performance evaluation for dno governance using … · performance evaluation for dno governance...
TRANSCRIPT

Performance Evaluation for DNO Governance
Using Data Envelopment Analysis Method
Amin Ghafouri1, Alireza Fereidunian
1,2, Hamid Lesani
1, Habib Torabi
3, Payam Kharazmi
3
(1) Systems and Machines Research Lab (SMRL), Control and Intelligent Processing Center of Excellence
(CIPCE), School of ECE, University of Tehran, Tehran, IRAN
(2) Smart Grid Research Lab., Faculty of ECE, K. N. Toosi University of Technology, Tehran, IRAN
(3) The Greater Tehran Electricity Distribution Company (GTEDC), Tehran, IRAN
Abstract— Smart performance evaluation of Distribution
Network Operators (DNOs) is an essential part of their effective
governance task. This paper focuses on benchmarking twenty
one districts of the Greater Tehran Electricity Distribution
Company (GTEDC) using Data Envelopment Analysis (DEA).
Three methods are employed, namely: CCR (Charnes, Cooper,
and Rhodes), SBM (Slack Based Measurement), and WSBM
(Weighted Slack Based Measurement). The results consist of
efficiency scores of CCR, SBM, and WSBM with slacks analysis
for the latter. Based on the WSBM results, weak districts are
clarified and necessary improvements are suggested.
Keywords- Distribution Network Operator (DNO); Governance;
Data Envelopment Analysis (DEA); Slack Based Measurement
(SBM); Performance Evaluation; Benchmarking;
I. INTRODUCTION
Smart electricity distribution is expected to be decentralized to a considerable extent; however, smart performance evaluation of Distribution Network Operators (DNOs) is essential for their effective governance. Assessing companies by comparing together is a common practice of regulation and governance. Many parametric or non-parametric performance evaluation methods have been developed and extensively utilized in practical applications. Data Envelopment Analysis (DEA) is one of these non-parametric methods, which has become a reputable approach in efficiency benchmarking, especially in the last decade. It has been widely used in benchmarking power systems in both power generation [3-6] and distribution networks [7-13].
Pahwa et al. [8] studied the fifty largest electric distribution utilities (based on MWh sales) in the USA, and extracted their performance efficiencies as well as the gaps in inputs and outputs of inefficient utilities. Zhang et al. [9] used DEA for assessing the performance of distribution lines in China. Reactive energy, energy loss, length of line, and transformer capacity were considered as inputs; and the energy sold was the only output. Lo et al. [10] used it to evaluate the relative
efficiency of the Taiwan Power Company (TPC) and reorganized the inefficient TPC districts, in order to improve their performance status. Jamasb et al. [12] studied European electricity distribution companies and suggested that in order to achieve more accurate results in the regulation of electricity distribution and transmission utilities, assigning different weights to inputs and outputs could be an option. This idea can develop the results accuracy, since in the performance of electrical utilities one of the parameters may significantly contribute to the overall functional efficiency of the company.
In this paper, efficiency benchmarking of twenty one districts of the Greater Tehran Electricity Distribution Company (GTEDC) is studied by employing DEA. Three methods are employed, namely: CCR (Charnes, Cooper, and Rhodes), SBM (Slack Based Measurement), and WSBM (Weighted Slack Based Measurement). The results consist of efficiency scores of CCR, SBM, and WSBM with slacks analysis for the latter. Based on the WSBM results, weak districts are clarified and necessary improvements are suggested.
The remainder of the paper is organized as follows: Section II presents a brief description of DEA, where the basics of CCR, SBM, and WSBM models are defined. Section III provides the case study and implementation of our proposed method. Section IV contains the results of efficiency scores and analysis of slacks for these districts. Finally, section V concludes the study.
II. BACKGROUND
A. Data Envelopment Analysis (DEA)
DEA calculates the ratio of sum of weighted outputs to sum of weighted inputs. The model was developed by Charnes, Cooper, and Rhodes, known as CCR [1]. It assigns the most suitable set of multipliers for the considered decision making unit (DMU) to maximize its efficiency score. Some of the significant properties of DEA are, being unit invariant, having
little calculations, and being needless of finding the production function of the firm. For n number of DMUs ( ) with m number of inputs ( and s number of outputs ( ), CCR model is defined as:
(1)
In this model, is the input vector and is the output
vector of the considered DMU. The optimal is technical efficiency and is lesser than 1 and greater than 0. For the input oriented model, it shows the value, which should be multiplied by the input vector of the considered DMU, so that it reaches a CCR-efficiency score equal to 1. Technical efficiency is attained when the DMU is placed on the frontier line or has
.
The dual problem of CCR which is expressed as follows, is more suitable since it is a simple linear programming problem:
(2)
where:
= vector of inputs for the considered DMU = vector of outputs for the considered DMU
= Matrix of inputs
= Matrix of outputs
If an extra constraint ( ) is added the model turns to BCC (Banker, Charnes, and Cooper) which is a variable return to scale method. But in this study, we use the constant return to scale model which is more suitable for power distribution studies [15],[16].
B. Weighted Slack Based Measurement (WSBM)
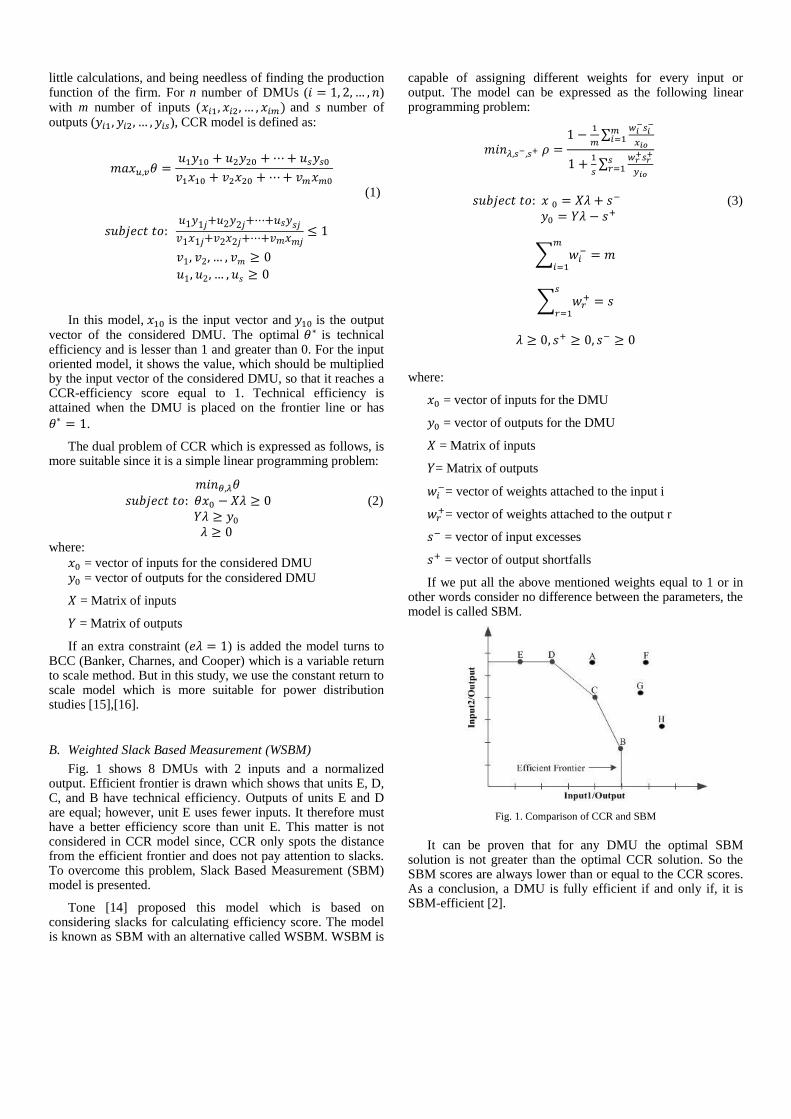
Fig. 1 shows 8 DMUs with 2 inputs and a normalized output. Efficient frontier is drawn which shows that units E, D, C, and B have technical efficiency. Outputs of units E and D are equal; however, unit E uses fewer inputs. It therefore must have a better efficiency score than unit E. This matter is not considered in CCR model since, CCR only spots the distance from the efficient frontier and does not pay attention to slacks. To overcome this problem, Slack Based Measurement (SBM) model is presented.
Tone [14] proposed this model which is based on considering slacks for calculating efficiency score. The model is known as SBM with an alternative called WSBM. WSBM is
capable of assigning different weights for every input or output. The model can be expressed as the following linear programming problem:
∑
∑
(3)
∑
∑
where:
= vector of inputs for the DMU
= vector of outputs for the DMU
= Matrix of inputs
= Matrix of outputs
= vector of weights attached to the input i
= vector of weights attached to the output r
= vector of input excesses
= vector of output shortfalls
If we put all the above mentioned weights equal to 1 or in other words consider no difference between the parameters, the model is called SBM.
Fig. 1. Comparison of CCR and SBM
It can be proven that for any DMU the optimal SBM
solution is not greater than the optimal CCR solution. So the SBM scores are always lower than or equal to the CCR scores. As a conclusion, a DMU is fully efficient if and only if, it is SBM-efficient [2].

III. IMPLEMENTATION
A. Case Study: The Greater Tehran Electricity Distribution
Company
GTEDC operates the distribution network of the Greater Tehran. It is the largest electrical distribution company in Iran and provides almost 16641 GWh/year for 3249000 customers [17]. GTEDC is divided into 4 major geographical regions (North West, North East, South West, and South East) with each of these regions being parted into 6, 5, 5, and 5 districts respectively. Each of the geographical districts are operated by a District Manager, who is the person in charge of delivering electricity to the GTEDC‟s customers in that district. Some of these districts are launched to be operated as a sort of Distribution Network Operators (DNOs). In this paper, names of the 21 districts have been randomly recalled as numbers, due to security and confidentiality issues. Map of the four major divisions is illustrated in Fig. 2.
Like any other electrical distribution company, GTEDC is moving towards improving its performance to enhance the reliability and quality of power supply. Therefore, DEA results can be useful for its future governance and regulation plans and acts.
The operational data of the DNOs are collected in each district and transferred to the GTEDC headquarter for governance and regulation studies, via an automated SCADA system [18-19].
Fig. 2. Map of GTEDC [17]
B. Inputs and Outputs
By choosing different set of inputs or outputs the efficiency scores will differ. Therefore, choosing a set of appropriate inputs and outputs is a vital step in calculating efficiency scores. If n, m, and s be the number of DMUs, inputs, and outputs respectively, a rule of thumb that bounds the number of inputs and outputs is:
( (4)
In this study, with the direct guidance of GTEDC managers, the following inputs and outputs are considered:
Inputs:
Number of Workers (NW)
Weighted Network Length (NL)
Outputs:
SAIDIinv
: inverse of System Average Interruption Duration Index (IS)
Number of Customers: total number of customers served in each district (NC)
Energy Sold: total revenue received from sales of electricity (ES)
SAIDI is a reliability indicator which is the average outage duration for each served customer. An increase in SAIDI should decrease the DMU‟s efficiency so whether SAIDI can be chosen as input or 1/SAIDI (SAIDI
inv) as output. In this
paper, we preferred to use the latter since being SAIDI an output makes more sense.
Distribution lines consist of 4 different types, MV underground, MV aerial, LV underground, and LV aerial. The network length could be adopted by summing these four values but in order to be more accurate a sum of weighted values is considered. In this study, weights of 2, 1.75, 1.25, and 1 are assigned for each type respectively.
Many other parameters can be involved, such as maintenance expenses, transformations capacity, complaints handling, etc. However, we had to choose the most important ones which are also available.
Assigning different weights for the inputs or the outputs is a capability in WSBM which influences the results. So based on each parameter‟s importance, the most suitable weight should be chosen. Here, for the weights of number of workers and network length, we consider 1 and 2, meaning that network length is two times more important than number of workers. With the same procedure for the outputs: SAIDI
inv, customers,
and energy sold, assigned weights are 4, 1, and 3 respectively.
Thus the CCR objective function is:
(5)
And for the SBM and WSBM it is:
(
(
(6)
(
(
(7)
IV. RESULTS AND DISCUSSIONS
In this part, benchmarking of the 21 GTEDC districts is carried out. Each DMU is named randomly by a number. The ranking results are presented in Table I where efficient units are marked with an (E).
Five units have technical efficiency, but based on SBM and WSBM only three of them are fully efficient. DMU8 has the lowest efficiency score in CCR and DMU21 has the lowest efficiency score in both SBM and WSBM. Contemplating the fact that CCR only calculates technical efficiency and does not consider slacks, SBM and WSBM results are more reliable.
TABLE I. RANKING OF GTEDC DISTRICTS
Rank CCR SBM WSBM
1 DMU6 (E) DMU6 (E) DMU6 (E)
2 DMU9 (E) DMU13 (E) DMU13 (E)
3 DMU10 (E) DMU19 (E) DMU19 (E)
4 DMU13 (E) DMU10 DMU9
5 DMU19 (E) DMU9 DMU10
6 DMU5 DMU17 DMU17
7 DMU17 DMU5 DMU5
8 DMU11 DMU12 DMU11
9 DMU15 DMU7 DMU3
10 DMU20 DMU18 DMU18
11 DMU7 DMU15 DMU1
12 DMU12 DMU11 DMU12
13 DMU1 DMU1 DMU7
14 DMU4 DMU20 DMU15
15 DMU3 DMU3 DMU20
16 DMU18 DMU16 DMU16
17 DMU2 DMU8 DMU8
18 DMU21 DMU14 DMU14
19 DMU16 DMU4 DMU4
20 DMU14 DMU2 DMU2
21 DMU8 DMU21 DMU21
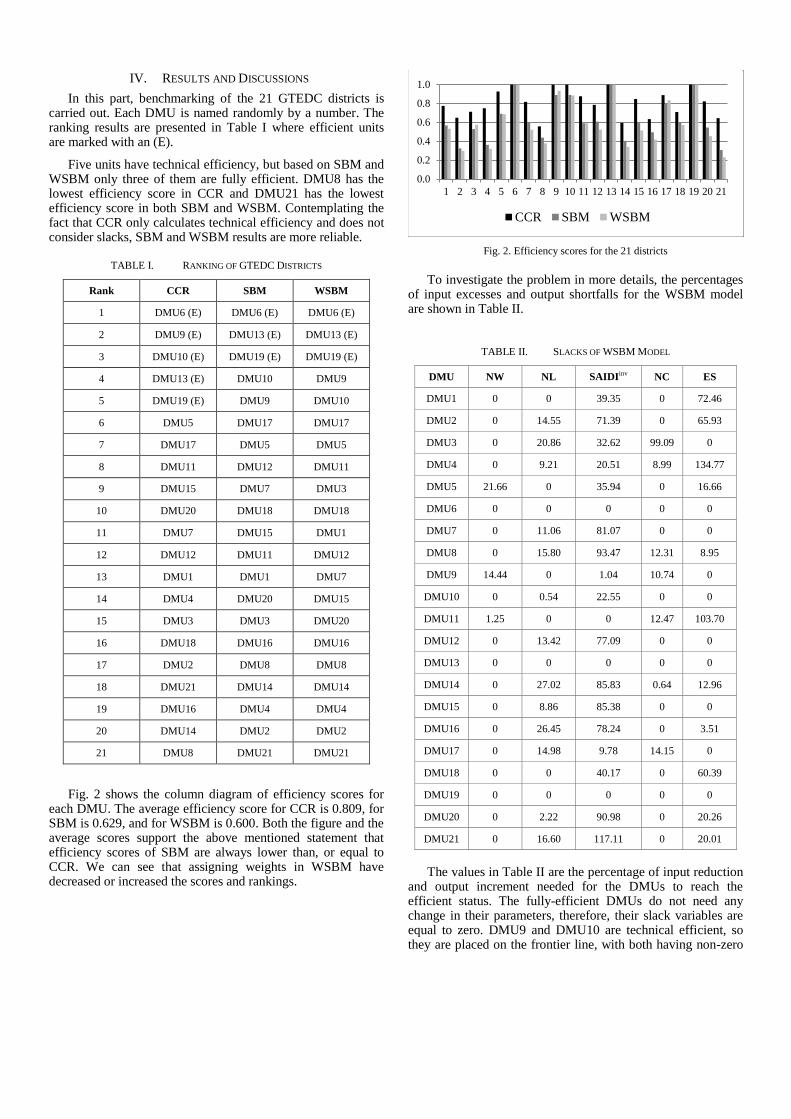
Fig. 2 shows the column diagram of efficiency scores for each DMU. The average efficiency score for CCR is 0.809, for SBM is 0.629, and for WSBM is 0.600. Both the figure and the average scores support the above mentioned statement that efficiency scores of SBM are always lower than, or equal to CCR. We can see that assigning weights in WSBM have decreased or increased the scores and rankings.
Fig. 2. Efficiency scores for the 21 districts
To investigate the problem in more details, the percentages
of input excesses and output shortfalls for the WSBM model are shown in Table II.
TABLE II. SLACKS OF WSBM MODEL
DMU NW NL SAIDIinv NC ES
DMU1 0 0 39.35 0 72.46
DMU2 0 14.55 71.39 0 65.93
DMU3 0 20.86 32.62 99.09 0
DMU4 0 9.21 20.51 8.99 134.77
DMU5 21.66 0 35.94 0 16.66
DMU6 0 0 0 0 0
DMU7 0 11.06 81.07 0 0
DMU8 0 15.80 93.47 12.31 8.95
DMU9 14.44 0 1.04 10.74 0
DMU10 0 0.54 22.55 0 0
DMU11 1.25 0 0 12.47 103.70
DMU12 0 13.42 77.09 0 0
DMU13 0 0 0 0 0
DMU14 0 27.02 85.83 0.64 12.96
DMU15 0 8.86 85.38 0 0
DMU16 0 26.45 78.24 0 3.51
DMU17 0 14.98 9.78 14.15 0
DMU18 0 0 40.17 0 60.39
DMU19 0 0 0 0 0
DMU20 0 2.22 90.98 0 20.26
DMU21 0 16.60 117.11 0 20.01
The values in Table II are the percentage of input reduction
and output increment needed for the DMUs to reach the efficient status. The fully-efficient DMUs do not need any change in their parameters, therefore, their slack variables are equal to zero. DMU9 and DMU10 are technical efficient, so they are placed on the frontier line, with both having non-zero
0.0
0.2
0.4
0.6
0.8
1.0
1 2 3 4 5 6 7 8 9 10 11 12 13 14 15 16 17 18 19 20 21
CCR SBM WSBM

slacks. This results in inefficiency and based on WSBM, their efficiency scores are 0.933 and 0.884.
According to slacks analysis, it seems that inverse of SAIDI is the most troublesome parameter which needs to be increased in 17 districts. In other words, SAIDI itself needs to be decreased in these 17 districts and organizers should consider lowering it in their future planning in order to reduce inefficiency.
The weakest district which has the least efficiency score is DMU21. A look in its slacks reveals that for this district SAIDI
inv needs to be increased 117.11%, in other words SAIDI
needs to be decreased 54%. In addition to that, the network length and energy sold should be changed by 16.60% (increase) and 20.01% (decrease). However, based on the fact that reducing network length may not be possible other outputs should be increased more than the diagnosed amount in order to compensate for this defect.
V. CONCLUSIONS
In this study, the twenty one DNOs (districts operation managers) of the Greater Tehran Electricity Distribution Company (GTEDC) were assessed, using Data Envelopment Analysis (DEA) method and a couple of its variants. DEA was described and two primary models named CCR and SBM were presented. Two variants of DEA, namely SBM and WSBM were introduced. This was done in order to consider the relative importance of each parameter in benchmarking.
In this study, the number of workers and network length (weighted) were the inputs and the inverse of SAIDI (SAIDI
inv), number of customers, and energy sold were
adopted as outputs. SAIDIinv
had the largest weight in the outputs and network length was the most important in the inputs. The results were presented and slack analysis was performed showing that SAIDI is the most problematic variable, which needs reorganization for improvement.
REFERENCES
[1] A. Charnes, W. W. Cooper, D. Divine, T. W. Ruefli, and D. Thomas, “Comparisons of DEA and existing ratio and regression systems for effecting efficiency evaluations of regulated electric cooperatives in Texas,” Res. in Governmental and Nonprofit Accounting, vol. 5, pp. 187–210, 1989.
[2] W. W. Cooper, L. M. Seiford, and K. Tone, Introduction to data envelopment analysis and its uses with DEA-solver software and references, Springer, pp. 95-102, 2005.
[3] R. Fare, S. Grosskopf, and J. Logan, “The relative efficiency of Illinois electric utilities,” Resources and Energy, vol. 5, pp. 349–367, 1983.
[4] D. K. Jha, Y. Zoka, N. Yorino, “Evaluatingperformance of electricity generating pants using data envelopment analysis: acase of Nepal”,Joint technical meeting on Power Engineering and Power Systems Engineering, IEE Japan, pp. 51-57, Aug. 2006.
[5] Chitkara, P, “A data envelopment analysis approach to evaluation of operational inefficiencies in power generating units: a case study ofIndian power plants”, IEEE Transactions on Power Systems, vol. 14,no. 2., 1998.
[6] Diewert, W. E. and A. Nakamura, “Benchmarking and the measurementof best practice efficiency: an electricity generation application”,Canadian Journal of Economics, vol. 32, no. 2, 1999.
[7] P. A. Miliotis, “Data envelopment analysis applied to electricity distribution districts,” J. Oper. Res. Soc., vol. 43, no. 5, pp. 549–555, 1992.
[8] A. Pahwa, X. Feng, & D. Lubkeman, “Performance Evaluation of Electric Distribution Utilities based on Data Envelopment Analysis”, IEEE Transactions on Power Systems, vol. 17, no. 3, pp. 400-405, Aug. 2002.
[9] T. F. Zhang, J. S. Yuan, and X.Z. Li , “Assessing the performance of distribution lines based on data envelopment analysis”,Industrial Engineering and Engineering Management, 2008 (IEEM 2008), 8-11 Dec. 2008, Singapore.
[10] F. Y. Lo, C. F. Chien, and J. T. Lin, “A DEA study to evaluate the relative efficiency and investigate the district reorganization of the Taiwan power company,” IEEE Trans. Power Syst., vol. 16, pp. 170–178, Feb. 2001.
[11] Cullmann, A. and Hirschhausen von, C. „Efficiency analysis of East European electricity distribution in transition‟, Journal of Productivity Analysis, Special Issue on Transition Economics.
[12] T. Jamasb, and M. Pollitt, “International utility benchmarking & regulation: an application to European electricity distribution dompanies,” DAE Working Paper, No 0115, Department of Applied Economics, University of Cambridge, 2002.
[13] D.K. Jha, N. Yorino,Y.Zoka, “Analyzing performance of distribution system in Nepal and investigating possibility of reorganization of distribution centers," Electric Utility Deregulation and Restructuring and Power Technologies, 2008. DRPT 2008. Third International Conference on , vol., no., pp.1312-1317, Apr. 2008.
[14] K. Tone, “A slack-based measure of efficiency in dataenvelopment analysis,” European Journal of Operational Research, 130, pp. 498-509, 2001.
[15] Choice of model and availability of data for the efficiencyanalysis of Dutch network and supply businesses in the electricitysector. Netherlands Electricity Regulatory Service. [Online]. Available:www.nma-dte.nl/english/default.html.
[16] Efficiency and benchmarking study of the NSW distribution businesses. Independent Pricing and Regulatory Tribunal of New South Wales. Available: www.ipart.nsw.gov
[17] E. Akhavan-Rezai, M.R. Haghifam, A. Fereidunian, “Data-driven reliability modeling, based on data mining in distribution network fault statistics,” PowerTech, 2009 IEEE Bucharest , pp.1-6, Jun. 28-Jul. 2009.
[18] A. Fereidunian, C. Lucas, H. Lesani, R., Rahmani, A.W. Wymore, “A Policy-Driven Method for IT Infrastructure Selection in Power Distribution Automation System”, International Review of Electrical Engineering, Vol. 5, No. 2, Part B, March-April 2010, pp. 671-682.
[19] A. Fereidunian, H. Lesani, C. Lucas, M. Nordman, M. Lehtonen, “A Systems Approach to Information Technology (IT) Infrastructure Design for Utility Management Automation Systems”, Iranian Journal of Electrical and Electronic Engineering, Vol. 2, No. 3&4, July 2006, pp. 91-105.