performance evaluation of a coded structured light system ... · performance evaluation of a coded...
TRANSCRIPT

j
(a) (b)
Fig.1. (a) Weary Herakles statue in the Antalya Museum, (b) the Khmer Head in the Museum Rietberg Zurich.
Performance Evaluation of a coded structured light system for cultural heritage applications
Devrim Akca*, Fabio Remondino, David Novák, Thomas Hanusch, Gerhard Schrotter, Armin Gruen
Institute of Geodesy and Photogrammetry, ETH Zurich, CH-8093 Zurich, SWITZERLAND
ABSTRACT
3D documentation and visualization of Cultural Heritage objects is an expanding application area. The selection of the right technology for these kinds of applications is very important and strictly related to the project requirements, budget and user’s experience. Active sensors, i.e. triangulation based laser scanners and structured light systems are used for many kinds of 3D object reconstruction tasks and in particular for 3D documentation of cultural heritage objects. This study presents some experiences in the results of two case studies in which a close-range structured light system is used for the 3D digitization. The paper includes all necessary steps of the 3D object modeling pipeline from data acquisition to 3D visualization.
Keywords: Active sensor, digitization, cultural heritage, modeling, visualization
1. INTRODUCTION Active sensors, based on coherent (laser) and non-coherent light, are used for many kinds of 3D reconstruction tasks and recently very much for the recording and 3D documentation of cultural heritage objects. They have become a very common source of documentation data in recent years, in particular for non-expert users, as they provide range data of surfaces in high resolution and with high accuracy. Compared to passive image-based approaches, active sensors provide directly and quickly 3D information of the surveyed object in form of range data (pointclouds). Active sensors are suitable for different scales and objects. While the recording devices are still relatively expensive, important progress has been made in recent years towards an efficient processing and analysis of range data.
Structured light systems consist of one (or more) camera(s) and an active light source, which illuminates the object with a known pattern of light sequence. Based on the triangulation principle, the 3D object coordinates are generally recovered in ca. 2-3 seconds with a potential accuracy of 50 microns or even better.
This paper reports about two case studies where a coded structured light system (optoTOP-HE™ and optoTOP-SE™, Breuckmann GmbH) is used for the precise 3D digitization and documentation of Cultural Heritage objects. It includes all essential steps of the 3D object modeling pipeline from data acquisition to 3D visualization. The first study is the 3D modeling of a part of a marble Herakles statue, named “Weary Herakles” (Fig. 1a), which is on display in the Antalya Museum (Turkey), digitized with an optoTOP-HE system. The second study is about the 3D modeling of a Khmer head sculpture (Fig. 1b), which is in the collection of Museum Rietberg Zurich (Switzerland), digitized using an optoTOP-SE sensor.
The next chapter introduces the scanner with emphasis on the working principle and technical specifications. The following third and fourth chapters explain the data acquisition and modeling workflow of the Weary Herakles and the Khmer head projects, respectively. The fifth chapter addresses the capabilities and the limitations of the used hardware and software.
*[email protected]; phone 41 44 6333063; fax 41 44 6331101; www.photogrammetry.ethz.ch
Videometrics IX, edited by J.-Angelo Beraldin, Fabio Remondino, Mark R. Shortis,Proc. of SPIE-IS&T Electronic Imaging, SPIE Vol. 6491, 64910V, © 2007 SPIE-IS&T · 0277-786X/07/$15
SPIE-IS&T/ Vol. 6491 64910V-1
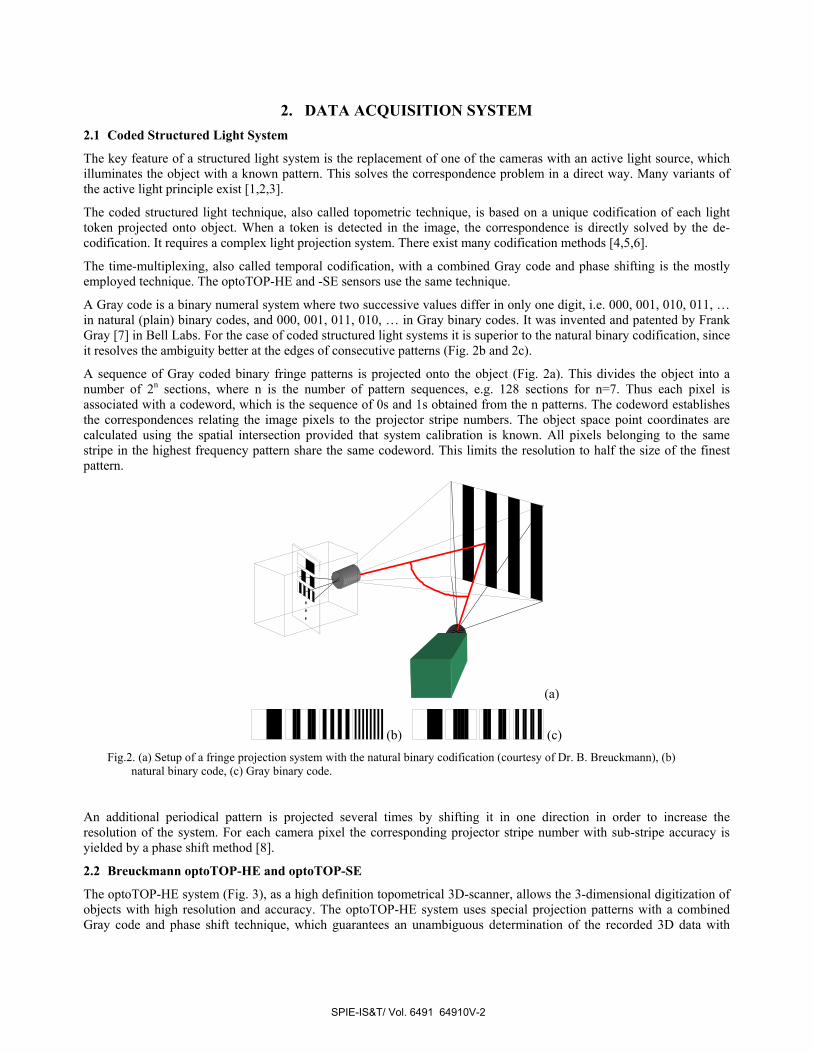
2. DATA ACQUISITION SYSTEM 2.1 Coded Structured Light System
The key feature of a structured light system is the replacement of one of the cameras with an active light source, which illuminates the object with a known pattern. This solves the correspondence problem in a direct way. Many variants of the active light principle exist [1,2,3].
The coded structured light technique, also called topometric technique, is based on a unique codification of each light token projected onto object. When a token is detected in the image, the correspondence is directly solved by the de-codification. It requires a complex light projection system. There exist many codification methods [4,5,6].
The time-multiplexing, also called temporal codification, with a combined Gray code and phase shifting is the mostly employed technique. The optoTOP-HE and -SE sensors use the same technique.
A Gray code is a binary numeral system where two successive values differ in only one digit, i.e. 000, 001, 010, 011, … in natural (plain) binary codes, and 000, 001, 011, 010, … in Gray binary codes. It was invented and patented by Frank Gray [7] in Bell Labs. For the case of coded structured light systems it is superior to the natural binary codification, since it resolves the ambiguity better at the edges of consecutive patterns (Fig. 2b and 2c).
A sequence of Gray coded binary fringe patterns is projected onto the object (Fig. 2a). This divides the object into a number of 2n sections, where n is the number of pattern sequences, e.g. 128 sections for n=7. Thus each pixel is associated with a codeword, which is the sequence of 0s and 1s obtained from the n patterns. The codeword establishes the correspondences relating the image pixels to the projector stripe numbers. The object space point coordinates are calculated using the spatial intersection provided that system calibration is known. All pixels belonging to the same stripe in the highest frequency pattern share the same codeword. This limits the resolution to half the size of the finest pattern.
(a)
(b) (c)
Fig.2. (a) Setup of a fringe projection system with the natural binary codification (courtesy of Dr. B. Breuckmann), (b) natural binary code, (c) Gray binary code.
An additional periodical pattern is projected several times by shifting it in one direction in order to increase the resolution of the system. For each camera pixel the corresponding projector stripe number with sub-stripe accuracy is yielded by a phase shift method [8].
2.2 Breuckmann optoTOP-HE and optoTOP-SE
The optoTOP-HE system (Fig. 3), as a high definition topometrical 3D-scanner, allows the 3-dimensional digitization of objects with high resolution and accuracy. The optoTOP-HE system uses special projection patterns with a combined Gray code and phase shift technique, which guarantees an unambiguous determination of the recorded 3D data with
SPIE-IS&T/ Vol. 6491 64910V-2
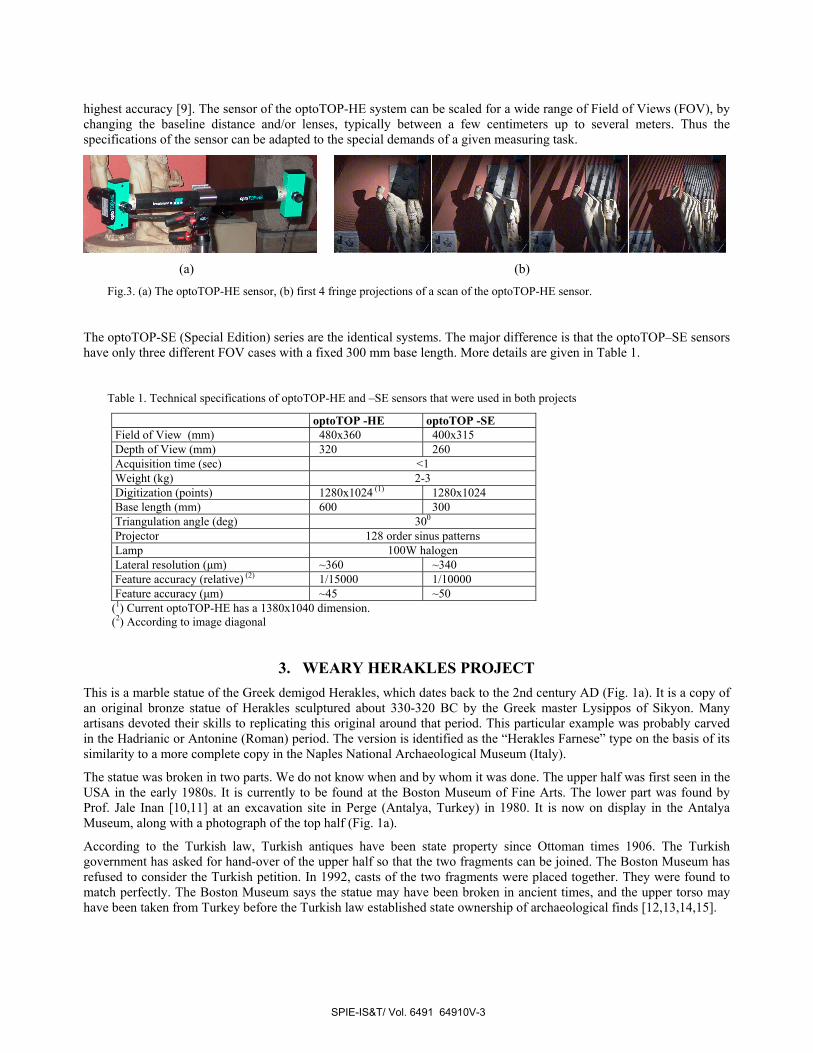
highest accuracy [9]. The sensor of the optoTOP-HE system can be scaled for a wide range of Field of Views (FOV), by changing the baseline distance and/or lenses, typically between a few centimeters up to several meters. Thus the specifications of the sensor can be adapted to the special demands of a given measuring task.
(a) (b)
Fig.3. (a) The optoTOP-HE sensor, (b) first 4 fringe projections of a scan of the optoTOP-HE sensor.
The optoTOP-SE (Special Edition) series are the identical systems. The major difference is that the optoTOP–SE sensors have only three different FOV cases with a fixed 300 mm base length. More details are given in Table 1.
Table 1. Technical specifications of optoTOP-HE and –SE sensors that were used in both projects
optoTOP -HE optoTOP -SE Field of View (mm) 480x360 400x315 Depth of View (mm) 320 260 Acquisition time (sec) <1 Weight (kg) 2-3 Digitization (points) 1280x1024 (1) 1280x1024 Base length (mm) 600 300 Triangulation angle (deg) 300 Projector 128 order sinus patterns Lamp 100W halogen Lateral resolution (µm) ~360 ~340 Feature accuracy (relative) (2) 1/15000 1/10000 Feature accuracy (µm) ~45 ~50 (1) Current optoTOP-HE has a 1380x1040 dimension. (2) According to image diagonal
3. WEARY HERAKLES PROJECT This is a marble statue of the Greek demigod Herakles, which dates back to the 2nd century AD (Fig. 1a). It is a copy of an original bronze statue of Herakles sculptured about 330-320 BC by the Greek master Lysippos of Sikyon. Many artisans devoted their skills to replicating this original around that period. This particular example was probably carved in the Hadrianic or Antonine (Roman) period. The version is identified as the “Herakles Farnese” type on the basis of its similarity to a more complete copy in the Naples National Archaeological Museum (Italy).
The statue was broken in two parts. We do not know when and by whom it was done. The upper half was first seen in the USA in the early 1980s. It is currently to be found at the Boston Museum of Fine Arts. The lower part was found by Prof. Jale Inan [10,11] at an excavation site in Perge (Antalya, Turkey) in 1980. It is now on display in the Antalya Museum, along with a photograph of the top half (Fig. 1a).
According to the Turkish law, Turkish antiques have been state property since Ottoman times 1906. The Turkish government has asked for hand-over of the upper half so that the two fragments can be joined. The Boston Museum has refused to consider the Turkish petition. In 1992, casts of the two fragments were placed together. They were found to match perfectly. The Boston Museum says the statue may have been broken in ancient times, and the upper torso may have been taken from Turkey before the Turkish law established state ownership of archaeological finds [12,13,14,15].
SPIE-IS&T/ Vol. 6491 64910V-3

F WUIIV7 Ii
Since both parts are unfortunately separated geographically, our aim was to record and model both the lower and the upper part and bring these partial models together in the computer, so that at least there the complete statue could be seen, appreciated and analyzed. With the help of the Turkish authorities and the Antalya Museum we were able to complete our work on the lower part, but access to the Boston Museum was denied.
The digitization of the lower part of the statue was done in 19-20 September 2005 in the Antalya Museum with a Breuckmann (http://www.breuckmann.com) optoTOP-HE coded structured light system. The system was kindly provided by the Turkish reseller InfoTRON Co. (http://www.infotron.com.tr), Istanbul.
3.1 Scanning in the Antalya Museum
The scanning campaign was completed in one and a half days of work. The statue is around 1.1 meters in height. The whole object was covered with 56 scans of the first day work. The remaining 11 scans of the second day were for filling the data holes and occlusion areas. Totally 83.75M points were acquired in 67 scan files. The average point spacing is 0.5 millimeter.
The optoTOP-HE is an instantaneous 3D digitization system, which means that the acquisition of one point cloud is done in nearly less than one second. However, orienting the scanner and planning the scan overlay needs careful preparation (Fig.4), especially for this kind of object with many concave and hidden parts. Due to the sensitivity of the sensor to ambient light special attention was paid to environment lighting conditions. Two ceiling halogen lambs looking at the statue were turned off.
3.2 Point Cloud Registration
The pairwise registration was done by use of an in-house developed method, called Least Squares 3D Surface Matching (LS3D). The mathematical model is a generalization of the Least Squares image matching method, in particular the method given by Gruen [16]. It provides mechanisms for internal quality control and the capability of matching of multi-resolution and multi-quality data sets. For details we refer to Gruen and Akca [17].
The pairwise LS3D matchings are run on every overlapping pairs (totally 234) and a subset of point correspondences are saved to separate files. The average of the sigma naught value is 81 microns. In the global registration step, all these files are passed to a block adjustment by independent models procedure, which is a well known orientation procedure in photogrammetry. It concluded with 47 micron a posteriori sigma naught value.
3.3 Point Cloud Editing
After the registration, all scan files were merged as one XYZ file, discarding the scanner detected blunders. This file totally contains 36.2 M points. The file was imported to Geomagic Studio™ 6 (Raindrop Geomagic Inc., release 2004_05_11_B). All the editing procedures were carried out in Geomagic Studio. The data set was further cropped to include only the area of interest (AOI), i.e. deleting the background wall or other non relevant parts, concluding with 33.9 M points. A low level noise reduction was applied using the “Reduce Noise” function of Geomagic Studio.
As a first attempt, the surface mesh generation was tried at the original data resolution. The operation could not be performed, since the memory request of the software exceeded the physical memory limit of 2 GB of the computer. Therefore, the number of points was reduced to 9.0 million by applying the “Curvature Sampling” function of Geomagic Studio. This operation eliminates points in flat regions but preserves points in high-curvature regions to maintain detail.
Fig.4. Preparation for a scan.
SPIE-IS&T/ Vol. 6491 64910V-4

$1
3.4 Surface Triangulation and Editing
Surface triangulation was done by setting the number of target triangles to 5 million. Because of the complexity of the statue and occlusions some inner concave parts could not be seen by the scanner. This resulted in several data holes on the wrapped surface. They were interactively filled with the “Fill Holes” option of the software. The final model contains 5.2 M triangles. We have achieved a high level of realism, which can make a one-to-one scale production of the statue possible, if required (Fig. 5).
The main portion of the editing effort is for the hole filling. It is a tedious work, and takes the longest time among all the steps of the project.
3.5 Texture Mapping and Visualization
Separately taken images, with a 4M pixel CCD Leica Digilux 1 camera, were used for the texture mapping. The Weaver module of the VCLab’s 3D Scanning Tool (ISTI-CNR, Pisa, Italy) was used
here. The VCLab’s Tool is a bundle of modules, which comprise the fundamental steps of the 3D modeling. The algorithmic details of the software can be found in Callieri et al [18].
Fig.6. Frontal view of the texture mapped model (left), frontal view (central) and back view (right) of the grey shaded
model.
Fig.5. Picture of the statue and its back-projected 3D model.
SPIE-IS&T/ Vol. 6491 64910V-5

The visualization of the final model was done with the IMView module of PolyWorks™ (InnovMetric Software Inc., version 9.0.2). It gives a better shading than Geomagic Studio. The textured model was visualized with the viewer of the VCLab’s Tool (Fig. 6).
4. KHMER HEAD PROJECT The earliest examples of Buddhist art on the mainland of Southeast Asia date from the 4th and 5th centuries and emerged under the influence of Indian and Sri Lankan art. During the 6th century the Khmer people established themselves in the fertile tropical plains of Cambodia, and as the dominating power in Southeast Asia in the 12th and 13th centuries. They built the stunning group of temples at Angkor. The Khmer rulers supported both Hinduism, displayed most magnificently at Angkor Vat, and Buddhism, whose most important monument the Bayon (the central temple at Angkor Thom) can still be admired.
A bodhisattva head from the late 12th or early 13th century is carved in the Bayon style (Fig. 1b). It is Lokeshvara or Avalokiteshvara, the “Lord of compassion who looks down (on the suffering of the world),” an emanation of the Buddha Amitabha as demonstrated by the seated Buddha on his hair ornament. His serene expression and transcendent smile convey better than any words the sublime essence of the Buddhist teachings [19].
4.1 Data acquisition in Museum Rietberg
The head is made of sandstone and 28 centimeters in height. The data acquisition was done in Museum Rietberg on 4 May 2006. A Breuckmann OptoTOP-SE fringe projection system was used for this purpose (Fig.7). The scanning and imaging took four hours on site work. The head was covered with 18 point clouds, totally 23.6 million points.
4.2 Point Cloud Registration
The point cloud registration was done again with the LS3D surface matching method. 52 pairwise LS3D matchings for all overlaps gave an average sigma naught value of 60 microns. The global registration with the block adjustment by independent models solution concluded with 28 microns sigma naught value.
4.3 Surface Modeling
The surface modeling was done by use of two commercial packages, namely Geomagic Studio and Polyworks. The aim was to compare the capabilities of both software. Registered point clouds were imported in the proper formats. Accordingly, the registration steps were skipped in both software. Both software packages have different processing pipelines (Table 2).
Geomagic Studio offers fully automatic data import functionality provided that data is given in one of the appropriate point cloud formats. Totally 18 point clouds were imported, merged into one, which gave a very dense (denser than 50 microns interpoint distance at some locations) point cloud. After discarding the no data or scanner signed erroneous points and points belonging to background and other non relevant objects, 3.2 million points remained.
The noise reduction ensures that points coming from different views in different quality will finally have the similar signal-to-noise ratio. Here a slight (low level) noise reduction was applied. After this step, the model contains highly redundant points coming from the multiple views. The “Curvature Sampling” function with a 60% reduction rate reduced the number of points to 1.9 millions. Intentionally, a restricted reduction rate was selected, so that small details can be preserved.
Fig.7. Scanning in Museum Rietberg.
SPIE-IS&T/ Vol. 6491 64910V-6

Table 2. Workflows of Geomagic Studio and PolyWorks
Geomagic Studio PolyWorks Importing the point clouds Importing the point clouds Point cloud merging Surface triangulation Defining the AOI Surface merging Noise reduction Defining the AOI Down sampling Surface editing Surface triangulation Surface editing
Fig.8. Shaded view of the model from Geomagic Studio (top-left) and PolyWorks (top-right). Zoom in to the left side of the
lip at Geomagic Studio (bottom-left) and PolyWorks (bottom-right) mesh models.
SPIE-IS&T/ Vol. 6491 64910V-7

The surface triangulation in Geomagic Studio is fully 3D and automatic, with limited user interaction. Hence, the resulting mesh will have topological errors and holes. On the other hand, it can preserve the high frequency details of the object geometry successfully by considering all points in one processing sweep. In general, surface triangulation quality is highly related to the point density and homogeneity.
PolyWorks has a significantly different workflow. Each step is represented as a module inside the package. Data import is not automatically performed. Each point cloud is individually imported, subsequently converted to the surface form by applying a 2.5D triangulation, similar to the terrain modeling case. Therefore, the user should interactively rotate the point cloud to a position where the viewing angle is close to the one at the acquisition instant. It substantially reduces the topological errors. On the opposite side, such a stepwise surface generation strategy does not utilize all the available information properly. For example, there might be some object parts with thin point distributions in individual views, whereas the combination of all views together provides a good solution.
At the next step, separate surfaces were merged as one manifold using the IMMerge module. This part is highly automated, and additionally offers a noise reduction option. During the process, triangulation is also optimized especially at the overlapping regions by associating dense triangles to high curvature areas and sparse at flat areas.
The IMEdit module offers many surface editing functions, e.g. cropping the AOI, filling the data holes, correcting the wrong triangles, boundary cleaning, etc. However, it is less flexible and user friendly than Geomagic Studio.
The resulting models from both software packages meet the project requirements. PolyWorks model (0.6 million triangles) has substantially less number of triangles than Geomagic model (3.9 million triangles), thus having a better and optimized triangulation algorithm. However, the model from Geomagic Studio preserves the small details and structures slightly better than the model of PolyWorks (Fig. 8). More details can be found in Novák [20].
4.4 Texture Mapping
A photographer type of professional illumination system consisting of two diffuse lights on a tripod was used (Fig. 9). It reduces the radiometric differences between the images and shadow effects at the complex parts and object silhouettes. Images were taken by a Sony DSC-W30 6 megapixel digital camera. The PolyWorks model was used for the texture mapping in the original resolution.
Fig.9. Illumination system used for the texture mapping in Museum Rietberg.
Internal and external orientations of the images were computed using a photogrammetric bundle adjustment with self-calibration. The object space coordinate system was defined as the coordinate system of the 3D model. The common points were interactively identified both in digital images and in the intensity images of the scanner.
We used this information, in addition to the geometric model and the images, to conduct a visibility analysis for every camera position. Triangles are back-projected into the images where the intersected and overlaid ones are searched. If any two triangles intersect or overlay in the image space, this means that one triangle is partly or fully obscured by the
SPIE-IS&T/ Vol. 6491 64910V-8

other one. By calculating the triangle to projection center distances, visible (upper) triangles and occluded (lower) triangles are determined (Fig. 10a). The partly occluded triangles are re-triangulated into visible and occluded parts. Re-triangulation is performed in the object space.
(a) (b) (c)
Fig.10. (a) Re-projection of intersection points and vertices; re-triangulated lower triangle with visible and occluded parts. Result of the visibility analysis of camera position 8, (b) frontal view, (c) side view.
Figure (10b) and (10c) show the result of the visibility analysis for one camera position from different viewpoints. This procedure is done for every image acquisition position.
The resultant list of visible triangles is used to calculate the texture coordinates of every vertex of the mesh. This is done by re-projecting the triangle vertices into image space. To select the optimal texture for every triangle, the angle between the surface normal vector and the viewing direction is calculated for every facet. The image with the most perpendicular viewing direction is used. In our case, “best viewing angle criterion” for texture selection is sufficient, because all the images are acquired within nearly the same distance to the object.
The presented approach is fully vector based, which leads to an image resolution independent analysis. Furthermore, the algorithm can work even with a limited amount of memory. It only needs to store the triangles in the RAM with an amount of 76 byte per point plus 24 byte for each triangle. For example, the amount of memory for a closed surface of 1 million triangles is around 95 MB. For huge datasets, we plan to implement a tiling algorithm for data handling. However, a tiling algorithm for the visibility analysis has already been implemented for speeding up the calculations.
The final textured mesh consists of around 295000 vertices and 585000 facets (Fig. 11). It is possible to visualize this model in a standard rendering software, but the navigation does not work fluently due to data size, even on computers with high quality graphic cards, memory and processing power. To cope with the problem, we decided to use special rendering software. With the open source software "Blender", we found an adequate software package to handle the huge number of triangles to produce high quality images and movies. However, for online and realtime visualizations, this full-resolution model cannot be used. For this application area, we reduce the number of triangles, without degradation of the visual impression. The high quality textured model is useful for presentations on high performance computers (concerning the physical memory, CPU and graphic card) and basically to preserve the object for e.g. reconstruction purposes.
5. CAPABILITIES OF THE USED HARDWARE AND SOFTWARE The optoTOP-HE and -SE sensors as a coded light projection system meet the project requirements satisfactorily. They have some distinctive advantages over the triangulation-based laser systems (Table 3).
Re-projected intersection points and vertex in object space
Intersection points and vertex of the upper triangle inside the lower triangle in image space
Upper triangle
Image space
Object space
Projection centre
Occluded parts Visible parts
Lower triangle
SPIE-IS&T/ Vol. 6491 64910V-9
I
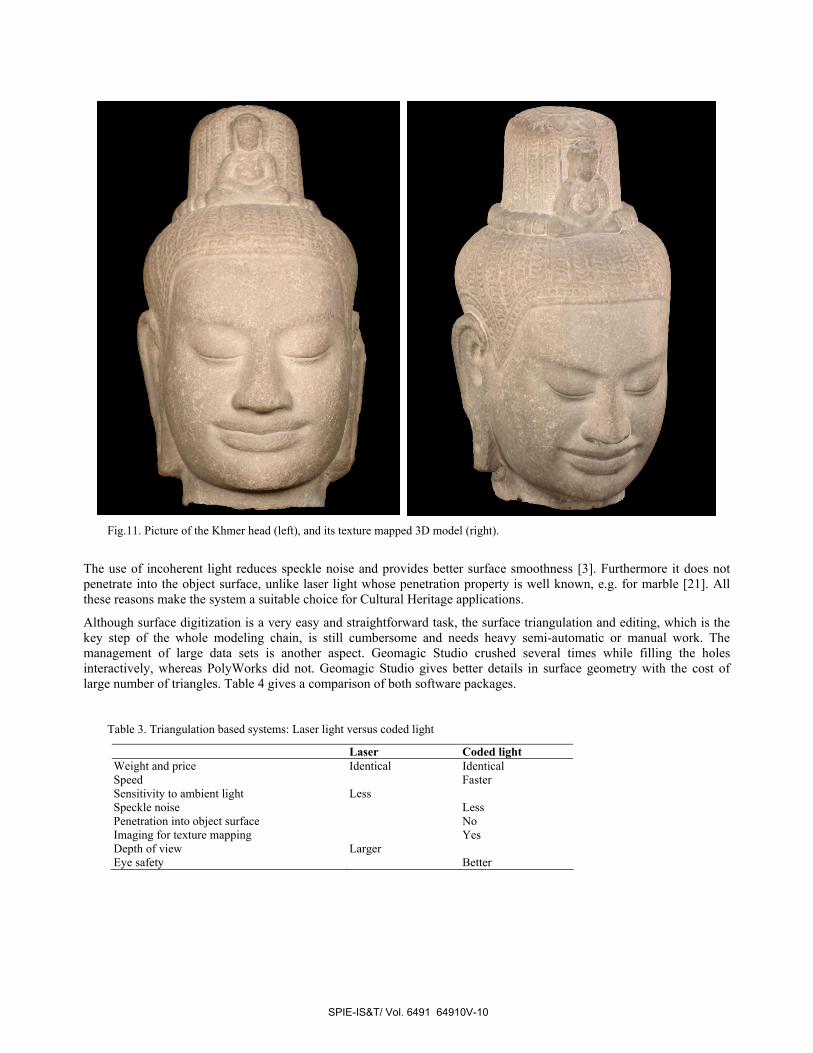
Fig.11. Picture of the Khmer head (left), and its texture mapped 3D model (right).
The use of incoherent light reduces speckle noise and provides better surface smoothness [3]. Furthermore it does not penetrate into the object surface, unlike laser light whose penetration property is well known, e.g. for marble [21]. All these reasons make the system a suitable choice for Cultural Heritage applications.
Although surface digitization is a very easy and straightforward task, the surface triangulation and editing, which is the key step of the whole modeling chain, is still cumbersome and needs heavy semi-automatic or manual work. The management of large data sets is another aspect. Geomagic Studio crushed several times while filling the holes interactively, whereas PolyWorks did not. Geomagic Studio gives better details in surface geometry with the cost of large number of triangles. Table 4 gives a comparison of both software packages.
Table 3. Triangulation based systems: Laser light versus coded light
Laser Coded light Weight and price Identical Identical Speed Faster Sensitivity to ambient light Less Speckle noise Less Penetration into object surface No Imaging for texture mapping Yes Depth of view Larger Eye safety Better
SPIE-IS&T/ Vol. 6491 64910V-10

Table 4. PolyWorks versus Geomagic Studio
PolyWorks Geomagic Data import Manual Automatic Triangulation Type 2.5D 3D Optimality Better Detail preservation Better Topological correctness Better Automatisation Better Editing capabilities Better Performance Better Visualization Better User friendliness Better Stability Better
6. CONCLUSIONS Active sensors are used for many kinds of 3D object reconstruction tasks, one important area of which is 3D documentation of cultural heritage objects. This study presents the results of 3D modeling of two cultural heritage objects, where a close-range coded structured light system was used for digitization.
The systems have acquired high quality point cloud data of the statues. The results of the processing (accuracy of about 50 micron and better) are in good agreement with the system specifications. The heaviest user interaction is needed in the editing steps, e.g. for filling the data holes. We have used two commercial software packages in order to carry out the modeling. Each software package has its own particular advantages and functions. A unique package, which fulfills all requirements with sophisticated and automatic editing capabilities, is not available. Usage of both packages can give the optimal modeling results. Texture mapping is another issue, which is not fully supported by either software.
Active sensing with coded structured light systems is a mature technology and allows high resolution documentation of cultural heritage objects.
7. ACKNOWLEDGEMENT The helps of Prof. Dr. Orhan Altan (Istanbul Technical University) and Mr. Lorenz Homberger (Museum Rietberg) are greatly appreciated. We thank the personnel of the Antalya Museum and Museum Rietberg for their kind help and permission. We also thank the Visual Computing Lab of ISTI-CNR for providing their Weaver software for the texture mapping.
REFERENCES
1. J.-A. Beraldin, F. Blais, L. Cournoyer, G. Godin, and M. Rioux, “Active 3D sensing”. Modelli E Metodi per lo studio e la conservazione dell'architettura storica. University: Scola Normale Superiore, Pisa, 10, 22-46, 2000. 2. J.-A. Beraldin, “Integration of laser scanning and close-range photogrammetry – The last decade and beyond”, International Archives of the Photogrammetry, Remote Sensing and Spatial Information Sciences, 35(B7), 972-983 (2004). 3. F. Blais, “Review of 20 years of range sensor development”, Journal of Electronic Imaging, 13(1), 231-240 (2004). 4. J. Batlle, E. Mouaddib, and J. Salvi, “Recent progress in coded structured light as a technique to solve correspondence problem: A survey”, Pattern Recognition, 31(7), 963-982 (1998). 5. J. Salvi, J. Pages, and J. Batlle, “Pattern codification strategies in structured light systems” Pattern Recognition, 37(4), 827-849 (2004). 6. A. Dipanda, and S. Woo, “Efficient correspondence problem-solving in 3-D shape reconstruction using a structured light system”, Optical Engineering, 44(9), 1-14 (2005). 7. F. Gray, “Pulse code communication”, US Patent no. 2,632,058. March 17, 1953.
SPIE-IS&T/ Vol. 6491 64910V-11

8. J. Burke, T. Bothe, W. Osten, and C. Hess, “Reverse engineering by fringe projection”, Interferometry XI: Applications, SPIE vol. 4778, pp. 312-324, 2002. 9. B. Breuckmann, “State of the art of topometric 3D-metrology”, Optical 3-D Measurement Techniques VI, Zurich, Sept. 22-25, Vol. II, pp. 152-158, 2003. 10. J. Inan, “Perge kazisi 1980 çalismalari”, III KST, DSI Basim ve Foto Film Isletme Müdürlügü Matbaasi, Ankara, sayfa 43-48, 1981 (in Turkish). 11. J. Inan, Heraklesstatue vom Typus des “Herakles Fernese” aus Perge, Festschrift für Max Wegner Zum 90, Geburtstag, Bonn, pp. 223-232, 1992. 12. M. Rose, and O. Acar, “Turkey’s war on the illicit antiquities trade”, Archaeology, 48(2), 45-56 (1995). 13. N. Brodie, and J. Doole, And Watson, P., “2Stealing history: The illicit trade in cultural material”, The McDonald Institute of Archaeological Research, Cambridge, pp. 31-32, 2000. 14. N. Brodie, “Stolen history: looting and illicit trade”, Museum International, 55(3-4), 10-22 (2003). 15. C. Gizzarelli, ‘Weary Herakles’: “Looters vs. Archaeologists”, http://www.bellaonline.com/articles/art28239.asp (accessed 6 April 2006). 16. A. Gruen, “Adaptive least squares correlation: a powerful image matching technique”, South Afr. J. of Photogrammetry, Remote Sensing and Cartography, 14(3), 175-187 (1985). 17. A. Gruen, and D. Akca, “Least squares 3D surface and curve matching”, ISPRS Journal of Photogrammetry and Remote Sensing, 59(3), 151-174 (2005). 18. M. Callieri, P. Cignoni, F. Ganovelli, C. Montani, P. Pingi, and R. Scopigno, “VCLab’s Tools for 3D range data processing”, VAST’03, Brighton, pp. 13-22, 2003. 19. Museum Rietberg, Exhibition Brochure, 2006. 20. D. Novák, “3D Object modeling by use of a close range active sensor”, B.Sc. Thesis in Photogrammetry and Remote Sensing, Summer Semester 2006, Institute of Geodesy and Photogrammetry, ETH Zurich, 2006. 21. G. Godin, M. Rioux, J.-A. Beraldin, M. Levoy, and L. Cournoyer, “An assessment of laser range measurement of marble surfaces”, Optical 3-D Measurement Techniques V, Vienna, Oct. 1-4, pp. 49-56, 2001.
SPIE-IS&T/ Vol. 6491 64910V-12