performance evaluation of fine graded ... evaluation of fine graded superpave mixtures for surface...
TRANSCRIPT
PERFORMANCE EVALUATION OF FINE GRADED
SUPERPAVE MIXTURES FOR SURFACE COURSES
by
N. Paul KhoslaS. Sadasivam
andGlen Malpass
HWY-2000-06
FINAL REPORTFHWA/NC/2002-005
in Cooperation with
North Carolina Department of Transportation
Department of Civil Engineering
North Carolina State University
August 2001

i
Technical Report Documentation Page1. Report No.
FHWA/NC/2002-0052. Government Accession No. 3. Recipient’s Catalog No:
5. Report Date
August 2001
4. Title and Subtitle
Performance Evaluation of Fine Graded Superpave Mixtures for SurfaceCourses 6. Performing Organization Code
7. Authors
N. Paul Khosla, S. Sadasivam, Glen Malpass
8. Performing Organization Report No.
10. Work Unit No. (TRAIS)9. Performing Organization Name and AddressDepartment of Civil EngineeringNorth Carolina State UniversityBox 7908, Raleigh, NC, 27695-7908
11. Contract or Grant No.
13. Type of Report and Period CoveredFinal ReportJuly 1999 – June 2001
12. Sponsoring Agency Name and AddressNC Department of TransportationResearch and Analysis Group1 South Wilmington Street,Raleigh, NC 27601
14. Sponsoring Agency Code2000-06
15. Supplementary Notes
16.Abstract
SHRP A407 recommends that aggregate gradations pass below the restricted zone as traffic level increases. The
aggregate gradation curve of most of the SUPERPAVE mixes used today, especially in the Southeast region of the
U.S., follows a typical "S" shape with fines lying slightly below the restricted zone. Such a gradation yields a
relatively coarse mix; however, the use of gradation with fines slightly above the restricted zone is technically
acceptable according to SHRP specifications. Since such a mix is similar to the I-I or I-2 surface mixture used by
the NCDOT for surfacing of the secondary roads, it will be more economical as well as more amenable to
acceptance by field engineers. The use of natural sand will reduce the build up of fines in the stone quarries and
encourage the use of reclaimed asphalt pavement (RAP) material.
This study investigated the use of natural sand in the fine and coarse gradations for the surface course mixtures.
The mixtures were designed using the SUPERPAVE mix design approach and were evaluated for their
performance in terms of resistance to rutting, fatigue, and moisture damage. In addition, the accelerated
performance of these mixtures was also evaluated using the Asphalt Pavement Analyzer (APA).
17. Key WordsSuperpave mixtures, natural sand, SHRP performancetests, rutting and fatigue life, Asphalt Pavement Analyzer.
18. Distribution Statement
19.Security Classif.(of this report)
Unclassified
20.Security Classif.(of this page)
Unclassified
21.No. of Pages
81
22.Price
Form DOT F 1700.7 (8-72) Reproduction of completed page authorized

ii
DISCLAIMER
The contents of this report reflect the views of the authors and not necessarily the views
of the University. The authors are responsible for the facts and the accuracy of the data
presented herein. The contents do not necessarily reflect the official views or policies of
either the North Carolina Department of Transportation or the Federal Highway
Administration at the time of publication. This report does not constitute a standard,
specification, or regulation.

iii
ACKNOWLEDGMENTS
The author expresses his sincere appreciation to the authorities of the North Carolina
Department of Transportation for making available the funds needed for this research.
Sincere thanks go to Mr. Cecil Jones, Chairman, Technical Advisory Committee, for his
interest and helpful suggestions through the course of this study. Equally, the
appreciation is extended to other members of the committee, Mr. Jim Grady, Mr. Carson
Clippard, Mr. Jack Cowsert, Mr. J. Travis, and Dr. Moy Biswas for their continuous
support during this study.

iv
TABLE OF CONTENTS
Page
Chapter 1: Introduction 1
1.1 Problem Statement 1
1.2 Objectives and Scope of Study 2
1.3 Research Approach and Methodology 3
Chapter 2: Literature Review 14
2.1 Superpave Specifications on Aggregates 14
2.1.1 Role of Aggregate Gradation 14
2.1.2 Air Void Considerations 15
2.2 Natural Sands 16
2.3 Review of Past Work 17
2.3.1 Packing Volume Concepts and Rugosity 20
Chapter 3: Material Selection And Evaluation 23
3.1 Asphalt Binder Properties 23
3.2 Manufactured Aggregate Properties 24
3.3 Natural Sand Properties 24
Chapter 4: Mixture Design 27
4.1 Mixture Design Procedure and Requirements 27
4.2 Design of Mixtures Containing 100% Manufactured Sand 28
4.3 Design of Mixtures Containing Natural Sand 31
Chapter 5: Mixture Evaluation 39
5.1 Simple Shear Tests 39
5.1.1 Frequency Sweep Test at Constant Height 40
5.1.2 Repeated Shear Test at Constant Height 42
5.2 Gyratory Load Plate Assembly 45

v
5.3 Evaluation of Moisture Sensitivity 51
5.4 Asphalt Pavement Analyzer for Rutting Susceptibility 54
Chapter 6: Mixture Performance Evaluation 58
6.1 SUPERPAVE Fatigue Model Analysis 58
6.2 SUPERPAVE Rutting Model Analysis 64
Chapter 7: Summary of Results and Conclusions 68
Implementation and Technology Transfer Plan 73
References 74

1
CHAPTER 1
INTRODUCTION
Because approximately 85% of the total volume of a hot-mix asphalt (HMA)
mixture consists of aggregates, the mineral aggregate properties are important to asphalt
mixture performance. One of the most important properties of the aggregate in the HMA
mix is the gradation. Aggregate gradation for a SUPERPAVE mix design is bound by
control points and a restricted zone on a 0.45 power chart that helps establish the
gradation of the aggregate blends.
The control points serve the following purposes: maximum size of aggregate;
relative proportion of coarse aggregate and fine aggregate; and amount of dust. In its
aggregate gradation limit, the restricted zone is introduced to avoid mixtures that have a
high proportion of fine sand relative to total sand. It is based on experience with
"humped" gradations that are generally caused by excessive amounts of fine sand. It also
avoids gradations that follow the maximum density, which do not have adequate voids in
the mineral aggregate. This criterion ensures that the aggregate will develop a strong,
stone skeleton to enhance resistance to permanent deformation while enhancing mixture
durability.
SHRP A407 recommends that aggregate gradations pass below the restricted zone
as traffic level increases. The aggregate gradation curve of most of the SUPERPAVE
mixes used today, especially in the Southeast region of the U.S., follows a typical "S"
shape with fines lying slightly below the restricted zone. Such a gradation yields a
relatively coarse mix; however, the use of gradation with fines slightly above the
restricted zone is technically acceptable according to SHRP specifications. Since such a
mix is similar to the I-I or I-2 surface mixture used by the NCDOT for surfacing of the
secondary roads, it will be more economical as well as more amenable to acceptance by
field engineers. The use of natural sand will reduce the build up of fines in the stone
quarries and encourage the use of reclaimed asphalt pavement (RAP) material.

2
1.1 Problem Statement
For the highway community, most of the experience with different types of
aggregate gradations has been with either Marshall or Hveem compacted specimens.
However, as each state and other highway agencies are preparing to switch over to the
SUPERPAVE™ system, several questions remain unanswered. There is a need to
evaluate the effect of the restricted zone on volumetric properties of fine graded mixtures
and determine if these mixtures can be successfully designed by the SUPERPAVE mix
design. More specifically, the following questions need to be answered:
1. How does the gradation with fines slightly above the restricted-zone perform ascompared to the gradation with fines lying slightly below the restricted zone?
2. What is the effectiveness of utilizing natural sands as fine aggregates?
3. What kinds of guidelines are needed for designing and producing fine aggregateblends for secondary roads?
4. What is the maximum amount of natural sand that can be allowed in a mixture tosatisfy the SUPERPAVE mix design criteria?
The scope of this proposal includes a background, explaining the aggregate gradation
curves and the approach to the SUPERPAVE mix design process for fine graded
mixtures containing natural sand. Current SUPERPAVE performance tests and the use of
loaded wheel testing device are also discussed to evaluate the performance of asphalt
mixtures. The objectives and scope are given followed by a research approach that will
accomplish the goals of the study.
1.2 Objectives and Scope of Study
The following are the specific objectives of the proposed study:
1. Study the aggregate gradation curves and investigate the use of natural sand in thefine and coarse gradations for the Surface Course mixtures.
2. Design the mixtures using the SUPERPAVE mix design approach and conduct testingof the selected asphalt mixtures, including the SUPERPAVE performance tests toevaluate their performance in terms of resistance to rutting, fatigue, and moisturedamage.

3
3. Compare the accelerated performance test results of the selected asphalt mixturesusing the Asphalt Pavement Analyzer (APA).
1.3 Research Approach and Methodology
Prior to presenting the specific steps to be taken in the research portion of the
study, it is appropriate to review the fundamentals of mineral aggregate in asphalt
mixtures, especially in regards to the SHRP system. The theory of the SUPERPAVE
gyratory compactor (SGC), SUPERPAVE Intermediate and Complete mix designs, and
loaded wheel testing machine are presented in addition to factors affecting the aggregate
gradation selection.
As stated earlier, one of the most important properties of the aggregate in an
HMA mix is the gradation, since about 85% of its total volume consists of aggregates.
The angularity, shape, and texture of the aggregate particles also have an effect on the
performance of HMA mixtures by controlling the mixture's strength and rutting. By
specifying coarse and fine aggregate angularity, the SUPERPAVE mix design seeks to
achieve an HMA with a high degree of internal friction and high shear strength for rutting
resistance.
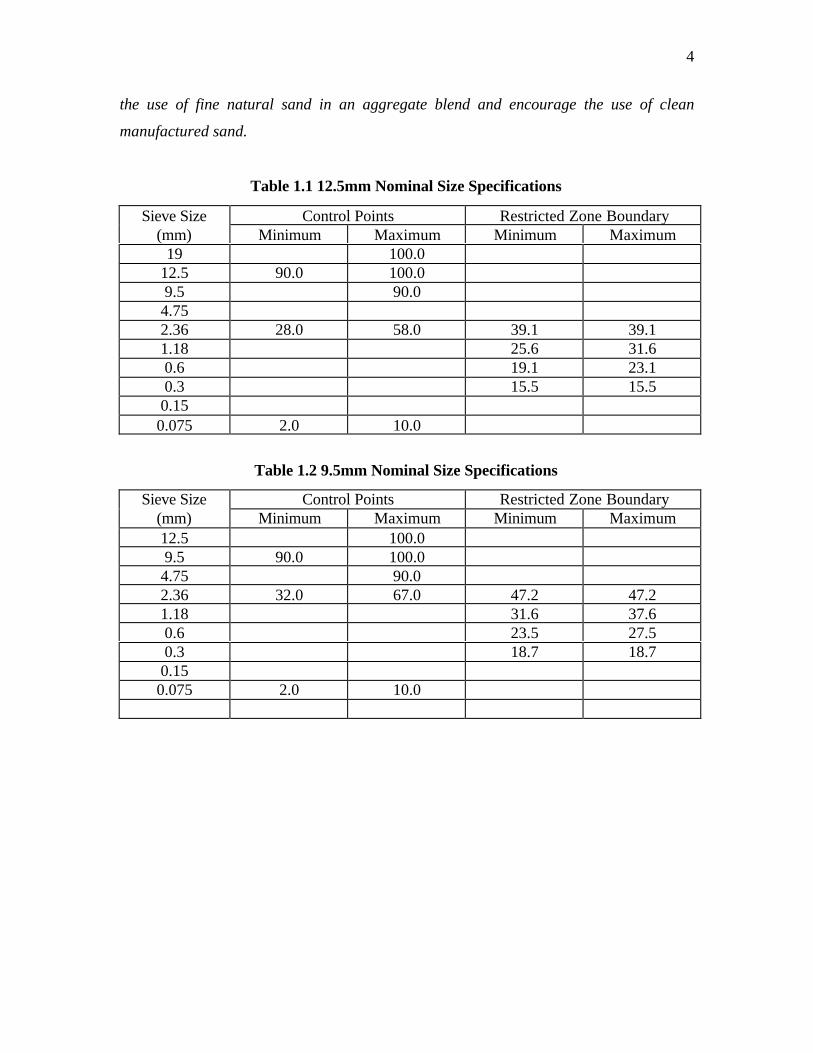
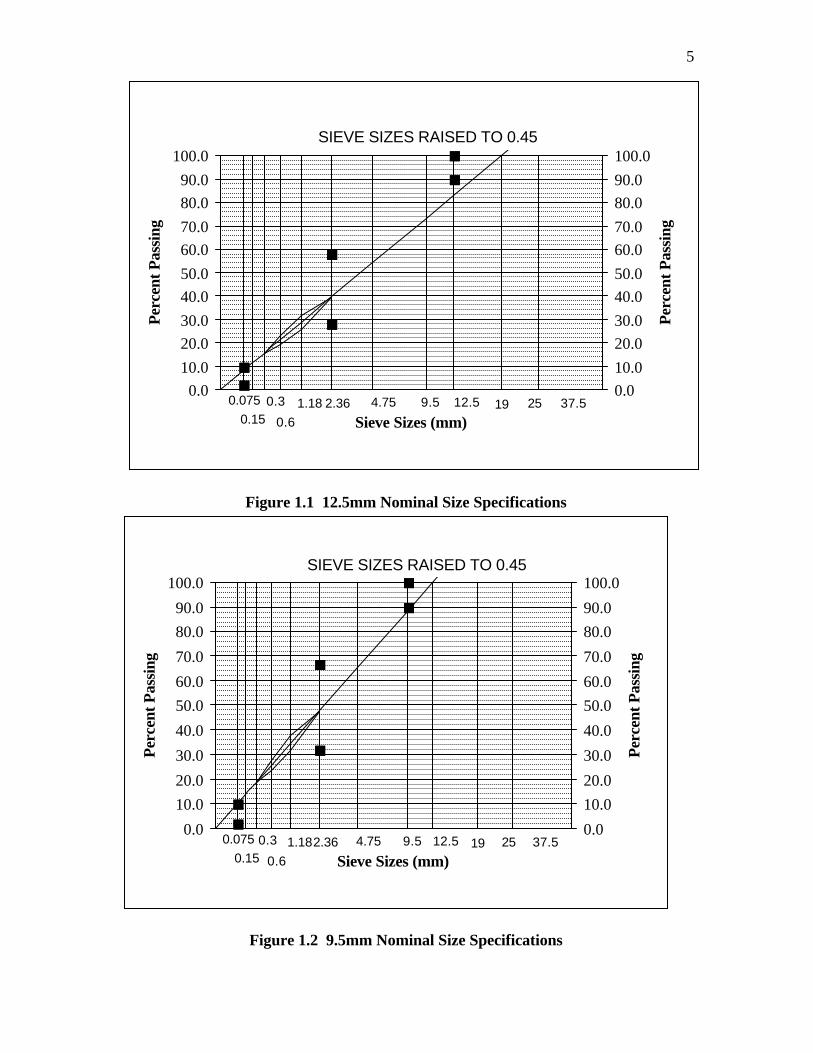
To help specify a proper aggregate gradation, the SHRP suggested two additional
features to the traditional 0.45 power chart: control points and a restricted zone. This is
illustrated in Tables 1.1 and 1.2 and Figures 1.1 and 1.2, respectively. The control points
perform as ranges through which gradations must pass. Their functions are: to maximize
the size of aggregate; to balance the relative proportion of coarse aggregate and fine
aggregate; and to control the amount of dust. The restricted zone is placed along the
maximum density gradation between intermediate size and the 0.3mm size. It is
introduced to avoid mixtures that have a high proportion of fine sand relative to the total
sand. It also avoids gradations that follow the maximum density, which do not have
adequate voids in the mineral aggregate. SHRP recommends that gradations pass outside
the restricted zone in order to provide adequate VMA and to avoid excessive use of
rounded sands. It also states that gradations that violate the restricted zone may possess a
weak aggregate skeleton that depends too much on asphalt binder stiffness to achieve
mixture shear strength. However, in many instances, the restricted zone will discourage
4
the use of fine natural sand in an aggregate blend and encourage the use of clean
manufactured sand.
Table 1.1 12.5mm Nominal Size Specifications
Sieve Size Control Points Restricted Zone Boundary(mm) Minimum Maximum Minimum Maximum
19 100.012.5 90.0 100.09.5 90.04.752.36 28.0 58.0 39.1 39.11.18 25.6 31.60.6 19.1 23.10.3 15.5 15.50.150.075 2.0 10.0
Table 1.2 9.5mm Nominal Size Specifications
Sieve Size Control Points Restricted Zone Boundary(mm) Minimum Maximum Minimum Maximum12.5 100.09.5 90.0 100.04.75 90.02.36 32.0 67.0 47.2 47.21.18 31.6 37.60.6 23.5 27.50.3 18.7 18.70.150.075 2.0 10.0
5
Figure 1.1 12.5mm Nominal Size Specifications
Figure 1.2 9.5mm Nominal Size Specifications
0.010.0
20.030.0
40.050.0
60.070.0
80.090.0
100.0
Sieve Sizes (mm)
Per
cent
Pas
sing
0.010.0
20.030.0
40.050.0
60.070.0
80.090.0
100.0
Per
cent
Pas
sing
SIEVE SIZES RAISED TO 0.45
0.075 259.5 1912.54.752.361.18
0.6
0.30.15
37.5
0.0
10.0
20.0
30.0
40.0
50.0
60.0
70.0
80.0
90.0
100.0
Sieve Sizes (mm)
Per
cent
Pas
sing
0.0
10.0
20.0
30.0
40.0
50.0
60.0
70.0
80.0
90.0
100.0
Per
cent
Pas
sing
SIEVE SIZES RAISED TO 0.45
0.075 259.5 1912.54.752.361.18
0.6
0.30.15
37.5

6
The amount of fines used in asphalt concrete mixtures and its shape and surface
texture play a significant role in determining the workability, durability, and strength of
asphalt concrete pavements. Angular and rough aggregate particles produced from
crushing operations usually produce mixtures that are stronger and more resistant to
permanent deformation than mixtures containing round and smooth aggregates from
natural river sands. However, crushed fines are blended with natural sands to increase the
workability of the mix.
To study the different aggregate gradation curves, four different mixes will be
evaluated. All of these mixes will consist of crushed granite aggregate available in NC
with varying percentages of natural sand. The type of granite and sand will be selected in
consultation with NCDOT. Two different sizes of aggregate blends will be used: 12.5
mm nominal size and 9.5 mm nominal size. For each type of aggregate blend, two
different aggregate gradations will be utilized comparing finer and coarser gradations: (1)
above restricted zone with 12.5mm NMSA, (2) below restricted zone with 12.5mm
NMSA, (3) through restricted zone with 9.5mm NMSA, and (4) above restricted zone
with 9.5mm NMSA. Sample gradations are shown in Figures 1.3 and 1.4. The aggregate
gradations are different only around the restricted zone. A PG64-22 asphalt cement will
be used for all the mixtures evaluated in this study.
A new, key feature in the SUPERPAVE mix design method is the laboratory
compaction. Laboratory compaction is accomplished by the SGC. The SGC's unique
feature is that it can provide information about the compactability of the particular
mixture by capturing data during compaction. Specimen density is achieved in the
gyratory compactor on the basis of three controls: vertical pressure, gyratory angle and
number of gyrations. The compaction pressure is 600 kPa, and the SGC base rotates at
constant 30 revolutions per minute during compaction with the mold positioned at a
compaction angle of 1.25 degrees. A specimen height measurement is an important
characteristic of the SGC since specimen density can be estimated during compaction by
knowing the mass of material, the diameter of the mold, and the specimen height.

7
0.0
10.0
20.0
30.0
40.0
50.0
60.0
70.0
80.0
90.0
100.0
Sieve Sizes (mm)
Per
cent
Pas
sing
0.0
10.0
20.0
30.0
40.0
50.0
60.0
70.0
80.0
90.0
100.0
Per
cent
Pas
sing
SIEVE SIZES RAISED TO 0.45
0.075 29.5 1912.54.752.361.180.6
0.30.15
37.5
Figure 1.3 Sample 9.5mm Gradations
0.0
10.0
20.030.0
40.050.0
60.0
70.080.0
90.0100.0
Sieve Sizes (mm)
Per
cent
Pas
sing
0.0
10.0
20.030.0
40.050.0
60.0
70.080.0
90.0100.0
Per
cent
Pas
sing
SIEVE SIZES RAISED TO 0.45
0.075 29.5 1912.54.752.361.180.6
0.30.15
37.5
Figure 1.4 Sample 12.5mm Gradations

8
In SUPERPAVE system, the compaction is a function of the design number of
gyrations, Ndes. It is used to vary the compactive effort of the design mixture and is a
function of climate and traffic level. The initial number of gyrations (Nini) is used to
determine an estimation of the compactability, and the specimen is compacted to the
maximum number of gyrations (Nmax).
The compaction data are analyzed by calculating the estimated bulk specific
gravity, corrected bulk specific gravity, and corrected percentage of maximum theoretical
specific gravity (%Gmm). From these data points, three graphs are generated: air voids,
voids in mineral aggregate (VMA), and voids filled with asphalt (VFA) versus asphalt
content. The criteria for the proper mixtures are as follows:
• The target air void should be 4 percent
• VMA values are a function of the nominal maximum size of aggregate
• VFA values depend on traffic level
• % Gmm at Nini should be less than 89%
• % Gmm, at Nmax should be less than 98%
In order to evaluate the effect of the restricted zone on volumetric properties of
specimens compacted with the SGC the following questions are addressed:
1) Are Nini, Ndes, and Nmax affected by the different aggregate gradations, and if sohow?
2) Do the different type of aggregate blends (crushed granite and granite withnatural sand) affect the volumetric properties?
In order to get 4% air void in an I-2 surface mixture used by the NCDOT, the asphalt
cement content is increased to as high as 7%. Since the fine graded asphalt mixture is
designed for a low traffic-volume road, producing an economical mixture is one of the
main goals. Currently, the NCDOT uses the target air voids of 5 to 5.5% with Marshall
mix design method; however, the SUPERPAVE™ system specifies that the target air void
should be 4%. This criteria requires the following investigations of I-2 surface mixture:
1. Is it reasonable to design I-2 surface mix by the SUPERPAVE mix design method?
2. Can it be produced easily and economically?

9
The volumetric properties of the mixes at optimum asphalt content are compared
as well as the compaction parameters for different mixes will be compared. In addition,
the moisture sensitivity of the design mixture will be evaluated according to the
AASHTO T283 to ensure the adequate performance of the mixes.
The performance based tests and performance prediction models are the products
of the SHRP research. Outputs from these tests are used to make predictions of actual
pavement performance. They are developed to estimate the performance life of a
prospective HMA in terms of equivalent single axle loads (ESALs). Two new
performance based testing procedures were developed by the SHRP: SUPERPAVE Shear
Tester (SST) and the Indirect Tensile Tester IDT. The data from these tests are used to
estimate actual pavement performance.
The SUPERPAVE Volumetric mix design entails compacting test specimens
using the SGC and selecting asphalt content on the basis of volumetric design
requirements. Intermediate mix design uses a volumetric mix design as a starting point
and adds an array of SST and IDT tests to arrive at a series of performance predictions. It
is used for traffic up to ten million ESALs and is anticipated to be the most predominant
SUPERPAVE mix design used in typical highway applications. Complete mix design
includes most of the facets of Volumetric and Intermediate mix designs. Complete
designs offer a more reliable level of performance prediction. It is required for traffic
levels exceeding ten million ESALs.
The performance testing and performance prediction models are important in
designing and managing pavements. The SUPERPAVE™ performance prediction
includes the following four components:
• material property model
• environmental effects model
• pavement response model
• pavement distress model
These models account for both the new asphalt mixture being designed and the
characteristics of the in-place pavement.
The test results from the SST and IDT are used to determine non-linear elastic,
visco-elastic, plastic, and fracture properties as the material property model. The

10
environmental effects model calculates pavement temperature as a function of depth and
material thermal characteristics. The pavement response model predicts stresses and
strains using a two-dimensional, axisymmetric finite element approach from the output of
the material property and environmental effects models. The pavement distress model
estimates rutting and fatigue and low temperature cracking by using the pavement
response and material property models. The major difference between the Intermediate
and Complete mix designs is that Complete level testing provides a more reliable
prediction of pavement performance because it involves performance testing over a wider
range of temperatures as compared to Intermediate mix design. This allows use of the
environmental effects model to more accurately predict pavement performance.
The SST is a closed-loop system that consists of four major components such as
the testing apparatus, the test control unit and data acquisition system, the environmental
control chamber, and the hydraulic system. Six tests can be performed using the SST, and
they are as follows:
• volumetric test
• uniaxial strain test
• repeated shear test at constant stress ratio
• repeated shear test at constant height
• simple shear test at constant height
• frequency sweep test at constant height
The volumetric and uniaxial strain tests are performed only for the Complete mix design.
A full description of the test procedures can be found in AASHTO TP7. In this
proposed study, repeated shear test at constant height and frequency sweep test at
constant height will be used to analyze the performance of HMA mixtures. The rutting
and fatigue analyses will then be conducted using the test results.
The repeated shear test at constant height is performed to identify an asphalt
mixture that is prone to tertiary rutting. Tertiary rutting occurs at low air void contents
and is the result of bulk mixture instability. In this test, repeated synchronized shear and
axial load are applied to the specimen. The test specimens are subjected to load cycles of
between 5,000 and 120,000 cycles depending on traffic and climate conditions, or until
11
the permanent strain reaches five percent. One load cycle consists of 0.1 second load
followed by 0.6 second rest period. The permanent shear strains are measured in this test.
The frequency sweep test at constant height is used to analyze the permanent
deformation and fatigue cracking. A repeated shearing load is applied to the specimen to
achieve a controlled shearing strain of 0.05 percent. One hundred cycles are used for the
test at each of the following loading frequencies: 10, 5, 2, 1, 0.5, 0.2, 0.1, 0.05, 0.02 and
0.01 Hz. The dynamic shear modulus (G*) and phase angle (δ) are determined by this
test.
The IDT is used to measure the creep compliance and strength of asphalt mixtures
using indirect tensile loading at intermediate to low temperatures. Two tests are
performed using the IDT: Creep Compliance and Strength at Low Temperatures and
Strength at Intermediate Temperatures. A full description of the test procedures can be
found in AASHTO TP9. Although the IDT is a part of the SUPERPAVE Intermediate
and Complete designs, it will not be included in this study.
The loaded wheel testing machine is a proof tester of HMA mixtures. A
compacted asphalt concrete specimen is subjected to an elevated temperature in a loaded
wheel system under repetitive loading, and the permanent deformation induced under the
wheel path is measured. This test will simulate the actual field compaction, the traffic
loading and the environmental conditions in a laboratory.
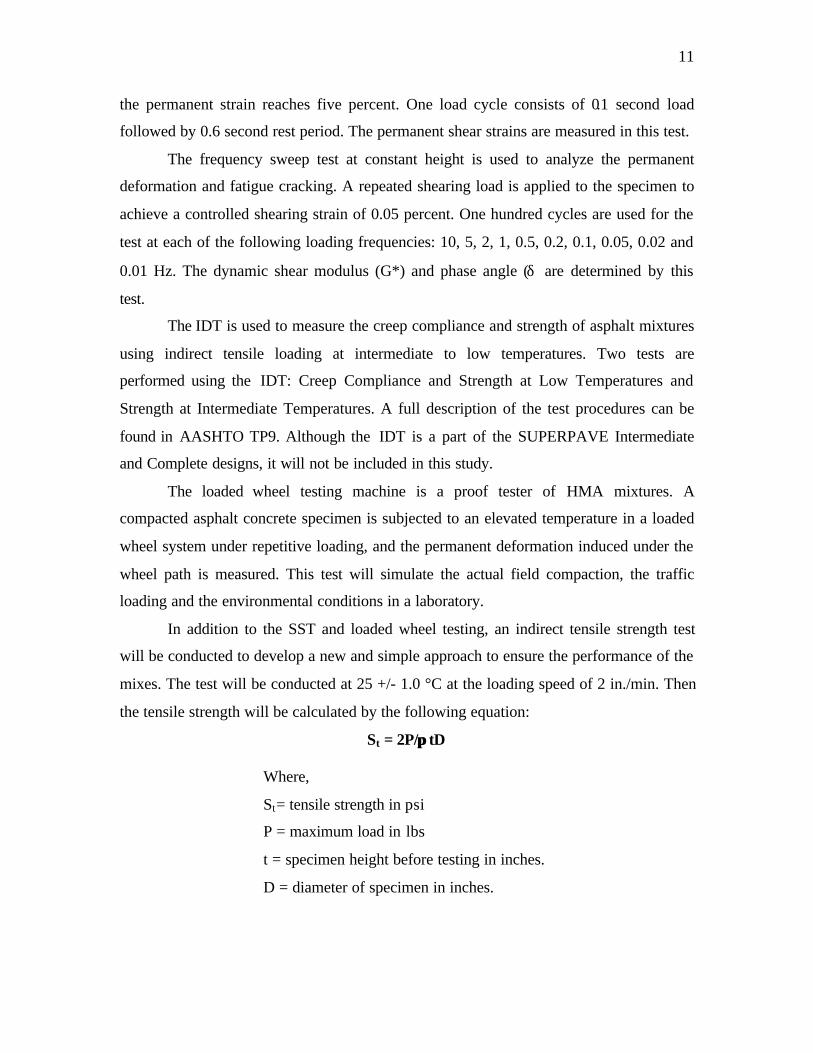
In addition to the SST and loaded wheel testing, an indirect tensile strength test
will be conducted to develop a new and simple approach to ensure the performance of the
mixes. The test will be conducted at 25 +/- 1.0 °C at the loading speed of 2 in./min. Then
the tensile strength will be calculated by the following equation:
St = 2P/ππ tD
Where,
St= tensile strength in psi
P = maximum load in lbs
t = specimen height before testing in inches.
D = diameter of specimen in inches.

12
In accordance with AASHTO T283, the moisture sensitivity of SUPERPAVE mixtures
will be evaluated using the given equation for the indirect tensile strength. From the
calculated tensile strengths, a tensile strength ratio will be determined for each aggregate
blend. Currently, the NCDOT criterion for tensile strength ratio is a minimum of 0.85 or
85%.
In view of the detailed discussion in the preceding sections, the project objectives
will be achieved through the following main tasks:
l) Aggregate Gradation Selection: All the mixes will consist of manufactured crushed
granite aggregate and varying amount of natural sand with a maximum of 20 percent.
Preliminary discussions with NCDOT have suggested 2 levels for the amount of
natural sand. The selection of natural sand used will be made in consultation with
NCDOT. Two different sizes of principal aggregate blends will be used: 12.5 mm and
9.5 mm nominal sizes. Four different gradations will be used to study all the possible
adversative effects, if any, on mixes: (1) gradation above the restricted zone with
12.5mm NMSA, (2) gradation below the restricted zone with 12.5mm NMSA, (3)
gradation through the restricted zone with 9.5mm NMSA, and (4) gradation above the
restricted zone with 9.Smm NMSA. The aggregate gradations will be different only
around the restricted zone. In order to ensure an acceptable level of performance for
fine aggregate, AASHTO TP33 will be used to determine the particle shape and
surface texture of the fine aggregates.
2) Mixture Design: It is proposed that the SUPERPAVE mix design is performed for
all aggregate gradations and blends to determine the optimum asphalt contents. A
PG64-22 asphalt cement will be used for all the mixtures. The mix design will be
conducted for each of the mixes with the SUPERPAVE gyratory compactor for
designing secondary roads in North Carolina. The values of Nini, Ndes and Nmax of 6,
50, and 75, respectively, will be used for 9.5mm NMSA gradations and 7, 75, and
115 will be used for 12.5mm NMSA gradations. After the mix designs are completed,
the volumetric properties of the mixes at optimum asphalt content will be evaluated,
and the moisture sensitivity of the design mixture will be evaluated according to
AASHTO T283.

13
3) SUPERPAVE Performance Testing: After the successful completion of the mix
design, the following two SUPERPAVE performance prediction tests will be
conducted: repeated shear test at constant height and frequency sweep test at constant
height. As discussed earlier, these tests will evaluate the rutting and fatigue
characteristics of fine graded mixes containing natural sand. As the low temperature
cracking is not a prevalent mode of distress in pavements in North Carolina,
especially in eastern part of the state, these evaluations will not be included in this
study. The positive results of performance evaluation will produce guidelines for
designing and producing such mixes and will allow the NCDOT to develop and
utilize a relatively economical SUPERPAVE™ surface course mixes for secondary
roads. On the other hand, the negative results will prevent the NCDOT from using
potentially troublesome mixes.
4) Indirect Tensile Strength Testing: A study of mixtures by the indirect tensile
testing device will be conducted to develop a simpler approach for evaluating the
performance of mixes. This test will also help in producing guidelines for designing
and producing fine graded SUPERPAVE™ surface course mixes.
5) Loaded Wheel Testing: The testing of mixtures by the loaded wheel testing device,
known as Asphalt Pavement Analyzer (APA), will be conducted to screen the mixes.
This will be used to determine the rut susceptibility of mixes under the wheel path.
Such an approach will also help in producing guidelines for designing and producing
fine graded SUPERPAVE surface course mixes.
The following sections will explain in detail the testing and characterization of the
materials used in this study, give the results of the SUPERPAVE volumetric design of all
study mixtures, and discuss the results of the mixture performance testing. The results of
the moisture sensitivity and loaded wheel testing will also be presented and discussed.
14
CHAPTER 2
LITERATURE REVIEW
Mineral aggregates play an important role in the performance of asphalt mixtures.
Aggregates constitute about 85% of total volume of asphalt mixtures. Various factors
such as gradation and maximum size of the aggregate blend, angularity and surface
texture of the aggregates influence the performance of the mixtures.
2.1 Superpave Specifications on Aggregates
Unlike the Marshall and Hveem mix design methods, Superpave mix design procedures
incorporate aggregate criteria by refining the existing test methods. Two types of
aggregate procedures are specified: consensus properties and source properties
The consensus properties are coarse aggregate angularity, fine aggregate angularity, flat
and elongated particles and clay content (1). Angularity of the aggregates ensures a high
degree of internal friction and shear resistance. Limiting elongated pieces ensures that the
mixture will not be susceptible to aggregate breakage during handling and construction
and under traffic. Limiting the amount of clay ensures the adhesive bond between asphalt
binder and the aggregate. Source properties include toughness, soundness and deleterious
materials. Those properties are source specific and are used to qualify local sources of
aggregates.
2.1.1 Role of Aggregate Gradation
One of the most important properties of the aggregates in the asphalt mix is the gradation.
To specify aggregate gradation, Superpave uses the 0.45 power gradation chart with
control points and a restricted zone to develop a design aggregate structure. Control
points function as master ranges between which gradation must pass. They are placed on
the nominal maximum sieve, an intermediate sieve (2.36mm), and the smallest sieve
(0.075mm).

15
The restricted zone, residing along the maximum density gradation between an
intermediate sieve and the 0.3mm sieve, forms a band through the gradation cannot pass.
Gradations that pass through the restricted zone have been called “humped gradations”
because of their characteristic hump shape in this area. In most cases, a humped
gradation indicates a high proportion of fine sand relative to total sand. This gradation
poses compaction problems during construction and offers reduced resistance to
permanent deformation during its performance life. The restricted zone also prevents the
gradation from following the maximum density line in the fine aggregate sieves.
Gradations that follow this maximum density gradation often have inadequate VMA to
allow enough asphalt content for adequate durability. These gradations are every
sensitive to asphalt content and can easily become plastic with even minor variations in
asphalt content.
2.1.2 Air Void Considerations
The packing characteristics of asphalt-coated aggregate properties in an asphalt mixture
are related to both aggregate surface characteristics and gradation. Aggregate surface
characteristics include angularity and surface texture. Surface properties contribute to
stability and skid resistance.
Sufficient voids are needed to develop adequately thick asphalt films for adhesion and
durability. Aggregate gradation has a major influence in the formation of intergranular
void space between the aggregate particles. The volume of this intergranular void space
between the aggregate particles of a compacted paving mixture that includes the air voids
and the effective asphalt content, expressed as a percent of total volume, is called the
Voids in the Mineral Aggregate (VMA).
A gradation with maximum density has no or very little air voids. The addition of asphalt
to this maximum density gradation only serves to separate the aggregate particles, which
reduces the shear strength of the mix and increases the potential for lateral flow. Too
much air voids makes the mixture highly permeable and thereby reduces the resistance to
the action of air and water. High permeability to air causes embrittlement of the binder
16
due to oxidation, causing the pavement to crack. High permeability to water encourages
stripping of the asphalt from the aggregate particles, and endangering the subgrade layer
and base course as well (2). Thus air voids in the compacted mixture play an important
role in the durability of asphalt concrete. Therefore, the voids’ content must be carefully
chosen so that none of the important characteristics are sacrificed.
2.2 Natural Sands
Fine aggregate contributes more to VMA than coarse aggregate. The interaction of shape
and texture of the fine aggregates on the packing characteristics of an asphalt mixture
greatly influence the VMA of the mix. So rough textured and angular aggregates will
have a high degree of interlock when a load is applied and will be more resistant to
displacement by that load. Crushed aggregates or Manufactured aggregates are angular
and have rough surface textures.
In practice, the use of natural sand is widely noticed. Natural sand can be defined as fine
aggregate that are obtained from natural deposits, rather than those that are collected
during aggregate crushing operations. The use of natural sand is attractive to contractors
because it is generally less expensive than crushed fines (3).
Natural sands are fine, well rounded aggregates with smooth surface texture. Aggregates
that are rounded are more easily moved or displaced by an applied load. Rounded
materials tend to slide by each other when subjected to load. The particles with smooth
surface textures will generally be more easily compacted than the aggregates with rough
surface textures.
The presence of natural sand in asphalt concrete tends to lower the resistance of the
mixture and makes more susceptible to permanent deformation, shoving, and bleeding
than mixtures containing 100 percent manufactured fine aggregates(4). These effects of
natural sands are attributable to their round shape and smooth surface texture, which
facilitate to the rearrangement of larger aggregate particle under the influence of repeated
loads.

17
Agencies like the Federal Highway Administration (FHWA) and the U.S. Army Corps of
Engineers (USACE) have issued guidance that limits the contents of natural sand in
pavement constructions. FHWA’s Technical Advisory T5040.27 provides the following
recommendations regarding natural sands: “The quality of natural sand varies
considerably from one location to another. Since most natural sands are rounded and
often contain some undesirable materials, the amount of natural sand such as a general
rule, should be limited to 15 to 20 percent for high volume pavements and 20 to 25
percent for medium and low volume pavements. These percentages may increase or
decrease depending on the quality of the natural sand and the types of traffic to which the
pavement will be subjected”. USACE limits the natural sand content of heavy-duty
pavement mixtures to 15% by mass of all the aggregate.
However some natural sands have performed as well as manufactured fine aggregates.
The shape of natural sands ranges from well round to angular, depending on their
mineralogy and geologic history. The performance of an asphalt mixture can also depend
on the quality of sand used.
2.3 Review of Past Work
Various papers have been published in the literature regarding the performance of natural
and crushed aggregates in asphalt mixtures.
JM Rice and WH Goetz (5) explored the possibility of using local Indiana dune, lake and
gravel pit waste sands as aggregates for low cost sand bituminous pavement mixtures,
particularly in areas where commercial aggregates are to be obtained only at a premium.
Important characteristics of the sands, which influence the compressive strength of the
mixtures, are the amount of the natural fine material, the surface texture of the sand
grains and the gradation of the particle sizes. The Lake Michigan dune sands, because of
their smooth surface texture, lack of natural fine material, and one sized gradation, are
inferior to the lake sands in regard to compressive strength. The gravel-pit waste sands,
unused products of the commercial gavel-pits, produced stronger mixtures. Similarly Paul
18
and Rex (6) studied the possible problems encountered in the use of locally available
materials in asphalt mixtures. They found that the mixtures containing natural aggregates
produced inadequate compressive strengths. They recommended the use of crushed
aggregates, which resulted in pronounced improvement in stability.
J.W. Button (7) et al studied the influence of fine aggregate on plastic deformation on
laboratory prepared asphalt concrete mixtures when increasing amount of natural
(uncrushed) aggregate particles are added to replace crushed particles. Tests on asphalt
mixtures included unconfined compression, static and dynamic creep, and indirect
tension. The particle index test was used on the aggregate. Particle indices increase as the
amount of natural sand in the mix decreases. Some changes were observed with the
replacement of natural sand particles by manufactured sand particles.
They are
• Increased asphalt content owing to greater specific surface area and greater
absorption of asphalt by some manufactured particles.
• Increased air void content and VMA of compacted mixtures owing to the angular
shape and surface texture of the manufactured particles
It was also observed that the manufactured sand mix is more resistant to compaction. Test
results indicated that asphalt mixtures containing some natural sands plastically deform
under static and dynamic loads much more readily than similarly graded mixtures
containing only manufactured particles. They suggested that rutting can be successfully
addressed by replacing most or all of natural sands with manufactured particles, using
large top-size crushed aggregates, increasing the minimum allowable air voids in the
laboratory compacted mixtures and limiting filler to bitumen ratio. They concluded that a
properly designed asphalt paving mixture transmits loads through an interlocked
aggregate framework. It does not depend on the asphalt or mastic for shear strength.
19
Kalcheff and Tunnicliff (8) studied the effects of crushed coarse and fine aggregates in
asphalt concrete. They observed that the optimum asphalt content for properly designed
asphalt paving mixtures is approximately the same for natural sand mixtures and
manufactured sand mixtures containing sands of similar particle shape, but somewhat
greater for mixtures containing manufactured sand having more angular particles. Test
results indicated that the mixtures containing crushed coarse and fine aggregates are
much more resistant to permanent deformation from repeated traffic loadings, and much
less susceptible to the effects of temperature and high initial void content than
comparable mixtures with natural sand. Also, tensile fatigue resistance is improved by
using manufactured sand rather than natural sand. They concluded that manufactured
sand resulted in improved mixture behavior in all cases.
Shklarsky and Livneh (9) made an extensive study of the difference between natural
gravel and crushed-stone aggregates in combination with natural sand and crushed-stone
fine aggregates. Several variables were studied including the Marshall stability and flow,
angle of internal friction and cohesion as measured in triaxial shear, resistance to moving
wheel loading, resistance to splitting, immersion-compression strengths, and
permeability. They reported as follows: Replacement of the natural sand with crushed
fines improves incomparably the properties of the product, increases its stability, reduces
rutting, improves water resistance, reduces bitumen sensitivity, increases the void ratio,
and brings the mixture of the quality level of one with crushed coarse and fine aggregate.
On the other hand, replacement of the coarse material with crushed coarse aggregate
entails no such decisive effect.
Moore and Welke (10) ran Marshall mix designs on 110 sands from throughout the state
of Michigan in which the coarse aggregate, asphalt content, and mineral filler were held
constant. Both the angularity of the fine aggregate and the gradation of the mixture are
critical in acquiring higher stabilities. The more angular the fine aggregate, the higher the
stability. As for gradation, the closer the gradation is to the Fuller curve for maximum
density, the higher is the stability. Rounded sands of relatively uniform size result in

20
lower stabilities. Moreover, manufactured sands have highly angular particle shapes and
are made for extremely high stabilities.
Lottman and Goetz (11) have reported the effect of crushed gravel fine aggregate in
improving the strength of dense-graded asphaltic surfacing mixtures.
2.3.1 Packing Volume Concepts and Rugosity
The behavior of natural and manufactured aggregates can be explained by the packing
volume concepts developed by Tons and Goetz (12). The packing volume and rugosity
concepts are the theoretical basis for understanding the bulk behavior and interlocking
mechanisms of aggregate composites with and without a binder. Two aggregate factors
that influence the behavior of a compacted asphalt mixture are particle geometry and
particle volume. Particle geometry includes shape, angularity and surface texture of the
aggregate particles. Generally angularity and texture are overlapped and are unified by
the term “rugosity.” More angular the rock, the higher is the rugosity.
The particle volume is defined as the volume, which a rock particle occupies in a mass of
mono volume particles. Since irregular particles usually touch one another at the peaks of
the surface roughness, the packing volume encompasses not only the solids and the
surface capillaries (micro surface voids), but also the volume of surface macro dips and
valleys (macro surface voids). Macro surface voids are primarily a function of the
rugosity of a surface. The packing volume can be visualized as the volume enclosed by a
dimensionless membrane stretching along the peaks of surface roughness. For any
arrangement of particles in bulk, this membrane partitions voids into interparticle voids
and particle surface voids.
If all the aggregate particles were ideal, smooth and one-sized spheres and they were
packed in a simple cubical arrangement, the voids in the mass, porosity, would be 47.6
percent. In the densest tetrahedral packing, porosity would be reduced to 26.0 percent.
For randomly packed spheres and irregular particles, the porosities usually vary between
the two extremes.

21
Ishai and Tons(13) proved experimentally that in bituminous mixtures, surface voids of
large particles provide enough room not only for asphalt, but also for smaller particles.
They explained conceptually using a container filled with one-size, coarse, smooth
particles. To this container, a certain amount of one-size, fine, smooth particles were
added. The average equivalent sphere diameters for coarse and fine particles were
designated as dc and df respectively. If the diameter ratio df/dc is small enough, the fine
particles will be able to filter between the coarse ones and will fill the interparticle voids.
Thus, without changing the mass volume (volume of the container) the total packing
volume of the blend will increase, while the amount of packing porosity will decrease.
Under no dilation of coarse particles, the increase of the total packing volume is equal to
the decrease of the volume of interparticle voids. When the diameter ratio df/dc increases,
dilation will occur in the structure of coarse particles and the introduction of fine fraction
will increase the mass volume. Under constant packing volume of the particles, any
additional increase in the mass volume (dilation) will be equal to a change on the volume
of interparticle voids. The models are additive in both cases.
The additivity and simplicity of the above models are distorted when aggregates with
irregular and rough aggregate fractions are involved. In this case, some of the particles
may penetrate through and under the imaginary packing volume membrane of coarse
particles. They defined this interaction between coarse and fine aggregates as the fines
lost by rugosity.
They further observed that less active fine particles will be located between the larger
rough particles which will be packed closer together with thinner asphalt films between
them exhibiting higher resistance to shear, tensile and compressive deformation. On the
other hand, smooth textured particles will be simply pushed apart by the more active
fines between them and show low strength. They found that aggregates with higher
geometric irregularity possess lower packing VMA, while mixtures with smooth
spherical aggregates possess higher packing VMA.

22
Khedaywi and Tons (14) studied the effect of aggregate rugosity and size on bituminous
mixes. A hypothesis was tested which suggest that for each coarse aggregate type with
different surface characteristics, there is a specific fine aggregate size that contributes to
developing an interlocking mechanism between the surfaces of coarse aggregates when
they are combined in a bituminous mix. For hypothesis testing, two types of coarse
aggregates, limestone and rounded gravel, were used. They concluded that by matching
the rugosity and the size of the fines properly, the strength of rounded gravel mixes could
be made much closer to the strength of mixes using crushed limestone coarse aggregate.
23
CHAPTER 3
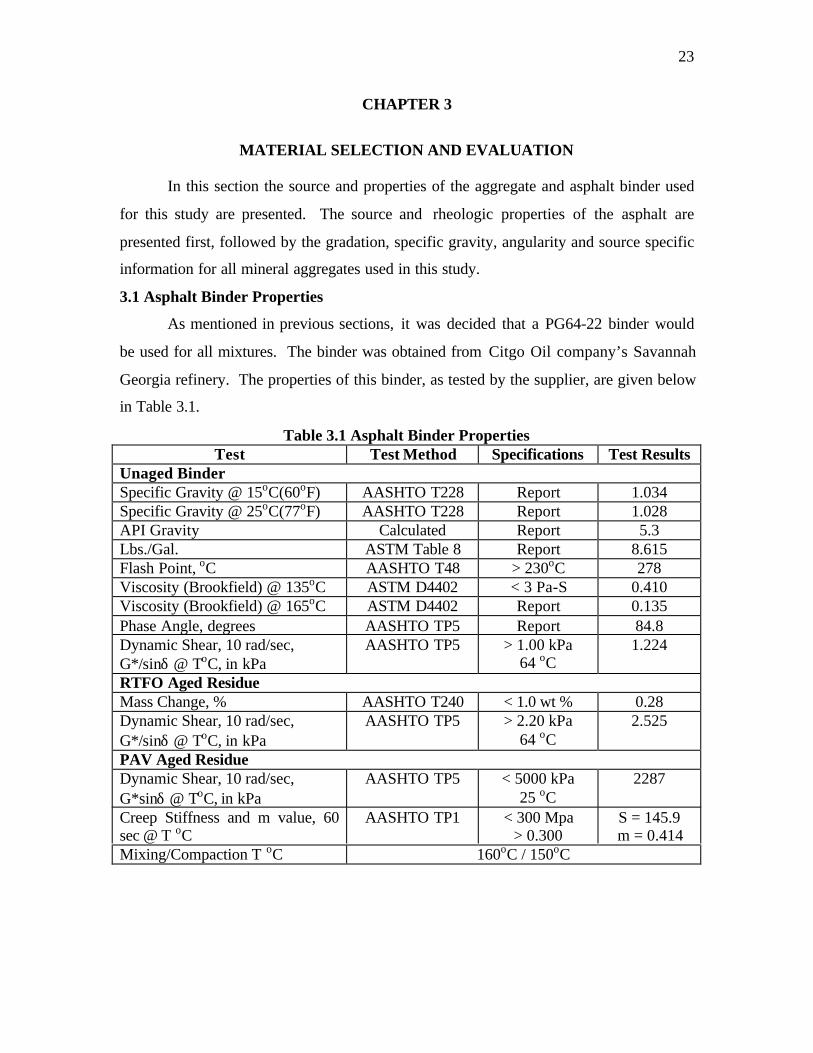
MATERIAL SELECTION AND EVALUATION
In this section the source and properties of the aggregate and asphalt binder used
for this study are presented. The source and rheologic properties of the asphalt are
presented first, followed by the gradation, specific gravity, angularity and source specific
information for all mineral aggregates used in this study.
3.1 Asphalt Binder Properties
As mentioned in previous sections, it was decided that a PG64-22 binder would
be used for all mixtures. The binder was obtained from Citgo Oil company’s Savannah
Georgia refinery. The properties of this binder, as tested by the supplier, are given below
in Table 3.1.
Table 3.1 Asphalt Binder PropertiesTest Test Method Specifications Test Results
Unaged BinderSpecific Gravity @ 15oC(60oF) AASHTO T228 Report 1.034Specific Gravity @ 25oC(77oF) AASHTO T228 Report 1.028API Gravity Calculated Report 5.3Lbs./Gal. ASTM Table 8 Report 8.615Flash Point, oC AASHTO T48 > 230oC 278Viscosity (Brookfield) @ 135oC ASTM D4402 < 3 Pa-S 0.410Viscosity (Brookfield) @ 165oC ASTM D4402 Report 0.135Phase Angle, degrees AASHTO TP5 Report 84.8Dynamic Shear, 10 rad/sec,G*/sinδ @ ToC, in kPa
AASHTO TP5 > 1.00 kPa64 oC
1.224
RTFO Aged ResidueMass Change, % AASHTO T240 < 1.0 wt % 0.28Dynamic Shear, 10 rad/sec,G*/sinδ @ ToC, in kPa
AASHTO TP5 > 2.20 kPa64 oC
2.525
PAV Aged ResidueDynamic Shear, 10 rad/sec,G*sinδ @ ToC, in kPa
AASHTO TP5 < 5000 kPa25 oC
2287
Creep Stiffness and m value, 60sec @ T oC
AASHTO TP1 < 300 Mpa> 0.300
S = 145.9m = 0.414
Mixing/Compaction T oC 160oC / 150oC
24
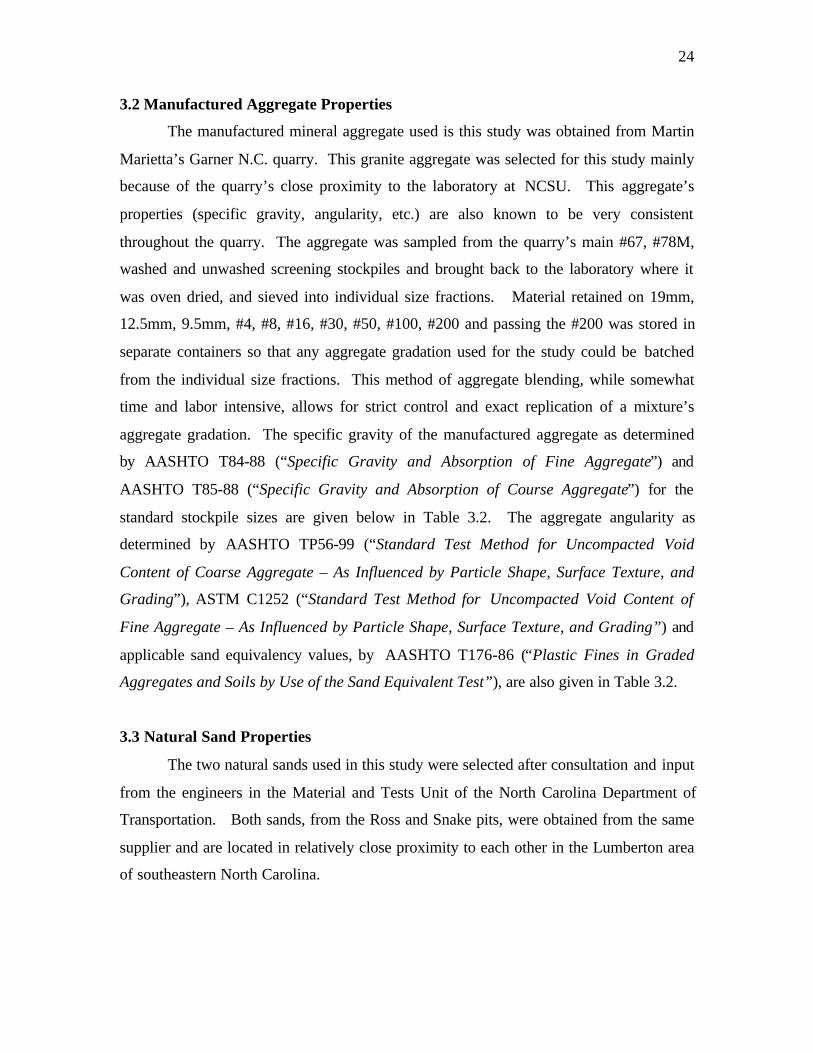
3.2 Manufactured Aggregate Properties
The manufactured mineral aggregate used is this study was obtained from Martin
Marietta’s Garner N.C. quarry. This granite aggregate was selected for this study mainly
because of the quarry’s close proximity to the laboratory at NCSU. This aggregate’s
properties (specific gravity, angularity, etc.) are also known to be very consistent
throughout the quarry. The aggregate was sampled from the quarry’s main #67, #78M,
washed and unwashed screening stockpiles and brought back to the laboratory where it
was oven dried, and sieved into individual size fractions. Material retained on 19mm,
12.5mm, 9.5mm, #4, #8, #16, #30, #50, #100, #200 and passing the #200 was stored in
separate containers so that any aggregate gradation used for the study could be batched
from the individual size fractions. This method of aggregate blending, while somewhat
time and labor intensive, allows for strict control and exact replication of a mixture’s
aggregate gradation. The specific gravity of the manufactured aggregate as determined
by AASHTO T84-88 (“Specific Gravity and Absorption of Fine Aggregate”) and
AASHTO T85-88 (“Specific Gravity and Absorption of Course Aggregate”) for the
standard stockpile sizes are given below in Table 3.2. The aggregate angularity as
determined by AASHTO TP56-99 (“Standard Test Method for Uncompacted Void
Content of Coarse Aggregate – As Influenced by Particle Shape, Surface Texture, and
Grading”), ASTM C1252 (“Standard Test Method for Uncompacted Void Content of
Fine Aggregate – As Influenced by Particle Shape, Surface Texture, and Grading”) and
applicable sand equivalency values, by AASHTO T176-86 (“Plastic Fines in Graded
Aggregates and Soils by Use of the Sand Equivalent Test”), are also given in Table 3.2.
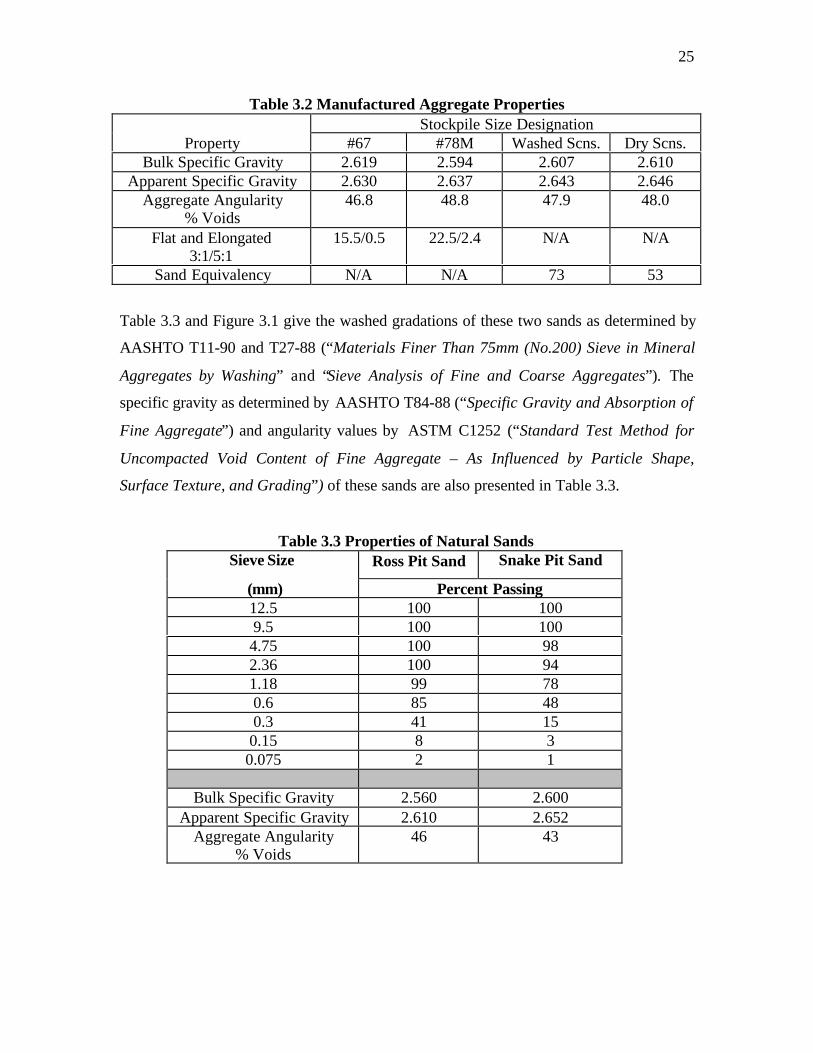
3.3 Natural Sand Properties
The two natural sands used in this study were selected after consultation and input
from the engineers in the Material and Tests Unit of the North Carolina Department of
Transportation. Both sands, from the Ross and Snake pits, were obtained from the same
supplier and are located in relatively close proximity to each other in the Lumberton area
of southeastern North Carolina.
25
Table 3.2 Manufactured Aggregate PropertiesStockpile Size Designation
Property #67 #78M Washed Scns. Dry Scns.Bulk Specific Gravity 2.619 2.594 2.607 2.610
Apparent Specific Gravity 2.630 2.637 2.643 2.646Aggregate Angularity
% Voids46.8 48.8 47.9 48.0
Flat and Elongated3:1/5:1
15.5/0.5 22.5/2.4 N/A N/A
Sand Equivalency N/A N/A 73 53
Table 3.3 and Figure 3.1 give the washed gradations of these two sands as determined by
AASHTO T11-90 and T27-88 (“Materials Finer Than 75mm (No.200) Sieve in Mineral
Aggregates by Washing” and “Sieve Analysis of Fine and Coarse Aggregates”). The
specific gravity as determined by AASHTO T84-88 (“Specific Gravity and Absorption of
Fine Aggregate”) and angularity values by ASTM C1252 (“Standard Test Method for
Uncompacted Void Content of Fine Aggregate – As Influenced by Particle Shape,
Surface Texture, and Grading”) of these sands are also presented in Table 3.3.
Table 3.3 Properties of Natural SandsSieve Size Ross Pit Sand Snake Pit Sand
(mm) Percent Passing12.5 100 1009.5 100 1004.75 100 982.36 100 941.18 99 780.6 85 480.3 41 150.15 8 30.075 2 1
Bulk Specific Gravity 2.560 2.600Apparent Specific Gravity 2.610 2.652
Aggregate Angularity% Voids
46 43

26
Figure 3.1 Natural Sand Gradations on 0.45 Power Chart
0.010.0
20.030.0
40.050.0
60.070.0
80.090.0
100.0
Sieve Sizes (mm)
Per
cent
Pas
sing
0.010.0
20.030.0
40.050.0
60.070.0
80.090.0
100.0
Per
cent
Pas
sing
Snake sand Ross sand
SIEVE SIZES RAISED TO 0.45
0.075 259.5 1912.54.752.361.18
0.6
0.30.15
37.5

27
CHAPTER 4
MIXTURE DESIGN
In this section, the results of the SUPERPAVE volumetric mixture design are presented
for all study mixtures. The mixture design procedure is briefly described and the
requirements and specifications are first presented, followed by the results in the mixture
designs for all study mixtures.
4.1 Mixture Design Procedure and Requirements
As mentioned in Chapter 1, it was decided that two different nominal maximum
size aggregate (NMSA) gradations would be used in this study: 12.5mm and 9.5mm. The
current NCDOT mixture requirements for a low volume pavement application were also
used for both mixture types. Table 4.1 gives those mixture requirements and design
parameters for a traffic level of less than 0.3 million equivalent single axle loads (ESALs)
over the pavement’s service life.
Table 4.1 NCDOT SUPERPAVE Mixture Design CriteriaCriteria or
SpecificationS12.5B
MixtureS9.5A
MixtureESAL Range (millions) <0.3 <0.3
Binder Grade PG64-22 PG64-22Gyrations at
Nini\Ndes\Nmax 7\75\115 6\50\75%Air Voids 4.0 4.0
%Void in Mineral Aggregate(min.)
14.0 15.0
%Voids Filled with Asphalt 65-78 70-80%Gmm at Nini (max.) 90.5 91.5%Gmm at Nmax (max.) 98.0 98.0
In a typical SUPERPAVE volumetric mixture design, trial aggregate gradations
are selected that meet the requirements of that mixture’s gradation control points, and
compacted with a SUPERPAVE gyratory compactor to specified number of revolutions
or gyrations (Nmax) using a calculated trial asphalt content. The bulk specific gravities of
the trial aggregate gradation samples are measured and calculations are performed to
28
determine an estimated optimum binder content and the corresponding volumetric
properties at that binder content. The estimated volumetric properties of these trial
aggregate gradations are evaluated for compliance to the specifications list in Table 4.1.
The aggregate gradation that best satisfies the volumetric requirements of that mixture
type is again used to fabricate specimens at varying asphalt binder contents and the
volumetric properties of that design aggregate gradation are again evaluated over a range
of binder contents. The binder content that satisfies the requirements of 4.0% air, and the
additional requirements listed in Table 4.1, is then the optimum design for that mixture
type. As mentioned in Chapter 1, one of the objectives of this study was to evaluate the
gradation curves themselves and their effect on the design and performance of the
mixtures. Upon consultation with NCDOT it was decided to concentrate on four general
aggregate gradations for this study: 1) 12.5mm NMSA passing above the restricted zone,
2) 12.5mm passing below the restricted zone, 3) 9.5mm passing below through the
restricted zone, and 4) 9.5mm passing above the restricted zone. These four gradations
basically represent two different NMSA gradations, each one of those having a relatively
coarser and finer portion of the fine aggregate fraction around the restricted zone. In
order to simplify future explanation and discussion of the different mixtures and
aggregate types used in this study, the following notation will be used:
(NMSA)(GRADATION)-(SAND)
where,
NMSA = nominal maximum size aggregate, either 9.5 or 12.5mm
SAND = sand type, manufactured (M), Ross pit (R) or Snake pit (S)
GRADATION = aggregate gradation with respect to the restricted zone, above
(RA), below (RB), or through (RT).
Example 12.5RA-M = 12.5mm NMSA mixture using 100% manufactured sand
passing above the restricted zone.
4.2 Design of Mixtures Containing 100% Manufactured Sand
Given the fact that the objective of the study had fixed the aggregate gradations to
some extent, the design of these mixtures did not include the typical selection of the

29
design aggregate structure procedure. The gradations were selected first and, through a
few trials using an asphalt content of 5.0%, were modified slightly until they yielded a
design that met all the requirements of those mixture types listed in Table 4.1. Figures
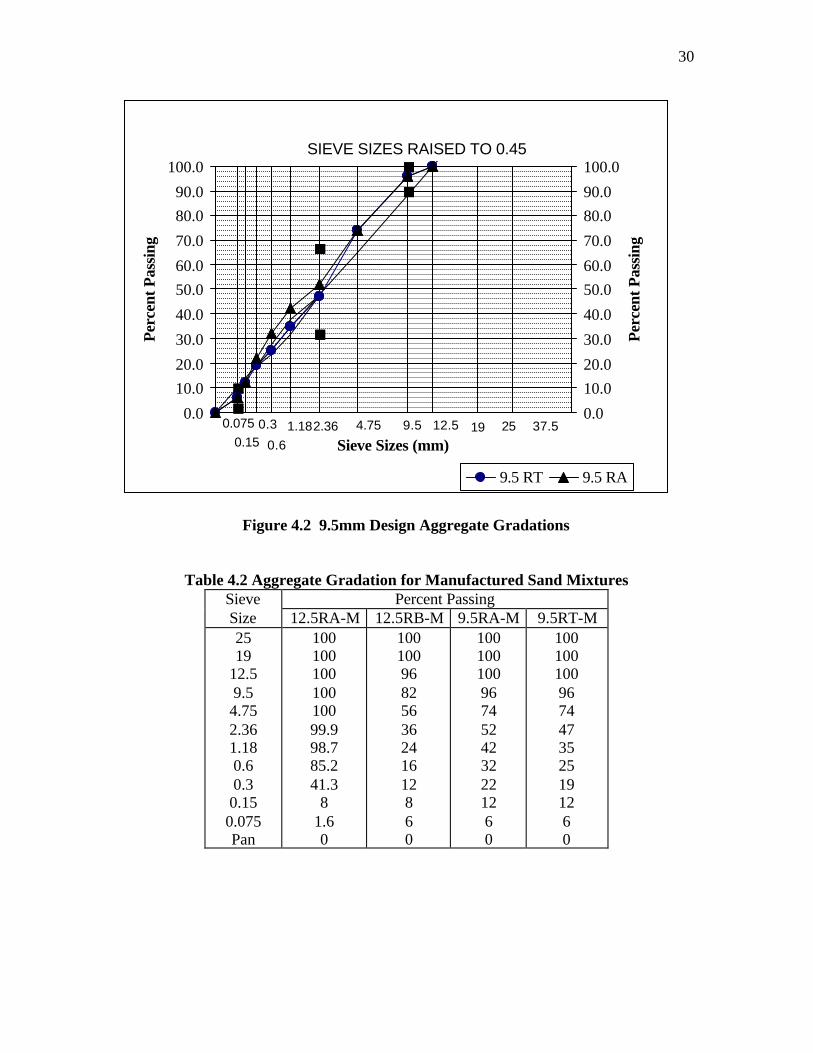
4.1,4.2 and Table 4.2 show the final aggregate gradations that were selected for use in
this study. Once the design aggregate structure was selected, specimens were fabricated
over a range of binder contents and the optimum binder content was selected that best
met the mixture requirements given in Table 4.1. Table 4.3 presents the maximum
theoretical specific gravity of the mixtures and the bulk specific gravity of the aggregate
blends. Table 4.4 below presents the design information and properties of the optimum
mixtures containing 100% manufactured aggregate.
Figure 4.1 12.5mm Design Aggregate Gradations
0.010.0
20.030.0
40.050.0
60.070.0
80.090.0
100.0
Sieve Sizes (mm)
Per
cent
Pas
sing
0.010.0
20.030.0
40.050.0
60.070.0
80.090.0
100.0
Per
cent
Pas
sing
12.5 RB 12.5 RA
SIEVE SIZES RAISED TO 0.45
0.075 259.5 1912.54.752.361.18
0.6
0.30.15
37.5
30
Figure 4.2 9.5mm Design Aggregate Gradations
Table 4.2 Aggregate Gradation for Manufactured Sand MixturesPercent PassingSieve
Size 12.5RA-M 12.5RB-M 9.5RA-M 9.5RT-M2519
12.59.54.752.361.180.60.30.150.075Pan
10010010010010099.998.785.241.3
81.60
10010096825636241612860
1001001009674524232221260
1001001009674473525191260
0.0
10.0
20.0
30.0
40.0
50.0
60.0
70.0
80.0
90.0
100.0
Sieve Sizes (mm)
Per
cent
Pas
sing
0.0
10.0
20.0
30.0
40.0
50.0
60.0
70.0
80.0
90.0
100.0
Per
cent
Pas
sing
9.5 RT 9.5 RA
SIEVE SIZES RAISED TO 0.45
0.075 259.5 1912.54.752.361.18
0.6
0.30.15
37.5
31
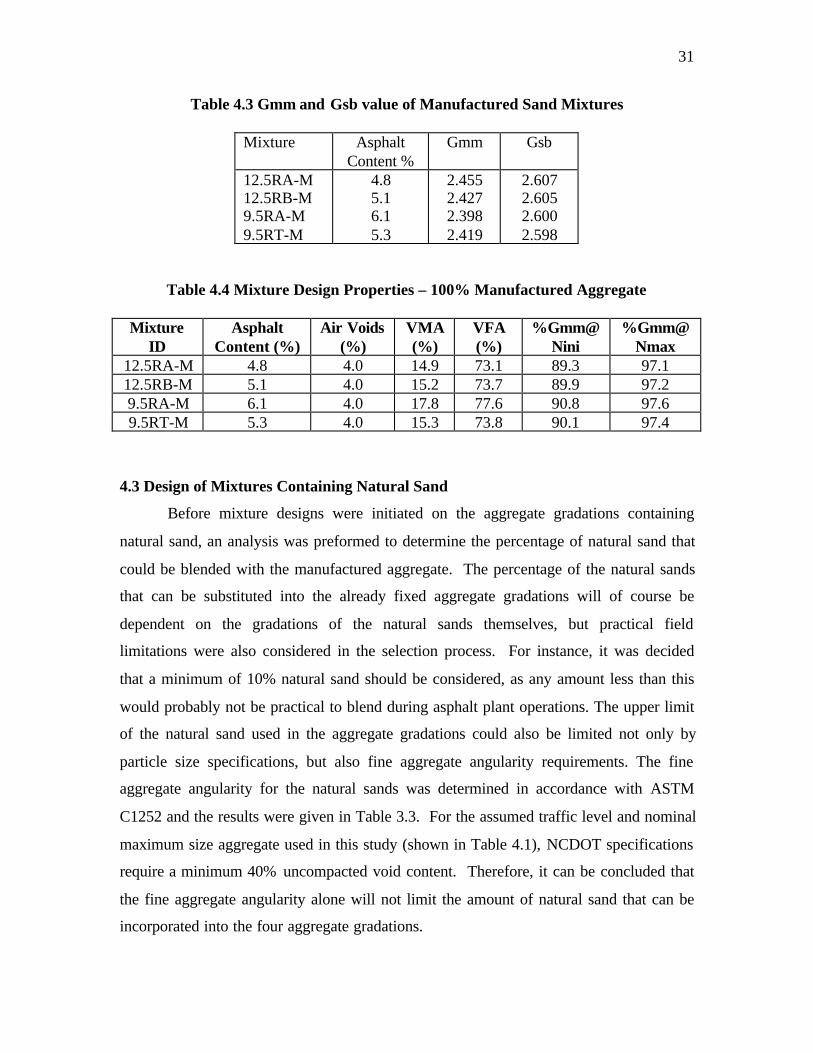
Table 4.3 Gmm and Gsb value of Manufactured Sand Mixtures
Mixture AsphaltContent %
Gmm Gsb
12.5RA-M12.5RB-M9.5RA-M9.5RT-M
4.85.16.15.3
2.4552.4272.3982.419
2.6072.6052.6002.598
Table 4.4 Mixture Design Properties – 100% Manufactured Aggregate
MixtureID
AsphaltContent (%)
Air Voids(%)
VMA(%)
VFA(%)
%Gmm@Nini
%Gmm@Nmax
12.5RA-M 4.8 4.0 14.9 73.1 89.3 97.112.5RB-M 5.1 4.0 15.2 73.7 89.9 97.29.5RA-M 6.1 4.0 17.8 77.6 90.8 97.69.5RT-M 5.3 4.0 15.3 73.8 90.1 97.4
4.3 Design of Mixtures Containing Natural Sand
Before mixture designs were initiated on the aggregate gradations containing
natural sand, an analysis was preformed to determine the percentage of natural sand that
could be blended with the manufactured aggregate. The percentage of the natural sands
that can be substituted into the already fixed aggregate gradations will of course be
dependent on the gradations of the natural sands themselves, but practical field
limitations were also considered in the selection process. For instance, it was decided
that a minimum of 10% natural sand should be considered, as any amount less than this
would probably not be practical to blend during asphalt plant operations. The upper limit
of the natural sand used in the aggregate gradations could also be limited not only by
particle size specifications, but also fine aggregate angularity requirements. The fine
aggregate angularity for the natural sands was determined in accordance with ASTM
C1252 and the results were given in Table 3.3. For the assumed traffic level and nominal
maximum size aggregate used in this study (shown in Table 4.1), NCDOT specifications
require a minimum 40% uncompacted void content. Therefore, it can be concluded that
the fine aggregate angularity alone will not limit the amount of natural sand that can be
incorporated into the four aggregate gradations.
32
For the determination of a percent or range of feasible natural sand contents that can be
substituted into the four aggregate gradations, the aggregate particle size distributions for
the standard aggregate sizes (#67, 78M, manufactured sands) and natural sands were
blended using a trial and error spreadsheet procedure. Figures 4.3 through 4.10 show the
best possible material blends and how they compare to the target aggregate gradations.
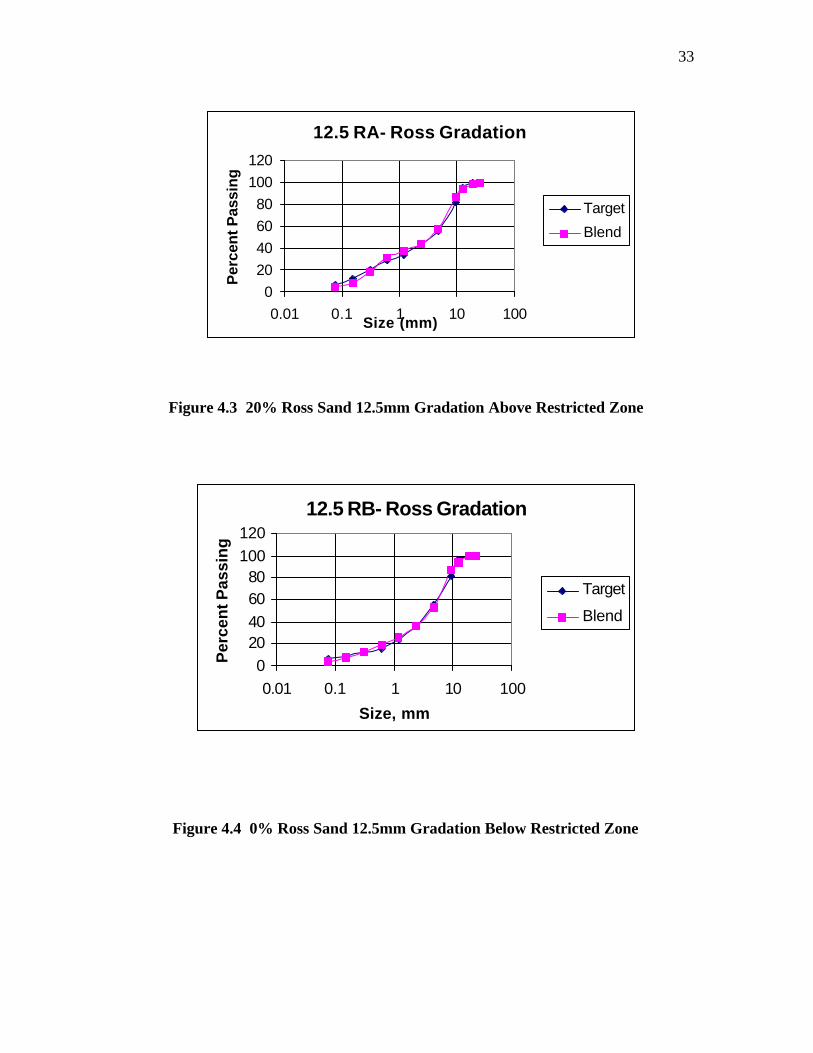
Figure 4.3 shows that the 12.5mm target aggregate gradation passing above the restricted
zone can be met by substituting up to 20% Ross sand into the blend. However, it was
determined that the addition of Ross sand in amounts greater than 10% caused the
resulting gradation to deviate significantly from the target 12.5mm gradation passing
below the restricted zone. Figure 4.4 shows that 12.5mm gradation passing below the
restricted zone can be matched closely without the addition of any Ross sand. The same
trend can be seen in the 9.5mm gradations (Figures 4.4 and 4.5) with 20% Ross sand
being added to pass above the restricted zone, and no Ross sand being needed to achieve
a gradation through the restricted zone. The Snake natural sand is much more flexible for
use in the chosen aggregate gradations. It can be added in percentages ranging from 10 to
22% to meet the 12.5 and 9.5mm gradations passing above, below and through the
restricted zone. From this analysis it was decided that the Snake sand would be used for
the design of all four gradations, but the Ross sand should only be used to evaluate the
12.5 and 9.5mm gradations passing above the restricted zone.
33
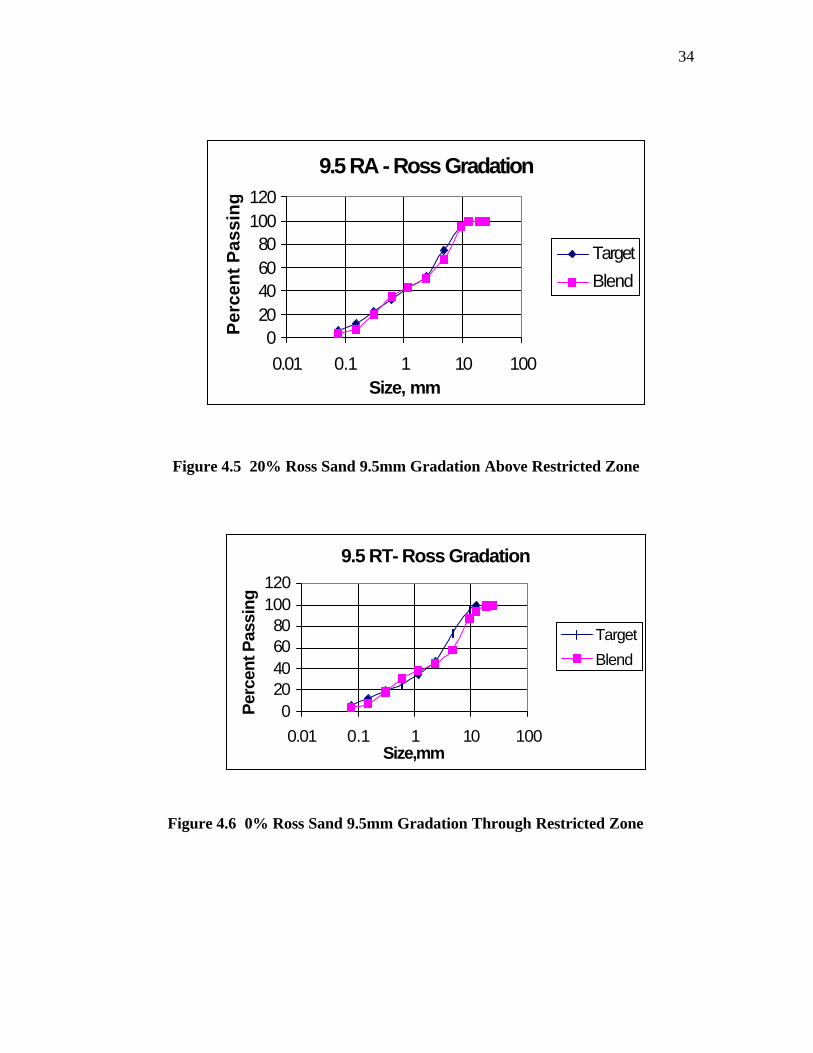
Figure 4.3 20% Ross Sand 12.5mm Gradation Above Restricted Zone
Figure 4.4 0% Ross Sand 12.5mm Gradation Below Restricted Zone
12.5 RA- Ross Gradation
0
20
40
60
80
100
120
0.01 0.1 1 10 100Size (mm)
Per
cen
t P
assi
ng
Target
Blend
12.5 RB- Ross Gradation
0
2040
6080
100
120
0.01 0.1 1 10 100
Size, mm
Per
cen
t P
assi
ng
Target
Blend
34
Figure 4.5 20% Ross Sand 9.5mm Gradation Above Restricted Zone
Figure 4.6 0% Ross Sand 9.5mm Gradation Through Restricted Zone
9.5 RA - Ross Gradation
020406080
100120
0.01 0.1 1 10 100Size, mm
Per
cen
t P
assi
ng
Target
Blend
9.5 RT- Ross Gradation
020406080
100120
0.01 0.1 1 10 100Size,mm
Per
cen
t Pas
sin
g
Target
Blend

35
Figure 4.7 12% Snake Sand 12.5mm Gradation Above Restricted Zone
Figure 4.8 20% Snake Sand 12.5mm Gradation Below Restricted Zone
12.5 RA - Snake Gradation
0
2040
60
80100
120
0.01 0.1 1 10 100Size, mm
Per
cen
t P
assi
ng
Target
Blend
12.5 RB- Snake Gradation
0
20
4060
80
100
120
0.01 0.1 1 10 100Size, mm
Per
cen
t P
assi
ng
Target
Blend

36
Figure 4.9 12% Snake Sand 9.5mm Gradation Above Restricted Zone
Figure 4.10 22% Snake Sand 9.5mm Gradation Through Restricted Zone
9.5 RA- Snake Gradation
020406080
100120
0.01 0.1 1 10 100
Size, mm
Per
cen
t P
assi
ng
Target
Blend
9.5 RT - Snake Gradation
0
2040
60
80100
120
0.01 0.1 1 10 100Size, mm
Per
cen
t P
assi
ng
Target
Blend
37
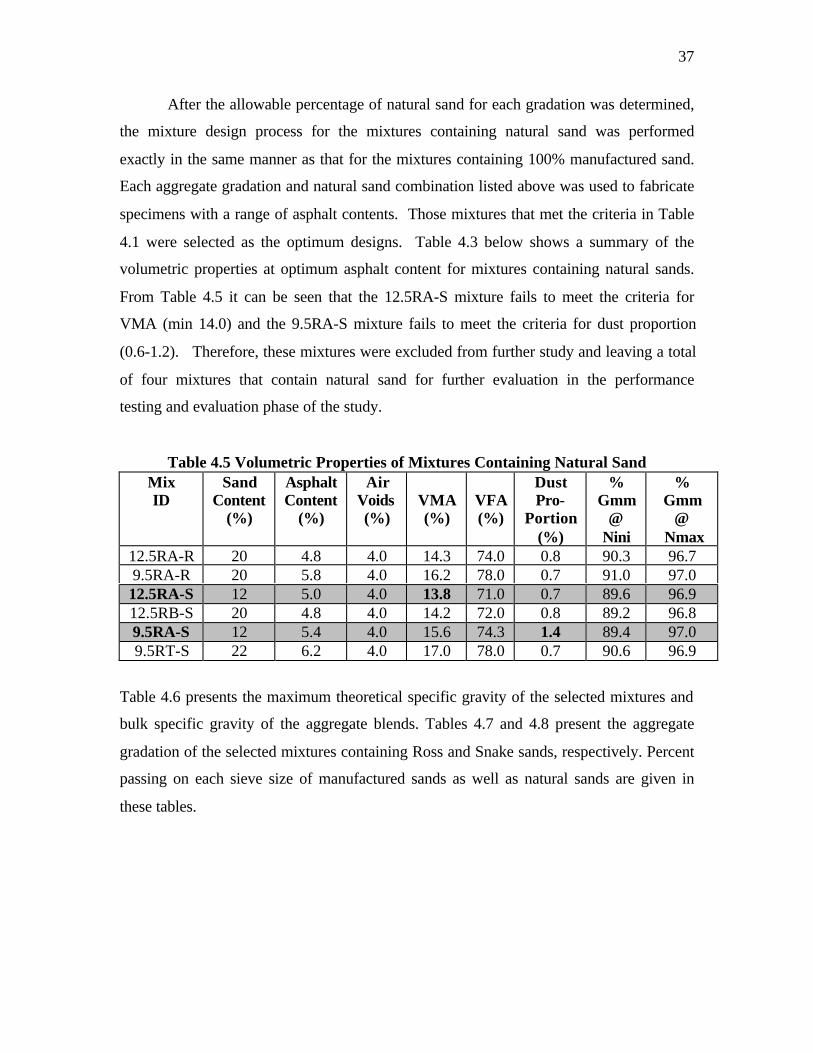
After the allowable percentage of natural sand for each gradation was determined,
the mixture design process for the mixtures containing natural sand was performed
exactly in the same manner as that for the mixtures containing 100% manufactured sand.
Each aggregate gradation and natural sand combination listed above was used to fabricate
specimens with a range of asphalt contents. Those mixtures that met the criteria in Table
4.1 were selected as the optimum designs. Table 4.3 below shows a summary of the
volumetric properties at optimum asphalt content for mixtures containing natural sands.
From Table 4.5 it can be seen that the 12.5RA-S mixture fails to meet the criteria for
VMA (min 14.0) and the 9.5RA-S mixture fails to meet the criteria for dust proportion
(0.6-1.2). Therefore, these mixtures were excluded from further study and leaving a total
of four mixtures that contain natural sand for further evaluation in the performance
testing and evaluation phase of the study.
Table 4.5 Volumetric Properties of Mixtures Containing Natural SandMixID
SandContent
(%)
AsphaltContent
(%)
AirVoids(%)
VMA(%)
VFA(%)
DustPro-
Portion(%)
%Gmm
@Nini
%Gmm
@ Nmax
12.5RA-R 20 4.8 4.0 14.3 74.0 0.8 90.3 96.79.5RA-R 20 5.8 4.0 16.2 78.0 0.7 91.0 97.012.5RA-S 12 5.0 4.0 13.8 71.0 0.7 89.6 96.912.5RB-S 20 4.8 4.0 14.2 72.0 0.8 89.2 96.89.5RA-S 12 5.4 4.0 15.6 74.3 1.4 89.4 97.09.5RT-S 22 6.2 4.0 17.0 78.0 0.7 90.6 96.9
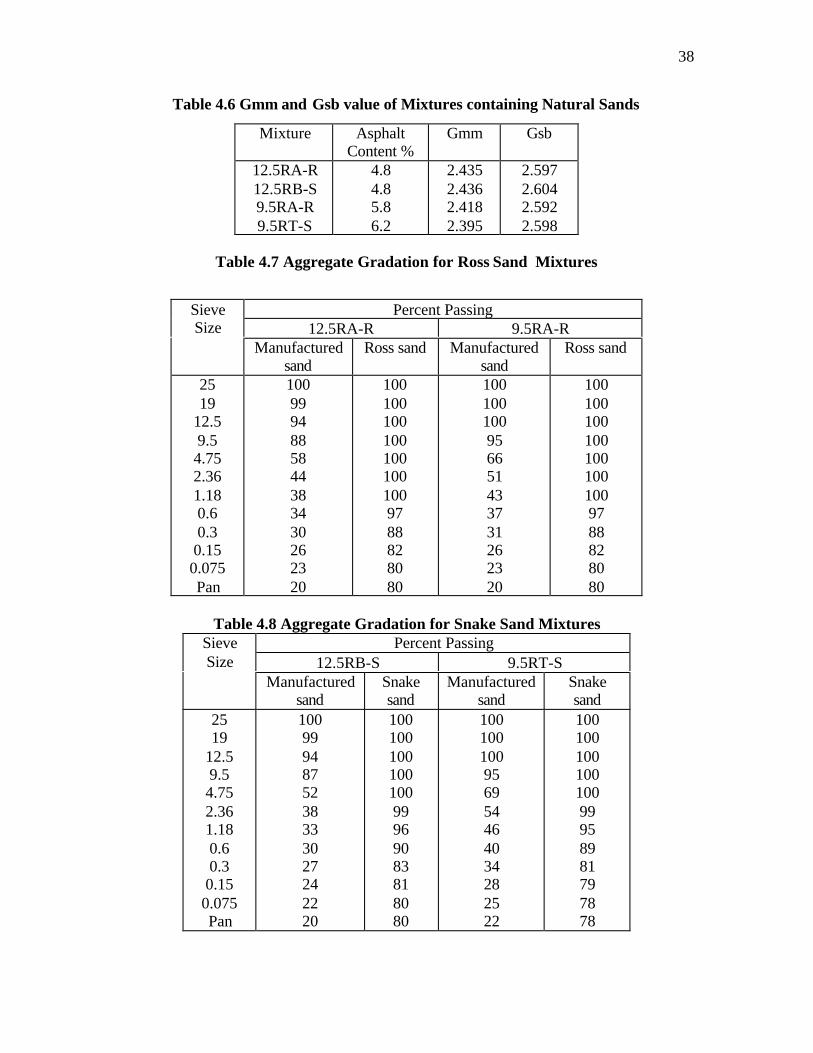
Table 4.6 presents the maximum theoretical specific gravity of the selected mixtures and
bulk specific gravity of the aggregate blends. Tables 4.7 and 4.8 present the aggregate
gradation of the selected mixtures containing Ross and Snake sands, respectively. Percent
passing on each sieve size of manufactured sands as well as natural sands are given in
these tables.
38
Table 4.6 Gmm and Gsb value of Mixtures containing Natural Sands
Mixture AsphaltContent %
Gmm Gsb
12.5RA-R12.5RB-S9.5RA-R9.5RT-S
4.84.85.86.2
2.4352.4362.4182.395
2.5972.6042.5922.598
Table 4.7 Aggregate Gradation for Ross Sand Mixtures
Percent Passing12.5RA-R 9.5RA-R
SieveSize
Manufacturedsand
Ross sand Manufacturedsand
Ross sand
2519
12.59.54.752.361.180.60.30.150.075Pan
1009994885844383430262320
1001001001001001001009788828080
100100100956651433731262320
1001001001001001001009788828080
Table 4.8 Aggregate Gradation for Snake Sand MixturesPercent Passing
12.5RB-S 9.5RT-SSieveSize
Manufacturedsand
Snakesand
Manufacturedsand
Snakesand
2519
12.59.54.752.361.180.60.30.150.075Pan
1009994875238333027242220
10010010010010099969083818080
100100100956954464034282522
10010010010010099958981797878
39
CHAPTER 5
MIXTURE EVALUATION
This chapter deals with the Superpave performance tests that were conducted to predict
the performance of asphalt mixtures to fatigue cracking and rutting. Tests that were
conducted using Simple Shear Tester, Asphalt Pavement Analyzer, Gyratory Load Plate
Assembly and Indirect Tensile Strength Tests.
5.1 Simple Shear Tests
Using the Superpave Shear Tester (SST), the following tests were conducted:
• Frequency Sweep Test at Constant Height (FSCH)
• Repeated Shear Test at Constant Height (RSCH)
The test results were then used to perform an analysis of a representative pavement
structure to investigate the effect on the predicted field performance.
Specimen Preparation
The specimens prepared for FSCH and RSCH tests were 150mm (6 inch) diameter
specimens compacted to Ndesign level of gyrations using the SGC. Eight different types
of mixtures with three replicates for each were prepared. Each specimen was sawed to a
thickness of 50mm (2 inch). The bulk specific gravities (Gmb) of the compacted
specimens were measured before testing. The specimens were glued between the loading
platens using the adhesives.
Selection of Test Temperature
In the abridged fatigue analysis (SHRP A-003A) procedure, the pavement temperature is
assumed to be 20oC through out the year. The resistance of the mix to fatigue cracking is
calculated based on the mix properties evaluated using FSCH at 20oC temperature. The
mixes are intended to be used for pavement construction in Cumberland county, North
Carolina. The seven-day average high pavement temperature at 20-mm depth from the

40
pavement surface was estimated using SHRPBIND Version 2.0 software. At 50%
reliability, the temperature was 54.2oC and at 98% reliability, the temperature was
57.4oC. As the main objective of this study was to compare the performance of different
mixes, and not to calculate actual pavement life, a test temperature of 54.2oC was used.
5.1.1 Frequency Sweep Test at Constant Height
This test is used to measure linear viscoelastic properties of asphalt concrete for rutting
and fatigue cracking analysis. This test uses a dynamic type of loading and is a strain
controlled test with the maximum shear strain limited to ± 0.005 percent (maximum peak
to peak of 0.0001 mm/mm). This test is conducted at a constant height requiring the
vertical actuator to be controlled by the vertical LVDT. The specimen is preconditioned
by applying a sinusoidal horizontal shear strain with amplitude of approximately 0.0001
mm/mm at a frequency of 10 Hz for 100 cycles. After preconditioning the specimen, a
series of 10 tests are conducted in descending order of frequency. The following
frequencies are used: 10,5,2,1,0.5,0.2,0.1,0.05,0.02 and 0.01 Hz. A specific number of
cycles between 4 and 50 is applied. During the test, axial and shear loads and
deformations are measured and recorded.
This test was conducted according to AASHTO TP-7 Procedure E. Eight mixtures, four
for manufactured sands and four for natural sands, with three replicates each, were tested
at a temperature of 20oC (15). Dynamic Shear Modulus and Phase angle was measured at
each frequency for each mixture. The ratio of the stress response of the test specimen to
the applied shear strain is used to compute a complex modulus for a given frequency. The
delay in the response of the material is measured as phase angle. From the test results, the
following graphs are generated to evaluate the mix properties:
• Dynamic Shear Modulus (|G*|) vs frequency (on log scale)
• Phase angle vs frequency (on log scale)

41
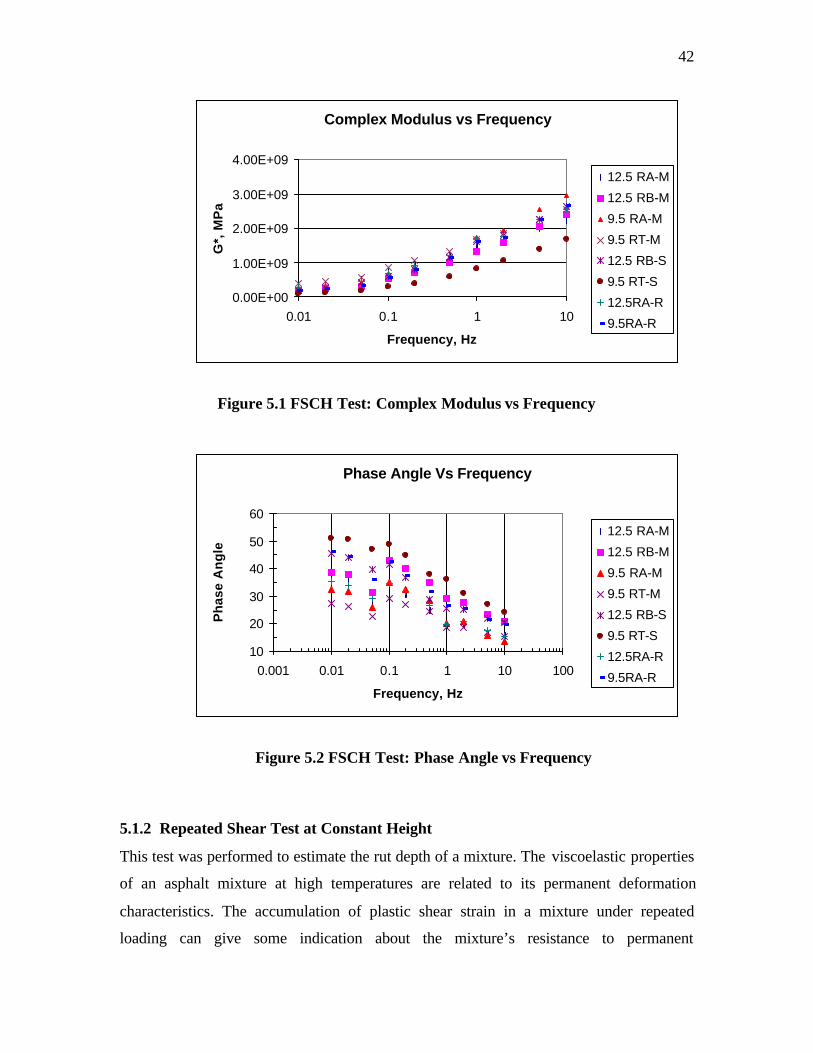
Analysis of FSCH Test Results
Table 5.1 shows the values of complex modulus and phase angles for all mixtures. Figure
5.1 shows the complex modulus as a function of frequency at 20 oC. Figure 5.2 shows the
change in phase angles with changing frequency. As the stiffness of the material is a
function of frequency of load applied, G* values are found to be increasing with
increasing frequency. The test results show that the 9.5mm mixture above the restricted
zone and manufactured sand (9.5RA-M) has the highest G* value, indicating it as the
stiffest mixture among all mixtures. The mixture made with Snake sand and 9.5mm
through the restricted zone (9.5RT-S) has the lowest G* value and the difference is
considerably high when compared with other mixtures. The average phase angles of
mixtures with manufactured sands are lower than that of the mixtures with natural sands
indicating the better performance of mixtures made with manufactured sands. In general,
finer mixtures are stiffer than other mixtures.
Table 5.1 Results of Frequency Sweep Tests
Average G* (MPa)/Phase Angle(Deg)
Freq
(Hz.)
12.5RA-
M
12.5 RB-
M
9.5RA-
M
9.5RT-M 12.5RB-S 9.5RT-S 12.5RA-
R
9.5 RA-
R
0.01 276/37 173/39 250/32 364/27 185/45 84/51 259/35 174/46
0.02 362/35 219/38 316/32 440/26 251/44 119/51 329/34 232/44
0.05 480/28 281/31 409/26 543/23 393/40 185/47 445/29 322/36
0.1 719/34 525/43 660/35 848/29 569/41 276/49 676/35 556/43
0.2 929/31 697/40 879/33 1050/27 779/37 383/45 905/32 785/38
0.5 1203/35 996/35 1130/28 1330/24 1135/29 591/38 1180/27 1124/32
1 1503/19 1346/29 1730/20 1680/19 1610/25 803/36 1690/20 1610/26
2 1683/20 1606/28 1960/21 1870/19 1805/25 1046/31 1770/21 1740/26
5 2003/16 2060/23 2560/16 2280/17 2265/22 1395/27 2270/18 2260/22
10 2220/16 2410/21 2970/14 2570/15 2650/21 1675/24 2560/15 2660/20
42
Figure 5.1 FSCH Test: Complex Modulus vs Frequency
Figure 5.2 FSCH Test: Phase Angle vs Frequency
5.1.2 Repeated Shear Test at Constant Height
This test was performed to estimate the rut depth of a mixture. The viscoelastic properties
of an asphalt mixture at high temperatures are related to its permanent deformation
characteristics. The accumulation of plastic shear strain in a mixture under repeated
loading can give some indication about the mixture’s resistance to permanent
Complex Modulus vs Frequency
0.00E+00
1.00E+09
2.00E+09
3.00E+09
4.00E+09
0.01 0.1 1 10
Frequency, Hz
G*,
MP
a
12.5 RA-M
12.5 RB-M
9.5 RA-M
9.5 RT-M
12.5 RB-S
9.5 RT-S
12.5RA-R
9.5RA-R
Phase Angle Vs Frequency
10
20
30
40
50
60
0.001 0.01 0.1 1 10 100
Frequency, Hz
Ph
ase
An
gle
12.5 RA-M
12.5 RB-M
9.5 RA-M
9.5 RT-M
12.5 RB-S
9.5 RT-S
12.5RA-R
9.5RA-R

43
deformation. The repeated shear testing at constant height was selected to evaluate the
accumulated shear strain and permanent deformation characteristics of the mixture.
The RSCH test is a stress-controlled test with the feedback to the vertical load actuator
from the magnitude of the shear load. The test is conducted at constant height, requiring
the vertical actuator to be controlled by the vertical LVDT. The horizontal LVDT
measures the difference in horizontal displacement between two points on the specimen
separated by 37.5mm. It preconditions the specimen by applying a haversine load
corresponding to a 7-kPa shear stress for 100 cycles. The 0.7-second load cycle consists
of a 0.1-second shear load followed by 0.6-second rest period. After preconditioning the
specimen, it applies a 68 ± 5 kPa haversine shear pulse for 5000 cycles or until 5% shear
strain is reached. This corresponds to a frequency of approximately 1.43 Hz. During the
test, axial and shear loads and deformations are measured and recorded. This test was
conducted according to AASHTO TP-7 Procedure F (15). Eight mixtures, four for
manufactured sands and four for natural sands were tested at a temperature of 54.2oC.
Three replicates were tested for each mixture.
Analysis of RSCH Test Results
Figure 5.3 shows plastic shear strain of all mixtures as a function of number of cycles. All
the mixtures have passed the 5000 cycle criterion indicating that no mixture has reached
the maximum strain limit. Table 5.2 shows the maximum shear strain for all mixtures and
percent difference in strain values with 12.5mm above mixture. From the graph, it can be
found that the mixture with Ross sand and 9.5mm NMSA aggregates (9.5RA-R) has the
highest plastic shear strain of 0.0226. The mixture with Ross sand and 12.5mm NMSA
aggregates (12.5RA-R) has the lowest plastic shear strain of 0.0079. The shear strains of
all other mixtures range between these two extremes. The results indicate that the mixture
12.5RA-R has the highest shear resistance among all the mixtures.

44
Table 5.3 Maximum Shear Strain of the Mixtures
Mixture Maximum
Shear Strain
Percent difference
with 12.5mm above
12.5 RA-M
12.5 RB-M
9.5 RA-M
9.5 RT-M
12.5 RB-S
9.5RT-S
12.5RA-R
9.5RA-R
0.0149
0.0166
0.0135
0.0097
0.0147
0.0112
0.0080
0.0226
0.0
11.7
-9.0
-35.0
-1.2
-24.9
-46.2
52.3
Figure 5.3 RSCH Test: Plastic Shear Strain vs Number of Cycles
Plastic Shear Strain vs Number of Cycles
0
0.005
0.01
0.015
0.02
0.025
0 1000 2000 3000 4000 5000 6000
Number of Cycles
Pla
stic
Sh
ear
Str
ain 12.5 RA-M
12.5 RB-M
9.5 RA-M
9.5 RT-M
12.5 RB-S
9.5 RT-S
12.5RA-R
9.5RA-R

45
5.2 Gyratory Load Plate Assembly
Measurement of mechanical property to evaluate mixture performance is not a new
concept. One of the most important criticisms of the Superpave volumetric design
procedure is the lack of a direct measure of mechanical properties of asphalt mixtures and
the reliance on the control of densification characteristics. Gyratory Load Plate Assembly
(GLPA) was developed to apply a two dimensional distribution of shear resistance as
measured on the top of the specimen (16).
The plate includes 3 load cells equally spaced on the perimeter of a double-plate
assembly, which can be inserted on the sample of the HMA in a typical gyratory mold.
The load cells allow measuring the variation in distribution of force on top of the sample
during the gyrations such that the position of the resultant force on top of the sample
during the gyrations such that the position of the resultant force from the gyratory
compactor can be determined in real time. The two dimensional distribution of the
eccentricity of the resultant load can be used to calculate the effective moment required to
overcome the shear resistance of mixtures and tilt the mold to conform to the 1.25 degree
angle.
Description of GLPA
It is believed that this effective moment is a direct measure of the resistance of asphalt
mixtures to distortion and to densification. Because the densification is being measured
by the compactor, the measured moment can be used to separate the energy spent in
densification form the energy spent in distortion. The distortion energy is believed to be
related to the resistance of the mixture to rutting under traffic.
The main components of the GLPA are three 9kN load cells, two hardened steel plates
that can fit into the compaction mold and a computer for data acquisition from both
GLPA and SGC device. The load cells are placed on the upper plate of the assembly at a
common radial distance, 120o apart. Each load cell is attached by three screws so that the
load pins of each load cell have a small contact point on the lower plate which is in
contact with the hot mixture during he compaction. The load cells are designed for high
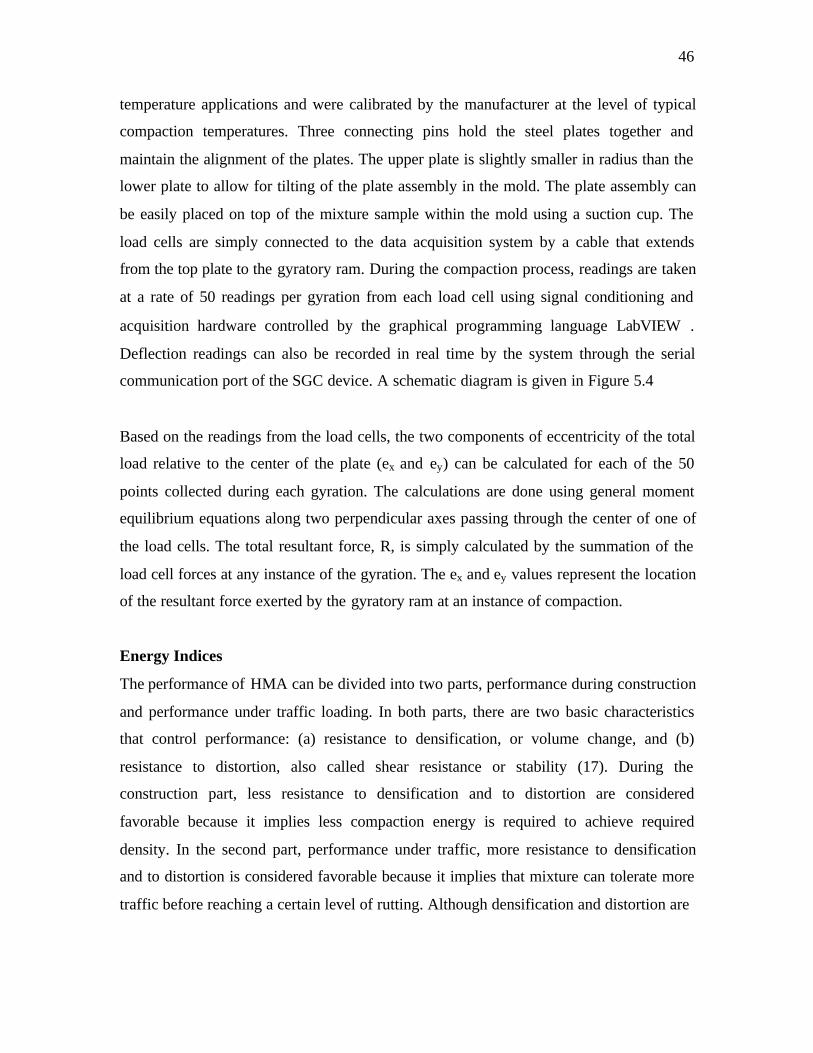
46
temperature applications and were calibrated by the manufacturer at the level of typical
compaction temperatures. Three connecting pins hold the steel plates together and
maintain the alignment of the plates. The upper plate is slightly smaller in radius than the
lower plate to allow for tilting of the plate assembly in the mold. The plate assembly can
be easily placed on top of the mixture sample within the mold using a suction cup. The
load cells are simply connected to the data acquisition system by a cable that extends
from the top plate to the gyratory ram. During the compaction process, readings are taken
at a rate of 50 readings per gyration from each load cell using signal conditioning and
acquisition hardware controlled by the graphical programming language LabVIEW.
Deflection readings can also be recorded in real time by the system through the serial
communication port of the SGC device. A schematic diagram is given in Figure 5.4
Based on the readings from the load cells, the two components of eccentricity of the total
load relative to the center of the plate (ex and ey) can be calculated for each of the 50
points collected during each gyration. The calculations are done using general moment
equilibrium equations along two perpendicular axes passing through the center of one of
the load cells. The total resultant force, R, is simply calculated by the summation of the
load cell forces at any instance of the gyration. The ex and ey values represent the location
of the resultant force exerted by the gyratory ram at an instance of compaction.
Energy Indices
The performance of HMA can be divided into two parts, performance during construction
and performance under traffic loading. In both parts, there are two basic characteristics
that control performance: (a) resistance to densification, or volume change, and (b)
resistance to distortion, also called shear resistance or stability (17). During the
construction part, less resistance to densification and to distortion are considered
favorable because it implies less compaction energy is required to achieve required
density. In the second part, performance under traffic, more resistance to densification
and to distortion is considered favorable because it implies that mixture can tolerate more
traffic before reaching a certain level of rutting. Although densification and distortion are

47
Figure 5.4 Gyratory Load Plate Assembly

48
not necessarily independent properties, they need to be measured independently because
distortion could be measured at a constant volume (no densification).
The researchers of the University of Wisconsin Madison developed energy indices as
measures of densification and distortion under construction and under traffic. The
Compaction Densification Index (CDI) and Compaction Force Index (CFI) are used to
evaluate the performance of mixtures during construction. CDI is measured by
integration of the area under the densification curve measured by the SGC between the
first gyration and the 92% Gmm. The 92% Gmm is assumed to be the target density at the
end of construction. The CFI is the integration of the area under the resistive work curve
measured with the GLPA between the same reference points. To measure the mixture
resistance to traffic, the Traffic Densification Index (TDI) and Traffic Force Index (TFI)
are used. TDI and TFI are estimated by integration of the area under the densification and
resistive work curves between 92% Gmm and 98% Gmm as shown in Figure 5.5.
Table 5.4 shows the energy indices measured using the Superpave Gyratory Compactor
and GLPA. The samples were gyrated to 300 cycles.
Table 5.4 Energy Indices
Mixture CEI TEI CFI TFI %Gmm @
Nini
%Gmm @
Ndes
%Gmm @
Nmax
VMA
12.5RA-M 104 754 193 2162 89.3 96.1 97.0 13.9
12.5RA-R 125 1116 237 3858 89.2 95.2 96.0 15.0
12.5RB-M 110 274 167 904 88.8 97.7 98.8 13.7
12.5RB-S 98 474 177 1607 89.4 96.7 97.7 13.9
9.5RA-M 30 207 74 623 91.2 97.7 98.5 15.4
9.5RA-R 73 722 148 2194 89.8 95.5 96.3 16.0
9.5RT-M 56 246 117 804 90.1 97.2 98.2 14.3
9.5RT-S 28 273 77 821 91.2 97.2 98.1 15.9
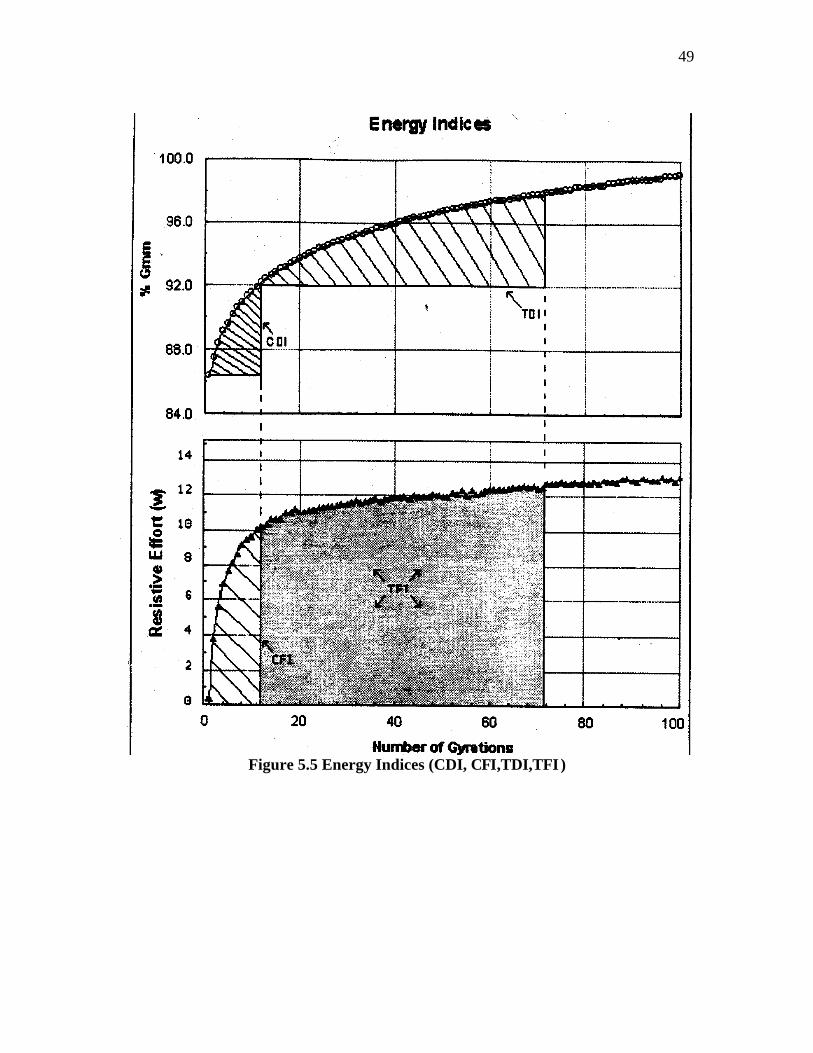
49
Figure 5.5 Energy Indices (CDI, CFI,TDI,TFI)
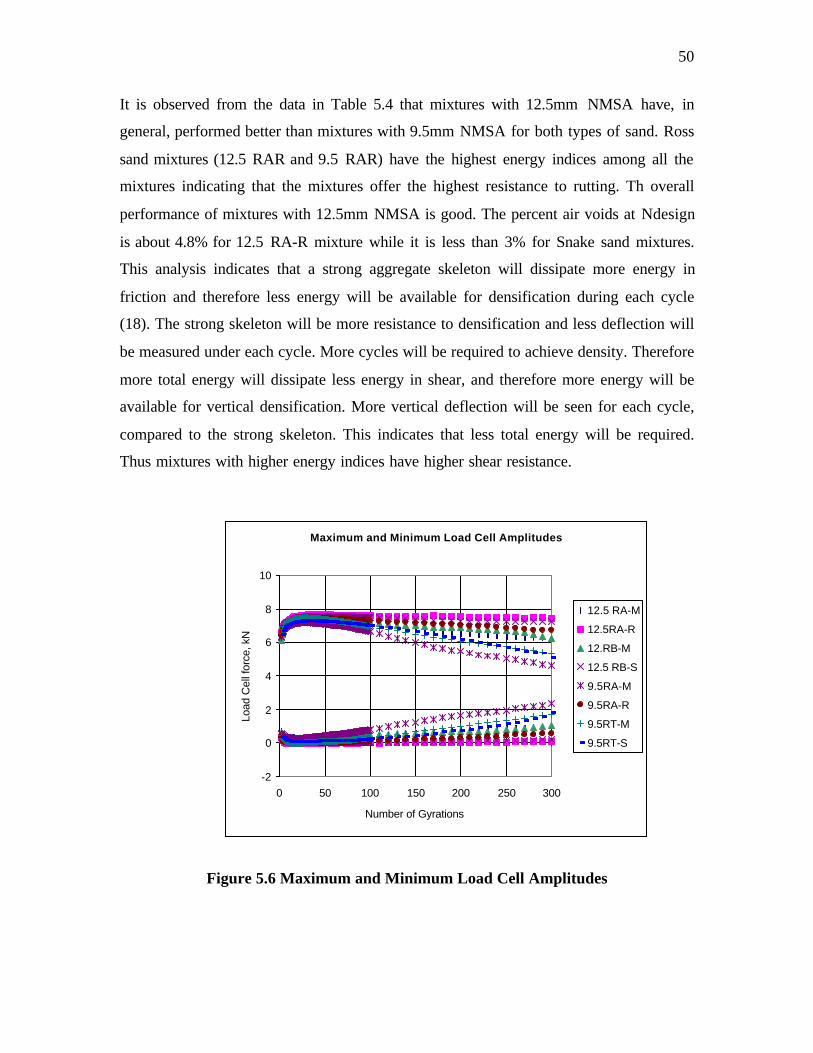
50
It is observed from the data in Table 5.4 that mixtures with 12.5mm NMSA have, in
general, performed better than mixtures with 9.5mm NMSA for both types of sand. Ross
sand mixtures (12.5 RAR and 9.5 RAR) have the highest energy indices among all the
mixtures indicating that the mixtures offer the highest resistance to rutting. Th overall
performance of mixtures with 12.5mm NMSA is good. The percent air voids at Ndesign
is about 4.8% for 12.5 RA-R mixture while it is less than 3% for Snake sand mixtures.
This analysis indicates that a strong aggregate skeleton will dissipate more energy in
friction and therefore less energy will be available for densification during each cycle
(18). The strong skeleton will be more resistance to densification and less deflection will
be measured under each cycle. More cycles will be required to achieve density. Therefore
more total energy will dissipate less energy in shear, and therefore more energy will be
available for vertical densification. More vertical deflection will be seen for each cycle,
compared to the strong skeleton. This indicates that less total energy will be required.
Thus mixtures with higher energy indices have higher shear resistance.
Figure 5.6 Maximum and Minimum Load Cell Amplitudes
Maximum and Minimum Load Cell Amplitudes
-2
0
2
4
6
8
10
0 50 100 150 200 250 300
Number of Gyrations
Load
Cel
l for
ce, k
N
12.5 RA-M
12.5RA-R
12.RB-M
12.5 RB-S
9.5RA-M
9.5RA-R
9.5RT-M
9.5RT-S

51
Figure 5.6 shows the maximum and minimum load amplitudes carried by the load cell of
GLPA during each of the 300 gyrations. The load amplitudes of 12.5mm mixtures start
decreasing slowly whereas the 9.5mm mixtures (except 9.5RAR) start decreasing rapidly.
The rapid rate of decrease indicates that the mixtures start losing the frictional resistance
with increased number of gyrations. These trends are important because they could be
related to observations in the field where rutting is observed for some mixtures after
increased number of traffic load applications.
These test results indicate that mixtures with 12.5 mm NMSA perform better than
mixtures made with 9.5mm NMSA. Energy index of mixtures made with natural sands
does not vary much with the index of the corresponding mixtures made with
manufactured sands.
5.3 Evaluation of Moisture Sensitivity
Moisture Damage in the AC layer occurs due to loss of adhesion between asphalt and
aggregate and or loss of cohesion. A reduction in cohesion results in a reduction in
strength and stiffness. The loss of adhesion is the physical separation of the asphalt
cement and aggregate, primarily caused by moisture. The stripping of the asphalt from
aggregate results in a reduction in the stiffness and strength of an asphalt mixture. Such
reduction in stiffness may contribute to premature pavement deterioration.
Moisture susceptibility of a mixture can be evaluated by calculation of a tensile strength
ratio using Modified Lottman test. This test was performed in accordance with AASHTO
T 283 (19). A sample is conditioned by saturation and immersion to simulate a mixture’s
moisture exposure. The indirect tensile strengths of the unconditioned and conditioned
sets are compared to evaluate the moisture damage induced by conditioning. This
damage, loss of cohesion and adhesion, manifests itself in a loss of tensile strength of the
mix.
Indirect tensile tests were performed on the three aggregates in accordance with
AASHTO T 283 (Resistance of Compacted Bituminous Mixture to Moisture Induced

52
Damage ). Three mixtures 12.5mm above with 100 percent manufactured sand, 12.5mm
above with Ross sand and 12.5mm below with Snake pit sand, were prepared. A sample
set of 4 specimens with 6 inches in diameter and 4 inches in thickness were prepared.
One subset was tested dry and another subset was preconditioned before testing. The dry
subset was stored at room temperature until testing. The specimens were then placed in a
77 F water bath for 2 hours and then tested. For preconditioning, the specimens were
saturated in a vacuum container for a degree of saturation that ranges from 65% to 80%.
The saturated specimens were then placed a water bath at 140 F for 24 hours. The
specimens were removed and placed in a water bath at 77 F for 2 hours before testing.
The specimens were removed from the water bath and tested using a Geotest loading
frame equipped with a chart recorder. The specimens were loaded at a constant rate of 2
inches per minute. The loading was continued until a vertical crack appeared. The
maximum load for each specimen was determined. Anti-stripping agents were not used in
any of these mixtures.
The indirect tensile strength of each specimen was computed as follows:
St = 2P/πtD
where
St = tensile strength, psi
P = maximum load, lbs
t = specimen thickness, inches and
D = specimen diameter, inches
The tensile strength ratio (TSR) was calculated as follows:
TSR = S2/S1
where
S1 = average tensile strength of unconditioned subset
S2 = average tensile strength of conditioned subset

53
The objective of TSR tests was to evaluate the water sensitivity of the mixtures
containing manufactured and natural sands included in this study. Therefore, as is
evident, only TSR test results of 12.5mm mixtures are included in Table 5.5
The results of indirect tensile strength for conditioned and unconditioned specimens are
given in Table 5.5
Table 5.5 Indirect Tensile Strength Tests
Tensile Strength, psi
Mixture Unconditioned Conditioned
TSR
percent
12.5 RA-M
12.5 RA-R
12.5 RB- S
141.37
133.41
105.97
131.96
115.15
90.93
93.3
86.3
85.8
It is seen that there is a difference in tensile strength of about 6.7% between conditioned
and unconditioned specimens for mixtures made with manufactured sands. This
difference increases with the inclusion of natural sands. The reduction in tensile strength
is about 13.7 % and 14.2% for mixtures containing Ross and Snake pit sands
respectively.
The mixtures containing manufactured and natural sands met the minimum value of 85
for TSR. However, the results of the TSR tests show that manufactured sand performs
better than natural sands. The addition of natural sand to asphalt mixtures could reduce
the mechanical adhesion between the aggregates. Mechanical adhesion depends primarily
on the physical properties of the aggregate such as surface texture, surface area etc. Also
natural sands might contain fine clays which in turn would emulsify the asphalt in the
presence of water. This might increase the probability of an asphalt mix to strip
prematurely.

54
5.4 Asphalt Pavement Analyzer for Rutting Susceptibility
The rutting susceptibility of the mixtures was assessed by placing samples under
repetitive loads of a wheel-tracking device, known as Asphalt Pavement Analyzer (APA).
APA is the new generation of the Georgia Loaded Wheel Tester (GLWT). The APA has
additional features that include a water storage tank and is capable of testing both
gyratory and beam specimens. Three beam or six gyratory samples can be tested
simultaneously (20).
The theory behind a loaded wheel tester is to apply an appropriate cyclical loading to
asphalt to best simulate actual traffic. This is accomplished in this apparatus by air
pressurized hoses laying across samples with a loaded wheel coming in contact with the
hose and applying a predetermined load to the hose and thus the specimens. The wheel
roles back and forth up to 8000 times or cycles and the rut depth is then measured.
Wheel loads are applied on test samples by means of three pneumatic cylinders, each
equipped with an aluminum wheel. The magnitude of the load applied on each sample is
regulated by air pressure supplied to each pneumatic cylinder. The load from each
moving wheel is transferred to a test sample through a stiff pressurized rubber hose
mounted along the top of the specimen. The pressure in the three hoses is regulated by a
common pressure regulator so that the pressure in the three hoses should always be the
same. The equipment is designed to evaluate not only the rutting potential of an asphalt
mixture, but also its moisture susceptibility and fatigue cracking under service conditions.
A model and schematic diagram of the APA is given in Figure. 5.7 and 5.8
In the APA testing, only rutting potential of the mixtures was investigated. Duplicates of
all the eight mixtures were prepared. The cylindrical samples were compacted to an air
void contents of 7 percent, using the Superpave Gyratory Compactor. Then the samples
were checked whether they fell within the acceptable range of air voids. A tolerance of
0.5 % change in air voids level was accepted. The 7 percent air voids level was selected
to simulate the typical field density achieved in the field. It is the average air voids that
are specified for most HMA pavements immediately at the end of

55
Figure 5.7 Model of APA
Figure 5.8 Schematic Drawing of the APA
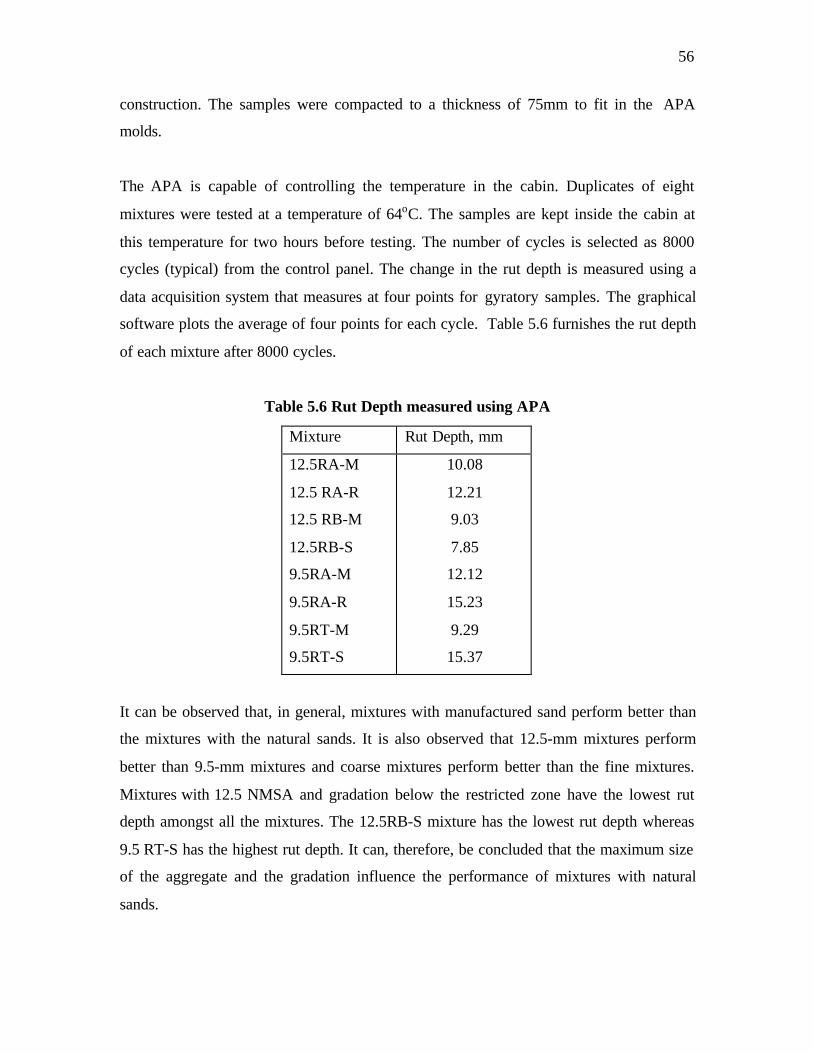
56
construction. The samples were compacted to a thickness of 75mm to fit in the APA
molds.
The APA is capable of controlling the temperature in the cabin. Duplicates of eight
mixtures were tested at a temperature of 64oC. The samples are kept inside the cabin at
this temperature for two hours before testing. The number of cycles is selected as 8000
cycles (typical) from the control panel. The change in the rut depth is measured using a
data acquisition system that measures at four points for gyratory samples. The graphical
software plots the average of four points for each cycle. Table 5.6 furnishes the rut depth
of each mixture after 8000 cycles.
Table 5.6 Rut Depth measured using APA
Mixture Rut Depth, mm
12.5RA-M
12.5 RA-R
12.5 RB-M
12.5RB-S
9.5RA-M
9.5RA-R
9.5RT-M
9.5RT-S
10.08
12.21
9.03
7.85
12.12
15.23
9.29
15.37
It can be observed that, in general, mixtures with manufactured sand perform better than
the mixtures with the natural sands. It is also observed that 12.5-mm mixtures perform
better than 9.5-mm mixtures and coarse mixtures perform better than the fine mixtures.
Mixtures with 12.5 NMSA and gradation below the restricted zone have the lowest rut
depth amongst all the mixtures. The 12.5RB-S mixture has the lowest rut depth whereas
9.5 RT-S has the highest rut depth. It can, therefore, be concluded that the maximum size
of the aggregate and the gradation influence the performance of mixtures with natural
sands.

57
From the APA tests, it is observed that the deformation rate changes with the number of
passes. Initial deformation rate within the first 1000 passes plays an important role in
predicting the final rut depth of the mixture. The variation of initial deformation rates
among the mixtures is large and so are their final rut depths. The mixtures reach nearly
half of their final rut depth within 1000 cycles. The deformation rates gradually slow
down beyond 1000 cycles and, for the most of the mixtures, the final deformation rates
are nearly equal. This can be attributed to the reorientation of the aggregates, which is
influenced by the maximum size, gradation and the aggregate type.

58
CHAPTER 6
MIXTURE PERFORMANCE EVALUATION
Analysis of Service Life of Pavement
The resulting parameters of FSCH and RSCH tests are the material responses that can be
used to predict the pavement’s performance under service for distresses such as fatigue
cracking and rutting. Fatigue and Rutting analysis are performed using surrogate models
developed by SHRP 003-A project and distress models of Asphalt Institute. Fatigue
analysis of SHRP model considers material properties as well as pavement structural
layer thickness whereas rutting analysis considers only the material properties.
6. 1 SUPERPAVE Fatigue Model Analysis
The abridged fatigue analysis system from SHRP A-003A predicts the resistance of mix
to fatigue distress for a pavement structure under a given traffic load (21). The resistance
of a mix to fatigue cracking depends on the horizontal tensile strain, initial flexural loss
stiffness and voids filled with asphalt (VFA). Shear stiffness of the mixture is measured
from the FSCH tests at 10 Hz at 20oC. The critical tensile strain is a function of the
pavement thickness.
Multi-layer elastic analysis is used to determine the design strain, the maximum principal
tensile strain at the bottom of the asphalt concrete layer, under the standard AASHTO
axle load of 18 kips. Therefore, a pavement structure was assumed to conduct this
analysis. The pavement structure and loading are given in Figure 6.1. A standard 18-kip
single axle load with dual tires inflated to 100 psi was used. The horizontal tensile strains
at the bottom of AC layer are estimated at outer edge, center, inner edge, and center of
dual tires using EVERSTRESS software for multilayer elastic analysis of pavement
sections. The critical tensile strain is used as the design strain.
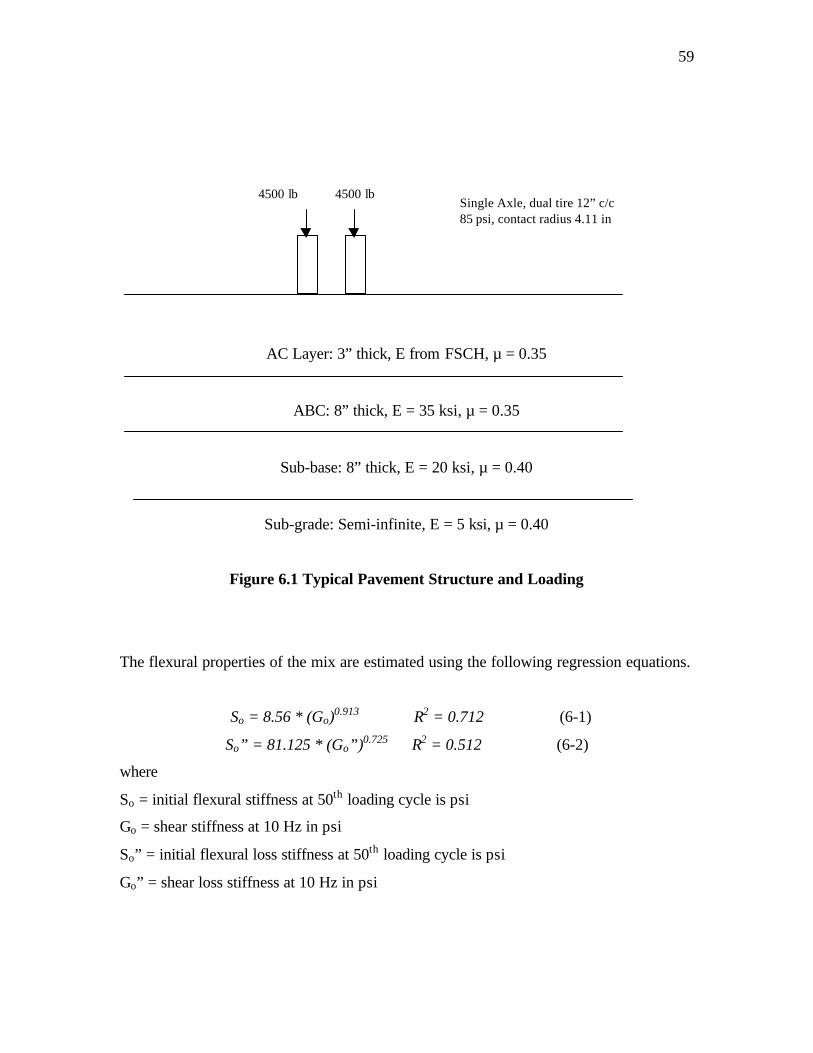
59
AC Layer: 3” thick, E from FSCH, µ = 0.35
ABC: 8” thick, E = 35 ksi, µ = 0.35
Sub-base: 8” thick, E = 20 ksi, µ = 0.40
Sub-grade: Semi-infinite, E = 5 ksi, µ = 0.40
Figure 6.1 Typical Pavement Structure and Loading
The flexural properties of the mix are estimated using the following regression equations.
So = 8.56 * (Go)0.913 R2 = 0.712 (6-1)
So” = 81.125 * (Go”)0.725 R2 = 0.512 (6-2)
where
So = initial flexural stiffness at 50th loading cycle is psi
Go = shear stiffness at 10 Hz in psi
So” = initial flexural loss stiffness at 50th loading cycle is psi
Go” = shear loss stiffness at 10 Hz in psi
4500 lb 4500 lbSingle Axle, dual tire 12” c/c85 psi, contact radius 4.11 in
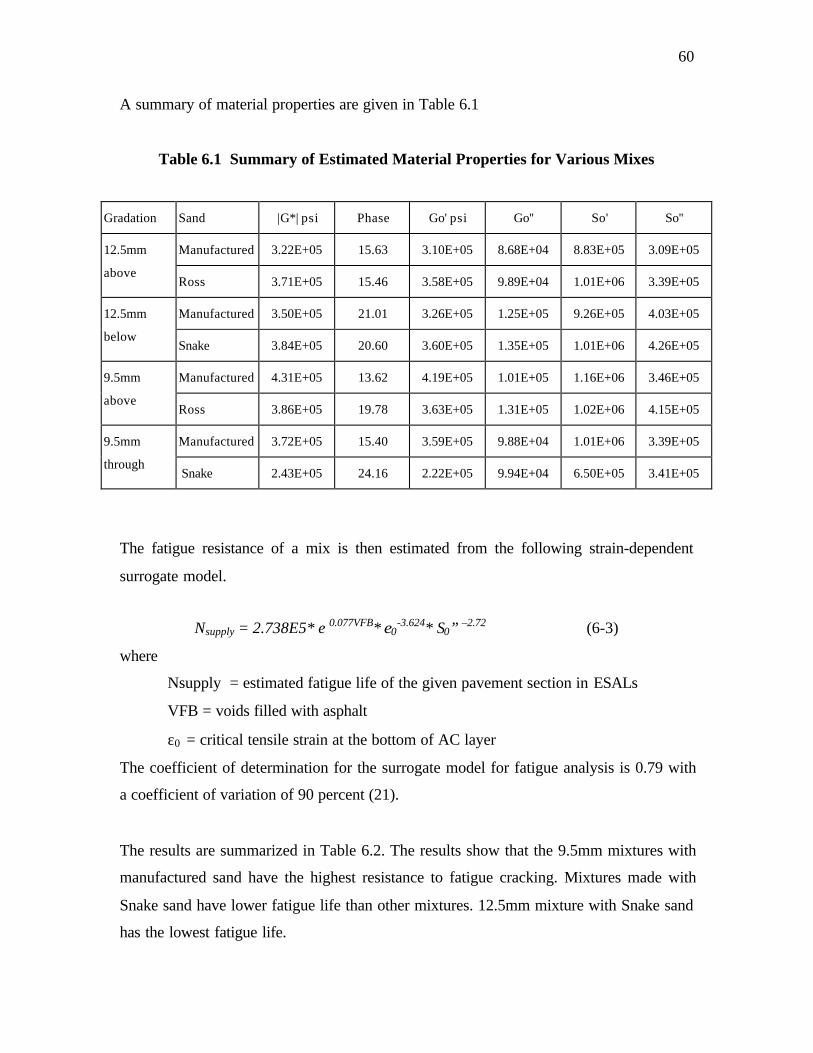
60
A summary of material properties are given in Table 6.1
Table 6.1 Summary of Estimated Material Properties for Various Mixes
Gradation Sand |G*| psi Phase Go' psi Go'' So' So''
Manufactured 3.22E+05 15.63 3.10E+05 8.68E+04 8.83E+05 3.09E+0512.5mm
aboveRoss 3.71E+05 15.46 3.58E+05 9.89E+04 1.01E+06 3.39E+05
Manufactured 3.50E+05 21.01 3.26E+05 1.25E+05 9.26E+05 4.03E+0512.5mm
belowSnake 3.84E+05 20.60 3.60E+05 1.35E+05 1.01E+06 4.26E+05
Manufactured 4.31E+05 13.62 4.19E+05 1.01E+05 1.16E+06 3.46E+059.5mm
aboveRoss 3.86E+05 19.78 3.63E+05 1.31E+05 1.02E+06 4.15E+05
Manufactured 3.72E+05 15.40 3.59E+05 9.88E+04 1.01E+06 3.39E+059.5mm
through Snake 2.43E+05 24.16 2.22E+05 9.94E+04 6.50E+05 3.41E+05
The fatigue resistance of a mix is then estimated from the following strain-dependent
surrogate model.
Nsupply = 2.738E5* e 0.077VFB* ε0-3.624* S0” –2.72 (6-3)
where
Nsupply = estimated fatigue life of the given pavement section in ESALs
VFB = voids filled with asphalt
ε0 = critical tensile strain at the bottom of AC layer
The coefficient of determination for the surrogate model for fatigue analysis is 0.79 with
a coefficient of variation of 90 percent (21).
The results are summarized in Table 6.2. The results show that the 9.5mm mixtures with
manufactured sand have the highest resistance to fatigue cracking. Mixtures made with
Snake sand have lower fatigue life than other mixtures. 12.5mm mixture with Snake sand
has the lowest fatigue life.

61
It is also found that the difference between the fatigue lives of mixtures of manufactured
sand and natural sand is more than 30% for 9.5mm NMSA aggregate gradations whereas
the difference is only around 10% for mixtures with 12.5mm NMSA aggregate
gradations.
Table 6.2 Summary of Fatigue Analysis Results (SHRP Surrogate Model)
Gradation Sand So'' VFA Strain Nsupply % Difference
with Nsupply
of Manf. sand
% Difference
with N supply
of 12.5 RA-M
Manufactured 3.09E+05 73.1 2.35E-04 1.27E+06 - -12.5mm above
Ross 3.39E+05 74 2.21E-04 1.30E+06 2.69 2.69
Manufactured 4.03E+05 73.68 2.30E-04 6.93E+05 - -45.4112.5mm below
Snake 4.26E+05 72 2.21E-04 6.05E+05 -12.78 -52.39
Manufactured 3.46E+05 77.6 2.07E-04 2.07E+06 - 62.769.5mm above
Ross 4.15E+05 78 2.20E-04 1.04E+06 -49.47 -17.76
Manufactured 3.39E+05 73.8 2.21E-04 1.29E+06 - 1.389.5 mm
through Snake 3.41E+05 78 2.66E-04 8.97E+05 -30.35 -29.39
The fatigue life values in Table 6.2 are estimated for asphalt layer of 3 inch thick. The
lowest fatigue life observed among all the mixtures is about 600,000 ESALs for 12.5 mm
mixture with Snake sand (12.5 RB-S). Poor fatigue life of mixtures observed in Table 6.2
is purely a function of design thickness of AC layer. This is demonstrated by estimating
the fatigue life of the 12.5 RB-S mixture for varying thickness of AC layer, as shown in
Table 6.3 and Figure 6.2.
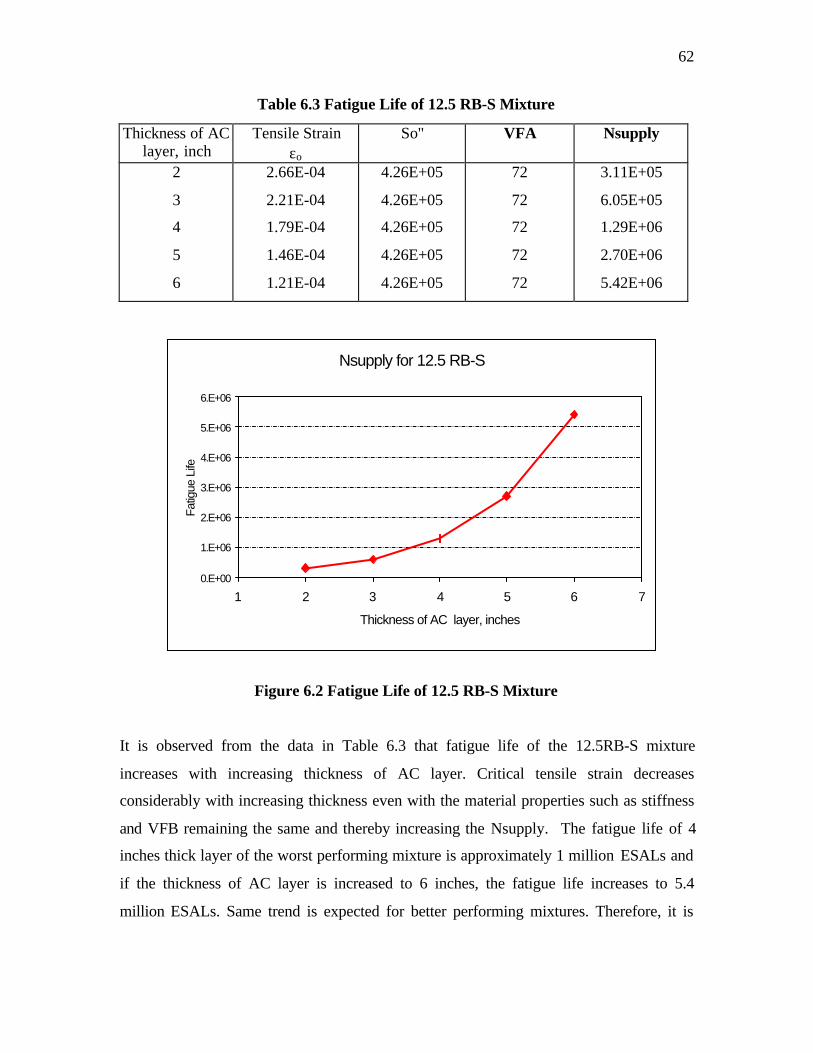
62
Table 6.3 Fatigue Life of 12.5 RB-S Mixture
Thickness of AClayer, inch
Tensile Strainεo
So'' VFA Nsupply
2
3
4
5
6
2.66E-04
2.21E-04
1.79E-04
1.46E-04
1.21E-04
4.26E+05
4.26E+05
4.26E+05
4.26E+05
4.26E+05
72
72
72
72
72
3.11E+05
6.05E+05
1.29E+06
2.70E+06
5.42E+06
Figure 6.2 Fatigue Life of 12.5 RB-S Mixture
It is observed from the data in Table 6.3 that fatigue life of the 12.5RB-S mixture
increases with increasing thickness of AC layer. Critical tensile strain decreases
considerably with increasing thickness even with the material properties such as stiffness
and VFB remaining the same and thereby increasing the Nsupply. The fatigue life of 4
inches thick layer of the worst performing mixture is approximately 1 million ESALs and
if the thickness of AC layer is increased to 6 inches, the fatigue life increases to 5.4
million ESALs. Same trend is expected for better performing mixtures. Therefore, it is
Nsupply for 12.5 RB-S
0.E+00
1.E+06
2.E+06
3.E+06
4.E+06
5.E+06
6.E+06
1 2 3 4 5 6 7
Thickness of AC layer, inches
Fat
igue
Life
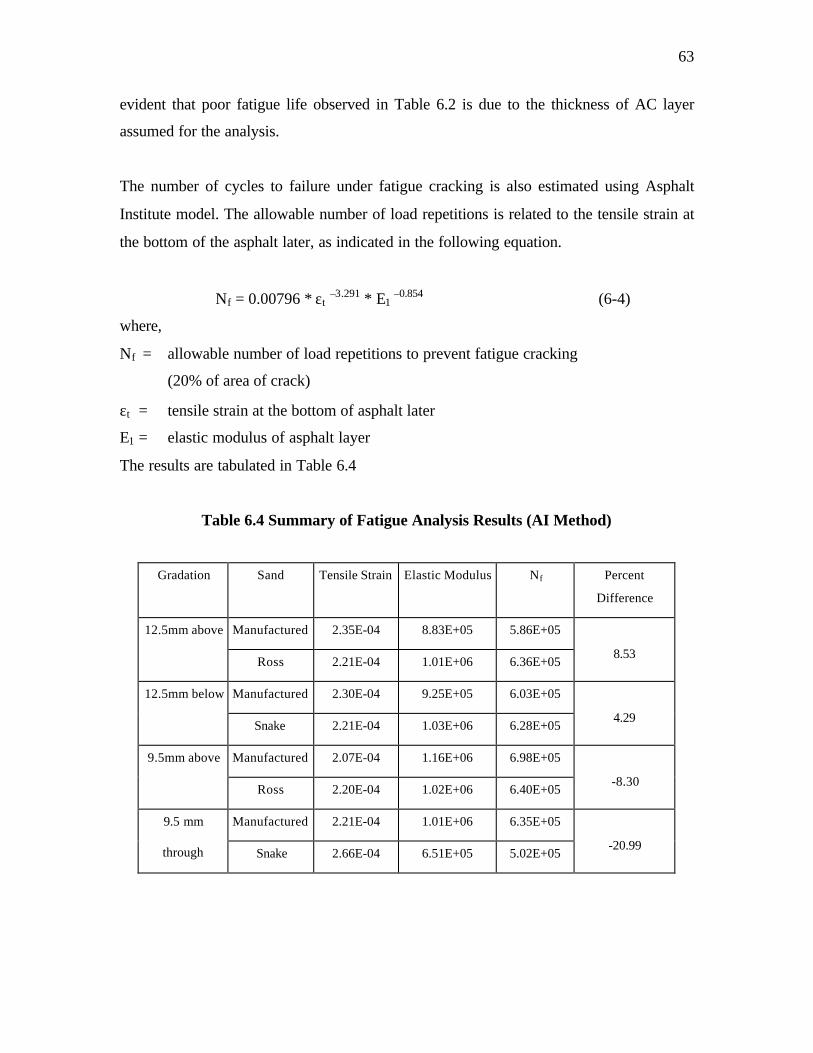
63
evident that poor fatigue life observed in Table 6.2 is due to the thickness of AC layer
assumed for the analysis.
The number of cycles to failure under fatigue cracking is also estimated using Asphalt
Institute model. The allowable number of load repetitions is related to the tensile strain at
the bottom of the asphalt later, as indicated in the following equation.
Nf = 0.00796 * εt –3.291 * E1 –0.854 (6-4)
where,
Nf = allowable number of load repetitions to prevent fatigue cracking
(20% of area of crack)
εt = tensile strain at the bottom of asphalt later
E1 = elastic modulus of asphalt layer
The results are tabulated in Table 6.4
Table 6.4 Summary of Fatigue Analysis Results (AI Method)
Gradation Sand Tensile Strain Elastic Modulus Nf Percent
Difference
Manufactured 2.35E-04 8.83E+05 5.86E+0512.5mm above
Ross 2.21E-04 1.01E+06 6.36E+058.53
Manufactured 2.30E-04 9.25E+05 6.03E+0512.5mm below
Snake 2.21E-04 1.03E+06 6.28E+054.29
Manufactured 2.07E-04 1.16E+06 6.98E+059.5mm above
Ross 2.20E-04 1.02E+06 6.40E+05-8.30
Manufactured 2.21E-04 1.01E+06 6.35E+059.5 mm
through Snake 2.66E-04 6.51E+05 5.02E+05-20.99
64
The results of AI fatigue cracking model show that the mixtures made with natural sand
have almost the same resistance to fatigue cracking as the mixtures made with
manufactured sand.
6.2 SUPERPAVE Rutting Model Analysis
The permanent deformation system of SHRP A-003A estimates rut depth from the
maximum permanent shear strain obtained from RSCH test using the following relation.
Rut depth (in.) = 11 * Maximum permanent shear strain (6-5)
If rutting in millimeters is desired, the coefficient of the above equation is about 275. The
above relationship is obtained for a tire pressure of 100psi and asphalt layer thickness of
15inch. Studies performed for the similar pavement structure at 200psi and 500psi
suggest that this relationship is independent of the tire pressure. But the same is not
reflected in the case of pavement thickness. The coefficient is expected to decrease with a
decrease in asphalt layer thickness.
The conversion of the number of RSCH test cycles to ESALs is determined by the
following equation:
log (cycles) = -4.36 + 1.24 log (ESALs) (6-6)
where,
cycles = number of cycles obtained from the RSCH test
ESALs = equivalent 18-kip single axle load
According to the above relationship, 5000 cycles of the RSCH test correspond to 3.156
million ESALs. The summary of the results are given in Table 6.5
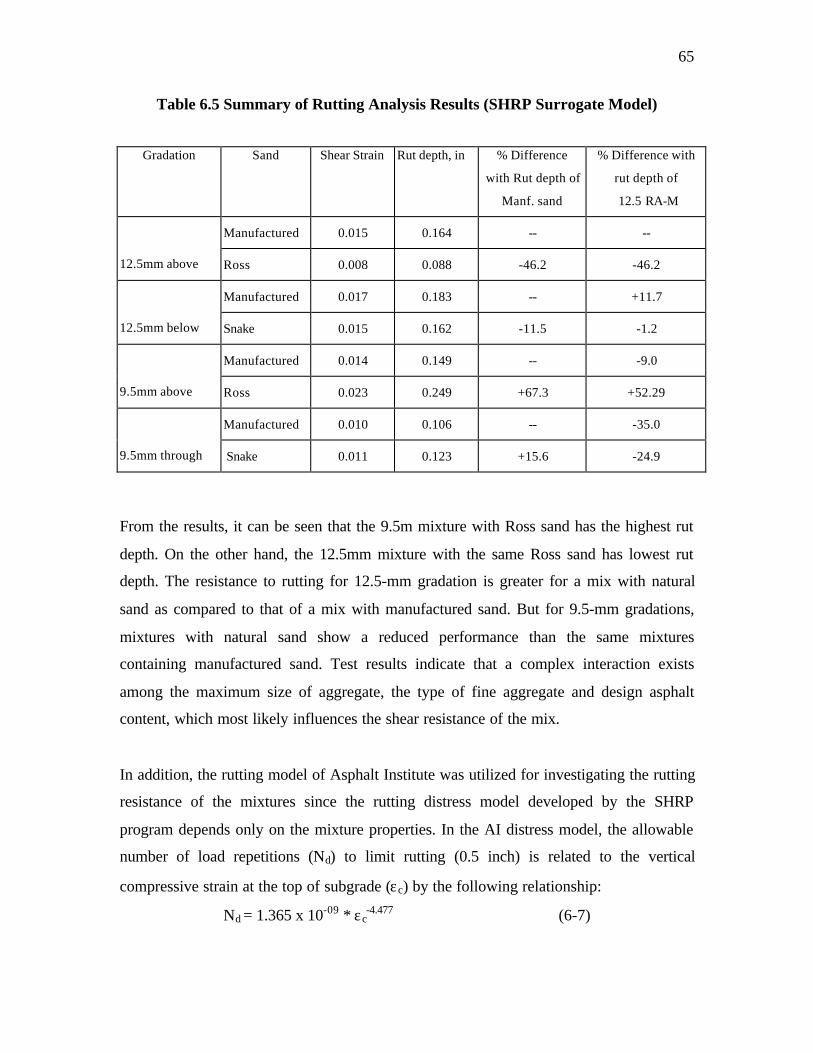
65
Table 6.5 Summary of Rutting Analysis Results (SHRP Surrogate Model)
Gradation Sand Shear Strain Rut depth, in % Difference
with Rut depth of
Manf. sand
% Difference with
rut depth of
12.5 RA-M
Manufactured 0.015 0.164 -- --
12.5mm above Ross 0.008 0.088 -46.2 -46.2
Manufactured 0.017 0.183 -- +11.7
12.5mm below Snake 0.015 0.162 -11.5 -1.2
Manufactured 0.014 0.149 -- -9.0
9.5mm above Ross 0.023 0.249 +67.3 +52.29
Manufactured 0.010 0.106 -- -35.0
9.5mm through Snake 0.011 0.123 +15.6 -24.9
From the results, it can be seen that the 9.5m mixture with Ross sand has the highest rut
depth. On the other hand, the 12.5mm mixture with the same Ross sand has lowest rut
depth. The resistance to rutting for 12.5-mm gradation is greater for a mix with natural
sand as compared to that of a mix with manufactured sand. But for 9.5-mm gradations,
mixtures with natural sand show a reduced performance than the same mixtures
containing manufactured sand. Test results indicate that a complex interaction exists
among the maximum size of aggregate, the type of fine aggregate and design asphalt
content, which most likely influences the shear resistance of the mix.
In addition, the rutting model of Asphalt Institute was utilized for investigating the rutting
resistance of the mixtures since the rutting distress model developed by the SHRP
program depends only on the mixture properties. In the AI distress model, the allowable
number of load repetitions (Nd) to limit rutting (0.5 inch) is related to the vertical
compressive strain at the top of subgrade (εc) by the following relationship:
Nd = 1.365 x 10-09 * εc-4.477 (6-7)

66
The vertical compressive strain at the top of subgrade is estimated using EVERSTRESS
pavement analysis software. The estimated number of cycles to failure under rutting for
all mixtures are given in Table 6.6
Table 6.6 Summary of Rutting Analysis Results (AI Method)
Gradation Sand Shear Strain Nd Percent
Difference
Manufactured 6.50E-04 2.53E+05
12.5mm above Ross 6.37E-04 2.78E+05 9.79
Manufactured 6.46E-04 2.61E+05
12.5mm below Snake 6.37E-04 2.78E+05 6.26
Manufactured 6.23E-04 3.07E+05
9.5mm above Ross 6.36E-04 2.80E+05 -9.06
Manufactured 6.37E-04 2.78E+05
9.5mm through Snake 6.79E-04 2.08E+05 -24.99
The results of SHRP model and AI model exhibit similar trend in that the 12.5 mixtures
made with natural sand have almost the same shear resistance as those made with
manufactured sand. A relative inferior performance of natural sands in the 9.5mm
mixtures is reflected in both models.
It should be borne in mind that even though there are some relative differences in rutting
potential, the maximum rut depth according to SHRP Rut Model in Table 6.5 is about
0.25 inch. Furthermore, the rut depths are calculated for 5000 cycles of RSCH test. This
corresponds to 3 million ESALs. In other words, all the mixtures included in this study
will perform well up to at least 3 million ESALs of traffic.
The analysis using the AI model is based on the elastic analysis of the pavement structure
and the rutting is governed by the compressive strain at the top of the subgrade. In other

67
words, the AI model is predicated on the assumption that rutting is controlled by the
deformation of the subgrade. On the other hand, the SHRP model assumes that rutting is
more pronounced in the surface layers and, therefore, the mixture properties of the
surface later primarily dictate the rutting behavior of a given pavement.
In view of the above reasoning and for the objective of relative evaluation of mixture
performance for rutting, SHRP model should be given more credence.
68
CHAPTER 7
SUMMARY OF RESULTS AND CONCLUSIONS
The performance of the asphalt concrete mixtures is judged based on the ability of the
mixture to resist fatigue and rutting distresses. Tests were carried out to evaluate the
performance of the mixtures containing manufactured and natural sands in terms of
fatigue and permanent deformation. Tests were conducted using Simple Shear Tester,
Asphalt Pavement Analyzer, GLPA and Superpave Gyratory Compactor.
The results of FSTCH and RSTCH were then analyzed using the Asphalt Institute (AI)
method and SHRP A 003-A Surrogate models. The AI method considers the mixture
stiffness, the only material parameter used in its analysis. On the other hand, surrogate
models use various mixture properties such as shear strain, flexural stiffness and VFA.
Therefore, the results of SHRP surrogate models are given preference in this discussion.
The estimates of fatigue life show that for mixtures of 12.5mm gradation, natural sands
have performed at par with 100 percent manufactured sand. The performance of the
mixtures differs within a range of ± 10 %. This difference is not statistically significant.
For mixtures of 9.5mm gradations, the fatigue life of mixtures containing natural sand is
almost half as compared to the mixtures containing manufactured sand. This significant
difference indicates the inferior performance of natural sands in the 9.5mm mixtures. The
same trend is reflected in the results obtained by the AI method.
The results show that the fatigue life of the mixture is influenced by the maximum size of
the aggregate and the gradation as well as the type of sand to be used. The 9.5mm
mixture with the gradation above the restricted zone and manufactured sand (9.5RA-M),
the finest among all the four gradations, has the highest fatigue life whereas the 12.5mm
mixture with the gradation below the restricted zone and Snake sand (12.5RB-S), the
coarsest among all the four gradations, has the lowest fatigue life. Though the fatigue life
of 12.5mm mixtures with the gradation below the restricted zone is nearly half of

69
the12.5mm mixtures with the gradation above the restricted zone, the addition of natural
sands did not significantly affect the performance of these mixtures. On the other hand,
though the fatigue life of the 9.5mm mixtures with 100 percent manufactured sand
performed better than the 12.5mm mixtures, the addition of natural sands reduced their
fatigue life by 30% to 50%. Therefore, it can be concluded that natural sands perform
equally well as compared with manufactured sand for mixtures of 12.5mm gradation
while the addition of natural sand results in the reduction of fatigue life for mixtures of
9.5mm gradation.
As is evident from the analysis of the data in Chapter 6, the 9.5mm mixture with Ross
sand had the highest rut depth. On the other hand, the 12.5 mm mixture made with the
same Ross sand had the lowest rut depth. The resistance to rutting for 12.5mm gradation
was greater for a mix with natural sand as compared to that of a mix with manufactured
sand. But for 9.5mm gradations, mixtures with natural sand showed a reduced
performance than the same mixtures containing manufactured sand. It is evident that a
complex interaction exists among the maximum size of the aggregate, the type of fine
aggregate and design asphalt content, which most likely influences the shear resistance of
the mix and rutting potential. However, the estimates of rutting indicate that the range of
rut depths for 5000 cycles (3 million ESALs) in the shear testing is from 0.09 to 0.25
inch. In other words, certain amount of natural sand can be used in these mixtures
without any significant effect on the rutting potential
The TSR test results reveal that mixtures with natural sands are relatively more moisture
susceptible. The TSR values for mixtures with Ross and Snake sands are 86.3% and
85.8%, respectively. These values pass the NCDOT criteria of a minimum value of 85%.
There is a difference in tensile strength of about 6.7% between conditioned and
unconditioned specimens for mixtures made with manufactured sands. This difference
increases with the inclusion of natural sands. The reduction in tensile strength is about
13.7 % and 14.2% for mixtures containing Ross and Snake pit sands, respectively. This
might increase the probability of an asphalt mix to strip prematurely.

70
The energy indices measured by SGC and GLPA show that 12.5mm mixtures perform
better than 9.5mm mixtures with an exception to 9.5 mm mixture containing Ross sand. It
is also observed that there is not much difference in CEI and CFI values of coarser
gradations and finer gradations of 12.5mm mixture. But TEI and TFI values of finer
gradations are greater than those of the coarser gradations. These observations contradict
with the notion that coarser gradations have better rutting resistance under heavy traffic
loads. The same trend was observed by Bahia et al (18). The authors explain that coarser
gradations are less desirable for construction and in-service traffic densification,
assuming that SGC is truly representing field conditions. They postulate that in a fine
blend, more individual particles result in more contact points. This increased number of
stone to stone contact points increases the frictional resistance of the mix and its
resistance to deformation. So finer mixtures tend to have a lower, more distributed void
content, which is explained by the higher CEI. On the other hand, coarser mixtures have
much more void space and fewer friction points allowing a relatively amount of energy to
move the aggregate particles past one another under the extended kneaded action. The
lower TDI can be explained by this increased space for movement of the particles. The
same has been observed with the indices of GLPA. The results of GLPA show that finer
mixtures have better frictional resistance, a measure of mix stability, than coarse mixture.
However this concept of interparticle contacts has not been widely accepted or validated
with the actual field performance. Furthermore, one of the major deficiencies of the
GLPA test is that it is conducted at the compaction temperature of about 155oC at which
the behavior of the mixtures could be quite different from a maximum service
temperature of about 60oC.
The results of the APA test show that mixtures with 12.5mm aggregates and gradation
below the restricted zone perform well irrespective of the presence of natural sand. It is
observed that coarser gradation with 12.5mm aggregate and manufactured sand mixtures
exhibit lower rut depth. These results once again emphasize the role of size of maximum
aggregate and type of gradation in predicting the performance of natural sands. The
behavior of mixtures below 1000 passes seems to be an area of interest as it gives nearly
half of the final rut depth. Some of the studies show that rut depth of APA testing
71
correlates well with the field performance ranking but this study involved a limited
number of samples. Due to lack of sufficient amount of data, APA results are still remain
to be validated with the data obtained from other studies at NCSU. Standard protocols
call for APA tests to be conducted on specimens compacted to approximately 7% air
voids and at maximum temperature of the performance graded asphalt, while the shear
tests are conducted on specimens compacted to Ndes and at 54oC. The discrepancy in
these test conditions may cloud a meaningful comparison of the performance of mixtures
as evaluated by these tests.
It is viewed that the performance of natural sand is greatly influenced by the maximum
size of aggregate. As the aggregate size decreases, VMA of the mix increases. Higher
VMA results in the reduction of stability and tensile strength. Studies by E.R.Brown (22)
show that there is an increase in the resilent modulus of the mixture with increased
aggregate size, and therefore, increased stiffness will result in the reduction of stresses in
the underlying layers. Also, when the diameter ratio of fine and coarse particle fractions
(df/dc) increases, dilation will occur in the coarse particle structure and the introduction of
the fine fraction will increase the mass volume (13).
The rutting test results indicates that the minimum service life of all the mixtures
included in this research study is about 3 million ESALs, while the minimum fatigue life
is to the tune of about 1 million ESALs. Therefore, it is quite evident that even 9.5mm
mixtures containing natural sand can adequately serve the low volume secondary roads.
It can be concluded from the test results that
1. Maximum size of aggregate and type of gradation influence the performance of
mixtures containing natural sand
2. The performance of 12.5mm mixtures, in terms of fatigue and rutting, is not adversely
affected by incorporation of natural sand in the mixture gradation.
3. The rutting performance of 9.5mm mixtures is not affected by the addition of natural
sand, while the fatigue life of these mixtures is adversely affected. The 9.5mm

72
mixtures containing natural sand have 50% to 70% of fatigue life of the mixtures
made with manufactured sand.
4. The rutting test results indicate that the minimum service life of all the mixtures is
about 3 million ESALs, while the minimum fatigue life is to the tune of
approximately 1 million ESALs. Therefore, it is quite evident that even 9.5mm
mixtures containing natural sand can adequately serve as a surface course for the low
volume secondary roads.
5. The fatigue life of a given pavement structure is a function of the thickness of the
asphalt concrete layer; thicker the asphalt concrete layer, higher the fatigue life.
Therefore, an increase in thickness of 9.5mm mixtures containing natural sand may
improve the fatigue life to a desired level.
6. The mixtures containing natural sand exhibit relatively higher moisture susceptibility.
7. The GLPA test is conducted at the compaction temperature (approximately 150oC) at
which the behavior of the mixtures could be significantly different from the behavior
at the maximum service temperature of 60oC. Furthermore, standard protocols call for
APA tests to be conducted on specimens compacted to approximately 7% air voids
and at maximum service temperature of the performance graded asphalt, i.e. 64oC. On
the other hand, the shear tests are conducted on specimens compacted to Ndes and at
54oC. The discrepancy in these test conditions may obscure a meaningful comparison
of the performance of mixtures as evaluated by these tests.

73
IMPLEMENTATION AND TECHNOLOGY TRANSFER PLAN
This study has provided an objective evaluation of the Superpave mix design for mixtures
containing natural sand. The results provide guidelines for designing such mixes and
allow NCDOT to develop and utilize relatively economical Superpave surface course
mixes for secondary roads.
74
REFERENCES
1. Superpave Level 1 Mix Design, Superpave Series No.2 (SP-2), Asphalt Institute,Lexington.
2. Waddah S. Abdullah, Mohammed Taleb Obaidat, Nazem Abu-Sa’da., Influence ofAggregate Type and Gradation on Voids of Asphalt Concrete Pavements, ASCEJournal of Materials in Civil Engineering, Vol. 10, No. 2, May 1998, pp. 76-85
3. Reed B. Freeman, and Chun-Yi Kuo, Quality Control for Natural Sand Content ofAsphalt Concrete, ASCE Journal of Transportation Engineering, Vol. 125, No. 6,1999, pp. 539-546.
4. Stuart, KD, and Mogawer, WS., Evaluation of Natural Sands Used in AsphaltMixtures, Transportation Research Record 1436, 1994, pp 115-123
5. JM Rice and WH Goetz, Suitability of Indiana Dune, Lake and Waste Sands ForBituminous Pavements, Proceedings of The Association of Asphalt PavingTechnologists, Vol 18, 1949, pp19-62.
6. JT Pauls and HM Rex, Design Problems Encountered in the Use of LocalAggregates, Proceedings of The Association of Asphalt Paving Technologists, Vol18, 1949, pp185-208.
7. Button, JW., Perdomo, D., and Lytton, RL. Influence of Aggregate on Rutting inAsphalt Concrete Pavements, Transportation Research Record 1259, 1990, pp 141-152.
8. Kalcheff, I.V. and Tunnicliff, D.G., “Effects of Crushed Stone Aggregate Size andShape on Properties of Asphalt Concrete,” Association of Asphalt PavingTechnologists, Vol. 51, 1982, p.453.
9. E.Shklarsky and M.Livneh. The Use of Gravels for Bituminous Paving Mixtures.Proc., Association of Asphalt Paving Technologists, Vol 33, 1964.
10. R.B.Moore and R.A Welke Effects of Fine Aggregate on Stability of BituminousMixes, Research Report 78 TB-34-79F. Testing and Research Division, TestingLaboratory Section, Michigan Department of Transportation, 1979.
11. R.R.Lottman and W.H.Goetz. Effect of Crushed Gravel Fine Aggregate on theStrength of Asphaltic Surfacing Mixtures. Circular 63, National Sand GravelAssociation, 1956.

75
12. Tons, E., and W.H.Goetz. Packing Volume Concept for Aggregates. In HighwayResearch Record 236, HRB, National Research Council, Washington, D.C., 1968, pp76-96
13. Ishai, I., and E.Tons. Factors in Bituminous Concrete Design. Proc., Association ofAsphalt Paving Technologists, Vol 42, 1973, p 160
14. Khedaywi, TS and Tons, E. Aggregate Rugosity And Size Effect on BituminousMixes,Transportation Research Record, 1998, pp 26-36.
15. Standard Method for Determining the Permanent Deformation and Fatigue CrackingCharacteristics of Hot Mix Asphalt using the Simple Shear Test Device, AASHTOTP-7, American Association of State Highways and Transportation Officials,Washington, D.C., 1996
16. Guler, M, Bahia, HU, Bosscher, PJ., and Plesha, ME. Device for Measuring ShearResistance of Hot-Mix Asphalt in Gyratory Compactor, Transportation ResearchRecord 1723, 2000, pp 116-124.
17. Stakson A.D., Bushek, J.J. and Hussian U. Bahia, Effect of Fine AggregateAngularity (FAA) on Compaction and Shearing Resistance of Asphalt Mixtures,(Unpublished paper – To be presented in TRB meeting 2002).
18. Bahia, H., Friemel, Timothy, Peterson, Pehr and Russell, Jeffrey. Optimization ofConstructability and Resistance to Traffic: A New Design Approach for HMA Usingthe Superpave Compactor. Proc., Association of Asphalt Paving Technologists, Vol67, 1998, p 189
19. Standard Method for Resistance of Compacted Bituminous Mixture to MoistureInduced Damage, AASHTO T-283, American Association of State Highways andTransportation Officials, Washington, D.C., 1996
20. Choubane, B, Page, GC and Musselman, JA. Suitability of Asphalt PavementAnalyzer for Predicting Pavement Rutting ,Transportation Research Record 1723,2000, pp 107-115
21. Monismith, C.L. Asphalt Concrete: An Extraordinary Material for EngineeringApplications, 13th Henry M. Shaw Lecture in Civil Engineering. Department of CivilEngineering, North Carolina State University, Raleigh, 1993.
22. Brown,E.R. and Charles E.Bassett, Effects of Maximum Aggregate Size on RuttingPotential and other Properties of Asphalt-Aggregate Mixtures, TransportationResearch Record 1259, 1990, pp 107 – 119.