performance improvement projects report · study summary ... 2-14 member satisfaction ... state and...
TRANSCRIPT

State of Georgia
Department of Community Health
Georgia Families Program
WellCare of Georgia, Inc.
PERFORMANCE IMPROVEMENT
PROJECTS REPORT
SFY 2015
November 2014

WellCare of Georgia, Inc. SFY 2015 PIP Validation Report WellCare_GASFY2015_CMO_PIP-Val_Report_F2_1114 State of Georgia Health Services Advisory Group, Inc.
Page i
TABLE OF CONTENTS
1. Background ....................................................................................................................... 1-1
CMO Overview ............................................................................................................................... 1-3 Study Rationale .............................................................................................................................. 1-3 Study Summary .............................................................................................................................. 1-3 Validation Overview ........................................................................................................................ 1-5 HSAG’s Validation Scoring Methodology ........................................................................................ 1-7
2. Findings ............................................................................................................................. 2-1 Aggregate Validation Findings ........................................................................................................ 2-1
Design ......................................................................................................................................... 2-2 Implementation ........................................................................................................................... 2-3 Outcomes ................................................................................................................................... 2-3
PIP-Specific Outcomes ................................................................................................................... 2-3 Analysis of Results ...................................................................................................................... 2-3 Adolescent Well-Care ................................................................................................................. 2-4 Annual Dental Visits .................................................................................................................... 2-6 Appropriate Use of ADHD Medications ....................................................................................... 2-7 Childhood Immunizations—Combo 10 ........................................................................................ 2-9 Childhood Obesity ..................................................................................................................... 2-10 Comprehensive Diabetes Care ................................................................................................. 2-12 Avoidable Emergency Room Visits ........................................................................................... 2-14 Member Satisfaction ................................................................................................................. 2-16 Postpartum Care ....................................................................................................................... 2-17 Provider Satisfaction ................................................................................................................. 2-19
3. Conclusions and Recommendations .............................................................................. 3-1 Conclusions .................................................................................................................................... 3-1 Recommendations .......................................................................................................................... 3-1
Appendix A. PIP-Specific Validation Scores ...................................................................... A-1
WellCare of Georgia, Inc. SFY 2015 PIP Validation Report WellCare_GASFY2015_CMO_PIP-Val_Report_F2_1114 State of Georgia Health Services Advisory Group, Inc.
Page ii
ACKNOWLEDGMENTS AND COPYRIGHTS
CAHPS® refers to the Consumer Assessment of Healthcare Providers and Systems and is a registered
trademark of the Agency for Healthcare Research and Quality (AHRQ).
HEDIS® refers to the Healthcare Effectiveness Data and Information Set and is a registered trademark of
the National Committee for Quality Assurance (NCQA).

WellCare of Georgia, Inc. SFY 2015 PIP Validation Report WellCare_GASFY2015_CMO_PIP-Val_Report_F2_1114 State of Georgia Health Services Advisory Group, Inc.
Page 1-1
Performance Improvement Project Validation Report – WellCare of Georgia, Inc.
1. BACKGROUND
The Georgia Department of Community Health (DCH) through its Division of Medical
Assistance Plans is responsible for administering the Medicaid program and the Children’s
Health Insurance Program (CHIP) for the State of Georgia and overseeing quality improvement
activities. The State refers to its Medicaid managed care program as Georgia Families and to its
CHIP program as PeachCare for Kids®
. For the purposes of this report, ―Georgia Families‖ refers
to all Medicaid and PeachCare for Kids® members enrolled in managed care.
The Georgia Families program serves the majority of Georgia’s Medicaid and CHIP populations.
The DCH requires its contracted Care Management Organizations (CMOs), serving the Georgia
Families members, to conduct performance improvement projects (PIPs). As set forth in 42 CFR
§438.240, the PIPs must be designed to achieve, through ongoing measurements and
interventions, significant improvement, sustained over time, in clinical and nonclinical care areas
that are expected to have a favorable effect on health outcomes and member satisfaction. DCH
requires the CMOs to report the status and results of each PIP annually. WellCare of Georgia,
Inc. (WellCare) is one of the Georgia Families CMOs.
The validation of PIPs is one of three federally-mandated activities for state Medicaid managed
care programs. The other two required activities include the evaluation of CMO compliance with
State and federal regulations and the validation of CMO performance measures.
These three mandatory activities work together to assess the CMOs’ performance with providing
appropriate access to high-quality care for their members. While a CMO’s compliance with
managed care regulations provides the organizational foundation for the delivery of quality
health care, the calculation and reporting of performance measure rates provide a barometer of
the quality and effectiveness of the care. The DCH requires the CMOs to initiate PIPs to improve
the quality of health care in targeted areas of low performance, or in areas identified as State
priorities or health care issues of greatest concern. The DCH required its CMOs to conduct 10
PIP studies during the 2013 calendar year and submit them for validation in 2014. PIPs are key
tools in helping DCH achieve the goals and objectives outlined in its quality strategy; they
provide the framework for monitoring, measuring, and improving the delivery of health care.
The primary objective of PIP validation is to determine each CMO’s compliance with
requirements set forth in 42 CFR §438.240(b)(1), including:
Measurement of performance using objective quality indicators.
Implementation of system interventions to achieve improvement in quality.
Evaluation of the effectiveness of the interventions.
Planning and initiation of activities to increase or sustain improvement.

BACKGROUND
WellCare of Georgia, Inc. SFY 2015 PIP Validation Report WellCare_GASFY2015_CMO_PIP-Val_Report_F2_1114 State of Georgia Health Services Advisory Group, Inc.
Page 1-2
To meet the federal requirement for the validation of PIPs, DCH contracted with Health Services
Advisory Group, Inc. (HSAG), the State’s external quality review organization (EQRO), to
conduct the validation of WellCare’s PIPs. WellCare submitted PIPs to HSAG between June 30,
2014, and July 30, 2014, and HSAG validated the PIPs between July 1, 2014, and August 15,
2014. The validated data represent varying measurement time periods as described in Table 2-3
through Table 2-12.
For PIPs initiated prior to January 1, 2012 (Childhood Obesity), HSAG used a validation
methodology based on the Centers for Medicare & Medicaid Services (CMS) validation
protocols.1-1
For PIPs initiated on or after January 1, 2012 (Adolescent Well-Care Visits, Annual
Dental Visits, Appropriate Use of ADHD Medications, Avoidable Emergency Room Visits,
Childhood Immunizations—Combo 10, Comprehensive Diabetes Care, Member Satisfaction,
Postpartum Care, and Provider Satisfaction), HSAG used CMS’ updated validation protocols.1-2
Compared to the 2002 CMS PIP protocols, the changes made to the 2012 protocols consisted of
reversing the order of Activities III and IV, and Activities VII and VIII. These changes did not
impact HSAG’s validation process.
Table 1-1—CMS Protocol Changes
PIP Activity CMS 2002 Protocol CMS 2012 Protocol
Clearly Defined Study Indicator(s) Activity III Activity IV
Correctly Identified Study Population Activity IV Activity III
Appropriate Improvement Strategies Activity VII Activity VIII
Sufficient Data Analysis and Interpretation of Results Activity VIII Activity VII
HSAG evaluated the following components of the quality improvement process:
1. The technical structure of the PIPs to ensure WellCare designed, conducted, and reported
PIPs using sound methodology consistent with the CMS protocol for conducting PIPs.
HSAG’s review determined whether a PIP could reliably measure outcomes. Successful
execution of this component ensures that reported PIP results are accurate and capable of
measuring real and sustained improvement.
2. The outcomes of the PIPs. Once designed, a PIP’s effectiveness in improving outcomes
depends on the systematic identification of barriers and the subsequent development of
relevant interventions. Evaluation of each PIP’s outcomes determined whether WellCare
improved its rates through the implementation of effective processes (i.e., barrier analyses,
intervention design, and evaluation of results) and, through these processes, achieved
statistically significant improvement over the baseline rate. Once statistically significant
improvement is achieved across all study indicators, HSAG evaluates whether WellCare was
successful in sustaining the improvement. The goal of HSAG’s PIP validation is to ensure
1-1
U.S. Department of Health and Human Services, Centers for Medicare & Medicaid Services. EQR Managed Care
Organization Protocol. Validating Performance Improvement Projects: A Protocol for Use in Conducting Medicaid External
Quality Review Activities, Final Protocol, Version 1.0, May 2002. 1-2
U.S. Department of Health and Human Services, Centers for Medicare & Medicaid Services. EQR Protocol 3: Validating Performance
Improvement Projects (PIPs): A Mandatory Protocol for External Quality Review (EQR), Version 2.0, September 2012.

BACKGROUND
WellCare of Georgia, Inc. SFY 2015 PIP Validation Report WellCare_GASFY2015_CMO_PIP-Val_Report_F2_1114 State of Georgia Health Services Advisory Group, Inc.
Page 1-3
that DCH and key stakeholders can have confidence that reported improvement in study
indicator outcomes is supported by statistically significant change and the CMOs
improvement strategies.
CMO Overview
The DCH contracted with WellCare beginning in 2006 to provide services to the Georgia
Families program population. Since implementation of the Georgia Families program, WellCare
has served the eligible population in all geographic regions of Georgia—Atlanta, Central, East,
North, Southeast, and Southwest.
Study Rationale
The purpose of a PIP is to achieve, through ongoing measurements and interventions, significant
improvement sustained over time in clinical or nonclinical areas. Although HSAG has validated
WellCare’s PIPs for seven years, the number of PIPs, study topics, and study methods has
evolved over time.
WellCare submitted 10 PIPs for validation. The PIP topics included:
Adolescent Well-Care Visits
Annual Dental Visits
Appropriate Use of ADHD Medications
Avoidable Emergency Room Visits
Childhood Immunizations—Combo 10
Childhood Obesity
Comprehensive Diabetes Care
Member Satisfaction
Postpartum Care
Provider Satisfaction
Study Summary
WellCare’s June 30, 2014, through July 30, 2014, PIP submissions included six clinical HEDIS-
based PIPs (Adolescent Well-Care Visits, Appropriate Use of ADHD Medications, Childhood
Immunizations—Combo 10, Childhood Obesity, Comprehensive Diabetes Care, and Postpartum
Care); two clinical PIPs not based on HEDIS specifications (Avoidable Emergency Room Visits
and Annual Dental Visits); and two nonclinical PIPs (Member Satisfaction and Provider
Satisfaction).

BACKGROUND
WellCare of Georgia, Inc. SFY 2015 PIP Validation Report WellCare_GASFY2015_CMO_PIP-Val_Report_F2_1114 State of Georgia Health Services Advisory Group, Inc.
Page 1-4
Table 1-2 outlines the key study indicators incorporated for the six clinical HEDIS-based PIPs.
Table 1-2—Clinical HEDIS-based Study Topics and Indicator Descriptions
Study Topic Study Indicator Description
Adolescent Well-Care Visits The percentage of members 12–21 years of age who had at least one comprehensive well-
care visit with a PCP or an OB/GYN practitioner during the measurement year.
Appropriate Use of ADHD
Medications
1. The percentage of members 6–12 years of age as of the Index Prescription Start Date
(IPSD) with an ambulatory prescription dispensed for ADHD medication, who had one
follow-up visit with a practitioner with prescribing authority during the 30-day
Initiation Phase.
2. The percentage of members 6–12 years of age as of the Index Prescription Start Date
(IPSD) with an ambulatory prescription dispensed for ADHD medication, who
remained on the medication for at least 210 days and who, in addition to the visit in the
Initiation Phase, had at least two follow-up visits with a practitioner from 31–300 days
following the IPSD. One of the two visits (during days 31–300) may be a telephone
visit with a practitioner.
Childhood Immunizations—
Combo 10
The percentage of children 2 years of age who had four diphtheria, tetanus and acellular
pertussis (DTaP); three polio (IPV); one measles, mumps, rubella (MMR); three H
influenza type B (HiB); three hepatitis B (HepB); one chicken pox (VZV); four
pneumococcal conjugate (PCV); one hepatitis A (HepA); two or three rotavirus (RV); and
two influenza (flu) vaccines by their second birthday.
Childhood Obesity
The percentage of members 3–17 years of age who had an outpatient visit with a PCP or
OB/GYN and who had evidence of BMI percentile documentation, nutrition counseling
and physical activity counseling.
Comprehensive Diabetes
Care
The percentage of members 18–75 years of age with diabetes (type 1 and type 2) who had
a HbA1c control < 7.0%, LDL-C control < 100mg/ml, and BP control < 140/90 mmHg.
Postpartum Care The percentage of deliveries of live births by members that were followed by a
postpartum visit on or between 21 and 56 days after delivery.
Table 1-3 outlines the key study indicators for the two clinical non-HEDIS PIPs.
Table 1-3—Clinical Non-HEDIS Study Topic and Indicator Descriptions
Study Topic Study Indicator Description
Annual Dental Visits
1. The percentage of members 1–20 years of age who received any dental service during
the measurement period (CMS 416 12A).
2. The percentage of members 1–20 years of age who received preventive dental
services during the measurement period (CMS 416 12B).
3. The percentage of members 6–9 years of age who received a sealant on a permanent
molar during the measurement period (CMS 416 12D).
Avoidable Emergency Room
Visits
1. The percentage of ER visits for ―avoidable‖ diagnoses (dx382–Acute Suppurative
otitis:382.9–Unspecified otitis:462–Acute pharyngitis:465.9–Acute upper respiratory
infection:466–Acute bronchitis:786.2–Cough) among members under 21 years of age
who had a visit to the ED in three selected Children’s Healthcare of Atlanta facilities
in the Atlanta region.
2. The percentage of ER visits for ―avoidable‖ diagnoses (dx382–Acute Suppurative otitis:
382.9–Unspecified otitis: 462–Acute pharyngitis: 465.9–Acute upper respiratory
infection: 466 –Acute bronchitis: 786.2–Cough) among members under 21 years of age
who had a visit to the ED in selected hospitals in the CMO’s expansion population.

BACKGROUND
WellCare of Georgia, Inc. SFY 2015 PIP Validation Report WellCare_GASFY2015_CMO_PIP-Val_Report_F2_1114 State of Georgia Health Services Advisory Group, Inc.
Page 1-5
Table 1-4 outlines the key study indicators incorporated for the two satisfaction-based PIPs.
The effectiveness of the Member Satisfaction PIP was measured using the Consumer Assessment
of Healthcare Providers and Systems (CAHPS) 5.0H, Medicaid Child Survey. This survey
provided information on parents’ experiences with their child’s provider and CMO.
The final WellCare PIP topic was Provider Satisfaction. WellCare contracted with a vendor to
produce and administer a survey to document the effectiveness of this performance improvement
project.
Table 1-4—Satisfaction-Based Study Indicators
Survey Type Question Survey Question
Member #36
The percentage of respondents who rate the health plan an 8, 9, or 10 in
response to the question ―Using any number from 0–10, where 0 is the
worst health plan and 10 is the best, what number would you use to rate
your child’s health plan?‖
Provider #3
The percentage of providers who respond ―very satisfied‖ or ―somewhat
satisfied‖ to the question ―Please rate your overall satisfaction with
WellCare of Georgia. Inc.‖
Validation Overview
HSAG obtained the data needed to conduct the PIP validation from WellCare’s PIP Summary
Forms. These forms provided detailed information about WellCare’s completed PIP activities.
Each required activity was evaluated on one or more elements that form a valid PIP. The HSAG
PIP Review Team scored each evaluation element within a given activity as Met, Not Met, Not
Applicable, or Not Assessed. In consultation with DCH and in an effort to more clearly
distinguish when evaluation criteria for each element were fulfilled, HSAG removed Partially
Met from the scoring options for this year’s validation cycle. HSAG designated some of the
evaluation elements deemed pivotal to the PIP process as critical elements. For a PIP to produce
valid and reliable results, all of the critical elements had to be scored Met. Given the importance
of critical elements to the scoring methodology, any critical element that received a Not Met
score resulted in an overall validation status for the PIP of Not Met. The CMO was also given a
Not Met validation status if less than 80 percent of all evaluation elements were scored Met.
HSAG provided a Point of Clarification when the CMO fully met the evaluation element criteria
and only minor documentation edits not critical to the validity of the PIP were recommended to
the CMO.
In addition to the overall validation status (e.g., Met) HSAG provided an overall percentage for
all evaluation elements (including critical elements) scored Met. HSAG calculated the overall
percentage by dividing the total number of elements scored Met by the total number of elements
scored Met and Not Met. HSAG also calculated a critical element overall percentage by dividing
the total number of critical elements scored Met by the sum of the critical elements scored Met,
and Not Met.
BACKGROUND
WellCare of Georgia, Inc. SFY 2015 PIP Validation Report WellCare_GASFY2015_CMO_PIP-Val_Report_F2_1114 State of Georgia Health Services Advisory Group, Inc.
Page 1-6
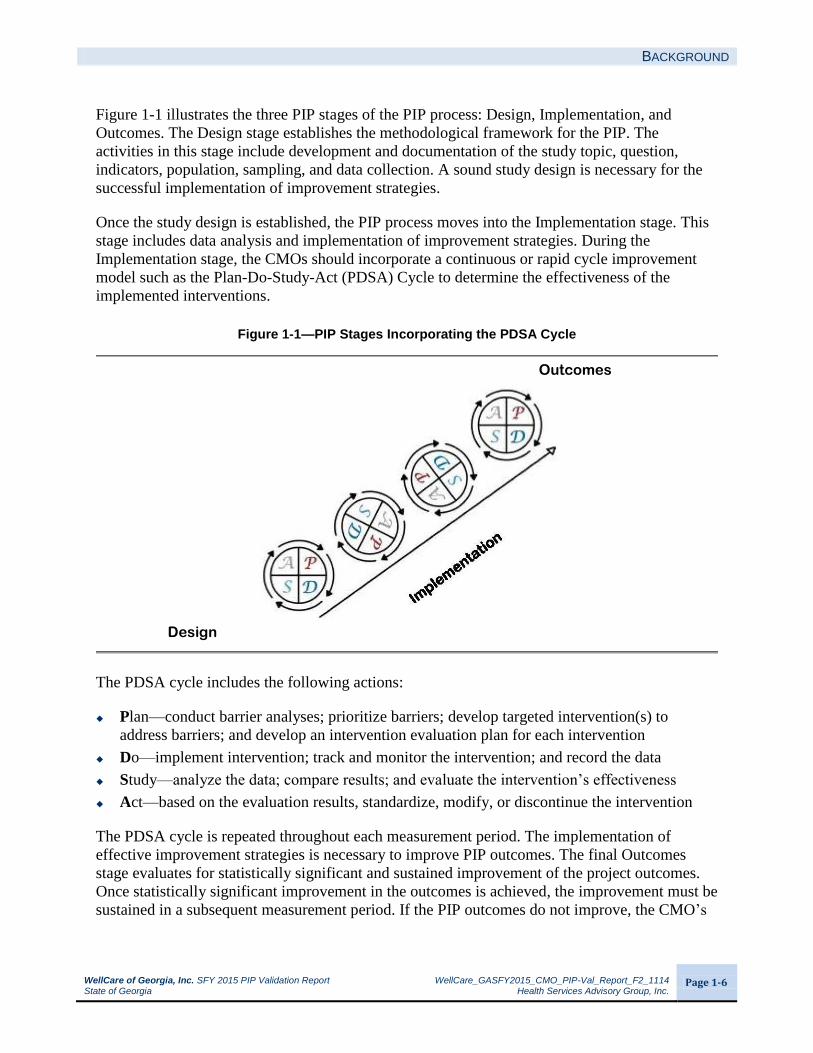
Figure 1-1 illustrates the three PIP stages of the PIP process: Design, Implementation, and
Outcomes. The Design stage establishes the methodological framework for the PIP. The
activities in this stage include development and documentation of the study topic, question,
indicators, population, sampling, and data collection. A sound study design is necessary for the
successful implementation of improvement strategies.
Once the study design is established, the PIP process moves into the Implementation stage. This
stage includes data analysis and implementation of improvement strategies. During the
Implementation stage, the CMOs should incorporate a continuous or rapid cycle improvement
model such as the Plan-Do-Study-Act (PDSA) Cycle to determine the effectiveness of the
implemented interventions.
Figure 1-1—PIP Stages Incorporating the PDSA Cycle
Outcomes
Design
The PDSA cycle includes the following actions:
Plan—conduct barrier analyses; prioritize barriers; develop targeted intervention(s) to
address barriers; and develop an intervention evaluation plan for each intervention
Do—implement intervention; track and monitor the intervention; and record the data
Study—analyze the data; compare results; and evaluate the intervention’s effectiveness
Act—based on the evaluation results, standardize, modify, or discontinue the intervention
The PDSA cycle is repeated throughout each measurement period. The implementation of
effective improvement strategies is necessary to improve PIP outcomes. The final Outcomes
stage evaluates for statistically significant and sustained improvement of the project outcomes.
Once statistically significant improvement in the outcomes is achieved, the improvement must be
sustained in a subsequent measurement period. If the PIP outcomes do not improve, the CMO’s

BACKGROUND
WellCare of Georgia, Inc. SFY 2015 PIP Validation Report WellCare_GASFY2015_CMO_PIP-Val_Report_F2_1114 State of Georgia Health Services Advisory Group, Inc.
Page 1-7
responsibility is to continue the PDSA cycle until statistically significant improvement is
achieved and sustained.
HSAG’s Validation Scoring Methodology
The scoring methodology evaluates whether or not the CMOs met all the documentation
requirements according to the CMS protocols, as well as evaluates whether or not all study
indicators have achieved statistically significant improvement over the baseline rate. In Activity
IX (real improvement achieved), the CMO must achieve statistically significant improvement
across all study indicator(s) between the baseline and a subsequent measurement period to
receive a Met score. For Activity X (sustained improvement achieved), HSAG assesses for
sustained improvement once all study indicators achieve statistically significant improvement
over the baseline and the CMO reports a subsequent measurement period. All study indicators
must achieve statistically significant improvement and sustain this improvement to receive a Met
validation score in Activity X.

WellCare of Georgia, Inc. SFY 2015 PIP Validation Report WellCare_GASFY2015_CMO_PIP-Val_Report_F2_1114 State of Georgia Health Services Advisory Group, Inc.
Page 2-1
2. FINDINGS
for WellCare of Georgia, Inc.
Aggregate Validation Findings
HSAG organized, aggregated, and analyzed WellCare’s PIP data to draw conclusions about the
CMO’s quality improvement efforts. The PIP validation process evaluated both the technical
methods of the PIP (i.e., the study design) and the outcomes associated with the implementation
of interventions. Based on its review, HSAG determined the overall methodological validity of
the PIPs, as well as the overall success in achieving improved study indicator outcomes. The
results are presented in Table 2-1.
Table 2-1—Performance Improvement Project Validation Scores for WellCare of Georgia, Inc.
PIP Percentage of Evaluation
Elements Scored Met Percentage of Critical Elements Scored Met
Validation Status
Adolescent Well-Care Visits 86% 93% Not Met
Annual Dental Visits 71% 55% Not Met
Appropriate Use of ADHD
Medication 86% 82% Not Met
Avoidable Emergency Room
Visits 64% 45% Not Met
Childhood Immunizations—
Combo 10 92% 100% Met
Childhood Obesity 94% 100% Met
Comprehensive Diabetes Care 88% 86% Not Met
Member Satisfaction 84% 86% Not Met
Postpartum Care 88% 79% Not Met
Provider Satisfaction 82% 79% Not Met
Only two of the 10 WellCare PIPs, Childhood Immunizations—Combo 10 and Childhood
Obesity, received an overall Met validation status. The remaining eight PIPs received a Not Met
score for one or more critical evaluation elements, which resulted in a Not Met validation status.
Table 2-2 displays the combined validation results for all 10 WellCare PIPs validated. This table
illustrates the CMO’s application of the PIP process and its success in implementing all 10
projects. Each activity was composed of individual evaluation elements scored as Met or Not
Met. Elements receiving a Met score satisfied the necessary technical requirements for a specific
element. The validation results presented in Table 2-2 show the percentage of applicable
evaluation elements that received a Met score by activity. Additionally, HSAG calculated an
overall percentage of Met scores across all activities for all 10 PIPs. Appendix A provides the
detailed scores from the validation tool for each of the 10 PIPs.

FINDINGS
WellCare of Georgia, Inc. SFY 2015 PIP Validation Report WellCare_GASFY2015_CMO_PIP-Val_Report_F2_1114 State of Georgia Health Services Advisory Group, Inc.
Page 2-2
Table 2-2—Performance Improvement Project Validation Results for WellCare of Georgia, Inc. (N=10 PIPs)
PIP Stage Activity
Percentage of Applicable Elements
Met Not Met
Design
Appropriate Study Topic 100%
(57/57)
0%
(0/57)
Clearly Defined, Answerable Study Question(s) 100%
(20/20)
0%
(0/20)
Clearly Defined Study Indicator(s) 93%
(26/28)
7%
(2/28)
Correctly Identified Study Population 91%
(53/58)
9%
(5/58)
Valid Sampling Techniques (if sampling was used) 98%
(41/42)
2%
(1/42)
Accurate/Complete Data Collection 99%
(82/83)
1%
(1/83)
Design Total 97%
(279/288)
3%
(9/288)
Implementation
Sufficient Data Analysis and Interpretation of Results 76%
66/87
24%
21/87
Appropriate Improvement Strategies 53%
20/38
47%
18/38
Implementation Total 69%
86/125
31%
39/125
Outcomes
Real Improvement Achieved 48%
19/40
53%
21/40
Sustained Improvement Achieved 50%
1/2
50%
1/2
Outcomes Total 48%
20/42
52%
22/42
Percentage of Applicable Evaluation Elements Scored Met 85%
(385/455)
Overall, 85 percent of the evaluation elements across all 10 PIPs received a Met score. WellCare
demonstrated a strong performance in the Design stage; however, the CMO was considerably
less successful in the Implementation and Outcomes stages. The following subsections highlight
HSAG’s validation findings associated with each of the three PIP stages.
Design
WellCare met 97 percent of the requirements across all 10 PIPs for the six activities within the
Design stage. The technical design of each PIP was sufficient to measure and monitor PIP

FINDINGS
WellCare of Georgia, Inc. SFY 2015 PIP Validation Report WellCare_GASFY2015_CMO_PIP-Val_Report_F2_1114 State of Georgia Health Services Advisory Group, Inc.
Page 2-3
outcomes. The solid foundation of the PIPs allowed for the CMO to progress to the next stage of
the PIP process.
Implementation
WellCare met 69 percent of the requirements for the two activities within the Implementation
stage. The CMO did not report accurate data components in some of its PIPs, and not all of the
statistical testing performed was completely accurate. Additionally, the CMO did not report an
adequate and data-driven barrier identification process. The PIPs did not include specific data or
analysis results to support identified barriers, and barriers were not prioritized. The PIPs also did
not include evaluations of effectiveness for each intervention, and evaluation results were not
reported. Overall, the improvement strategies were not successful in achieving statistically
significant improvement across all study indicators for all PIPs and for sustaining any
improvement achieved.
Outcomes
This year, all 10 PIPs were evaluated for achieving statistically significant improvement over
baseline. Three PIPs, Adolescent Well-Care Visits, Childhood Immunizations—Combo 10, and
Childhood Obesity achieved statistically significant improvement over baseline for all indicators
at the current measurement period. Two of those PIPs, Adolescent Well-Care Visits and
Childhood Immunizations—Combo 10 progressed to the point of being assessed for sustained
improvement with mixed results. Sustained improvement is defined as statistically significant
improvement in performance over baseline that is maintained or increased for at least one
subsequent measurement period. Additionally, the results of the most current measurement
period must reflect improvement when compared to baseline results. While the Childhood
Immunizations—Combo 10 study indicator demonstrated sustained improvement, the Adolescent
Well-Care Visits study indicator demonstrated a statistically significant decline in performance,
resulting in a lack of sustained improvement over baseline.
PIP-Specific Outcomes
Analysis of Results
Each table below displays the study indicator rates for each measurement period of the PIP,
including the baseline period and each subsequent measurement period. Statistically significant
changes between remeasurement periods are noted with an upward or downward arrow followed by
an asterisk. Statistical significance is based on the p value calculated from a statistical test comparing
measurement period rates. Differences in these rates that resulted in a p value less than 0.05 were
considered statistically significant. Please note that it is possible for a percentage point difference
between measurement period rates to appear large without being statistically significant. In
certain instances, the study indicator denominators may not be large enough to have sufficient
power to detect statistically significant difference. Similarly, the reverse may also occur: a small
percentage point difference between measurement period rates with large denominators may

FINDINGS
WellCare of Georgia, Inc. SFY 2015 PIP Validation Report WellCare_GASFY2015_CMO_PIP-Val_Report_F2_1114 State of Georgia Health Services Advisory Group, Inc.
Page 2-4
result in a small percentage point difference that is statistically significant because larger
denominators have greater power to detect statistically significant differences.
If the PIP achieved statistically significant improvement over the baseline rate during a previous
measurement period, it was then reviewed for sustained improvement. Additionally, the most current
measurement period’s results must reflect statistically significant improvement when compared to
the baseline results for all study indicators. PIPs that did not achieve statistically significant
improvement (i.e., did not meet the criteria to be assessed for sustained improvement) were not
assessed (NA). Comparisons of study indicator results that utilized HEDIS measures were made
using the Medicaid HEDIS 2012 Audit, Means, Percentiles, and Ratios (reflecting the 2011
calendar year [CY]).
WellCare was not successful in achieving the desired outcomes for all study indicators. Only three
PIPs achieved statistically significant improvement over baseline across all study indicators, and
only one PIP demonstrated sustained improvement over baseline.
The identification of barriers through barrier analysis, the selection of appropriate interventions
to address identified barriers, and the ongoing evaluation of intervention effectiveness are
necessary steps to improve outcomes. WellCare’s processes for causal/barrier analysis,
intervention implementation, and intervention evaluations are all essential to the overall success
of the PIPs. Deficiencies were identified during the validation process in each of these areas and
will be explained in further detail below.
Adolescent Well-Care
Table 2-3—Performance Improvement Project Outcomes for Adolescent Well-Care Visits
Study Indicator Baseline Period
(1/1/11–12/31/11)
Remeasurement 1
(1/1/12–12/31/12)
Remeasurement 2
(1/1/13–12/31/13)
Sustained Improvement^
The percentage of members 12–21
years of age who had at least one
comprehensive well-care visit with a
PCP or an OB/GYN practitioner
during the measurement year.
41.4% 51.6%*
43.8%*
No
* Designates statistically significant improvement over the prior measurement period (p value < 0.05).
* Designates statistically significant decline from the prior measurement period (p value < 0.05).
^ Sustained improvement is defined as statistically significant improvement in performance over baseline for all study indicators
that is maintained or increased for at least one subsequent measurement period. Additionally, the most current measurement
period’s results must reflect statistically significant improvement when compared to the baseline results for all study indicators.
There was a statistically significant decline in the study indicator rate from Remeasurement 1 to
Remeasurement 2 for the Adolescent Well-Care Visits PIP. The percentage of eligible adolescent
members who had at least one well-care visit during the measurement year declined 7.8
percentage points. The Remeasurement 2 rate was no longer a statistically significant
improvement over the baseline rate; therefore, the PIP did not demonstrate sustained

FINDINGS
WellCare of Georgia, Inc. SFY 2015 PIP Validation Report WellCare_GASFY2015_CMO_PIP-Val_Report_F2_1114 State of Georgia Health Services Advisory Group, Inc.
Page 2-5
improvement. The Remeasurement 2 rate fell below the 2013 DCH target of 49.7 percent and
was between the 25th and 50th percentiles of the national Medicaid HEDIS 2012 rates.
A critical analysis of WellCare’s improvement processes revealed several factors contributing to
the performance decline. The CMO’s Utilization Management Medical Advisory Committee
(UMAC) and Quality Improvement Committee (QIC) met quarterly to identify and address
barriers. The CMO used a fishbone diagram to summarize identified barriers; however, WellCare
did not describe the process used to identify or prioritize barriers for intervention. Specific data
to support the barriers were not documented in the PIP.
WellCare continued ongoing interventions to address member and provider awareness of when
an adolescent well-care appointment was due. The CMO revised one intervention for CY 2013,
extending the hours of operation for the Centralized Telephonic Outreach outbound call unit to
7:00 p.m., in order to reach members after normal business hours and provide assistance with
scheduling well-care appointments.
The ongoing interventions that the CMO continued during CY 2013 were:
Telephone outreach to educate members on the importance of adolescent well-care visits and
schedule appointments.
Targeted Health Check schedule reminder letters sent at 120 days of plan enrollment and
during the member’s birthday month.
Monthly provider membership lists that specified children eligible for health check visits
who had not had an encounter within 120 days of joining the health plan or were not in
compliance with the Health Check Program.
While WellCare initiated new interventions following the performance decline in
Remeasurement 2, and reinstated the provider incentive program, the CMO did not describe the
analysis results or processes used to guide decisions about making these changes. WellCare did
not document any processes to evaluate the effectiveness of each intervention or any evaluation
results. Without intervention-specific evaluations, the CMO does not have the information
necessary to fully assess the causes for the decline in adolescent well-care visits. Quantitative
assessment of each intervention is necessary to determine if interventions are being implemented
effectively and to identify which strategies are having the greatest positive impact on targeted
outcomes.

FINDINGS
WellCare of Georgia, Inc. SFY 2015 PIP Validation Report WellCare_GASFY2015_CMO_PIP-Val_Report_F2_1114 State of Georgia Health Services Advisory Group, Inc.
Page 2-6
Annual Dental Visits
Table 2-4—Performance Improvement Project Outcomes for Annual Dental Visits
Study Indicator Baseline
(10/1/2011–9/30/2012) Remeasurement 1
(10/1/2012–9/30/2013)
Sustained Improvement^
1. The percentage of EPSDT eligible members
ages 1–20 who received any dental services
during the measurement period (CMS 416 12A).
63.8% 64.7%* NA
2. The percentage of EPSDT eligible members
ages 1–20 who received preventive dental
services during the measurement period (CMS
416 12B).
59.6% 45.4%* NA
3. The percentage of EPSDT eligible members
ages 6–9 who received preventive dental
services during the measurement period (CMS
416 12D).
16.7% 16.1%* NA
* Designates statistically significant improvement over the prior measurement period (p value < 0.05).
* Designates statistically significant decline over the prior measurement period (p value < 0.05).
NA Statistically significant improvement over baseline and a subsequent measurement must occur for all study indicators before
sustained improvement can be assessed.
^ Sustained improvement is defined as statistically significant improvement in performance over baseline for all study indicators
that is maintained or increased for at least one subsequent measurement period. Additionally, the most current measurement
period’s results must reflect statistically significant improvement when compared to the baseline results for all study indicators.
The study indicators demonstrated mixed results for the first remeasurement of WellCare’s
Annual Dental Visits PIP. There was a statistically significant increase in the rate for Study
Indicator 1 (any dental service) but a statistically significant decline in the rates for Study
Indicators 2 (preventive dental services) and 3 (dental sealant services). The Remeasurement 1
rate for Study Indicator 2 was also 12.6 percentage points below the 2013 DCH target rate of
58.0 percent.
A critical review of WellCare’s quality improvement processes and strategies identified several
reasons for the mixed study indicator performance.
The CMO documented that barriers were identified through a collaborative approach
including a drill-down analysis of the baseline data. WellCare summarized system, member,
and provider barriers in a fishbone diagram. The PIP documentation, however, did not
include any data to support identified barriers, and no specific step-by-step process was
described for the causal/barrier analysis. Additionally, priority barriers were not identified in
the PIP.
WellCare did not adequately describe the interventions implemented for the PIP. Based on
the documentation provided, some interventions, such as the case manager program and the
community outreach program, were system interventions. Other interventions, such as the
mailed member reminders and mailed noncompliant lists for providers, were not system
changes likely to result in improvement of long-term outcomes.

FINDINGS
WellCare of Georgia, Inc. SFY 2015 PIP Validation Report WellCare_GASFY2015_CMO_PIP-Val_Report_F2_1114 State of Georgia Health Services Advisory Group, Inc.
Page 2-7
The CMO did not document any monitoring or evaluation of ongoing interventions.
WellCare had no documented evaluation process, nor did it have results of evaluating the
effectiveness for each intervention.
It is critical that WellCare implement and document processes to evaluate the effectiveness of
each implemented intervention. To address the varied study indicator results, it is necessary to
examine each intervention to determine if it is impacting some of the study indicators but not
others. The CMO should conduct further drill-down analyses to determine the root causes of
noncompliance with the CMS 416 dental measures. Attention should be paid to the differences
between the three study indicators to determine why interventions positively impacted Study
Indicator 1 but resulted in declines in Study Indicators 2 and 3.
Appropriate Use of ADHD Medications
Table 2-5—Performance Improvement Project Outcomes for Appropriate Use of ADHD Medications
Study Indicator Baseline Period
(1/1/11–12/31/11)
Remeasurement 1
(1/1/12–12/31/12)
Remeasurement 2
(1/1/13–12/31/13)
Sustained Improvement^
1. The percentage of members 6–12 years
of age as of the Index Prescription Start
Date (IPSD) with an ambulatory
prescription dispensed for ADHD
medication, who had one follow-up
visit with a practitioner with prescribing
authority during the 30-day Initiation
Phase.
40.0% 39.4% 41.1%* NA
2. The percentage of members 6–12 years
of age as of the Index Prescription Start
Date (IPSD) with an ambulatory
prescription dispensed for ADHD
medication, who remained on the
medication for at least 210 days and
who, in addition to the visit in the
Initiation Phase, had at least two
follow-up visits with a practitioner from
31–300 days following the IPSD. One
of the two visits (during days 31–300)
may be a telephone visit with a
practitioner.
54.6% 53.1% 54.2% NA
* Designates statistically significant improvement over the prior measurement period (p value < 0.05).
NA Statistically significant improvement over baseline and a subsequent measurement must occur for all study indicators before sustained
improvement can be assessed.
^ Sustained improvement is defined as statistically significant improvement in performance over baseline for all study indicators that is
maintained or increased for at least one subsequent measurement period. Additionally, the most current measurement period’s results
must reflect statistically significant improvement when compared to the baseline results for all study indicators.
At the second remeasurement for WellCare’s Appropriate Use of ADHD Medications PIP,
neither study indicator achieved statistically significant improvement over baseline. The
Remeasurement 2 rate for Study Indicator 1 (follow-up visits for the initiation phase) was a

FINDINGS
WellCare of Georgia, Inc. SFY 2015 PIP Validation Report WellCare_GASFY2015_CMO_PIP-Val_Report_F2_1114 State of Georgia Health Services Advisory Group, Inc.
Page 2-8
statistically significant improvement over Remeasurement 1 but not over baseline. The
Remeasurement 2 rate for Study Indicator 2 (follow-up visits for the continuation phase) was a
non-statistically significant improvement over Remeasurement 1, and the rate remained below
baseline. The Remeasurement 2 rates for Study Indicators 1 and 2 fell below the CY 2013 DCH
targets of 52.5 percent and 63.1 percent, respectively. In comparison with the national Medicaid
HEDIS 2012 rates, the Remeasurement 2 rates for both study indicators fell between the 50th
and 75th percentile rates.
A critical examination of WellCare’s improvement processes and strategies determined several
factors related to the lack of significant improvement in the study indicators for the Appropriate
Use of ADHD Medications PIP.
The CMO documented that ―member and provider correspondence, data analysis, and
process review‖ were used to identify barriers; however, the CMO did not report specific
data or analysis results to support identified barriers. The CMO also did not identify priority
barriers for the PIP. To thoroughly evaluate the root causes of noncompliance with ADHD
follow-up visits, WellCare should have documented specific member/provider feedback,
results from the survey of a sample of noncompliant members, and results from drill-down
analyses for specific providers.
To address member and provider awareness of the ADHD medication follow-up visit
requirements, WellCare completed a number of educational and reminder mailings to
members and providers. The mailings identified due follow-up visits and shared best
practices. In addition to mailings, the CMO completed face-to-face visits with high-volume
ADHD providers to review lists of noncompliant members and discuss best practices for
completing timely follow-up visits.
Despite the lack of significant improvement over baseline for the study indicator rates, the
CMO documented that it would be continuing all interventions but provided no evaluation
data to support this decision.
Given the lack of significant improvement in outcomes, HSAG recommends that WellCare re-
evaluate its quality improvement processes, focusing on the documentation of data-driven
analyses and results. The CMO should provide data to support identified barriers, and a detailed
description of how the barriers were prioritized and how they were linked to the interventions.
WellCare should also have processes in place to evaluate the effectiveness of each implemented
intervention, and combine evaluation results with causal/barrier drill-down analyses to illuminate
the true root causes of the lack of significant improvement in outcomes. New or revised
improvement strategies should be planned and implemented based on these follow-up analyses.

FINDINGS
WellCare of Georgia, Inc. SFY 2015 PIP Validation Report WellCare_GASFY2015_CMO_PIP-Val_Report_F2_1114 State of Georgia Health Services Advisory Group, Inc.
Page 2-9
Childhood Immunizations—Combo 10
Table 2-6—Performance Improvement Project Outcomes for Childhood Immunizations—Combo 10
Study Indicator Baseline Period
(1/1/11–12/31/11)
Remeasurement 1
(1/1/12–12/31/12)
Remeasurement 2
(1/1/13–12/31/13)
Sustained Improvement^
The percentage of children 2 years of age
who had four diphtheria, tetanus and
acellular pertussis (DTap); three polio
(IPV); one measles, mumps, rubella
(MMR); three H influenza type B (HiB);
three hepatitis B (HepB); one chicken pox
(VZV); four pneumococcal conjugate
(PCV); one hepatitis A (HepA); two or
three rotavirus (RV); and two influenza
(flu) vaccines by their second birthday.
20.2% 38.4%*
40.3% Yes
* Designates statistically significant improvement over the prior measurement period (p value < 0.05).
^ Sustained improvement is defined as statistically significant improvement in performance over baseline for all study indicators that is
maintained or increased for at least one subsequent measurement period. Additionally, the most current measurement period’s results
must reflect statistically significant improvement when compared to the baseline results for all study indicators.
WellCare demonstrated sustained improvement in the Childhood Immunizations—Combo 10
PIP, with an increase of 20.1 percentage points from baseline to Remeasurement 2 in the rate of
eligible child members who received the recommended vaccinations by their second birthday.
The Remeasurement 2 rate of 40.3 percent exceeded the 90th percentile of the national Medicaid
HEDIS 2012 rates.
WellCare’s collaborative PIP team identified barriers and developed member, provider, and
plan-level interventions through data analysis and process review. The CMO documented
barriers such as members refusing assistance with appointments, member lack of awareness
regarding immunization schedule, and lack of provider awareness of HEDIS requirements.
To address these barriers, WellCare implemented the following interventions:
Pay for Performance (P4P) provider face-to-face visits to deliver lists of noncompliant
members.
Member incentive program for completed immunization visits.
Outbound member reminder calls.
Centralized telephonic outreach program with extended operating hours beyond normal
business hours.
Inbound care gap alert program to facilitate scheduling of visits for needed services when a
member calls.
Targeted periodicity letters sent to members annually.
Targeted 120-day provider reminder letters with a list of noncompliant members.
HEDIS Toolkits distributed during P4P visits.

FINDINGS
WellCare of Georgia, Inc. SFY 2015 PIP Validation Report WellCare_GASFY2015_CMO_PIP-Val_Report_F2_1114 State of Georgia Health Services Advisory Group, Inc.
Page 2-10
Although the study indicator demonstrated sustained improvement, the CMO failed to document
intervention evaluations. The PIP documentation included neither detail on methods for
evaluating intervention effectiveness nor evaluation results. To maintain and continue to improve
the Childhood Immunizations—Combo 10 study indicator rate, WellCare must implement
ongoing, intervention-specific evaluations, based on quality improvement science, such as the
Plan-Do-Study-Act (PDSA) cycle. Each intervention should be evaluated for effectiveness, and
evaluation processes and results should be documented in the PIP and linked to decisions about
future implementation.
Childhood Obesity
Table 2-7—Performance Improvement Project Outcomes
For Childhood Obesity
Study Indicator Baseline Period
(1/1/09–12/31/09)
Remeasurement 1
(1/1/10–12/31/10)
Remeasurement 2
(1/1/11–12/31/11)
Remeasurement 3
(1/1/12–12/31/12)
Remeasurement 4
(1/1/13–12/31/13)
Sustained Improvement^
The percentage of
members 3–17 years
of age who had an
outpatient visit with a
PCP or OB/GYN and
who had evidence of
BMI percentile
documentation.
36.5% 30.4% 56.9%*
38.7%*
49.1%*
NA
The percentage of
members 3–17 years
of age who had an
outpatient visit with a
PCP or OB/GYN and
who had evidence of
counseling for
nutrition.
42.3% 48.9% 50.4%*
55.5% 61.1% NA
The percentage of
members 3–17 years
of age who had an
outpatient visit with a
PCP or OB/GYN and
who had evidence of
counseling for
physical activity.
38.7% 30.9%*
37.0% 42.1% 51.9%*
NA
NA Statistically significant improvement over baseline and a subsequent measurement must occur for all study indicators before sustained
improvement can be assessed.
* Designates statistically significant improvement over the prior measurement period (p value < 0.05).
* Designates statistically significant decline in performance over the prior measurement period (p value < 0.05).
^ Sustained improvement is defined as statistically significant improvement in performance over baseline for all study indicators that is maintained
or increased for at least one subsequent measurement period. Additionally, the most current measurement period’s results must reflect statistically
significant improvement when compared to the baseline results for all study indicators.

FINDINGS
WellCare of Georgia, Inc. SFY 2015 PIP Validation Report WellCare_GASFY2015_CMO_PIP-Val_Report_F2_1114 State of Georgia Health Services Advisory Group, Inc.
Page 2-11
All three study indicators for the Childhood Obesity PIP demonstrated improvements from
Remeasurement 3 to Remeasurement 4, with the improvements for Study Indicators 1 (BMI
percentile documentation) and 3 (evidence of counseling for physical activity) being statistically
significant. Additionally, Study Indicator 3 demonstrated statistically significant improvement
over baseline for the first time at Remeasurement 4. The Remeasurement 4 rates for all three
study indicators—BMI percentile documentation, evidence of nutrition counseling, and evidence
of physical activity counseling—exceeded the CY 2013 DCH target rates of 47.5 percent, 54.9
percent, and 43.3 percent, respectively. In comparison with the national Medicaid HEDIS 2012
benchmarks, WellCare’s CY 2013 rates for all three study indicators were between their
respective 50th percentile and 75th percentile rates.
For the Childhood Obesity PIP, WellCare gathered input from several sources: quarterly UMAC
and QIC meetings; bimonthly HEDIS Steering Committee meetings; and staff input from
member outreach, provider relations, and quality improvement departments. The CMO identified
barriers through member and provider feedback, data analysis, and process review. Barriers
documented in a fishbone diagram included the following: members not attending well-care
visits during the measurement period, lack of provider awareness of documentation
requirements, insufficient time for provider to meet documentation requirements, and lack of
reimbursement for current procedural terminology (CPT) II codes.
To address these barriers, WellCare implemented the following interventions:
Outreach to 13,732 members ages 3–6 years, reminding them of due well-child visits.
Distribution of postcards outlining the Weight Assessment and Counseling for Nutrition and
Physical Activity for Children/Adolescents (WCC) measures to providers at a pediatric
conference.
Distribution of a DCH-approved BMI percentile documentation form for providers via their
provider Web site and through fax.
E-mail communication with independent practice associations (IPAs), providing BMI
percentile forms and WCC postcards.
Targeted face-to-face pediatric provider visits requesting the use of CPT II codes to
document WCC services, despite the lack of reimbursement for these codes.
The CMO documented the evaluation of effectiveness for some interventions. One intervention,
face-to-face provider visits requesting the use of CPT II codes, had a documented quantitative
evaluation in which the CMO reported, "The providers that were asked to utilize the CPT II
codes had higher rates of compliance for WCC than the providers who did not have a face-to-
face visit." This type of evaluation should be conducted and documented for each intervention.
Documentation of evaluation results should include the specific subgroup rates compared as part
of an evaluation. For example, for the provider visit intervention, the CMO should report the rate
among providers who received the visit versus the rate among providers who did not receive the
visit.

FINDINGS
WellCare of Georgia, Inc. SFY 2015 PIP Validation Report WellCare_GASFY2015_CMO_PIP-Val_Report_F2_1114 State of Georgia Health Services Advisory Group, Inc.
Page 2-12
Comprehensive Diabetes Care
Table 2-8—Performance Improvement Project Outcomes for Comprehensive Diabetes Care
Study Indicator Baseline Period
(1/1/11–12/31/11)
Remeasurement 1
(1/1/12–12/31/12)
Remeasurement 2
(1/1/13–12/31/13)
Sustained Improvement^
The percentage of members 18–75
years of age with diabetes (type 1 and
type 2) who had an HbA1c control <
7.0%.
32.4% 32.4% 30.1% NA
The percentage of members 18–75
years of age with diabetes (type 1 and
type 2) who had a LDL-C control <
100mg/ml.
25.2% 28.1% 28.9% NA
The percentage of members 18–75
years of age with diabetes (type 1 and
type 2) who had a BP control <
140/90 mmHg.
51.6% 51.6% 56.9% NA
NA Statistically significant improvement over baseline and a subsequent measurement must occur for all study indicators before sustained
improvement can be assessed.
^ Sustained improvement is defined as statistically significant improvement in performance over baseline for all study indicators that is
maintained or increased for at least one subsequent measurement period. Additionally, the most current measurement period’s results
must reflect statistically significant improvement when compared to the baseline results for all study indicators.
There were no statistically significant changes in the study indicator rates at Remeasurement 2
for the Comprehensive Diabetes Care PIP. The rate for Study Indicator 1 (HbA1c control <
7.0%) decreased by 2.3 percentage points, the rate for Study Indicator 2 (LDL-C control < 100
mg/ml) increased by 0.8 percentage point, and Study Indicator 3 (BP control < 140/90 mmHg)
increased by 5.3 percentage points. The CMO’s rates fell below the CY 2013 DCH goals of 36.7
percent (HbA1c control < 7.0%), 35.9 percent (LDL-C control < 100 mg/ml), and 63.5 percent
(BP control < 140/90 mmHg), respectively. The rate for Study Indicator 1 fell below the 25th
percentile of the national Medicaid HEDIS 2012 rates, and the rates for Study Indicators 2 and 3
were slightly higher than the 25th percentile.
A critical review of WellCare’s quality improvement processes revealed several factors that
contributed to a lack of significant improvement in the study indicators.
The CMO summarized barriers using a fishbone diagram; however, the PIP documentation did
not include any quantitative data or specific data analysis results to support the identified
barriers. The fishbone diagram included the following barriers: lack of member willingness,
awareness, and skills to manage diabetes; lack of provider awareness of HEDIS requirements;
lack of provider awareness of member noncompliance; inaccurate contact information for
diabetic patients; and lack of provider incentive. WellCare did not describe a process for
identifying high-priority barriers and did not rank barriers in order of priority.
WellCare implemented both member- and provider-focused interventions based on its
causal/barrier analysis findings. The CMO implemented the following interventions:

FINDINGS
WellCare of Georgia, Inc. SFY 2015 PIP Validation Report WellCare_GASFY2015_CMO_PIP-Val_Report_F2_1114 State of Georgia Health Services Advisory Group, Inc.
Page 2-13
Laboratory follow-up by the QI Department to determine results of laboratory tests listed on
the quarterly ―labs with no result‖ lists.
Distribution of noncompliant member lists to provider offices.
HEDIS Education Screening Program—WellCare identified members with a care gap during
the calendar year based on claims data. Registered nurses (RNs) across the company
contacted those diabetic members with care gaps. During the call, the nurse provided
education and assisted with making an appointment to visit the provider’s office.
A HEDIS care gap database and tracking tool, which alerts WellCare staff of any due/past
due services during inbound/outbound telephone contact with the member.
Training on glucometer use for members enrolled in the disease management program.
Enhanced care plans implemented by the disease management program to support more
individualized care and education, resulting in better self-management. These plans
incorporate member-identified needs and identify specific, measurable, attainable, relevant,
and time-bound (SMART) goals to facilitate self-management. The plans are shared with the
member’s provider.
Contracted with AVESIS, an external vendor, to increase outreach capability through
telephone calls and postcards.
While WellCare reported the implementation status of each intervention, the CMO did not
document any intervention-specific results used to guide decisions about continuing or
discontinuing the interventions. The documentation did not include any evaluation methods or
results for the interventions. Although the PIP documentation included an additional intervention
table with an "Analysis" column, the documentation in this column did not describe any
evaluation linking intervention implementation to study indicator performance. Each
intervention should be accompanied by an effectiveness evaluation, with methods and
quantitative results documented in the PIP.

FINDINGS
WellCare of Georgia, Inc. SFY 2015 PIP Validation Report WellCare_GASFY2015_CMO_PIP-Val_Report_F2_1114 State of Georgia Health Services Advisory Group, Inc.
Page 2-14
Avoidable Emergency Room Visits
Table 2-9—Performance Improvement Project Outcomes for Avoidable Emergency Room Visits
Study Indicator Baseline Period
(1/1/11–12/31/11)
Remeasurement 1
(1/1/12–12/31/12)
Remeasurement 2
(1/1/13–12/31/13)
Sustained Improvement^
1. The percentage of ER visits for
―avoidable‖ diagnoses (dx382–Acute
Suppurative otitis:382.9–Unspecified
otitis:462–Acute pharyngitis:465.9–Acute
upper respiratory infection:466 –Acute
bronchitis:786.2–Cough) among
members under 21 years of age who had
a visit to the ED in three selected
Children’s Healthcare of Atlanta facilities
in the Atlanta region.
12.1% 14.8% 15.0% NA
Study Indicator Baseline Period
(1/1/13–12/31/13)
Remeasurement 1
(1/1/14–12/31/14)
Remeasurement 2
(1/1/15–12/31/15)
Sustained Improvement^
2. The percentage of ER visits for
―avoidable‖ diagnoses (dx382–Acute
Suppurative otitis: 382.9–Unspecified
otitis: 462–Acute pharyngitis: 465.9–
Acute upper respiratory infection: 466 –
Acute bronchitis: 786.2–Cough) among
members under 21 years of age who had
a visit to the ED in selected hospitals in
the CMO’s expansion population.*
* NA
* The CMO did not report baseline data for Study Indicator 2.
NA Statistically significant improvement over baseline and a subsequent measurement must occur for all study indicators before sustained
improvement can be assessed.
^ Sustained improvement is defined as statistically significant improvement in performance over baseline for all study indicators that is
maintained or increased for at least one subsequent measurement period. Additionally, the most current measurement period’s results
must reflect statistically significant improvement when compared to the baseline results for all study indicators.
In CY 2013, for the Avoidable Emergency Room Visits PIP, WellCare collected Remeasurement
2 data for Study Indicator 1, the percentage of ER visits for avoidable diagnoses in select
facilities in the Atlanta region. The CMO should have also collected baseline data for Study
Indicator 2 (the percentage of ER visits for avoidable diagnoses in select hospitals in the CMO’s
expansion population) during CY 2013; however, WellCare did not report baseline data for
Study Indicator 2. The rate for Study Indicator 1 increased from baseline to Remeasurement 1
and from Remeasurement 1 to Remeasurement 2. Because the avoidable ER visits rate was an
inverse study indicator, for which a lower rate is better, the increases from baseline to
Remeasurement 2 demonstrated a decline in performance.
A critical analysis of WellCare’s improvement strategies identified several shortcomings in the
PIP that resulted in a lack of improvement. The CMO’s UMAC, QIC, and HEDIS Steering
Committee collaborated to identify barriers. Barriers were summarized in a fishbone diagram;
high-priority barriers were not distinguished in the PIP documentation. As with other WellCare
PIPs, no analysis results or quantitative data to support the barriers were identified for the
FINDINGS
WellCare of Georgia, Inc. SFY 2015 PIP Validation Report WellCare_GASFY2015_CMO_PIP-Val_Report_F2_1114 State of Georgia Health Services Advisory Group, Inc.
Page 2-15
Avoidable Emergency Room Visits PIP. The identified barriers included: lack of provider
awareness of member emergency room (ER) visits, providers not offering members guidance on
handling after-hours care needs, lack of member awareness of after-hours and urgent care
facilities, and lack of member understanding of what conditions warrant an ER visit.
To address provider-based barriers, the CMO conducted a Webinar with providers to discuss the
Avoidable Emergency Room Visits PIP and increase provider awareness of member ER usage.
WellCare implemented three member-focused interventions including:
Targeted distribution to members of a ―Before the ER‖ step-by-step plan for when an
emergency occurs.
Step 1: PCP information and a list of conditions appropriate for PCP care.
Step 2: Nurse advice line information and Web site to identify nearby urgent care
facilities.
Step 3: Local urgent care facility information.
Step 4: Local ER facility information and a list of life-threatening conditions that warrant
an ER visit.
Distribution of ―ER Tool Kits‖ through high-volume provider practices, to enhance member
knowledge of when and where to seek urgent versus emergent care. The tool kits included:
Centers for Disease Control and Prevention (CDC) ―Get Smart‖ materials: posters,
prescription pads, and brochures.
Pre-populated flyers and posters providing office hours, local urgent care facility
information, and local pharmacy information.
Materials providing advice for seeking care after-hours.
Targeted outreach to members who visited the ER. Members were educated on their PCP
contact information, benefits such as the nurse advice line, and what conditions warrant an
ER visit. High ER utilizers were referred to field short-term case management and, when
appropriate, members were referred to complex case management.
As WellCare did not report baseline data for the correct Study Indicator 2 (the percentage of ER
visits for avoidable diagnoses in select hospitals in the CMO’s expansion population), the CMO
did not document any interventions that were tailored to the expansion population.
WellCare provided insufficient information on the impact of the interventions on the PIP
outcomes. The CMO did not fully document evaluation processes and results used to evaluate
intervention effectiveness. While the CMO provided some qualitative information about how the
interventions were received by providers and how some interventions would be revised, the PIP
documentation did not include any quantitative evaluation results. Additionally, the CMO
provided no information on how the impact of one intervention, the ―Before the ER‖ step-by-
step member plan, was assessed and whether or not this strategy would be continued. HSAG
recommends WellCare investigate the reasons for the repeated decline in study indicator
performance and, based on drill-down analyses and intervention-specific evaluation, identify and
implement new strategies to improve performance.

FINDINGS
WellCare of Georgia, Inc. SFY 2015 PIP Validation Report WellCare_GASFY2015_CMO_PIP-Val_Report_F2_1114 State of Georgia Health Services Advisory Group, Inc.
Page 2-16
Member Satisfaction
Table 2-10—Performance Improvement Project Outcomes for Member Satisfaction
Study Indicator Baseline Period
(1/1/13–5/31/13)
Remeasurement 1
(1/1/14–5/31/14)
Sustained Improvement^
The percentage of respondents who rate the health plan an
8, 9, or 10 in response to the question ―Using any number
from 0–10, where 0 is the worst health plan and 10 is the
best, what number would you use to rate your child’s health
plan?‖
88.3% 87.5% NA
NA Statistically significant improvement over baseline and a subsequent measurement must occur for all study indicators before sustained
improvement can be assessed.
^ Sustained improvement is defined as statistically significant improvement in performance over baseline for all study indicators that is
maintained or increased for at least one subsequent measurement period. Additionally, the most current measurement period’s results must
reflect statistically significant improvement when compared to the baseline results for all study indicators.
At the first remeasurement for the Member Satisfaction PIP, WellCare reported a decline in the
rate of member satisfaction. The rate of respondents giving WellCare a score of ―8‖ or higher
declined 0.8 percentage point from baseline to Remeasurement 1.
A critical assessment of the improvement strategies WellCare used for the Member Satisfaction
PIP suggested several factors that contributed to the lack of improvement demonstrated at the
first remeasurement. WellCare documented the involvement of its UMAC, QIC, HEDIS Steering
Committee, and CAHPS Committee in the causal/barrier analysis process for the Member
Satisfaction PIP. The committees identified barriers through data analysis and process review.
The CMO used a Force Field Analysis to summarize identified barriers and interventions.
The CMO continued the following ongoing interventions:
To address member care gaps, WellCare implemented HEDIS Tool Kits to provide member-
centric talking points to Community Relations staff and outreach nurses who contact
members identified as having due/past due services.
To address a lack of in-network providers and specialists, WellCare continued year-round
provider recruiting, worked with a vendor to identify specialists contracted with other payors,
launched a partnership to provide telemedicine services, and removed prior authorization
requirements for most procedures.
To address WellCare not being a strong presence in the community, the CMO implemented
Enhanced Community Outreach, a collaborative relationship with community advocacy
partners.
Lack of member awareness of recent CMO improvements
Member opinion of Customer Service courtesy and respect
The CMO initiated four interventions during CY 2013, which included:
Increased the number of open provider panels by 20 percent to enhance member access to
providers.

FINDINGS
WellCare of Georgia, Inc. SFY 2015 PIP Validation Report WellCare_GASFY2015_CMO_PIP-Val_Report_F2_1114 State of Georgia Health Services Advisory Group, Inc.
Page 2-17
Sent out a letter to members to increase awareness of the changes WellCare implemented in
order to improve member satisfaction.
Provided ―soft skill‖ training to customer service staff to meet members’ expectations of
courtesy and respect.
Launched a series of member mailings to change member perceptions of the CMO’s services.
Despite the many documented interventions, WellCare did not achieve improvement in overall
member satisfaction. The CMO documented that the interventions would be discussed by the
CAHPS Committee, in relation to the Remeasurement 1 results; however, WellCare did not
document any planned or implemented intervention revisions. HSAG recommends that the CMO
determine an evaluation plan for each intervention and document evaluation results as part of the
PIP. The evaluation results should be used to guide the CMO's decisions to continue, expand,
revise, or abandon interventions.
Postpartum Care
Table 2-11—Performance Improvement Project Outcomes for Postpartum Care
Study Indicator Baseline
(1/1/12–12/31/12)
Remeasurement 1
(1/1/13–12/31/13) Sustained
Improvement^
The percentage of deliveries of live births by
members that were followed by a postpartum visit
on or between 21 and 56 days after delivery.
62.5% 63.2% NA
NA Statistically significant improvement over baseline and a subsequent measurement must occur for all study indicators before
sustained improvement can be assessed.
^ Sustained improvement is defined as statistically significant improvement in performance over baseline for all study
indicators that is maintained or increased for at least one subsequent measurement period. Additionally, the most current
measurement period’s results must reflect statistically significant improvement when compared to the baseline results for all
study indicators.
For the first remeasurement of the Postpartum Care PIP, WellCare reported a non-statistically
significant improvement of 0.7 percentage point. The Remeasurement 1 rate fell below the 2013
DCH target rate of 71.1 percent and below the 50th percentile of the national Medicaid HEDIS
2012 rates.
Critical examination of WellCare’s quality improvement processes identified several deficiencies
in the CMO’s approach, leading to a lack of statistically significant improvement in the study
indicator.
WellCare continued its practice of documenting barriers and interventions without providing
quantitative data or analysis results to support conclusions for the Postpartum Care PIP. The
CMO reported that it used a ―fishbone analysis‖ for the causal/barrier analysis; however, the
specific data and process used in this analysis were not identified. Additionally, no process for
prioritizing barriers was described, and high-priority barriers were not distinguished from other
barriers. Lastly, most of the interventions documented for the PIP were linked to barriers that

FINDINGS
WellCare of Georgia, Inc. SFY 2015 PIP Validation Report WellCare_GASFY2015_CMO_PIP-Val_Report_F2_1114 State of Georgia Health Services Advisory Group, Inc.
Page 2-18
were not listed on the fishbone diagram. The CMO documented the following interventions and
associated barriers:
To address lack of member awareness, WellCare implemented reminder calls for scheduled
postpartum appointments.
To provide members an incentive for completing a timely visit, the CMO offered a
―maternity rewards program.‖ Members could select a stroller or play yard after completion
of a timely postpartum visit.
To stress the importance of the postpartum visit, WellCare contracted with a vendor to
conduct comprehensive outreach to members during and after the pregnancy.
To address lack of coordination, WellCare issued a ―Welcome Home Report‖ for each
member recently discharged after delivery. Case managers and the High Risk Obstetrics
(OB) team used these reports to plan transitional interventions, including scheduling the
postpartum visit.
To address social service needs and facilitate coordination of care, the CMO facilitated
member outreach by OB social workers.
To provide integrated care and meet individual member needs, WellCare offered OB short-
term case management, which provided appropriate assessments and referrals.
The Community Relations department hosted postpartum events to promote the importance
of timely postpartum visits.
To address provider awareness of HEDIS specifications for the timing of the postpartum
visit, WellCare received assistance from the Obstetrics and Gynecology (OB/GYN) Society
to provide education to specialists.
WellCare provided insufficient information about the interventions implemented. The CMO
reported only the calendar year for the intervention implementation dates and did not provide
specific start dates; it was unclear whether interventions were implemented for only part of the
identified measurement period or for the entire year. Accurate and consistent documentation of
implementation dates is important as part of the process to evaluate intervention effectiveness.
Complete start and end dates allow the CMO to better link implementation of specific
interventions to changes in the study indicators. Beyond incomplete implementation dates,
WellCare failed to describe any evaluation methods or results for the Postpartum Care PIP
interventions. The CMO must document an evaluation specific to each intervention, as part of
ongoing causal/barrier analyses, to support data-driven decisions about future improvement
strategies that will promote statistically significant improvement in outcomes.
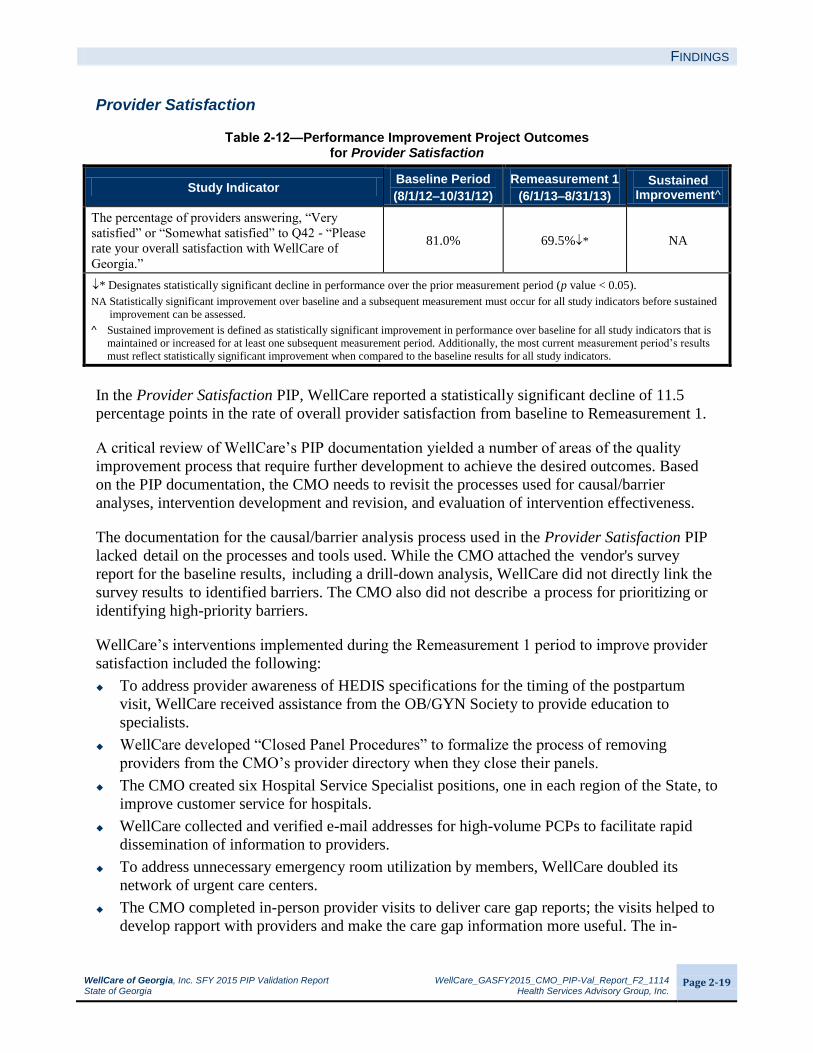
FINDINGS
WellCare of Georgia, Inc. SFY 2015 PIP Validation Report WellCare_GASFY2015_CMO_PIP-Val_Report_F2_1114 State of Georgia Health Services Advisory Group, Inc.
Page 2-19
Provider Satisfaction
Table 2-12—Performance Improvement Project Outcomes for Provider Satisfaction
Study Indicator Baseline Period
(8/1/12–10/31/12)
Remeasurement 1
(6/1/13–8/31/13)
Sustained Improvement^
The percentage of providers answering, ―Very
satisfied‖ or ―Somewhat satisfied‖ to Q42 - ―Please
rate your overall satisfaction with WellCare of
Georgia.‖
81.0% 69.5%* NA
* Designates statistically significant decline in performance over the prior measurement period (p value < 0.05).
NA Statistically significant improvement over baseline and a subsequent measurement must occur for all study indicators before sustained
improvement can be assessed.
^ Sustained improvement is defined as statistically significant improvement in performance over baseline for all study indicators that is
maintained or increased for at least one subsequent measurement period. Additionally, the most current measurement period’s results
must reflect statistically significant improvement when compared to the baseline results for all study indicators.
In the Provider Satisfaction PIP, WellCare reported a statistically significant decline of 11.5
percentage points in the rate of overall provider satisfaction from baseline to Remeasurement 1.
A critical review of WellCare’s PIP documentation yielded a number of areas of the quality
improvement process that require further development to achieve the desired outcomes. Based
on the PIP documentation, the CMO needs to revisit the processes used for causal/barrier
analyses, intervention development and revision, and evaluation of intervention effectiveness.
The documentation for the causal/barrier analysis process used in the Provider Satisfaction PIP
lacked detail on the processes and tools used. While the CMO attached the vendor's survey
report for the baseline results, including a drill-down analysis, WellCare did not directly link the
survey results to identified barriers. The CMO also did not describe a process for prioritizing or
identifying high-priority barriers.
WellCare’s interventions implemented during the Remeasurement 1 period to improve provider
satisfaction included the following:
To address provider awareness of HEDIS specifications for the timing of the postpartum
visit, WellCare received assistance from the OB/GYN Society to provide education to
specialists.
WellCare developed ―Closed Panel Procedures‖ to formalize the process of removing
providers from the CMO’s provider directory when they close their panels.
The CMO created six Hospital Service Specialist positions, one in each region of the State, to
improve customer service for hospitals.
WellCare collected and verified e-mail addresses for high-volume PCPs to facilitate rapid
dissemination of information to providers.
To address unnecessary emergency room utilization by members, WellCare doubled its
network of urgent care centers.
The CMO completed in-person provider visits to deliver care gap reports; the visits helped to
develop rapport with providers and make the care gap information more useful. The in-

FINDINGS
WellCare of Georgia, Inc. SFY 2015 PIP Validation Report WellCare_GASFY2015_CMO_PIP-Val_Report_F2_1114 State of Georgia Health Services Advisory Group, Inc.
Page 2-20
person visits included an explanation of how providers can use the report to address health
concerns in the member population.
WellCare’s omissions in the documented causal/barrier analysis process were accompanied by a
lack of documented intervention-specific evaluation. The CMO’s PIP documentation did not
include a process for the evaluation of intervention effectiveness or quantitative evaluation
results for each intervention. Process improvements, based on quality improvement science, in
the areas of barrier identification and ongoing evaluation of intervention effectiveness are
necessary before WellCare can expect to achieve the desired improvement in outcomes.

WellCare of Georgia, Inc. SFY 2015 PIP Validation Report WellCare_GASFY2015_CMO_PIP-Val_Report_F2_1114 State of Georgia Health Services Advisory Group, Inc.
Page 3-1
3. CONCLUSIONS AND RECOMMENDATIONS
for WellCare of Georgia, Inc.
Conclusions
WellCare demonstrated a thorough application of the PIP Design stage (Activities I through VI).
The sound study design for eight of the 10 PIPs created the foundation for the CMO to progress
to subsequent PIP stages—implementing improvement strategies and achieving real and
sustained study indicator outcomes. WellCare appeared to appropriately select and conduct the
sampling and data collection activities. These activities ensured that the CMO properly defined
and collected the necessary data to produce accurate study indicator rates.
While WellCare documented sound study designs for its PIPs, it only achieved real and sustained
improvement for one of the 10 PIPs. The CMO’s documentation of the barrier identification
process did not include supporting data or analysis results. The CMO also failed to identify
priority barriers and narrow the focus of interventions toward those barriers. Additionally,
quantitative, intervention-specific evaluations of effectiveness were lacking from all of the PIPs;
WellCare’s decisions about revising or continuing interventions were not based on a solid
foundation of evaluation and data analysis. To achieve desired improvement in outcomes,
causal/barrier analyses and ongoing intervention evaluations, based on sound quality
improvement science, are necessary.
Recommendations
HSAG recommends that WellCare:
Ensure that all data components reported in each PIP are accurate and consistently
documented throughout the PIP, and align with the data reported in the CMO’s final report
audit.
Ensure that all statistical testing is done correctly and the documentation of the statistical
testing outcomes is accurate and consistent throughout the PIP.
Conduct causal/barrier and drill-down analyses more frequently than annually and
incorporate quality improvement science such as PDSA cycles into its improvement
strategies and action plans. The data and results of specific PDSA cycles should be included
in the PIP documentation.
Identify barriers through quantitative data analysis. Data to support identified barriers should
be documented in the PIP Summary Form.
Have a process for identifying high-priority barriers or ranking barriers in order of priority.
The prioritization process and results should be documented in the PIP Summary Form.
Interventions should be targeted at high-priority barriers, rather than trying to address every
identified priority with limited resources.
CONCLUSIONS AND RECOMMENDATIONS
WellCare of Georgia, Inc. SFY 2015 PIP Validation Report WellCare_GASFY2015_CMO_PIP-Val_Report_F2_1114 State of Georgia Health Services Advisory Group, Inc.
Page 3-2
Ensure that each intervention is directly linked to an identified barrier and to the study
indicators. Additionally, the full implementation dates should be documented for each
intervention. All interventions should directly impact the study indicator.
Evaluate the efficacy of each intervention to determine if it is being successfully
implemented and achieving the desired goal. The results of each intervention’s evaluation for
each remeasurement period should be included in the PIP.
Design small-scale tests coupled with analysis of results to determine the success of the
intervention. If the small-scale test results suggest that the intervention has been
unsuccessful, the CMO should determine: (1) if the true root cause was identified—if not, the
CMO should conduct another causal/barrier analysis to isolate the true root cause or issue
that is impacting improvement; and (2) if the interventions need to be revised because a new
root cause was identified or the intervention was unsuccessful.
Synthesize the results of intervention-specific evaluations with regular causal/barrier
analyses to develop a complete picture of each PIP’s progress toward improvement goals. If
evaluation results suggest that individual interventions are successful but the study indicator
rate(s) did not improve, the CMO should incorporate this information into further drill-down
analyses to identify the true root causes of the lack of improvement.

WellCare of Georgia, Inc. SFY 2015 PIP Validation Report WellCare_GASFY2015_CMO_PIP-Val_Report_F2_1114 State of Georgia Health Services Advisory Group, Inc.
Page A-1
APPENDIX A. PIP-SPECIFIC VALIDATION SCORES
for WellCare of Georgia, Inc.
Table A-1—WellCare of Georgia, Inc.’s SFY 2015 PIP Performance
Percentage of Applicable Evaluation Elements Scored Met
PIP Stage Activity Adolescent Well-Care
Visits
Annual Dental Visits
Appropriate Use of ADHD
Medications
Childhood Immunizations—Combo 10
Childhood Obesity
Comprehensive Diabetes Care
Avoidable Emergency
Room Visits
Member Satisfaction
Postpartum
Care
Provider Satisfaction
Design
Appropriate Study
Topic 100% 100% 100% 100% 100% 100% 100% 100% 100% 100%
Clearly Defined,
Answerable Study
Question(s)
100% 100% 100% 100% 100% 100% 100% 100% 100% 100%
Correctly Identified
Study Population 100% 67% 100% 100% 100% 100% 50% 100% 100% 100%
Clearly Defined Study
Indicator(s) 100% 83% 100% 100% 100% 100% 60% 80% 83% 100%
Valid Sampling
Techniques (if sampling
was used)
100% Not
Applicable
Not
Applicable 83% 100% 100%
Not
Applicable 100% 100% 100%
Accurate/Complete
Data Collection 100% 100% 100% 100% 100% 100% 80% 100% 100% 100%
Design Total 100% 91% 100% 97% 100% 100% 80% 96% 97% 100%
Implementation
Sufficient Data Analysis
and Interpretation 78% 63% 75% 78% 78% 78% 50% 89% 89% 78%
Appropriate
Improvement Strategies 50% 25% 67% 75% 75% 67% 50% 50% 50% 25%
Implementation Total 69% 50% 73% 77% 77% 75% 50% 77% 77% 62%
Outcomes
Real Improvement
Achieved 50% 25% 50% 100% 100% 25% 25% 25% 50% 25%
Sustained Improvement
Achieved 0%
Not
Assessed
Not
Assessed 100%
Not
Assessed
Not
Assessed
Not
Assessed
Not
Assessed
Not
Assessed
Not
Assessed
Outcomes Total 40% 25% 50% 100% 100% 25% 25% 25% 50% 25%
Validation Status Not Met Not Met Not Met Met Met Not Met Not Met Not Met Not Met Not Met