performance improvement report fourth state fiscal …
TRANSCRIPT

PERFOR MANCE IMP ROVE MENT REPORT
FOURT H STATE F ISCAL QUARTER 2 0 1 2 April, May, June 2012
Mary Louise McEwen, SUPERINTENDENT
July 24, 2012

THIS PAGE INTENTIALLY LEFT BLANK

Table of Contents
GLOSSARY OF TERMS, ACRONYMS, AND ABBREVIATIONS
INTRODUCTION
ADMISSIONS ...................................................................................................................... 1
COMMUNITY FORENSIC ACT TEAM ................................................................................. 3
CAPITOL COMMUNITY CLINIC ......................................................................................... 7
CLIENT SATISFACTION ................................................................................................... 11
COMPARATIVE STATISTICS ........................................................................................... 20
DIETARY ........................................................................................................................... 41
HARBOR TREATMENT MALL ............................................................................................ 44
HEALTH INFORMATION MANAGEMENT ......................................................................... 45
HOUSEKEEPING .............................................................................................................. 47
HUMAN RESOURCES ...................................................................................................... 49
INFECTION CONTROL ..................................................................................................... 54
LIFE SAFETY .................................................................................................................... 55
NURSING .......................................................................................................................... 58
PEER SUPPORT ............................................................................................................... 62
PROGRAM SERVICES ...................................................................................................... 64
REHABILITATION SERVICES ........................................................................................... 65
SECURITY & SAFETY ........................................................................................................ 66
SOCIAL WORK............................................................................................................... 67
STAFF DEVELOPMENT .................................................................................................... 70
CONSENT DECREE COMPLIANCE STANDARDS SUMMARY ..................................... 71

THIS PAGE INTENTIALLY LEFT BLANK

Glossary of Terms, Acronyms & Abbreviations
ACT Assertive Community Treatment ADC Automated Dispensing Cabinets (for medications)
ADON Assistant Director of Nursing AOC Administrator on Call CCM Continuation of Care Management (Social Work Services) CCP Continuation of Care Plan CPI Continuous Process (or Performance) Improvement CPR Cardio-Pulmonary Resuscitation CSP Comprehensive Service Plan GAP Goal, Assessment, Plan Documentation HOC Hand off communications. IMD Institute for Mental Disease
ICDCC Involuntary Civil District Court Commitment ICDCC-M Involuntary Civil District Court Commitment, Court Ordered Medications
ICDCC-PTP Involuntary Civil District Court Commitment, Progressive Treatment Plan IC-PTP+M Involuntary Commitment, Progressive Treatment Plan, Court Ordered
Medications ICRDCC Involuntary Criminal District Court Commitment
INVOL CRIM Involuntary Criminal Commitment INVOL-CIV Involuntary Civil Commitment
ISP Individualized Service Plan IST Incompetent to Stand Trial
LCSW Licensed Clinical Social Worker LPN License Practical Nurse TJC The Joint Commission (formerly JCAHO, Joint Commission on
Accreditation of Healthcare Organizations) MAR Medication Administration Record
MRDO Medication Resistant Disease Organism (MRSA, VRE, C-Dif) NAPPI Non Abusive Psychological and Physical Intervention
NASMHPD National Association of State Mental Health Program Directors NCR Not Criminally Responsible NOD Nurse on Duty NP Nurse practitioner
NPSG National Patient Safety Goals (established by the Joint Commission) NRI NASMHPD Research Institute, Inc. OT Occupational Therapist
PA or PA-C Physician’s Assistant (Certified) PCHDCC Pending Court Hearing
PCHDCC+M Pending Court Hearing for Court Ordered Medications PPR Periodic Performance Review – a self-assessment based upon TJC
standards that are conducted annually by each department head. PSD Program Services Director PTP Progressive Treatment Plan

Glossary of Terms, Acronyms & Abbreviations
R.A.C.E. Rescue/Alarm/Confine/Extinguish RN Registered Nurse RT Recreation Therapist SA Substance Abuse
SBAR Acronym for a model of concise communications first developed by the US Navy Submarine Command. S = Situation, B = Background, A = Assessment, R = Recommendation
SD Standard Deviation – a measure of data variability. Seclusion, Locked Client is placed in a secured room with the door locked. Seclusion, Open Client is placed in a room and instructed not to leave the room.
SRC Single Room Care (seclusion) URI Upper respiratory infection UTI Urinary tract infection VOL Voluntary – Self
VOL-OTHER Voluntary – Others (Guardian) MHW Mental Health Worker

INTRODUCTION Each section of this report focuses on an area that is specific to client and staff safety, regulatory compliance, priority focus areas related to accreditation standards, and compliance with the specifications of the consent decree compliance standards; including the provision of services that meet or exceed the Rights of Recipients of Mental Health Services. The intent of this report is to outline the efforts of the hospital’s Governance, Leadership, Staffs, and participating clients and family members in ensuring an environment and culture of care that is centered on safety, just treatment of both clients and staffs, and the creation of a method of care that supports the recovery of the clients served. To ensure the sustainability of this system of effective care and efficient delivery of services the hospital continually seeks out best practices in clinical care and organizational systems management through ongoing review of key performance indicators, the measurement of these indicators, the analysis of the measures, the improvement of processes and care methods, and the ongoing control of organizational changes with a focal point of achieving overall organizational performance excellence.
The key performance indicators related to safety are in two parts: 1) the environment of care; and 2) the safety and effectiveness of the care delivered. The key indicators related to the safety of the environment of care include elements related to life safety, laundry and dietary services, infection prevention, and facility safety and security. Indicators concerning safety in the delivery of care include measures regarding the frequency of use and duration of seclusion and restraint, client and staff injuries, medication variances, and elopement. There is an ongoing focus on the reduction of seclusion and restraint as a means of protecting clients during incidence of aggressive behaviors. Results of this measure continue to be lower than or consistent with national aggregate rates of performance. In addition to this area of concentration, medication variances, injuries related to falls, and suicidal risk prevention have come to the forefront and specific concentration in these areas has begun through the creation of interdisciplinary teams to address these concerns.
Key performance indicators related to the care of clients in a manner that is effective, efficient, and centered on providing the resources for client recovery include elements related to: 1) staff competencies; 2) the management of care related information; the utilization of peer support personnel as active contributors to care; and 3) care delivered by nursing, social work, and rehabilitation services staffs. The compliance of staff regarding participation in ongoing educational programs demonstrates consistently high levels of performance. The review of staffs’ performance through the completion of annual performance evaluations has improved significantly and this improvement is the direct result of the “watchdog” efforts of the hospital’s human resources personnel. The delivery of care by nursing, social work, and rehabilitation services personnel is overall consistent and of high quality as demonstrated by the performance indicators shown. While individual areas periodically indicate opportunities for improvement, when these areas of concern are identified through trending analysis, focused attention on methods to improve the work processes are defined and implemented. Part of the process of creating and managing a just culture is the understanding that the delivery of health care services is most effectively done through human interaction. It must also be acknowledged that humans are prone to error and every aspect of care that involves the human element includes the potential for error to occur. The focus of the hospital; therefore, should be on developing systems and work processes that take into account the potential for human error and to introduce tools and barriers that can be leveraged to prevent the occurrence of errors, especially those errors that have a high potential for harm. Much of what has been reported to date has been related to compliance elements. Accreditation and regulatory standards are changing to reflect a methodology that is concerned more with identifying opportunities for improvement within an organization and implementing change to make the organizational processes more effective and efficient. Throughout the coming year it is anticipated that changes in the methods and key focus areas will shift to these more improvement oriented areas of concentration and reflect less on individual compliance factors. In addition, work on the internal assessment of the fulfillment of the Consent Decree Standards of Compliance is ongoing and overall success in maintaining these standards is expected to be sustainable.

. THIS PAGE INTENTIALLY LEFT BLANK

Page
1
(Glossary of Terms, Acronyms & Abbreviations) (Back to Table of Contents)
ADMISSIONS
Figure CD-06 2011 2012 Client Admission Diagnoses 4Q11 1q12 2Q12 3Q12 4Q12 ADJUSTMENT DIS W MIXED DISTURBANCE OF EMOTIONS & CONDUCT 1 2 1
ADJUSTMENT DISORDER WITH DEPRESSED MOOD 2 2 3 1
ADJUSTMENT DISORDER WITH DISTURBANCE OF CONDUCT 1
ADJUSTMENT DISORDER WITH MIXED ANXIETY AND DEPRESSED MOOD 1 1 2 1
ADJUSTMENT REACTION NOS 1 2 2 1
ALCOH DEP NEC/NOS-REMISS 1
ANXIETY STATE NOS 1
ATTN DEFICIT W HYPERACT 1
BIPOL I DIS, MOST RECENT EPIS (OR CURRENT) MANIC, UNSPEC 1
BIPOL I, REC EPIS OR CURRENT MANIC, SEVERE, SPEC W PSYCH BEH 1 2 1
BIPOLAR DISORDER, UNSPECIFIED 11 17 17 6 5
CANNABIS ABUSE-IN REMISS 1
CONDUCT DISTURBANCE NOS 1
DELUSIONAL DISORDER 2 4 3
DEPRESS DISORDER-UNSPEC 1 1 2 1
DEPRESSIVE DISORDER NEC 7 4 6
DRUG ABUSE NEC-IN REMISS 2 3
DRUG ABUSE NEC-UNSPEC 1
DRUG MENTAL DISORDER NOS 1
DYSTHYMIC DISORDER 2 1
HALLUCINOG ABUSE-REMISS 1
HEBEPHRENIA-CHRONIC 1 1
IMPULSE CONTROL DIS NOS 1 1
INTERMITT EXPLOSIVE DIS 3 3
PARANOID SCHIZO-CHRONIC 5 10 6 9 1
PARANOID SCHIZO-UNSPEC 2 1 1
PERSON FEIGNING ILLNESS 1
POSTTRAUMATIC STRESS DISORDER 3 4 4 3 4
PSYCHOSIS NOS 14 6 13 13 6
REC DEPR DISOR-PSYCHOTIC 1 1
RECUR DEPR DISOR-SEVERE 1 2
SCHIZOAFFECTIVE DISORDER, UNSPECIFIED 13 11 13 16 10
SCHIZOPHRENIA NOS-CHR 2 3 1 2 3
SCHIZOPHRENIA NOS-UNSPEC 1 1
SCHIZOPHRENIFORM DISORDER, UNSPECIFIED 1 1
UNSPEC PERSISTENT MENTAL DIS DUE TO COND CLASS ELSEWHERE 3
UNSPECIFIED EPISODIC MOOD DISORDER 5 12 4 4 9
UNSPECIFIED NONPSYCHOTIC MENTAL DISORDER 2
Total Admissions 76 84 85 69 57 % Admitted with primary diagnosis of mental retardation, traumatic brain injury, dementia, substance abuse or dependence. 2.7% 3.6% 0.0% 1.4% 7.02%

Page
2
(Glossary of Terms, Acronyms & Abbreviations) (Back to Table of Contents)
ADMISSIONS
Figure CD-04 2011 2012 Client Legal Status on Admission Qtr4 Qtr1 Qtr2 Qtr3 Qtr4 ICDCC 23 39 41 29 19 ICDCC-M 3 1 1 ICDCC-PTP 1 IC-PTP+M ICRDCC 2 INVOL CRIM 30 32 31 33 39 INVOL-CIV 2 1 3 3 PCHDCC 2 PCHDCC+M 1 1 1 1 VOL 10 13 18 2 4 VOL-OTHER 2 1

Page
3
(Glossary of Terms, Acronyms & Abbreviations) (Back to Table of Contents)
COMMUNITY FORENSIC ACT TEAM ASPECT: REDUCTION OF RE-HOSPITALIZATION FOR ACT TEAM CLIENTS
Indicators Findings Compliance Threshold Percentile
1. The ACT Team Director will review all client cases of re-hospitalization from the community for patterns and trends of the contributing factors leading to re-hospitalization each quarter. The following elements are considered during the review:
a. Length of stay in community b. Type of residence (i.e.: group home,
apartment, etc) c. Geographic location of residence d. Community support network e. Client demographics (age, gender, financial) f. Behavior pattern/mental status g. Medication adherence h. Level of communication with ACT Team
4 NCR clients were re-admitted to RPC; 1 for violation of court order, 1 who was readmitted due to
elopement and 2 for increased psychiatric
symptoms.
100% 100%
2. ACT Team will work closely with inpatient treatment team to create and apply discharge plan incorporating additional supports determined by review noted in #1.
2/2 treatment plans were collaborated upon for clients discharged from
readmissions to RPC
100% 100%
Summary 1. All readmissions were male, under the care of the DHHS Commissioner (NCR), on modified release,
all had been in the community for over two years, all had been receiving benefits (low but stable income), all were medication adherent, one of four had developed community supports and all resided in Augusta.
In two of the admissions, the precipitating factor was seen to be an increase in symptoms of mental illness, and in the other two the factor was a medical issue initially unrelated to their mental illness (colonoscopy and broken leg). The first client who was readmitted had been living in an Eastside Campus group home for two years, age 57, who had limited natural supports, and was admitted to RPC directly from MGMC after a colonoscopy attempt. He was medication adherent, but may have been negatively impacted by dehydration due to colonoscopy prep. He remained inpatient for 6 weeks, and reports his mental clarity has improved to a great extent. He is experiencing financial difficulty with his home and with his benefits. He has an excellent level of communication with the ACT Team when he is psychiatrically stable.
The second admission was also a direct transfer from a medical facility (MGMC-Thayer) where he had foot/ankle surgery precipitated by a fall. The transfer to RPC was to assist the client in managing post op issues to include responsible taking of pain medication and to manage symptoms of relapse to avoid actual relapse. He was successfully transitioned back to his apartment after 23 days. This client is also in his mid-fifties, has limited natural supports, has SSDI as his only source of income, and is living 3 miles from RPC. His communication had been quite impaired with the introduction of narcotic pain medication, yet relapse warning signs were noted prior to his accident.
The third client readmitted was experiencing increased symptoms of his mental illness and was adherent to medication regimen. He was discharged after six days back to a supervised apartment within 2 miles of RPC, is in his mid-thirties, has natural and professional supports,

Page
4
(Glossary of Terms, Acronyms & Abbreviations) (Back to Table of Contents)
COMMUNITY FORENSIC ACT TEAM
The fourth client readmitted to RPC was experiencing an exacerbation of psychiatric symptoms causing him to be suspicious of food to the extent that he stopped eating. He remained inpatient for just under three weeks. He is in his late-fifties, has very limited natural supports and usually has good communication with ACT and residential staff.
2. The ACT Team has participated effectively with inpatient teams in treatment team meetings and consultation while clients are in the hospital, assisting with transportation, trips into the community, and contact with District Attorney/Attorney General’s office.
ASPECT: INSTITUTIONAL AND ANNUAL REPORTS
Indicators Findings Compliance Threshold Percentile
3. Institutional Reports will be completed, reviewed internally, and delivered to the court within 10 business days of notification of submitted petition.
5/5 on time
100% 95%
4. The assigned case manager will review the new court order with the client and document the meeting in a progress note or treatment team note.
4 new court orders, all reviewed.
100% 100%
5. Annual Reports (due Nov) to the commissioner for all out-patient Riverview ACT NCR clients are submitted annually
N/A N/A 100%
Summary 1. Five clients petitioned to have their cases heard in Superior Court. Four of five had Institutional
Reports completed on time. The process has been improved to include essential reviewers and in this quarter, a client who stated he had withdrawn a petition due to re-hospitalization had ultimately not contacted his attorney to pull the petition. Of the five, 1 client did pull their petitions due to recent re-hospitalization.
2. ACT Team Leader delivers four new Court Orders to Case Managers upon receipt, who then review with both client and supported housing staff involved in compliance with order. This is documented in progress notes and/or reviewed in ISP treatment team.
3. No Annual Reports were due this quarter.

Page
5
(Glossary of Terms, Acronyms & Abbreviations) (Back to Table of Contents)
COMMUNITY FORENSIC ACT TEAM ASPECT: SUBSTANCE ABUSE AND ADDICTIVE BEHAVIOR HISTORY
Indicators Findings Compliance Threshold Percentile
1. age of onset documented in Comprehensive Assessment 43/43 100% 95%
2. duration of behavior documented in C.A. and progress notes 43/43 100% 95%
3. pattern of behavior documented in C.A. and progress notes 43/43 100% 95%
Summary
The Co-Occurring Specialist has reviewed all urinalyses for illicit drug/alcohol us, as well as appropriateness of substances screened for. This has resulted in increased testing post-pass in the community, quicker request for re-submission of samples when positive results are received and therefore greater concern about false positives from the lab. The ACT Team would benefit from the ability to perform drug testing urinalyses on-site, as RPC does, but there is no private bathroom for this purpose. The exploration of a site that provides a restroom that ensures privacy and confidentiality would support the enhanced detection of illicit substances in urine as well as potentially reduce the false positive results from the current lab utilized for this purpose. ASPECT: INDIVIDUAL SERVICE PLANS AND PROGRESS NOTES
Indicators Findings Compliance Threshold Percentile
1. Progress notes in GAP/Incidental/Contact format will indicate at minimum weekly contact with all clients assigned on an active status caseload.
43/43 100% 95%
2. Individual Service Plans will have measurable goals and interventions listing client strengths and areas of need related to community integration and increased court ordered privileges based on risk reduction activities.
43/43 100% 95%
3. Case notes will indicate at minimum monthly contact with all NCR clients who remain under the care of the Commissioner. These clients receive treatment services by community providers and RPC ACT monitors for court order and annual report compliance only.
10/10 100% 95%
Summary 1. Clients in transition from ACT to other community resources have had less than weekly direct contact
but are discussed weekly in clinical meeting and are seen face to face at least 4 times per month (averaging weekly contacts).
2. ISPs also contain group attendance goals, especially with clients who are petitioning for increased court ordered privileges. Case managers are focused on including group attendance in ISP goals.
3. Three clients currently served as outliers are being transitioned to an intensive case manager upon the filling of that position, as their needs for ACT-based treatment has increased. All of these clients will be seeing Dr. Manin for psychiatry.

Page
6
(Glossary of Terms, Acronyms & Abbreviations) (Back to Table of Contents)
COMMUNITY FORENSIC ACT TEAM ASPECT: PEER SUPPORT
Indicators Findings Compliance Threshold Percentile
1. Engagement attempt with client within 7 days of admission. 1/1 100% 95%
2. Documented offer of peer support services. 43/43 100% 95%
3. Attendance at treatment team meetings as appropriate. 27/30 90% 95%
Summary
The Peer Support Specialist makes every effort to attend treatment team meetings at ACT offices and in hospital with clients who state they wish him to attend. The only missed treatment team meetings are those that were reschedule for a time the PSS was unable to attend, or those that were scheduled while he was not expected to be at work (vacation, sick time). The quantity and quality of client contacts with Peer Support continues to significantly contribute to the ACT Team’s goal of seeing clients face to face three times per week.

Page
7
(Glossary of Terms, Acronyms & Abbreviations) (Back to Table of Contents)
CAPITOL COMMUNITY CLINIC CO ASPECT: CLIENT SATISFACTION SURVEY
Indicators Findings Compliance Threshold Percentile
Clients from RPC as well as clients in the community will receive a survey to fill out at the time of appt. The survey has several questions and in those questions we are asking the client how we can better serve there needs.
April
Thirty-four surveys were completed by dental in-house clients as well as outpatient. Of the surveys completed, all were positive.
100%
90%
May Thirty-eight client surveys were received. All surveys were positive.
100%
90%
June Thirty-eight client surveys were completed. Of the surveys returned, all were positive.
100 %
90%
Summary One hundred ten surveys were returned and all showed positive results for the 4th quarter 2012. Actions Will continue the client surveys to monitor and evaluate monthly with staff.
Page
8
(Glossary of Terms, Acronyms & Abbreviations) (Back to Table of Contents)
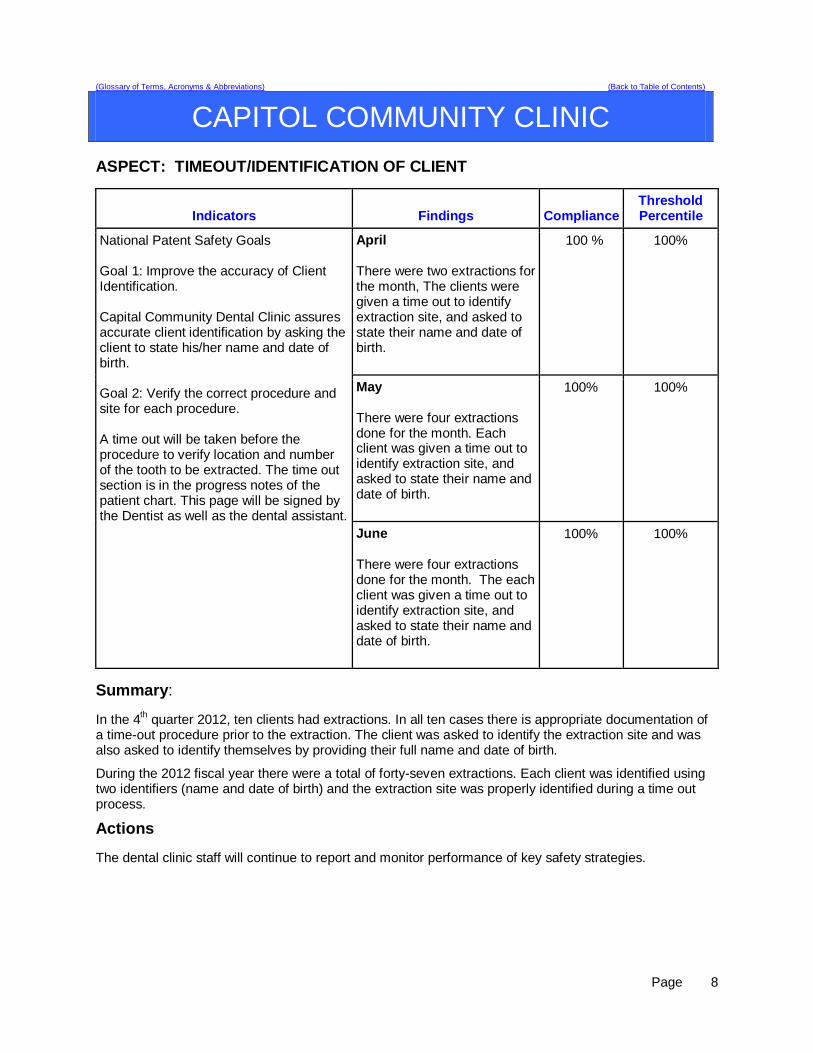
CAPITOL COMMUNITY CLINIC ASPECT: TIMEOUT/IDENTIFICATION OF CLIENT
Indicators Findings Compliance Threshold Percentile
National Patent Safety Goals Goal 1: Improve the accuracy of Client Identification. Capital Community Dental Clinic assures accurate client identification by asking the client to state his/her name and date of birth. Goal 2: Verify the correct procedure and site for each procedure. A time out will be taken before the procedure to verify location and number of the tooth to be extracted. The time out section is in the progress notes of the patient chart. This page will be signed by the Dentist as well as the dental assistant.
April There were two extractions for the month, The clients were given a time out to identify extraction site, and asked to state their name and date of birth.
100 %
100%
May There were four extractions done for the month. Each client was given a time out to identify extraction site, and asked to state their name and date of birth.
100%
100%
June There were four extractions done for the month. The each client was given a time out to identify extraction site, and asked to state their name and date of birth.
100%
100%
Summary: In the 4th quarter 2012, ten clients had extractions. In all ten cases there is appropriate documentation of a time-out procedure prior to the extraction. The client was asked to identify the extraction site and was also asked to identify themselves by providing their full name and date of birth.
During the 2012 fiscal year there were a total of forty-seven extractions. Each client was identified using two identifiers (name and date of birth) and the extraction site was properly identified during a time out process.
Actions The dental clinic staff will continue to report and monitor performance of key safety strategies.

Page
9
(Glossary of Terms, Acronyms & Abbreviations) (Back to Table of Contents)
CAPITOL COMMUNITY CLINIC
ASPECT: DENTAL CLINIC 24 HOUR POST EXTRACTION FOLLOW-UP
Indicators Findings Compliance Threshold Percentile
Post dental extractions, the clients will receive a follow-up phone call from the clinic within 24hrs of procedure to assess for post procedure complications.
April Two extraction were performed. A 24-hour phone follow-up call was made to the clients. The clients reported no complications post extractions.
100%
100%
May Four extractions were performed. A 24-hour phone follow-up call was made to each client. All clients reported no complications post extractions.
100%
100%
June Four extractions were performed. A 24-hour phone follow-up call was made to each client. All clients reported no complications post extractions
100% 100%
Summary There were ten extractions in the third quarter. Clients were called 24 hours post extraction. All nine clients reported no post procedure complications.
During the 2012 fiscal year forty-seven extractions were completed. Post extraction follow-up calls were made to all clients and not complications were reported.
Action Results will be reviewed monthly by staff and will continue to report monthly to RPC.

Page
10
(Glossary of Terms, Acronyms & Abbreviations) (Back to Table of Contents)
CAPITOL COMMUNITY CLINIC ASPECT: MED MANAGEMENT CLINIC APPOINTMENT ASSESSMENT
Indicators Findings Compliance Threshold Percentile
All Outpatient clients will have Vital Signs and Weight recorded upon arrival for appointment.
April Forty clients that had scheduled appointments had their vitals signs taken before their clinic appointment.
100%
100%
May Thirty-nine clients had scheduled appointments during the month. All clients had vital signs taken before their appointment.
100%
100%
June Forty-two clients had scheduled appointments during the month. All clients had their vital signs taken before their clinic appointment.
100% 100%
Summary
For the 4th quarter 2012 there were one hundred twenty clients. All clients had their vitals taken before their scheduled appointment. This information was reviewed at monthly staff meetings and reports forwarded quarterly to RPC Quality Council.
During the 2012 fiscal year a total of three hundred seventy-one clients were served with medication management appointments.
Actions Staff will continue to strive for 100% of the goal. Staff will monitor and report monthly, as well as quarterly to RPC.

Page
11
(Glossary of Terms, Acronyms & Abbreviations) (Back to Table of Contents)
CLIENT SATISFACTION ASPECT: CLIENT SATISFACTION WITH CARE
# Indicators Findings
Results % Change
1 I am better able to deal with crisis. 0% -20%
2 My symptoms are not bothering me as much. 4% -31%
3 The medications I am taking help me control symptoms that used to bother me. -13% -18%
4 I do better in social situations. -4% -24%
5 I deal more effectively with daily problems. -17% -27%
6 I was treated with dignity and respect. 0% -35%
7 Staff here believed that I could grow, change and recover. 8% -42%
8 I felt comfortable asking questions about my treatment and medications. 29% -11%
9 I was encouraged to use self-help/support groups. 21% -9%
10 I was given information about how to manage my medication side effects. -21% -11%
11 My other medical conditions were treated. -8% -43%
12 I felt this hospital stay was necessary. -29% -4%
13 I felt free to complain without fear of retaliation. -8% -13%
14 I felt safe to refuse medication or treatment during my hospital stay. -13% -8%
15 My complaints and grievances were addressed. -8% -63%
16 I participated in planning my discharge. 8% -57%
17 Both I and my doctor or therapist from the community were actively involved in my hospital treatment plan. -4% -4%
18 I had an opportunity to talk with my doctor or therapist from the community prior to discharge. 8% +3%
19 The surroundings and atmosphere at the hospital helped me get better. 0% +5%

Page
12
(Glossary of Terms, Acronyms & Abbreviations) (Back to Table of Contents)
CLIENT SATISFACTION
# Indicators Findings
Results % Change
20 I felt I had enough privacy in the hospital. 0% -35%
21 I felt safe while I was in the hospital. 17% -23%
22 The hospital environment was clean and comfortable. 42% +17%
23 Staff were sensitive to my cultural background. 4% -36%
24 My family and/or friends were able to visit me. 13% -17%
25 I had a choice of treatment options. -29% -34%
26 My contact with my doctor was helpful. -8% -53%
27 My contact with nurses and therapists was helpful. -4% -49%
28 If I had a choice of hospitals, I would still choose this one. -17% -32%
29 Did anyone tell you about your rights? -25% -50%
30 Are you told ahead of time of changes in your privileges, appointments, or daily routine? 0% -15%
31 Do you know someone who can help you get what you want or stand up for your rights? 25% +15%
32 My pain was managed. -13% -53% Summary
Positive scores indicate satisfaction, while negative scores indicate dissatisfaction. Percentages are calculated using actual weighted scores and highest possible score for each indicator. The total number of respondents was 12. The first column indicates the score for 4th quarter and the second column shows increases/decreases from 3rd quarter. Overall satisfaction for 4th quarter decreased 24% causing a negative score (-1%), indicating an overall dissatisfaction with care. Of the 32 indicators, only 4 indicators increased in satisfaction, while all the others decreased, 16 of which indicated dissatisfaction. There were 18 indicators that continued to drop.

Page
13
(Glossary of Terms, Acronyms & Abbreviations) (Back to Table of Contents)
CLIENT SATISFACTION
0
10
20
30
40
50
% S
atis
fact
ion
1st Qtr '12 2nd Qtr '12 3rd Qtr '12 4th Qtr '12
Total Satisfaction
Total
The Inpatient Consumer Survey (ICS) is a standardized national survey of customer satisfaction. The National Association of State Mental Health Program Directors Research Institute (NRI) collects data from state psychiatric hospitals throughout the country in an effort to compare the results of client satisfaction in six areas or domains of focus. These domains include Outcomes, Dignity, Rights, Participation, Environment, and Empowerment.
Inpatient Consumer Survey (ICS) has been recently endorsed by NQF, under the Patient Outcomes Phase 3: Child Health and Mental Health Project, as an outcome measure to assess the results, and thereby improve care provided to people with mental illness. The endorsement supports the ICS as a scientifically sound and meaningful measure to help standardize performance measures and assures quality of care.
Rate of Response for the Inpatient Consumer Survey Jul Aug Sep Oct Nov Dec Jan Feb Mar Apr May Jun Total Responses 8 11 4 6 8 2 2 4 4 3 4 5 61 Discharges 24 33 32 19 26 20 25 17 20 19 24 21 280
Rate of Response 33% 33% 13% 32% 31% 10% 8% 24% 20% 16% 17% 24% 22%
Due to the operational and safety need to refrain from complete openness regarding plans for discharge and dates of discharge for forensic clients, the process of administering the inpatient survey is difficult to administer. Whenever possible the peer support staff work to gather information from clients on their perception of the care provided to then while at Riverview Psychiatric Center.
There is currently no aggregated date on a forensic stratification of responses to the survey.

Page
14
(Glossary of Terms, Acronyms & Abbreviations) (Back to Table of Contents)
CLIENT SATISFACTION Inpatient Consumer Survey
Outcome Domain
0
10
20
30
40
50
60
70
80
90
100
Perc
ent o
f Clie
nts
w/ P
ositi
ve R
espo
nses
Riverview 87.50 60.00 66.67 28.57 100.0 88.89 75.00 72.73 50.00 83.33 71.43 50.00 50.00 50.00 50.00 33.33 25.00
Dorothea Dix 75.00 60.00 60.00 100.0 50.00 27.27 58.33 100.0 90.00 69.23 83.33 66.67 80.00 80.00 75.00 50.00
Ntl Mean 76.34 78.10 77.20 78.38 74.31 77.62 77.16 79.65 75.78 76.06 78.76 76.42 74.02 77.68 75.21 73.85 83.17
- 1 StDev 59.19 62.60 60.81 62.30 55.29 61.64 61.26 61.62 55.17 56.79 61.43 60.35 54.81 60.24 60.89 54.11 67.65
Jan Feb Mar Apr May Jun Jul Aug Sep Oct Nov Dec Jan Feb Mar Apr May Jun
3rd SFQ 2011 4th SFQ 2011 1st SFQ 2012 2nd SFQ 2012 3rd SFQ 2012 4th SFQ 2012
GOOD
Outcome Domain Questions 1. I am better able to deal with crisis. 2. My symptoms are not bothering me as much. 3. I do better in social situations. 4. I deal more effectively with daily problems.

Page
15
(Glossary of Terms, Acronyms & Abbreviations) (Back to Table of Contents)
CLIENT SATISFACTION Inpatient Consumer Survey
Dignity Domain
0
10
20
30
40
50
60
70
80
90
100
Perc
ent o
f Clie
nts
w/ P
ositi
ve R
espo
nses
Riverview 87.50 80.00 66.67 42.86 100.0 70.00 37.50 72.73 100.0 80.00 62.50 100.0 50.00 75.00 75.00 33.33 50.00
Dorothea Dix 87.50 80.00 87.50 60.00 62.50 72.73 75.00 100.0 100.0 76.92 100.0 66.67 80.00 100.0 87.50 87.50
Ntl Mean 82.08 81.80 80.23 81.75 78.17 79.69 80.36 79.72 78.51 78.16 80.42 80.87 80.98 81.24 82.00 81.80 84.94
- 1 StDev 65.46 64.96 64.70 65.46 61.59 64.45 64.98 63.68 57.26 61.46 63.54 65.00 66.73 64.78 68.98 64.57 72.53
Jan Feb Mar Apr May Jun Jul Aug Sep Oct Nov Dec Jan Feb Mar Apr May Jun
3rd SFQ 2011 4th SFQ 2011 1st SFQ 2012 2nd SFQ 2012 3rd SFQ 2012 4th SFQ 2012
GOOD
Dignity Domain Questions
1. I was treated with dignity and respect. 2. Staff here believed that I could grow, change and recover. 3. I felt comfortable asking questions about my treatment and medications. 4. I was encouraged to use self-help/support groups.

Page
16
(Glossary of Terms, Acronyms & Abbreviations) (Back to Table of Contents)
CLIENT SATISFACTION Inpatient Consumer Survey
Rights Domain
0
10
20
30
40
50
60
70
80
90
100
Perc
ent o
f Clie
nts
w/ P
ositi
ve R
espo
nses
Riverview 57.14 75.00 66.67 42.86 100.0 40.00 12.50 63.64 100.0 60.00 50.00 50.00 50.00 50.00 25.00 33.33 50.00
Dorothea Dix 75.00 55.56 60.00 50.00 57.14 54.55 33.33 80.00 66.67 61.54 83.33 50.00 80.00 77.78 62.50 75.00
Ntl Mean 64.18 66.37 64.15 63.82 63.98 62.84 61.57 64.46 64.61 64.42 63.65 62.80 64.70 66.20 66.92 66.84 68.20
- 1 StDev 42.53 44.89 42.02 42.94 43.63 40.28 40.38 44.71 41.65 46.65 40.51 43.50 44.66 45.35 47.87 44.19 49.02
Jan Feb Mar Apr May Jun Jul Aug Sep Oct Nov Dec Jan Feb Mar Apr May Jun
3rd SFQ 2011 4th SFQ 2011 1st SFQ 2012 2nd SFQ 2012 3rd SFQ 2012 4th SFQ 2012
GOOD
Rights Domain Questions
1. I felt free to complain without fear of retaliation. 2. I felt safe to refuse medication or treatment during my hospital stay. 3. My complaints and grievances were addressed.

Page
17
(Glossary of Terms, Acronyms & Abbreviations) (Back to Table of Contents)
CLIENT SATISFACTION Inpatient Consumer Survey
Participation Domain
0
10
20
30
40
50
60
70
80
90
100
Perc
ent o
f Clie
nts
w/ P
ositi
ve R
espo
nses
Riverview 57.14 80.00 100.0 57.14 100.0 66.67 50.00 50.00 33.00 66.67 33.33 50.00 0.00 33.33 100.0 33.33 66.67
Dorothea Dix 87.50 87.50 80.00 66.67 50.00 70.00 41.67 40.00 75.00 61.54 66.67 33.33 80.00 87.50 62.50 75.00
Ntl Mean 77.86 70.12 74.84 69.39 69.89 72.42 72.31 71.18 72.43 69.26 70.78 70.69 71.99 72.13 75.49 74.44 76.55
- 1 StDev 59.68 45.52 50.14 45.21 50.69 50.97 51.23 50.96 49.76 47.11 44.15 45.72 47.50 51.32 55.88 53.69 53.20
Jan Feb Mar Apr May Jun Jul Aug Sep Oct Nov Dec Jan Feb Mar Apr May Jun
3rd SFQ 2011 4th SFQ 2011 1st SFQ 2012 2nd SFQ 2012 3rd SFQ 2012 4th SFQ 2012
GOOD
Participation Domain Questions
1. I participated in planning my discharge. 2. Both I and my doctor or therapist from the community were actively involved in my hospital
treatment plan. 3. I had an opportunity to talk with my doctor or therapist from the community prior to discharge.

Page
18
(Glossary of Terms, Acronyms & Abbreviations) (Back to Table of Contents)
CLIENT SATISFACTION Inpatient Consumer Survey
Environment Domain
0
10
20
30
40
50
60
70
80
90
100
Perc
ent o
f Clie
nts
w/ P
ositi
ve R
espo
nses
Riverview 83.33 75.00 100.0 50.00 50.00 75.00 33.33 75.00
Dorothea Dix 53.85 83.33 33.33 80.00 90.00 75.00 75.00
Ntl Mean 68.99 74.31 69.59 66.19 68.46 69.02 69.79 70.59
- 1 StDev 48.11 56.84 49.86 41.90 48.73 51.64 49.63 49.55
Jan Feb Mar Apr May Jun Jul Aug Sep Oct Nov Dec Jan Feb Mar Apr May Jun
3rd SFQ 2011 4th SFQ 2011 1st SFQ 2012 2nd SFQ 2012 3rd SFQ 2012 4th SFQ 2012
GOOD
Environment Domain
1. The surroundings and atmosphere at the hospital helped me get better 2. I felt I had enough privacy in the hospital. 3. I felt safe while I was in the hospital. 4. The hospital environment was clean and comfortable.
Data aggregation on this domain began in October 2011. A trend analysis pattern related to this data is only now becoming apparent.

Page
19
(Glossary of Terms, Acronyms & Abbreviations) (Back to Table of Contents)
CLIENT SATISFACTION Inpatient Consumer Survey
Empowerment Domain
0
10
20
30
40
50
60
70
80
90
100
Perc
ent o
f Clie
nts
w/ P
ositi
ve R
espo
nses
Riverview 50.00 75.00 75.00 0.00
Dorothea Dix 71.00 75.00
Ntl Mean 77.34 73.49 66.43 79.58
- 1 StDev 57.66 50.09 36.82 55.78
Jan Feb Mar Apr May Jun Jul Aug Sep Oct Nov Dec Jan Feb Mar Apr May Jun
3rd SFQ 2011 4th SFQ 2011 1st SFQ 2012 2nd SFQ 2012 3rd SFQ 2012 4th SFQ 2012
GOOD
Empowerment Domain
1. I had a choice of treatment options. 2. My contact with my Doctor was helpful. 3. My contact with nurses and therapists was helpful.
Data aggregation on this domain began in January 2012. A trend analysis pattern related to this data cannot be determined until further data elements are available.
Page
20
(Glossary of Terms, Acronyms & Abbreviations) (Back to Table of Contents)
COMPARATIVE STATISTICS The comparative statistics reports include the following elements:
Client Injury Rate
Elopement Rate
Medication Error Rate
30 Day Readmit Rate
Percent of Clients Restrained
Hours of Restraint
Percent of Clients Secluded
Hours of Seclusion
Confinement Events Analysis
Confinement Events Management
Medication Administration during Behavioral Events
In addition to the areas of performance listed above, each of the comparative statistics areas includes a graph that depicts the stratification of forensic and non-forensic (civil) services provided to clients. This is new information that is being provided by the National Association of State Mental Health Program Directors Research Institute, Inc. (NRI). NRI is charged with collecting data from state mental health facilities, aggregating the data and providing feedback to the facilities as well as report findings of performance to the Joint Commission.
According to NRI, “forensic clients are those clients having a value for Admission Legal Status of "4" (Involuntary-Criminal) and having any value for justice system involvement (excluding no involvement). Clients with any other combination of codes for these two fields are considered non-forensic.”

Page
21
(Back to Comparative Statistics) (Back to Table of Contents)
COMPARATIVE STATISTICS
Figure CD-29
Client Injury Rate
0.00
0.20
0.40
0.60
0.80
1.00
1.20
1.40
1.60
1.80
2.00
Inju
ries
per 1
000
patie
nt d
ays
Riverview 0.00 0.00 0.52 0.00 0.24 0.25 0.00 0.00 0.51 0.25 0.52 0.76 0.26 0.00 0.24 0.52 0.26
Ntl Mean 0.36 0.46 0.42 0.44 0.37 0.44 0.36 0.40 0.41 0.38 0.34 0.36 0.43 0.33 0.37 0.40 0.64
+1 StDev 1.02 1.05 1.06 1.06 0.81 1.02 0.85 0.86 1.03 1.01 0.79 0.95 0.98 0.81 0.85 0.86 1.43
Jan Feb Mar Apr May Jun Jul Aug Sep Oct Nov Dec Jan Feb Mar Apr May Jun
3rd SFQ 2011 4th SFQ 2011 1st SFQ 2012 2nd SFQ 2012 3rd SFQ 2012 4th SFQ 2012
GOOD
This graph depicts the number of client injury events that occurred for every 1000 inpatient days. For example, a rate of 0.5 means that 1 injury occurred for each 2000 inpatient days.
The NRI standards for measuring client injuries differentiate between injuries that are considered reportable to the Joint Commission as a performance measure and those injuries that are of a less severe nature. While all injuries are currently reported internally, only certain types of injuries are documented and reported to NRI for inclusion in the performance measure analysis process. “Non-reportable” injuries include those that require: 1) No Treatment, or 2) Minor First Aid Reportable injuries include those that require: 3) Medical Intervention, 4) Hospitalization or where, 5) Death Occurred. No Treatment – The injury received by a client may be examined by a clinician but no treatment is
applied to the injury. Minor First Aid – The injury received is of minor severity and requires the administration of minor first
aid. Medical Intervention Needed – The injury received is severe enough to require the treatment of the
client by a licensed practitioner, but does not require hospitalization. Hospitalization Required – The injury is so severe that it requires medical intervention and treatment
as well as care of the injured client at a general acute care medical ward within the facility or at a general acute care hospital outside the facility.
Death Occurred – The injury received was so severe that if resulted in, or complications of the injury lead to, the termination of the life of the injured client.
The comparative statistics graph only includes those events that are considered “Reportable” by NRI.

Page
22
(Back to Comparative Statistics) (Back to Table of Contents)
COMPARATIVE STATISTICS Client Injury Rate
Forensic Stratification
0.00
0.20
0.40
0.60
0.80
1.00
1.20
1.40
1.60
1.80
2.00
Inju
ries
per 1
000
patie
nt d
ays
Riverview 0.00 0.00 0.00 0.00 0.00 0.00 0.00 0.00 0.37 0.36 0.37 0.00 0.00 0.00 0.00 0.32
Ntl Mean 0.26 0.29 0.26 0.33 0.28 0.34 0.22 0.24 0.31 0.27 0.17 0.15 0.22 0.18 0.23 0.21
Jan Feb Mar Apr May Jun Jul Aug Sep Oct Nov Dec Jan Feb Mar Apr May Jun
3rd SFQ 2011 4th SFQ 2011 1st SFQ 2012 2nd SFQ 2012 3rd SFQ 2012 4th SFQ 2012
Client Injury RateCivil Stratification
0.00
0.50
1.00
1.50
2.00
2.50
3.00
Inju
ries
per 1
000
patie
nt d
ays
Riverview 0.00 0.00 1.77 0.00 0.74 0.00 0.00 0.00 0.86 0.00 0.85 2.62 0.95 0.00 0.91 1.32
Ntl Mean 0.47 0.55 0.47 0.53 0.45 0.58 0.46 0.55 0.43 0.47 0.48 0.47 0.51 0.40 0.44 0.55
Dorothea Dix 0.54 0.00 0.00 0.00 0.00 0.00 0.00 0.00 0.00 0.61 0.00 0.66 0.00 0.00 0.00 0.00 1.68
Jan Feb Mar Apr May Jun Jul Aug Sep Oct Nov Dec Jan Feb Mar Apr May Jun
3rd SFQ 2011 4th SFQ 2011 1st SFQ 2012 2nd SFQ 2012 3rd SFQ 2012 4th SFQ 2012
These graphs depict the number of client injury events stratified by forensic or civil classifications that occurred for every 1000 inpatient days. For example, a rate of 0.5 means that 1 injury occurred for each 2000 inpatient days. The hospital-wide results from the Dorothea Dix facility are compared to the civil population results at the Riverview facility due to the homogeneous nature of these two sample groups.

Page
23
(Back to Comparative Statistics) (Back to Table of Contents)
COMPARATIVE STATISTICS ASPECT: SEVERITY OF INJURY BY MONTH
Severity APR MAY JUN 4Q2012 No Treatment 4 9 6 19 Minor First Aid 2 2 1 5 Medical Intervention Required 1 1 Hospitalization Required Death Occurred Total 7 11 7 25 The event that required medical intervention involved a client to client assault. ASPECT: TYPE AND CAUSE OF INJURY BY MONTH
Type - Cause APR MAY JUN 4Q2012 Accident – Fall Unwitnessed 5 5 4 14 Accident – Fall Witnessed 1 1 2 Accident – Other 4 1 5 Assault 1 1 Self-Injurious Behavior 1 2 3 Due to the potential for injury and since falls are the predominant cause of potentially injurious events, fall incidents remain a focus of the hospital. Three of the fall incidents required minor first aid. The remainder required no treatment Falls Risk Management Team has been created to be facilitated by a member of the team with data supplied by the Risk Manager. The role of this team is to conduct root cause analyses on each of the falls incidents and to identify trends and common contributing factors and to make recommendations for changes in the environment and process of care for those clients identified as having a high potential for falls. ASPECT: TYPE OF FALL BY CLIENT AND MONTH
Fall Type Client APR MAY JUN TOTAL
Unwitnessed
MR00000019 1 1 MR00000091 3 3 MR00000092 1 1 MR00000116 1 1 MR00000480 1 1 MR00000814 1 1 MR00002775 1 1 2 MR00003440 1 1 MR00004814 1 1 MR00006705 1 1 MR00006759 1 1
Witnessed MR00000156 1 1 MR00001307 1 1

Page
24
(Back to Comparative Statistics) (Back to Table of Contents)
COMPARATIVE STATISTICS
Figure CD-28
Elopement
0.00
0.10
0.20
0.30
0.40
0.50
0.60
0.70
0.80
0.90
Elop
emen
ts p
er 1
000
patie
nt d
ays
Riverview 0.00 0.00 0.00 0.26 0.00 0.25 0.24 0.00 0.00 0.00 0.00 0.00 0.26 0.00 0.24 0.26 0.00
Ntl Mean 0.17 0.19 0.15 0.17 0.23 0.21 0.19 0.22 0.19 0.13 0.15 0.15 0.15 0.21 0.10 0.17 0.21
StDev 0.39 0.53 0.38 0.39 0.51 0.39 0.39 0.5 0.39 0.3 0.38 0.42 0.4 0.83 0.35 0.43 0.63
Jan Feb Mar Apr May Jun Jul Aug Sep Oct Nov Dec Jan Feb Mar Apr May Jun
3rd SFQ 2011 4th SFQ 2011 1st SFQ 2012 2nd SFQ 2012 3rd SFQ 2012 4th SFQ 2012
GOOD
This graph depicts the number of elopements that occurred for every 1000 inpatient days. For example, a rate of 0.25 means that 1 elopement occurred for each 4000 inpatient days. An elopement is defined as any time a client is “absent from a location defined by the client’s privilege status regardless of the client’s leave or legal status.”

Page
25
(Back to Comparative Statistics) (Back to Table of Contents)
COMPARATIVE STATISTICS Elopement
Forensic Stratification
0.00
0.50
1.00
1.50
2.00
2.50
3.00
3.50
4.00
4.50
5.00
Elop
emen
ts p
er 1
000
patie
nt d
ays
Riverview 0.00 0.00 0.00 0.84 0.00 0.00 0.36 0.00 0.00 0.00 0.00 0.00 0.00 0.00 0.33 0.32
Ntl Mean 0.09 0.06 0.05 0.05 0.07 0.06 0.08 0.09 0.06 0.06 0.07 0.06 0.07 0.06 0.05 0.06 0.07 0.06
Jan Feb Mar Apr May Jun Jul Aug Sep Oct Nov Dec Jan Feb Mar Apr May Jun
3rd SFQ 2011 4th SFQ 2011 1st SFQ 2012 2nd SFQ 2012 3rd SFQ 2012 4th SFQ 2012
ElopementCivil Stratification
0.00
0.50
1.00
1.50
2.00
2.50
3.00
3.50
4.00
4.50
5.00
Elop
emen
ts p
er 1
000
patie
nt d
ays
Riverview 0.00 0.00 0.00 0.00 0.00 0.80 0.00 0.00 0.00 0.00 0.00 0.00 0.95 0.00 0.00 0.00
Ntl Mean 0.17 0.19 0.22 0.23 0.28 0.28 0.26 0.26 0.24 0.19 0.18 0.20 0.14 0.17 0.14 0.16
Dorothea Dix 1.09 3.51 2.18 0.59 1.13 1.65 1.64 1.10 1.10 0.00 0.68 0.66 0.67 0.73 0.00 0.00 0.84
Jan Feb Mar Apr May Jun Jul Aug Sep Oct Nov Dec Jan Feb Mar Apr May Jun
3rd SFQ 2011 4th SFQ 2011 1st SFQ 2012 2nd SFQ 2012 3rd SFQ 2012 4th SFQ 2012
This graph depicts the number of elopements stratified by forensic or civil classifications that occurred for every 1000 inpatient days. For example, a rate of 0.25 means that 1 elopement occurred for each 4000 inpatient days. The hospital-wide results from the Dorothea Dix facility are compared to the civil population results at the Riverview facility due to the homogeneous nature of these two sample groups.

Page
26
(Back to Comparative Statistics) (Back to Table of Contents)
COMPARATIVE STATISTICS Medication Errors
0.00
5.00
10.00
15.00
20.00
25.00
30.00
Even
ts p
er 1
00 e
piso
des
of c
are
Riverview 7.69 4.92 7.20 4.13 3.88 6.15 13.39 6.77 7.58 4.10 4.00 6.84 1.60 4.88 8.87 1.71 10.17
Ntl Mean 2.34 2.65 2.56 2.46 2.32 2.57 2.89 2.73 2.65 2.68 2.71 2.71 2.98 2.92 3.42 2.87 4.45
+1 StDev 5.16 5.61 5.31 5.52 4.72 5.43 6.31 6.03 5.49 5.95 6.52 6.22 6.47 6.74 9.74 6.21 11.39
Jan Feb Mar Apr May Jun Jul Aug Sep Oct Nov Dec Jan Feb Mar Apr May Jun
3rd SFQ 2011 4th SFQ 2011 1st SFQ 2012 2nd SFQ 2012 3rd SFQ 2012 4th SFQ 2012
GOOD
This graph depicts the number of medication error events that occurred for every 100 episodes of care (duplicated client count). For example, a rate of 1.6 means that 2 medication error events occurred for each 125 episodes of care.

Page
27
(Back to Comparative Statistics) (Back to Table of Contents)
COMPARATIVE STATISTICS Medication Errors
Forensic Stratification
0.00
5.00
10.00
15.00
20.00
25.00
30.00
Even
ts p
er 1
00 E
piso
des
of C
are
Riverview 6.15 4.55 5.80 5.88 1.37 5.48 16.67 1.37 5.41 1.54 1.45 5.88 1.41 6.85 4.88 1.20
Ntl Mean 2.05 2.44 3.66 2.09 2.48 2.36 2.25 2.05 1.92 1.86 1.99 1.84 1.94 1.37 2.04 1.88 1.64 2.90
Jan Feb Mar Apr May Jun Jul Aug Sep Oct Nov Dec Jan Feb Mar Apr May Jun
3rd SFQ 2011 4th SFQ 2011 1st SFQ 2012 2nd SFQ 2012 3rd SFQ 2012 4th SFQ 2012
Medication ErrorsCivil Stratification
0.00
5.00
10.00
15.00
20.00
25.00
30.00
Even
ts p
er 1
00 E
piso
des
of C
are
Riverview 1.92 5.36 7.14 1.89 7.14 7.02 3.64 8.33 8.62 5.26 3.57 8.16 1.85 2.00 7.14 2.94
Ntl Mean 2.38 2.33 2.24 2.20 2.31 2.33 2.51 2.23 2.40 2.21 2.37 2.50 2.82 2.49 3.15 2.75
Dorothea Dix 12.36 12.82 8.89 9.21 0.00 14.12 9.52 15.12 14.12 2.90 4.48 6.25 13.64 5.56 1.52 1.52 6.90
Jan Feb Mar Apr May Jun Jul Aug Sep Oct Nov Dec Jan Feb Mar Apr May Jun
3rd SFQ 2011 4th SFQ 2011 1st SFQ 2012 2nd SFQ 2012 3rd SFQ 2012 4th SFQ 2012
This graph depicts the number of medication error events stratified by forensic or civil classifications that occurred for every 100 episodes of care (duplicated client count). For example, a rate of 1.6 means that 2 medication error events occurred for each 125 episodes of care. The hospital-wide results from the Dorothea Dix facility are compared to the civil population results at the Riverview facility due to the homogeneous nature of these two sample groups.

Page
28
(Back to Comparative Statistics) (Back to Table of Contents)
COMPARATIVE STATISTICS 30 Day Readmit
0.00
2.00
4.00
6.00
8.00
10.00
12.00
14.00
16.00
Perc
ent o
f dis
char
ges
that
retu
rn in
30
days
Riverview 8.00 9.52 0.00 9.38 0.00 0.00 3.57 12.50 6.25 6.25 10.53 0.00 0.00 0.00 5.88 0.00 0.00
Ntl Mean 5.20 5.84 5.70 5.98 5.64 5.54 5.09 5.53 5.51 6.00 5.31 5.08 5.96 5.65 5.41 5.83 5.10
+1 StDev 11.12 13.59 12.1 12.27 11.51 11.11 10.47 11.21 11.26 13.53 11.76 10.65 12.61 14.23 10.81 13 10.25
Jan Feb Mar Apr May Jun Jul Aug Sep Oct Nov Dec Jan Feb Mar Apr May Jun
3rd SFQ 2011 4th SFQ 2011 1st SFQ 2012 2nd SFQ 2012 3rd SFQ 2012 4th SFQ 2012
GOOD
This graph depicts the percent of discharges from the facility that returned within 30 days of a discharge of the same client from the same facility. For example, a rate of 10.0 means that 10% of all discharges were readmitted within 30 days.

Page
29
(Back to Comparative Statistics) (Back to Table of Contents)
COMPARATIVE STATISTICS 30 Day Readmit
Forensic Stratification
0.00
5.00
10.00
15.00
20.00
25.00
30.00
Perc
ent o
f Dis
char
ges
that
Ret
urn
in 3
0 D
ays
Riverview 25.00 9.09 0.00 7.69 0.00 0.00 0.00 0.00 10.00 13.33 0.00 0.00 0.00 0.00 0.00 0.00 0.00
Ntl Mean 3.53 4.19 4.13 4.25 4.02 3.69 3.84 3.25 3.20 2.86 3.03 2.32 2.90 2.86 3.74 3.00 3.05
Jan Feb Mar Apr May Jun Jul Aug Sep Oct Nov Dec Jan Feb Mar Apr May Jun
3rd SFQ 2011 4th SFQ 2011 1st SFQ 2012 2nd SFQ 2012 3rd SFQ 2012 4th SFQ 2012
30 Day Readmit Civil Stratification
0.00
5.00
10.00
15.00
20.00
25.00
30.00
Perc
ent o
f Dis
char
ges
that
Ret
urn
in 3
0 D
ays
Riverview 4.76 10.00 0.00 10.53 0.00 0.00 6.25 23.08 4.55 0.00 16.67 0.00 0.00 0.00 0.00 9.09 0.00
Ntl Mean 7.93 8.09 8.37 8.00 8.02 8.27 8.12 8.55 8.39 8.00 7.82 7.54 8.14 8.28 7.79 7.84 7.97
Dorothea Dix 8.33 11.54 0.00 11.76 10.00 0.00 20.00 20.00 16.00 1.17 20.00 0.00 13.33 6.25 8.00 5.26 0.00
Jan Feb Mar Apr May Jun Jul Aug Sep Oct Nov Dec Jan Feb Mar Apr May Jun
3rd SFQ 2011 4th SFQ 2011 1st SFQ 2012 2nd SFQ 2012 3rd SFQ 2012 4th SFQ 2012
This graph depicts the percent of discharges from the facility that returned within 30 days of a discharge of the same client from the same facility stratified by forensic or civil classifications. For example, a rate of 10.0 means that 10% of all discharges were readmitted within 30 days. The hospital-wide results from the Dorothea Dix facility are compared to the civil population results at the Riverview facility due to the homogeneous nature of these two sample groups.

Page
30
(Back to Comparative Statistics) (Back to Table of Contents)
COMPARATIVE STATISTICS Percent of Clients Restrained
0.00
5.00
10.00
15.00
20.00
25.00
Perc
ent o
f clie
nts
rest
rain
ed a
t lea
se o
nce
Riverview 5.13 6.56 5.69 6.61 4.65 8.53 4.80 5.38 9.09 1.65 6.45 5.13 5.60 8.94 5.65 10.26 5.13
Ntl Mean 6.44 6.21 6.53 6.61 6.29 6.62 6.64 6.64 6.58 6.73 6.92 6.85 7.51 6.76 7.09 6.89 7.37
+1 StDev 13.72 13.29 13.51 14.15 12.95 13.8 13.47 13.63 13.91 14.18 14.01 14.53 16.1 12.59 14.26 14.77 16.54
Jan Feb Mar Apr May Jun Jul Aug Sep Oct Nov Dec Jan Feb Mar Apr May Jun
3rd SFQ 2011 4th SFQ 2011 1st SFQ 2012 2nd SFQ 2012 3rd SFQ 2012 4th SFQ 2012
GOOD
This graph depicts the percent of unique clients who were restrained at least once – includes all forms of restraint of any duration. For example, a rate of 4.0 means that 4% of the unique clients served were restrained at least once.

Page
31
(Back to Comparative Statistics) (Back to Table of Contents)
COMPARATIVE STATISTICS Percent of Clients Restrained
Forensic Stratification
0
5
10
15
20
25
Perc
ent o
f Clie
nts
Res
trai
ned
At L
east
Onc
e
Riverview 0 4.55 2.9 2.94 1.37 5.48 5.56 5.56 5.41 0 2.9 2.94 1.41 4.11 3.66 7.23
Ntl Mean 3.41 3.64 3.74 3.85 3.47 4.09 4.13 3.96 4.07 4.35 4.28 3.98 3.94 4.22 4.18 4.57 4.44 4.59
Jan Feb Mar Apr May Jun Jul Aug Sep Oct Nov Dec Jan Feb Mar Apr May Jun
3rd SFQ 2011 4th SFQ 2011 1st SFQ 2012 2nd SFQ 2012 3rd SFQ 2012 4th SFQ 2012
Percent of Clients Restrained Civil Stratification
0
5
10
15
20
25
Perc
ent o
f Clie
nts
Res
trai
ned
At L
east
Onc
e
Riverview 11.54 8.93 9.26 11.32 8.93 12.5 3.77 5.17 13.79 3.57 10.91 8.16 11.11 16 9.52 17.65
Ntl Mean 6.03 5.67 5.93 6.1 5.91 6.18 6.14 6.12 5.86 6.28 6.56 6.36 6.74 6.75 6.85 6.61
Dorothea Dix 8.14 5.13 5.75 8.00 5.26 10.84 7.41 8.43 6.02 4.41 9.09 6.45 3.03 5.71 4.55 1.54 7.14
Jan Feb Mar Apr May Jun Jul Aug Sep Oct Nov Dec Jan Feb Mar Apr May Jun
3rd SFQ 2011 4th SFQ 2011 1st SFQ 2012 2nd SFQ 2012 3rd SFQ 2012 4th SFQ 2012
This graph depicts the percent of unique clients who were restrained at least once stratified by forensic or civil classifications – includes all forms of restraint of any duration. For example, a rate of 4.0 means that 4% of the unique clients served were restrained at least once. The hospital-wide results from the Dorothea Dix facility are compared to the civil population results at the Riverview facility due to the homogeneous nature of these two sample groups.

Page
32
(Back to Comparative Statistics) (Back to Table of Contents)
COMPARATIVE STATISTICS
Figure CD-24
Restraint Hours
0.00
0.50
1.00
1.50
2.00
2.50
Res
trai
nt h
ours
per
100
0 in
patie
nt h
ours
Riverview 0.01 0.06 0.03 0.10 0.02 0.03 0.01 0.03 0.04 0.00 0.04 0.02 0.02 0.03 0.01 0.12 0.04
Ntl Mean 0.36 0.42 0.36 0.39 0.33 0.32 0.37 0.34 0.38 0.35 0.39 0.37 0.45 0.49 0.50 0.46 0.43
+1 StDev 1.35 1.58 1.13 1.35 1.04 0.991 1.19 1.02 1.31 1.05 1.48 1.16 1.42 1.85 2.03 1.64 1.31
Jan Feb Mar Apr May Jun Jul Aug Sep Oct Nov Dec Jan Feb Mar Apr May Jun
3rd SFQ 2011 4th SFQ 2011 1st SFQ 2012 2nd SFQ 2012 3rd SFQ 2012 4th SFQ 2012
GOOD
This graph depicts the number of hours clients spent in restraint for every 1000 inpatient hours - includes all forms of restraint of any duration. For example, a rate of 1.6 means that 2 hours were spent in restraint for each 1250 inpatient hours.

Page
33
(Back to Comparative Statistics) (Back to Table of Contents)
COMPARATIVE STATISTICS Restraint Hours
Forensic Stratification
0.00
0.50
1.00
1.50
2.00
2.50
Res
trai
nt H
ours
per
100
0 In
patie
nt H
ours
Riverview 0.00 0.03 0.00 0.10 0.00 0.03 0.02 0.05 0.02 0.00 0.03 0.00 0.00 0.02 0.01 0.06
Ntl Mean 0.51 0.48 0.52 0.54 0.49 0.40 0.36 0.48 0.51 0.52 0.51 0.52 0.70 0.71 0.83 0.68
Jan Feb Mar Apr May Jun Jul Aug Sep Oct Nov Dec Jan Feb Mar Apr May Jun
3rd SFQ 2011 4th SFQ 2011 1st SFQ 2012 2nd SFQ 2012 3rd SFQ 2012 4th SFQ 2012
Restraint Hours Civil Stratification
0.00
0.50
1.00
1.50
2.00
2.50
Res
trai
nt H
ours
per
100
0 In
patie
nt H
ours
Riverview 0.03 0.10 0.08 0.09 0.04 0.03 0.00 0.00 0.07 0.00 0.05 0.04 0.05 0.04 0.02 0.31
Ntl Mean 0.37 0.40 0.41 0.37 0.32 0.39 0.46 0.37 0.42 0.33 0.46 0.38 0.49 0.61 0.53 0.51
Dorothea Dix 0.02 0.01 0.01 0.01 0.00 0.02 0.01 0.01 0.00 0.00 0.02 0.05 0.23 0.05 0.00 0.00 0.00
Jan Feb Mar Apr May Jun Jul Aug Sep Oct Nov Dec Jan Feb Mar Apr May Jun
3rd SFQ 2011 4th SFQ 2011 1st SFQ 2012 2nd SFQ 2012 3rd SFQ 2012 4th SFQ 2012
This graph depicts the number of hours clients spent in restraint for every 1000 inpatient hours stratified by forensic or civil classifications - includes all forms of restraint of any duration. For example, a rate of 1.6 means that 2 hours were spent in restraint for each 1250 inpatient hours. The hospital-wide results from the Dorothea Dix facility are compared to the civil population results at the Riverview facility due to the homogeneous nature of these two sample groups.

Page
34
(Back to Comparative Statistics) (Back to Table of Contents)
COMPARATIVE STATISTICS Percent of Clients Secluded
0.00
1.00
2.00
3.00
4.00
5.00
6.00
7.00
8.00
9.00
Perc
ent o
f clie
nts
secl
uded
at l
ease
onc
e
Riverview 4.27 4.92 3.25 6.61 3.88 3.88 6.40 4.62 5.30 1.65 4.84 2.56 4.80 5.69 4.84 6.84 6.84
Ntl Mean 2.57 2.60 2.71 2.80 2.64 2.66 2.71 2.63 2.62 2.79 2.77 2.56 2.86 2.77 3.04 2.35 2.08
+1 StDev 7.17 7.42 7.68 7.8 7.21 7.5 7.49 7.51 7.02 7.34 7.46 6.88 8.03 7.51 8.11 5.92 5.46
Jan Feb Mar Apr May Jun Jul Aug Sep Oct Nov Dec Jan Feb Mar Apr May Jun
3rd SFQ 2011 4th SFQ 2011 1st SFQ 2012 2nd SFQ 2012 3rd SFQ 2012 4th SFQ 2012
GOOD
This graph depicts the percent of unique clients who were secluded at least once. For example, a rate of 3.0 means that 3% of the unique clients served were secluded at least once.
Page
35
(Back to Comparative Statistics) (Back to Table of Contents)
COMPARATIVE STATISTICS Percent of Clients Secluded
Forensic Stratification
0.00
1.00
2.00
3.00
4.00
5.00
6.00
7.00
8.00
9.00
10.00
Perc
ent o
f Clie
nts
Secl
uded
At L
east
Onc
e
Riverview 1.54 1.52 0.00 4.41 2.74 2.74 5.56 5.56 4.05 1.54 4.35 2.94 1.41 2.74 4.88 6.02
Ntl Mean 2.04 1.90 2.14 2.16 2.28 2.18 2.14 1.85 2.03 1.92 1.99 2.02 2.32 1.95 2.25 1.79
Jan Feb Mar Apr May Jun Jul Aug Sep Oct Nov Dec Jan Feb Mar Apr May Jun
3rd SFQ 2011 4th SFQ 2011 1st SFQ 2012 2nd SFQ 2012 3rd SFQ 2012 4th SFQ 2012
Percent of Clients Secluded Civil Stratification
0.00
1.00
2.00
3.00
4.00
5.00
6.00
7.00
8.00
9.00
10.00
Perc
ent o
f Clie
nts
Secl
uded
At L
east
Onc
e
Riverview 7.69 8.93 7.41 9.43 5.36 5.36 7.55 3.45 6.9 1.79 5.45 2.04 9.26 10 4.76 8.82
Ntl Mean 2.52 2.28 2.49 2.59 2.43 2.4 2.5 2.36 2.29 2.55 2.53 2.43 2.62 2.7 2.7 2.48
Dorothea Dix 5.81 3.85 3.45 8.00 2.63 3.61 3.70 3.61 2.41 1.47 4.55 1.61 0.00 2.86 3.03 0.00 7.14
Jan Feb Mar Apr May Jun Jul Aug Sep Oct Nov Dec Jan Feb Mar Apr May Jun
3rd SFQ 2011 4th SFQ 2011 1st SFQ 2012 2nd SFQ 2012 3rd SFQ 2012 4th SFQ 2012
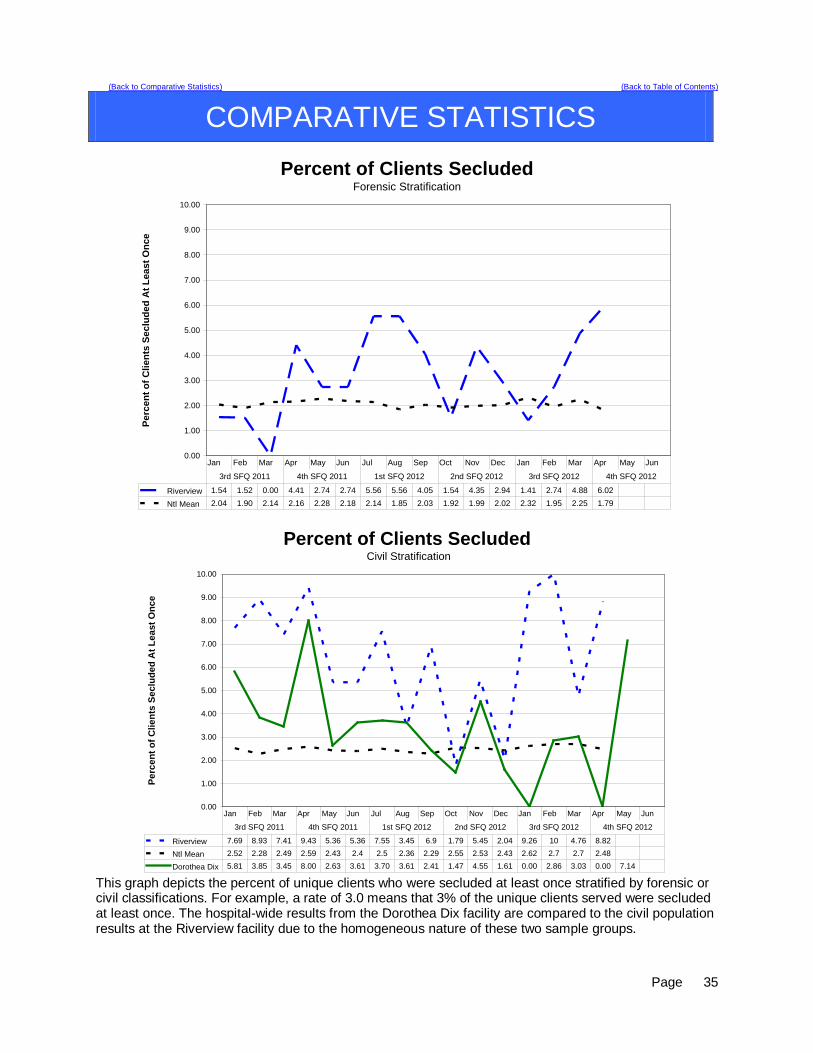
This graph depicts the percent of unique clients who were secluded at least once stratified by forensic or civil classifications. For example, a rate of 3.0 means that 3% of the unique clients served were secluded at least once. The hospital-wide results from the Dorothea Dix facility are compared to the civil population results at the Riverview facility due to the homogeneous nature of these two sample groups.

Page
36
(Back to Comparative Statistics) (Back to Table of Contents)
COMPARATIVE STATISTICS
Figure CD-23
Seclusion Hours
0.00
0.50
1.00
1.50
2.00
2.50
3.00
3.50
4.00
Secl
usio
n ho
urs
per 1
000
inpa
tient
hou
rs
Riverview 0.41 0.24 0.10 0.27 0.18 2.25 0.29 0.15 0.69 0.02 0.45 0.09 0.42 0.26 0.58 1.55 3.68
Ntl Mean 0.35 0.37 0.31 0.29 0.27 0.29 0.25 0.28 0.31 0.31 0.30 0.30 0.37 0.40 0.39 0.28 0.31
+1 StDev 1.63 1.76 1.27 1.14 1.13 1.07 1.03 1.26 1.55 1.33 1.21 1.4 1.75 1.98 1.84 1.5 1.77
Jan Feb Mar Apr May Jun Jul Aug Sep Oct Nov Dec Jan Feb Mar Apr May Jun
3rd SFQ 2011 4th SFQ 2011 1st SFQ 2012 2nd SFQ 2012 3rd SFQ 2012 4th SFQ 2012
GOOD
This graph depicts the number of hours clients spent in seclusion for every 1000 inpatient hours. For example, a rate of 0.8 means that 1 hour was spent in seclusion for each 1250 inpatient hours. This graph reflects the events related to a single individual during the month of May. This individual has been in seclusion for extended periods of time due to extremely aggressive behaviors that are focused on staff. It was determined that the only way to effectively manage this client and create a safe environment for both the staff and other clients was to segregate him in an area away from other clients and to provide frequent support and interaction with staff during this period.

Page
37
(Back to Comparative Statistics) (Back to Table of Contents)
COMPARATIVE STATISTICS Seclusion Hours
Forensic Stratification
0
0.5
1
1.5
2
2.5
3
Secl
usio
n H
ours
per
100
0 In
patie
nt H
ours
Riverview 0.57 0.08 0 0.04 0.26 2.72 0.33 0.18 0.09 0.02 0.34 0.11 0.1 0.12 0.69 0.5
Ntl Mean 0.4 0.41 0.45 0.48 0.49 0.48 0.4 0.38 0.53 0.41 0.55 0.51 0.59 0.52 0.62 0.39
Jan Feb Mar Apr May Jun Jul Aug Sep Oct Nov Dec Jan Feb Mar Apr May Jun
3rd SFQ 2011 4th SFQ 2011 1st SFQ 2012 2nd SFQ 2012 3rd SFQ 2012 4th SFQ 2012
Seclusion Hours Civil Stratification
0
0.5
1
1.5
2
2.5
3
3.5
4
4.5
5
Secl
usio
n H
ours
per
100
0 In
patie
nt H
ours
Riverview 0.19 0.48 0.27 0.59 0.06 1.54 0.23 0.09 1.61 0.02 0.62 0.06 1 0.51 0.37 4.64
Ntl Mean 0.47 0.53 0.4 0.35 0.28 0.29 0.24 0.27 0.31 0.28 0.26 0.27 0.4 0.41 0.38 0.31
Dorothea Dix 1.93 0.13 0.05 0.33 0.07 0.53 0.44 0.25 0.02 0.02 0.33 0.02 0.00 0.10 0.38 0.00 0.22
Jan Feb Mar Apr May Jun Jul Aug Sep Oct Nov Dec Jan Feb Mar Apr May Jun
3rd SFQ 2011 4th SFQ 2011 1st SFQ 2012 2nd SFQ 2012 3rd SFQ 2012 4th SFQ 2012
This graph depicts the number of hours clients spent in seclusion for every 1000 inpatient hours stratified by forensic or civil classifications. For example, a rate of 0.8 means that 1 hour was spent in seclusion for each 1250 inpatient hours. The hospital-wide results from the Dorothea Dix facility are compared to the civil population results at the Riverview facility due to the homogeneous nature of these two sample groups.

Page
38
(Back to Comparative Statistics) (Back to Table of Contents)
COMPARATIVE STATISTICS
Confinement Event Breakdown
Manual
Hold Mechanical Restraint
Locked Seclusion Grand Total % of Total
Cumulative %
MR00002951 25 24 49 32% 32% MR00003374 17 6 25 48 31% 63% MR00006799 5 8 13 8% 71% MR00000477 3 3 2 8 5% 76% MR00002775 4 3 7 5% 81% MR00000045 2 1 3 2% 83% MR00000091 2 1 3 2% 85% MR00000092 2 1 3 2% 86% MR00004271 1 2 3 2% 88% MR00000116 1 1 2 1% 90% MR00005625 1 1 2 1% 91% MR00006314 1 1 2 1% 92% MR00006816 2 2 1% 94% MR00006898 1 1 2 1% 95% MR00000115 1 1 1% 95% MR00000175 1 1 1% 96% MR00000668 1 1 1% 97% MR00000738 1 1 1% 97% MR00005267 1 1 1% 98% MR00006145 1 1 1% 99% MR00006563 1 1 1% 99% MR00006695 1 1 1% 100% Grand Total 70 11 74 155
28% (22/80) of average hospital population experienced some form of confinement event during the 4th fiscal quarter 2012. Seven of these clients (9% of the average hospital population) accounted for 85% of the containment events. Figure CD-25, CD-26
Factors of Causation Related to All Confinement Events (Manual Hold, Mechanical Restraint, Seclusion)
Year End Mar 2012 Jul Aug Sep Oct Nov Dec Jan Feb Mar Apr May Jun Danger to Others/Self 24 19 42 3 22 16 22 22 24 73 46 34 Danger to Others 1 1 2 1 Danger to Self 1 1 1 % Dangerous Precipitation 100% 100% 100% 100% 100% 100% 100% 100% 100% 100% 100% 100% Total Events 24 19 42 4 23 16 22 23 26 74 47 34

Page
39
(Back to Comparative Statistics) (Back to Table of Contents)
COMPARATIVE STATISTICS
Figure CD-42 Confinement Events Management
Seclusion Events (74) Events Standard Threshold Compliance The record reflects that seclusion was absolutely necessary to protect the patient from causing physical harm to self or others, or if the patient was examined by a physician or physician extender prior to implementation of seclusion, to prevent further serious disruption that significantly interferes with other patients’ treatment.
95% 100%
The record reflects that lesser restrictive alternatives were inappropriate or ineffective. This can be reflected anywhere in record.
90% 100%
The record reflects that the decision to place the patient in seclusion was made by a physician or physician extender.
90% 100%
The decision to place the patient in seclusion was entered in the patient’s records as a medical order.
90% 100%
The record reflects that, if the physician or physician extender was not immediately available to examine the patient, the patient was placed in seclusion following an examination by a nurse.
90% 100%
The record reflects that the physician or physician extender personally evaluated the patient within 30 minutes after the patient has been placed in seclusion, and if there is a delay, the reasons for the delay.
90% 100%
The record reflects that the patient was monitored every 15 minutes. (Compliance will be deemed if the patient was monitored at least 3 times per hour.)
90% 100%
Individuals implementing seclusion have been trained in techniques and alternatives.
90% 100%
The record reflects that reasonable efforts were taken to notify guardian or designated representative as soon as possible that patient was placed in seclusion.
75% 100%
Standard Threshold Compliance The medical order states time of entry of order and that number of hours in seclusion shall not exceed 4.
85% 100%
The medical order states the conditions under which the patient may be sooner released.
85% 100%
The record reflects that the need for seclusion is re-evaluated at least every 2 hours by a nurse.
90% 100%
The record reflects that the 2 hour re-evaluation was conducted while the patient was out of seclusion room unless clinically contraindicated.
70% 100%
The record includes a special check sheet that has been filled out to document reason for seclusion, description of behavior and the lesser restrictive alternatives considered.
85% 100%
The record reflects that the patient was released, unless clinically contraindicated, at least every 2 hours or as necessary for eating, drinking, bathing, toileting or special medical orders.
85% 100%
Reports of seclusion events were forwarded to medical director and advocate.
90% 100%
The record reflects that, for persons with mental retardation, the regulations governing seclusion of clients with mental retardation were met.
85% 100%
The medical order for seclusion was not entered as a PRN order.
90% 100%
Where there was a PRN order, there is evidence that physician was counseled.
95% N/A

Page
40
(Back to Comparative Statistics) (Back to Table of Contents)
COMPARATIVE STATISTICS
Figure CD-43 Confinement Events Management
Mechanical Restraint Events (11) Events Standard Threshold Compliance The record reflects that restraint was absolutely necessary to protect the patient from causing serious physical injury to self or others.
95% 100%
The record reflects that lesser restrictive alternatives were inappropriate or ineffective.
90% 100%
The record reflects that the decision to place the patient in restraint was made by a physician or physician extender
90% 100%
The decision to place the patient in restraint was entered in the patient’s records as a medical order.
90% 100%
The record reflects that, if a physician or physician extended was not immediately available to examine the patient, the patient was placed in restraint following an examination by a nurse.
90% 100%
The record reflects that the physician or physician extender personally evaluated the patient within 30 minutes after the patient has been placed in restraint, or, if there was a delay, the reasons for the delay.
90% 100%
The record reflects that the patient was kept under constant observation during restraint.
95% 100%
Individuals implementing restraint have been trained in techniques and alternatives.
90% 100%
The record reflects that reasonable efforts taken to notify guardian or designated representative as soon as possible that patient was placed in restraint.
75% 100%
The medical order states time of entry of order and that number of hours shall not exceed four.
90% 100%
The medical order shall state the conditions under which the patient may be sooner released.
85% 100%
Standard Threshold Compliance The record reflects that the need for restraint was re-evaluated every 2 hours by a nurse.
90% 100%
The record reflects that re-evaluation was conducted while the patient was free of restraints unless clinically contraindicated.
70% 100%
The record includes a special check sheet that has been filled out to document the reason for the restraint, description of behavior and the lesser restrictive alternatives considered.
85% 100%
The record reflects that the patient was released as necessary for eating, drinking, bathing, toileting or special medical orders.
90% 100%
The record reflects that the patient’s extremities were released sequentially, with one released at least every fifteen minutes.
90% 100%
Copies of events were forwarded to medical director and advocate.
90% 100%
For persons with mental retardation, the applicable regulations were met.
85% 100%
The record reflects that the order was not entered as a PRN order.
90% 100%
Where there was a PRN order, there is evidence that physician was counseled.
95% N/A
A restraint event that exceeds 24 hours will be reviewed against the following requirement: If total consecutive hours in restraint, with renewals, exceeded 24 hours, the record reflects that the patient was medically assessed and treated for any injuries; that the order extending restraint beyond 24 hours was entered by Medical Director (or if the Medical Director is out of the hospital, by the individual acting in the Medical Director’s stead) following examination of the patient; and that the patient’s guardian or representative has been notified.
90% 100%

Page
41
(Back to Comparative Statistics) (Back to Table of Contents)
COMPARATIVE STATISTICS
Medication Administration during Behavioral Events
Jan Feb Mar Apr May Jun Jul Aug Sep Oct Nov Dec
2012 Total
2011 Total
COURTN 7 COURTY 3 GUARDN 1 2 3 39 GUARDY 1 1 3 5 33 PEMEDSN 5 7 6 7 1 26 33 PEMEDSY 3 2 6 7 1 19 50 PRNY 11 14 12 8 3 48 153 Total Meds Admin 20 25 29 22 * 5 * 0 101 317 Percent Unwilling 25% 32% 28% 32% 20% -- 29% 24.9%
4th FQ 2012 COURTN GUARDN PEMEDSN TOTAL Percent Cum % MR00002951 6 6 75.0% 75.0% MR00006799 1 1 12.5% 87.5% MR00002775 1 1 12.5% 100,0% Total 8 8
All unwilling administrations of medications were supported by a court order, a guardian order, or the declaration of a psychiatric emergency.
* A data entry failure prevented the complete recording of events beginning mid-May 2012 through the end of the quarter. The numbers reflected are incomplete tallies of event related medication administrations.
COURTN = Court ordered medication administration, client unwilling COURTY = Court ordered medication administration, client willing GUARDN = Guardian permission for medication administration, client unwilling GUARDY = Guarding permission for medication administration, client willing PEMEDSN = Psychiatric Emergency declared, client unwilling PEMEDSY = Psychiatric Emergency declared, client willing PRNY = PRN medications offered, client willing

Page
42
(Glossary of Terms, Acronyms & Abbreviations) (Back to Table of Contents)
DIETARY ASPECT: CLEANLINESS OF MAIN KITCHEN
Indicators
Quarterly % Compliance
Threshold Percentile
Apr ‘12- Jun ‘12
Jan. ’12- Mar. ‘12
Oct. ’11- Dec. ‘11
Jul. ’11- Sep. ‘11
Apr ‘11- Jun ‘11
Jan. ’11- Mar. ‘11
1. All convection ovens (4) were thoroughly cleaned monthly. 83%
(10 of 12)
100%
(12 of 12)
100%
(12 of 12)
75% (9 of 12)
100%
(12 of 12)
100%
(12 of 12)
100%
2. Dish machine was de-limed monthly 100%
(3 of 3) 100%
(3 of 3) 100%
(3 of 3) 100%
(3 of 3) 100%
(3 of 3) 100%
(3 of 3) 100%
1. Shelves (6) used for storage
of clean pots and pans were cleaned monthly
66% (6 of 9)
100% (18 of 18)
100% (18 of 18)
100% (18 of 18)
100% (9 of 9)
100% (18 of 18)
100%
4. Knife cabinet was thoroughly cleaned monthly 100%
(3 of 3) 100%
(3 of 3) 100%
(3 of 3) 100%
(3 of 3) 100%
(3 of 3) 100%
(3 of 3) 100%
5. Walk in coolers were cleaned thoroughly monthly. 100%
(6 of 6) 100%
(6 of 6) 100%
(6 of 6) 100%
(6 of 6) 100%
(6 of 6) 100%
(6 of 6) 100%
6. Steam kettles (2) were cleaned thoroughly on a weekly basis
100% (26 of 26)
100% (26 of 26)
77% (20 of 26)
54% (14 of 26)
100% (26 of 26)
100% (26 of 26)
95%
7. All trash cans (4) and bins (1) were cleaned daily 94.8%
(518 of 546)
99.2%
(542 of 546)
98.7% (454 of 460)
99% (548 of 552)
97% (530 of 546)
89%
(401 of 450)
95%
8. All carts(9) used for food transport (tiered) were cleaned daily
100% (819 of 819)
99.9% (818 of 819)
100% (828 of 828)
100% (828 of 828)
99.4% (814 of 819)
97.7% (792 of 810)
100%
9. All hand sinks (4) were cleaned daily 100%
(364 of364)
100% (364 of 364)
100% (368 of 368)
100% (368 of 368)
100% (364
of364)
100% (360 of 360)
95%
10. Racks(3) used for drying dishes were cleaned daily 100%
(273 of 273)
100% (273 of 273)
96.7% (267of 276)
98% (270 of 276)
98.9% (270 of 273)
98.8% (267 of 270)
100%
Summary
These indicators are based on state and federal compliance standards. Sanitary conditions shall be maintained in the storage, preparation and distribution of food throughout the facility. Written cleaning and sanitizing assignments shall be posted and implemented for all equipment, food contact surfaces, work areas and storage areas.

Page
43
(Glossary of Terms, Acronyms & Abbreviations) (Back to Table of Contents)
DIETARY
• Threshold percentiles have been adjusted to reflect a measurement reflective of the severity of a
negative outcome of the task. • The decline seen regarding cleaning shelves was due to an error in the new system used to assign
tasks to employees. • The decline seen regarding cleaning the ovens was due to a vacancy.
Overall Compliance: 98.3%
Actions: • The procedure used for assigning cleaning tasks has been redefined. • Interviews are in progress to fill the Cook II vacancy; the tasks of cleaning the oven has been
reassigned. • FSM reviews all daily cleaning schedules on a daily basis to assure staff completion. • The weekly staff meeting includes review of the past weeks completion rates. • Results of this CPI indicator will be discussed with staff. ASPECT: TIMELINESS OF NUTRITIONAL ASSESSMENT
Indicator
Quarterly % Compliance
Threshold Percentile
Apr ‘12- Jun ‘12
Jan. ’12- Mar. ‘12
Oct. ’11- Dec. ‘11
Jul. ’11- Sep. ‘11
Apr ‘11- Jun ‘11
Jan. ’11- Mar. ‘11
A nutrition assessment is completed within 5 days of admission when risk is identified via the nutrition
100%
(63 of 63)
100%
(69 of 69)
100%
(63 of 63)
100%
(87 of 87)
100%
(76 of 76)
100%
(75 of 75) 100%
Summary All assessments completed within 5 days of admission. Overall Compliance: 100%
Actions • The nutrition screen, which is part of the Initial Nursing Assessment and Admission Data, will be
completed by nursing within 24 hours of admission. • The Dietitian reviews the nutrition screening to determine whether the client is at nutrition risk. • Nursing will contact the Dietary Department at 287-7248 if an Urgent consult is required. Dietary staff
will then contact the Registered Dietitian/Dietetic Technician Registered. This includes weekends and holidays. The RD/DTR will respond by telephone or with an on-site follow-up as deemed appropriate within 24 hours. Nursing must document in the progress notes any recommendations made by the RD/DTR.

Page
44
(Glossary of Terms, Acronyms & Abbreviations) (Back to Table of Contents)
HARBOR TREATMENT MALL
Aspect: Harbor Mall Hand-off Communication
Indicators Current Findings 4Q2012 3Q2012 2Q2012 1Q2012
Threshold Percentile
1. Hand-off communication sheet was received at the Harbor Mall within the designated time frame.
18 of 42 43% 55% 55% 62% 100%
2. RN signature/Harbor Mall staff signatures present.
42 of 42 100% 100% 100% 98% 100%
3. SBAR information completed from the units to the Harbor Mall.
29 of 42 69%
40%
40%
43%
100%
4. SBAR information completed from the Harbor Mall to the receiving unit.
41 of 42 98%
95%
95%
76%
100%
Summary This is the fourth quarterly report for this year. All units were made aware of the criteria that would be monitored in order to ensure that the hand-off communication process for the Harbor Mall is being done properly. Indicator number one was 62% for the first quarter, 55% for the second quarter, increased to 62% for the third quarter and decreased to 43% for this quarter. Indicator number two was 98% for the first quarter and increased to 100% for the second, third and fourth quarter. Indicator number three was 43% in the first quarter, 40% for the second quarter, 48% for the third quarter and 69% for this quarter. Indicator number four was 76% in the first quarter, 95% for the second quarter, 98% for the third and fourth quarter.
Indicator #1-Twenty-four of the hand-off communication sheets did not arrive to the Harbor Mall within the allotted time frame and eighteen did. This sheet is to be brought to the mall no later than 5 minutes before the start of groups and this did not happen on twenty-four of the sheets that were reviewed for this quarter. The PSD for the mall will remind each of the units what the protocol is for the hand-off sheet to ensure that the information reaches the mall in time to be relayed to group leaders.
Indicator #2- Indicator#2 was 98% for the first quarter and 100% for the second, third, and fourth quarter.
Indicator #3- Twenty-two of the 42 sheets reviewed did not have any client concerns or comments from the units written for the Harbor Mall and/or did not state no issues to report on the HOC. Twenty of the sheets reflected concerns or comments from the units. The PSD for the Harbor Mall will review the need for accuracy in completing the HOC sheet with each of the units.
Indicator #4 – One of the 42 sheets reviewed did not have any client concerns or comments from the Harbor Mall back to the units and/or did not state know issues to report on the HOC sheet. Forty one of the sheets did reflect concern or comments from the Harbor Mall.
Actions PSD will continue to randomly audit all the hand-off communication sheets received from the units. Any patterns from one particular unit will be reported to that unit’s PSD in order to ensure accurate and timely communication between the two areas.

Page
45
(Glossary of Terms, Acronyms & Abbreviations) (Back to Table of Contents)
HEALTH INFORMATION MANAGEMENT ASPECT: DOCUMENTATION & TIMELINESS
Indicators Findings 4Q2012 3Q2012 2Q23012
1Q2012 Threshold Percentile
Records will be completed within Joint Commission standards, state requirements and Medical Staff bylaws timeframes.
There were 59 discharges in
quarter 4 2012 (as of 6/22/12 when this report was completed). Of those, 57 were
completed by 30 days.
97 % 86 % 97 % 97 % 80%
Discharge summaries will be completed within 15 days of discharge.
58 out of 59 discharge
summaries were completed within
15 days of discharge during quarter 4 2012.
98 % 100 % 100 % 99 % 100%
All forms/revisions to be placed in the medical record will be approved by the Medical Records Committee.
1 form was approved/ revised in quarter 4 2012
(see minutes).
100% 100% 100% 100% 100%
Medical transcription will be timely and accurate.
Out of 1163 dictated reports,
1133 were completed within
24 hours.
97% 90% 89% 93% 90%
Summary The indicators are based on the review of all discharged records. There was 97% compliance with record completion. There was 98% compliance with discharge summary completion. Weekly “charts needing attention” lists are distributed to medical staff, including the Medical Director, along with the Superintendent, Risk Manager and the Quality Improvement Manager. There was 97% compliance with timely & accurate medical transcription services. Actions Continue to monitor the compliance rate of each measure and work closely with the Medical Director to identify barriers to on-time completion of medical records according to the prescribed timeline.

Page
46
(Glossary of Terms, Acronyms & Abbreviations) (Back to Table of Contents)
HEALTH INFORMATION MANAGEMENT
ASPECT: CONFIDENTIALITY
Indicators 4Q2012 3Q2012 2Q2012 1Q2012 Threshold Percentile
All client information released from the Health Information department will meet all Joint Commission, State, Federal & HIPAA standards.
100%
Client Info 192
Police Check 6044
100%
Client Info 138
Police Check 3238
100%
Client Info 204
Police Check 2520
100%
Client Info 181
Police Check 2638
100%
All new employees/contract staff will attend confidentiality/HIPAA training.
100%
New Staffs
17
100%
New Staffs
17
100%
New Staffs
28
100%
New Staffs
22
100%
Confidentiality/Privacy issues tracked through incident reports.
100% Privacy
Incidents 0
100% Privacy
Incidents 1
100%
Privacy Incidents
2
100%
Privacy Incidents
0
100%
Summary The indicators are based on the review of all requests for information, orientation for all new employees/contract staff and confidentiality/privacy-related incident reports. No problems were found in quarter 4 related to release of information from the Health Information department and training of new employees/contract staff, however compliance with current law and HIPAA regulations need to be strictly adhered to requiring training, education and policy development at all levels. Actions The above indicators will continue to be monitored.

Page
47
(Glossary of Terms, Acronyms & Abbreviations) (Back to Table of Contents)
HOUSEKEEPING ASPECT: LINEN CLEANLINESS AND QUALITY
Indicators
Quarterly % Compliance Threshold
Percentile Apr ‘12- Jun ‘12
Jan. ’12- Mar. ‘12
Oct. ’11- Dec. ‘11
Jul. ’11- Sep. ‘11
Apr ‘11- Jun ‘11
Jan. ’11- Mar. ‘11
1. Was linen clean coming back from vendor?
100%
(58 of 58)
97%
(57of 59)
88% (22 of 25)
80%
(24 of 30)
98% (45 of 46)
100%
(34 of 34)
100%
2. Was linen free of any holes or rips coming back from vendor?
98%
(57 of 58)
100% (59 of 59)
88% (22 of 25)
97%
(29 of 30)
98% (45 of 46)
92%
(31 of 34)
95%
3. Did we have enough linen on units via complaints from unit staff?
98%
(57 of 58)
100% (59 of 59)
100% (25 of 25)
100%
(30 of 30)
98% (45 of 46)
88%
(30 of 34)
90%
4. Was linen covered on units?
98%
(57 of 58)
100% (59 of 59)
100% (25 of 25)
100%
(30 of 30)
100% (46 of 46)
97%
(33 of 34)
95%
5. Did vendor provide a 24 hr. turn around service as specified in the contract?
100%
(58 of 58)
100% (59 of 59)
100% (25 of 25)
100%
(30 of 30)
96%
(44 of 46)
97%
(33 of 34)
100%
6. Did we receive an adequate supply of mops and rags from vendor?
98%
(57 of 58)
100% (59 of 59)
100% (25 of 25)
100%
(30 of 30)
98%
(45 of 46)
97%
(33 of 34)
95%
7. Was linen bins clean returning from vendor?
100%
(58 of 58)
100% (59 of 59)
100% (25 of 25)
93%
(28 of 30)
87% (40 of 46)
100%
(34 of 34)
100%
8. Was the linen manifest accurate from the vendor
100%
(58 of 58)
97%
(57of 59)
40% (10 of 25)
77%
(23 of 30)
89%
(41 of 46)
88%
(30 of 34)
85%
Summary
Eight different criteria are to be met for acceptability. The indicators are based on the inspections of linen closets throughout the facility including the returned linen from the vendor. All linen types were reviewed randomly this quarter. All indicators are within threshold percentiles except for indicator #1. The overall compliance for this quarter was 99%. This is shows a .05% increase from last quarters’ report. (Indicator #1) Linen not coming back clean from the vendor. Some towels came back stained.

Page
48
(Glossary of Terms, Acronyms & Abbreviations) (Back to Table of Contents)
HOUSEKEEPING
Actions
The Housekeeping Department has done the following actions to remedy the above problem indicators:
1. Communicate to all Housekeeping staff to be aware of the status of this indicator. 2. Housekeeping staff will continue to document all information regarding to inventory and manifest
statistics from the vendor.

Page
49
(Glossary of Terms, Acronyms & Abbreviations) (Back to Table of Contents)
HUMAN RESOURCES ASPECT: DIRECT CARE STAFF INJURIES
Reportable (Lost Time & Medical) Direct Care Staff Injuries
0.00
0.50
1.00
1.50
2.00
2.50
3.00
Per 1
,000
Clie
nt D
ays
Lost Time Ratio 0.78 0.00 0.41 0.40 2.48 0.40 1.22 0.40 0.37 1.62 1.68 1.25
Jul-11 Aug-11 Sep-11 Oct-11 Nov-11 Dec-11 Jan-12 Feb-12 Mar-12 Apr-12 May-12 Jun-12
Summary The trend for reportable injuries sustained by direct care staff increased during the last quarter. This was due to one client that resulted in the injury of several staff during this period. Current work on developing tools to reduce the incidence of physical interaction between clients and staff through heightened awareness of client’s triggers and coping mechanisms is ongoing with generally good results. Highly acute clients tend to alter the overall results showing higher trends. The goal remains to reduce the number of violent client staff interactions the intent to reduce the overall number of both client and staff injuries that may result from these interactions.

Page
50
(Glossary of Terms, Acronyms & Abbreviations) (Back to Table of Contents)
HUMAN RESOURCES ASPECT: NON-DIRECT CARE STAFF INJURIES
Reportable (Lost Time & Medical) Non-Direct Care Staff Injuries
0.00
0.50
1.00
1.50
2.00
2.50
3.00
Per 1
,000
Clie
nt D
ays
Lost Time Ratio 0.00 0.00 0.82 0.40 0.00 0.40 0.00 0.40 0.37 0.00 0.00 0.00
Jul-11 Aug-11 Sep-11 Oct-11 Nov-11 Dec-11 Jan-12 Feb-12 Mar-12 Apr-12 May-12 Jun-12
Summary The average percent of non-direct care staff who sought medical attention or lost time from work remains low. The annual trend shows a steady yet low rate of injury. As with the incidence of direct care staff injuries, close monitoring of surrounding events and activities is being conducted to determine correlations between injury rates and work activities.

Page
51
(Glossary of Terms, Acronyms & Abbreviations) (Back to Table of Contents)
HUMAN RESOURCES ASPECT: PERFORMANCE EVALUATIONS COMPLETION Completion of performance evaluations within 30 days of the due date.
Performance Evaluation Compliance
0.00%
10.00%
20.00%
30.00%
40.00%
50.00%
60.00%
70.00%
80.00%
90.00%
100.00%
Perc
ent O
n-Ti
me
Com
plet
ion
Monthly % Compliance 85.71% 74.42% 77.78% 90.91% 88.46% 86.05% 93.33% 91.67% 82.05% 73.81% 63.89%Quarterly % Compliance 77.00% 87.01% 89.69% 73.50%
Jul-11 Aug-11 Sep-11 Oct-11 Nov-11 Dec-11 Jan-12 Feb-12 Mar-12 Apr-12 May-12 Jun-12
Summary Cumulative results from this quarter (73.5%) are significantly below the planned performance threshold of 85%. The monthly results for compliance have shown considerable variability from the low of 77% in May 2011 to a high of 89.69% in March 2012. Ongoing measurement of performance is indicated. Efforts to ensure on time completion of performance evaluations by unit managers will continue in order to achieve the highest possible rate of on-time performance and to maintain a sustainable level of performance above the 85% level. The HR staff will be conducting further analysis as to the causes of this variable performance and generate a plan of correction to increase and sustain the rate of compliance with completion of performance evaluations.

Page
52
(Glossary of Terms, Acronyms & Abbreviations) (Back to Table of Contents)
HUMAN RESOURCES ASPECT: PERSONNEL MANAGEMENT
Monthly Overtime
0
500
1000
1500
2000
2500
3000
3500
4000
Ove
rtim
e H
ours
FY 2012 2812 2451 2178 1868 2473 2507 1618 1853 1798 2999 2896 2743FY 2011 2859 1885 1411 1860 1926 2474 1844 1740 1589 1697 1042 2342
Jul Aug Sep Oct Nov Dec Jan Feb Mar Apr May Jun
Overtime levels have increased significantly over the past quarter. Much of this may be due to open positions and the slower than expected recruitment of staffs to fill open positions. Higher than anticipated client acuity may also contribute to the need to provide additional staff for 1:1 or 2:1 monitoring of clients requiring focused care.

Page
53
(Glossary of Terms, Acronyms & Abbreviations) (Back to Table of Contents)
HUMAN RESOURCES
Monthly Mandated Shifts
0
10
20
30
40
50
Num
ber o
f Shi
ft M
anda
tes
FY 2012 44 30 23 18 20 22 11 28 52 54 49 38FY2011 11 7 14 10 10 12 11 18 14 7 13 36
Jul Aug Sep Oct Nov Dec Jan Feb Mar Apr May Jun
The number of mandates is higher than anticipated and does not appear to be consistent with a seasonal variation related to vacation and holiday scheduling and other activities. Current staffing patterns are being adjusted to take advantage of the shift from contract staff to regular staff. Mandate levels are higher than expected for this season and may be the result of high acuity clients, staff coverage for illness or injury, and shifting of staffing roles within the facility..

Page
54
(Glossary of Terms, Acronyms & Abbreviations) (Back to Table of Contents)
INFECTION CONTROL ASPECT: HOSPITAL ACQUIRED INFECTION
Indicators Findings Compliance Threshold Percentile
Total number of infections for the first quarter of the fiscal year, per 1000 patient days
3.3 100 % within standard
1 SD within the mean
Hospital Acquired (healthcare associated) infection rate, infections per 1000 patient days
0.96 100% within standard
1 SD within the mean
Data Upper Respiratory Infections - 1 Lower Saco – 4 infections Lower Respiratory Infections – 1 Upper Saco – 8 infection Dental Infections – 6 Lower Kennebec - 5 infections Skin Infections – 13 Lower Kennebec SCU – 5 infections GI Infections – 4 Upper Kennebec – 3 infections Ear Infections – 1 Summary Infection control rates remain within one standard deviation of the mean. There were no unusual infections. No multi drug-resistant organism infections. Two persons were diagnosed with Hepatitis C. Both were given a complete medical work up and a community referral. Types and number of infections were scattered throughout the units. No trending. There was one case of hospital associated Athletes’ Foot. I asked the Charge Nurse on the unit to review the protocol “Managing Athletes’ Foot” with unit staff. Action Plan • Continue total house surveillance.

Page
55
(Glossary of Terms, Acronyms & Abbreviations) (Back to Table of Contents)
LIFE SAFETY ASPECT: LIFE SAFETY
Indicators
Quarterly % Compliance Threshold
Percentile Apr. ’12 May. ‘12
Jan. ’12 Mar. ‘12
Oct. ’11 Dec. ‘11
Jul. ’11 Sep. ‘11
Apr. ’11- Jun. ‘11
Jan. ’11- Mar. ‘11
1. Total number of fire drills and actual alarms conducted during the quarter compared to the total number of alarm activations required per Life Safety Code, that being (1) drill per shift, per quarter.
100% (3/3)
100% (3/3)
100% (3/3)
100% (3/3)
100% (3/3)
100% (3/3)
100%
2. Total number of staff who knows what R.A.C.E. stands for.
100%
100%
100% (238/238)
100% (124/124)
100% (159/159)
100% (202/202)
95%
3. Total number of staff who knows how to acknowledge the fire alarm or trouble alarm on the enunciator panel.
98% 124/126
100% 156/156
100% (238/238)
97% (121/124)
96% (153/159)
100% (202/202)
95%
4. Total number of staff who knows the emergency number.
100% 126/126
100% 156/156
100% (238/238)
100% (124/124)
100% (159/159)
100% (202/202)
95%
5. During unannounced safety audits conducted by the Safety Officer, this represents the total number of staff who displays identification tags.
98%
123/126
97%
156/160
100% (105/105)
98% (124/126)
98% (163/165)
98% (204/208)
95%
6. During unannounced safety audits conducted by the Safety Officer, this represents the total number of direct care staff who carries a personal duress transmitter.
99% 125/126
99% 158/160
95% (100/105)
99% (125/126)
98% 162/165
97% 206/208
95%
Summary
The (3) alarms reported for the hospital meets the required number of drills per The JCAHO and Life Safety Code. Indicators 2 through 4 are indicators used for the purpose of evaluating the knowledge and skills of staff as it relates to critical skills and knowledge necessary to carry out functions in the event of a fire and/or smoke emergency.

Page
56
(Glossary of Terms, Acronyms & Abbreviations) (Back to Table of Contents)
LIFE SAFETY During drills, there were no significant issues. The following deficiencies were discovered:
1. Four telephones were missing emergency stickers. 2. One announced drill was conducted on a unit since the acuity throughout the hospital was not
conducive to the typical milieu usually found during a hospital-wide alarm. 3. During one drill, the charge nurse was not available, yet the staff provided the necessary
leadership for the event. The number of staff carrying ID’s and transmitters has improved since this tracking began. The Safety Officer will investigate other indicators. Drills and environmental tours addressed areas such as R.A.C.E., evacuation routes, use of fire extinguishers, use of annunciator panels, census taking, and emergency communications. Actions
Actions taken after drills were the following:
1. Missing stickers were placed on the identified phones. 2. The Safety Officer was still able to meet the objectives and satisfied the Clinical needs of the
facility relative to the acuity level.
We continue to conduct environmental tours and safety audits to assure that staff is in possession of required safety equipment and facility ID’s. This area of monitoring has shown improvement.

Page
57
(Glossary of Terms, Acronyms & Abbreviations) (Back to Table of Contents)
LIFE SAFETY ASPECT: FIRE DRILLS REMOTE SITES
Indicators
Quarterly % Compliance Threshold
Percentile Apr. ’12 Jun. ‘12
Jan. ’12 Mar. ‘12
Oct. ’11 Dec. ‘11
Jul. ’11 Sep. ‘11
Apr. ’11- Jun. ‘11
Jan. ’11- Mar. ‘11
Total number of fire drills and actual alarms conducted at Portland Clinic compared to the total number of alarm activations required per Life Safety Code (3) drills per year based on the fact that it is business occupancy.
100% (1 drill)
100% (1 drill)
100% (1 drill)
100% (1 drill)
100% (1 drill)
100% (1 drill)
100%
Summary The Safety Officer conducted an announced drill on 02/29/12. This drill satisfies the NFPA requirement. The clinic had hired a new receptionist. Prior to the drill, time was spent reviewing her specific duties as they relate to necessary actions in the event of a fire or smoke event. Staff did an excellent job during the drill. The drill did not result in any adverse issues. The next drill, an unannounced drill, will be conducted sometime during the end of the calendar year. We continue to perform environmental tours during which time we ask them questions as it relates to what actions they must take in the event of a fire and/or smoke emergency. Actions An unannounced drill is planned for the 1st or 2nd quarter of FY13. The required drills have been performed.

Page
58
(Glossary of Terms, Acronyms & Abbreviations) (Back to Table of Contents)
NURSING ASPECT: SECLUSION/RESTRAINT RELATED TO STAFFING EFFECTIVENESS
Figure CD-27
Indicators Findings Compliance 1. Staff mix appropriate 88 of 88 100%
2. Staffing numbers within appropriate acuity level for unit 88 of 88 100%
3. Debriefing completed 86 of 88 98%
4. Dr. Orders 88 of 88 100% SUMMARY
The indicators of “Seclusion/Restraint Related to Staffing Effectiveness” # 1,2 and 3 remain at 100%. #3 remains stable. ACTION
Good Progress. We will continue to monitor. ASPECT: INJURIES RELATED TO STAFFING EFFECTIVENESS
Indicators Findings Compliance 1. Staff mix appropriate 43 of 43 100%
2. Staffing numbers within appropriate acuity level for unit 43 of 43 100%
SUMMARY
Overall staff injuries are monitored by Risk Management and Human Resources for Direct care and by Human Resources’ and Environment of Care for staff injuries due to the environment. The staffing numbers are within the appropriate level for the current staffing plan and the acuity level. Compliance remains @ 100% ACTIONS
This is an important issue that is of concern to all. The Director of Nursing is working in concert with the Superintendent and Risk management to monitor and measure trends and variables that contribute to staff injury. We will continue the focus is on appropriate use of stat calls for support to heighten awareness of safety and the obvious support in numbers for lifting and other manual activities.

Page
59
(Glossary of Terms, Acronyms & Abbreviations) (Back to Table of Contents)
NURSING ASPECT: MEDICATION ERRORS RELATED TO STAFFING EFFECTIVENESS
Date Omit Co-mission Float New O/T Unit Acuity Staff Mix
3/28/12 Y Seroquel 100 mg – 1 dose omitted,
given late N N N LKS 3 RN, 1 LPN,
9 ½ MHW
3/31/12 Y Baby Aspirin 81 mg. not found, not
given, NOD not consulted Y N N LKS 2 RN, 1 LPN,
8 MHW
4/9/12 N Gave repeat dose of 2200 med
(Depakote) 500 mg. N N N LS # RN, 0 LPN,
7 MHW
4/10/12 N Thorazine – 1 dose transcription error, not discontinued per order N N N LK
4 RN, 0 LPN, 9 MHW
4/11/12 Y Lexapro – doses inadvertently
missed N Y Y LK 1 RN, 2 MHW
4/13/12 Y Aldactone 25 mg. – 1 dose missed N N N LK 3 RN, 1 LPN,
8 MHW
4/24/12 Y New order overlooked N N N UK 2 RN, 0 LPN,
5 MHW
5/9/12 N Oxycodone 10 mg. * N N N UK 3 RN, 1 LPN,
6 MHW
5/10/12 Y 1 each Cymbalta, Ditropan, Elavil,
Plaquenyl N N N LS 3 RN, 0 LPN,
7 MHW
5/10/12 Y 20,000 missed of Vitamin D3 N N N LS 3 RN, 0 LPN,
7 MHW
5/14/12 Y 1 dose each – Benzatropine,
Halopindol, Melatonin, Somnote N N N LS 4 RN, 0 LPN,
7 MHW
5/22/12 N Seroquel 25 mg. ordered, 100 mg.
given N N N LK 1 RN, 6 MHW
6/14/12 N Buspar 15 mg. 2 hours early Y N Y US 3 RN, 4 MHW
SUMMARY Total of 13 med variances not unrelated to staffing mix, two related to OT, 2 involved floating by RN, one off her reg. unit, one by float nurse assigned as such. Notably 10 of the 13 variances involved units with the highest acuity (LS/LK). Significant decrease in meds not given with 2 instances of meds found in cups. Other errors involved wrong time of administering, wrong dose, or procedural error [new order overlooked, transcription, redlining, one occurrence of multiple errors involving med not in Acudose and NOD not informed]. There has been a significant decrease in omissions since a procedural change was instituted eliminating pre-pulling medications. Introduction of Pyxis medication machines has been well received by staff. The plan is to monitor med variances for the next quarter, in relation to staff ratio, acuity, and variance type. A newly formed Nursing/Pharmacy meeting will assist in observing trends throughout the hospital with appropriate response to needs.
ACTION: All nursing related med variances were noted to have appropriate staffing levels. Procedural errors will be addressed by way of staff in-service. This module will be developed around variances reported. Nursing/Pharmacy Committee will look at recommendations to address repetitive variances.

Page
60
(Glossary of Terms, Acronyms & Abbreviations) (Back to Table of Contents)
NURSING ASPECT: PAIN MANAGEMENT
Indicator Findings Compliance
Pre-administration Assessed using pain scale 647of 670 96.6%
Post-administration Assessed using pain scale 523 of 670 78.1% SUMMARY The “Pre-administration assessment” indicator 96% this quarter, down three percentiles from last quarter. Post-assessment has again decreased from to 81% to 78.1%, down also 3 percentiles. Both indicators are using the 1-10 Pain Scale. indicator as per policy. 88% last quarter ACTION We believe that the decrease in compliance for “Post-administration” assessment is an ongoing problem. Nursing will continue to place a great deal of attention and effort on post administration assessment and management of the related documentation. Nursing will continue to track this indicator and strive for increase in post assessment in the next quarter. The two ADONs will continue to work with unit nursing staff and Nurse IV’s to assure that this is done consistently. A contributing factor may be new staff hired into our facility. The action outlined above will be followed through. This will also be addressed in the Med Module teaching tool. This will also be addressed in the nurse documentation teaching tool by Nurse Educator. ASPECT: CHART REVIEW EFFECTIVENESS
Indicators Findings Compliance 1. GAP note written in appropriate manner at least every 24 hours 36 of 60 60%
2. STGs/ Interventions relate directly to content of GAP note. 55 of 60 92%
3. Weekly Summary note completed. 15 of 60 25%
4. BMI on every Treatment Plan. 43 of 60 72%
5. Diabetes education Teaching checklist shows documentation of client teaching (diabetic clients)
54 of 60 90%
6. Multidisciplinary Teaching checklist active being completed. 52 of 60 80%
7. Dental education Teaching checklist 40 of 60 66%
SUMMARY Indicators 1-7 have all dropped this quarter, from 3- 18 percentile
ACTION Review and re-educate weekly summary notes. ADONs and Nurse IVs will continue to work on this in general. Many new employees, several staff have left. These outcomes will be addressed in RN IV and Charge Nurse Meetings and communicated to individual nurses on the units.

Page
61
(Glossary of Terms, Acronyms & Abbreviations) (Back to Table of Contents)
NURSING
ASPECT: INITIAL CHART COMPLIANCE
Figure CD-02, CD-09
Indicator Findings Compliance 1. Universal Assessment completed by RN within 24 hours
75 of 75 100%
2. All sections completed or deferred within document 75 of 75 100%
3. Initial Safety Treatment Plan initiated 75 of 75 100%
4. All sheets required signature authenticated by assessing RN 75 of 75 100%
5. Medical Care Plan initiated if Medical problems identified 75 of 75 100%
6. Informed Consent sheet signed 75 of 75 100%
7. Potential for violence assessment upon admission 54 of 75 72%
8. Suicide potential assessed upon admission 67 of 75 89.3%
9. Fall Risk assessment completed upon admission 67 of 75 89.3%
10. Score of 5 or above incorporated into problem need list 75 of 75 100%
11. Dangerous Risk Tool done upon admission 75 of 75 100%
12. Score of 11 or above incorporated into Safety Problem 71 of 75 94.7%
13. Evidence that clients are routinely informed of their rights upon admission in accordance with ¶ 150 of the settlement agreement is found in the document of the charts reviewed.
Pending
SUMMARY
Indicator 1, 2, 4, 10 and 11 remain the same at 100%. #3, 5, 6, and 12 have increased to 100%. Indicator # 7 decreased by 7 percentiles while # 8 and 9 decreased by 10.7 percentiles. ACTION
Assure complete and thorough education of new Nurses by reviewing as necessary. Allow more time for them to function in medication delivery under supervision. Preceptorship is now organized. Will follow to see if this is helping in all areas. Continue to monitor.

Page
62
(Glossary of Terms, Acronyms & Abbreviations) (Back to Table of Contents)
PEER SUPPORT ASPECT: INTEGRATION OF PEER SPECIALISTS INTO CLIENT CARE
Indicators Findings Compliance Threshold Percentile
1. Attendance at Comprehensive Treatment Team meetings.
387 of 427 91% 80%
2. Level II grievances responded to by RPC on time.
4 of 4 100% 100%
3. Attendance at Service Integration meetings. 52 of 56 93% 100%
4. Contact during admission. 63 of 63 100% 100%
5. Level I grievances responded to by RPC on time. 63 of 112 56% 100%
6. Client satisfaction surveys completed. 12 of 26 46% 50%
Summary Compliance with indicators 1, 2, 4, and 6 remained relatively the same as last quarter. Peer support attendance at Service Integration meetings dropped 7% due to peer support not being notified of the meetings occurring. Compliance with response to Level I grievances dropped significantly, from 87% last quarter to 56% this quarter. The number of grievances filed this quarter increased by about 150%, with the majority from one client. There were 49 late grievances, ranging from 1 to 23 days late. Figure CD-07
Documented Contact During Admission
020406080
100120
QTR1SFY12 QTR2SFY12 QTR3SFY12 QTR4SFY12
ComplianceTarget

Page
63
(Glossary of Terms, Acronyms & Abbreviations) (Back to Table of Contents)
PEER SUPPORT Figure CD-08
Treatment Team Attendance
70
75
80
85
90
95
QTR1SFY12 QTR2SFY12 QTR3SFY12 QTR4SFY12
Compliance
Target
Figure CD-03
Level II Grievance Response
020406080
100120
QTR4SFY10
QTR1SFY12
QTR2SFY12
QTR3SFY12
QTR4SFY12
ComplianceTarget

Page
64
(Glossary of Terms, Acronyms & Abbreviations) (Back to Table of Contents)
PROGRAM SERVICES
SUMMARY Nine indicators have decreased since last quarter. One has increased by 3 percent and one remained the same at 100%. Two indicators # 6 and #12 did not meet expected compliance level. ACTION Continue to monitor focusing on the indicators that have decreased slightly.
Indicator Findings % Compliance 1. Documentation reveals that the client attended 50% of
assigned psycho-social-educational interventions within the last 24 hours.
88 of 120 73%
70%
2. A minimum of three psychosocial educational interventions are assigned daily. 108 of 120 90%
70%
3 A minimum of four groups are prescribed for the weekend. 82 of 120 68%
70%
4. The client is able to state what his or her assigned psycho-social-educational interventions are and why they have been assigned.
85 of 120 70%
60%
5 The client can correctly identify assigned RN and MHW. (or where the information is available to him or her) 118 of 120 98%
75%
6. The medical record documents the client’s active participation in Morning Meeting within the last 24 hours.
63 of 120 52%
70% LK/LS 85% UK/US
7. The client can identify personally effective distress tolerance mechanisms available within the milieu. 115 of 120 95%
65%
8. Level and quality of client’s use of leisure within the milieu are documented in the medical record over the last 7 days.
112 of 120 93%
75%
9. Level and quality of social interactions within the milieu are documented in the medical record over the last 7 days.
116 of 120 96.7%
75%
10. Suicide potential moderate or above incorporated into CSP 33 of 36 92%
90%
11. Allergies displayed on order sheets and on spine of medical record. 120 of 120 100%
100%
12. By the 7th day if Fall Risk prioritized as active-was it incorporated into CSP 29 of 30 97%
100%

Page
65
(Glossary of Terms, Acronyms & Abbreviations) (Back to Table of Contents)
REHABILITATION SERVICES ASPECT: READINESS ASSESSMENTS, COMPREHENSIVE SERVICE PLANS & PROGRESS NOTES
Indicators Findings Compliance
1. Readiness assessment and treatment plan completed within 7 days of admission.
30 of 30 100%
2. Rehabilitation short term goals on Comprehensive Service Plan are measurable and time limited.
30 of 30 100%
3. Rehabilitation progress notes indicate treatment being offered as prescribed on Comprehensive Service Plan.
30 of 30 100%
4. Rehabilitation progress notes indicate progress towards addressing identified goals on the Comprehensive Service Plan.
30 of 30 100%
Summary This is the fourth and final quarter review of the above indicators. The identified indicators have been averaging over 95% for the past year and no longer require monitoring.
Indicator #1- All assessments and annual updates reviewed were completed in the allotted time frame. No issues at this time with the completion of the assessment and treatment plan.
Indicator #2- All short-term goals on the Comprehensive Service Plan reviewed were measurable and time limited. No issues at this time.
Indicator #3 & 4-All the rehabilitation progress notes that were reviewed indicated the treatment that is being offered. The notes also reflected the progress that is being made towards addressing these goals

Page
66
(Glossary of Terms, Acronyms & Abbreviations) (Back to Table of Contents)
SECURITY & SAFETY ASPECT: SECURITAS/RPC SECURITY TEAM
Indicators
Quarterly % Compliance Threshold
Percentile Apr. ’12 Jun. ‘12
Jan. ’12 Feb. ‘12
Oct. ’11 Dec. ‘11
Jul. ’11 Sep. ‘11
Apr. ’11- Jun. ‘11
Jan. ’11- Mar. ‘11
Security Officer “foot patrols” during Open Hospital times. (Total # of “foot patrols” done vs. total # of “foot patrols” to be done.)
93%
(915/978)
96%
(1513/1578)
98%
(2130/2156)
99%
(1981/2002)
98%
(1975/2002)
99%
(1980/2002)
95%
Summary The new web-based tour system, “Vision System” has been in place since February. There are (9) Security bar-coded points covering the areas for client open hospital times. Since a trial period was necessary in order to become acclimated to the system and we did not want to complicate that process, we chose to bar code a particular area. We are proud to report that the system has been a success and we are in the process of adding bar-coded points to the rest of the hospital. The reduction of % is based on reducing the number of standard tours after the inception of the Vision System, especially during a period in April when there was a request for additional security coverage on LSSCU. The quality of the tours which were reported during the previous 5 quarters did not diminish. It actually improved since the tours demand a more detailed assessment. Actions During the next reporting quarter, we will compile data from the Vision System. During tours, officers discovered the following of which each and every one was corrected though the Incident Reporting Procedure:
1. During a tour of the Treatment Mall, furniture was discovered in the sally port of the Center Courtyard. The furniture had been placed there during housekeeping activities. The Security Manager resolved the issue with staff.
2. Extra attention has been placed on assuring that parked vehicles are secure. Numerous vehicles, especially pick-up trucks, have contained items in the bed area which could pose a potential threat in the hands of people with ill motives.
3. There was another incident involving the Treatment Mall oven being left unattended. Timers were placed on both the oven and the cooktop.
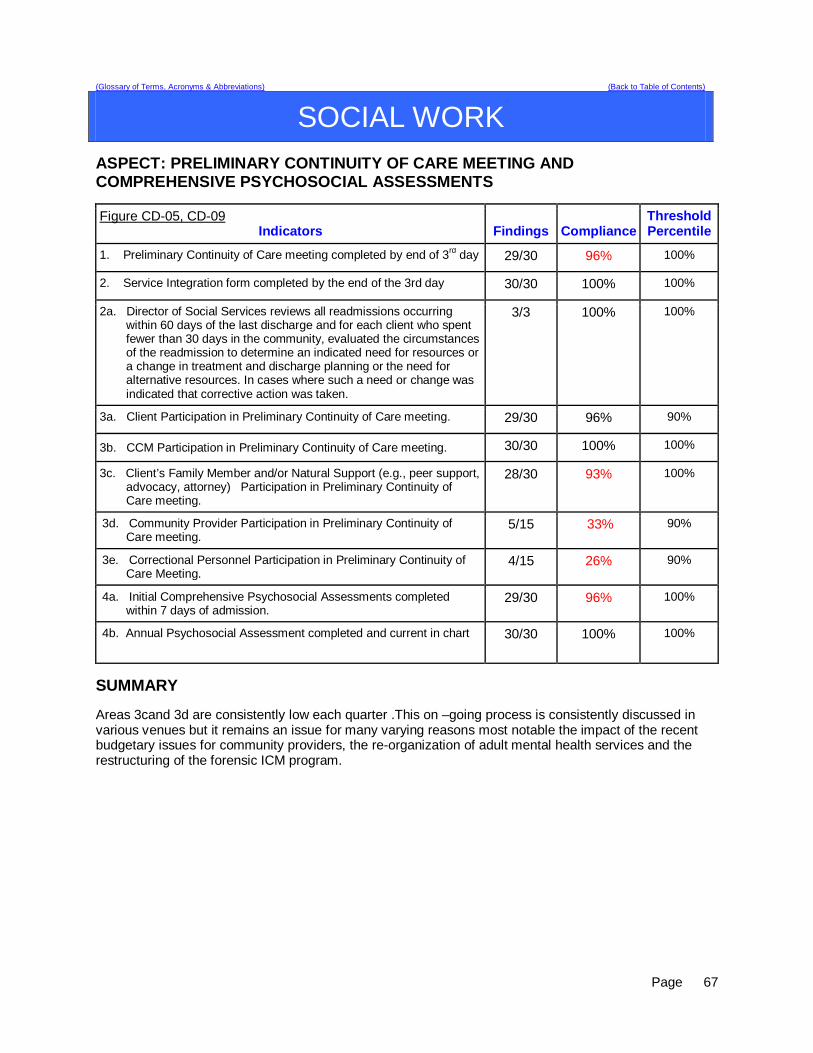
Page
67
(Glossary of Terms, Acronyms & Abbreviations) (Back to Table of Contents)
SOCIAL WORK ASPECT: PRELIMINARY CONTINUITY OF CARE MEETING AND COMPREHENSIVE PSYCHOSOCIAL ASSESSMENTS
Figure CD-05, CD-09 Indicators Findings Compliance
Threshold Percentile
1. Preliminary Continuity of Care meeting completed by end of 3rd day 29/30 96% 100%
2. Service Integration form completed by the end of the 3rd day 30/30 100% 100%
2a. Director of Social Services reviews all readmissions occurring within 60 days of the last discharge and for each client who spent fewer than 30 days in the community, evaluated the circumstances of the readmission to determine an indicated need for resources or a change in treatment and discharge planning or the need for alternative resources. In cases where such a need or change was indicated that corrective action was taken.
3/3 100% 100%
3a. Client Participation in Preliminary Continuity of Care meeting. 29/30 96% 90%
3b. CCM Participation in Preliminary Continuity of Care meeting. 30/30 100% 100%
3c. Client’s Family Member and/or Natural Support (e.g., peer support, advocacy, attorney) Participation in Preliminary Continuity of Care meeting.
28/30 93% 100%
3d. Community Provider Participation in Preliminary Continuity of Care meeting.
5/15 33% 90%
3e. Correctional Personnel Participation in Preliminary Continuity of Care Meeting.
4/15 26% 90%
4a. Initial Comprehensive Psychosocial Assessments completed within 7 days of admission.
29/30 96% 100%
4b. Annual Psychosocial Assessment completed and current in chart 30/30 100% 100%
SUMMARY Areas 3cand 3d are consistently low each quarter .This on –going process is consistently discussed in various venues but it remains an issue for many varying reasons most notable the impact of the recent budgetary issues for community providers, the re-organization of adult mental health services and the restructuring of the forensic ICM program.

Page
68
(Glossary of Terms, Acronyms & Abbreviations) (Back to Table of Contents)
SOCIAL WORK ASPECT: INSTITUTIONAL AND ANNUAL REPORTS
Figure CD-18 Indicators Findings Compliance
Threshold Percentile
1. Institutional Reports will be completed, reviewed internally, and delivered to the court within 10 business days of request.
7/7 100% 95%
2. The assigned CCM will review the new court order with the client and document the meeting in a progress note or treatment team note.
5/5 100% 100%
3. Annual Reports (due Dec) to the commissioner for all inpatient NCR clients are submitted annually
N/A N/A 100%
ASPECT: CLIENT DISCHARGE PLAN REPORT/REFERRALS
Indicators Findings Compliance Threshold Percentile
1. The Client Discharge Plan Report will be updated/reviewed by each Social Worker minimally one time per week.
13/13 100% 95%
2. The Client Discharge Plan Report will be reviewed/updated minimally one time per week by the Director of Social Services.
1313 100% 100%
2a. The Client Discharge Plan Report will be sent out weekly as indicated in the approved court plan.
13/13 100% 100%
3. Each week the Social Work team and Director will meet and discuss current housing options provided by the respective regions and prioritize referrals.
13/13 100% 100%
ASPECT: TREATMENT PLANS AND PROGRESS NOTES
Figure CD-16, CD-17 Indicators Findings Compliance
Threshold Percentile
1. Progress notes in GAP/Incidental/Contact format will indicate at minimum weekly 1:1 meeting with all clients on assigned CCM caseload.
43/45 95% 95%
2. On Upper Saco progress notes in GAP/Incidental format will indicate at minimum bi- weekly 1:1 meeting with all clients on assigned CCM caseload
15/15 100% 95%
3. Treatment plans will have measurable goals and interventions listing client strengths and areas of need related to transition to the community or transition back to a correctional facility.
58/60 96% 95%

Page
69
(Glossary of Terms, Acronyms & Abbreviations) (Back to Table of Contents)
SOCIAL WORK ASPECT: BARRIERS TO COMMUNITY PLACEMENT OF CIVIL CLIENTS FY12 Q4 25% of civil clients discharged faced a barrier
28 civil clients discharged in the quarter. 7 faced identified barrier Figures CD-12, CD-13, CD-14 Clinical Readiness
Residential Supports (0.03) 3%
15 discharged 0-7days 10 discharged 8-30 days 1 discharged 31-45days 2 discharged post 45 days
1 client discharge 6 days post readiness
Treatment Services (0.03) 3%
Housing Barriers (5) 17 %
1 client discharged 9 days post clinical readiness
1 client discharged 17 days post clinical readiness 2 client discharged 28 days post clinical readiness 1 client discharged 39 days post clinical readiness 1 client discharged 111 days post clinical readiness 1 client discharged 125 days post clinical readiness
Post Discharge Readiness for Those Discharged4Q2012 (N=28)
53.57%35.71%
3.57% 7.14%
Cumulative percentages & targets are as follows: Within 7 days = (15) 53.57% (target 75%) Within 30 days = (10) 89.28% (target 90%) Within 45 days = ( 1) 92.85% (target 100%) Post 45 days = ( 2) 7.14% (target 0%)
The previous five quarters are displayed in the table below
Target >> Within 7 days Within 30days Within 45 days 45 +days
75% 90% 100% 0% Q32012 N=42 69.0% 85.7% 92.9% 7.1% Q22012 N=45 53.3% 84.4% 93.3% 6.7% Q12012 N=54 68.8% 76.6% 86.0% 14.1% Q42011 N=40 54.4% 77.9% 88.2% 11.0% Q32011 N=44 67.6% 83.8% 89.2% 10.8%

Page
70
(Glossary of Terms, Acronyms & Abbreviations) (Back to Table of Contents)
STAFF DEVELOPMENT ASPECT: NEW EMPLOYEE AND MANDATORY TRAINING Figure CD-19 and CD-20
Indicators Quarterly Findings
YTD Findings Compliance
Threshold Percentile
1. New employees will complete new employee orientation within 60 days of hire.
16 of 16 completed orientation
63 of 63 scheduled employees completed orientation
100%
100 %
2. New employees will complete CPR training within 30 days of hire.
16 of 16 completed
CPR training
63 of 63 scheduled employees
completed CPR training
100% 100 %
3. New employees will complete NAPPI training within 60 days of hire.
16 of 16 completed
Nappi training
63 of 63 scheduled employees completed
NAPPI training
100% 100 %
4. Riverview and Contract staff will attend CPR training bi-annually.
62 of 62 attended scheduled
CPR Recertification
135 of 135 scheduled employees
completed CPR training
100% 100 %
5. Riverview and Contract staff will attend NAPPI training annually.
45 of 45 have
completed NAPPI training
379 of 379 scheduled employees completed
NAPPI training
100%
100 %
6. Riverview and Contract staff will attend Annual training.
27 of 27 have
completed annual training
385 of 385 have completed annual training
100 % 100 %
Findings The indicators are based on the requirements for all new/current staff to complete mandatory training and maintain current certifications. 16 of 16 (100%) new Riverview/Contracted employees completed these trainings. 341 of 341 (100%) Riverview/Contracted employees are current with CPR certification. 379 of 379 (100%) Riverview/Contracted employees are current in Nappi training. 385 of 385 (100%) employees are current in Annual training. All indicators remained at 100% compliance for quarter 4-FY 2012.
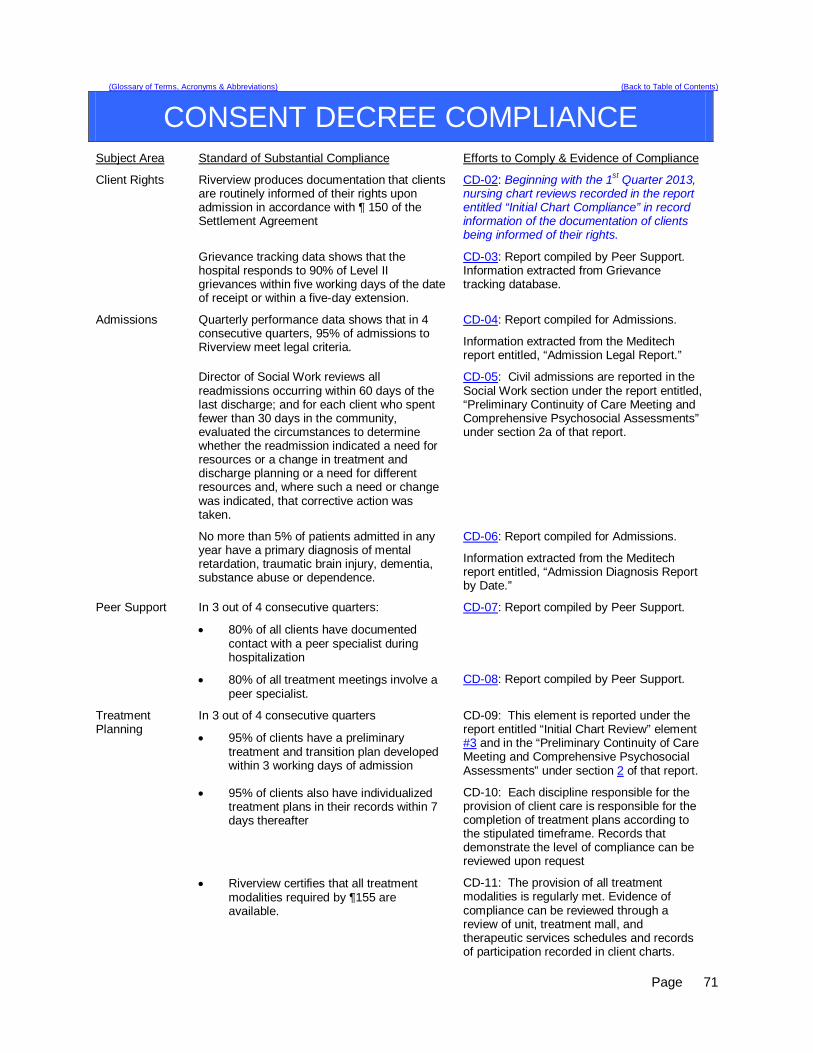
Page
71
(Glossary of Terms, Acronyms & Abbreviations) (Back to Table of Contents)
CONSENT DECREE COMPLIANCE Subject Area Standard of Substantial Compliance Efforts to Comply & Evidence of Compliance
Client Rights Riverview produces documentation that clients are routinely informed of their rights upon admission in accordance with ¶ 150 of the Settlement Agreement
CD-02: Beginning with the 1st Quarter 2013, nursing chart reviews recorded in the report entitled “Initial Chart Compliance” in record information of the documentation of clients being informed of their rights.
Grievance tracking data shows that the hospital responds to 90% of Level II grievances within five working days of the date of receipt or within a five-day extension.
CD-03: Report compiled by Peer Support. Information extracted from Grievance tracking database.
Admissions Quarterly performance data shows that in 4 consecutive quarters, 95% of admissions to Riverview meet legal criteria.
CD-04: Report compiled for Admissions.
Information extracted from the Meditech report entitled, “Admission Legal Report.”
Director of Social Work reviews all readmissions occurring within 60 days of the last discharge; and for each client who spent fewer than 30 days in the community, evaluated the circumstances to determine whether the readmission indicated a need for resources or a change in treatment and discharge planning or a need for different resources and, where such a need or change was indicated, that corrective action was taken.
CD-05: Civil admissions are reported in the Social Work section under the report entitled, “Preliminary Continuity of Care Meeting and Comprehensive Psychosocial Assessments” under section 2a of that report.
No more than 5% of patients admitted in any year have a primary diagnosis of mental retardation, traumatic brain injury, dementia, substance abuse or dependence.
CD-06: Report compiled for Admissions.
Information extracted from the Meditech report entitled, “Admission Diagnosis Report by Date.”
Peer Support In 3 out of 4 consecutive quarters:
• 80% of all clients have documented contact with a peer specialist during hospitalization
CD-07: Report compiled by Peer Support.
• 80% of all treatment meetings involve a peer specialist.
CD-08: Report compiled by Peer Support.
Treatment Planning
In 3 out of 4 consecutive quarters
• 95% of clients have a preliminary treatment and transition plan developed within 3 working days of admission
CD-09: This element is reported under the report entitled “Initial Chart Review” element #3 and in the “Preliminary Continuity of Care Meeting and Comprehensive Psychosocial Assessments” under section 2 of that report.
• 95% of clients also have individualized treatment plans in their records within 7 days thereafter
CD-10: Each discipline responsible for the provision of client care is responsible for the completion of treatment plans according to the stipulated timeframe. Records that demonstrate the level of compliance can be reviewed upon request
• Riverview certifies that all treatment modalities required by ¶155 are available.
CD-11: The provision of all treatment modalities is regularly met. Evidence of compliance can be reviewed through a review of unit, treatment mall, and therapeutic services schedules and records of participation recorded in client charts.

Page
72
(Glossary of Terms, Acronyms & Abbreviations) (Back to Table of Contents)
CONSENT DECREE COMPLIANCE Subject Area Standard of Substantial Compliance Efforts to Comply & Evidence of Compliance
Treatment Planning (cont’d)
An evaluation of treatment planning and implementation, performed in accordance with Attachment D, demonstrates that, for 90% of the cases reviewed quarterly performance data shows that in 4 consecutive quarters:
• 70% of clients who remained ready for discharge were transitioned out of the hospital within 7 days of a determination that they had received maximum benefit from inpatient care
CD-12: Information on this standard is illustrated in the Social Work performance measures related to the aspect of care entitled, “Barriers to Community Placement of Civil Clients”
• 80 % of clients who remained ready for discharge were transitioned out of the hospital within 30 days of a determination that they had received maximum benefit from inpatient care
CD-13: Information on this standard is illustrated in the Social Work performance measured related to the aspect of care entitled, “Barriers to Community Placement of Civil Clients”
• 90% of clients who remained ready for discharge were transitioned out of the hospital within 45 days of a determination that they had received maximum benefit from inpatient care (with certain clients excepted, by agreement of the parties and court master).
CD-14: Information on this standard is illustrated in the Social Work performance measured related to the aspect of care entitled, “Barriers to Community Placement of Civil Clients”
• treatment and discharge plans reflect interventions appropriate to address discharge and transition goals
CD-15: This standard is reflected in the multi-disciplinary documentation contained in individual treatment plans and can be reviewed upon request.
• for patients who have been found not criminally responsible or not guilty by reason of insanity, appropriate interventions include timely reviews of progress toward the maximum levels allowed by court order; and the record reflects timely reviews of progress toward the maximum levels allowed by court order
CD-16: This compliance standard is partially addressed in the Social Work report on “Treatment Plans and Progress Notes, standard #3.”
• interventions to address discharge and transition planning goals are in fact being implemented
CD-17: This compliance standard is partially addressed in the Social Work report on “Treatment Plans and Progress Notes, standard #3.”
• for patients who have been found not criminally responsible or not guilty by reason of insanity, this means that, if the treatment team determines that the patient is ready for an increase in levels beyond those allowed by the current court order, Riverview is taking reasonable steps to support a court petition for an increase in levels.
CD-18: This compliance standard is addressed in the Social Work report on “Institutional and Annual Reports” as well as in multi-disciplinary documentation of client legal status changes.

Page
73
(Glossary of Terms, Acronyms & Abbreviations) (Back to Table of Contents)
CONSENT DECREE COMPLIANCE Subject Area Standard of Substantial Compliance Efforts to Comply & Evidence of Compliance
Staffing and Staff Training
Riverview performance data shows that 95% of all new direct care staff have received 90% of their orientation training before having been assigned to duties requiring unsupervised direct care of patients.
CD-19: Compliance with this standard is documented under the section of Staff Development.
Riverview certifies that 95% of professional staff have maintained professionally-required continuing education credits and have received the ten hours of annual cross-training required by ¶216
CD-20: Compliance with this standard is documented under the section of Staff Development.
Riverview certifies that staffing ratios required by ¶202 are met, and makes available documentation that shows actual staffing for up to one recent month.
CD-21: All required staffing ratios are regularly met. Evidence of compliance can be reviewed through staffing office and other human resource records.
The evaluation of treatment and discharge planning, performed in accordance with Attachment D, demonstrates that staffing was sufficient to provide patients access to activities necessary to achieve the patients’ treatment goals, and to enable patients to exercise daily and to recreate outdoors consistent with their treatment plans.
CD-22: The Clinical Leaders Team conducted a preliminary review of 28 client records to determine substantial compliance in the areas of: 1) treatment and discharge planning and implementation, and 2) staffing. Areas requiring review are being addressed through the ongoing review and revision of the treatment planning model.
Seclusion and Restraint
Quarterly performance data shows that, in 5 out of 6 quarters, total seclusion and restraint hours do not exceed one standard deviation from the national mean as reported by NASMHPD
Report compiled by the Integrated Quality Team and reported in Comparative Statistics section on…
CD-23: Seclusion Hours and
CD-24: Restraint Hours.
Riverview demonstrates that, based on a review of two quarters of data, for 95% of seclusion events, seclusion was employed only when absolutely necessary to protect the patient from causing physical harm to self or others or for the management of violent behavior.
CD-25: Report compiled by the Integrated Quality Team and reported in Comparative Statistics
Riverview demonstrates that, based on a review of two quarters of data, for 95% of restraint events involving mechanical restraints, the restraint was used only when absolutely necessary to protect the patient from serious physical injury to self or others.
CD-26: Report compiled by the Integrated Quality Team and reported in Comparative Statistics
Riverview demonstrates that, based on a review of two quarters of data, for 95% of seclusion and restraint events, the hospital achieved an acceptable rating for meeting the requirements of paragraphs 182 and 184 of the Settlement Agreement, in accordance with a methodology defined in Attachments E-1 and E-2.
CD-42: Seclusion and CD-43 restraint events are reviewed as part of a regular analysis of performance by the Nursing Department.

Page
74
(Glossary of Terms, Acronyms & Abbreviations) (Back to Table of Contents)
CONSENT DECREE COMPLIANCE Subject Area Standard of Substantial Compliance Efforts to Comply & Evidence of Compliance
Elopement Quarterly performance data shows that, in 5 out of 6 quarters, the number of client elopements does not exceed one standard deviation from the national mean as reported by NASMHPD.
CD-27: Report compiled by the Integrated Quality Team and reported in Comparative Statistics section on Elopement.
Client Injuries Quarterly performance data shows that, in 5 out of 6 quarters, the number of client injuries does not exceed one standard deviation from the national mean as reported by NASMHPD.
CD-28: Report compiled by the Integrated Quality Team and reported in Comparative Statistics section on Client Injuries.
Patient Abuse, Neglect, Exploitation, Injury or Death
Riverview certifies that it is reporting and responding to instances of patient abuse, neglect, exploitation, injury or death consistent with the requirements of ¶¶ 192-201 of the Settlement Agreement.
CD-29: Regular reports of any events related to allegations of abuse, neglect, exploitation, injury or death are submitted to the Disability Rights Center, the Human Rights Committee and the Consent Decree Court Master per the requirements of the Settlement Agreement. Minutes of the Human Rights Committee are available for review by regulators and accreditation agencies upon request. The Superintendent also certifies annually according to 22 MRSA, Chapter 1684, and 10-44 CMR Chapter 114, Rules Governing the Reporting of Sentinel Events that all sentinel and serious reportable events are reported to the DHHS DLRS Sentinel Events Team as required by this law.
Performance Improvement
Riverview maintains JCAHO accreditation CD-30: A joint commission survey conducted on November 15-19, 2010 resulted in a full accreditation determination for both the hospital and the Community Forensic ACT team. Documentation of this action can be viewed in the office of the Superintendent.
Riverview maintains its hospital license CD-40: Documentation of the hospital’s licensure status can be viewed in the office of the Superintendent and verified with the Maine DHHS Department of Licensure and Regulatory Services.
The hospital does not lose its CMS certification (for the entire hospital excluding Lower Saco SCU so long as Lower Saco SCU is a distinct part of the hospital for purposes of CMS certification) as a result of patient care issues
CD-41: Documentation of the hospital’s CMS certification status can be viewed in the office of the Superintendent.
The items listed in this table were abstracted from the Standards for Defining Substantial Compliance dated October 29, 2007.