performance - kingston general hospital · performance report 2015-2016 q2 2nd quarter ended...
TRANSCRIPT
Quality Improvement Plan (QIP)
PerformanceReport
2015-2016 Q22nd quarter ended September 30, 2015
fiscal

KGH Quality Improvement Plan (QIP) Performance Report Fiscal 2016
PageQuality Improvement Plan (QIP) Indicators Status Summaries 1
Strategic Direction 1Transform the patient experience through a relentless focus on quality, safety and service
Outcome 1:
Strategic Performance IndicatorsOverall, how would you rate the care you received at the hospital? (QIP) 2
Outcome 2:
Strategic Performance IndicatorsC-Difficile (QIP) 3Hand Hygiene Compliance (QIP) 4Hospital Standardized Mortality Ratio (HSMR) (QIP) 5Medication Reconciliation at Admission (QIP) 6
6
7
8
Outcome 3:
Strategic Performance Indicators90th Percentile ED Wait Time (All Admitted Patients) (Hrs) - (QIP) 9Percent ALC Days (QIP) 10
Patients are engaged in all aspects of our quality, safety, and Service improvement initiatives
All preventable harm to patients is eliminated
All preventable delays in the patient journey to, within, and from KGH are Eliminated
Twenty-Five percent fewer patients experience skin ulcers on the 3 units (across 3 programs - medicine/surgery/critical care (K6, C10, K2, ICU)) - (QIP)
All three phases of the surgical safety checklist are performed (Briefing, time out, and Debriefing)(QIP)
The Number of Patients Falls in Level 3 and Level 4 categories - (QIP)
KGH Quality Improvement Plan (QIP) Performance Report Fiscal 2016
Strategic Direction 4Increase our focus on complex-acute and specialty care
Outcome 6:
Strategic Performance Indicators30 Day Readmission Rate Outperforms its Expected MOH rate (QIP) 11
Strategic Direction 5Enable High Performance
Outcome 11:
Strategic Performance IndicatorsTotal Margin (QIP) 12
Status Legend 13
Our operation budget is balanced and we are able to allocate $20 million a year to capital expenditures
KGH services are well aligned and integrated with the broader health care system
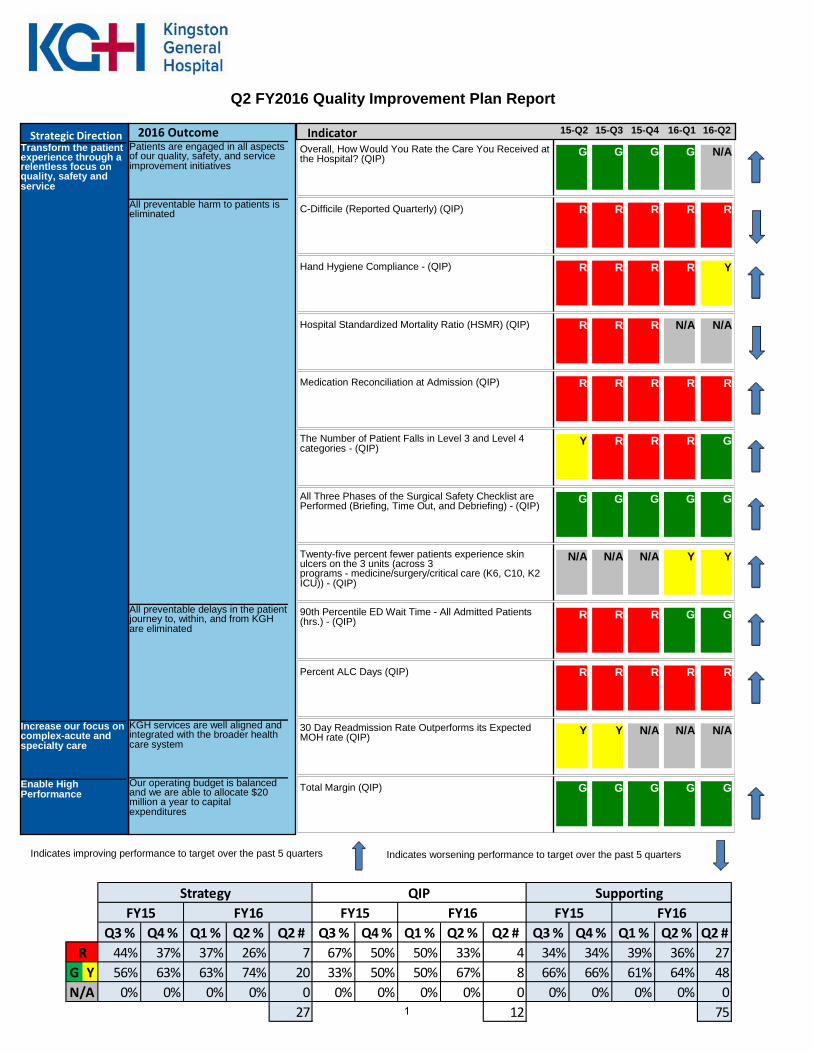
Q2 FY2016 Quality Improvement Plan Report
15-Q2 16-Q2 15-Q3 15-Q4 16-Q1 Transform the patient experience through a relentless focus on quality, safety and service
Patients are engaged in all aspects of our quality, safety, and service improvement initiatives
Overall, How Would You Rate the Care You Received at the Hospital? (QIP) G G G G N/A
All preventable harm to patients is eliminated C-Difficile (Reported Quarterly) (QIP) R R R R R
Hand Hygiene Compliance - (QIP) R R R R Y
Hospital Standardized Mortality Ratio (HSMR) (QIP) R R R N/A N/A
Medication Reconciliation at Admission (QIP) R R R R R
The Number of Patient Falls in Level 3 and Level 4 categories - (QIP)
Y R R R G
All Three Phases of the Surgical Safety Checklist are Performed (Briefing, Time Out, and Debriefing) - (QIP) G G G G G
Twenty-five percent fewer patients experience skin ulcers on the 3 units (across 3 programs - medicine/surgery/critical care (K6, C10, K2 ICU)) - (QIP)
N/A N/A N/A Y Y
All preventable delays in the patient journey to, within, and from KGH are eliminated
90th Percentile ED Wait Time - All Admitted Patients (hrs.) - (QIP) R R R G G
Percent ALC Days (QIP) R R R R R
Increase our focus on complex-acute and specialty care
KGH services are well aligned and integrated with the broader health care system
30 Day Readmission Rate Outperforms its Expected MOH rate (QIP) Y Y N/A N/A N/A
Enable High Performance
Our operating budget is balanced and we are able to allocate $20 million a year to capital expenditures
Total Margin (QIP) G G G G G
Indicates worsening performance to target over the past 5 quarters Indicates improving performance to target over the past 5 quarters
Strategic Direction 2016 Outcome Indicator
Q3 % Q4 % Q1 % Q2 % Q2 # Q3 % Q4 % Q1 % Q2 % Q2 # Q3 % Q4 % Q1 % Q2 % Q2 #44% 37% 37% 26% 7 67% 50% 50% 33% 4 34% 34% 39% 36% 27
G Y 56% 63% 63% 74% 20 33% 50% 50% 67% 8 66% 66% 61% 64% 480% 0% 0% 0% 0 0% 0% 0% 0% 0 0% 0% 0% 0% 0
27 12 75
QIP Supporting
R
FY15 FY16FY16
N/A
FY16FY15 FY15Strategy
1
Q2 FY2016 Quality Improvement Plan Report
Transform the patient experience through a relentless focus on quality, safety and service Patients are engaged in all aspects of our quality, safety, and service improvement initiatives
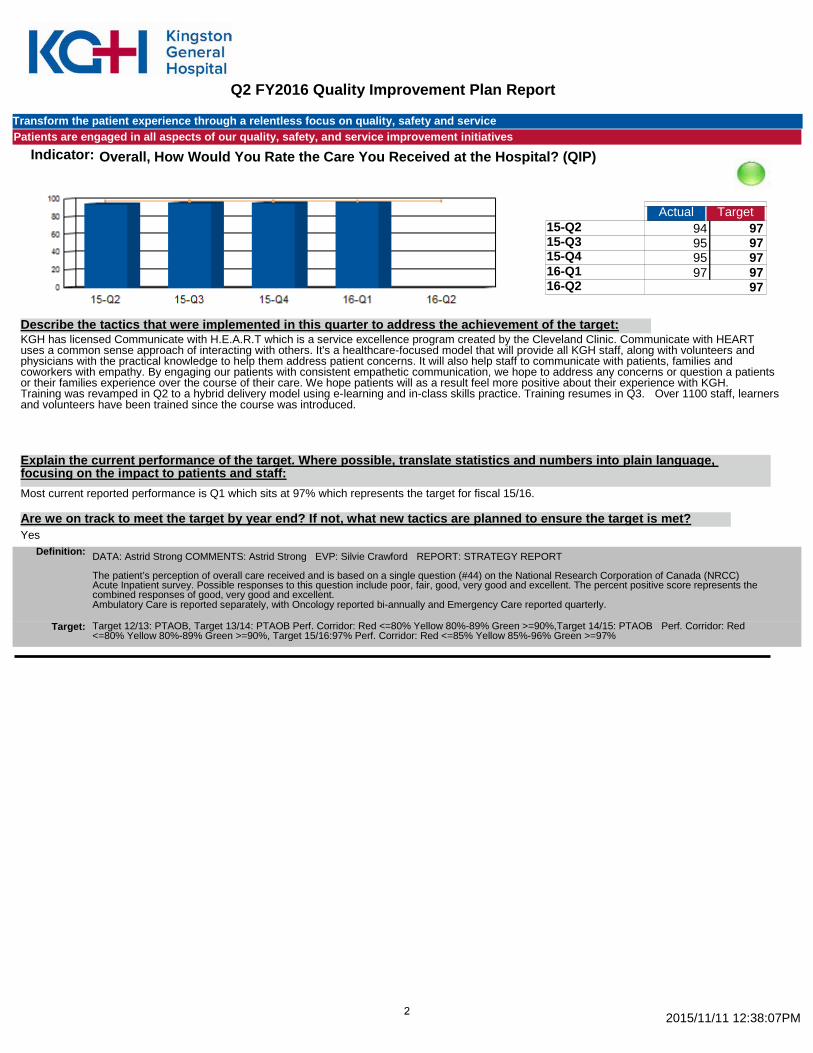
Indicator: Overall, How Would You Rate the Care You Received at the Hospital? (QIP)
Actual Target 15-Q2 94 97 15-Q3 95 97 15-Q4 95 97 16-Q1 97 97 16-Q2 97
380.70
KGH has licensed Communicate with H.E.A.R.T which is a service excellence program created by the Cleveland Clinic. Communicate with HEART uses a common sense approach of interacting with others. It's a healthcare-focused model that will provide all KGH staff, along with volunteers and physicians with the practical knowledge to help them address patient concerns. It will also help staff to communicate with patients, families and coworkers with empathy. By engaging our patients with consistent empathetic communication, we hope to address any concerns or question a patients or their families experience over the course of their care. We hope patients will as a result feel more positive about their experience with KGH. Training was revamped in Q2 to a hybrid delivery model using e-learning and in-class skills practice. Training resumes in Q3. Over 1100 staff, learners and volunteers have been trained since the course was introduced.
Describe the tactics that were implemented in this quarter to address the achievement of the target:
Explain the current performance of the target. Where possible, translate statistics and numbers into plain language, focusing on the impact to patients and staff: Most current reported performance is Q1 which sits at 97% which represents the target for fiscal 15/16.
Yes Are we on track to meet the target by year end? If not, what new tactics are planned to ensure the target is met?
Definition: DATA: Astrid Strong COMMENTS: Astrid Strong EVP: Silvie Crawford REPORT: STRATEGY REPORT The patient’s perception of overall care received and is based on a single question (#44) on the National Research Corporation of Canada (NRCC) Acute Inpatient survey. Possible responses to this question include poor, fair, good, very good and excellent. The percent positive score represents the combined responses of good, very good and excellent. Ambulatory Care is reported separately, with Oncology reported bi-annually and Emergency Care reported quarterly.
Target 12/13: PTAOB, Target 13/14: PTAOB Perf. Corridor: Red <=80% Yellow 80%-89% Green >=90%,Target 14/15: PTAOB Perf. Corridor: Red <=80% Yellow 80%-89% Green >=90%, Target 15/16:97% Perf. Corridor: Red <=85% Yellow 85%-96% Green >=97%
Target:
2015/11/11 12:38:07PM 2
Q2 FY2016 Quality Improvement Plan Report
Transform the patient experience through a relentless focus on quality, safety and service All preventable harm to patients is eliminated
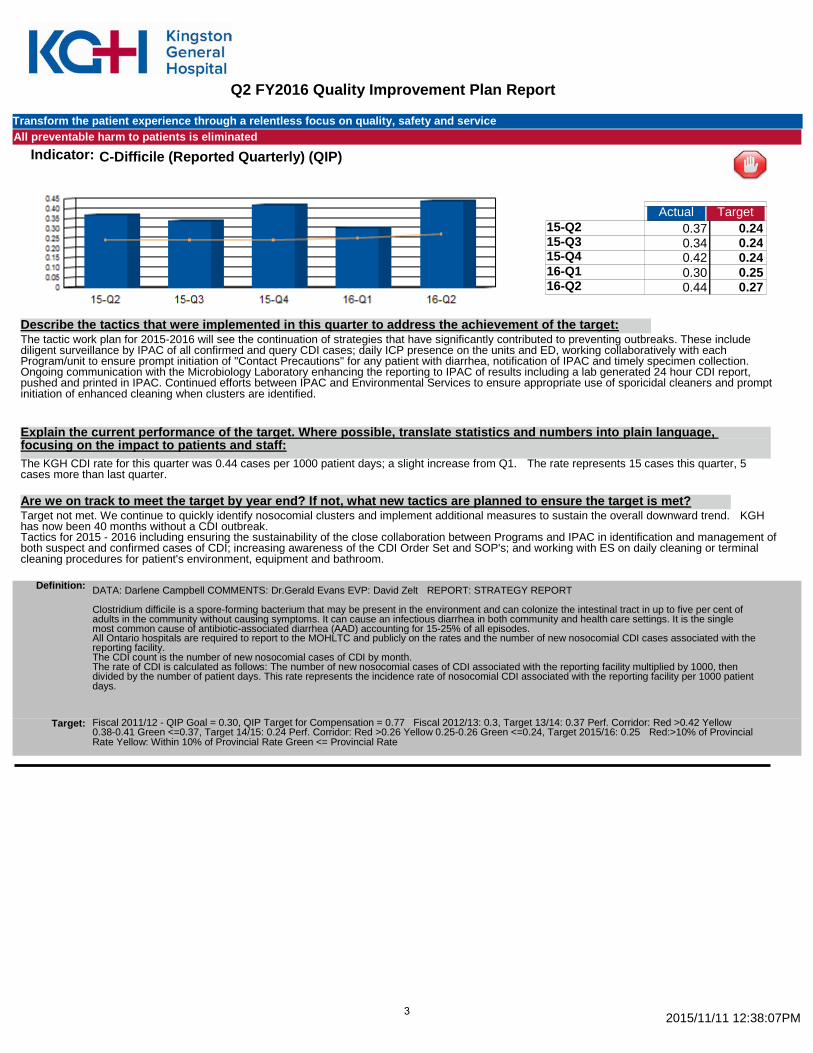
Indicator: C-Difficile (Reported Quarterly) (QIP)
Actual Target 15-Q2 0.37 0.24 15-Q3 0.34 0.24 15-Q4 0.42 0.24 16-Q1 0.30 0.25 16-Q2 0.44 0.27
1.87
The tactic work plan for 2015-2016 will see the continuation of strategies that have significantly contributed to preventing outbreaks. These include diligent surveillance by IPAC of all confirmed and query CDI cases; daily ICP presence on the units and ED, working collaboratively with each Program/unit to ensure prompt initiation of "Contact Precautions" for any patient with diarrhea, notification of IPAC and timely specimen collection. Ongoing communication with the Microbiology Laboratory enhancing the reporting to IPAC of results including a lab generated 24 hour CDI report, pushed and printed in IPAC. Continued efforts between IPAC and Environmental Services to ensure appropriate use of sporicidal cleaners and prompt initiation of enhanced cleaning when clusters are identified.
Describe the tactics that were implemented in this quarter to address the achievement of the target:
Explain the current performance of the target. Where possible, translate statistics and numbers into plain language, focusing on the impact to patients and staff: The KGH CDI rate for this quarter was 0.44 cases per 1000 patient days; a slight increase from Q1. The rate represents 15 cases this quarter, 5 cases more than last quarter.
Target not met. We continue to quickly identify nosocomial clusters and implement additional measures to sustain the overall downward trend. KGH has now been 40 months without a CDI outbreak. Tactics for 2015 - 2016 including ensuring the sustainability of the close collaboration between Programs and IPAC in identification and management of both suspect and confirmed cases of CDI; increasing awareness of the CDI Order Set and SOP's; and working with ES on daily cleaning or terminal cleaning procedures for patient's environment, equipment and bathroom.
Are we on track to meet the target by year end? If not, what new tactics are planned to ensure the target is met?
Definition: DATA: Darlene Campbell COMMENTS: Dr.Gerald Evans EVP: David Zelt REPORT: STRATEGY REPORT Clostridium difficile is a spore-forming bacterium that may be present in the environment and can colonize the intestinal tract in up to five per cent of adults in the community without causing symptoms. It can cause an infectious diarrhea in both community and health care settings. It is the single most common cause of antibiotic-associated diarrhea (AAD) accounting for 15-25% of all episodes. All Ontario hospitals are required to report to the MOHLTC and publicly on the rates and the number of new nosocomial CDI cases associated with the reporting facility. The CDI count is the number of new nosocomial cases of CDI by month. The rate of CDI is calculated as follows: The number of new nosocomial cases of CDI associated with the reporting facility multiplied by 1000, then divided by the number of patient days. This rate represents the incidence rate of nosocomial CDI associated with the reporting facility per 1000 patient days.
Fiscal 2011/12 - QIP Goal = 0.30, QIP Target for Compensation = 0.77 Fiscal 2012/13: 0.3, Target 13/14: 0.37 Perf. Corridor: Red >0.42 Yellow 0.38-0.41 Green <=0.37, Target 14/15: 0.24 Perf. Corridor: Red >0.26 Yellow 0.25-0.26 Green <=0.24, Target 2015/16: 0.25 Red:>10% of Provincial Rate Yellow: Within 10% of Provincial Rate Green <= Provincial Rate
Target:
2015/11/11 12:38:07PM 3
Q2 FY2016 Quality Improvement Plan Report
Transform the patient experience through a relentless focus on quality, safety and service All preventable harm to patients is eliminated
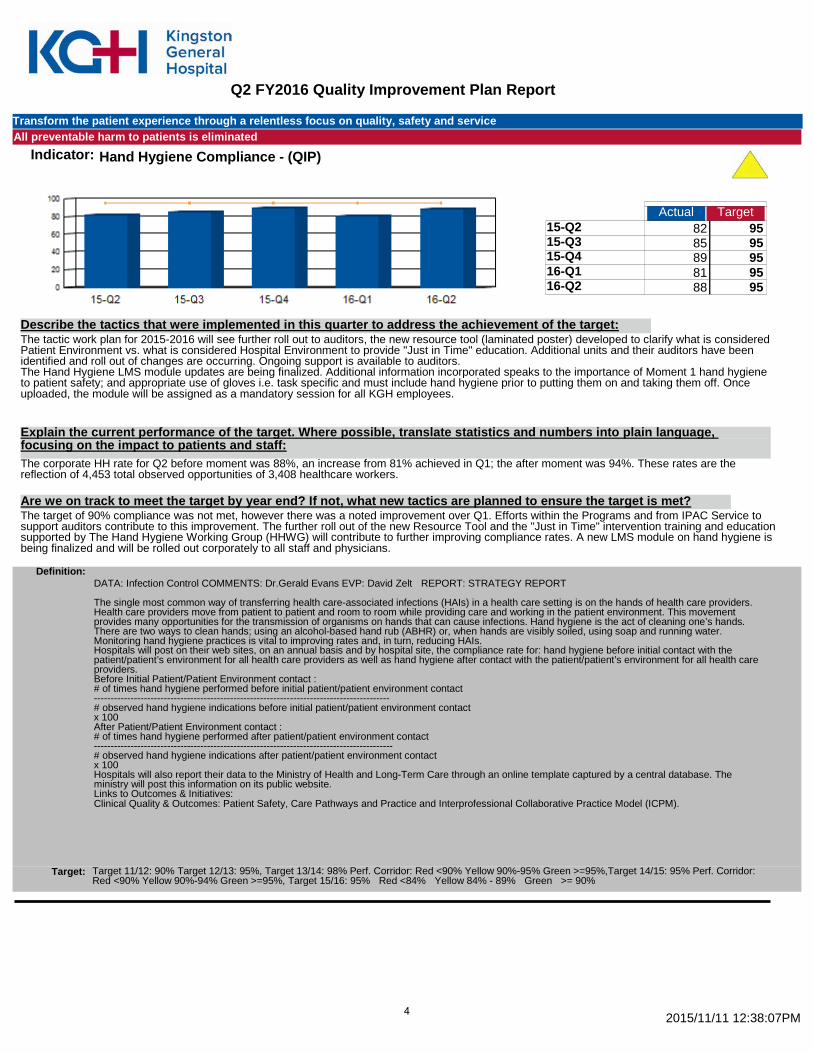
Indicator: Hand Hygiene Compliance - (QIP)
Actual Target 15-Q2 82 95 15-Q3 85 95 15-Q4 89 95 16-Q1 81 95 16-Q2 88 95
425.40
The tactic work plan for 2015-2016 will see further roll out to auditors, the new resource tool (laminated poster) developed to clarify what is considered Patient Environment vs. what is considered Hospital Environment to provide "Just in Time" education. Additional units and their auditors have been identified and roll out of changes are occurring. Ongoing support is available to auditors. The Hand Hygiene LMS module updates are being finalized. Additional information incorporated speaks to the importance of Moment 1 hand hygiene to patient safety; and appropriate use of gloves i.e. task specific and must include hand hygiene prior to putting them on and taking them off. Once uploaded, the module will be assigned as a mandatory session for all KGH employees.
Describe the tactics that were implemented in this quarter to address the achievement of the target:
Explain the current performance of the target. Where possible, translate statistics and numbers into plain language, focusing on the impact to patients and staff: The corporate HH rate for Q2 before moment was 88%, an increase from 81% achieved in Q1; the after moment was 94%. These rates are the reflection of 4,453 total observed opportunities of 3,408 healthcare workers.
The target of 90% compliance was not met, however there was a noted improvement over Q1. Efforts within the Programs and from IPAC Service to support auditors contribute to this improvement. The further roll out of the new Resource Tool and the "Just in Time" intervention training and education supported by The Hand Hygiene Working Group (HHWG) will contribute to further improving compliance rates. A new LMS module on hand hygiene is being finalized and will be rolled out corporately to all staff and physicians.
Are we on track to meet the target by year end? If not, what new tactics are planned to ensure the target is met?
Definition: DATA: Infection Control COMMENTS: Dr.Gerald Evans EVP: David Zelt REPORT: STRATEGY REPORT The single most common way of transferring health care-associated infections (HAIs) in a health care setting is on the hands of health care providers. Health care providers move from patient to patient and room to room while providing care and working in the patient environment. This movement provides many opportunities for the transmission of organisms on hands that can cause infections. Hand hygiene is the act of cleaning one’s hands. There are two ways to clean hands; using an alcohol-based hand rub (ABHR) or, when hands are visibly soiled, using soap and running water. Monitoring hand hygiene practices is vital to improving rates and, in turn, reducing HAIs. Hospitals will post on their web sites, on an annual basis and by hospital site, the compliance rate for: hand hygiene before initial contact with the patient/patient’s environment for all health care providers as well as hand hygiene after contact with the patient/patient’s environment for all health care providers. Before Initial Patient/Patient Environment contact : # of times hand hygiene performed before initial patient/patient environment contact ----------------------------------------------------------------------------------------- # observed hand hygiene indications before initial patient/patient environment contact x 100 After Patient/Patient Environment contact : # of times hand hygiene performed after patient/patient environment contact ------------------------------------------------------------------------------------------ # observed hand hygiene indications after patient/patient environment contact x 100 Hospitals will also report their data to the Ministry of Health and Long-Term Care through an online template captured by a central database. The ministry will post this information on its public website. Links to Outcomes & Initiatives: Clinical Quality & Outcomes: Patient Safety, Care Pathways and Practice and Interprofessional Collaborative Practice Model (ICPM).
Target 11/12: 90% Target 12/13: 95%, Target 13/14: 98% Perf. Corridor: Red <90% Yellow 90%-95% Green >=95%,Target 14/15: 95% Perf. Corridor: Red <90% Yellow 90%-94% Green >=95%, Target 15/16: 95% Red <84% Yellow 84% - 89% Green >= 90%
Target:
2015/11/11 12:38:07PM 4
Q2 FY2016 Quality Improvement Plan Report
Transform the patient experience through a relentless focus on quality, safety and service All preventable harm to patients is eliminated
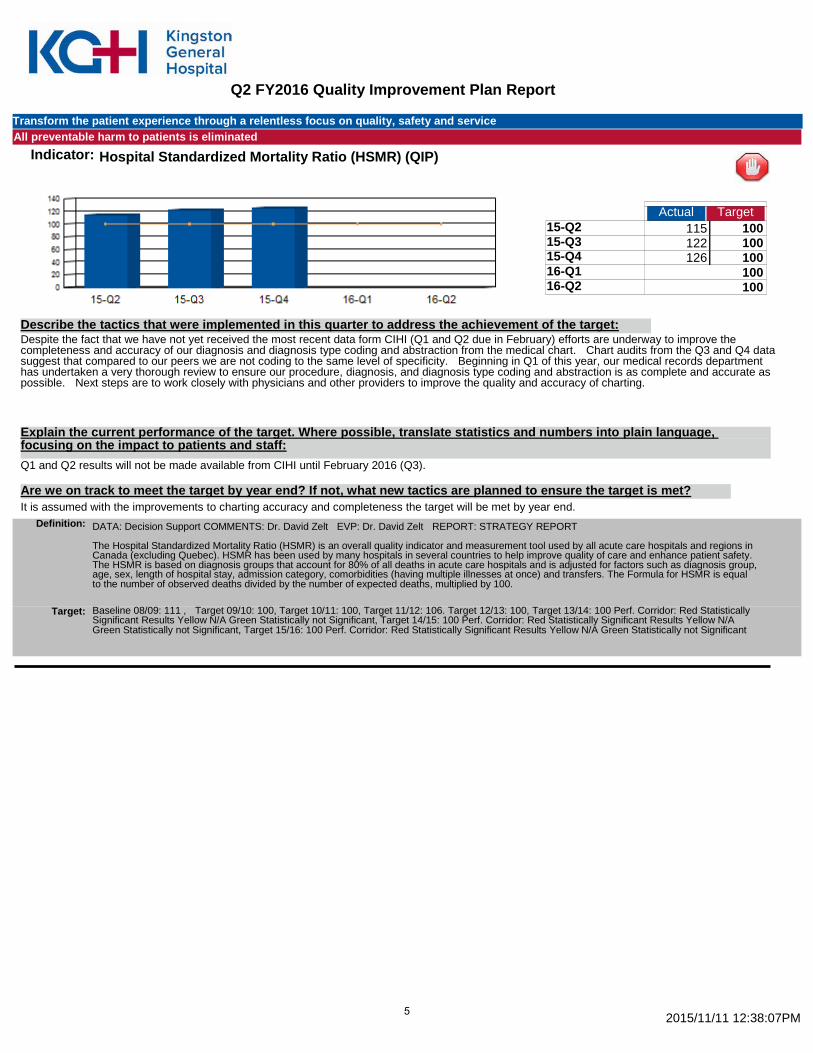
Indicator: Hospital Standardized Mortality Ratio (HSMR) (QIP)
Actual Target 15-Q2 115 100 15-Q3 122 100 15-Q4 126 100 16-Q1 100 16-Q2 100
363.00
Despite the fact that we have not yet received the most recent data form CIHI (Q1 and Q2 due in February) efforts are underway to improve the completeness and accuracy of our diagnosis and diagnosis type coding and abstraction from the medical chart. Chart audits from the Q3 and Q4 data suggest that compared to our peers we are not coding to the same level of specificity. Beginning in Q1 of this year, our medical records department has undertaken a very thorough review to ensure our procedure, diagnosis, and diagnosis type coding and abstraction is as complete and accurate as possible. Next steps are to work closely with physicians and other providers to improve the quality and accuracy of charting.
Describe the tactics that were implemented in this quarter to address the achievement of the target:
Explain the current performance of the target. Where possible, translate statistics and numbers into plain language, focusing on the impact to patients and staff: Q1 and Q2 results will not be made available from CIHI until February 2016 (Q3).
It is assumed with the improvements to charting accuracy and completeness the target will be met by year end. Are we on track to meet the target by year end? If not, what new tactics are planned to ensure the target is met?
Definition: DATA: Decision Support COMMENTS: Dr. David Zelt EVP: Dr. David Zelt REPORT: STRATEGY REPORT The Hospital Standardized Mortality Ratio (HSMR) is an overall quality indicator and measurement tool used by all acute care hospitals and regions in Canada (excluding Quebec). HSMR has been used by many hospitals in several countries to help improve quality of care and enhance patient safety. The HSMR is based on diagnosis groups that account for 80% of all deaths in acute care hospitals and is adjusted for factors such as diagnosis group, age, sex, length of hospital stay, admission category, comorbidities (having multiple illnesses at once) and transfers. The Formula for HSMR is equal to the number of observed deaths divided by the number of expected deaths, multiplied by 100.
Baseline 08/09: 111 , Target 09/10: 100, Target 10/11: 100, Target 11/12: 106. Target 12/13: 100, Target 13/14: 100 Perf. Corridor: Red Statistically Significant Results Yellow N/A Green Statistically not Significant, Target 14/15: 100 Perf. Corridor: Red Statistically Significant Results Yellow N/A Green Statistically not Significant, Target 15/16: 100 Perf. Corridor: Red Statistically Significant Results Yellow N/A Green Statistically not Significant
Target:
2015/11/11 12:38:07PM 5
Q2 FY2016 Quality Improvement Plan Report
Transform the patient experience through a relentless focus on quality, safety and service All preventable harm to patients is eliminated
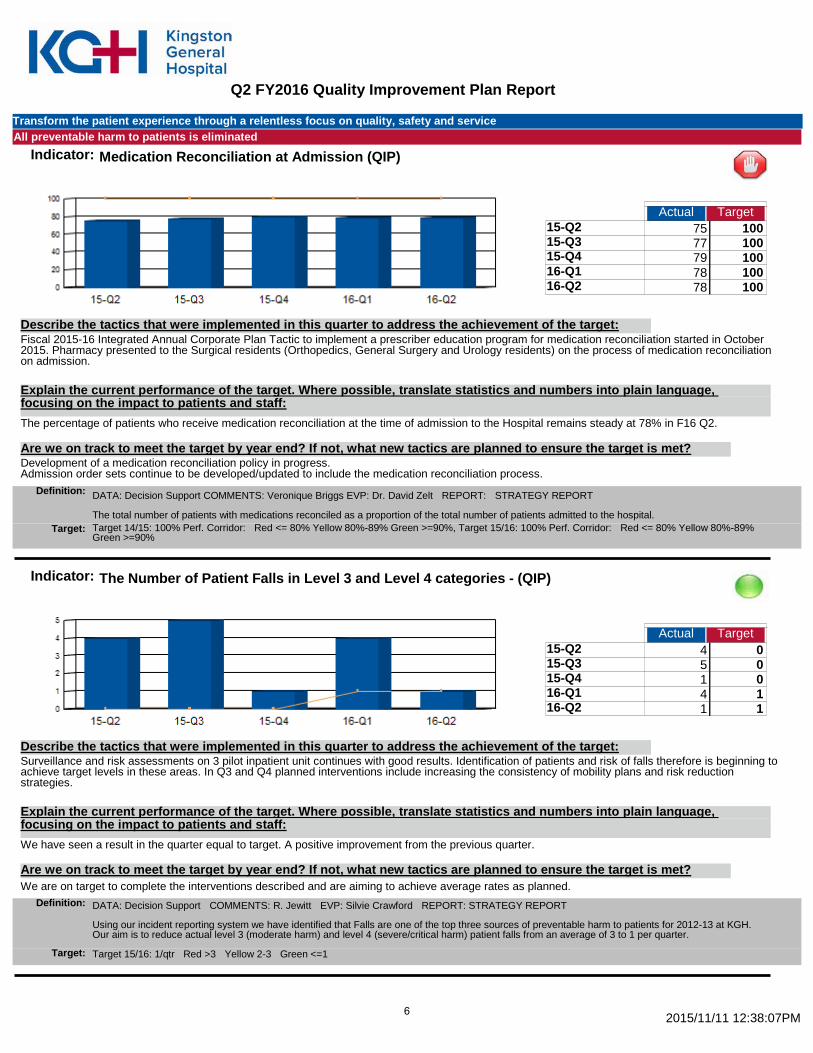
Indicator: Medication Reconciliation at Admission (QIP)
Actual Target 15-Q2 75 100 15-Q3 77 100 15-Q4 79 100 16-Q1 78 100 16-Q2 78 100
387.00
Fiscal 2015-16 Integrated Annual Corporate Plan Tactic to implement a prescriber education program for medication reconciliation started in October 2015. Pharmacy presented to the Surgical residents (Orthopedics, General Surgery and Urology residents) on the process of medication reconciliation on admission.
Describe the tactics that were implemented in this quarter to address the achievement of the target:
Explain the current performance of the target. Where possible, translate statistics and numbers into plain language, focusing on the impact to patients and staff: The percentage of patients who receive medication reconciliation at the time of admission to the Hospital remains steady at 78% in F16 Q2.
Development of a medication reconciliation policy in progress. Admission order sets continue to be developed/updated to include the medication reconciliation process.
Are we on track to meet the target by year end? If not, what new tactics are planned to ensure the target is met?
Definition: DATA: Decision Support COMMENTS: Veronique Briggs EVP: Dr. David Zelt REPORT: STRATEGY REPORT The total number of patients with medications reconciled as a proportion of the total number of patients admitted to the hospital. Target 14/15: 100% Perf. Corridor: Red <= 80% Yellow 80%-89% Green >=90%, Target 15/16: 100% Perf. Corridor: Red <= 80% Yellow 80%-89% Green >=90%
Target:
Indicator: The Number of Patient Falls in Level 3 and Level 4 categories - (QIP)
Actual Target 15-Q2 4 0 15-Q3 5 0 15-Q4 1 0 16-Q1 4 1 16-Q2 1 1
15.00
Surveillance and risk assessments on 3 pilot inpatient unit continues with good results. Identification of patients and risk of falls therefore is beginning to achieve target levels in these areas. In Q3 and Q4 planned interventions include increasing the consistency of mobility plans and risk reduction strategies.
Describe the tactics that were implemented in this quarter to address the achievement of the target:
Explain the current performance of the target. Where possible, translate statistics and numbers into plain language, focusing on the impact to patients and staff: We have seen a result in the quarter equal to target. A positive improvement from the previous quarter.
We are on target to complete the interventions described and are aiming to achieve average rates as planned. Are we on track to meet the target by year end? If not, what new tactics are planned to ensure the target is met?
Definition: DATA: Decision Support COMMENTS: R. Jewitt EVP: Silvie Crawford REPORT: STRATEGY REPORT Using our incident reporting system we have identified that Falls are one of the top three sources of preventable harm to patients for 2012-13 at KGH. Our aim is to reduce actual level 3 (moderate harm) and level 4 (severe/critical harm) patient falls from an average of 3 to 1 per quarter.
Target 15/16: 1/qtr Red >3 Yellow 2-3 Green <=1 Target:
2015/11/11 12:38:07PM 6
Q2 FY2016 Quality Improvement Plan Report
Transform the patient experience through a relentless focus on quality, safety and service All preventable harm to patients is eliminated
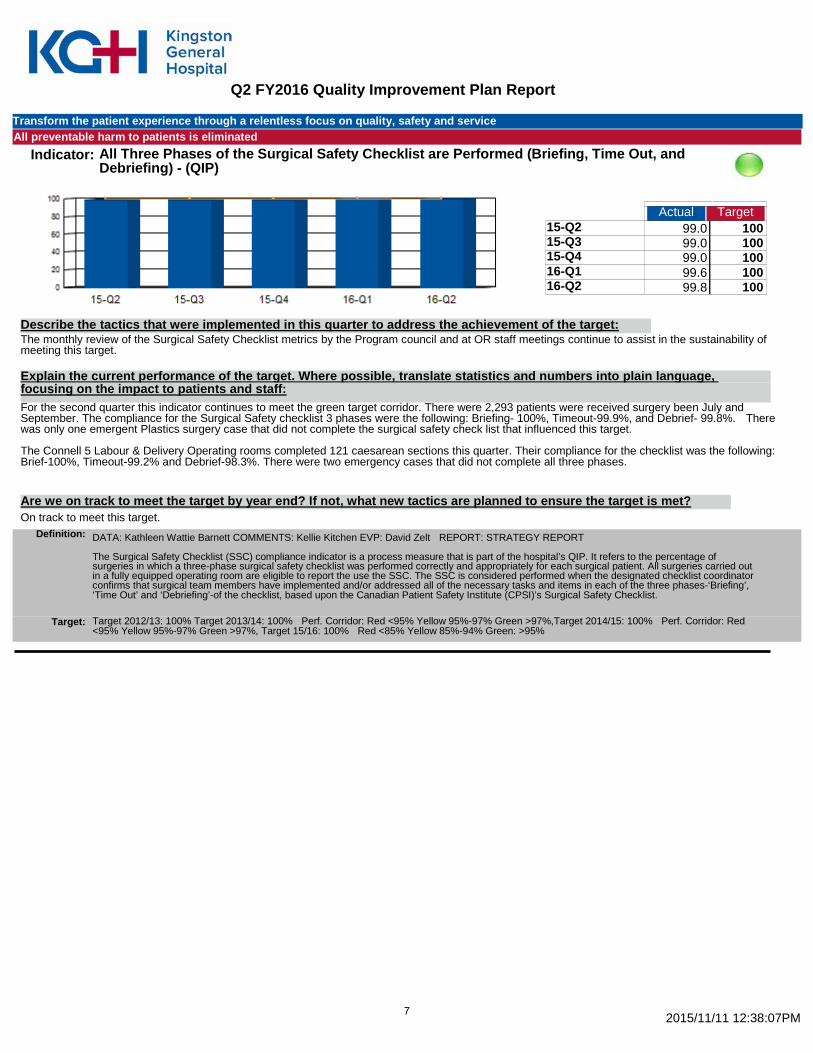
Indicator: All Three Phases of the Surgical Safety Checklist are Performed (Briefing, Time Out, and Debriefing) - (QIP)
Actual Target 15-Q2 99.0 100 15-Q3 99.0 100 15-Q4 99.0 100 16-Q1 99.6 100 16-Q2 99.8 100
496.40
The monthly review of the Surgical Safety Checklist metrics by the Program council and at OR staff meetings continue to assist in the sustainability of meeting this target.
Describe the tactics that were implemented in this quarter to address the achievement of the target:
Explain the current performance of the target. Where possible, translate statistics and numbers into plain language, focusing on the impact to patients and staff: For the second quarter this indicator continues to meet the green target corridor. There were 2,293 patients were received surgery been July and September. The compliance for the Surgical Safety checklist 3 phases were the following: Briefing- 100%, Timeout-99.9%, and Debrief- 99.8%. There was only one emergent Plastics surgery case that did not complete the surgical safety check list that influenced this target. The Connell 5 Labour & Delivery Operating rooms completed 121 caesarean sections this quarter. Their compliance for the checklist was the following: Brief-100%, Timeout-99.2% and Debrief-98.3%. There were two emergency cases that did not complete all three phases.
On track to meet this target. Are we on track to meet the target by year end? If not, what new tactics are planned to ensure the target is met?
Definition: DATA: Kathleen Wattie Barnett COMMENTS: Kellie Kitchen EVP: David Zelt REPORT: STRATEGY REPORT The Surgical Safety Checklist (SSC) compliance indicator is a process measure that is part of the hospital’s QIP. It refers to the percentage of surgeries in which a three-phase surgical safety checklist was performed correctly and appropriately for each surgical patient. All surgeries carried out in a fully equipped operating room are eligible to report the use the SSC. The SSC is considered performed when the designated checklist coordinator confirms that surgical team members have implemented and/or addressed all of the necessary tasks and items in each of the three phases-‘Briefing’, ‘Time Out’ and ‘Debriefing’-of the checklist, based upon the Canadian Patient Safety Institute (CPSI)’s Surgical Safety Checklist.
Target 2012/13: 100% Target 2013/14: 100% Perf. Corridor: Red <95% Yellow 95%-97% Green >97%,Target 2014/15: 100% Perf. Corridor: Red <95% Yellow 95%-97% Green >97%, Target 15/16: 100% Red <85% Yellow 85%-94% Green: >95%
Target:
2015/11/11 12:38:07PM 7
Q2 FY2016 Quality Improvement Plan Report
Transform the patient experience through a relentless focus on quality, safety and service All preventable harm to patients is eliminated
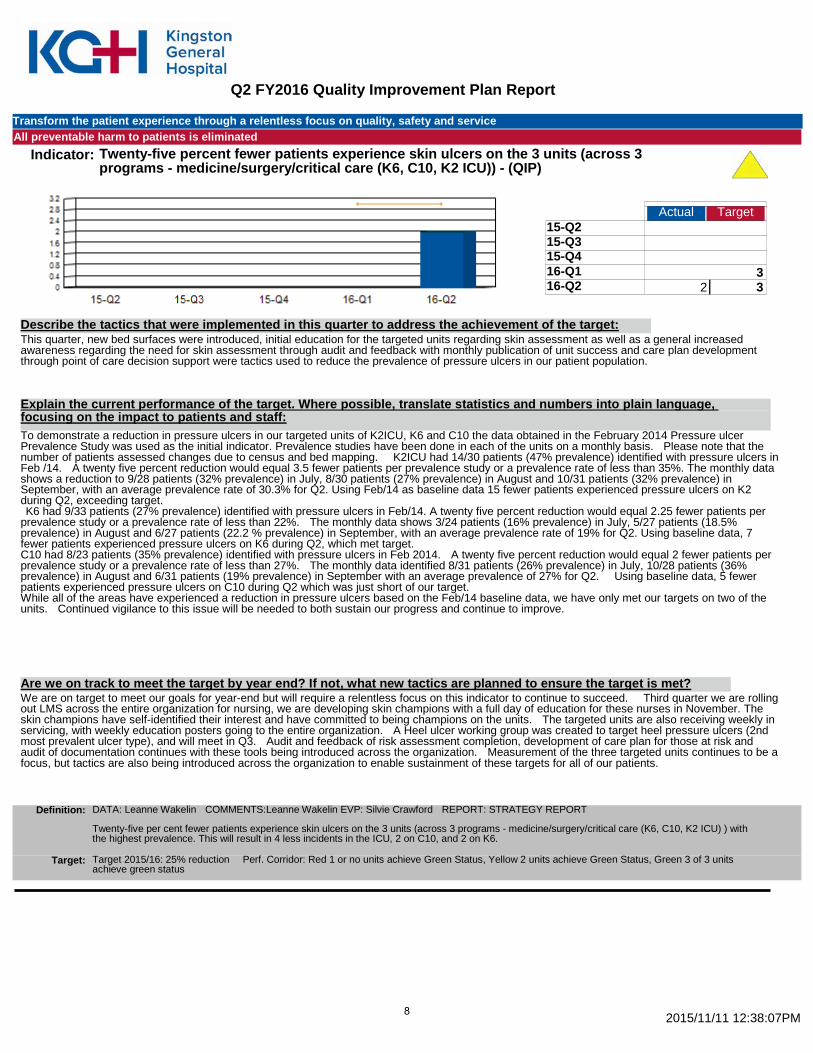
Indicator: Twenty-five percent fewer patients experience skin ulcers on the 3 units (across 3 programs - medicine/surgery/critical care (K6, C10, K2 ICU)) - (QIP)
Actual Target 15-Q2 15-Q3 15-Q4 16-Q1 3 16-Q2 2 3
2.00
This quarter, new bed surfaces were introduced, initial education for the targeted units regarding skin assessment as well as a general increased awareness regarding the need for skin assessment through audit and feedback with monthly publication of unit success and care plan development through point of care decision support were tactics used to reduce the prevalence of pressure ulcers in our patient population.
Describe the tactics that were implemented in this quarter to address the achievement of the target:
Explain the current performance of the target. Where possible, translate statistics and numbers into plain language, focusing on the impact to patients and staff: To demonstrate a reduction in pressure ulcers in our targeted units of K2ICU, K6 and C10 the data obtained in the February 2014 Pressure ulcer Prevalence Study was used as the initial indicator. Prevalence studies have been done in each of the units on a monthly basis. Please note that the number of patients assessed changes due to census and bed mapping. K2ICU had 14/30 patients (47% prevalence) identified with pressure ulcers in Feb /14. A twenty five percent reduction would equal 3.5 fewer patients per prevalence study or a prevalence rate of less than 35%. The monthly data shows a reduction to 9/28 patients (32% prevalence) in July, 8/30 patients (27% prevalence) in August and 10/31 patients (32% prevalence) in September, with an average prevalence rate of 30.3% for Q2. Using Feb/14 as baseline data 15 fewer patients experienced pressure ulcers on K2 during Q2, exceeding target. K6 had 9/33 patients (27% prevalence) identified with pressure ulcers in Feb/14. A twenty five percent reduction would equal 2.25 fewer patients per prevalence study or a prevalence rate of less than 22%. The monthly data shows 3/24 patients (16% prevalence) in July, 5/27 patients (18.5% prevalence) in August and 6/27 patients (22.2 % prevalence) in September, with an average prevalence rate of 19% for Q2. Using baseline data, 7 fewer patients experienced pressure ulcers on K6 during Q2, which met target. C10 had 8/23 patients (35% prevalence) identified with pressure ulcers in Feb 2014. A twenty five percent reduction would equal 2 fewer patients per prevalence study or a prevalence rate of less than 27%. The monthly data identified 8/31 patients (26% prevalence) in July, 10/28 patients (36% prevalence) in August and 6/31 patients (19% prevalence) in September with an average prevalence of 27% for Q2. Using baseline data, 5 fewer patients experienced pressure ulcers on C10 during Q2 which was just short of our target. While all of the areas have experienced a reduction in pressure ulcers based on the Feb/14 baseline data, we have only met our targets on two of the units. Continued vigilance to this issue will be needed to both sustain our progress and continue to improve.
We are on target to meet our goals for year-end but will require a relentless focus on this indicator to continue to succeed. Third quarter we are rolling out LMS across the entire organization for nursing, we are developing skin champions with a full day of education for these nurses in November. The skin champions have self-identified their interest and have committed to being champions on the units. The targeted units are also receiving weekly in servicing, with weekly education posters going to the entire organization. A Heel ulcer working group was created to target heel pressure ulcers (2nd most prevalent ulcer type), and will meet in Q3. Audit and feedback of risk assessment completion, development of care plan for those at risk and audit of documentation continues with these tools being introduced across the organization. Measurement of the three targeted units continues to be a focus, but tactics are also being introduced across the organization to enable sustainment of these targets for all of our patients.
Are we on track to meet the target by year end? If not, what new tactics are planned to ensure the target is met?
Definition: DATA: Leanne Wakelin COMMENTS:Leanne Wakelin EVP: Silvie Crawford REPORT: STRATEGY REPORT Twenty-five per cent fewer patients experience skin ulcers on the 3 units (across 3 programs - medicine/surgery/critical care (K6, C10, K2 ICU) ) with the highest prevalence. This will result in 4 less incidents in the ICU, 2 on C10, and 2 on K6.
Target 2015/16: 25% reduction Perf. Corridor: Red 1 or no units achieve Green Status, Yellow 2 units achieve Green Status, Green 3 of 3 units achieve green status
Target:
2015/11/11 12:38:07PM 8
Q2 FY2016 Quality Improvement Plan Report
Transform the patient experience through a relentless focus on quality, safety and service All preventable delays in the patient journey to, within, and from KGH are eliminated
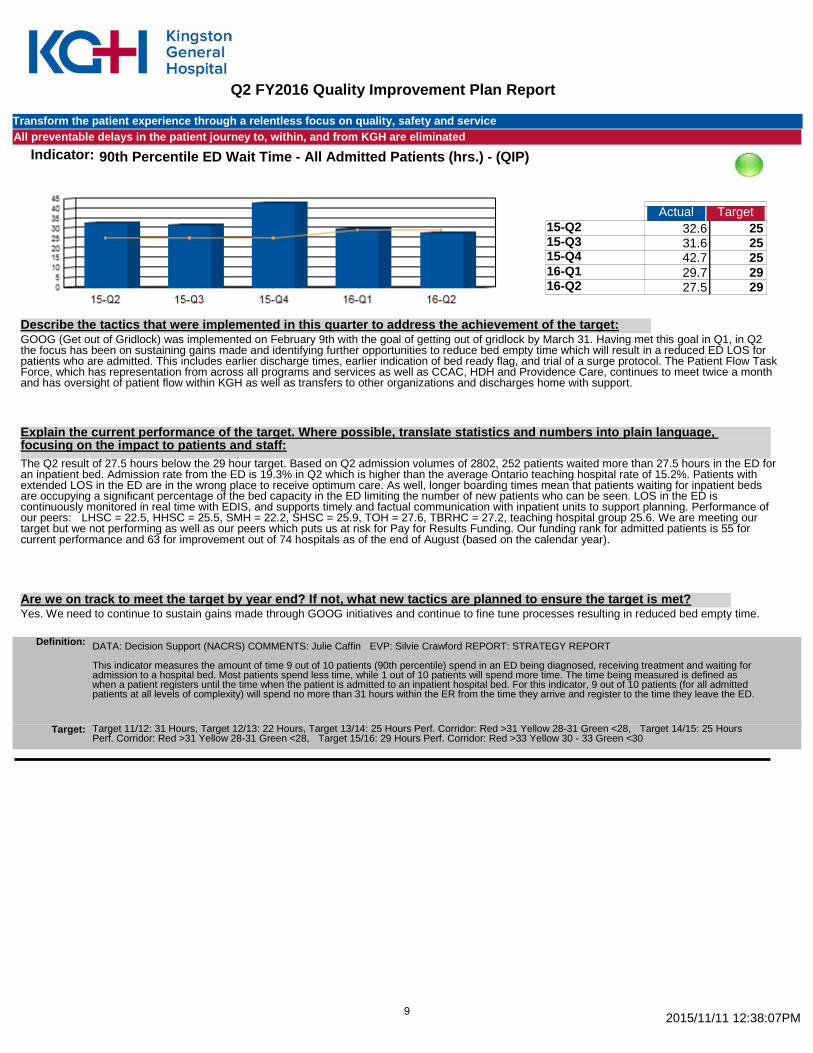
Indicator: 90th Percentile ED Wait Time - All Admitted Patients (hrs.) - (QIP)
Actual Target 15-Q2 32.6 25 15-Q3 31.6 25 15-Q4 42.7 25 16-Q1 29.7 29 16-Q2 27.5 29
164.10
GOOG (Get out of Gridlock) was implemented on February 9th with the goal of getting out of gridlock by March 31. Having met this goal in Q1, in Q2 the focus has been on sustaining gains made and identifying further opportunities to reduce bed empty time which will result in a reduced ED LOS for patients who are admitted. This includes earlier discharge times, earlier indication of bed ready flag, and trial of a surge protocol. The Patient Flow Task Force, which has representation from across all programs and services as well as CCAC, HDH and Providence Care, continues to meet twice a month and has oversight of patient flow within KGH as well as transfers to other organizations and discharges home with support.
Describe the tactics that were implemented in this quarter to address the achievement of the target:
Explain the current performance of the target. Where possible, translate statistics and numbers into plain language, focusing on the impact to patients and staff: The Q2 result of 27.5 hours below the 29 hour target. Based on Q2 admission volumes of 2802, 252 patients waited more than 27.5 hours in the ED for an inpatient bed. Admission rate from the ED is 19.3% in Q2 which is higher than the average Ontario teaching hospital rate of 15.2%. Patients with extended LOS in the ED are in the wrong place to receive optimum care. As well, longer boarding times mean that patients waiting for inpatient beds are occupying a significant percentage of the bed capacity in the ED limiting the number of new patients who can be seen. LOS in the ED is continuously monitored in real time with EDIS, and supports timely and factual communication with inpatient units to support planning. Performance of our peers: LHSC = 22.5, HHSC = 25.5, SMH = 22.2, SHSC = 25.9, TOH = 27.6, TBRHC = 27.2, teaching hospital group 25.6. We are meeting our target but we not performing as well as our peers which puts us at risk for Pay for Results Funding. Our funding rank for admitted patients is 55 for current performance and 63 for improvement out of 74 hospitals as of the end of August (based on the calendar year).
Yes. We need to continue to sustain gains made through GOOG initiatives and continue to fine tune processes resulting in reduced bed empty time. Are we on track to meet the target by year end? If not, what new tactics are planned to ensure the target is met?
Definition: DATA: Decision Support (NACRS) COMMENTS: Julie Caffin EVP: Silvie Crawford REPORT: STRATEGY REPORT This indicator measures the amount of time 9 out of 10 patients (90th percentile) spend in an ED being diagnosed, receiving treatment and waiting for admission to a hospital bed. Most patients spend less time, while 1 out of 10 patients will spend more time. The time being measured is defined as when a patient registers until the time when the patient is admitted to an inpatient hospital bed. For this indicator, 9 out of 10 patients (for all admitted patients at all levels of complexity) will spend no more than 31 hours within the ER from the time they arrive and register to the time they leave the ED.
Target 11/12: 31 Hours, Target 12/13: 22 Hours, Target 13/14: 25 Hours Perf. Corridor: Red >31 Yellow 28-31 Green <28, Target 14/15: 25 Hours Perf. Corridor: Red >31 Yellow 28-31 Green <28, Target 15/16: 29 Hours Perf. Corridor: Red >33 Yellow 30 - 33 Green <30
Target:
2015/11/11 12:38:07PM 9
Q2 FY2016 Quality Improvement Plan Report
Transform the patient experience through a relentless focus on quality, safety and service All preventable delays in the patient journey to, within, and from KGH are eliminated
Indicator: Percent ALC Days (QIP)
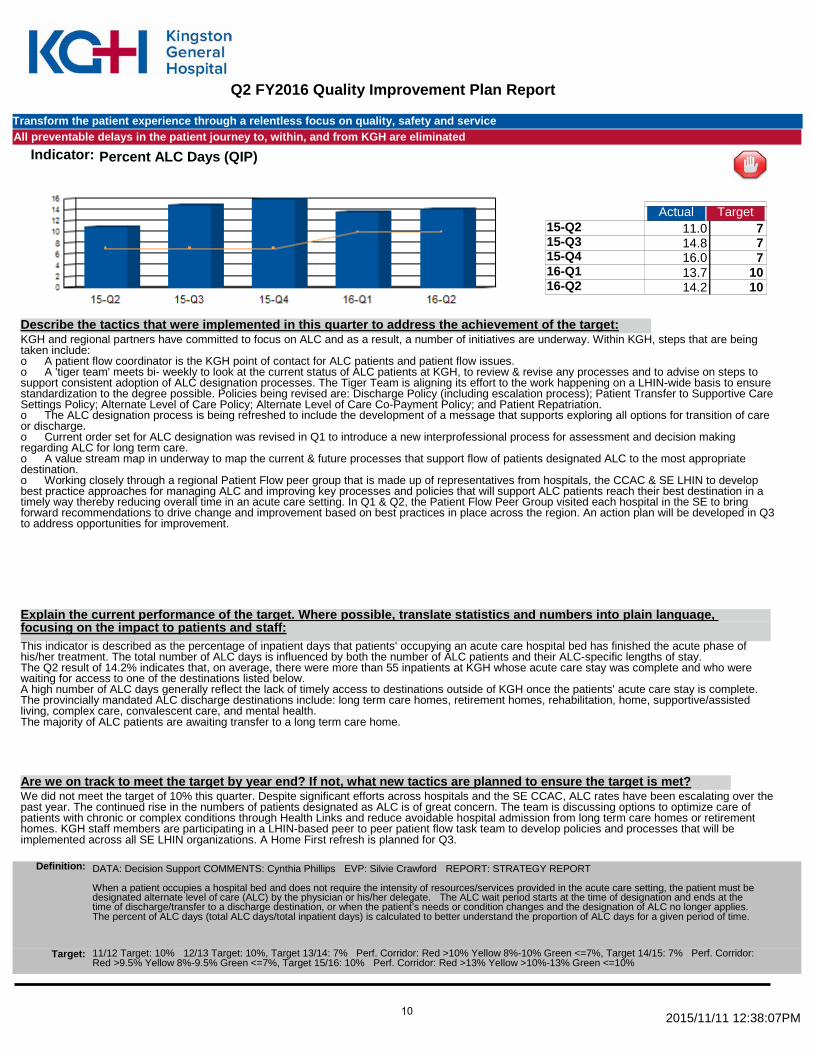
Actual Target 15-Q2 11.0 7 15-Q3 14.8 7 15-Q4 16.0 7 16-Q1 13.7 10 16-Q2 14.2 10
69.70
KGH and regional partners have committed to focus on ALC and as a result, a number of initiatives are underway. Within KGH, steps that are being taken include: o A patient flow coordinator is the KGH point of contact for ALC patients and patient flow issues. o A 'tiger team' meets bi- weekly to look at the current status of ALC patients at KGH, to review & revise any processes and to advise on steps to support consistent adoption of ALC designation processes. The Tiger Team is aligning its effort to the work happening on a LHIN-wide basis to ensure standardization to the degree possible. Policies being revised are: Discharge Policy (including escalation process); Patient Transfer to Supportive Care Settings Policy; Alternate Level of Care Policy; Alternate Level of Care Co-Payment Policy; and Patient Repatriation. o The ALC designation process is being refreshed to include the development of a message that supports exploring all options for transition of care or discharge. o Current order set for ALC designation was revised in Q1 to introduce a new interprofessional process for assessment and decision making regarding ALC for long term care. o A value stream map in underway to map the current & future processes that support flow of patients designated ALC to the most appropriate destination. o Working closely through a regional Patient Flow peer group that is made up of representatives from hospitals, the CCAC & SE LHIN to develop best practice approaches for managing ALC and improving key processes and policies that will support ALC patients reach their best destination in a timely way thereby reducing overall time in an acute care setting. In Q1 & Q2, the Patient Flow Peer Group visited each hospital in the SE to bring forward recommendations to drive change and improvement based on best practices in place across the region. An action plan will be developed in Q3 to address opportunities for improvement.
Describe the tactics that were implemented in this quarter to address the achievement of the target:
Explain the current performance of the target. Where possible, translate statistics and numbers into plain language, focusing on the impact to patients and staff: This indicator is described as the percentage of inpatient days that patients' occupying an acute care hospital bed has finished the acute phase of his/her treatment. The total number of ALC days is influenced by both the number of ALC patients and their ALC-specific lengths of stay. The Q2 result of 14.2% indicates that, on average, there were more than 55 inpatients at KGH whose acute care stay was complete and who were waiting for access to one of the destinations listed below. A high number of ALC days generally reflect the lack of timely access to destinations outside of KGH once the patients' acute care stay is complete. The provincially mandated ALC discharge destinations include: long term care homes, retirement homes, rehabilitation, home, supportive/assisted living, complex care, convalescent care, and mental health. The majority of ALC patients are awaiting transfer to a long term care home.
We did not meet the target of 10% this quarter. Despite significant efforts across hospitals and the SE CCAC, ALC rates have been escalating over the past year. The continued rise in the numbers of patients designated as ALC is of great concern. The team is discussing options to optimize care of patients with chronic or complex conditions through Health Links and reduce avoidable hospital admission from long term care homes or retirement homes. KGH staff members are participating in a LHIN-based peer to peer patient flow task team to develop policies and processes that will be implemented across all SE LHIN organizations. A Home First refresh is planned for Q3.
Are we on track to meet the target by year end? If not, what new tactics are planned to ensure the target is met?
Definition: DATA: Decision Support COMMENTS: Cynthia Phillips EVP: Silvie Crawford REPORT: STRATEGY REPORT When a patient occupies a hospital bed and does not require the intensity of resources/services provided in the acute care setting, the patient must be designated alternate level of care (ALC) by the physician or his/her delegate. The ALC wait period starts at the time of designation and ends at the time of discharge/transfer to a discharge destination, or when the patient’s needs or condition changes and the designation of ALC no longer applies. The percent of ALC days (total ALC days/total inpatient days) is calculated to better understand the proportion of ALC days for a given period of time.
11/12 Target: 10% 12/13 Target: 10%, Target 13/14: 7% Perf. Corridor: Red >10% Yellow 8%-10% Green <=7%, Target 14/15: 7% Perf. Corridor: Red >9.5% Yellow 8%-9.5% Green <=7%, Target 15/16: 10% Perf. Corridor: Red >13% Yellow >10%-13% Green <=10%
Target:
2015/11/11 12:38:07PM 10
Q2 FY2016 Quality Improvement Plan Report
Increase our focus on complex-acute and specialty care KGH services are well aligned and integrated with the broader health care system
Indicator: 30 Day Readmission Rate Outperforms its Expected MOH rate (QIP)
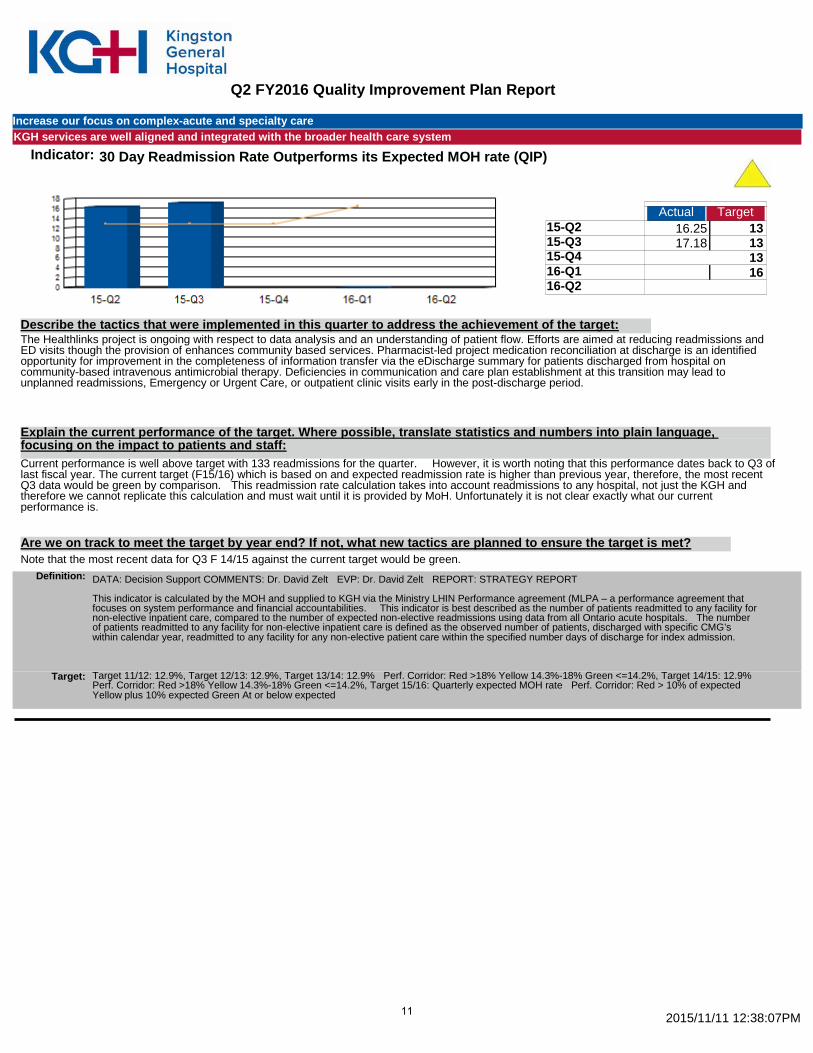
Actual Target 15-Q2 16.25 13 15-Q3 17.18 13 15-Q4 13 16-Q1 16 16-Q2
33.43
The Healthlinks project is ongoing with respect to data analysis and an understanding of patient flow. Efforts are aimed at reducing readmissions and ED visits though the provision of enhances community based services. Pharmacist-led project medication reconciliation at discharge is an identified opportunity for improvement in the completeness of information transfer via the eDischarge summary for patients discharged from hospital on community-based intravenous antimicrobial therapy. Deficiencies in communication and care plan establishment at this transition may lead to unplanned readmissions, Emergency or Urgent Care, or outpatient clinic visits early in the post-discharge period.
Describe the tactics that were implemented in this quarter to address the achievement of the target:
Explain the current performance of the target. Where possible, translate statistics and numbers into plain language, focusing on the impact to patients and staff: Current performance is well above target with 133 readmissions for the quarter. However, it is worth noting that this performance dates back to Q3 of last fiscal year. The current target (F15/16) which is based on and expected readmission rate is higher than previous year, therefore, the most recent Q3 data would be green by comparison. This readmission rate calculation takes into account readmissions to any hospital, not just the KGH and therefore we cannot replicate this calculation and must wait until it is provided by MoH. Unfortunately it is not clear exactly what our current performance is.
Note that the most recent data for Q3 F 14/15 against the current target would be green. Are we on track to meet the target by year end? If not, what new tactics are planned to ensure the target is met?
Definition: DATA: Decision Support COMMENTS: Dr. David Zelt EVP: Dr. David Zelt REPORT: STRATEGY REPORT This indicator is calculated by the MOH and supplied to KGH via the Ministry LHIN Performance agreement (MLPA – a performance agreement that focuses on system performance and financial accountabilities. This indicator is best described as the number of patients readmitted to any facility for non-elective inpatient care, compared to the number of expected non-elective readmissions using data from all Ontario acute hospitals. The number of patients readmitted to any facility for non-elective inpatient care is defined as the observed number of patients, discharged with specific CMG’s within calendar year, readmitted to any facility for any non-elective patient care within the specified number days of discharge for index admission.
Target 11/12: 12.9%, Target 12/13: 12.9%, Target 13/14: 12.9% Perf. Corridor: Red >18% Yellow 14.3%-18% Green <=14.2%, Target 14/15: 12.9% Perf. Corridor: Red >18% Yellow 14.3%-18% Green <=14.2%, Target 15/16: Quarterly expected MOH rate Perf. Corridor: Red > 10% of expected Yellow plus 10% expected Green At or below expected
Target:
2015/11/11 12:38:07PM 11

Q2 FY2016 Quality Improvement Plan Report
Enable High Performance Our operating budget is balanced and we are able to allocate $20 million a year to capital expenditures
Indicator: Total Margin (QIP)
Actual Target 15-Q2 3 0 15-Q3 3 0 15-Q4 7 0 16-Q1 4 0 16-Q2 5 0
22.00
The margin reflected at Q2 exceeds the budgeted performance target. Describe the tactics that were implemented in this quarter to address the achievement of the target:
Explain the current performance of the target. Where possible, translate statistics and numbers into plain language, focusing on the impact to patients and staff: The favourable position is mainly due to the recognition of one-time revenue/recovery and expense adjustments
At this point in time, senior leadership is optimistic that the hospital will achieve a balanced operating position. Monthly financial reporting and analysis support will continue to be provided monthly to allow those with budget responsibility to make informed decisions relative to actions necessary to ensure that year-end performance achieves a balanced budget position. High-level summary results by category continue to be provided to the KGH senior leadership team to inform discussion and decisions made by the hospital Planning and Performance Committee.
Are we on track to meet the target by year end? If not, what new tactics are planned to ensure the target is met?
Definition: DATA: J'Neene Coghlan COMMENTS: J'Neene Coghlan EVP: Jim Flett REPORT: STRATEGY REPORT Operating margin "measures total operating revenues in excess of total expenses". It is a measurement of management’s efficiency and the hospital’s ability to live within available financial resources. Calculated as: Operating Surplus/(Deficit) divided by Operating Revenue. To ensure consistency in calculation between hospitals, the Province has provided a specific definition based on the Hospitals MIS Chart of Accounts. It is inclusive of all fund types (fund 1, 2, and 3), but excludes facility amortization).
Baseline 08/09: (3.9%), Target 09/10: (4.0), Target 10/11: (2.17), Target 11/12: 0, Target 12/13: 0, Target 13/14: 0% Perf. Corridor: Red <0 Yellow N/A Green >=0, Target 14/15: 0% Perf. Corridor: Red <0 Yellow N/A Green >=0, Target 15/16: 0% Perf. Corridor: Red <0 Yellow N/A Green >=0
Target:
2015/11/11 12:38:07PM 12

Q2 FY2016 Quality Improvement Plan Report
Status:
Currently Not Available
Green-Meet Acceptable Performance Target
Red-Performance is outside acceptable target range and require
Yellow-Monitoring Required, performance approaching
2015/11/11 12:38:07PM
N/A
13