performance management and kpis file• average days or cost per recruitment 11 . why dashboards?...
TRANSCRIPT

Performance Management and KPIs

Outline
• Business Performance Management (BPM)
• Dashboards • SSAS: KPI and Dashboards
2

Business Performance Management (BPM)
3

Business Performance Management (BPM) • BPM encompasses a closed-loop set of
processes that link strategy to execution in order to optimize business performance, which is achieved by: – Setting goals and objectives – Establishing initiatives and plans to achieve
those goals – Monitoring actual performance against the
goals and objectives – Taking corrective action
4

Business Performance Management (BPM) • A set of management and analytic
processes, supported by technology, that enable businesses to define strategic goals and then measure and manage performance against those goals
• BPM processes include monitoring of key performance indicators linked to strategy
• BPM is part of the daily work of managers
5

Key Performance Indicators (KPIs) • Some of the areas from which top management
analysis may gain knowledge by using BPM may include: – customer-related numbers:
• new customers acquired • status of existing customers • attrition of customers
– turnover generated by segments of the customers - possibly using demographic filters
6

Key Performance Indicators (KPIs)
– outstanding balances held by segments of customers and terms of payment - possibly using demographic filters
– collection of bad debts within customer relationships
– demographic analysis of individuals (potential customers) applying to become customers, and the levels of approval, rejections and pending numbers
7

Key Performance Indicators (KPIs)
– profitability of customers by demographic segments and segmentation of customers by profitability
– campaign management – real-time dashboard on key operational
metrics. • Overall equipment effectiveness
8

BPM Applications
• BPM applications: 1. Budgeting, planning, and forecasting 2. Profitability modeling and optimization 3. Scorecard applications 4. Financial consolidation 5. Financial reporting
9

BI support for BPM
• BI tools commonly used for business performance management include: – OLAP (online analytical processing),
sometimes simply called "analytics" (based on dimensional analysis
– scorecarding, dashboarding and data visualization
10

Dashboards • Dashboards provide at-a-glance views of
KPIs relevant to a particular objective or business process
– sales, marketing, human resources, or production
• Dashboards give signs about a business letting you know something is wrong or something is right
• Example – manufacturing dashboard shows KPIs related
to productivity, such as • number of parts manufactured, or • number of failed quality inspections per hour.
– human resources dashboard shows KPIs related to
• staff recruitment, • retention and composition (number of open
positions), or • average days or cost per recruitment
11

Why Dashboards? • BI users consume large amounts of
information in a simple, graphical view • Enables management to monitor KPI
company-wide • Critical for driving executive support
12

Why Dashboards? • Dashboards versus
scorecards – Dashboards Visual display used to
monitor operational performance
– Scorecards Visual display used to chart
progress against strategic and tactical goals and targets
13

Dashboards Increase Adoption
14

Barriers to BI Adoption
Based on 675 respondents, Wayne Eckerson, “Pervasive BI: Techniques and Technologies for Deploying BI on an Enterprise Scale,” TDWI Research, 2008.
15

Two Types of BI Users Power Users (20%) Create lots of reports Create complex reports Create dynamic reports
Casual Users (80%) Can’t find the right report No single version of truth Slow response times Too complex to use
16

Dashboard design practices • “The fundamental challenge of dashboard design is to display all
the required information on a single screen, clearly and without distraction, in a manner that can be assimilated quickly" (Few, 2005)
• What to look for in a dashboard – Use of visual components (e.g., charts, performance bars,
sparklines, gauges, meters, stoplights) to highlight, at a glance, the data and exceptions that require action.
– Transparent to the user, meaning that they require minimal training and are extremely easy to use
– Combine data from a variety of systems into a single, summarized, unified view of the business
17

Dashboard design practices • Key elements to a good dashboard:
1. Simple, communicates easily 2. Minimum distractions…it could cause
confusion 3. Supports organize business with
meaningful and useful data 4. Applies human visual perception to visual
presentation of information 5. Comforting to the eye
18

• Based on custom reports • 20 elements per dashboard • Click to drill into underlying
report • Can be refreshed anytime • Data has to be there:
– Reports only as good as the data they are based on
Dashboard design practices
19

1. Chart – Pie, Line, Vertical or Horizontal ex. Stacked or Side by Side
2. Table – Sort by label or value with max values
displayed ex. Leaderboard/Top Reps
3. Metric – Stackable with colors ex. Compare multiple reports
4. Gauge – Custom breakpoints and colors ex. Quota or Goal attainment
Dashboard components
20
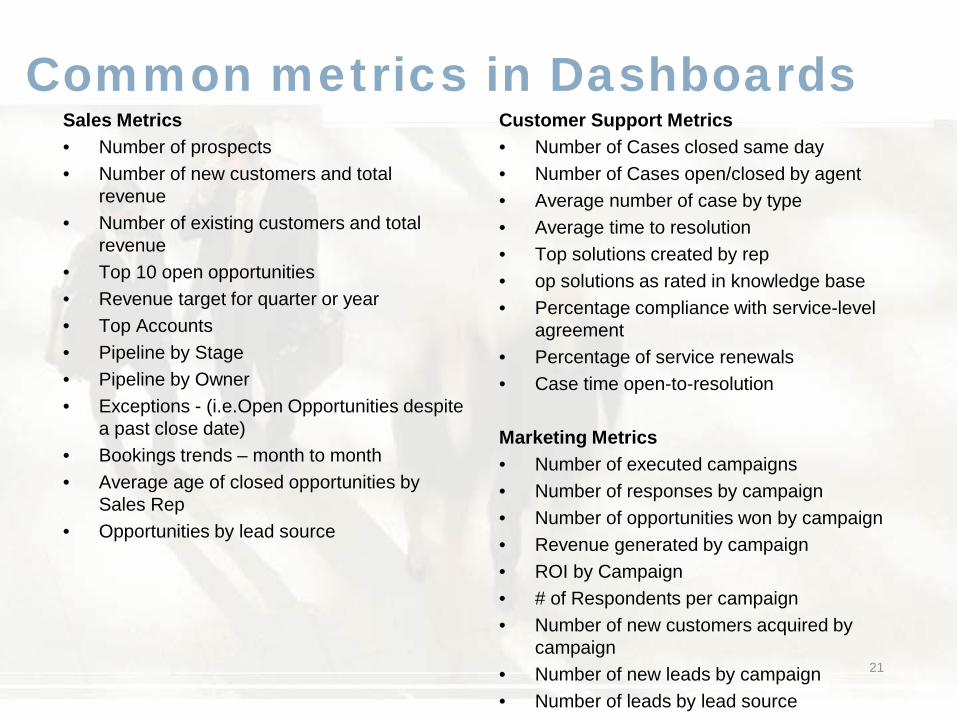
Sales Metrics • Number of prospects • Number of new customers and total
revenue • Number of existing customers and total
revenue • Top 10 open opportunities • Revenue target for quarter or year • Top Accounts • Pipeline by Stage • Pipeline by Owner • Exceptions - (i.e.Open Opportunities despite
a past close date) • Bookings trends – month to month • Average age of closed opportunities by
Sales Rep • Opportunities by lead source
Customer Support Metrics • Number of Cases closed same day • Number of Cases open/closed by agent • Average number of case by type • Average time to resolution • Top solutions created by rep • op solutions as rated in knowledge base • Percentage compliance with service-level
agreement • Percentage of service renewals • Case time open-to-resolution Marketing Metrics • Number of executed campaigns • Number of responses by campaign • Number of opportunities won by campaign • Revenue generated by campaign • ROI by Campaign • # of Respondents per campaign • Number of new customers acquired by
campaign • Number of new leads by campaign • Number of leads by lead source
Common metrics in Dashboards
21

KPI in SSAS • SSAS allows for the creation of KPIs on its cubes
– KPI is a collection of calculations that are associated with a measure group in a cube that are used to evaluate business success.
– Calculations are a combination of MDX expressions or calculated members
• Basic information about KPI includes: – the name and description of the KPI – The goal is an MDX expression that evaluates to a number – The actual value is an MDX expression that evaluates to a number – The status and trend value are MDX expressions that evaluate to a number
• KPI uses graphic displays to display status and trend, e.g., Traffic light • KPI defines 4 expressions for performance metrics
– Actual Value (-1 to 1) – Goal Value – Status (-1 to 1) – Trend (-1 to 1)
22

KPI Terms used in SSAS • Value
– The value is an MDX expression used to return the actual value of the KPI
• Goal – The goal is an MDX expression used to specify the target value of the
KPI. • Status
– Ideal values for the status would be a max of 1 (good) to a minimum of -1 (bad), while 0 indicates neutral status
• Status Indicator – The status indicator is a visual element which is used to present the
status of the KPI. Eg gauges, traffic lights or smileys. • Trend
– The trend is an MDX expression that evaluates the value of a KPI across time. It can be expressed using any time based criteria. Using this, the business user will be able to determine how the KPI's value has progressed over time.
• Trend Indicator – The trend indicator is a visual element which is used to present the
trend of the KPI. 23

24

Rebuild and from the toolbar of the KPIs tab click “Browser View”. In the Filter pane, select ”Store” in the Dimension list, select ”State Country” in the Hierarchy list. select Equal in the Operator list, and then select ”USA” (or any of the rest countries) in the Filter Expression list
25