performance management and local government …
TRANSCRIPT
Performance Management and Local Government Administration in Ghana: The
Case of the District Development Facility and the Functional Organisational
Assessment Tool
A Thesis Submitted to the University of Manchester for the Degree of Doctor of
Philosophy in the Faculty of Humanities
2014
Hamza Bukari Zakaria
Institute for Development Policy and Management (IDPM)
School of Environment, Education and Development
1
Table of Contents
List of Tables.............................................................................................................................. 8
List of Figures ............................................................................................................................ 9
List of Acronyms and Abbreviations ....................................................................................... 10
Abstract .................................................................................................................................... 12
Declaration ............................................................................................................................... 13
Copyright Statement ................................................................................................................ 13
Acknowledgement.................................................................................................................... 14
Dedication ................................................................................................................................ 15
Chapter 1: General introduction and research background ...................................................... 16
1.1 Introduction ........................................................................................................................ 16
1.2 Statement of the problem ................................................................................................... 17
1.3 Aim of research .................................................................................................................. 19
1.4 Objectives and research questions ..................................................................................... 19
1.5 Significance of the study .................................................................................................... 20
1.6 Structure of the thesis ......................................................................................................... 21
1.7 Conclusion ......................................................................................................................... 23
Chapter 2: Context of local government administration in Ghana .......................................... 24
2.1 Introduction ........................................................................................................................ 24
2.2 An overview of the Ghanaian context ................................................................................ 24
2.2.1 National demographic characteristics ............................................................................. 25
2.2.2 The economy of Ghana ................................................................................................... 26
2.3 The evolution of local government administration in Ghana............................................. 27

2
2.3.1 Current local government system in Ghana .................................................................... 28
2.3.2 Constitutional foundations of local government administration in Ghana ..................... 30
2.4 Structure of local government administration .................................................................... 31
2.4.1 The ministry of local government and rural development .............................................. 31
2.4.2 Regional coordinating councils (RCCs) ......................................................................... 32
2.5 Tiers of local government authorities ................................................................................ 33
2.5.1 Functions and composition of local government authorities .......................................... 35
2.5.2 The general assembly ...................................................................................................... 36
2.5.3 Committees of local governments ................................................................................... 36
2.5.4 Public relations and complaints committee..................................................................... 37
2.5.5 The executive committee ................................................................................................ 38
2.5.6 Decentralised departments of local governments in Ghana ............................................ 38
2.6 Study areas in context ........................................................................................................ 40
2.6.1 ‘A’ Metropolis ................................................................................................................. 42
2.6.1.1 Basic education in the ‘A’ metropolis .......................................................................... 43
2.6.1.2 Health, water and sanitation in the ‘A’ metropolis ...................................................... 43
2.6.2 ‘B’ Municipality .............................................................................................................. 44
2.6.2.1 Basic education in the ‘B’ municipality ....................................................................... 45
2.6.2.3 Health, water and sanitation in the ‘B’ municipality ................................................... 46
2.6.3 ‘C’ District ...................................................................................................................... 48
2.6.3.1 Basic education in the ‘C’ district ................................................................................ 48
2.6.3.2 Health, water and sanitation in the ‘C’ district ............................................................ 49
2.7 Conclusion ......................................................................................................................... 50
Chapter 3: Examining performance management of local governments: A literature review . 51
3
3.1 Introduction ........................................................................................................................ 51
3.2 The antecedents and rise of performance management ..................................................... 51
3.3 What is performance in the public sector? ......................................................................... 53
3.4 Theoretical perspectives for managing local government performance ............................ 55
3.4.1 Economic perspective ..................................................................................................... 56
3.4.2 Accountability perspective .............................................................................................. 56
3.4.3 Service quality perspective ............................................................................................. 57
3.5 Levels and scope of performance ....................................................................................... 58
3.5.1 Span of performance ....................................................................................................... 59
3.5.2 Depth of performance ..................................................................................................... 61
3.5.3 Individual performance ................................................................................................... 61
3.5.4 Organisational performance ............................................................................................ 63
3.5.5 Government performance................................................................................................ 64
3.6 Shifting from performance measurement to performance management. ........................... 66
3.6.1 What is a performance management system? ................................................................. 67
3.6.2 Best practice or best fit performance management systems?.......................................... 73
3.7 Local government administration and service delivery in sub-Sahara Africa ................... 75
3.7.1 Determinants of local government performance ............................................................. 77
3.8 Performance management and service delivery: A public service motivation
perspective................................................................................................................................ 78
3.9 Exploring the failure of performance management systems .............................................. 79
3.10 Conclusion ....................................................................................................................... 81
Chapter 4: Research framework ............................................................................................... 82
4.1 Introduction ........................................................................................................................ 82

4
4.2 First research objective and corresponding research questions ......................................... 82
4.3 Second research objective and corresponding research question ...................................... 83
4.4 Third research objective and corresponding research questions ........................................ 87
4.5 Conclusion ......................................................................................................................... 90
Chapter 5: Research design and methodology ......................................................................... 91
5.1 Introduction ........................................................................................................................ 91
5.2 Justifying the choice of qualitative approach ..................................................................... 91
5.3 Philosophical orientation of the study ................................................................................ 92
5.4 Research design .................................................................................................................. 95
5.4.1 Case study research strategy ........................................................................................... 96
5.4.2 Unit of analysis, selection of cases and sampling procedure .......................................... 97
5.5 Data collection ................................................................................................................... 98
5.5.1 Pilot study ....................................................................................................................... 99
5.5.2 Interview schedule ........................................................................................................ 100
5.5.3 Interviews ...................................................................................................................... 101
5.5.4 Expert interviews .......................................................................................................... 102
5.5.5 The interview process ................................................................................................... 102
5.5.6 Focus group discussions ................................................................................................ 105
5.5.7 Observation ................................................................................................................... 106
5.5.8 Secondary data .............................................................................................................. 107
5.5.9 Document analysis ........................................................................................................ 107
5.6 Data analysis and interpretation ....................................................................................... 108
5.6.1 Post field work data cleaning and transcription ............................................................ 109
5.6.2 Coding and categorization of themes ............................................................................ 110

5
5.6.3 Thematic analysis of transcripts .................................................................................... 112
5.7 Ethical considerations ...................................................................................................... 115
5.8 Conclusion ....................................................................................................................... 117
Chapter 6: Analysis and discussion of local government performance management
practices.................................................................................................................................. 119
6.1 Introduction ...................................................................................................................... 119
6.2 Understanding the mission of local government authorities and bureaucrat’s perception
of performance ....................................................................................................................... 120
6.3 Operationalising performance of local governments ....................................................... 122
6.3.1 Formulation of performance indicators: Whose responsibility? ................................... 123
6.3.2 Intersections between national development policy and local government
performance............................................................................................................................ 124
6.3.3 Medium term development plans at sub-national level ................................................ 125
6.4 Development priorities of local governments under the GSGDA: Whose priorities? ..... 130
6.5 Internal measures for managing local government performance ..................................... 139
6.6 External measures for managing local government performance .................................... 141
6.6.1 Local government authorities and regional coordinating councils interface ................ 142
6.6.2 Local government authorities and the district assembly common fund interface ......... 144
6.6.3 Local government authorities and the ministry of local government interface ............ 146
6.7 Challenges with the implementation of plans and its implications for managing local
government performance ....................................................................................................... 148
6.8 Conclusion ....................................................................................................................... 150
Chapter 7: Exploring the scope of performance–enhancing policy: The case of the District
Development Facility-Functional Organisational Assessment Tool...................................... 153
7.1 Introduction ...................................................................................................................... 153
6
7.2 An overview of the district development facility and the functional organisational
assessment tool ....................................................................................................................... 153
7.3 Performance measures and performance-based grants ............................................... 160
7.4 Formulation of performance indicators under the DDF-FOAT, stakeholder expectation
and perceptions....................................................................................................................... 165
7.5 Analysis of DDF FOAT in managing local government performance in Ghana: A
balance score card approach................................................................................................... 167
7.5.1 Financial performance ................................................................................................... 170
7.5.2 Internal process perspective .......................................................................................... 179
7.5.3 Citizens perspective ...................................................................................................... 184
7.5.4 Learning and innovation ............................................................................................... 188
7.6 Limitations of the FOAT for managing local government performance in Ghana.......... 192
7.7 Conclusion ....................................................................................................................... 193
Chapter 8: Impact of performance information and performance management practices on
social service delivery ............................................................................................................ 198
8.1 Introduction ...................................................................................................................... 198
8.2 Developing a performance culture ................................................................................... 199
8.3 Generation of performance information........................................................................... 201
8.4 Examining the use of performance information for service delivery .............................. 203
8.4.1 Basic education ............................................................................................................. 210
8.4.2 Sanitation and waste management ................................................................................ 212
8.5 Citizens perspectives of local government performance ................................................. 215
8.5.1 Perceived quantity and quality of local government services ....................................... 216
8.5.2 Responsiveness to citizens’ demands............................................................................ 218
8.6 Understanding what drives the use of performance information ..................................... 220
7
8.6.1 Perceived importance of performance information....................................................... 222
8.6.2 Commitment to central government’s priorities ........................................................... 223
8.6.3 Adherence to project specific regulations ..................................................................... 224
8.6.4 Public service motivation .............................................................................................. 225
8.7 Conclusion ....................................................................................................................... 226
Chapter 9: Summary of findings and conclusion ................................................................... 229
9.1 Introduction ...................................................................................................................... 229
9.2 General overview of the study ......................................................................................... 230
9.3 Summary of major findings ............................................................................................. 232
9.3.1 Findings on mechanisms for managing local government performance ...................... 232
9.3.2 Findings on the scope of performance indicators under the district development
facility and the functional organisational assessment tool ..................................................... 234
9.3.3 Findings on performance management practices, use of performance information and
basic service delivery ............................................................................................................. 236
9.4 Contribution to knowledge and research conclusions ...................................................... 240
9.5 Theoretical implications ................................................................................................... 241
9.6 Implications for policy and practice ................................................................................. 242
9.7 Research limitations ......................................................................................................... 243
9.8 Final remarks and suggestions for future research ........................................................... 244
References .............................................................................................................................. 246
List of appendices .................................................................................................................. 259
8
List of Tables
Chapter 2
Table 2. 1: Major income and revenue indicators for the period 2000-2013 ........................... 26
Table 2. 2: Distribution of local government authorities by population .................................. 30
Table 2. 3: Departments of local government authorities ........................................................ 39
Table 2. 4: Performance of schools in BECE examination (2006-2009) ................................. 43
Table 2. 5: Basic school enrolment in the ‘B’ municipality .................................................... 45
Table 2. 6: Health facilities ...................................................................................................... 46
Table 2. 7: Distribution of exam performance by sex .............................................................. 49
Chapter 3
Table 3. 1: Rationale for measuring performance .................................................................... 69
Table 3. 2: Reasons for performance measurement failure ...................................................... 80
Chapter 5
Table 5. 1: Prerequisites for conducting qualitative interviews ............................................. 103
Table 5. 2: Distribution of interviewees ................................................................................. 105
Table 5. 3: The coding process .............................................................................................. 112
Table 5. 4: Ethical factors and accompanying questions ....................................................... 116
Chapter 6
Table 6. 1: Aligning development challenges to the national development policy (GSGDA:
2009-2013) ...................................................................................................................... 132
Table 6. 2: Development priorities of local governments under the GSGDA (2009-2013) .. 135
Chapter 7 Table 7. 1: Minimum conditions and indicators under the FOAT ......................................... 156
Table 7. 2: Annual distribution of minimum conditions (2008-2013) ................................... 158
Table 7. 3: Distribution of local governments’ fulfilment of MCs by region ........................ 159
Table 7. 4: Performance measures under the DDF ................................................................ 161
Table 7. 5: Distribution of performance measures (2008-2013) ............................................ 161
Table 7. 6: Common measures for dealing with financial performance of LGs .................... 172
Table 7. 7: Internally generated funds of selected local government authorities from 2006
to 2009 in cedis (¢) ......................................................................................................... 175
Table 7. 8: Measures to improve internal processes .............................................................. 182
Table 7. 9: Measures to improve upon citizen perspective of LG performance .................... 186
Table 7. 10: LG strategies to improve learning and innovation ............................................. 190
Table 7. 11: Proposed features and functions of the FOAT ................................................... 196
Chapter 8
Table 8. 1: Distribution of projects by district ....................................................................... 208
Table 8. 2: Education spending and related projects (2005-2012)......................................... 212
Table 8. 3: Sanitation spending and related projects (2005-2012)......................................... 215
Table 8. 4: Perceived benefits and use of performance information...................................... 221
Chapter 9
Table 9. 1: Summary of key research findings ...................................................................... 237
9
List of Figures
Chapter 2
Figure 2. 1: Regional distribution of population in Ghana ...................................................... 25
Figure 2. 2: Structures for local government administration in an inter-governmental
framework ......................................................................................................................... 34
Figure 2. 3: Committees of LGs and their sub-committees ..................................................... 37
Figure 2. 4: Map of Ghana showing the study regions ............................................................ 41
Chapter 3 Figure 3. 1: An integrated performance management model for public organisations ............ 71
Figure 3. 2: Elements of a performance management process ................................................. 73
Chapter 4
Figure 4. 1: The balance scorecard .......................................................................................... 85
Figure 4. 2: Research framework ............................................................................................. 89
Chapter 5 Figure 5. 1: Sources of data ..................................................................................................... 99
Chapter 6
Figure 6. 1: Cycle of local government planning process ...................................................... 128
Figure 6. 2: Internal and external revenues of LGs ................................................................ 145
Chapter 7
Figure 7. 1: Minimum conditions fulfilled by LG (2008-2013) ............................................ 158
Figure 7. 2: The balance scorecard approach ......................................................................... 169
Figure 7. 3: Targets of internally generated funds achieved between 2006 and 2006 ........... 176
List of Boxes
Chapter 5
Box 5. 1: List of hints from interview transcripts .................................................................. 114
Chapter 6
Box 6. 1: Stakeholders at the local government level ............................................................ 127
Chapter 7
Box 7. 1: Formula for disbursing funds under the DDF ........................................................ 154
List of Appendices
Appendix 1: Participant information sheet and informed consent ......................................... 259
Appendix 2: Schedule for focus group discussions ............................................................... 264
10
Appendix 3: Details of minimum conditions and performance measures under the DDF-
FOAT .............................................................................................................................. 267
Appendix 4: List of conferences and workshops attended during PhD study ....................... 286
Appendix 5: Skills training workshops attended ................................................................... 288
List of Acronyms and Abbreviations
BECE Basic Education Certificate Examination
BG Basic Grant
BOT Build, Operate and Transfer
BSC Balanced Scorecard
CAPs Community Action Plans
CBG Capacity Building Grant
CBOs Community-Based Organisation
CBRDP Community Based Rural Development Programme
CG Central Government
CHPS Community Health Planning System
CLOSAG Civil and Local Government Staff Association of Ghana
CPA Comprehensive Performance Assessment
CPP Convention Peoples’ Party
DACF District Assembly Common Fund
DCDs District Coordinating Directors
DCEs District Chief Executives
DDF District Development Facility
DHMT District Health Management Team
DPCU District Planning and Coordinating Unit
EU European Union
EXECO Executive Committee
FGDs Focus Group Discussions
FOAT Functional Organisational Assessment Tool
GDP Gross Domestic Product
GES Ghana Education Service
GETFUND Ghana Education Trust Fund
GHS Ghana Health Service
GIMPA Ghana Institute of Management and Public Administration
GNFS Ghana National Fire Service
GPRA Government Performance and Results Act
GPRS I Ghana Poverty Reduction Strategy
GPRS II Growth and Poverty Reduction Strategy
GSFP Ghana School Feeding Programme
GSGDA Ghana Shared Growth and Development Agenda
GSOP Ghana Social Opportunities Programme
HIV/AIDS Human Immunodeficiency Virus/Acquired Immune Deficiency
Syndrome
HRM Human Resource Management
ICT Information Communication Technology
IGF Internally Generated Funds
ILGS Institute of Local Government Studies
IMF International Monetary Fund

11
IOO Input-output-outcome
JHS Junior High Schools
KWIC Key Words in Contexts
LESDEP Local Entrepreneurship and Skills Development Programme
LG Local Government
LGSS Local Government Service Secretariat
LI Legislative Instrument
LGWU Local Government Workers Union
MCs Minimum Conditions
MDAs Ministries, Departments and Agencies
MDGs Millennium Development Goals
MDPI Management Development and Productivity Institute
MLGRD Ministry of Local Government and Rural Development
MMDAs Metropolitan, Municipal and District Assemblies
MMDCEs Metropolitan, Municipal and District Chief Executives
MPCU Metropolitan/Municipal Planning and Coordinating Unit
MPs Members of Parliament
MTDP Medium Term Development Plan
NADMO National Disaster Management Organisation
NCCE National Commission for Civic Education
NDPC National Development Planning Commission
NGOs Non-Governmental Organisations
NPM New Public Management
NRCD National Redemption Council Decree
OECD Organisation for Economic Cooperation and Development
PG Performance Grant
PHC Population and Housing Census
PMs Performance Measures
PMS Performance measurement/management system
PNP Peoples’ National Convention
PRCC Public Relations and Complaints Committee
PSM Public Service Motivation
PTAs Parent Teachers Association
RCC Regional Coordinating Council
SAPs Structural Adjustment Programmes
SEND Social Enterprise Network for Development
SERVQUAL Service quality
SIF Social Investment Fund
SMART Specific, Measurable, Achievable, Realistic and Time-bound
SMC Supreme Military Council
SMCs School Management Committees
SMEs Small and Medium Enterprises
SSA Sub-Sahara Africa
SSS Senior Secondary School
UNDP United Nations Development Programme
USD United States Dollar
WB World Bank
12
Hamza Bukari Zakaria, August, 2014
The University of Manchester, Doctor of Philosophy (PhD)
Performance Management and Local Government Administration in Ghana: The
Case of the District Development Facility and the Functional Organisational
Assessment Tool
Abstract
For the past two decades, interest in the performance of local governments has become
high in public management. The wave of performance consciousness has thus far diffused
from developed countries to developing countries where decreasing public confidence and
trust in government has made the implementation of performance management policies a
way of improving public perception of government performance. Meanwhile, the
implementation of such policies is often based on untested assumptions some of which
constitute gaps in the literature. For instance, it is understood that performance
management systems enable public organisations that provide services to satisfy citizens’
demand for services. It is also assumed that mechanisms for managing organisational
performance recognise and address the interests of multiple stakeholders in an
organisational environment and that once performance management systems generate
performance information, decision makers are likely to use that information to advance the
goals of their organisations. This study explores these assertions by investigating
performance management practices of local government authorities in Ghana. It sets out to
understand how local governments manage organisational performance and what shapes
their performance. It also examines the scope of a performance enhancing policy to
determine whether it addresses multiple perspectives of organisational performance and the
extent to which local government managers use performance information to improve
service delivery. The study adopts a qualitative research approach by using data from
interviews, focus group discussions, observations and documents to construct and interpret
research findings.
This research identified internal and external mechanisms for managing local government
performance and found that central-local government relations allows the former to
influence the latter’s priorities by imposing on them, the national development policy, in
ways that define development planning, performance reporting and local government
controls. Following Kaplan and Norton (1992), a Balanced Score Card framework was
used to examine the scope of performance indicators used to assess the performance of
local governments under the District Development Facility. The findings reveal that
performance indicators tend to be skewed towards financial and internal organisational
aspects of performance rather than incorporating citizens’ views about local government
performance or promoting organisational learning, innovation and accountability. The
findings offer insights for re-examining multiple principal-agent relationships at the local
government level where the assessment of local government performance excludes the
opinions of local residents and affects local governments’ accountability to citizens.
Although developing a culture of performance emerged as a key factor for improving local
government performance, the findings revealed that the use of performance information by
local government managers to make decisions on service delivery depends on the
importance of performance information, their commitment to central government’s
priorities, reporting requirements of externally funded projects and public service
motivation. This study concludes that the utilisation of performance information to
improve service delivery is necessary but not sufficient without adopting an all-inclusive,
citizen-centred approach woven into the formulation, implementation and evaluation of
performance management systems in a developing country context.
13
Declaration
I, Hamza Bukari Zakaria, declare that no portion of the work referred to in this thesis has
been submitted in support of an application for another degree or qualification for another
degree or qualification of this or any other university or other institute of learning
Copyright Statement
I. The author of this thesis (including any appendices and/or schedules to this thesis)
owns certain copyright or related rights in it (the “Copyright”) and s/he has given
The University of Manchester certain rights to use such Copyright, including for
administrative purposes.
II. Copies of this thesis, either in full or in extracts and whether in hard or electronic
copy, may be made only in accordance with the Copyright, Designs and Patents
Act 1988 (as amended) and regulations issued under it or, where appropriate, in
accordance with licensing agreements which the University has from time to time.
This page must form part of any such copies made.
III. III. The ownership of certain Copyright, patents, designs, trademarks and other
intellectual property (the “Intellectual Property”) and any reproductions of
copyright works in the thesis, for example graphs and tables (“Reproductions”),
which may be described in this thesis, may not be owned by the author and may be
owned by third parties. Such Intellectual Property and Reproductions cannot and
must not be made available for use without the prior written permission of the
owner(s) of the relevant Intellectual Property and/or Reproductions.
IV. Further information on the conditions under which disclosure, publication and
commercialisation of this thesis, the Copyright and any Intellectual Property and/or
Reproductions described in it may take place is available in the University IP
Policy (see http://documents.manchester.ac.uk/DocuInfo.aspx?DocID=487) in any
relevant Thesis restriction declarations deposited in the University Library, The
University Library’s regulations (see
http://www.manchester.ac.uk/library/aboutus/regulations) and in The University’s
policy on Presentation of Theses.

14
Acknowledgement
I am profoundly grateful to my supervisors, Dr. Aminu Mamman and Dr. Chris Rees,
Joint-Directors for the Centre for Organisations in Development at the Institute for
Development Policy and Management for their guidance, patience, helpful insights and
constructive comments without which this study would be incomplete. To my entire
supervisory team and academic staff at the Institute, I wish to express my heartfelt
gratitude for supporting me in diverse ways throughout my PhD.
Special appreciation also goes to the Ghana Education Trust Fund for sponsoring my
studies. I am particularly indebted to Prof. Kwamena Ahwoi for his friendship and
immense support to my academic progress. To Prof. Seidu Alhassan, Director of the
Institute for Continuing Education and Interdisciplinary Research, University for
Development Studies in Ghana, I am extremely grateful for his assistance before and
during my PhD studies especially when I was in Ghana to collect data for my research.
I very much appreciate the invaluable support and cooperation of the Directors at the
Ministry of Local Government and Rural Development and the Local Government Service
Secretariat, the Chief Executives, Coordinating Directors and Heads of Departments in all
the local government authorities that I collected data from. I also thank the assembly
members, school teachers, unit committee members and all those who participated in this
study.
To my colleagues at IDPM, I sincerely thank Lawrence Ado-Kofie, Husrev Habak, Ameen
Alharbi, Omar Alshehhi, Shaoheng Li and Foteini Kravariti for their friendship. I also
express my sincere gratitude to my housemates at 42 Colliery Street whose warmth,
support and encouragement helped me to persevere even in adversity. To Dr. Divine
Banyubala, Lamisi Mbilah, Ishmeal Ayanoore and former housemates, Dr. Justice Bawole
and Dr. Francis Sanyare, may God richly bless you all for your brotherliness, care and
support. My special thanks go to Dr. Abdul-Razak Alhassan and Dr. Abdul-Gafaru
Abdulai for all the encouragement.
Finally, words can hardly describe my appreciation to my wife, Nihad Abubakar, for her
patience, understanding and endearing support without which my PhD experience could
have lost its sparkle. For all the personal sacrifices she had to make for the sake of my
studies, I am deeply and truly thankful.

15
Dedication
I dedicate this thesis to my parents, Hajia Memunatu Zakaria and the late Mr Bukari
Zakaria of blessed memory, for reasons words cannot describe.
16
Chapter 1: General introduction and research background
1.1 Introduction
The state of public sector performance in general, and local government administration in
particular, has been a subject of concern for politicians, policy makers, academics and
public management practitioners for many decades (Crook and Manor 1998). This concern
is reinforced by persistent pressure on local governments to effectively provide services to
citizens; a condition which often leads them to devise strategies for improving their
performance (Sanger 2008;Demirkaya 2006). Meanwhile, measures that seek to improve
local government performance cannot be taken for granted because their effectiveness
depends on several factors, the most important of which is whether or not measures for
improving performance satisfy the needs of all relevant stakeholders in a local government
context. This makes it important to know the circumstances under which a performance
management system (henceforth PMS) for a local government authority will be successful.
Some experts have argued that performance management practices should generate and use
quantitative and qualitative performance information that is capable of changing the
attitude of public managers, elected officials and bureaucrats in serving the public
(Bouckaert and Dooren 2002). However, this objective will be difficult to attain unless
performance indicators are capable of producing vital information needed to achieve
organisational goals. Yet, it is argued that the best ways of producing and using
performance information in many organisational contexts is not known (Behn 1995).
In a local government (henceforth LG) environment, managing performance is expected to
promote transparency as it provides the mechanism for measuring and reporting important
aspects of what local governments seek to deliver (Halachmi 2002). It is argued that
performance management systems have the potential to improve accountability and
maximise the benefits of citizens’ engagement with local governments (Sanger 2008). In
the same vein, the process of performance management (henceforth PM) may reveal
obstacles that affect service delivery, thereby opening up discussions for redress. In
developed countries, research has shown that performance information of local
government and their service delivery record is sometimes used to restore trust between
citizens and their elected representatives (Yang and Holzer 2006) but in most developing
countries, performance information of local governments is rarely available to the general
17
public and whether or not, local government officials use performance information to make
managerial decisions on service delivery is inconclusive (Ayee 1996;Therkildsen 2000).
Meanwhile, some experts have suggested that a number of conditions need to be met in
order for LGs to fulfil increasing demand for better services (Tangen 2005). For instance, it
is argued that an environment of change must be created and supported by a performance
culture that emphasises the achievement of LG goals, outputs and outcomes. It is therefore
crucial to ensure that indicators for shaping local level development are both measurable
and aligned to local council priorities, including those of their constituents (Resnick 2009).
Since performance information allows managers of local authorities and key stakeholders
to assess the effectiveness of internal operations and service improvement over time, one
would expect resource allocation and investment plans to be more effective and result
oriented (Behn 2003). This is why it is important for researchers and policy makers to
understand whether performance indicators capture key aspects of organisational
performance and whether they are capable of addressing the interests of all relevant
stakeholders. In addition to this, this research takes a step further to explore one of the ‘big
questions’ for performance management by seeking to understand why LG managers use
performance information (Moynihan and Pandey 2010). This is crucial because most of the
literature on performance management at the local government level draws on European
and American experiences where local councils are quite autonomous compared to their
counterparts in developing countries where they operate as extensions of central
government in ways that curtail their independence. It is within this context that this
research examines the content, consequences and outcomes of local government
performance management practices in Ghana.
1.2 Statement of the problem
In Ghana, the advent of structural adjustment in the 1980s was accompanied by political
and administrative reforms that promoted decentralisation of power and authority from
central government to local government authorities. The military government of the
Provisional National Defence Council (PNDC) at the time was convinced that
decentralised local governance would be a viable strategy to improve its response to public
demands, promote service delivery and empower citizens to participate in decision making
processes (World Bank 1989;Oquaye 1995). This is why from the outset, Ghana’s
decentralization policy sought to: (a) promote popular participation in decision making

18
processes; (b) promote responsive government at the local level; and (c) enhance efficiency
and effectiveness of the entire government machinery by restructuring institutions [that
are] responsible for service delivery for them to get closer and accountable to citizens
(Ayee 2008: 234). Today, local governments are not only expected to deepen participatory
democracy, they are also required to reduce poverty and coordinate local economic
development in their areas of jurisdiction (Asante and Ayee 2008).
Yet, research evidence suggests that local government authorities in Ghana struggle to
perform their core mandatory functions in terms of providing health and education
infrastructure, potable water, sanitation, public transport and access roads (Awortwi and
Helmsing 2007;Crook and Manor 1998). It has been observed that although
decentralisation and local governance has achieved some success in political terms through
the election of councillors, this very success paradoxically produces deep frustrations at the
institutional level as it reflects in only marginal improvements in local level development
(Crook 1994). Not even the introduction of citizens and service charters for local
governments has been able to accelerate social service provision (World Bank 2000).
According to Ayee (1997) the lack of tangible development results undermine the
objective of creating a more legitimate and responsive form of government at the local
level. There are claims that local governments have not made any significant difference in
people’s lives due to their marginal performance which is often attributed to the absence of
political direction and leadership of the bureaucracy, centralized nature of government and
administration, lack of financial resources, poor calibre of personnel, the failure of local
government authorities to maximize the revenue resources available to them, poor and
erratic commitment to development and services as demonstrated by misplaced priorities
and widespread corruption (Ayee 1994; Ayee 1995; Crook 1994).
Based on these issues, interest in the performance of local government authorities has
become a priority for ordinary citizens and civil society organisations, local politicians and
the central government in Ghana. Consequently, some measures have been put in place to
assess how local governments perform their statutory functions to facilitate local level
development. Yet, very little, if any academic research has been conducted to understand
the nature of these practices and the scope of performance indicators used to manage local
government performance in Ghana. In addition, performance management practices are
expected to periodically generate performance information but it is unknown whether LG
managers use the resultant performance information in making decisions on social service
19
delivery (Halachmi, 2008). This is a gap this thesis intends to fill. Since the researcher is
motivated by calls for in-depth research on the implementation of performance
management practices in a variety of contexts (de Lancer Julnes and Holzer 2001;Wholey
1999) this study intends to contribute a developing country’s perspective on the subject to
the public administration and public management literature.
1.3 Aim of research
The study aims at examining performance management practices of local governments in
Ghana by drawing on the knowledge of local government officials and community groups
to understand the nature of existing performance management processes, the scope of
performance indicators, and the use of performance information to enhance service
delivery.
1.4 Objectives and research questions
Based on the research aim outlined above, the study intends to achieve the following
objectives.
1. Identify and explore the nature and role of performance management practices of
local governments in Ghana to understand what influence organisational
performance;
2. Analyse the District Development Facility; a recent performance enhancing policy
initiative, to appreciate the extent to which performance indicators under the
performance management framework cover multiple dimensions of local
government performance as well constituents at the local level; and
3. Examine the impact of local government managers’ utilisation of performance
information on social service delivery to understand factors that affect performance
information use.
In order to achieve these objectives, the following research questions will guide the
inquiry:

20
1. How do local government authorities evaluate and manage organisational
performance in Ghana?
2. What core issues within the national policy space influence the management of
local government performance?
3. In which way does performance enhancing policy address multiple perspectives of
local government performance?
4. To what extent will local government managers use performance management
practices to improve service delivery? and
5. What drives the use of performance information within local government
authorities in Ghana?
Answers to these questions are significant because they should offer an interpretation of
performance that goes beyond resource economy, efficiency and financial interpretations
of organisational effectiveness. Also, this interpretation should broaden the understanding
of official and non-official LG performance by incorporating citizens’ perceptions of LG
performance in their capacity as legitimate beneficiaries of LG services.
1.5 Significance of the study
This research sought to contribute to existing literature by exploring performance
management in a local government context. Even though a lot of studies have covered
various aspects of decentralisation and local governance in the ‘global south’ (Awortwi
2011; Conyers 2007; Robinson 2007; Crawford 2004; Crook and Manor 1998), very few
studies have examined the implementation of performance management systems within
local government authorities in sub-Sahara Africa in general and Ghana in particular. In
developing and transitional economies, mechanisms for managing organisational
performance have become imperative because public sector organisations tend to perform
below expectations due to administrative problems caused by poor leadership, inefficiency,
corruption and weak accountability systems (Therkildsen 2006). Also when strategies are
implemented to improve organisational performance, details about the types of
performance indicators, the relevance of those indicators and the use of performance
21
information are often taken for granted (Boyne 2002). This study contributes to knowledge
by exploring these issues in a local government context where multiple stakeholders often
have a wide range of expectations and interests in relation to the performance of LGs but
unfortunately may not play any direct role in managing the performance of their local
authorities. Furthermore, the research explores the use of performance information to
understand the effects of LG performance management practices on social service delivery.
The use of performance information is considered as one of the big questions in
performance management research (Moyhihan and Pandey 2010) since many studies
presume that once performance information is produced, it will be automatically used to
make managerial decisions. In sum, the findings of this research will offer lessons for local
government policy makers to reflect over practical issues that affect the impact of
performance management practices. These lessons could also be considered in future
review of performance policies for local governments in particular and for other public
sector organisations in general.
1.6 Structure of the thesis
The study is structured into nine chapters. The first chapter sets the tone of the thesis by
describing the research problem, research aim and objectives and specific research
questions the study seeks to answer. Specific objectives and questions are stated to explore
existing mechanisms for managing local government performance in Ghana; analyse the
scope of a recent performance management policy initiative to understand the extent to
which it covers multiple dimensions of LG performance; and to understand whether or not
senior LG officials use performance information to facilitate social service delivery and
what factors may account for the utilisation of performance information in the Ghanaian
context.
Chapter two focuses on the study context which is essential because LG systems do vary
from one country to another. The chapter offers a general overview of the research
background which illuminates the national economic and demographic features of Ghana
and the evolution of local government administration dating back to the period of British
colonial administration. It further explains the legal and constitutional basis of local
government administration in Ghana. Details of the research setting are also presented to
put the study into context.
22
The third chapter is divided into two sections and presents a review of public sector
performance literature within the domain of public administration and public management.
It explores the concept of performance and discusses fundamental debates and theoretical
perspectives for studying LG performance. The chapter also examines literature on local
government administration in Sub Saharan Africa to highlight gaps that justify the
advancement and inclusion of ordinary citizens in evaluating and managing LG
performance. It also draws attention to research gaps in examining the use of performance
information to deliver LG outputs and services as well as understanding fundamental
reasons for which local government managers might use information for managerial
decisions. Chapter four presents the framework that guides the research. It draws linkages
between research questions and the key aspects of the study that will provide answers to
achieve the objectives of the study. The fifth chapter explains the research methodology.
It highlights the philosophical approach of the study and explains the rationale for using a
qualitative approach and a case study research strategy. Techniques for data collection,
sources of data as well as details of how interviews were conducted in the field and
analysed is also explained in this chapter.
Chapter six presents the first data analysis and discussion of findings. It also addresses the
first and second research questions by analysing internal and external mechanisms for
managing local government performance. The chapter highlights the importance and
influence of national development policy in the formulation and implementation of local
government plans that guide LG performance. It also shows how inter-governmental
relations influence performance reporting and routine performance monitoring in ways that
affect performance management at the local government level. Chapter seven sought to
answer the third research question which specifically analyses the District Development
Facility (DDF) and Functional Organisational Assessment Tool (FOAT) – a nation-wide
performance management strategy for LGs - to understand the scope and depth of
performance indicators (Minimum Conditions and Performance Measures). Also, based on
Kaplan and Norton’s (1992) conception of the Balanced Scorecard, a framework is
developed to analyse performance indicators under the DDF-FOAT.
Chapter eight addresses the fourth and fifth research questions by presenting and
discussing findings pertaining to the utilisation of performance information for decisions
making. It primarily focuses on Chief Executives and the responses of senior LG officials
to understand whether and how performance management practices facilitate the use of
23
performance information to deliver LG outputs. Also, attempt is made to understand
factors that explain the use of performance information in a local government context. In
addition, the chapter uses findings from focus group discussions to present citizens’
perspectives to understand their opinions about the performance of local government
authorities with regard to the provision of basic education, sanitation and waste
management services.
Last but not least, chapter nine presents a summary and conclusion of major findings that
emerged from the research. It discusses emerging issues and calls for a critical re-
examination of performance management initiatives that might otherwise be touted as best-
practices. The chapter also discusses the contribution of the study and its implications for
theory, policy and practice. Limitations of the research are recounted and final remarks and
suggestions for future research presented.
1.7 Conclusion
This chapter sets the tone of the thesis by presenting a brief introduction and background
of the research. It states the research problem, research aims and objectives as well as
specific research questions the study seeks to answer. The research problem is defined in
the context of performance management of local governments in Ghana. Also, two
research gaps are identified from a review of the public administration and public
management literature in relation to the implementation of performance management at the
organisational level. The first gap relate to the assumption that a performance management
system that is perceived as conforming to best practices aligns organisational goals to the
expectations and aspiration of all stakeholders. For this reason, the study adapts the
balanced scorecard concept (Kaplan and Norton, 1992) to examine the extent to which
performance indicators for managing LG performance in Ghana cover multiple dimensions
of examining organisational performance. The second research gap pertains to the
utilisation of performance information by senior local government officials who take
decisions on local governments’ provision of services. Furthermore, the outline of this
thesis is described in this chapter to provide hints about the content of each of the nine
chapters. The next chapter explains the context of local government administration in
Ghana.
24
Chapter 2: Context of local government administration in Ghana
2.1 Introduction
This chapter presents details of the study area so that findings that will emerge from the
study to address research questions and objectives can be understood in the proper context.
Explaining the study setting is imperative because local government systems vary across
different countries. Therefore, this chapter reinforces the contextual value of the research
and also reduces the tendency of viewing the phenomenon under study as universal or
homogenous. It is important to note that in this chapter, local ‘government administration’
refers to a process involving formal institutions that are legally established to deliver a
range of specified services to relatively small geographic jurisdictions. In the Ghanaian
context, these institutions are Metropolitan, Municipal and District Assemblies and their
sub structures in which career civil servants are responsible for managing the affairs of the
Assembly. The scope of this research does not extend to all aspects of ‘local governance’
which is a term that broadly refers to the organization and coordination of collective action
at the local level through government hierarchies, private enterprises, voluntary and not-
for-profit organisations and informal associations that may have links with a local
government (Shah 2006).
This chapter attempts to put the study into perspective by tracing the political history of
Ghana and presenting the structure of the country’s economy as well as important socio
demographic features of the population. The chapter also explores the evolution of local
government administration in the Ghanaian context and clarifies the nature and structure of
local government authorities in Ghana. It concludes by presenting details of three local
government authorities that were purposively selected for the study.
2.2 An overview of the Ghanaian context
Ghana is one of 16 countries in West Africa. It covers an area of 238, 533sq km and has a
population of 24.6 million people [based on 2010 population census]. The country was a
British colony from 1874-1957 during which time it was known as the Gold Coast. The
emergence of native elites led to the formation of nationalists movements which mobilised
support for political independence. In 1957, the Gold Coast was the first European colony
in Sub-Sahara Africa to attain independence. Under the leadership of Kwame Nkrumah,
25
the Convention Peoples’ Party (CPP) formed the first native government which lasted for 9
years until it was toppled in a military coup that inspired similar uprisings in the sub region
(See Gocking 2005).
2.2.1 National demographic characteristics
The 2010 population and housing census revealed that approximately 24,658,823 people
live in Ghana. This represents a 30.4 percentage increase compared to 18,912,079 reported
in the year 2000. The current population is 51.2% female and 48.8% male. The Ashanti
region is the most populous region with about 4,780,280 people representing 19.7%
followed by the Greater Accra region with a population of 4,010,054 representing 16.3%
of the country’s population (Ghana Statistical Service 2012). Meanwhile, Accra is the most
congested city with a density of approximately 1,236 persons per square kilometre
compared to the national average of 103 persons per square kilometre. The least populated
region is the Upper West region which has a population of 702,110 representing 2.8% of
the total population.
The 2010 population and housing census shows that Ghana has a youthful population,
comprising a large proportion of children under 15 years and a small proportion of elderly
people, 65 years and older. This population structure is attributed to high fertility and
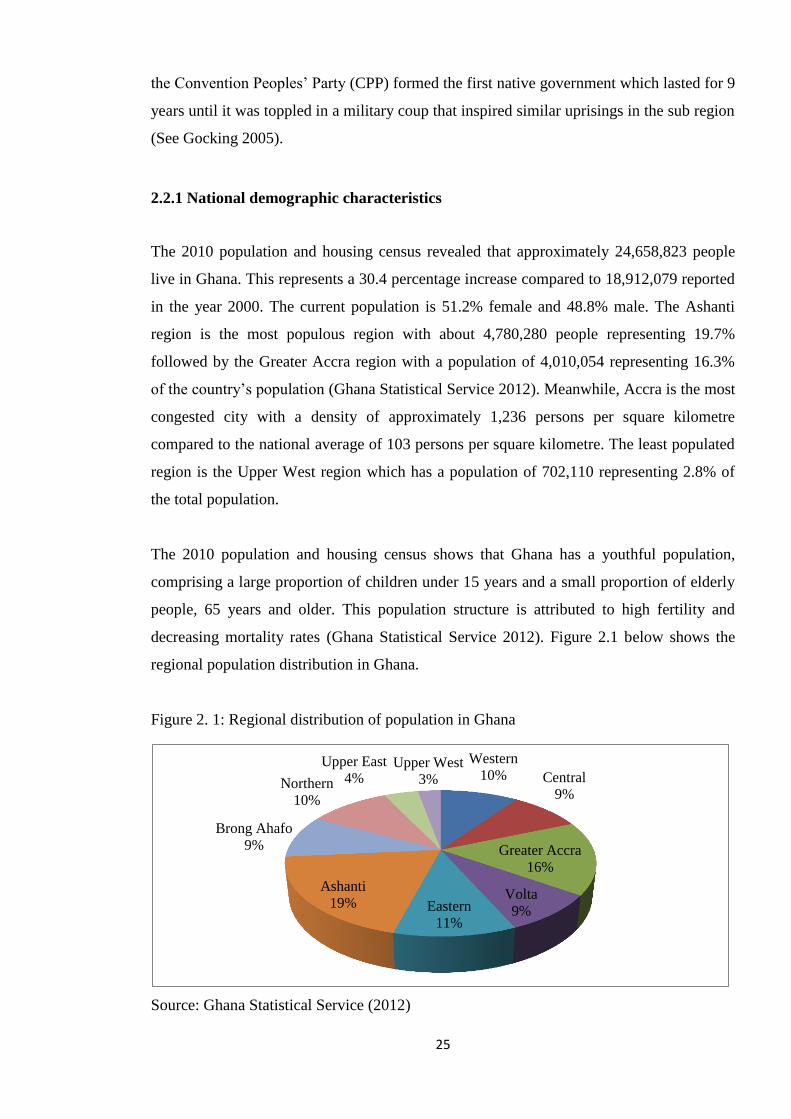
decreasing mortality rates (Ghana Statistical Service 2012). Figure 2.1 below shows the
regional population distribution in Ghana.
Figure 2. 1: Regional distribution of population in Ghana
Source: Ghana Statistical Service (2012)
Western
10% Central
9%
Greater Accra
16%
Volta
9% Eastern
11%
Ashanti
19%
Brong Ahafo
9%
Northern
10%
Upper East
4% Upper West
3%
26
2.2.2 The economy of Ghana
Ghana has the second largest economy in West Africa’s after Nigeria (Africa Development
Bank 2012). Until recently, the economy depended heavily on agriculture which employed
not less than 60 per cent of the population. The country is endowed with vast arable land
that supports food and livestock production even though agriculture is less modernised
with farmers predominantly using simple tools and equipment. Apart from subsistence
food crop production, the economy attracts foreign exchange through the export of cash
crops such as cocoa, coffee, oil palm, pineapple, shea nuts and rubber (Aryeetey and
Kanbur 2008). Ghana is also endowed with natural resources such as gold, diamond,
bauxite and timber. Recently, oil deposits in commercial quantities were found in the south
western boundary along the south Atlantic coast. Oil production in the off shore fields
which started in December 2010 is expected to significantly contribute to the economy
(Government of Ghana 2014a). However, foreign exchange obtained from export
commodities are severely declining due to low value addition.
With respect to the macro-economy, Ghana relies heavily on the International Monetary
Fund (IMF) and the World Bank to finance the national budget. This has often led to
conditions for the government to down-size the public sector by freezing employment and
public spending. Also, there is growing concern about graduate and youth unemployment
in the public sector. Meanwhile, lack of credit opportunities makes it difficult for
prospective entrepreneurs to start up small scale private businesses. Even though the Bank
of Ghana has been trying to implement prudent monetary and fiscal policies to support
commercial banks to encourage lending to large businesses and small enterprises, high
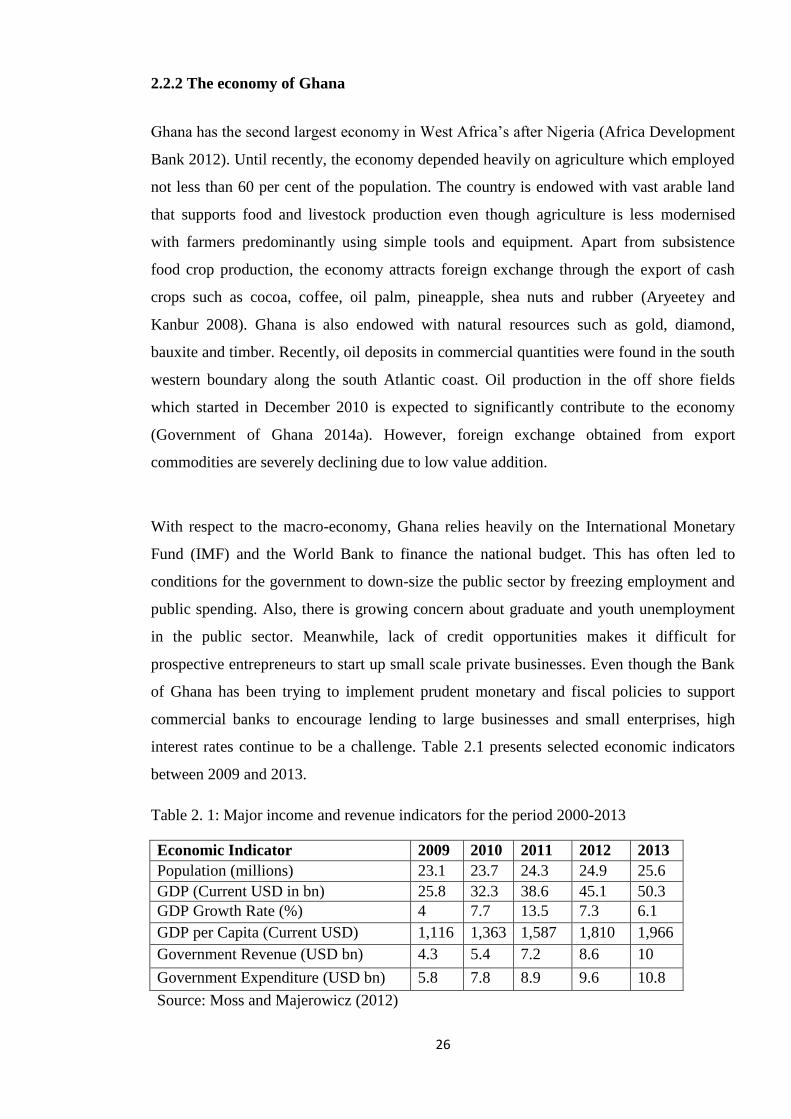
interest rates continue to be a challenge. Table 2.1 presents selected economic indicators
between 2009 and 2013.
Table 2. 1: Major income and revenue indicators for the period 2000-2013
Economic Indicator 2009 2010 2011 2012 2013
Population (millions) 23.1 23.7 24.3 24.9 25.6
GDP (Current USD in bn) 25.8 32.3 38.6 45.1 50.3
GDP Growth Rate (%) 4 7.7 13.5 7.3 6.1
GDP per Capita (Current USD) 1,116 1,363 1,587 1,810 1,966
Government Revenue (USD bn) 4.3 5.4 7.2 8.6 10
Government Expenditure (USD bn) 5.8 7.8 8.9 9.6 10.8
Source: Moss and Majerowicz (2012)
27
2.3 The evolution of local government administration in Ghana
Ghana was known as the British Gold Coast before independence in 1957. During that
period, the colonial administration operated a system of indirect rule that relied on native
authorities to uphold law and order rather than involve natives in real local government
administration (Gocking 2005). Ahwoi (2010) argues that LGs at the time were
undemocratic, corrupt and inefficient. Legislations such as the Municipal Councils
Ordinance of 1859 were enacted to support local government administration in major
coastal towns. And for the first time in the Gold Coast, native people were elected to local
councils in Accra, Cape Coast, Sekondi Takoradi and Kumasi. These councils were in
charge of public health issues, security and maintenance of peace, law and order (Ahwoi,
2010).
Immediately after Ghana attained independence in 1957, the government of the CPP
adopted a centralised system of public administration. A number of reason accounted for
this. First, Nkrumah was pro-socialist, which saw his political ideals influence the
introduction of policies that promoted the centralisation of power as opposed to
decentralisation. The CPP government did not also promote local government
administration due to fears of secession linked to Asante’s agitations for federalism. Even
when the CPP government attempted to create five regional autonomous assemblies in the
early days after independence, “local governance was generally weak and subject to the
centralisation of power that was typical of the post-colonial state in Africa” (Crawford
2004 :6).
When the CPP government was overthrown in 1966, the Siriboe, Mills Odoe and Akufo-
Addo commissions were formed to advise the government on local government
administration. Busia’s government implemented the recommendations of these
commissions by formulating a local administration act 1971 (act 357) which introduced a
de-concentrated form of local administration. It also restored traditional leaders as
members of LG councils, allowing them to take local level decisions alongside two thirds
elected membership. Regional, district and local councils were established with powers to
provide public services (Ahwoi, 2010). However, these reforms could not be sustained
after the government was overthrown in 1972. The military government of the National
Redemption Council that took over from Busia’s government amended act 357 in what
became known as the local administration (amended) decree of 1974 (NRCD 258). The

28
decree created a four tier structure comprising regional councils, district councils, area,
municipal, urban and local councils and; town/village development committees. These
structures have survived up to date.
Unfortunately, the military government that introduced these reforms was overthrown on
June 4th
, 1979 by junior army officers led by Flight Lieutenant Jerry John Rawlings who
formed the Armed Forces Revolutionary Council (AFRC). The military junta handed over
power to the Peoples’ National Party (PNP) which formed a civilian government under the
leadership of Dr Hilla Limman upon winning presidential elections in 1980. In its 27
months in office, the PNP government passed a local government (amendment) act of 1980
(act 403) that subsequently led to the establishment of regional administrative units. The
regional administrations were responsible for development planning and coordinating
plans and programmes between district and regional levels (Ahwoi 2010). They were also
in charge of initiating and implementing regional development programmes to ensure fair
and equitable distribution of public services. But before most of the provisions under act
403 were tested, the PNP government was overthrown by Flt Lieutenant J. J. Rawlings in
his second coup on 31st December, 1981. This marked the beginning of the current LG
system in Ghana.
2.3.1 Current local government system in Ghana
Ghana is a unitary state and a constitutional republic with two major layers of government;
a central government located in the capital city Accra, and 216 local government
authorities (as at the time of writing this thesis in 2013/2014) dispersed across the
country’s ten administrative regions. The head of state and government is the Executive
President, who is directly elected by universal adult suffrage in competitive multi-party
elections organised after every four years. Upon assuming office, the President appoints
Ministers of State to manage various sectors out of which the Minister for Local
Government and Rural Development is in charge of local government administration. This
makes the local government system highly susceptible to considerable influence by central
government. The root of the current LG system in Ghana originated from the
decentralization policy that was introduced by the military government of the PNDC
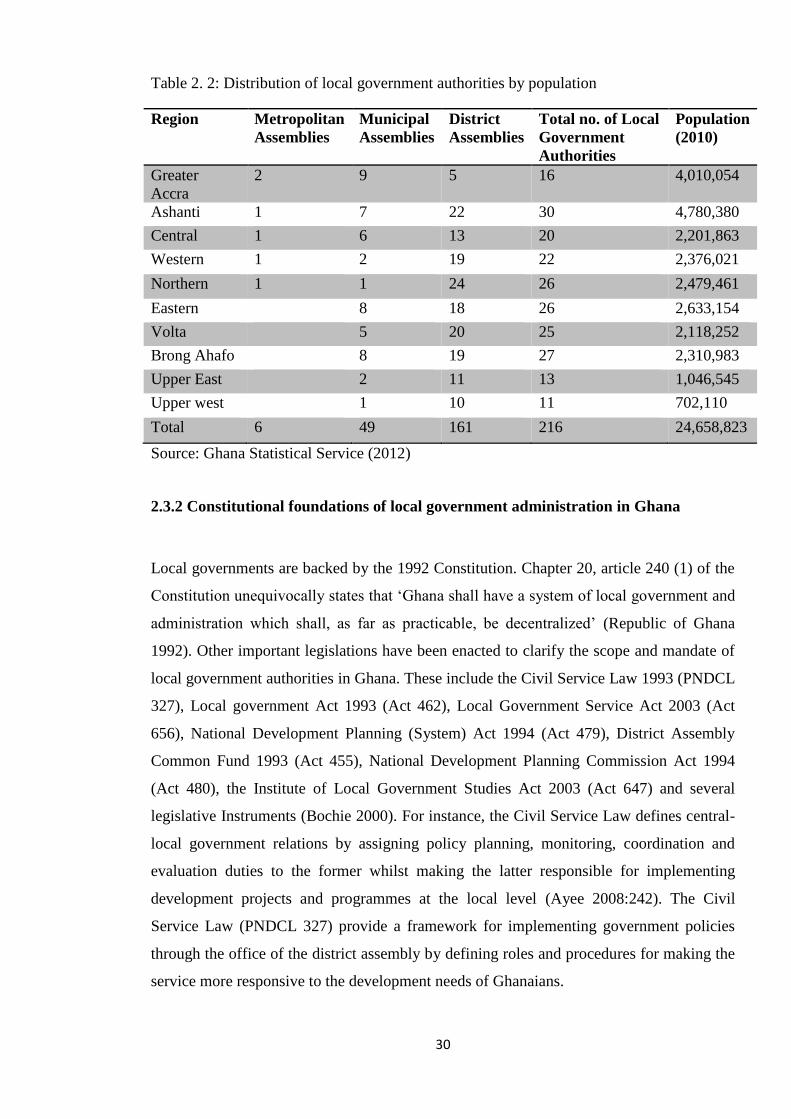
between 1981 and 1992. The policy was part of the Structural Adjustment Programmes
(SAPs) that were implemented to reform the public sector of many developing countries in
the 1980s (Ayee, 2008). Today, local government authorities are constitutionally
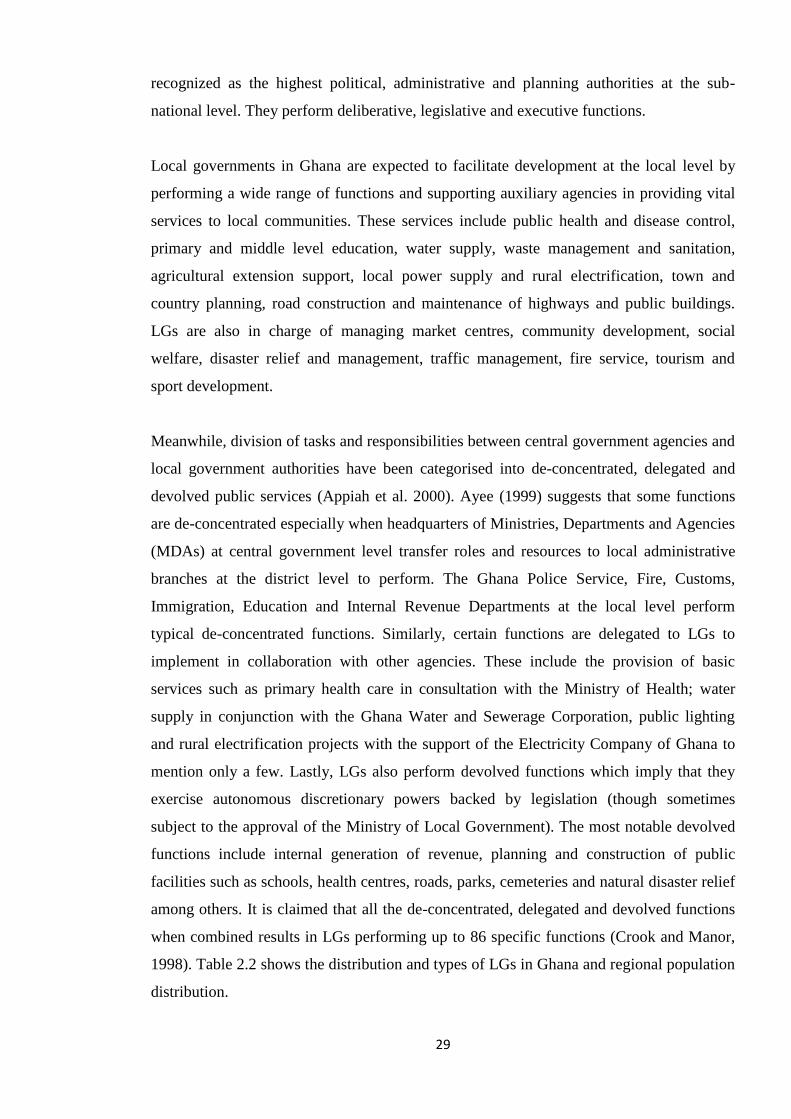
29
recognized as the highest political, administrative and planning authorities at the sub-
national level. They perform deliberative, legislative and executive functions.
Local governments in Ghana are expected to facilitate development at the local level by
performing a wide range of functions and supporting auxiliary agencies in providing vital
services to local communities. These services include public health and disease control,
primary and middle level education, water supply, waste management and sanitation,
agricultural extension support, local power supply and rural electrification, town and
country planning, road construction and maintenance of highways and public buildings.
LGs are also in charge of managing market centres, community development, social
welfare, disaster relief and management, traffic management, fire service, tourism and
sport development.
Meanwhile, division of tasks and responsibilities between central government agencies and
local government authorities have been categorised into de-concentrated, delegated and
devolved public services (Appiah et al. 2000). Ayee (1999) suggests that some functions
are de-concentrated especially when headquarters of Ministries, Departments and Agencies
(MDAs) at central government level transfer roles and resources to local administrative
branches at the district level to perform. The Ghana Police Service, Fire, Customs,
Immigration, Education and Internal Revenue Departments at the local level perform
typical de-concentrated functions. Similarly, certain functions are delegated to LGs to
implement in collaboration with other agencies. These include the provision of basic
services such as primary health care in consultation with the Ministry of Health; water
supply in conjunction with the Ghana Water and Sewerage Corporation, public lighting
and rural electrification projects with the support of the Electricity Company of Ghana to
mention only a few. Lastly, LGs also perform devolved functions which imply that they
exercise autonomous discretionary powers backed by legislation (though sometimes
subject to the approval of the Ministry of Local Government). The most notable devolved
functions include internal generation of revenue, planning and construction of public
facilities such as schools, health centres, roads, parks, cemeteries and natural disaster relief
among others. It is claimed that all the de-concentrated, delegated and devolved functions
when combined results in LGs performing up to 86 specific functions (Crook and Manor,
1998). Table 2.2 shows the distribution and types of LGs in Ghana and regional population
distribution.
30
Table 2. 2: Distribution of local government authorities by population
Region Metropolitan
Assemblies
Municipal
Assemblies
District
Assemblies
Total no. of Local
Government
Authorities
Population
(2010)
Greater
Accra
2 9 5 16 4,010,054
Ashanti 1 7 22 30 4,780,380
Central 1 6 13 20 2,201,863
Western 1 2 19 22 2,376,021
Northern 1 1 24 26 2,479,461
Eastern 8 18 26 2,633,154
Volta 5 20 25 2,118,252
Brong Ahafo 8 19 27 2,310,983
Upper East 2 11 13 1,046,545
Upper west 1 10 11 702,110
Total 6 49 161 216 24,658,823
Source: Ghana Statistical Service (2012)
2.3.2 Constitutional foundations of local government administration in Ghana
Local governments are backed by the 1992 Constitution. Chapter 20, article 240 (1) of the
Constitution unequivocally states that ‘Ghana shall have a system of local government and
administration which shall, as far as practicable, be decentralized’ (Republic of Ghana
1992). Other important legislations have been enacted to clarify the scope and mandate of
local government authorities in Ghana. These include the Civil Service Law 1993 (PNDCL
327), Local government Act 1993 (Act 462), Local Government Service Act 2003 (Act
656), National Development Planning (System) Act 1994 (Act 479), District Assembly
Common Fund 1993 (Act 455), National Development Planning Commission Act 1994
(Act 480), the Institute of Local Government Studies Act 2003 (Act 647) and several
legislative Instruments (Bochie 2000). For instance, the Civil Service Law defines central-
local government relations by assigning policy planning, monitoring, coordination and
evaluation duties to the former whilst making the latter responsible for implementing
development projects and programmes at the local level (Ayee 2008:242). The Civil
Service Law (PNDCL 327) provide a framework for implementing government policies
through the office of the district assembly by defining roles and procedures for making the
service more responsive to the development needs of Ghanaians.
31
Based on these legislations, local authorities are expected to exercise political and
administrative authority that allows them to provide guidance, give direction to, and
supervise other administrative authorities to manage development at the local level. By
law, the National Development Planning Commission Act 1994 (Act 480) establishes and
specifies the composition, roles, functions and authority of the National Development
Planning Commission as the highest coordinating body in charge of development planning
in Ghana while the District Assembly Common Fund Act 1993 (Act 455) defines the
nature of inter-governmental fiscal transfers.
2.4 Structure of local government administration
In Ghana, local government authorities are known as Metropolitan, Municipal and District
Assemblies (MMDAs). A Metropolitan Assembly is a local government for a defined
geographic area with more than 250,000 people; a Municipal Assembly is a ‘one town
assembly’ with population ranging from 95,000 and 250,000 people while a District
Assembly is a local government authority for a group of settlements with a minimum
population of 75,000 and a maximum of 95,000. Despite this classification, organisational
structures that support local government administration at the sub-national level exist in
three distinct vertical levels. Firstly, there is a Regional Coordinating Council (RCC) in
each of the ten administrative regions responsible for monitoring and coordinating the
performance of local government authorities in the regions even though the regional
administrations themselves do not have the powers of local government authorities.
Secondly, at the sub-regional level, there are 6 Metropolitan Assemblies, 49 Municipal
Assemblies and 161 District Assemblies as shown in table 2.2. Thirdly, at the sub-district
level, there are Sub-Metropolitan Councils, Urban, Town and Zonal Councils as well as
Unit Committees at the lowest level.
2.4.1 The Ministry of Local Government and Rural Development
The Ministry of Local Government and Rural Development (MLGRD) is the apex body
that oversee local government administration in Ghana. It is responsible for the
formulation of local government policy as well as coordinating, implementing, monitoring
and evaluating reform policies and programmes aimed at consolidating democratic
governance in Ghana. The Ministry has implemented a number of reforms in the past

32
geared towards making local government authorities effective players in local level
development by promoting popular participation in local administration and formulating
policies and programmes aimed at accelerating decentralisation and decelerating
(re)centralisation.
As one of the important gate keepers to LGs in the country, the Ministry of Local
Government and the Local Government Service Secretariat direct LG policy by initiating
development projects, some of which have benefitted from donor support. For instance, in
the last decade, LGs in the three northern regions received support from the European
Union (EU) to implement micro projects. Other similar interventions include a community-
based rural development programme and a village infrastructure project that led to the
construction of schools and health facilities in a bid to improve infrastructure. Similarly, a
number of pro poor development interventions such as the Ghana School Feeding
Programme (GSFP), Ghana Social Opportunities Programme (GSOP), Local Enterprise
Skills Development Project (LESDEP) and the District Development Facility (DDF) have
been implemented throughout the country. The Ministry therefore operates project support
or coordinating units within the MLGRD to monitor the performance of LGs on these
interventions.
2.4.2 Regional coordinating councils (RCCs)
In each of the ten administrative regions in Ghana, there is a Regional Coordinating
Council (RCC). These Councils do not have the powers of local government authorities
even though they facilitate local government administration. The President of Ghana
appoints Regional Ministers to head the regional administrations and to chair the RCCs.
Regional Ministers symbolize the face of central government as they are the chief
representatives of the President. They are particularly responsible for co-ordinating and
directing the administrative machinery in the region and perform any other functions
delegated to them by the President. In addition to the Regional Ministers, the composition
of the RCCs include Deputy Regional Minister(s), Presiding Members and Chief
Executives of each LG within the regions, two traditional leaders elected by their peers to
represent the Regional House of Chiefs and the regional heads of decentralized (de-
concentrated) departments who have no voting rights during RCC meetings. According to
the Local Government Act 462 of 1993, the Regional Co-ordinating Director is the
secretary to the RCC.
33
2.5 Tiers of local government authorities
Even though LGs in Ghana can be categorized on the basis of population size, it is
important to emphasise that Metropolitan, Municipal and District Assemblies have equal
powers under the local government law. Also, the President has the power to create
additional LGs when there is an increase in urbanization and population size. Under the
current democratic dispensation, the number of LGs has almost doubled between 1988 and
2012 when the number of LGs was increased from 110 to 216. All local authorities have
similar internal structures and departments except that Metropolitan Assemblies, as shown
in figure 2.2 have three tiers below them while Municipal and District Assemblies have
two tiers at the sub-district level. Whereas the sub structures for Metropolitan Assemblies
are Sub-metropolitan councils, Town Councils and Unit Committees; Municipal
Assemblies have Zonal Councils and Unit Committees whilst District Assemblies have
Area/urban Councils and Unit Committees. Unit Committees operate at the bottom of the
structural hierarchy of local government authorities. Unfortunately, these committees have
lost their relevance and do not even exist in many jurisdictions (Songore, 2011). This has
intensified calls for their abolition. Figure 2.2 below shows the tiers of LGs showing
central-local government linkages.

34
Figure 2. 2: Structures for local government administration in an inter-governmental
framework
Source: author’s construct, 2014
Office of the
President of Ghana
National Development
Planning Commission
Regional Coordinating Councils
District Assemblies
Cabinet of Ministers
Ministry of Local Government and Rural Development
Metropolitan
Assemblies
Municipal Assemblies
Sub-Metropolitan
Councils
Area/Urban Councils Town Councils Zonal Councils
Unit Committees

35
2.5.1 Functions and composition of local government authorities
The constitutional mandate given to LGs to perform deliberative, legislative and executive
functions is translated into certain broad functional responsibilities prescribed by the Local
Government Act 1993 (Act 462). The law specifies that LGs would be:
(i) Responsible for the overall development of the district and shall ensure the preparation
and submission through the Regional Co-ordinating Council:
of development plans of the district to the National Development Planning
Commission for approval, and
of the budget of the district related to approved plans to the Minister responsible for
finance for approval;
(ii) Shall formulate and execute plans, programmes and strategies for the effective
mobilisation of resources necessary for the overall development of the district;
(iii) Shall promote and support productive activity and social development in the district
and remove any obstacles to initiative and development;
(iv) Shall initiate programmes for the development of basic infrastructure and provide
municipal works and services in the district;
(v) Responsible for the development, improvement and management of human settlements
and the environment in the district;
(vi) Responsible for the maintenance of security and public safety in the district; and shall
ensure ready access to law courts in the district for the promotion of justice.
Fulfilling these functions will depend on the performance of the total membership of the
Assemblies. Administratively, LGs consist of a General Assembly, Public Relations and
Complaints Committee, an Executive Committee and its Sub-Committees, a Coordinating
Directorate and 22 decentralized Departments (Crawford, 2004). While these committees
and units are composed of elected and appointed members, it is Chief Executives –
political appointees similar to an executive mayor- that head the LGs. Apart from Chief
Executives, the local government authority is steered by Coordinating Directors who
advise the Chief Executives and coordinate the operations of various decentralised
departments. It is important to emphasise that Metropolitan, Municipal and District Chief
Executives (MMDCEs) are nominated by the President of Ghana and only assume office
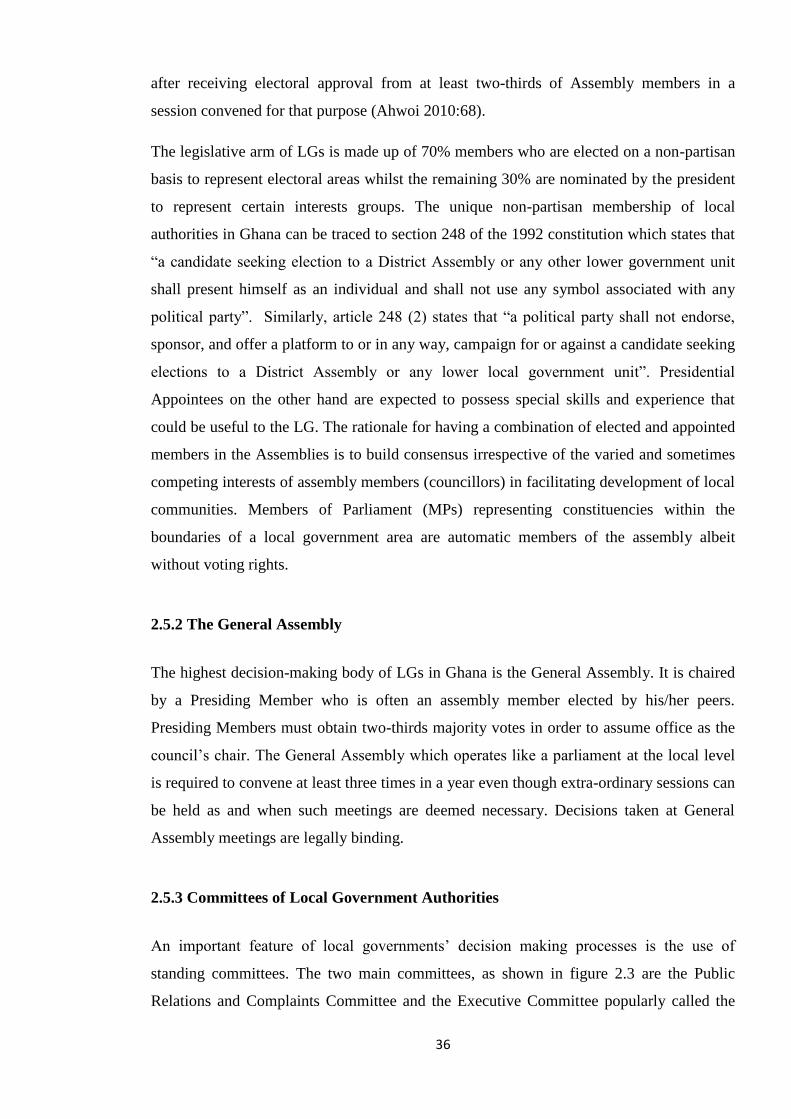
36
after receiving electoral approval from at least two-thirds of Assembly members in a
session convened for that purpose (Ahwoi 2010:68).
The legislative arm of LGs is made up of 70% members who are elected on a non-partisan
basis to represent electoral areas whilst the remaining 30% are nominated by the president
to represent certain interests groups. The unique non-partisan membership of local
authorities in Ghana can be traced to section 248 of the 1992 constitution which states that
“a candidate seeking election to a District Assembly or any other lower government unit
shall present himself as an individual and shall not use any symbol associated with any
political party”. Similarly, article 248 (2) states that “a political party shall not endorse,
sponsor, and offer a platform to or in any way, campaign for or against a candidate seeking
elections to a District Assembly or any lower local government unit”. Presidential
Appointees on the other hand are expected to possess special skills and experience that
could be useful to the LG. The rationale for having a combination of elected and appointed
members in the Assemblies is to build consensus irrespective of the varied and sometimes
competing interests of assembly members (councillors) in facilitating development of local
communities. Members of Parliament (MPs) representing constituencies within the
boundaries of a local government area are automatic members of the assembly albeit
without voting rights.
2.5.2 The General Assembly
The highest decision-making body of LGs in Ghana is the General Assembly. It is chaired
by a Presiding Member who is often an assembly member elected by his/her peers.
Presiding Members must obtain two-thirds majority votes in order to assume office as the
council’s chair. The General Assembly which operates like a parliament at the local level
is required to convene at least three times in a year even though extra-ordinary sessions can
be held as and when such meetings are deemed necessary. Decisions taken at General
Assembly meetings are legally binding.
2.5.3 Committees of Local Government Authorities
An important feature of local governments’ decision making processes is the use of
standing committees. The two main committees, as shown in figure 2.3 are the Public
Relations and Complaints Committee and the Executive Committee popularly called the
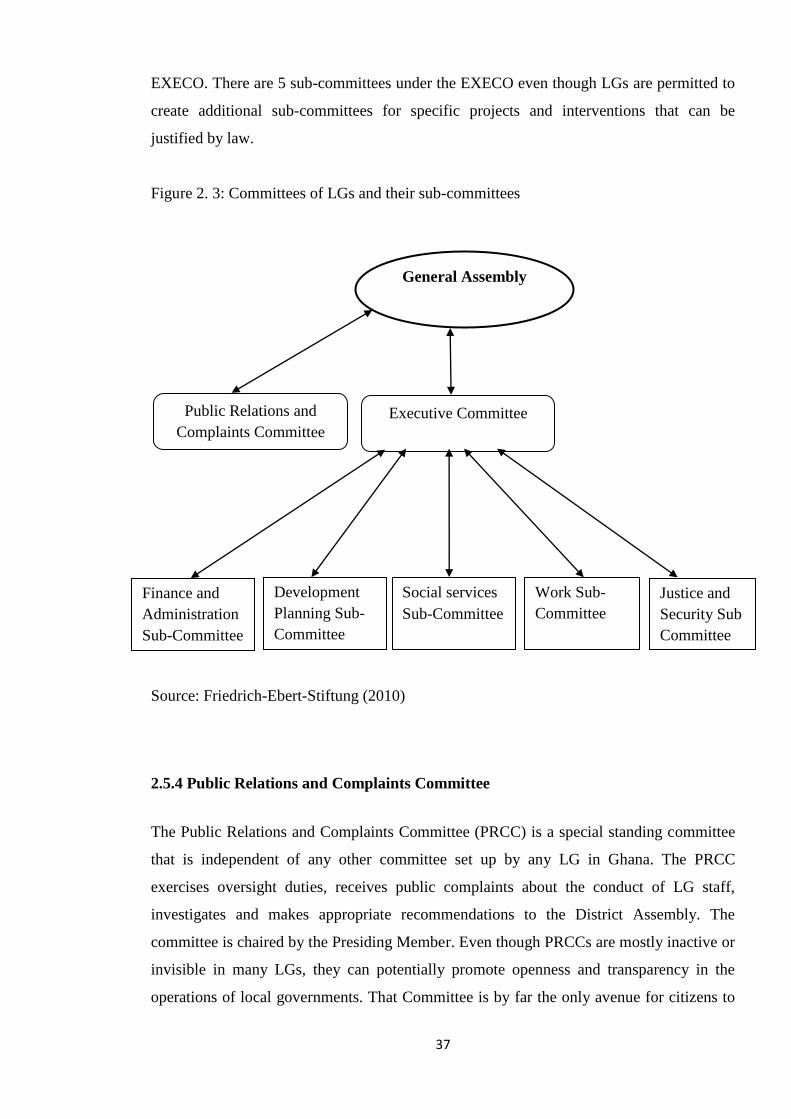
37
EXECO. There are 5 sub-committees under the EXECO even though LGs are permitted to
create additional sub-committees for specific projects and interventions that can be
justified by law.
Figure 2. 3: Committees of LGs and their sub-committees
Source: Friedrich-Ebert-Stiftung (2010)
2.5.4 Public Relations and Complaints Committee
The Public Relations and Complaints Committee (PRCC) is a special standing committee
that is independent of any other committee set up by any LG in Ghana. The PRCC
exercises oversight duties, receives public complaints about the conduct of LG staff,
investigates and makes appropriate recommendations to the District Assembly. The
committee is chaired by the Presiding Member. Even though PRCCs are mostly inactive or
invisible in many LGs, they can potentially promote openness and transparency in the
operations of local governments. That Committee is by far the only avenue for citizens to
General Assembly
Work Sub-
Committee
Executive Committee Public Relations and
Complaints Committee
Finance and
Administration
Sub-Committee
Development
Planning Sub-
Committee
Social services
Sub-Committee
Justice and
Security Sub
Committee
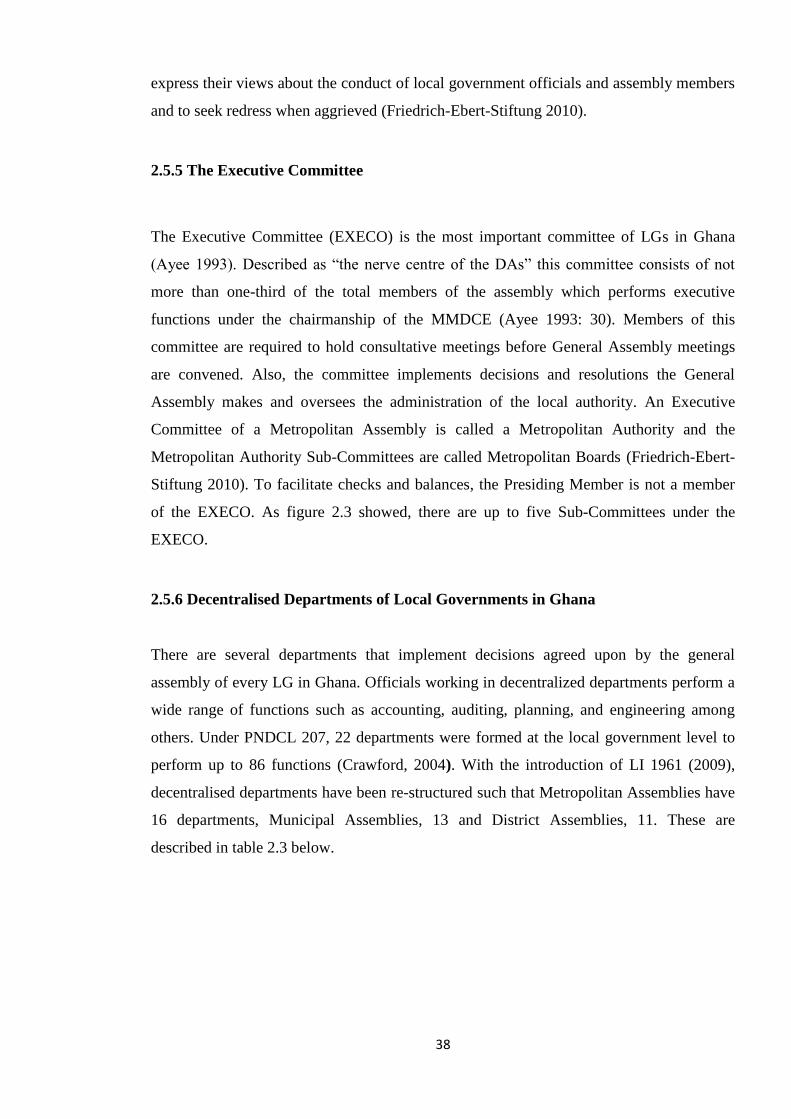
38
express their views about the conduct of local government officials and assembly members
and to seek redress when aggrieved (Friedrich-Ebert-Stiftung 2010).
2.5.5 The Executive Committee
The Executive Committee (EXECO) is the most important committee of LGs in Ghana
(Ayee 1993). Described as “the nerve centre of the DAs” this committee consists of not
more than one-third of the total members of the assembly which performs executive
functions under the chairmanship of the MMDCE (Ayee 1993: 30). Members of this
committee are required to hold consultative meetings before General Assembly meetings
are convened. Also, the committee implements decisions and resolutions the General
Assembly makes and oversees the administration of the local authority. An Executive
Committee of a Metropolitan Assembly is called a Metropolitan Authority and the
Metropolitan Authority Sub-Committees are called Metropolitan Boards (Friedrich-Ebert-
Stiftung 2010). To facilitate checks and balances, the Presiding Member is not a member
of the EXECO. As figure 2.3 showed, there are up to five Sub-Committees under the
EXECO.
2.5.6 Decentralised Departments of Local Governments in Ghana
There are several departments that implement decisions agreed upon by the general
assembly of every LG in Ghana. Officials working in decentralized departments perform a
wide range of functions such as accounting, auditing, planning, and engineering among
others. Under PNDCL 207, 22 departments were formed at the local government level to
perform up to 86 functions (Crawford, 2004). With the introduction of LI 1961 (2009),
decentralised departments have been re-structured such that Metropolitan Assemblies have
16 departments, Municipal Assemblies, 13 and District Assemblies, 11. These are
described in table 2.3 below.
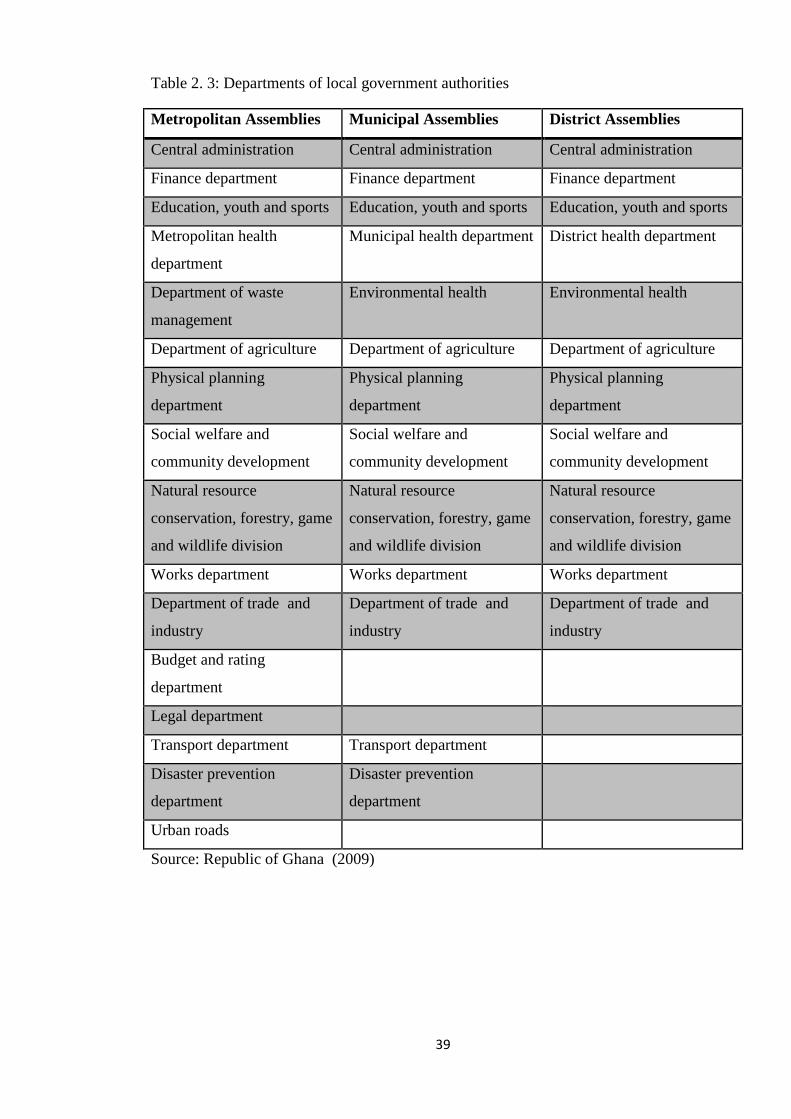
39
Table 2. 3: Departments of local government authorities
Metropolitan Assemblies Municipal Assemblies District Assemblies
Central administration Central administration Central administration
Finance department Finance department Finance department
Education, youth and sports Education, youth and sports Education, youth and sports
Metropolitan health
department
Municipal health department District health department
Department of waste
management
Environmental health Environmental health
Department of agriculture Department of agriculture Department of agriculture
Physical planning
department
Physical planning
department
Physical planning
department
Social welfare and
community development
Social welfare and
community development
Social welfare and
community development
Natural resource
conservation, forestry, game
and wildlife division
Natural resource
conservation, forestry, game
and wildlife division
Natural resource
conservation, forestry, game
and wildlife division
Works department Works department Works department
Department of trade and
industry
Department of trade and
industry
Department of trade and
industry
Budget and rating
department
Legal department
Transport department Transport department
Disaster prevention
department
Disaster prevention
department
Urban roads
Source: Republic of Ghana (2009)
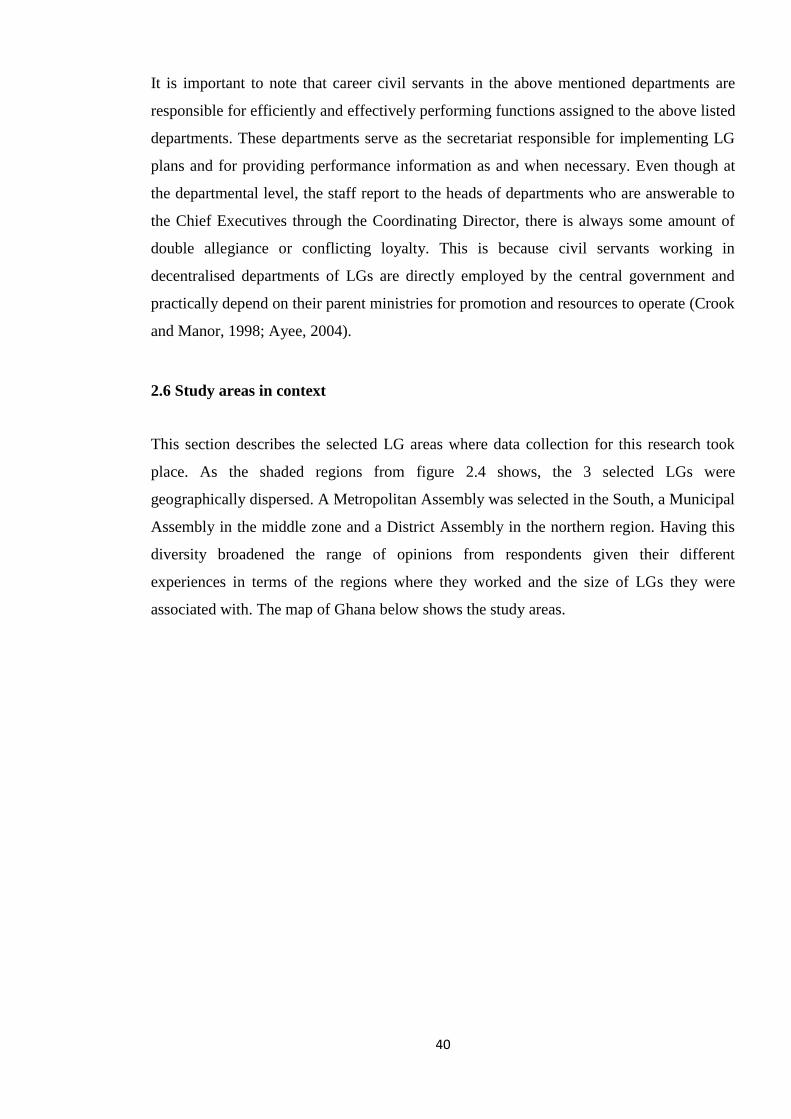
40
It is important to note that career civil servants in the above mentioned departments are
responsible for efficiently and effectively performing functions assigned to the above listed
departments. These departments serve as the secretariat responsible for implementing LG
plans and for providing performance information as and when necessary. Even though at
the departmental level, the staff report to the heads of departments who are answerable to
the Chief Executives through the Coordinating Director, there is always some amount of
double allegiance or conflicting loyalty. This is because civil servants working in
decentralised departments of LGs are directly employed by the central government and
practically depend on their parent ministries for promotion and resources to operate (Crook
and Manor, 1998; Ayee, 2004).
2.6 Study areas in context
This section describes the selected LG areas where data collection for this research took
place. As the shaded regions from figure 2.4 shows, the 3 selected LGs were
geographically dispersed. A Metropolitan Assembly was selected in the South, a Municipal
Assembly in the middle zone and a District Assembly in the northern region. Having this
diversity broadened the range of opinions from respondents given their different
experiences in terms of the regions where they worked and the size of LGs they were
associated with. The map of Ghana below shows the study areas.
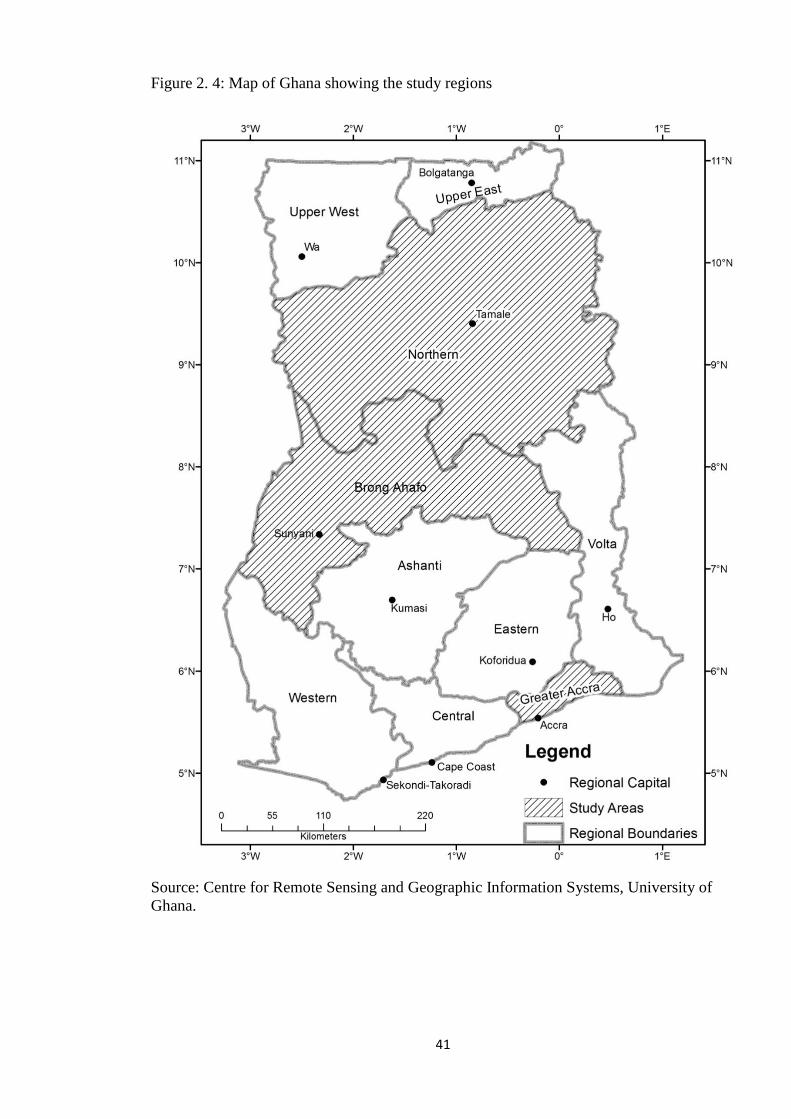
41
Figure 2. 4: Map of Ghana showing the study regions
Source: Centre for Remote Sensing and Geographic Information Systems, University of
Ghana.

42
2.6.1 ‘A’ Metropolis
The ‘A’ Metropolitan area is a coastal district located about 25 kms east of the national
capital - Accra. It covers an area of 396 km2 and has a population of 402, 637; 193,334
(48%) males and 209,303 (52%) females (Ghana Statistical Service 2012). The largest
seaport in Ghana can be found in this metropolis which was built as a model commercial
centre with industrial zones. Today, more than 500 factories operate in the metropolis
which is seen as a major industrial hub for the production of agro-chemicals, consumer
electronics and electrical equipment, refined petroleum products, steel and heavy
machines.
The ‘A’ Metropolitan Assembly was previously a municipal assembly until it was
upgraded in 2007 upon the promulgation of Legislative Instrument (LI) 1929. Due to
increasing urbanisation and population growth, one of its sub-metropolitan district councils
was carved out of the metropolis and upgraded into a district assembly to improve
development management and control. In terms of membership, the ‘A’ Metropolitan
Assembly at the time of this research had 49 members; 32 of whom were elected by
universal adult suffrage, 14 members appointed by the President of Ghana, 2 members of
parliament as ex-officio members and a Metropolitan Chief Executive. The mission of the
Metropolitan Assembly’s is:
‘to improve the quality of life of people in the metropolis
through the provision of essential services and the creation of
an enabling environment to ensure the total development of
the metropolis’ (‘A’ Metropolitan Assembly, 2010).
In the same vein, the vision of the local government is
‘To become an international standard metropolis where its
inhabitants will enjoy the full benefits of modernization and
comfort on a peaceful, reliable and sustainable basis’ (ibid)
The Metropolitan Assembly has a development agenda that aims at improving the living
standards of local residents, promoting good governance and reducing poverty through
efficient revenue mobilisation, provision of quality basic social services, environmental
sanitation and sustainable public private partnership.
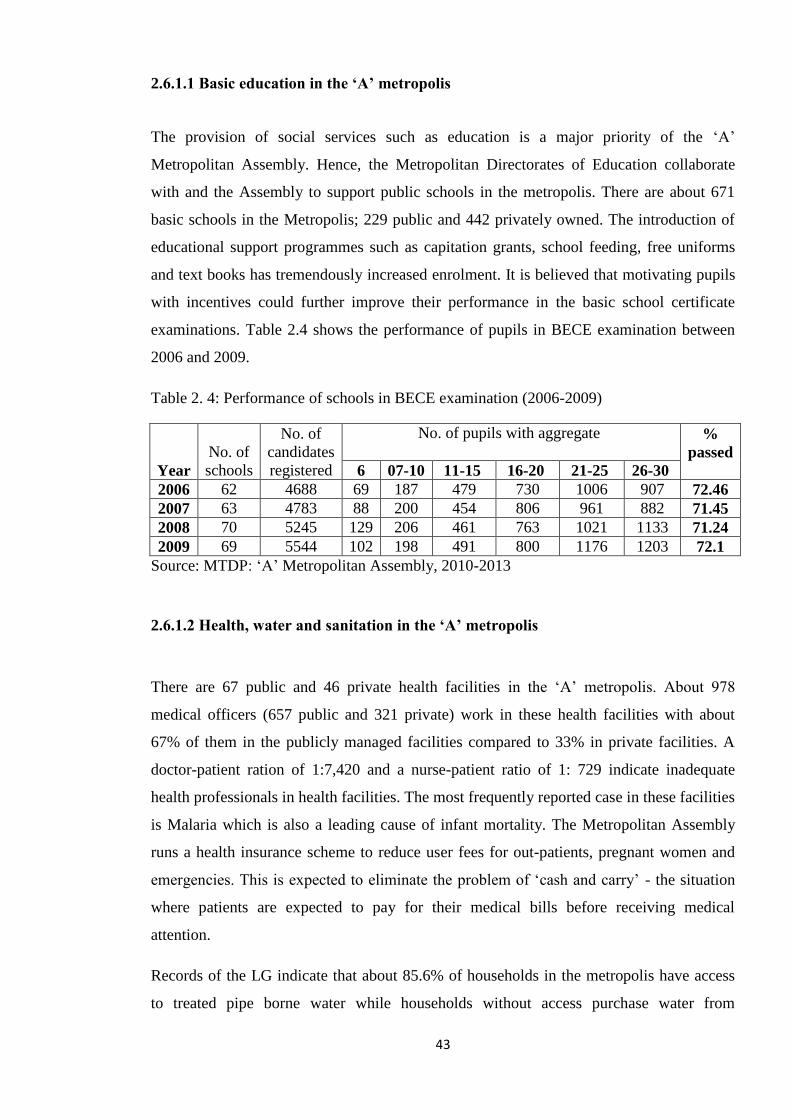
43
2.6.1.1 Basic education in the ‘A’ metropolis
The provision of social services such as education is a major priority of the ‘A’
Metropolitan Assembly. Hence, the Metropolitan Directorates of Education collaborate
with and the Assembly to support public schools in the metropolis. There are about 671
basic schools in the Metropolis; 229 public and 442 privately owned. The introduction of
educational support programmes such as capitation grants, school feeding, free uniforms
and text books has tremendously increased enrolment. It is believed that motivating pupils
with incentives could further improve their performance in the basic school certificate
examinations. Table 2.4 shows the performance of pupils in BECE examination between
2006 and 2009.
Table 2. 4: Performance of schools in BECE examination (2006-2009)
Year
No. of
schools
No. of
candidates
registered
No. of pupils with aggregate
%
passed
6 07-10 11-15 16-20 21-25 26-30
2006 62 4688 69 187 479 730 1006 907 72.46
2007 63 4783 88 200 454 806 961 882 71.45
2008 70 5245 129 206 461 763 1021 1133 71.24
2009 69 5544 102 198 491 800 1176 1203 72.1
Source: MTDP: ‘A’ Metropolitan Assembly, 2010-2013
2.6.1.2 Health, water and sanitation in the ‘A’ metropolis
There are 67 public and 46 private health facilities in the ‘A’ metropolis. About 978
medical officers (657 public and 321 private) work in these health facilities with about
67% of them in the publicly managed facilities compared to 33% in private facilities. A
doctor-patient ration of 1:7,420 and a nurse-patient ratio of 1: 729 indicate inadequate
health professionals in health facilities. The most frequently reported case in these facilities
is Malaria which is also a leading cause of infant mortality. The Metropolitan Assembly
runs a health insurance scheme to reduce user fees for out-patients, pregnant women and
emergencies. This is expected to eliminate the problem of ‘cash and carry’ - the situation
where patients are expected to pay for their medical bills before receiving medical
attention.
Records of the LG indicate that about 85.6% of households in the metropolis have access
to treated pipe borne water while households without access purchase water from

44
commercial vendors and tanker operators. Water supply in the metropolis is irregular
despite the fact that the metropolitan assembly has a water and sanitation unit.
Management of household liquid waste is one of the major environmental problems facing
the LG. With respect to solid waste, the metropolitan assembly has outsourced refuse
collection, evacuation and disposal to private firms on franchise. This means that
households directly pay user fees to a private company for the collection of their household
waste. However, inadequate waste bins in communities and frequent delays in emptying
them encourage indiscriminate disposal of waste (‘A’ Metropolitan Assembly MTDP,
2010-2013). Even though some self-styled waste collectors locally known as “boola-boola
boys” use wheel barrows to operate door-to-door collection of solid waste, their operations
are confined to affluent residential areas where people are willing to pay for waste
collection. Another challenge the LG faces in tackling waste management problems is the
absence of a permanent site for disposing waste in the metropolis. At the time of this
research, an abandoned gravel pit was being used as the final disposal site even though the
Metropolitan Assembly had planned to rehabilitate and convert an old landfill site into a
new engineered sanitary landfill under an Urban Environmental Sanitation Project.
2.6.2 ‘B’ Municipality
The ‘B’ municipal area is in the Brong Ahafo Region where it shares boundaries with three
other districts and one in the Ashanti Region. It is the second largest urban area in the
region with about 64% of the total population living in urban settlements (‘B’ Municipal
Assembly, 2010). The capital town of the municipality connects the southern and northern
regions of Ghana. The ‘B’ Municipal Assembly was established by Legislative Instrument
(LI 1472) in 1989 as a District Assembly and was later upgraded to the status of a
Municipal Assembly in 2004 under LI 1799. Today, it is one of 29 LGs in the Brong
Ahafo Region with 32 elected members and 12 government appointees, one Member of
Parliament and a Municipal Chief Executive. The vision of the assembly is:
“To alleviate poverty and transform its local economy into a
vibrant and developed enclave” (‘B’ Municipal Assembly)
In order to attain this vision, the Assembly’s mission is
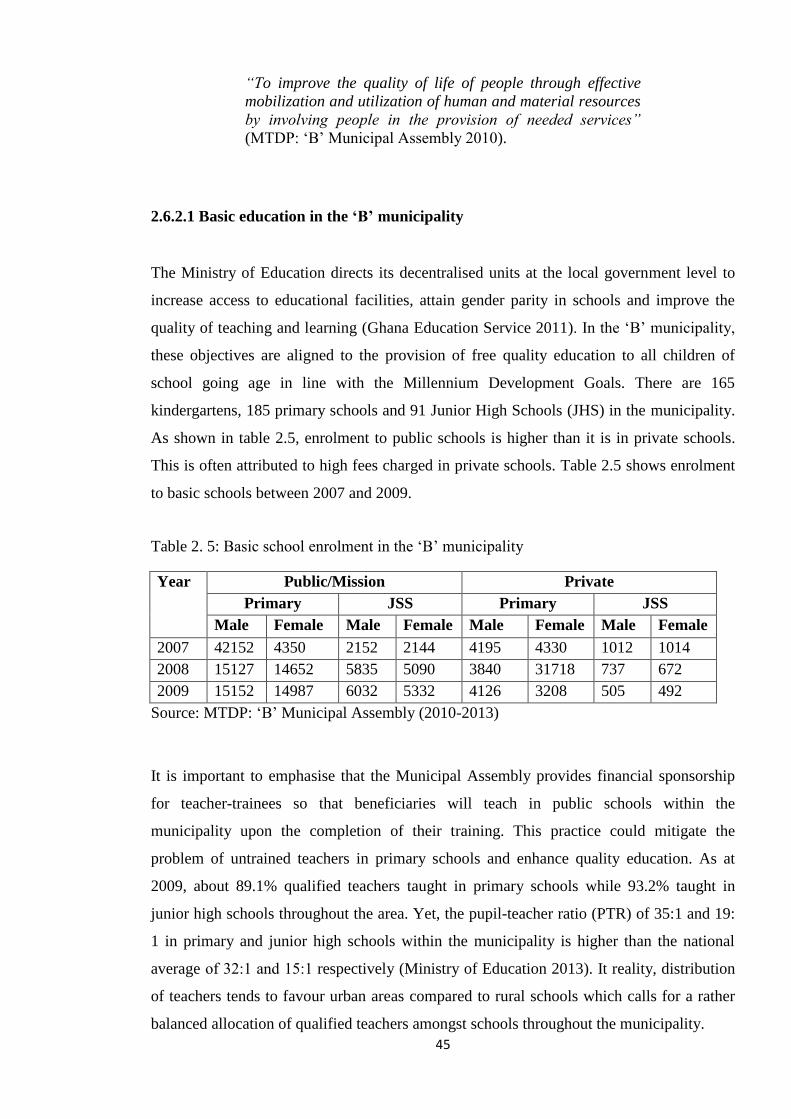
45
“To improve the quality of life of people through effective
mobilization and utilization of human and material resources
by involving people in the provision of needed services”
(MTDP: ‘B’ Municipal Assembly 2010).
2.6.2.1 Basic education in the ‘B’ municipality
The Ministry of Education directs its decentralised units at the local government level to
increase access to educational facilities, attain gender parity in schools and improve the
quality of teaching and learning (Ghana Education Service 2011). In the ‘B’ municipality,
these objectives are aligned to the provision of free quality education to all children of
school going age in line with the Millennium Development Goals. There are 165
kindergartens, 185 primary schools and 91 Junior High Schools (JHS) in the municipality.
As shown in table 2.5, enrolment to public schools is higher than it is in private schools.
This is often attributed to high fees charged in private schools. Table 2.5 shows enrolment
to basic schools between 2007 and 2009.
Table 2. 5: Basic school enrolment in the ‘B’ municipality
Year Public/Mission Private
Primary JSS Primary JSS
Male Female Male Female Male Female Male Female
2007 42152 4350 2152 2144 4195 4330 1012 1014
2008 15127 14652 5835 5090 3840 31718 737 672
2009 15152 14987 6032 5332 4126 3208 505 492
Source: MTDP: ‘B’ Municipal Assembly (2010-2013)
It is important to emphasise that the Municipal Assembly provides financial sponsorship
for teacher-trainees so that beneficiaries will teach in public schools within the
municipality upon the completion of their training. This practice could mitigate the
problem of untrained teachers in primary schools and enhance quality education. As at
2009, about 89.1% qualified teachers taught in primary schools while 93.2% taught in
junior high schools throughout the area. Yet, the pupil-teacher ratio (PTR) of 35:1 and 19:
1 in primary and junior high schools within the municipality is higher than the national
average of 32:1 and 15:1 respectively (Ministry of Education 2013). It reality, distribution
of teachers tends to favour urban areas compared to rural schools which calls for a rather
balanced allocation of qualified teachers amongst schools throughout the municipality.
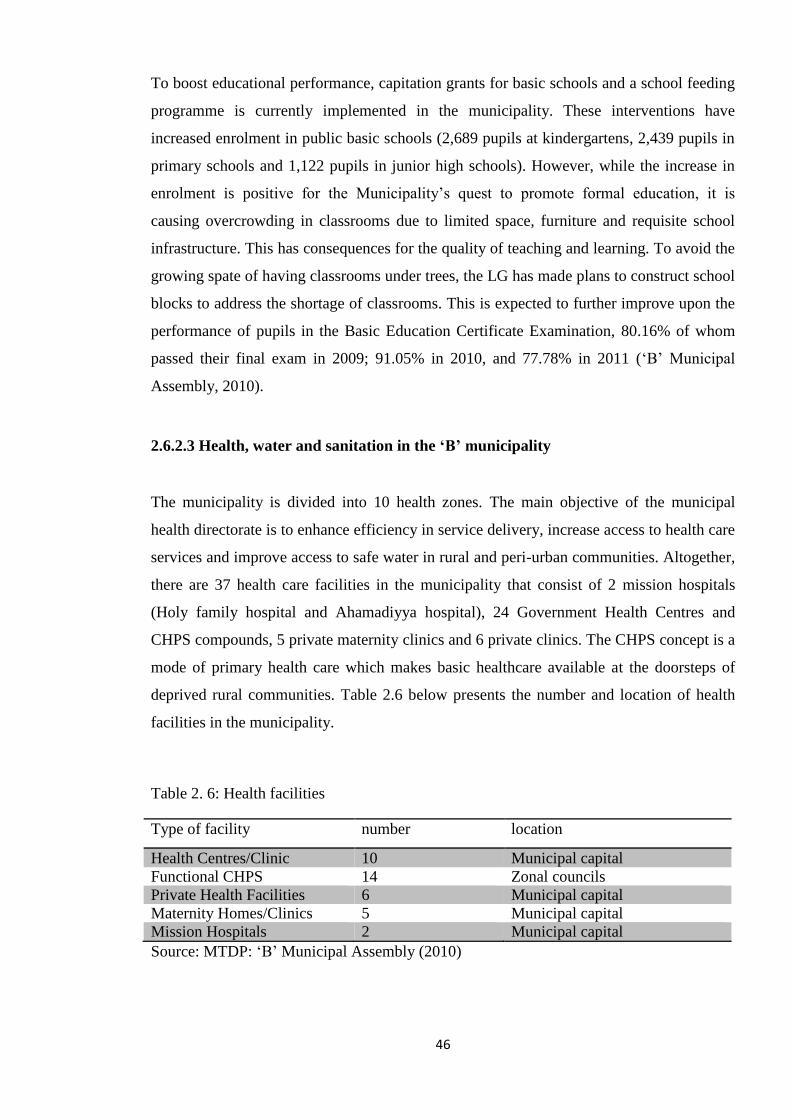
46
To boost educational performance, capitation grants for basic schools and a school feeding
programme is currently implemented in the municipality. These interventions have
increased enrolment in public basic schools (2,689 pupils at kindergartens, 2,439 pupils in
primary schools and 1,122 pupils in junior high schools). However, while the increase in
enrolment is positive for the Municipality’s quest to promote formal education, it is
causing overcrowding in classrooms due to limited space, furniture and requisite school
infrastructure. This has consequences for the quality of teaching and learning. To avoid the
growing spate of having classrooms under trees, the LG has made plans to construct school
blocks to address the shortage of classrooms. This is expected to further improve upon the
performance of pupils in the Basic Education Certificate Examination, 80.16% of whom
passed their final exam in 2009; 91.05% in 2010, and 77.78% in 2011 (‘B’ Municipal
Assembly, 2010).
2.6.2.3 Health, water and sanitation in the ‘B’ municipality
The municipality is divided into 10 health zones. The main objective of the municipal
health directorate is to enhance efficiency in service delivery, increase access to health care
services and improve access to safe water in rural and peri-urban communities. Altogether,
there are 37 health care facilities in the municipality that consist of 2 mission hospitals
(Holy family hospital and Ahamadiyya hospital), 24 Government Health Centres and
CHPS compounds, 5 private maternity clinics and 6 private clinics. The CHPS concept is a
mode of primary health care which makes basic healthcare available at the doorsteps of
deprived rural communities. Table 2.6 below presents the number and location of health
facilities in the municipality.
Table 2. 6: Health facilities
Type of facility number location
Health Centres/Clinic 10 Municipal capital
Functional CHPS 14 Zonal councils
Private Health Facilities 6 Municipal capital
Maternity Homes/Clinics 5 Municipal capital
Mission Hospitals 2 Municipal capital
Source: MTDP: ‘B’ Municipal Assembly (2010)
47
Within the Ghanaian context, the ‘B’ Municipality is relatively endowed in terms of health
facilities and this appears to reflect in access to health care. Results from the 2003 Core
Welfare Indicators Questionnaire Survey (CWIQS) shows that 69.4% of households in the
Municipality took less than 30 minutes to reach the nearest health facility as compared to
regional and national averages of 53.85 and 57.6 minutes respectively. However, just like
in the ‘X’ Metropolis, malaria is the most commonly reported illness at Out Patient
Departments of health facilities whilst pneumonia is a major cause of mortality in the
municipality. As at 2010, there were 8 medical doctors, 3 Specialists, 7 Medical Assistants,
62 Midwifes, 43 General Nurses, 4 Public Health Nurses and 47 Community Health
Nurses. This culminated in a doctor-patient ratio of 1:21,363 and a nurse-patient ratio of
1:2,500 in the municipality (MTDP: ‘B’ Municipal Assembly 2010). Perhaps, this explains
why the level of satisfaction with medical services is 74% - lower than the regional
average of 82.3% (Ghana Statistical Service 2003). Apart from problems of access and
quality of care, another serious challenge facing the health sector is the cost of health care
especially for financially weak households despite the fact that the Municipal Assembly
runs a mutual health insurance scheme to make health care affordable to the people.
In terms of water and sanitation, the distribution of potable water and sanitary facilities is
relatively higher in urban settlements compared to small towns and villages. The main
sources of water supply are pipe-borne water, boreholes, hand-dug wells and streams, yet,
about 33% of households in rural areas do not have access to safe drinking water (‘B’
Municipal Assembly, 2010). In addition to this, another important concern relates to
sanitation and waste management. Even though the LG constructed 35 public toilets in
various communities, the management of household liquid and solid waste is still a huge
problem. Many communities in the Municipality have grown beyond the capacity of the
Municipal Assembly to deliver effective sanitation services. It is not uncommon to find
open drains and gutters along the streets being used as dumping sites for different kinds of
household waste. To control this from spreading, waste collection containers have been
placed at strategic open spaces in communities for waste collection. Also, the Municipal
Assembly has secured a site where haulage trucks dump household waste deposits.
Zoomlion Company Limited, a private waste collection firm has been contracted to assist
in sanitation and management of waste in the municipality.
48
2.6.3 ‘C’ District
The district is historically significant because it serves as the cradle of the Gonja Kingdom
that was established in the 17th Century by Ndewura Jakpa. Nyange, the traditional capital
of the Gonja people was located within the district until the creation of present day Sawla
Tuna Kalba District in 2004 (MTDP: ‘C’ District Assembly 2010). The area is endowed
with vast arable lands. The population of the district is estimated at about 95, 353,
comprising 53% male and 47% females with a population growth rate of about 3. 6% per
annum (Ghana Statistical Service 2012). The mission of the ‘C’ District Assembly is
“To improve the living standards of people in the District
through effective coordination of resources to provide quality
services” (MTDP: ‘C’ District Assembly 2010).
2.6.3.1 Basic education in the ‘C’ district
There is only one Government Senior High School in the ‘C’ district, 25 junior high
schools, 61 primary schools and 3 vocational schools. Out of 329 teachers in 2007, 142
were trained teachers compared to 187 untrained. In 2008, the number of teachers
increased slightly to 345 (176 trained and 169 untrained) and then marginally to 386 (205
trained and 181 untrained) in 2009. This has not however improved upon the pupil-teacher
ratio at the primary school level where the trend increased from 1: 47 to 1: 57 between
2007 and 2009. To meet the District Education Directorate’s aim of promoting education,
27 new public schools have been opened in the district since 2008. Even though school
enrolment subsequently increased as a result, there are concerns about high drop-out rate
amongst girls from primary to JHS, a problem that is attributed to poverty, teenage
pregnancy and early marriage (MTDP: ‘C’ District Assembly 2010). Other problems
affecting basic education in the district is the use of children of school going age as a
source of cheap labour in restaurants and stone quarries. This has repercussions on the
performance of pupils in the Basic Education Certificate Examination, which declined
between 2007 and 2009 as shown in table 2.7 below.
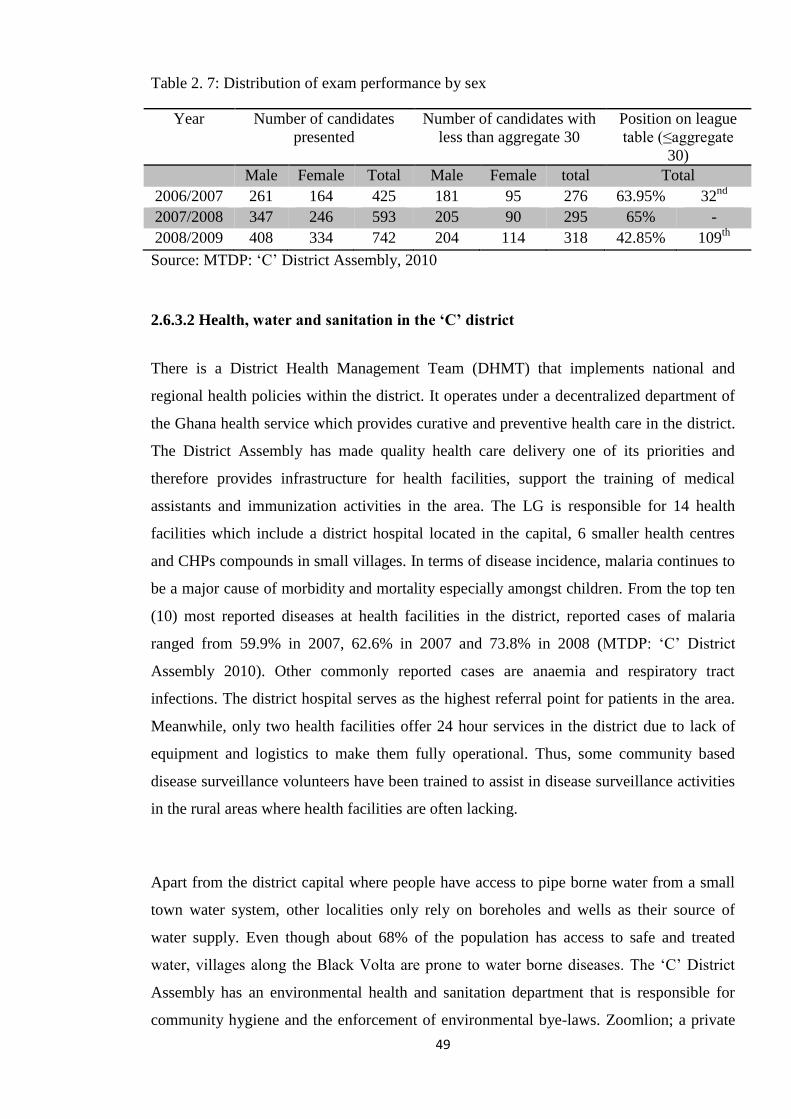
49
Table 2. 7: Distribution of exam performance by sex
Year Number of candidates
presented
Number of candidates with
less than aggregate 30
Position on league
table (≤aggregate
30)
Male Female Total Male Female total Total
2006/2007 261 164 425 181 95 276 63.95% 32nd
2007/2008 347 246 593 205 90 295 65% -
2008/2009 408 334 742 204 114 318 42.85% 109th
Source: MTDP: ‘C’ District Assembly, 2010
2.6.3.2 Health, water and sanitation in the ‘C’ district
There is a District Health Management Team (DHMT) that implements national and
regional health policies within the district. It operates under a decentralized department of
the Ghana health service which provides curative and preventive health care in the district.
The District Assembly has made quality health care delivery one of its priorities and
therefore provides infrastructure for health facilities, support the training of medical
assistants and immunization activities in the area. The LG is responsible for 14 health
facilities which include a district hospital located in the capital, 6 smaller health centres
and CHPs compounds in small villages. In terms of disease incidence, malaria continues to
be a major cause of morbidity and mortality especially amongst children. From the top ten
(10) most reported diseases at health facilities in the district, reported cases of malaria
ranged from 59.9% in 2007, 62.6% in 2007 and 73.8% in 2008 (MTDP: ‘C’ District
Assembly 2010). Other commonly reported cases are anaemia and respiratory tract
infections. The district hospital serves as the highest referral point for patients in the area.
Meanwhile, only two health facilities offer 24 hour services in the district due to lack of
equipment and logistics to make them fully operational. Thus, some community based
disease surveillance volunteers have been trained to assist in disease surveillance activities
in the rural areas where health facilities are often lacking.
Apart from the district capital where people have access to pipe borne water from a small
town water system, other localities only rely on boreholes and wells as their source of
water supply. Even though about 68% of the population has access to safe and treated
water, villages along the Black Volta are prone to water borne diseases. The ‘C’ District
Assembly has an environmental health and sanitation department that is responsible for
community hygiene and the enforcement of environmental bye-laws. Zoomlion; a private
50
waste management operator, has been contracted by the LG to sweep streets in major
towns in the district and to evacuate and dispose household wastes to a landfill site. One
major problem facing waste management is the attitude of people towards indiscriminate
disposal of refuse- a situation partially caused by insufficient waste collection bins. Also,
household wastes are mostly made up of non- degradable polythene bags and plastic
materials which may have long term consequences on the environment if they are not
recycled.
2.7 Conclusion
The aim of this chapter is to present the context of the study and describe the case study
districts. Since local government systems differ from country to country, it was imperative
to explain and clarify the LG system in the Ghanaian context. The contextual overview of
the study area suggests that the LG system in Ghana is not entirely unique especially in
terms of central-local government relations. However, there are complex connections
between structures of LGs and the central government and its ministries and agencies such
as the Ministry of Local Government and Rural Development and the National
Development Planning Commission. Being a small unitary state of 25 million people, the
two levels of government have been structurally enmeshed through different forms of
decentralisation - deconcentration of power and authority to regional level agencies,
devolution of power and service delivery responsibilities to LGs and delegation to sub-
national structures.
The chapter highlights how Regional Coordinating Councils as intermediaries between the
central government and the 216 local governments are dispersed throughout the ten regions
of the country. All the structures at different levels of governments perform functions that
have implications for the performance of LGs. Interestingly, the inter-governmental
relations in the Ghanaian context treats LGs as an off-shoot of the centre and this has
implications for accountability as discussed in subsequent chapters. Importantly, this
chapter shows how the legitimacy of local government administration in Ghana has its
roots in the 1992 constitution which provides the legal framework within which the local
government Act, 1993 (Act 462) defines the functions of LGs. Outlining the functions and
responsibilities of LGs is important because it helps us to determine the services they
provide and the basis on which to analyse their performance.
51
Chapter 3: Examining performance management of local governments: A literature
review
3.1 Introduction
The aim of this chapter is to explore and review the public administration and public
management literature to identify gaps peculiar to the implementation of performance
management systems in public organisations. The chapter is divided into two parts. The
first section examines the concept of ‘performance’, ‘performance management’ and the
levels in which ‘performance’ could be studied. The evolution of performance
management in the public sector is traced as well as the underlying reasons for managing
organisational performance. Also, the ambiguity associated with the performance construct
is explored, its multiple definitions and dimensions examined and the shifting emphasis
from performance measurement to performance management described. The second
section explores the local government literature in the context of Sub Sahara Africa to
appreciate how performance is operationalised and identify key determinants of LG
performance. From a developing country perspective, this section explores how LGs’
provision of municipal services is indicative of their performance.
3.2 The antecedents and rise of performance management
Performance is not only an age old concept, but measuring and managing it in the public
sector has grown extensively in the last decades, spreading across sectors and countries
(Talbot 1999;Williams 2003). The evolution of performance measurement and
management span three distinct time periods; before the second world war through the
1950s and 1970s, up to the 1980s and beyond (Halligan et al. 2010). The first generation
performance movement focused on cost accounting, scientific management and the science
of administration. The purpose for measuring performance was to tackle corruption and
government adhocracy because at that time, the demand for governments was to be honest
and not necessarily efficient (ibid). Subsequently, the need to have better governments
became imminent with policy makers advocating for efficiency of public agencies and a
separation of politics from the scientific principle of public administration. The second
wave of performance management gained momentum after the second world war with an
emphasis on performance budgeting. It saw the introduction of Planning, Programming,
52
and Budgeting Systems (PPBS) which subsequently inspired what came to be known as
‘Management by Objectives’ and ‘Zero Based Budgeting’, both of which were less
successful (Halligan et al. 2010:41). Policy makers turned to social indicators to measure
changes in society by using data on government actions to understand education, health,
crime and social welfare outcomes (Bulmer 2001). Even though the social indicator
movement also run into difficulties because it failed to develop a system of indicators with
a common measurement unit, this appears to be useful even today since indicators are
crucial for any performance measurement or management process (ibid).
Some experts have argued that developments in performance management in public sector
organisations have been influenced by the expansion of the welfare state which increased
citizens expectations of government, thereby pushing performance on top of the agenda of
development (Halligan et al. 2010). Others are of the view that economic and financial
problems in many countries have created difficulties that require appropriate political and
administrative reforms (Pollitt et al. 2005). Hence, the general appeal to restructure the
public sector has culminated in the popularity of New Public Management which aims at
improving efficiency and effectiveness of public sector organisations so that governments
would work better and cost less (Hood 1991). In the UK for example, initiatives were
introduced to measure outputs as well as performance of organisations by using
performance indicators to measure public sector performance in ways that reflect the
characteristics of the NPM (Halligan et al. 2010:43). No wonder from the 1980s
throughout the 1990s, efficiency and effectiveness were key elements of public policy
under the Government Performance and Results Act (GPRA) in the US and under the Best
Value and Comprehensive Performance Assessment in the UK.
This suggests that performance measurement and management did not become popular
automatically but was rather a response to persistent demand for accountability from public
organizations and by extension, government (Talbot 1999;OECD 1997;Sanderson 2001).
Yet, some sceptics are of the view that very little has changed in conceptualising
performance from one phase to another (Williams 2003) because the evolutionary trend
brought with it certain assumptions that underpin the adoption of performance
management practices within and across different countries. For instance, the UK and New
Zealand served as models of the NPM to other countries and throughout Europe, the
performance movement received considerable political support of the OECD (OECD-
53
PUMA 1997). As a result, the NPM has not only accelerated performance consciousness
but has pushed it into the inner circles of government business.
Perhaps, the most notable feature of managing performance in the last two decades, a
period many people see as its international apogee, was the level of international
commitment and interests in measuring performance. It was recognised that something
unusual was happening in the 1990s with the “rise of performance as an issue of public
sector theory and practice” (Talbot, 1999; Bouckaert, 2008: 11). By the mid- 1990s, the
phenomenon was becoming ‘more intensive, more extensive and more external’
(Bourkaert, 1996). This trend continued in the 2000s with a noticeable momentum with
‘performance measurement and performance reporting becoming important within
governments. According to Thomas (2003: 1), this culminated in a popular refrain that “if
you can’t measure it, you can’t manage it”. Today, public services seldom escape from the
practice of performance management as evident in countless studies on the performance of
a broad range of services (Askim 2007;Boyne 1999;Addicott and Ferlie 2006). Yet, what
exactly do people mean when they talk about the concept of performance? This is explored
in the next section.
3.3 What is performance in the public sector?
The public sector is entrusted with the delivery of essential public goods and services at
various levels of government. However, there is considerable controversy associated with
the meaning of performance in the public sector and this has affected how the concept is
understood, analysed and researched. The concept of performance is multi-dimensional,
complex, and sometimes ambiguous (Bouckaert and Halligan 2008;Talbot 2010). Despite
its popularity in contemporary public administration and management literature, on-going
debates suggest this field of study will remain contested and evolutionary due to the nature
of the public sector which is characterised by multiple goals, most of which tend to be
vague, unstable, controversial and sometimes conflicting, creating room for multi-faceted
and subjective interpretation of performance (Brewer and Selden 2000;Thomas
2006;Halligan et al. 2010). Since organisations usually have multiple stakeholders, it
makes it difficult to agree on a common definition of performance because different people
have different interpretations of what performance entails (de Bruijn 2002a:7;Thomas
2006).

54
Despite the fact that performance management in public organisations is a subject of
intense debate, it has grown rapidly in both public administration and management studies
(Bouckaert and Halligan 2008;Forsythe 2001;Ingraham et al. 2003). Key points from these
debates are as follows: firstly, it is believed that performance levels can be explained based
on the effectiveness of organisational activities even though it is unclear ‘what makes
performance management so attractive in theory, yet so difficult in practice?’(Thomas
2006: 1). A second concern draws attention to the limits of rationality and the likelihood of
unintended consequences. To Christensen and Laegreid (2004), managers are often seen as
functioning within the narrow parameters of managing performance in an imperfect world
that is rationally defined. Hence, the presumption that a public organisation will be
transformed by measuring or managing its performance needs to be contextualised. This
contextualisation is even more necessary because performance measurement is further
associated with an’ array of buzzwords such as reinventing government, new public
management, performance management, results-based budgeting, and performance
contracting among others (Thomas 2006:1). While these points to an obvious confusion of
terminology, the resultant reality is that “measuring performance is like the weather;
everyone talks about it but there is no consensus on how to do it” (Schick 2001).
Whereas public sector performance has no universal meaning due to the complex nature of
political and administrative relationships in the public sphere, it is still an important area of
research. It is argued that performance management encourages goal-driven performance
when organisations keep track and focus on their strategies, targets and overall
performance (Kaplan and Norton 1992; 2000). Apart from ensuring accountability and
value for money in the utilisation of tax revenues, examining the performance of public
organisations could optimise the public good by implementing projects and delivering
services that satisfy government and citizens (Boyne et al. 2010). Meanwhile, how
performance is assessed by the government and citizens is influenced by political versus
pluralistic interests that raise questions about the suitability of using either ‘objective’ or
‘subjective’ measures of performance or both. The former focuses on indicators of public
sector performance that is viewed as accurately reflecting the real world and minimising
discretion’ (Meier and Brudney 2002:19). According to this point of view, measures of
performance need to be precise on a given dimension of performance it seeks to measure
and involve external actors to verify its accuracy. In this sense, objective indicators are
viewed to be impartial, independent, and detached from the unit of analyses. On the
contrary, Brewer (2010) offers a fierce rebuttal to this perspective by arguing that all
55
measures of performance are subjective because organisational performance is a social
construct. In line with this view, a subjective measure of performance must refer to a
dimension of performance that is relevant and internal to the organisation, and based on
which certain judgements are made either by members of the organisation such as
managers or employees or by external stakeholders such as clients, consumers or
inspectors employed by regulatory agencies (Boyne et al. 2010). Clearly, both objective
and subjective measures of performance can provide complementary information since
none of them is singularly superior for managing public sector organisations.
The foregoing discussion suggests that performance of a public organisation cannot be
succinctly defined unless it is disaggregated into dimensions of performance. This is why
some studies of performance have focused on inputs, processes, outputs or outcomes or a
combination of these variables. However, there is no consensus as to whether
organisational services that take the form of inputs, outputs and outcomes are agreed,
acceptable and adequate definitions of performance (Bouckaert and Peters 2002;Boyne
2003;Talbot 2010). This view makes it even more difficult to discern the performance of
organisations that play complementary roles in the provision of public services (Talbot
2010). With local governments increasingly contracting-out some of their traditional
functions to the private sector, non-governmental and voluntary organisations, evaluating
their performance poses significant challenges due to differences in the way each of these
entities would assess performance (Lynn et al. 2000). Nonetheless, assessing and managing
performance in a systematic way must be rooted in any one or a combination of the
theoretical perspectives presented in the next section.
3.4 Theoretical perspectives for managing local government performance
Generally, there are quantitative and behavioural theories of performance, most of which
involve processes or outputs and outcomes in the interpretation of performance (Sonnentag
and Frese 2002). This means that several reasons can thus be advanced to explain the
continued interests in assessing organisational performance. In developed and developing
countries alike, performance management is seen as a response to unsatisfactory and often
dysfunctional governance systems that manifests in various acts of corruption and rent-
seeking, inappropriate allocation of resources which leads to waste, inefficient revenue
systems, and weak delivery of vital public services (Shah 2006). This generic issue is
connected to the rationale for managing performance within LGs as examined below.
56
3.4.1 Economic perspective
The literature on local government performance addresses issues of economy, efficiency
and effectiveness which are directly linked to operational performance. Central to this
perspective is the efficiency debate which focuses on how organisations optimally use their
resources to produce units of outputs at the least cost (Bouckaert and Halligan
2008;Greiling 2006). To achieve value for money, this perspective plays a key role in
countries confronted with declining finances and spending cuts which require expenditure
decisions to be appropriate, efficient and expedient. At the LG level, there is pressure for
authorities to do more with less to enhance operational efficiency in public service
provision. This dimension of performance substantially influences citizen’s perceptions
about local governments’ performance because the extent to which a LG performs its
functions efficiently affects the availability and costs of services they provide.
3.4.2 Accountability perspective
Performance management is important for politicians, elected officials and citizens
because it redefines the relationship and interactions between local residents, local
governments and service providers when they collectively place performance on top of
local governments’ agenda. From this relationship, performance information could be used
to indicate how well services are provided and whether they reflect the needs and
aspirations of all stakeholders. This way, Sanger (2008) claims that performance
management provides valuable knowledge that restores citizens’ trust in government. It
allows public services to be openly scrutinised, fostering transparency and value for money
to tax payers (Yang and Holzer 2006). For example, there have been instances where
performance management is implemented to mobilize support for the dual purpose of
improving service delivery and increasing the legitimacy of local government authority
(Ho 2003). For this reason, LGs that manage their performance to reflect citizens’ interests
are able to strengthen democratic values for being accountable and responsive to citizen
demands (Sanger 2008).
It is argued that performance management can be used to promote accountability especially
when citizens are not merely seen as recipients of local government services but rather
assume the status of “owners and evaluators of government” (Ho and Coates 2004:29).
This form of political accountability reflects democratic values by ensuring that public
57
administrators pursue publicly valued goals that satisfy the legitimate expectations of the
people they serve (Callahan 2007). This gives rise to public officials asking the
fundamental question - whom do we represent and therefore to whom are we accountable?
The answers to these questions are not only important for developing countries where
accountability has been lacking for many decades, they also motivate the introduction of
PMS into the bureaucracy of developing countries (Therkildsen 2006). Due to differences
in context, using PM to restore political accountability needs caution as the case might be
in Ghana (Ohemeng 2009).
3.4.3 Service quality perspective
Basically, quality relates to conforming to certain specifications. Meanwhile, the
interpretation of service quality is subjective because it depends on an individuals’
experience in a service area (Van Ryzin 2004). This implies that people’s perception about
local government services is influenced by the satisfaction they get from using a particular
service within a defined geographic area. Just as customer satisfaction is secured through
high-quality products or services provided in the private sector, public sector organizations
and those operating in local government areas can face pressure from different quarters to
improve customer service on a continuous basis (Gaster, 1999). Some of these pressures
could arise internally within local authorities if managers genuinely wish to improve upon
the quality of services to local residents and communities but in most cases, the demand for
quality services from LG managers is influenced by external forces such as citizen’s
charters or consumer activism (Wisniewski 1996).
One of the most important contributions to the study of service quality comes from the
marketing literature, precisely from a framework developed by Parasuraman, Zeithaml and
Berry (1985) who explained perceived service quality as the difference between people’s
expectations of a service and their perceptions about that service. They argued that
people’s expectations of a service is determined primarily by their personal needs, past
experience with service providers, word-of-mouth communications and external
communications which could either come from the service provider or elsewhere. It is
important to note that Parasuraman and his colleagues (1985) identified 10 determinants of
perceived service quality in their original framework which focused on the following:
access, communication, competence, courtesy, credibility, reliability, responsiveness,

58
security, tangibles and understanding the customer. In a refined SERVQUAL model,
Parasuraman et al., (1988) explained service quality based on the following criteria:
Tangibles: such as physically verifiable facilities, equipment, personnel;
Reliability: the ability to perform the promised service dependably and accurately;
Responsiveness: willingness to provide appropriate services to help customers;
Assurance: knowledge and courtesy of employees and their ability to inspire trust
and confidence;
Empathy: caring, individualised attention organizations are able to provide to their
clients.
Thus, for service delivering organisations that seek to improve upon their performance, the
elements of the SERQUAL model could be used as explicit objectives of their performance
management system. Since the SERVQUAL model provides a checklist not only for
assessing people’s views about service quality but also a yardstick of what service quality
should entail, these qualities have often been embedded in formulating performance
management systems that aim at improving quality of service delivery at the local
government level (Wisniewski 1996;Gaster 1999).
3.5 Levels and scope of performance
As the preceding section indicated, performance is not a unitary concept that can be
universally defined. That is why performance could be conceptualised using three widely
known models (Amirkhanyan et al. 2014).
1) The goal attainment model
2) Competing values framework and
3) A multiple constituency model
The goal attainment model primarily examines performance in relation to how individuals,
organisations and governments achieve their goals. However, this notion has been
criticised for being overly simplistic because public organisations often have more than
one goal to achieve. Secondly, the competing values framework combines the goal
attainment model with theories of performance that highlight the ability to tap and utilise
external resources and opportunities for the internal health of organisations. Lastly, the
59
multiple constituency perspective interprets performance of individuals and organisations
based on who is examining performance rather than using a set of standards or objectively
verifiable indicators to explain performance. This is similar to Brewer’s (2010) assertion
that every notion of performance is subjective and liable to several interpretations. The
multiple constituency model recognises that ‘organisational constituents have diverse
needs and none of their perspectives are more “correct” than others’(Amirkhanyan et al.
2014:2). This implies that performance and its improvement can be conceived in different
ways.
It is important to recognise that the goal attainment, competing values and multiple
constituency models lay an important foundation for our understanding of performance.
They are often implicitly embedded in the analysis of performance such as those that
follow the simple production process in which inputs are transformed into outputs. This
conventional approach is seen to be relevant for evaluating organisational performance
because no performance management system can ignore how organisational processes and
inputs are used to produce outputs and sometimes outcomes. Based on this normative
production analogy, performance has often been defined in terms of economy, efficiency
and effectiveness or some other loose extensions of these dimensions (Summermatter and
Siegel 2009). These are discussed in the next sections.
3.5.1 Span of performance
In line with the simple logic of a production process, the span of performance refers to the
qualitative and quantitative linear relationship that characterise organisations’ conversion
of inputs through activities into outputs. To Bouckaert and Halligan (2008), the span of
performance represents the process in which an organisation transforms its inputs to
achieve dual objectives that include fulfilling organisational targets and citizen’s
expectations. This linear process or relationship has been extended to include trust, even
though admittedly, there are serious concerns of objectively verifying attribution
(Bouckaert and Halligan 2008). Nevertheless, it is assumed that organisations could earn
the trust and confidence of clients and consumers based on the latter’s expectations
regarding the quality of outputs and services delivered. In a local government context, one
would expect the provision of services to be a means of achieving outcomes that could
gain the trust of their clientele, a phenomenon that appears to be the ultimate goal of many
public organisations. It is therefore legitimate for the objectives of LGs to be defined by
60
the needs and aspirations of citizens (Morgeson and Petrescu 2011). This explains the
decisions of LGs to invest in vital projects that are relevant to, and desired by local
communities. However, because community needs, preferences and expectations are less
static but rather change quite frequently, one can expect fluctuating levels of satisfaction
with respect to the quantity and quality of services delivered by LGs.
It is also possible to match and observe direct relationships between different stages of any
service production process such as input-output-outcome process. Given that local
governments are required to optimally spend limited resources to provide essential
services, managers are often seen prioritizing operational efficiency and effectiveness; the
former measured by input-output ratios whilst the latter is based on output-outcome
relationships. Whilst this simplistic matching is not new to many organisations, the
hypothetical relationship between outcomes and trust as proposed by Bouckaert and
Halligan (2008) is inconclusive and cannot be verified even though public sector
management in general, and local government administration in particular aim at filling
this gap. This implies that focusing on intra organisational processes such as economy,
efficiency and effectiveness alone would limit the span of performance whilst the inclusion
of outcomes and trust could broaden it (Bouckaert and Halligan 2006). Even though
Bouckaert and Halligan (2008) claim that the span of performance can indicate citizens’
satisfaction of organisational performance based on organisational outcomes, its
explanatory power for local governments is limited for two reasons. First, there is a blanket
assumption that organisational deliverables (outputs and outcomes) are uniform and equal
in value; meanwhile, there are mostly varying degrees of quantity and quality of outputs
and outcomes. Secondly, performance outcomes are largely delivered by a range of
organisations in co-production relationships whose activities may not logically have the
linear relationship between the various stages of the service delivery chain. Thus,
clarifying inter-organisational relationships and specific roles that different actors play
within these relationships deepen our understanding of the span of performance especially
when changes occur in the policy environment (Bouckaert and Halligan 2006).
61
3.5.2 Depth of performance
The second typology of performance proposed by Bouckaert and Halligan (2008) describes
performance in vertical levels. This way, performance potentially occurs at micro, meso
and macro levels. Organisations whose activities directly affect individual citizens and
other organisations is categorised under the micro level. Performance in the meso or
intermediate level is analogous to sector-specific policy fields such as education, health
and agriculture whilst the macro level is typical of government performance at the country
level or supra national level such as the Eurozone, OECD and Africa Union (Bouckaert
and Halligan 2008). Based on this perspective, the depth of performance at LG level can be
said to be micro because LGs and citizens directly interact based on their status as service
providers and service users. Expectations play a major role in how they interact. Within
any given depth of performance, individuals or organisations would be expected to satisfy
the expectations of key stakeholders within each level of performance. This is anchored on
the believe that organisations that design performance management systems for improving
service delivery must focus on user expectations in order to satisfy them because
expectations and perceptions influence peoples’ assessment of performance (Bouckaert
and Halligan 2008).
3.5.3 Individual performance
Human resource management literature explicitly considers individual employees as the
building blocks of organisations with the capacity of influencing overall performance
outcomes (Safdar 2011;Boyne et al. 1999;Debrah 2001;Drucker 2009). This assertion
draws a link between the potential contribution of human capital to both organisational
success and failure (Carmeli and Tishler 2004). In the private sector for instance, the
performance of individuals is crucial to the survival and continued competiveness of
organisations (Atkinson and Shaw 2006). Since human capital endowment, competencies,
and the capabilities of an organisation’s workforce are essential for creating such
competitive advantage, performance management is said to play a key role in developing
and optimizing such human capital (Tahvanainen 2000).
Important drivers of individual performance typically encompasses cognitive factors,
quality of training, experience as well as opportunities for personal development and
public service motivation (Alonso and Lewis 2001). However, considering the fact that
62
individual performance is not static but rather varies over time, attempts to understand it in
organizational settings can take two forms; either by focusing on observable process
factors (behaviour) or by concentrating on outcomes resulting from employees’ task
performance (Roe 1999). The behavioural aspects examines the actions of individuals in
the process of executing tasks while the outcome dimension refers to consequences or
results of employee behaviour (Sonnentag and Frese 2002). This conceptualisation of
performance recognises measurable actions and activities that are essential to individual
performance and mainly focuses on behaviour that is related to the achievement of
organisational goals (Motowildo et al. 1997). It also implies that performance is not only
constructed, but defined by a judgemental and evaluative process. Hence, a criterion must
be used to determine the degree to which an individual’s performance contributes to
organisational goals since there might be practical challenges in trying to determine which
behavioural patterns significantly have an impact on performance (Motowildo et al. 1997).
Apart from the distinction between behavioural and outcome dimensions, it is also possible
to identify three perspectives in the literature on individual performance; an individual
differences perspective which focuses on individual characteristics as sources of variation
in performance, a situational perspective which considers contextual factors that either
facilitate or impede performance, and a performance regulation perspective which
describes the performance process itself (Sonnentag and Frese 2002). Social cognitive
theorists such as Bandura (1997) argue that individuals who are oriented towards
developing new skills will improve their level of competence, become effective at work,
and achieve a sense of mastery. This view assumes there is a positive relationship between
self-efficacy or high sense of goal achievement and performance mainly because
differences in individual performance is due to variations in employee education, skills,
interests, experience and motivation. Building on this assertion, Motowildo et al., (1997)
argue that cognitive abilities influence task performance whereas personality traits
influence contextual performance. They explain that task performance is defined as the
contribution of employees to the organisations’ broader goals that are related to formal
reward systems and usually specified in job descriptions while contextual performance
refers to individual actions that are not formally specified by their job descriptions, but
nonetheless, contribute to the achievement of organisational goals (Sonnentag et al. 2008).
Despite the distinction between task and contextual performance, some analysts are of the
view that understanding individual performance within organisations will require some

63
amount of differentiation between human resource policy and human resource practice; the
former being the organisation’s official intentions regarding human resources while the
latter relates to observable activities as experienced by employees (Gould Williams
2010:125). This implies that how human resource management (HRM) practices are
planned and implemented influences individual performance (Chenhall and Langfield-
Smith 2007). Even though individual employee performance has been treated in its own
right, relating human resource practices to broader organisational outcomes in the public
sector is driven by the attempt to ‘open the black box’ which demands critical examination
of the relationship between HRM and performance (Wright et al. 2003). Boselie and
colleagues (2005) found an association between HRM and performance, even though their
analysis neither established causation nor concretely explained why that association exist.
In addition, behavioural models have been used to study perceptions of employees’
behavioural outcomes at work, group level performance and organisational outcomes
(Gould Williams 2010;Wright et al. 2003).
3.5.4 Organisational performance
The literature has widely covered the assertion that public sector organisations often have
several goals for which reason they are associated with multiple dimensions of
performance (Boyne 2003;Halligan et al. 2010). It is even claimed that for organisational
performance to be defined, conceptual frameworks of performance must be clearly
specified so that there can be consensus amongst relevant stakeholders over what
performance entails (Dess and Robinson 1984). However, Brewer and Selden (2000) claim
that difficulties involved in defining and measuring organisational performance in the
public sector is because most of the elements of performance are embroiled in serious
political discourses that makes it difficult to agree on what organisational performance
means. No wonder performance has become ubiquitous in discussions of organisational
strategies, planning, learning and regulation among others and yet, a universal definition of
the concept is lacking (Ashworth et al. 2010).
Consistent with the goal attainment model, organisational performance typically focuses
on the extent to which public and private agencies are able to deliver on their core
mandates by discharging appropriate administrative and operational functions in ways that
seek to achieve both short and long term goals (Kim 2005). It is also possible to assess
performance either internally or externally. Evaluating performance internally is often
64
based on appraising administrative processes such as employee performance of roles and
tasks while external performance assessment captures the perceptions and aspirations of
customers and stakeholders. Intra-organisational performance is often a feature of internal
control systems involving periodic evaluation of performance standards and how
operational objectives are achieved (Kloot and Martin 2000). Because different people
have divergent expectations in relation to what an organisations should achieve, Brewer
and Selden (2000) observe that such differences often result in disagreements amongst
stakeholders with respect to the most important criteria for assessing organisational
performance. This also influences perceptions about factors that drive organisational
performance.
For instance, many studies on organisational performance focus on financial performance
by assessing economy, efficiency and organisational effectiveness (Halligan et al., 2010).
In an extended input-output-outcome model, Boyne (2002) categorised the dimensions of
organisational performance into outputs, efficiency, effectiveness, responsiveness, and
democratic outcomes such as equity and fairness. Meanwhile, each of these variables could
be judged differently inside and outside public organisations depending on the interests of
whoever is evaluating performance. But there are certain limitations in using only
economy, efficiency, and effectiveness to explain organisational performance. For
example, the pursuit of economy, defined as the minimum cost of inputs is inadequate as a
measure of performance because organisational expenditure on staff, logistics and general
administration (all of which are inputs) can hardly show the quantity, quality or standard of
services delivered. In a LG context where outputs can be defined in terms of quantity and
quality of services, and outcomes in terms of the impact, equity and distribution of
services, it can be argued that neither the 3Es nor the Input-Output-Outcome (I-O-O)
model is able to sufficiently explain performance since they ignore citizens’ opinions about
performance in general and with regard to their satisfaction with service provision and
demand for probity and accountability in particular.
3.5.5 Government performance
There are various definitions of government but Stoker (1998) claims the concept is often
used to refer to institutional structures and formal processes that maintain public order and
facilitate collective action either at the sub national, nation state or supra-national levels.
Thus, how people feel about government performance depends on the level of government
65
at which they find themselves. This implies that citizens experience with agencies that
constitute the government machinery at the local government level influence their
perception of government performance (Morgeson and Petrescu 2011). Also, the status of
public administration may reflect government performance because it serves as the
medium through which the ‘social contract’ between government and citizens is mediated
and expressed.
After the Second World War, there was a perception that democratically elected
governments are likely to ‘perform’ better and in the interest of the citizenry. This led to
the proliferation of and support for the notion of good governance throughout the world
(Andrews 2008;Doornbos 2001). Advocates of ‘good governance’ maintain that it
promotes proper management of public resources, meaningful public engagement and
ultimately delivers outcomes that people cherish (Grindle 2007). Interests in government
performance has grown to the extent that politicians, policy makers, academics, citizens,
and aid agencies, including the World Bank have been working on indicators of
government performance (Kaufmann et al. 1999). One of such initiatives is the Brookings
Institution’s attempt to evaluate the performance of government institutions in the US
which was influenced by the Bank’s 1997 World Development Report (World Bank 1997).
Even though developing countries were encouraged to introduce assessment mechanisms
to improve upon the performance of their governments, very few, if any at all, was able to
undertake self-assessment (ibid). Today, most developing countries are battling with
increasing levels of citizens’ expectations and persistent demand for transparency,
accountability and improved municipal services from governments (World Bank 2003).
Some analysts contend that a proper analysis of government performance should focus on
the extent to which political pledges are fulfilled especially in relation to government
output (Yang and Rho 2007). However, the reality in many countries is that public opinion
about government performance is declining amidst scepticisms about the efficiency and
effectiveness of public organisations to deliver vital services. At the local level, the
consequences have led to deteriorating government-citizen relations, marked by revolts
which sometimes escalate into destructive political instability (Christensen and Lægreid
2005). To avoid this, attempts have been made in some countries to establish performance
standards for local governments to promote the direct provision of services to citizens. In
the UK for instance, citizens’ charters are used to hold local councils accountable for
certain services. In addition, league tables have been used to rank the performance of local
66
authorities under what was known as ‘comprehensive performance assessment’ and ‘best
value’ initiatives which provide information to the public about the status of their council’s
performance compared to other councils (Boyne. 2002). Similar performance
benchmarking initiatives in the US under the Government Performance and Results Act
(GPRA) and the Program Assessment and Rating Tool (PART) both published citizens
perceptions about the federal government’s performance to promote transparency and
accountability (Van Ryzin 2004). These mechanisms do create healthy competition
amongst local councils, pushing them to deliver quality services to the public.
3.6 Shifting from performance measurement to performance management.
Many studies use both performance measurement and performance management
interchangeably because performance measurement is fundamental to any performance
management system (Fryer et al. 2009;Lemieux-Charles et al. 2003;de Bruijn 2002b).
Meanwhile, some experts make a distinction between the two terms. For example, Radnor
and Barnes (2007) differentiate performance measurement as the quantitative or qualitative
assessment of inputs, outputs or outcomes of activities, events or processes from
performance management which is seen as a systematic utilisation of performance
information to improve organisational outcomes. This distinction implies that while
performance measurement is geared towards the utilisation of resources, mostly with
emphasis on efficiency, performance management appears much broader, offering a
holistic view of organisational effectiveness.
Thomas (2006) defined performance measurement as the regular generation, collection,
analysis, reporting and utilization of a range of data related to the operation of public
organisations and public programs. This allows data to be compared with preferred
performance norms and standards to determine whether an organization is moving in the
right direction or not. The distinction between performance measurement and performance
management is simplified by Lebas (1995) who claims that the former simply focuses on
the past whilst the latter uses information to make decisions for the future. Placing
emphasis on the utilisation of performance information, Bouckaert and Dooren (2002)
report that performance management signifies action whilst performance measurement
generates information. Hence, the collection of performance information is only a means to
an end – to manage performance. How performance management systematically improves
67
evidence-based decision making, continuous organizational learning and accountability is
something this study will explore.
From the foregoing discussion, two recurring themes resonate in the literature on
performance management and performance measurement. The first one suggests that both
performance management and performance measurement cannot be separated from
activities and processes related to organisational goals, specific objectives and standards of
performance. This supports the utilisation of performance indicators in performance
management systems (Greiling 2006). The second theme suggests that a good definition of
performance should entail both behavioural, technical, and procedural aspects of
measuring performance (Sonnentag and Frese 2002). This is mostly evident in
performance management systems as discussed in the next section.
3.6.1 What is a performance management system?
Performance management systems are information-based procedures used by individuals
and organisations to improve, sustain or revise organizational activities to achieve desired
objectives (de Waal 2006). Poister (2003) notes that performance management systems
take different shapes and sizes depending on the purpose for which they are created. This
ranges from those that monitor micro production processes or service delivery chains
within a particular agency to those that broadly focus on macro measures at the regional or
national level. It is believed that organisations that effectively implement performance
management systems are likely to perform better than those that do not (Rheem 1996).
This is because PMS can be designed to specifically improve upon productivity, quality of
services, and clients’ satisfaction with service delivery (Poister 2003).
Meeting these objectives is however not simple. For instance, performance management
systems, especially those developed under the guise of best-practice, are expected to be
multi-dimensional and aspire to achieve strategic objectives that reflect the concerns of all
stakeholders (Tangen 2005;Bouckaert and Halligan 2008). According to Carroll and
Dewar (2002), users of a performance management system need to clarify the level at
which performance is measured, evaluate the specific dimensions of performance, report,
disseminate and use performance information to compare actual performance to desired
levels. This is consistent with the core steps of a performance management system;
measurement, incorporation and use (Bouckaert and Halligan 2008). While performance
68
management systems are expected to satisfy at least one of these conditions if not all, the
purpose of a PMS particularly in the public sector must be geared towards achieving goals
and outcomes for both governments and the general public (Bouckaert and Halligan 2006).
This is why a good performance management system (so called best-practice) is expected
to contain a balanced set of factors that are critical for the success of the implementing
agency (Elzinga et al. 2009). The extent to which performance management systems of LG
in Ghana satisfy these requirements is something this study seeks to explore.
At the employee (micro) level, performance management systems could be designed to
clarify organisational objectives; assist in the management of individual employee
performance and plan relevant training and development programs. This means that PMS
could be linked to both short and long term vision and mission of the organisation
concerned. Briscoe and Claus (2008:15) conceive performance management systems as
‘instruments through which organisations set work goals, determine performance
standards, assign and evaluate work (tasks), provide performance feedback, determine
training and development needs and distribute rewards’. This ‘HRM’ notion of
performance management system may provide relevant information that motivates
appropriate professional conduct, encourage accountability, organizational learning and
create possibilities for service improvements (Neely 1998). These features present
performance management as a continuous process rather than a distinct event, reinforcing
the need for organisations to modify their strategies to attain successful outcomes in an
ever changing world (Bititci et al. 2006).
Indeed, several issues have been raised in the literature concerning how performance
management systems should be designed to capture relevant information for improved
performance. These debates are motivated and reinforced by opinions about the relative
strengths of using quantitative indicators against qualitative measures (Boyne
2002:29;Taylor 2007). Associated with these debates is the concern that concentrating
more on quantitative indicators at the expense of qualitative measures could undermine
other equally important goals of service providers (Jarrar and Schiuma 2007). The value of
using only quantitative indicators to boost the effectiveness of service organisations has
been questioned by some analysts who claim that using quantitative indicators alone may
focus on short term objectives to the neglect of long term organisational goals (Jarrar and
Schiuma 2007). Since performance measurement is inherently an important part of
performance management systems, it is expected that performance indicators would focus
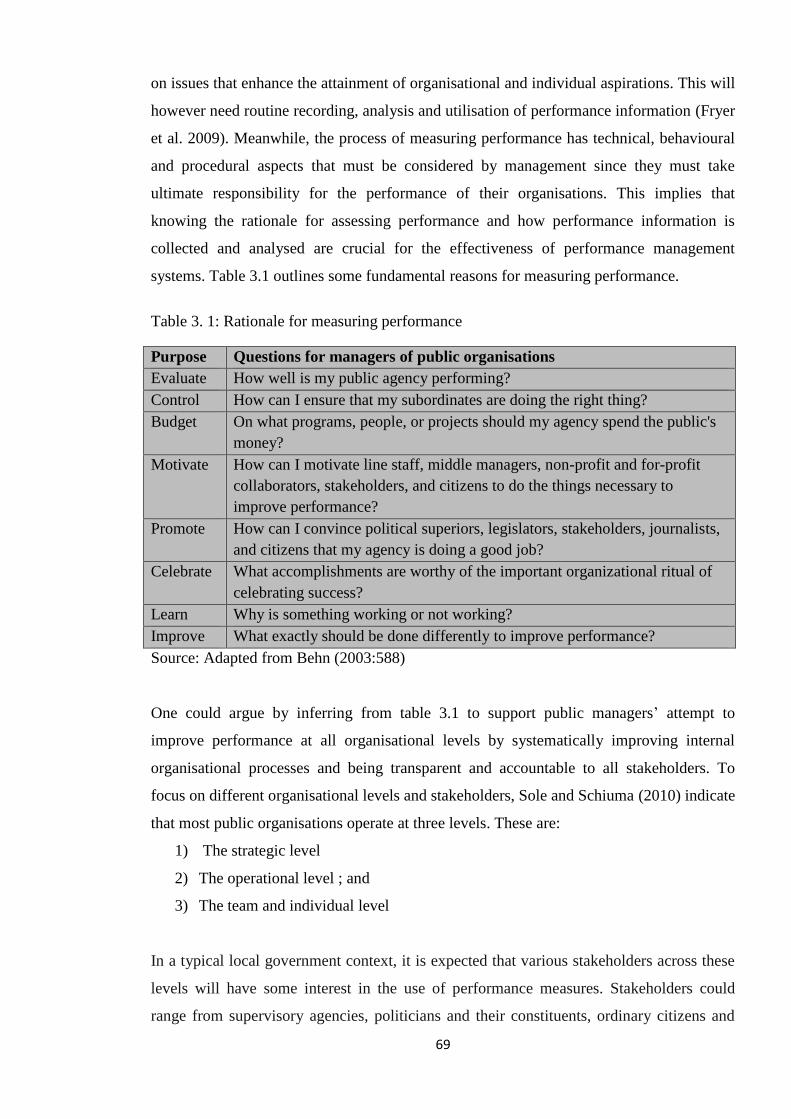
69
on issues that enhance the attainment of organisational and individual aspirations. This will
however need routine recording, analysis and utilisation of performance information (Fryer
et al. 2009). Meanwhile, the process of measuring performance has technical, behavioural
and procedural aspects that must be considered by management since they must take
ultimate responsibility for the performance of their organisations. This implies that
knowing the rationale for assessing performance and how performance information is
collected and analysed are crucial for the effectiveness of performance management
systems. Table 3.1 outlines some fundamental reasons for measuring performance.
Table 3. 1: Rationale for measuring performance
Purpose Questions for managers of public organisations
Evaluate How well is my public agency performing?
Control How can I ensure that my subordinates are doing the right thing?
Budget On what programs, people, or projects should my agency spend the public's
money?
Motivate How can I motivate line staff, middle managers, non-profit and for-profit
collaborators, stakeholders, and citizens to do the things necessary to
improve performance?
Promote How can I convince political superiors, legislators, stakeholders, journalists,
and citizens that my agency is doing a good job?
Celebrate What accomplishments are worthy of the important organizational ritual of
celebrating success?
Learn Why is something working or not working?
Improve What exactly should be done differently to improve performance?
Source: Adapted from Behn (2003:588)
One could argue by inferring from table 3.1 to support public managers’ attempt to
improve performance at all organisational levels by systematically improving internal
organisational processes and being transparent and accountable to all stakeholders. To
focus on different organisational levels and stakeholders, Sole and Schiuma (2010) indicate
that most public organisations operate at three levels. These are:
1) The strategic level
2) The operational level ; and
3) The team and individual level
In a typical local government context, it is expected that various stakeholders across these
levels will have some interest in the use of performance measures. Stakeholders could
range from supervisory agencies, politicians and their constituents, ordinary citizens and
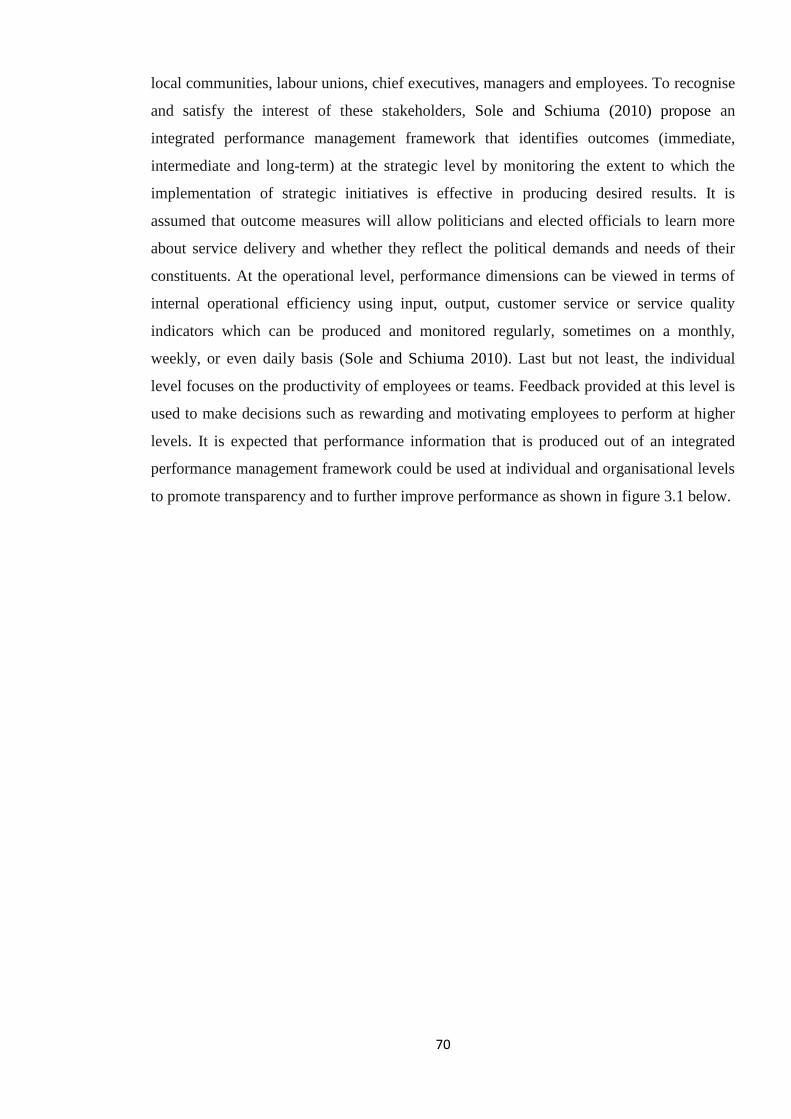
70
local communities, labour unions, chief executives, managers and employees. To recognise
and satisfy the interest of these stakeholders, Sole and Schiuma (2010) propose an
integrated performance management framework that identifies outcomes (immediate,
intermediate and long-term) at the strategic level by monitoring the extent to which the
implementation of strategic initiatives is effective in producing desired results. It is
assumed that outcome measures will allow politicians and elected officials to learn more
about service delivery and whether they reflect the political demands and needs of their
constituents. At the operational level, performance dimensions can be viewed in terms of
internal operational efficiency using input, output, customer service or service quality
indicators which can be produced and monitored regularly, sometimes on a monthly,
weekly, or even daily basis (Sole and Schiuma 2010). Last but not least, the individual
level focuses on the productivity of employees or teams. Feedback provided at this level is
used to make decisions such as rewarding and motivating employees to perform at higher
levels. It is expected that performance information that is produced out of an integrated
performance management framework could be used at individual and organisational levels
to promote transparency and to further improve performance as shown in figure 3.1 below.
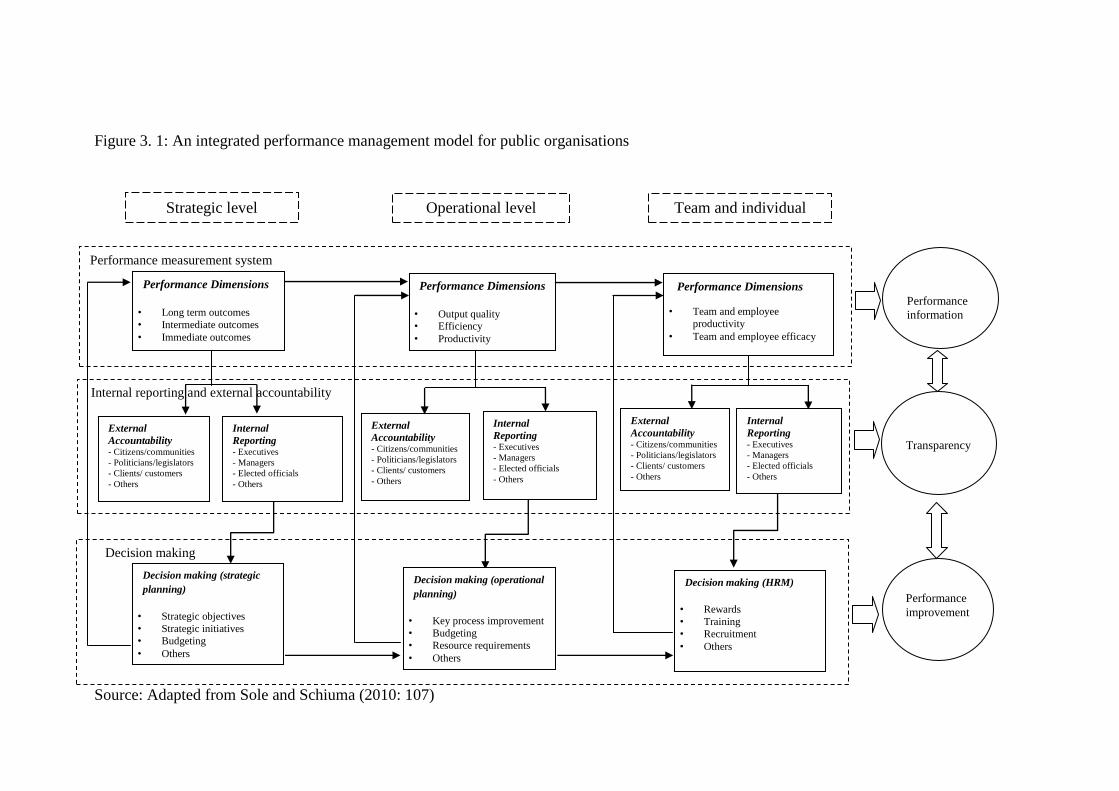
Decision making
Performance measurement system
Internal reporting and external accountability
Figure 3. 1: An integrated performance management model for public organisations
Source: Adapted from Sole and Schiuma (2010: 107)
Performance Dimensions
• Long term outcomes
• Intermediate outcomes
• Immediate outcomes
Performance Dimensions
• Output quality • Efficiency
• Productivity
Performance Dimensions
• Team and employee
productivity
• Team and employee efficacy
External
Accountability - Citizens/communities
- Politicians/legislators
- Clients/ customers
- Others
Internal
Reporting - Executives
- Managers
- Elected officials
- Others
Decision making (strategic
planning)
• Strategic objectives
• Strategic initiatives
• Budgeting
• Others
Decision making (operational
planning)
• Key process improvement
• Budgeting
• Resource requirements
• Others
Decision making (HRM)
• Rewards
• Training
• Recruitment
• Others
Performance
improvement
Transparency
External
Accountability - Citizens/communities
- Politicians/legislators
- Clients/ customers
- Others
Internal
Reporting - Executives
- Managers
- Elected officials
- Others
Internal
Reporting - Executives
- Managers
- Elected officials
- Others
External
Accountability - Citizens/communities
- Politicians/legislators
- Clients/ customers
- Others
Strategic level Operational level Team and individual
level
Performance
information
Whereas the performance management framework shown in figure 3.1 may be applicable
to different levels of an organisation, how to effectively implement a performance
management system remains a challenge for many managers. Poister (2003:23) claims that
having an effective PMS begins by securing the commitment of managers, clarifying the
purpose of the system and identifying outcomes and performance criteria. Similarly,
important factors to consider include ‘defining and evaluating indicators, developing data
collection methods, specifying the frequency and channels of reporting, determining
analytical and reporting formats and assigning responsibilities for maintaining and
modifying the system if necessary. Fulfilling these preconditions is necessary for the
effective utilisation, evaluation and modification of PMS over time.
An important contribution comes from Pollitt (2013) who proposes five elements to
explain the components of a PMS as shown in figure 3.2. The first component which
consists of the main object of the performance management effort could either be an
activity or a set of activities, interventions, programmes or policies. The second component
deals with measurement of one or more aspects of that activity. Thirdly, the measurement
generates different types of data, both quantitative and qualitative in nature. Fourth, the
data are interpreted and transformed into information to make them meaningful. Fifth and
perhaps the most important stage is when the information is ready for use, mis-used or not-
used by various stakeholders such as service delivery staff, managers, politicians, service
users, the media and the general public. This conception of a PMS is meaningful because it
highlights unavoidable decisions that must be considered while implementing a PMS
(Pollitt, 2013). For instance, it must be clear which aspects of the organisation’s work are
to be measured and which are not? Answering this question is important because it is
widely believed that what is measured gets more attention than what is not and that ‘what
is measured gets managed’(Smith 1995). In a local government context, it is even more
difficult to determine who is responsible for assessing performance: is it service providers,
their superiors, independent external evaluators or service users? Answers to these
questions have different implications for the purpose of evaluating performance. For
instance, if service providers assess themselves without recognising the opinions of service
users, there would be obvious dangers of bias (Talbot 2010). Meanwhile, regardless of
whose opinion counts, a performance management system is expected to have the
components shown in figure 3.2 below.
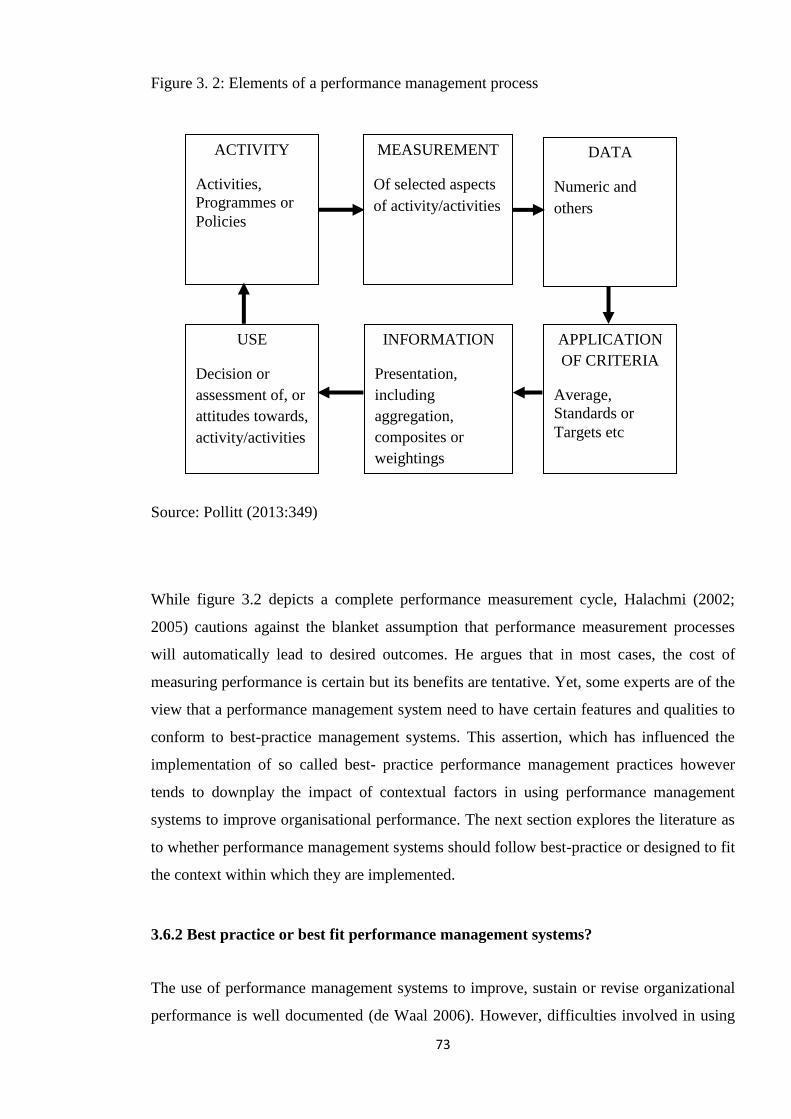
73
Figure 3. 2: Elements of a performance management process
Source: Pollitt (2013:349)
While figure 3.2 depicts a complete performance measurement cycle, Halachmi (2002;
2005) cautions against the blanket assumption that performance measurement processes
will automatically lead to desired outcomes. He argues that in most cases, the cost of
measuring performance is certain but its benefits are tentative. Yet, some experts are of the
view that a performance management system need to have certain features and qualities to
conform to best-practice management systems. This assertion, which has influenced the
implementation of so called best- practice performance management practices however
tends to downplay the impact of contextual factors in using performance management
systems to improve organisational performance. The next section explores the literature as
to whether performance management systems should follow best-practice or designed to fit
the context within which they are implemented.
3.6.2 Best practice or best fit performance management systems?
The use of performance management systems to improve, sustain or revise organizational
performance is well documented (de Waal 2006). However, difficulties involved in using
ACTIVITY
Activities,
Programmes or
Policies
MEASUREMENT
Of selected aspects
of activity/activities
DATA
Numeric and
others
USE
Decision or
assessment of, or
attitudes towards,
activity/activities
INFORMATION
Presentation,
including
aggregation,
composites or
weightings
APPLICATION
OF CRITERIA
Average,
Standards or
Targets etc
74
PMS to generate relevant and timely information for control and planning purposes have
led some experts to advocate for the adoption of best practices of managing organisational
performance (Tangen 2005). By aiming at highly preferred standards, targets and
benchmarks, it is believed that an organisation can become aware of its problems, learn
from them and set on the path to better performance (de Bruijn 2002a). The notion of
performance management ‘best practice’ is based on the assumption that certain universal
principles in developed countries can be mimicked by developing countries. This one-size
fits all agenda has been widely criticised in economic policy reforms under structural
adjustments in sub-Sahara Africa (SSA) where ill-conceived policies have failed
tremendously. In Ghana, the introduction and implementation of PMS supported by
international donor agencies is described as a typical best practice PMS.
The features of a best practice PMS are numerous. For instance, Crawford and Cox (1990)
have argued that performance must be assessed in ways that is easily understood by those
whose performance is being evaluated while others are of the view that performance
measures should be generated from strategic objectives of organisations to ensure that
employees’ tasks are consistent with organisational goals. At the organisational level, a
PMS that conforms to best practice is expected to provide timely, relevant and accurate
information with feedback mechanisms and consist of both financial and non-financial
measures (Kaplan and Norton 1992), express specific, measurable, achievable, realistic and
time bound (SMART) performance indicators as well as target short and long term results
(Tangen 2004). This way, PMS would not only provide relevant information but would
also support strategic, tactical and operational objectives (Tangen 2005). Advocates of best
practice PMS are often inspired by the experiences of others and may strive to benchmark
their performance against industry leaders or professional standards. While performance
benchmarking in itself could enable an organisation to creatively stand on its feet and work
towards greater heights, ‘benchmarking may degenerate into silly copying especially when
a best practice is simply transplanted from another organization’ (de Bruijn 2002a: 24).
Yet, studies have shown that regardless of superiority in design, the adoption and
implementation of PMS is not a panacea for organisational effectiveness (Halachmi 2005).
Even though managing organisations through performance measures has been on the
ascendancy, few studies especially in developing countries have explored the reasons why
some public organisations have utilised PMS better than others in translating metrics into
action (Taylor 2007;Therkildsen 2006). Driven by this gap in the literature, it is imperative
75
to examine the effects of a PMS at LG level in order to highlight the implications of failing
to incorporate very important contextual factors into its implementation. Bouckaert and
Halligan (2008) also make a case for best fit between organisations and their internal and
external environment. Such a fit is crucial because variations in terms of service delivery,
scope of policy, or level of government can be good reasons why performance
management systems should be adapted to suit any given context. Adaptation theorists
assume that because well-performing organisations adjust to their environment in order to
survive, PMS also need to be flexible and adjustable to suit the organisational environment
in order to have a lasting impact (Andrews 2010). This is crucial because many contingent
factors such as corporate culture, availability of resources and motivation to change can
undermine the usefulness of PMS (Tangen 2005).
Meanwhile, aligning PMS to achieve contextual fitness requires behavioural changes and
technical considerations. Behn (2002:9) argues that ‘It requires a complete mental
reorientation’. For instance, organisational norms and behaviours will be effective if it
produces high quality management, efficient allocation and utilisations of resources and
provide incentives that encourage a culture of performance. Also, technical factors
concerning measurement issues, the robustness of data and its quality and reporting format
must be considered. Integrating technical and behavioural issues into the PMS could create
the right performance climate, set realistic indicators to meet realistic expectations,
promote consensus in assessing performance and avoid perverse behaviour (Mayne 2007).
In sum, the best fit perspective suggests that for a PMS to be effective, there must be
sufficient degree of alignment of the PMS and the existing systems and strategies of the
organisation driven by leadership commitment; stakeholder involvement; continuous
monitoring, feedback, dissemination and learning from results (Wang and Berman 2001;de
Waal 2006).
3.7 Local government administration and service delivery in sub-Sahara Africa
Advocates of decentralisation and local governance claim it promotes ordinary people’s
participation in local development efforts (Robinson 2007). By off-loading responsibilities
to lower levels of government, decentralisation is expected to create space for the
participation of non- state actors, civil society and private businesses (Manor 1999). In
some countries, local government projects are aimed at reducing poverty; an important
goal that central government interventions have failed to achieve in most developing

76
countries (Manor 1999). It is also believed that not only will benefits in socio-economic
development accrue from more responsive and accountable local governments but that
relevant public services will be delivered to meet local needs (Awortwi 2011;Oyugi 2000).
However, studies on local governments’ contribution to the improvement of public service
delivery in Sub Saharan Africa presents mixed results (Conyers 2007). Some scholars have
argued that decentralisation has failed to provide the enabling environment for efficient
and effective delivery of essential services (Oyugi 2000;Ribot 2003). For example,
Fjeldstad (2001) found that majority of residents in local government areas in Tanzania
were dissatisfied with service delivery. Crook and Manor (1998) also reported that 70 per
cent of their respondents in Ghana claimed local governments failed to satisfy their social
needs, with 54 per cent in Côte d’Ivoire expressing similar views. Even in Uganda, where
local governance is perceived to be a shining example in Africa, its impact on service
delivery is inconclusive because improvements in education, health infrastructure and
social services, attributed to local councils have been challenged (Makara 2000). There are
instances where local governments have only tried to increase the number of infrastructure
to facilitate access to social services without addressing declining quality of services
despite central government’s transfer of additional funds to local governments for health,
education, agricultural extension, potable water and sanitation (Conyers 2007;Robinson
2007).
In many countries, the inability of local government to effectively provide public services
has led to the adoption of alternative mechanisms such as developing partnerships with
private sector agencies and non-governmental organizations to meet the needs of the
general public. In what appears to be influenced by neo liberal market ideals embedded in
the new public management discourse, these relationships aim at achieving effective
service delivery through co-production, contracting/out-sourcing, franchising, or a
combination of these. Yet, not all of these arrangements have produced positive results
such as improving service delivery, efficiency and value for money (Awortwi 2004). This
makes it imperative to understand fundamental conditions that explain the overall
performance of local authorities. Some of these are discussed in the next section.
77
3.7.1 Determinants of local government performance
Several factors account for the performance of LGs but commonly cited ones often include
but not limited to environmental factors, organisational structures, legal and regulatory
regimes, leadership, vision, strategy, financial resources and culture (Crook and Manor
1998). Previous studies on the determinants of local government in sub Saharan Africa
focused on contextual, environmental and political economy considerations. For example,
Olowu and Smoke (1992) compared local governments in Lagos, Nigeria to another one in
Gokwe, Zimbabwe and concluded that the size of local government authorities were
crucial for their revenue generation capacity as well as general performance. They
concluded that local governments in urban areas performed better than their rural
counterparts due to substantial revenue mobilised from the local base; something rural
municipalities could only match when they are endowed with natural resources.
In spite of these, one key factor that arguably has been identified for having an over
bearing influence on how local governments perform their statutory functions is related to
the clarity of the legal framework within which they operate. Whilst the legal framework
define roles, powers and responsibilities of local government, it is expected, under ideal
circumstances, to reduce central government’s interference in local affairs since central-
local government relations that are progressive rather than predatory will be a prerequisite
for the performance of local government authorities (Crook 2003).
In addition, there is consensus in the public management literature that management plays
a central role in organisational performance, and that effective performance management
systems require proactive organisational leadership that is committed to accomplishing
organizational goals. Sangner (2008) argues that leadership that is empowering, flexible
and decisive are key requirement for local government authorities that seek to improve
upon their performance and accountability to citizens. Leadership is also found to be
important for the establishment and sustenance of performance management systems
(Melkers and Willoughby 2005). In some jurisdictions, sustained leadership and political
commitment are linked to high levels of local government performance especially when
those local authorities are led by proactive and result oriented managers who substitute
rigid rules for flexibility, innovation and learn from experience (Moynihan and Ingraham
2003).
78
3.8 Performance management and service delivery: A public service motivation
perspective
There are several definitions of Public Service Motivation (PSM). Perry and Wise (1990)
originally defined PSM as “a predisposition to respond to motives grounded primarily or
uniquely in public organizations” (p. 368). Based upon this concept, Perry (1996)
developed a measurement process which measures PSM based on: people’s attraction to
public policy-making, commitment to the public interest, compassion and self-sacrifice.
Brewer and Selden (1998: 417) described PSM as “a motivational force that induces
individuals to perform meaningful public service such as community or social service”.
Rainey and Steinbauer (1999:20) refer to it as “a general, altruistic motivation to serve the
interest of a community of people, a state, a nation or humankind”. Similarly,
Vandenabeele (2007:549) refers to PSM as “the belief, values and attitudes that go beyond
self-interest and organizational interest, that concern the interest of a larger political entity
and that motivate individuals to act accordingly whenever appropriate”. Also, Perry and
Hondeghem (2008) see PSM as “an individual’s predisposition to deliver services with a
purpose to do good for others and society. Underpinning all these definitions is the view
that certain incentives activate specific motives in people that guide their behaviour in a
specific direction, especially in providing a public service.
Advocates of PSM argue it has a positive effect on organisational performance and that
highly public service motivated individuals perform well because they work to provide
services they perceive as meaningful for other people (Rainey and Steinbauer 1999).
According to Moynihan and Pandey (2007), organizational factors such as the reduction of
hierarchy, red tape and goal clarity have a positive effect on PSM. Some experts have
hypothesized that people who feel motivated to serve the public value monetary incentives
less compared to private sector employees (Houston 2000;Buelens and Van den Broeck
2007). However, Gabris und Simo (1995) are sceptical about this hypothesis because they
found no difference between the motives of employees in the public and private sectors in
their study. On the contrary, some analysts are cautions in making conclusive connections
between PSM and organisational performance arguing that the relationship between PSM
and performance is more complex than originally expected and that contextual factors need
to be included in the PSM - performance analysis (Wright and Pandey 2008). For this
reason, it would be imperative to explore how and what motivates LG managers and

79
bureaucrats to comply with the requirements of the DDF FOAT and whether their motives
enhance other values when delivering basic services.
This is particularly important in a local government context where the ultimate goal of a
performance management system is to facilitate the provision of services for the broader
public good. However, in a critique to the presumption that public organizations provide
sufficient opportunities to satisfy the motivation of staff to serve the public, Wright and
Pandey (2008) observe that people do not necessarily activate such opportunities. This
study attempts to further explain and understand public service motivation in the context of
other parallel incentives. It does so in a performance management context, by exploring
factors underlining how and why LG managers comply with eligibility requirements for
performance based grants and the use of performance information before and after
performance assessments. Since LGs are responsible for the total development of their
areas of jurisdictions, the PSM will be important to understand whether services delivery is
based upon public service values or on some other forms of rewards associated with the
performance management system. Understanding these issues is important because of a
number of interrelated reasons. For instance, exploring the existence or absence of PSM
amongst LG managers and civil servants will be useful in identifying mechanisms needed
to mainstream PSM into an organisation that has a constitutional mandate to serve the
public good. This is especially important given the use of incentives to create and probably
sustain a culture of performance in LGs in Ghana.
3.9 Exploring the failure of performance management systems
Contrary to the expectation that managing organisational performance would automatically
yield desired results, some studies have shown the opposite with researchers claiming that
70% of performance measurement initiatives often fail (McCunn 1998). Failure of PMS
can be categorised on the basis of organisational context, processes and content of
managing performance systems (Bourne et al. 2002). There are however several cross-
cutting reasons accounting for the failure of PMS. For example, shortcomings in the design
of PMS such as failing to specify performance goals due to multiple and conflicting
objectives could also be contextual in nature (Heinrich 2002). Similarly, contextual factors
such as organisational climate and cultural values as well as general political and economic
conditions may affect the implementation of performance management systems in both
private and public sector organisations. Furthermore, high costs and the inability of
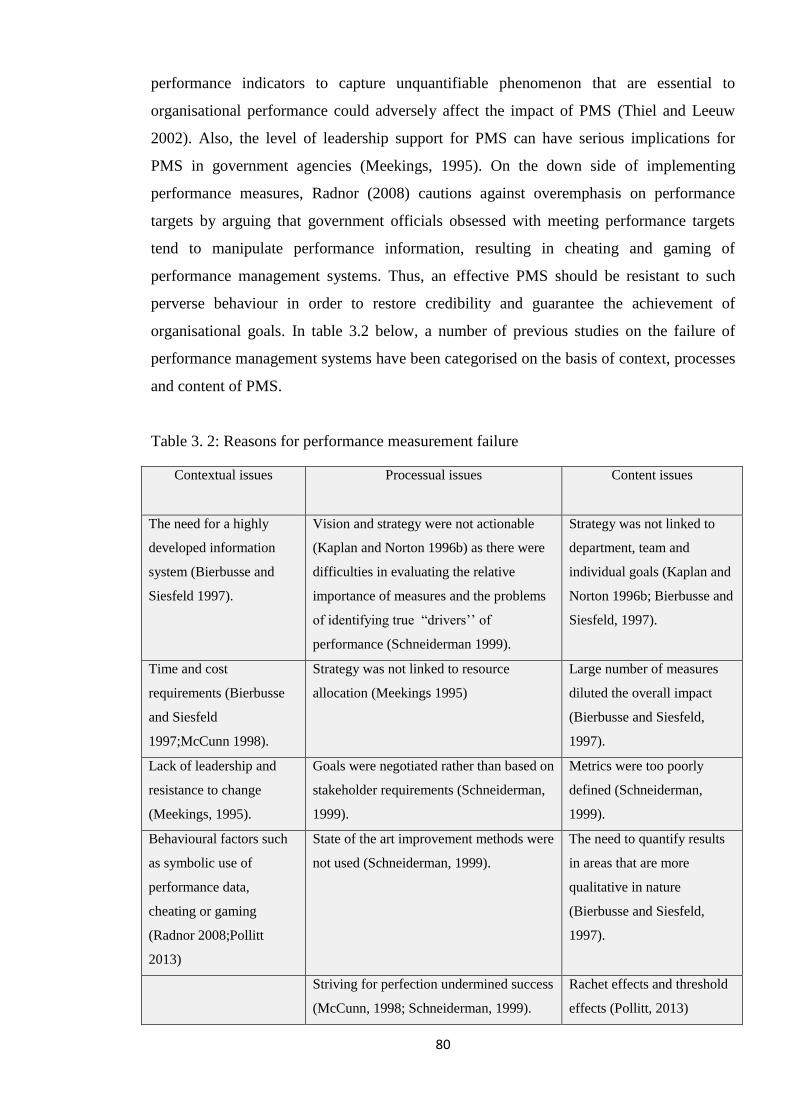
80
performance indicators to capture unquantifiable phenomenon that are essential to
organisational performance could adversely affect the impact of PMS (Thiel and Leeuw
2002). Also, the level of leadership support for PMS can have serious implications for
PMS in government agencies (Meekings, 1995). On the down side of implementing
performance measures, Radnor (2008) cautions against overemphasis on performance
targets by arguing that government officials obsessed with meeting performance targets
tend to manipulate performance information, resulting in cheating and gaming of
performance management systems. Thus, an effective PMS should be resistant to such
perverse behaviour in order to restore credibility and guarantee the achievement of
organisational goals. In table 3.2 below, a number of previous studies on the failure of
performance management systems have been categorised on the basis of context, processes
and content of PMS.
Table 3. 2: Reasons for performance measurement failure
Contextual issues
Processual issues
Content issues
The need for a highly
developed information
system (Bierbusse and
Siesfeld 1997).
Vision and strategy were not actionable
(Kaplan and Norton 1996b) as there were
difficulties in evaluating the relative
importance of measures and the problems
of identifying true “drivers’’ of
performance (Schneiderman 1999).
Strategy was not linked to
department, team and
individual goals (Kaplan and
Norton 1996b; Bierbusse and
Siesfeld, 1997).
Time and cost
requirements (Bierbusse
and Siesfeld
1997;McCunn 1998).
Strategy was not linked to resource
allocation (Meekings 1995)
Large number of measures
diluted the overall impact
(Bierbusse and Siesfeld,
1997).
Lack of leadership and
resistance to change
(Meekings, 1995).
Goals were negotiated rather than based on
stakeholder requirements (Schneiderman,
1999).
Metrics were too poorly
defined (Schneiderman,
1999).
Behavioural factors such
as symbolic use of
performance data,
cheating or gaming
(Radnor 2008;Pollitt
2013)
State of the art improvement methods were
not used (Schneiderman, 1999).
The need to quantify results
in areas that are more
qualitative in nature
(Bierbusse and Siesfeld,
1997).
Striving for perfection undermined success
(McCunn, 1998; Schneiderman, 1999).
Rachet effects and threshold
effects (Pollitt, 2013)
81
Source: Adapted from Bourne et al (2002)
3.10 Conclusion
This chapter explored relevant literature with the aim of identifying gaps in relation to
local governments’ use of performance management practices to facilitate organisational
performance. It began with a discussion of the evolution of performance management and
what the concept of performance means in the context of public organisations. The chapter
highlighted the multiple interpretations of performance and controversies associated with
its interpretation. It also explored theoretical perspectives for managing local government
performance as well as plausible levels and scope for analysing performance within the
public sector. The review suggests that different perspectives such as the goal attainment
model, competing values or multiple constituency models are embedded in managing
organisational performance.
In this chapter, a distinction is made between performance measurement and performance
management in the public sector. In typical service delivering organisations, the review
suggests organisational performance can be analysed at strategic, operational and
individual levels, each of which has its own reporting and accountability mechanisms and
decision making outcomes. Yet, within an integrated performance management
framework, it is important to understand how the interests of different stakeholders,
especially service users, are integrated into the design and implementation of the
performance management system. Also, and perhaps more importantly, it is imperative to
understand whether and how performance information is used to perform the core
functions of local governments. However, in the context of sub Saharan Africa, the chapter
revealed that the performance of local governments leaves much to be desired given the
extent of citizens’ dissatisfaction with local governments particularly due to poor service
delivery. Clearly, while adopting and implementing performance management systems
could be a step in the right direction, a lot is expected from LGs to harness and create the
necessary factors such as results oriented and visionary leadership, effective organisational
structures, workable strategies, performance culture and mobilise sufficient financial
resources in order to perform to the satisfaction of their ‘constituents. The next chapter
presents a research framework that defines the boundaries of this study.
82
Chapter 4: Research framework
4.1 Introduction
Without a research framework, researchers are at risk of describing the phenomenon under
study without bringing out its deeper meaning (Hartley 1994). For this reason, this section
presents the framework for the study by mapping out specific research questions to
concepts derived from literature that would be explored further using primary data to
achieve the objectives of the study. This implies that the research framework defines the
boundaries of the study and raises key issues relating to specific research questions to
explain and illustrate the linkages between questions and core components of the study. As
illustrated in figure 4.2, the research framework also maps out the boundaries and key
elements of this research.
4.2 First research objective and corresponding research questions
The first objective of the study seeks to identify and explore the nature and role of
performance management practices of local governments in Ghana to understand what
influence organisational performance. Two specific research questions are used to address
this objective: (1) how do local government authorities evaluate and manage
organisational performance in Ghana? and (2) what core issues within the national policy
space influence the management of local government performance? It is important to note
that the search for answers to these questions recognises the fact that local government
authorities throughout the world are increasingly challenged to prove to citizens and the
central government that their work is being done well. This requires LGs to showcase their
performance with respect to internal organisational processes, service outputs and
outcomes such that making performance information available to the public can help them
become operationally effective, transparent and accountable to their constituents (Sanger
2008). Yet, there is no consensus on the best way of evaluating LG performance given that,
“The task of measuring and assessing performance in local government depends very much
on who you are, what you want and where you stand in the scheme of things” (Jackson
1984 : 25). This in part explains why in places where performance management systems
have been used to improve organisational performance, there have been different
approaches about the way such systems should be designed to achieve expected results
83
(Charbonneau 2011). Whilst some experts contend that performance management systems
should follow best-practices borrowed from experiences in developed countries, others
advocate for systems that best-fit in a particular environment (Mayne 2007). The
popularity of best-practices has been influenced by national policy initiatives such as the
American Governments’ Performance and Results Act and the Program Assessment Rating
Tool (Radin 2006) and the United Kingdom’s Comprehensive Performance Assessment
and Best Value regimes (Boyne et al. 2002b). In all these policy initiatives, central
government played a significant role in formulating them even though they were
implemented at local government level. The principles of these initiatives have influenced
similar policy initiatives in developing countries without paying particular attention to the
local context. In the case of Ghana, it would be of theoretical and practical interest to
explore internal and external mechanisms for managing local government performance and
determine whether national development policy influences performance management
practices of local governments without focusing on local contextual factors that may affect
perceived LG performance.
4.3 Second research objective and corresponding research question
The second research objective aims at analysing the District Development Facility; a
recent performance enhancing policy initiative, to appreciate the extent to which
performance indicators under this performance management framework cover multiple
dimensions of local government performance as well constituents at the local level. In
order to achieve this objective, the study attempts to answer a specific research question,
notably; in which way does performance enhancing policy address multiple perspectives of
local government performance? The objective and research questions are against the
backdrop that any performance management system that seeks to improve organisational
performance in the public sector must recognise multiple dimensions and stakeholders
involved in evaluating organisational performance. This implies that such a system should
encourage stakeholder involvement, continuous monitoring and learning from results
(Thomas 2006). It is believed that a good performance management framework should be
reliable, balanced and resistant to negative behaviour and perverse consequences such as
gaming, cheating and falsification of performance information (Bouckaert and Peters
2002;Tangen 2005). Thus, widening the scope of assessing LG performance by
incorporating the view of different constituents is said to have more utility when it
84
combines quantitative and qualitative indicators to assess service delivery targets
(Verbeeten 2008).
With respect to the second objective of this study, Kaplan and Norton (1992) Balance
Scorecard (BSC) concept is used as a guide to investigate the scope of performance
indicators under the new performance enhancing policy. The BSC is relevant and
appropriate given the inherent limitations of conventional models for conceptualising
performance. For example, the 3 Es (economy, efficiency and effectiveness) and IOO
(input-output-outcome) models are widely used to analyse organisational performance but
they do not address non-financial dimensions of performance such as the responsiveness of
organisations to public preferences. As Boyne (2002) noted, efficiency, economy and
effectiveness can be achieved within public sector organisations but their value will be
meaningless unless they meet public demands. Also, it is argued that since these models
are not balanced, they less likely emphasise the interests of multiple stakeholders (Talbot
1999). To Boyne (2002) placing the interests of both internal and external stakeholders
side by side is imperative because the satisfaction of the former could be a prerequisite for
the latter’s satisfaction.
Using the Balance Scorecard to specifically analyse the scope of performance indicators in
this research seeks to make an original contribution in terms of assessing organisational
performance. This builds on the value of the BSC as a framework that has redefined the
traditional view of interpreting organisational performance by combining financial and
non-financial dimensions of performance. A typical BSC has four components: a financial
perspective, an internal process perspective, client’s perspective and a learning and
innovation perspective (Kaplan and Norton 1992; 2000). In its original form, the financial
perspective is used to inform shareholders about the financial status of their organisations
which might focus on profitability, sales or return on investments among others. The
internal process perspective focuses on operational effectiveness, the customer perspective
aims at improving clients’ satisfaction and last but not least, the learning and innovation
perspective explores mechanisms for continuous improvement and value creation (Kaplan
and Norton 1992). Figure 4.1 below illustrates the original BSC framework.
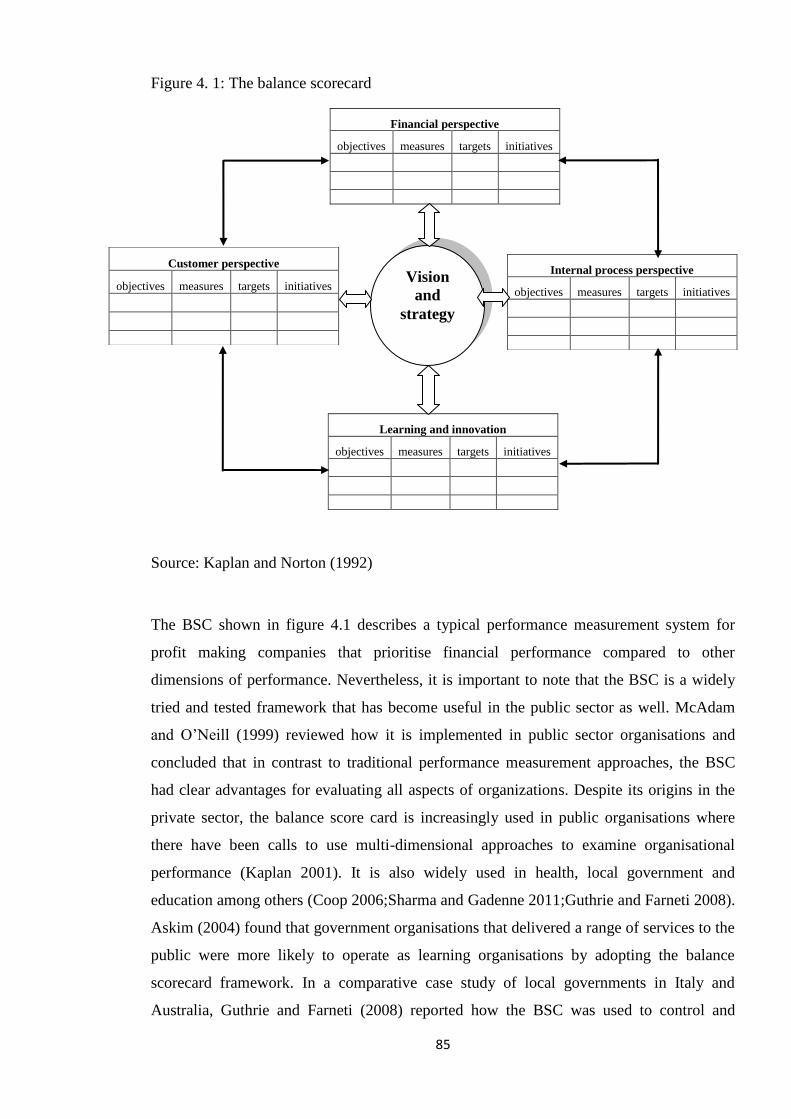
85
Figure 4. 1: The balance scorecard
Financial perspective
objectives measures targets initiatives
Source: Kaplan and Norton (1992)
The BSC shown in figure 4.1 describes a typical performance measurement system for
profit making companies that prioritise financial performance compared to other
dimensions of performance. Nevertheless, it is important to note that the BSC is a widely
tried and tested framework that has become useful in the public sector as well. McAdam
and O’Neill (1999) reviewed how it is implemented in public sector organisations and
concluded that in contrast to traditional performance measurement approaches, the BSC
had clear advantages for evaluating all aspects of organizations. Despite its origins in the
private sector, the balance score card is increasingly used in public organisations where
there have been calls to use multi-dimensional approaches to examine organisational
performance (Kaplan 2001). It is also widely used in health, local government and
education among others (Coop 2006;Sharma and Gadenne 2011;Guthrie and Farneti 2008).
Askim (2004) found that government organisations that delivered a range of services to the
public were more likely to operate as learning organisations by adopting the balance
scorecard framework. In a comparative case study of local governments in Italy and
Australia, Guthrie and Farneti (2008) reported how the BSC was used to control and
Customer perspective
objectives measures targets initiatives
Internal process perspective
objectives measures targets initiatives
Learning and innovation
objectives measures targets initiatives
Vision
and
strategy

86
manage internal processes. Coop (2006) in a BSC study on mental health service in New
Zealand observed that performance indicators for each component was central to the
quality of clinical outcomes and productivity among others, while managers that
implemented the BSC achieved better results by demonstrating and implementing
principles and initiatives of change management. Moreso, these studies suggest that the
most important incentive for organisations to adopt the BSC transcend its capacity as an
instrument for implementing strategy. This is because organisations are more likely to be
motivated by the potential of the score card to clarify their mission and to narrow the gap
between abstract aspirations and performance strategies with their daily operational
activities (Kaplan and Norton 2001b;Kaplan and Norton 2001c).
Today, the BSC has evolved from being a mere performance measurement tool to a
performance management framework that is extensively used across different disciplines
and professional fields (Kaplan and Norton 2001b). Advocates of the BSC believe the
practical relevance of the framework is maximised by its success as a performance
management framework and as a method for implementing strategy (Kaplan 2001;Kaplan
and Norton 2001b;Kaplan and Norton 2001c). Kaplan (2001) has further argued that using
the BSC to assess non-profit or governmental organisations can help managers to:
1. Clarify and translate vision and strategy;
2. Communicate and link strategic objectives and measures;
3. Plan, set targets, and align strategic initiatives; and
4. Enhance strategic feedback and learning
As shown in figure 4.1 above, the BSC can be used as a strategic management tool because
it puts strategy and vision, rather than control at the heart of the performance management
system (Kaplan and Norton 1992). Even though local governments in Ghana are not
known for implementing Kaplan and Norton’s balance scorecard, the theory of the BSC is
applied to establish the extent to which local government performance management
broadly considers multiple dimensions of organisational performance. The BSC is adapted
in such a way that the original clients’ perspective is replaced by citizens’ perspective
which is placed above other perspectives because local government’s core business is to
serve the general public (see figure 7.2, page 169). Given the underlying mission-driven
logic of the BSC, performance indicators would be expected to reflect each of the four
87
perspectives in order to contribute to the achievement of local government mission while at
the same time, satisfying citizen’s needs and expectations. In a local government context,
there are several reasons why an understanding of public opinion about LG performance is
important. Ho and Coates (2004) observe significant changes in the perception of local
government officials in relation to departmental procedures, organisational norms and
managerial practices because the PMS fully incorporated citizens’ views. They also found
that when local government officials’ collaborated with citizens to develop performance
indicators, it gave political credibility to the performance management regime and
increased the likelihood of using performance information for strategic decision making. A
typical example is the best value performance management framework for local
governments in the United Kingdom which emphasises local choice, local accountability
and seek to create an environment for promoting continuous improvement (Rashid 1999).
If the performance management system in Ghana is to challenge old ways of assessing
performance, then it must be effective at individual, service and organizational levels.
Therefore, it will be of theoretical and practical interest to determine whether performance
indicators under the recent performance enhancing policy, (the District development
facility and the functional organisational assessment tool) broadly addresses multiple
perspectives of evaluating organisational performance.
4.4 Third research objective and corresponding research questions
The third objective of this study is to examine how local government managers utilise
performance information to improve social service delivery and to understand factors that
affect performance information use. Two specific questions are stated to find answers that
will help achieve this objective. They are as follows: (1) To what extent will local
government managers use performance management practices to improve service
delivery? and (2) what drives the use of performance information within local government
authorities in Ghana? Previous studies have shown that understanding the rationale for
generating performance information is as important as knowing why such information is
used or not used since the importance of any PMS depends on its decision making value to
its users (Taylor 2011). According to Ammons (2002), a good performance management
system inspires managerial thinking by providing performance information that cannot be
ignored. It is therefore essential to know how and why LGs translate performance
information to satisfy short and long term objectives as well as reasons that might affect
the effectiveness of their PMS. Given that studies have identified factors such as
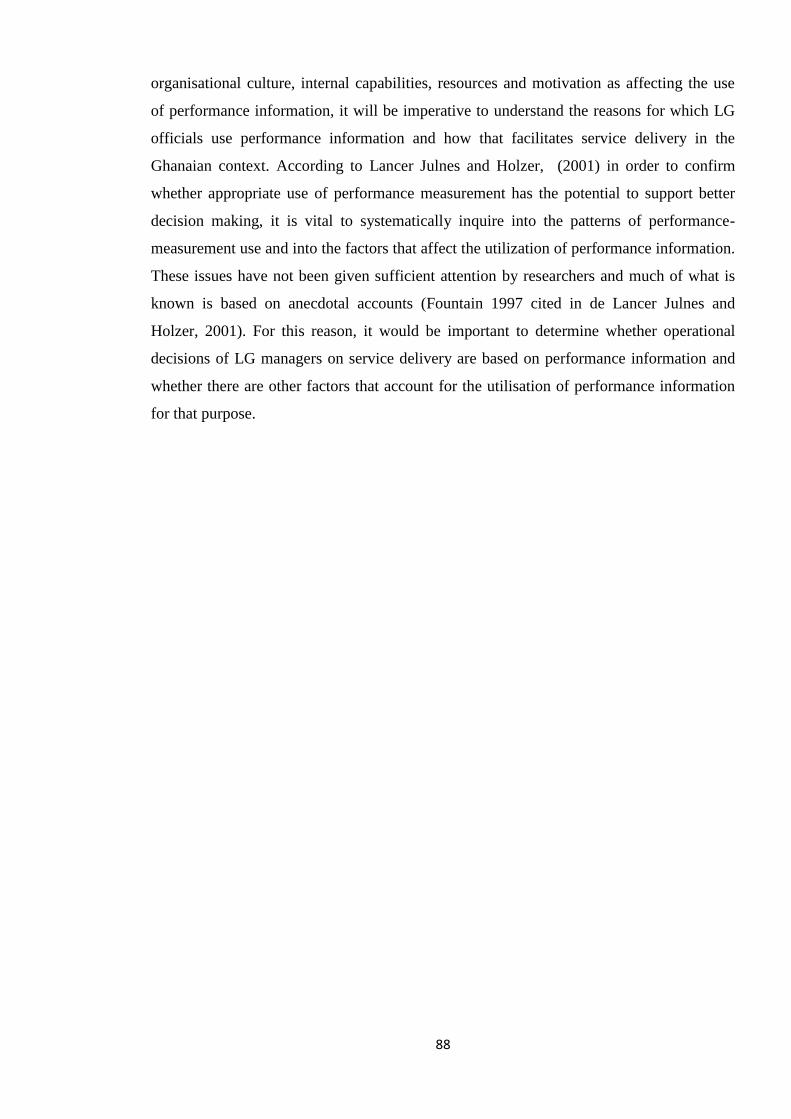
88
organisational culture, internal capabilities, resources and motivation as affecting the use
of performance information, it will be imperative to understand the reasons for which LG
officials use performance information and how that facilitates service delivery in the
Ghanaian context. According to Lancer Julnes and Holzer, (2001) in order to confirm
whether appropriate use of performance measurement has the potential to support better
decision making, it is vital to systematically inquire into the patterns of performance-
measurement use and into the factors that affect the utilization of performance information.
These issues have not been given sufficient attention by researchers and much of what is
known is based on anecdotal accounts (Fountain 1997 cited in de Lancer Julnes and
Holzer, 2001). For this reason, it would be important to determine whether operational
decisions of LG managers on service delivery are based on performance information and
whether there are other factors that account for the utilisation of performance information
for that purpose.
89
Figure 4. 2: Research framework
Authors’ construct, 2014
Based on local government functions
Internal mechanisms of managing performance
External mechanisms of managing performance
The role of national development policy
RQ 1: Understand
how LGs manage
performance
RQ2: Examine how
national policy affects
performance
management of local
governments
Based on the District Development Facility-Functional
Organisational Assessment Tool
Financial perspective
Internal process perspective
Citizens’ perspective
Learning and innovation
RQ 3: Analyse the
scope of performance
indicators under the
performance
enhancing policy
initiative
Based on perspectives of LG Managers and FGDs
Performance culture
Determinants of performance information use
Citizens’ perceptions of LG performance
Basic education
Sanitation and waste management
RQ 4: Examine how
LG managers use
performance
information to improve
service delivery
RQ5: Identify factors
that influence the use
of performance
information
90
4.5 Conclusion
This chapter has presented the research framework for the study. It outlined three (3)
specific research objectives and five (5) research questions that are used to guide the study.
For example, in order to achieve the first research objective of identifying and exploring
mechanisms for managing local government performance in Ghana, and to understand
whether there are contextual factors within the national policy field that influence LGs’
performance management practices, emphasis would be placed on internal and external
mechanisms that shape performance management practices of local government authorities
by recognising the impact of national development policy in this regard. With respect to
the second research objective of examining the scope of performance indicators under a
recent performance enhancing policy, Kaplan and Norton’s (1992) influential balance
scorecard framework would be adapted to analyse the extent to which performance
indicators cover multiple dimensions of local government performance. It is anticipated
that using the principles of the balance scorecard to scrutinise performance indicators
would significantly illuminate a new and better way of evaluating LG performance in
Ghana. Last but not least, the research framework shows that answers to the fourth and
fifth research questions that aim at achieving the third research objective would be based
on the perspectives of local government managers who play a key role in allocating
resources and influencing decisions on social service delivery in particular and local level
development in general.
91
Chapter 5: Research design and methodology
5.1 Introduction
This chapter broadly presents the methodology used in the study. It explains the underlying
reasons for adopting a qualitative approach. It also discusses the philosophical foundations
of the study and the research design which explains the research strategy and specific
methods employed to collect data. Furthermore, the details of field work carried out in
Ghana are elaborated to provide insights into the data collection process. The chapter also
explains how data was analysed to generate research findings as well as ethical concerns
that guided the study.
5.2 Justifying the choice of qualitative approach
Understanding empirical phenomenon is often influenced by philosophical and
methodologically preferences of researchers in their attempt to advance knowledge. These
preferences govern their underlying philosophies about truth and reality. Some of these
philosophies are expressed in, and reinforced by broad debates about quantitative versus
qualitative approaches to research. Even though this dichotomy means different things to
different people, it is believed that quantitative approaches are characterised by principles
that support the existence of an objective reality which can be dissociated from the
researcher’s own values. On the other hand, qualitative research paradigm acknowledges
the value laden nature of social inquiry and stresses that reality is socially constructed.
Advocates of qualitative research are convinced that knowledge production should be
flexible and sensitive to the social context within which data are generated rather than
relying on rigid, remote and inferential methods (Denzin and Lincoln 2005).
For this reason, qualitative research strategies capitalise on the relationship developed
between researchers and their subjects of study to understand the meaning individuals and
groups ascribe to social phenomenon and social problems (Punch 2005). It is therefore
somewhat ironic that whereas quantitative researchers tend to challenge their qualitative
colleagues for being overly dependent on impressionistic data that can neither produce
objective nor reliable knowledge, the persistent growth and proliferation of qualitative
research is seen by its proponents as a response to the weaknesses of traditional
92
quantitative approaches that have dominated many social science disciplines until the past
few decades (Sandberg 2005). This view is supported by arguments that have emerged
amongst quantitative researchers themselves, whereby some ‘post-positivists’ have cast
doubts on the traditional notion of absolute truth of knowledge particularly in the study of
social phenomenon and human behaviour (Denzin and Lincoln 2005). It is therefore
difficult to think of a field of study in contemporary social science that has not been
influenced by the ‘qualitative wave’ of thinking.
Hence, it is less surprising that management and organisational research which produces
knowledge about human action within and between organisational structures and how they
affect society has not been able to escape from the influence of these two dominant strands
of research. While this observation is quite true, qualitative research has further gained
ground on the basis that traditional positivist claims to objective knowledge have severe
theoretical limitations that do not allow deeper understanding of human behaviour and
organisational phenomenon (Lincoln and Denzin 2003;Prasad and Prasad 2002). To
overcome this weaknesses, proponents of interpretive approaches contend that research on
organisations should consider the ‘lived experiences’ of individual members of
organisations or their clients as the basis of empirical knowledge (McCormack
2000;Prasad and Prasad 2002). As a result, this study is built on the knowledge of local
government officials, elected representatives, heads of departments as well as participants
of focus group discussions in the selected local government authorities. Given the
complexity and multidimensional nature of organisational performance, the information
generated from officials would be triangulated with the perspectives of service users in
local communities. Analysing the information generated from these interactions will make
it possible to interpret local government performance as conceived by the research
participants.
5.3 Philosophical orientation of the study
There is consensus that producing knowledge through research has philosophical
underpinnings. In organisational studies just as any typical social science discipline, there
are different perspectives to creating knowledge and for understanding reality. These are
often referred to as philosophical paradigms (Lincoln and Guba 2000). To Kuhn (1970), a
paradigm refers to a collection of underlying beliefs, values, and techniques shared by
members of a given community. Kuhn’s notion of paradigms is so influential that some
93
scholars argue that social science researchers must emphasise their choice of research
paradigm over research methods since the former influences the latter (Lincoln and Guba
2000). Paradigms are useful because of the assumptions they make about ontology,
epistemology and methodology (Jacobs and Manzi 2000). To Denzin and Lincoln (2005),
ontology refers to fundamental assumptions about reality whilst epistemology relates to the
forms, nature and origin of knowledge that also clarifies how knowledge is produced.
More generally, methodology refers to the constellation of coherent assumptions expressed
in the form of specific methods or procedures that are employed to understand a
phenomenon. These perspectives shape people’s understanding of social phenomena and
their worldviews. As the foundation of knowledge, paradigms justify how researchers
interpret reality. This has often led to unending debates about whether an objective reality
exists or whether reality is only constructed and derived through social interpretations
(Tronvoll et al. 2011).
Four broad paradigms are dominant in organisational studies. These are functionalist,
interpretivist, radical structuralist and radical humanists perspectives (Burrell and Morgan
1979). According to Hardy and Clegg (1997), the popular paradigms are either normative,
interpretive, critical or postmodern approaches to organisational studies. To Alvesson and
Deetz (1996), the normative approach in organizational studies maintains a harmonious
relationship with the existing social order that is geared towards establishing law-like
relations between phenomena under study. The approach also emphasises ‘scientific,
neutral and objective styles of doing research often associated with the method of
positivism and the assumptions of normal science’ (Hardy and Clegg 1997:7). These
features are also inherent in Burrell and Morgan’s (1979) explanation of the functionalist
perspective which assumes that organisational performance depends on rational decision
making processes. Yet, in practice, rationality is neither an automatic feature of
organisational processes nor an intrinsic contributor to organisational performance.
From an organizational perspective, interpretive approaches mostly utilise hermeneutics
and ethnography to study the social aspects of organizational life (Alvesson and Deetz
2006). This helps researchers to explain how organizational realities are socially
constructed, negotiated, affirmed, maintained or changed (Karataş-Özkan and Murphy
2010). For instance, constructionists are convinced that knowledge and truth are enacted
and expressed in a variety of symbols and language systems (Lincoln and Guba 2000).
They contend that organizations are culturally, historically and socially unique spaces

94
where members are collectively involved in the construction of social reality. Conversely,
critical theorists see organizations as socially and historically created within contexts of
struggle and conflict while postmodernists focus on unequal power relations in
organisational settings (Alvesson and Deetz 2006;Karataş-Özkan and Murphy 2010).
Situating this research within the context of public administration and public management,
it can argued that organisational performance could both be ‘real’ and socially constructed
(Boyne et al. 2010). Advocating for a realist approach to analysing organisational
performance, Talbot (2010) argues that the utilisation of quantifiable resources in the
production of outputs and outcomes affect social reality in very pragmatic ways to justify a
realist philosophical interpretation of organisational performance. However, one could
argue that measuring performance of local governments is complex because what
constitutes performance and how performance is measured and managed, may neither
follow an objective process nor involve objectively verifiable standards but would rather
be socially constructed by different stakeholders. Stakeholders in this context refer to
persons, groups, and institutions that have an interest in the activities of LGs. Therefore,
the assumption that performance is an objective phenomenon that could be known through
a set of quantifiable measures or indicators might be limited given the multiple
constituencies in the public sector and the variety of values attached to what constitutes
performance. More so, the apparent lack of a universal definition of performance
reinforces the assertion that performance is socially constructed, subjective, complex, and
particularly difficult to measure in the public sector (Brewer and Selden 2000). It is further
seen as a normative construct that is mostly used in relation to value laden concepts such as
improvement, success, progress, and sometimes excellence (Summermatter and Siegel
2009). Thus organisational performance would be viewed in this study as a social construct
that is based upon people’s understanding and interpretation of performance within local
government authorities, sector departments and interaction between these institutions and
communities that benefit from the services of LGs.
It is important to recognise that the growing acceptance and utilisation of social
constructivist and interpretive research techniques in public management and
organisational analysis cannot be underestimated. The utility of this perspective is evident
in the wide range of benefits it offers to researchers. For example, it allows for a critical
examination of assumptions related to public management practice that would have been
overlooked or even ignored by other approaches (Jacobs and Manzi 2000). Furthermore,
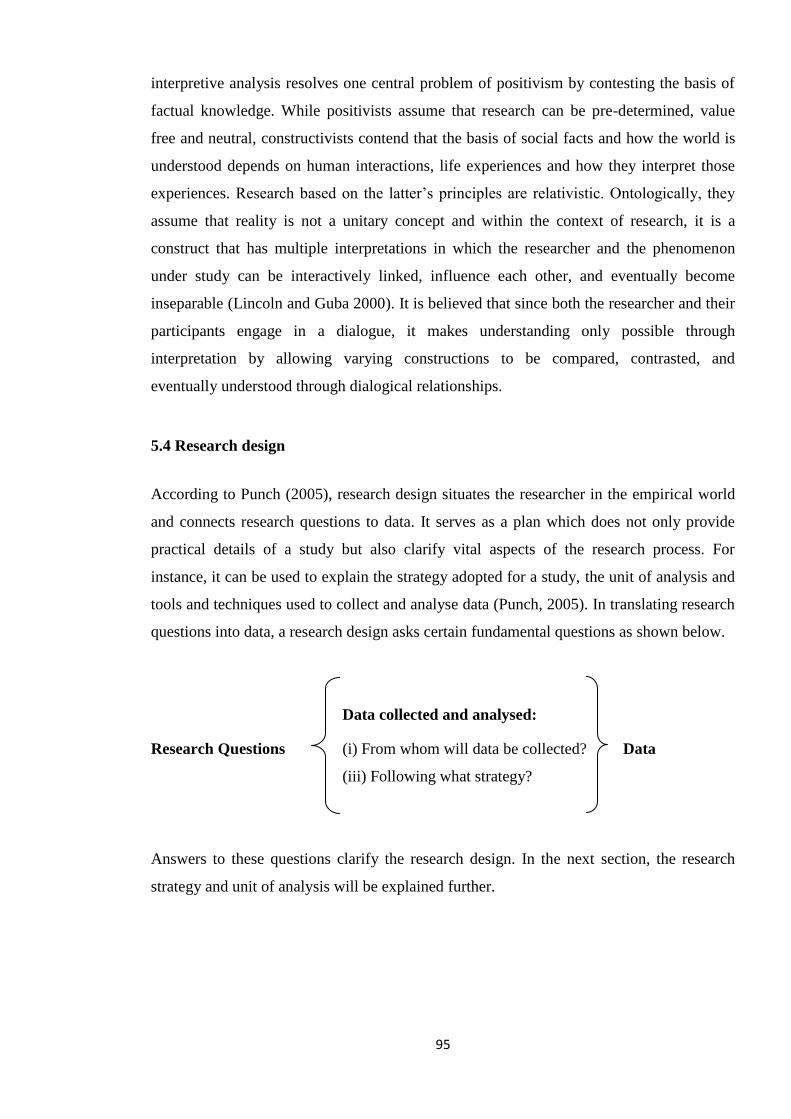
95
interpretive analysis resolves one central problem of positivism by contesting the basis of
factual knowledge. While positivists assume that research can be pre-determined, value
free and neutral, constructivists contend that the basis of social facts and how the world is
understood depends on human interactions, life experiences and how they interpret those
experiences. Research based on the latter’s principles are relativistic. Ontologically, they
assume that reality is not a unitary concept and within the context of research, it is a
construct that has multiple interpretations in which the researcher and the phenomenon
under study can be interactively linked, influence each other, and eventually become
inseparable (Lincoln and Guba 2000). It is believed that since both the researcher and their
participants engage in a dialogue, it makes understanding only possible through
interpretation by allowing varying constructions to be compared, contrasted, and
eventually understood through dialogical relationships.
5.4 Research design
According to Punch (2005), research design situates the researcher in the empirical world
and connects research questions to data. It serves as a plan which does not only provide
practical details of a study but also clarify vital aspects of the research process. For
instance, it can be used to explain the strategy adopted for a study, the unit of analysis and
tools and techniques used to collect and analyse data (Punch, 2005). In translating research
questions into data, a research design asks certain fundamental questions as shown below.
Data collected and analysed:
Research Questions (i) From whom will data be collected? Data
(iii) Following what strategy?
Answers to these questions clarify the research design. In the next section, the research
strategy and unit of analysis will be explained further.
96
5.4.1 Case study research strategy
The case study strategy is relevant in social science research because it facilitates in-depth
understanding of phenomenon in their real natural environment (Yin 2009). Case studies
can serve a dual purpose, both as a research strategy and as a research method (Punch
2005;Yin 2009). Yin (2009:18) affirms that case studies are suitable for ‘investigating
contemporary phenomena into detail and within real-life contexts especially when the
boundaries between phenomenon and context are not clearly evident’. The case study
strategy has become popular in organisation and management studies due to growing
confidence in it as a rigorous research strategy in its own right (Hartley 1994;Yin 2009). In
addition to these advantages, case studies are not only bounded systems that focus on
specific phenomenon; they also seek to preserve the wholeness and integrity of the case or
cases under study; and may include data from different sources (individuals, specific
groups, organisations and sometimes communities) as well as multiple methods (Punch
2005).
Stake (2000) classifies case studies into intrinsic, instrumental, and collective case studies.
He explains that intrinsic cases are conducted to gain deeper understanding of specific
issues whilst instrumental case studies are used to clarify a particular phenomenon or to
further advance theoretical knowledge. Lastly, and as the name suggests, collective case
studies consists of two or more cases that allows for the examination and comparison of
different contexts. It is argued that multiple cases strengthen research results by replicating
pattern matching, thus increasing confidence in the robustness of data and theory (Yin,
2009). In this study, the case study strategy was suitable because studies on the
performance of LGs in Ghana is limited and the few studies that attempt to look at
performance focused on poverty reduction and issues of political participation that had no
linkages to the prevailing performance management framework (See Crook 1994;Crook
and Manor 1998;Yankson 2007;Crawford 2008). Hence, three LGs were purposively
selected based on their sizes and geographic location. They included a Metropolitan
Assembly in the Greater Accra region, a Municipal Assembly in the Brong Ahafo region
and a District Assembly in the Northern region. From these local government authorities,
the implementation of performance management practice and the performance enhancing
policy would be considered as part of an intrinsic case.
97
5.4.2 Unit of analysis, selection of cases and sampling procedure
Out of a total number of 216 LGs in Ghana, 3 were purposively selected as the unit of
analysis because time and resource constraints associated with the PhD project made it
impractical to cover all LGs in the 10 regions of Ghana. The selected LGs comprised a
Metropolitan Assembly in the South of the country, a Municipal Assembly in the middle
zone and a District Assembly in the Northern region. The study infers from these LGs
because primary data were collected from their officials and from communities that fall
under their jurisdictions. The diversity offered by different LG authorities addresses an
often cited limitation of having a single geographic case, especially in terms of
generalizing research findings and decreasing the possibility of bias (Eisenhardt 1989).
One way to avoid a single case bias is to adopt a multiple case-study approach. It is argued
that:
“Multiple cases augment external validity and help guard against
observer biases. Moreover, multi-case sampling adds confidence to
findings. By looking at a range of similar and contrasting cases,
we can understand a single-case finding, grounding it by
specifying how and where and, if possible, why it behaves as it
does” (Miles and Huberman 1994).
Unlike quantitative sampling which primarily seeks to achieve representativeness of the
study population, the overarching aim of qualitative sampling is to obtain rich information
by selecting cases purposefully rather than randomly (Meyer 2001). Hence, an appropriate
sample size is one that adequately answers the research question regardless of whether it is
a single digit number or made up of several sampled units (Marshall 1996). I therefore
selected 3 regions in order to keep the cases to a manageable size. Given the nature of
qualitative research, the number of required respondents becomes obvious to the researcher
as the study progresses, until data saturation point is reached when new categories, themes
or explanations cease to emerge from the data (Marshall 1996). In this study, the selection
of research participants was exclusively based on the need to engage the most suitable
persons who had the requisite knowledge to answer my research questions. Participants
were contacted ahead of the interviews to book appointments. Subsequently, interviews
were conducted at locations that were convenient to the respondents such as their offices,
and in rare cases, at their residence. In all, 41 interviews were completed in the three local
government areas while 6 senior officers were interviewed in central government
departments in Accra. In addition, 6 Focus Group Discussions (FGDs) were held, 2 in each
region. Participants of the FGDs were drawn from the Ghana Education Service and Unit
98
Committees in the study districts. Clearly, since research participants were selected on the
basis of their knowledge and experience of local government performance, the
heterogeneity of respondents provided valuable data because participants offered varied
opinions. Furthermore, useful insights were obtained by passively participating in two
general assembly meetings in the Brong Ahafo and Greater Accra regions where I
observed proceedings of the highest decision making body of the LGs. This increased my
understanding of the research context and the dynamics involved in managing local
government performance. From this cross-section of data sources, a lot of information was
gathered to answer the research questions. The next section presents details of the data
collection phase of the research.
5.5 Data collection
The study used primary data obtained from selected local government authorities in
addition to central government ministries, departments and agencies that have relevant
information concerning the performance of LGs in Ghana. Primary data was supplemented
with [quantitative] secondary data obtained from these organisations during my field work
in Ghana from September 2012 to March 2013 and afterwards when it was necessary to
obtain additional data. Apart from these, I widely used published and unpublished
materials such as local government policies, legislative instruments, development plans
and technical reports. Figure 5.1 summarises the main sources of data used in this study
and highlight the unit of analysis. It also identifies participants for interviews and provides
clues about secondary sources of data.
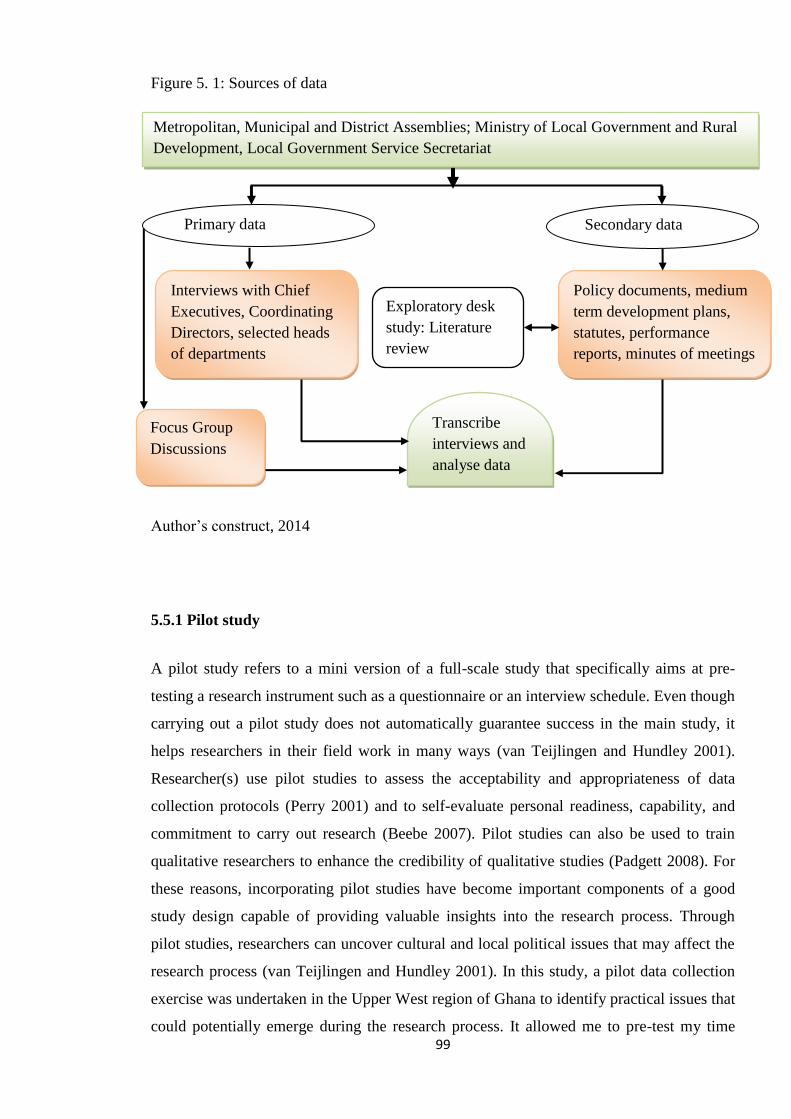
99
Figure 5. 1: Sources of data
Author’s construct, 2014
5.5.1 Pilot study
A pilot study refers to a mini version of a full-scale study that specifically aims at pre-
testing a research instrument such as a questionnaire or an interview schedule. Even though
carrying out a pilot study does not automatically guarantee success in the main study, it
helps researchers in their field work in many ways (van Teijlingen and Hundley 2001).
Researcher(s) use pilot studies to assess the acceptability and appropriateness of data
collection protocols (Perry 2001) and to self-evaluate personal readiness, capability, and
commitment to carry out research (Beebe 2007). Pilot studies can also be used to train
qualitative researchers to enhance the credibility of qualitative studies (Padgett 2008). For
these reasons, incorporating pilot studies have become important components of a good
study design capable of providing valuable insights into the research process. Through
pilot studies, researchers can uncover cultural and local political issues that may affect the
research process (van Teijlingen and Hundley 2001). In this study, a pilot data collection
exercise was undertaken in the Upper West region of Ghana to identify practical issues that
could potentially emerge during the research process. It allowed me to pre-test my time
Interviews with Chief
Executives, Coordinating
Directors, selected heads
of departments
Policy documents, medium
term development plans,
statutes, performance
reports, minutes of meetings
Focus Group
Discussions
Metropolitan, Municipal and District Assemblies; Ministry of Local Government and Rural
Development, Local Government Service Secretariat
Transcribe
interviews and
analyse data
Exploratory desk
study: Literature
review
Primary data Secondary data
100
management skills as I recorded and compared the duration of each interview; checked the
quality of tape recordings and modified the words and sequence of some questions where
appropriate. In the end, it was obvious that a pilot study can be “time-consuming,
frustrating, and fraught with unanticipated problems, but it is better to deal with them
before investing a great deal of time, money, and effort in the full study” (Mason and
Zuercher 1995).
5.5.2 Interview schedule
A semi structured interview schedule was used to guide face to face interaction with
respondents during data collection in the field. This was needed because the structure and
content of interview protocols shape the kind of knowledge generated in primary research
in ways consistent with the objectives of the study (Dilley 2004). The choice of semi
structured interviews was appropriate because unstructured interviews can produce data
that is unrelated to the performance of LGs in Ghana whilst structured questions alone may
not permit further exploration of relevant issues that fall outside the domain of the research
topic. Seidman (2012) emphasizes the importance of the structure of interview protocols
by arguing that consciously sequencing questions in a logical order attracts the attention of
respondents and engages them effectively. Whereas Seidman (2012) highlights the
significance of the structure of interview protocols in particular and the interview process
in general, Rubin and Rubin (2005) argue that a different set of skills - the art of hearing
data - are necessary in qualitative interviewing because it allows researchers to find out
what others feel and think about their own immediate ‘worlds’. The flexibility of the semi
structured interview schedule made it possible to obtain insights into issues and themes
that were not explicitly included in the list of interview questions. The interview
instrument facilitated my understanding of events in which I neither personally participated
in, nor directly experienced prior to this research. Therefore, in an attempt to achieve my
research objectives, interview questions were consciously worded to elicit multifaceted
information that would be ‘factual’, descriptive, and provide background information and
insights into the performance of LGs in Ghana.

101
5.5.3 Interviews
In qualitative studies, interviews have become a widely used technique for data collection
(Heyink and Tymstra 1993). While an interview simply refers to the act of asking
questions and receiving answers, there is much more to it in an academic qualitative
inquiry. Planning an interview can be time consuming especially when the researcher
strives to avoid mistakes in order to achieve a successful outcome. Apart from preparing
adequately for the interviews, there are a number of factors worth considering right from
the onset. These range from being aware of and getting prepared for unexpected behaviour
of research participants and unforeseen problems associated with the interview
environment, intrusion of own biases and expectations, maintaining focus by constructing
and delivering the right questions, dealing with sensitive topics and transcription of
recorded interviews (Roulston et al. 2003). Despite these plausible challenges, the strength
of using interviews to collect data lies in its flexibility which allows the researcher to go
back and forth, to probe, seek clarification and ask questions based on what has already
been said (Marvasti 2010). Thus, the interview technique was appropriate for this research
because the most reliable way of understanding the performance of LGs is through
engaging and interacting with individual members of local government authorities or other
people who have deeper insights into local government performance. This was also the
most appropriate step towards understanding research participants’ construction of reality
in their own contexts (Punch 2005). In line with Jones (1985: 46) :
‘in order to understand other persons’ construction of reality,
we would do well to ask them…and to ask them in such a way
that they can tell us in their terms (rather than those imposed
rigidly and a priori by ourselves) and in a depth which
addresses the rich context that is the substance of their
meaning’.
Hence, in order to understand the details of performance management practices of local
government authorities, face to face interviews were conducted with a wide range of
participants to understand the state of local government performance. Before starting an
interview, I officially introduced myself and explained the purpose of my research. In
addition, research questions and objectives were explained to participants for them to know
why they were selected to participate in the study. They were also informed about the
research instruments used, ethical issues and the time frame for each interview. For all
102
interviewees and participants of focus group discussions, these formalities were
instrumental in building rapport with them and gaining confidence and trust throughout the
data collection process.
5.5.4 Expert interviews
Six interviews were held with local government experts and practitioners from the Ministry
of Local Government and Rural Development, Local Government Service Secretariat,
Institute of Local Government Studies and the Development Partners Sector group on
Decentralisation and Local Government. Given the knowledge of these interviewees
concerning the implementation of local government policy, they offered important
perspectives about evaluating the performance of local governments in Ghana. This
category of interviewees supplied relevant information that would otherwise have been
difficult to obtain at the local government level.
5.5.5 The interview process
Before interviews were conducted, an introductory letter issued by the University of
Manchester was submitted to the Local Government Service Secretariat; the official gate
keepers in charge of Metropolitan, Municipal and District Assemblies in Ghana. This was
a mandatory procedure for facilitating access to prospective research participants within
local government authorities. Yet, there was no guarantee that the entire interview process
would be successful. Even though there is still no universally accepted criterion for
conducting successful interviews, the researcher was attentive to certain conditions that
could affect the outcome of qualitative interviews. These factors have been summarised by
Kvale (1996) and expanded by Bryman (2008: 455) as indicated in table 5.1 below.
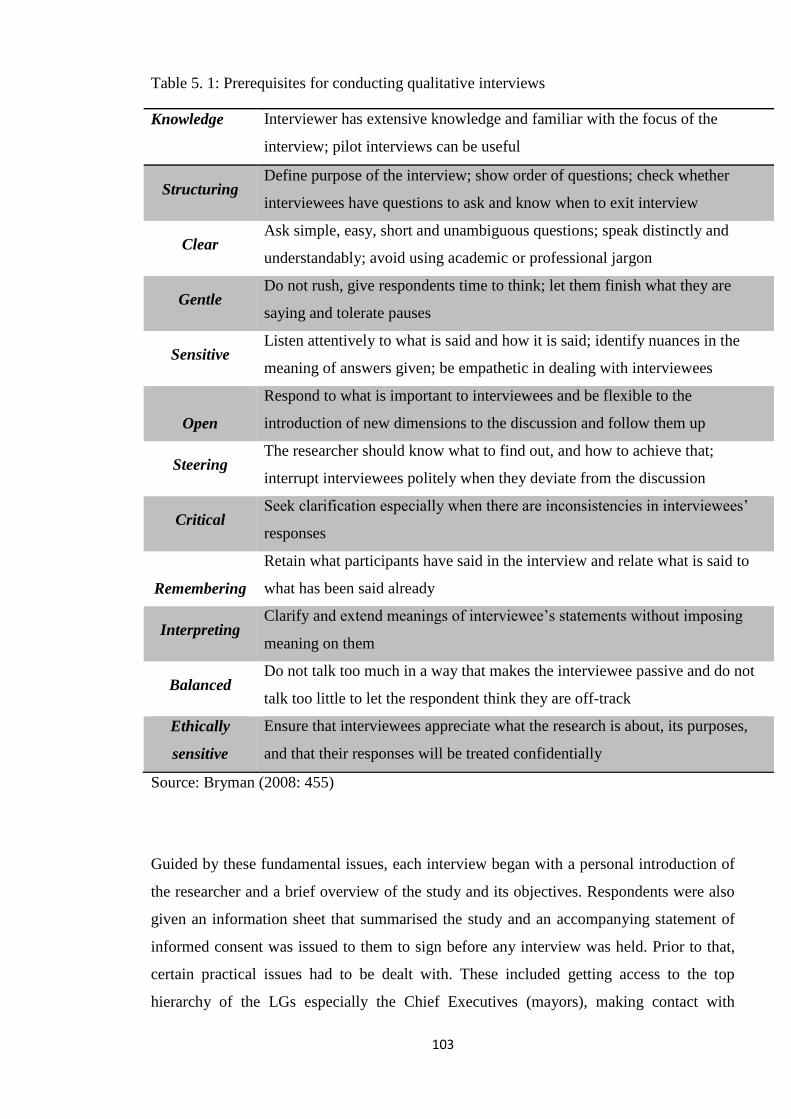
103
Table 5. 1: Prerequisites for conducting qualitative interviews
Knowledge Interviewer has extensive knowledge and familiar with the focus of the
interview; pilot interviews can be useful
Structuring Define purpose of the interview; show order of questions; check whether
interviewees have questions to ask and know when to exit interview
Clear Ask simple, easy, short and unambiguous questions; speak distinctly and
understandably; avoid using academic or professional jargon
Gentle Do not rush, give respondents time to think; let them finish what they are
saying and tolerate pauses
Sensitive Listen attentively to what is said and how it is said; identify nuances in the
meaning of answers given; be empathetic in dealing with interviewees
Open
Respond to what is important to interviewees and be flexible to the
introduction of new dimensions to the discussion and follow them up
Steering The researcher should know what to find out, and how to achieve that;
interrupt interviewees politely when they deviate from the discussion
Critical Seek clarification especially when there are inconsistencies in interviewees’
responses
Remembering
Retain what participants have said in the interview and relate what is said to
what has been said already
Interpreting Clarify and extend meanings of interviewee’s statements without imposing
meaning on them
Balanced Do not talk too much in a way that makes the interviewee passive and do not
talk too little to let the respondent think they are off-track
Ethically
sensitive
Ensure that interviewees appreciate what the research is about, its purposes,
and that their responses will be treated confidentially
Source: Bryman (2008: 455)
Guided by these fundamental issues, each interview began with a personal introduction of
the researcher and a brief overview of the study and its objectives. Respondents were also
given an information sheet that summarised the study and an accompanying statement of
informed consent was issued to them to sign before any interview was held. Prior to that,
certain practical issues had to be dealt with. These included getting access to the top
hierarchy of the LGs especially the Chief Executives (mayors), making contact with
104
prospective respondents, securing appointments and deciding on the number of data
collection times. These issues were addressed by making phone calls to potential
respondents and when necessary, undertaking reconnaissance visits to the study districts.
Throughout the data collection process, field work practices that are widely linked to
successful research outcomes were adopted. For instance, all research participants were
assured that the interviews would be tape recorded, their responses treated confidentially
and their identities anonymised. In addition, field notes were often written when new
perspectives that were hitherto, not thought about, were revealed. These notes were useful
for personal reflections during the fieldwork and showed pointers towards issues that
required to be followed up immediately. Clearly, recording interviews on tape facilitated
the organisation of analytical ideas that were generated during and after the field work. To
Hughes (1994), the quality or adequacy of a research project is not only the result of the
questions asked or concepts used; it is also the result of keeping rigorous field notes.
Hence, field notes were taken immediately after every interview to summarise key topics
and issues that were raised in the interview to properly capture the respondent’s
perspective. Using these notes as a memo became a vital tool for refreshing my memory
throughout the field work. To Hammersley and Atkinson (1983), recording field data
constitute[s] a central research activity that should be carried out with much care and self-
consciousness as possible.
Indeed, the interview sessions were flexible because the semi-structured interview guide
allowed me to probe further whenever respondents did not answer a question satisfactorily.
Probing entailed stimulating further discussions with respondents to uncover and get a
better understanding of what they meant while answering a question. This technique was
used to perform two functions. First, it motivated respondents to clarify answers they gave
and encouraged them to offer plausible reasons to support those answers and secondly, it
enabled me to steer the interview and focus the conversation on issues that relate to the
performance of LGs in the Ghanaian context. Even though my knowledge of local
governance in Ghana enabled me to ask the right questions, a conscious attempt was made
to limit bias on my part as a researcher and on the part of the interviewees who participated
in the study. I involved as many respondents as possible in order not to have a one sided
view of local government performance. For example, not only did I engage local
government officials from different hierarchical levels, departments, and locations, I also
interacted with a wide range of highly knowledgeable respondents (both senior and junior

105
officials) at central and local government levels because they provided diverse perspectives
on local government performance. Table 5.2 presents the number of interviewees who took
part in the study as well as their professional roles.
Table 5. 2: Distribution of interviewees
Title of respondent Sample prior to
field work
No of participants
interviewed
Chief Executives 3 3
Coordinating directors 3 3
Presiding members (Chairs) 3 2
Finance officers 3 3
Planning officers 3 3
Budget officers 3 3
Works engineers 3 3
Internal auditors 3 2
Directors of sanitation/ waste management 3 3
Head of personnel (HR) 3 2
Directors of education 3 2
Head teachers of primary schools 6 2
Elected assembly members 10 5
Sub-committee chairpersons 6 3
PTA chairpersons/ representatives 6 2
Total number of interviewees 51 (expected) 41
(80.4% response rate)
Author’s construct, 2014
5.5.6 Focus group discussions
Focus group discussions were conducted to elicit the opinions, perceptions and everyday
experiences of local residents regarding services their LGs provide. In each of the selected
districts, focus group discussions (FGDS) were organised with members of unit
committees to understand their perception of local government performance. It must be
recalled that unit committees are the lowest sub district structure that operate at the
community level with elected and appointed members. In addition, separate focus group
106
discussions were held with school management committees and parent-teacher associations
in selected public basic schools at the district level. These were homogenous groups with
similar features but with sufficient variations amongst participants to allow contrasting
opinions (Denzin and Lincoln 2005;Ruff et al. 2005). Opinions that emerged from the
focus group discussions were crucial because they represented the voice of people who live
in localities where the daily lives of people are affected by local governments’
performance. In all, six (6) focus group discussions, two in each local government area was
organised.
To ensure that these discussions generated relevant data, certain principles were adhered
to. For instance, the researcher moderated each session by managing participants’
expectations during the discussions and paid special attention to the nature and format of
questions, group size and the amount of time allocated to each session (Ruff et al. 2005).
Participants of focus group discussions ranged from 6 to 10 people. For example, 6 unit
committee members and 7 people representing a parent-teacher association of a primary
school in the ‘A’ Metropolis participated in separate FGDs. Also, 6 unit committee
members and 8 members of a PTA took part in FGDs in the ‘B’ Municipality while in the
‘C’ district, 6 unit committee members and 9 members of a school management committee
participated in two separate FGDs. Combining data from FGDs with interview data
reduces individual bias since a variety of opinions from group interactions complemented
interview data. By allowing respondents to consult each other during discussions, the
knowledge and experience shared by participants significantly contributed to our
understanding of local government performance in the Ghanaian context.
5.5.7 Observation
Observing individual behaviour and organisational processes has a long tradition in
qualitative research (Bryman 2008). In a naturalistic observation, the researcher neither
manipulates nor stimulates the behaviour of research participants in contrast to some other
data collection techniques (Punch 2005). In this study, some events, activities and projects
were observed to confirm the views of research participants. The researcher participated in
general assembly meetings of two local government authorities where key deliberative and
legislative procedures were observed and recorded. It also helped the interpretation of data
in relation to questions that were asked during the field work. In addition to focusing on
internal local government administrative practices, observation was used as a triangulation
107
device to verify claims of physical infrastructure and social services provided in local
communities. Observed behaviours and unexpected incidents that occurred during
individual interviews and focus group discussions were also documented in field memos.
Apart from complementing other sources of data, ‘observational data’ were helpful in
describing, analysing and interpreting the findings of the study.
5.5.8 Secondary data
Secondary data in this study refers to data generated by government ministries,
departments and agencies that exist independent of this research. Found in quantitative and
qualitative forms, such data are often produced for purposes of management, planning and
evaluation (Cowton 1998). The main advantage of using secondary data is because it
requires less time to collect given that they already exist prior to collecting primary data.
More often, secondary data complements primary data, making up for the shortfalls of the
other or providing confirmation. This complementarity is seen as data ‘triangulation’ with
a potential of increasing the credibility of research findings (Frankfort-Nachmias and
Nachmias 2007). For these reasons, several official documents such as policy statements,
legislative instruments, operational manuals, reports and planning guidelines were obtained
from the Ministry of Local Government and Rural Development in Ghana, the Institute of
Local Government Studies and from the Local Government Service Secretariat. In addition
to these, development plans, budgets and performance review reports of the 3 selected
local government authorities that participated in this study were collected and analysed.
5.5.9 Document analysis
There are two perspectives concerning the use of documents in qualitative research. The
first perspective assumes that documents can reveal an underlying social reality within a
given context. In this sense, it is presumed that documents produced by organisations such
as minutes of meetings, mission statements, organisational charts, newsletters and annual
reports represent the reality of that organisation because they reveal what goes on within an
organisation and may give hints about the culture, values and ethos of organisations.
According to this perspective, documents are ‘windows onto social and organisational
realities (Bryman 2008: 526). On the contrary, Atkinson and Coffey (2010) contend that
documents should be viewed as having a distinct reality in their own right. They argue that
documents should be examined within the context in which they were written and with
108
regard to their readership. This implies that documents are significant only when they
accomplish the purpose for which they were produced. Atkinson and Coffey (2010)
emphasise that ‘inter-textuality’ or connections between documents should be made to gain
a better understanding of their content.
In this research, archival resources consisting of official records and documents were
analysed to understand how LGs in Ghana manage their performance. These materials
were used as secondary data sources since they provided data that were not specifically
gathered for this thesis. Silverman (2011) has provided a catalogue of documents as
consisting of files, statistical records, records of official proceedings and images. Guba and
Lincoln (1992) however make a distinction between documents and records. They define
records as written statements prepared by an individual or an agency to account for or
proof the occurrence of an event. Examples of records in this sense include business
registration permits issued by local government authorities, minutes of meetings, and
speeches of chief executives during general assembly meetings, and audit reports among
others. According to Guba and Lincoln (1992), a document refers to any written material
other than a record that was not prepared specifically in response to some request from the
researcher. In the context of this study, these include publications - both academic and non-
academic- as well as policy related documents of local government authorities such as
medium term development plans, proposals for the development and transformation of
urban areas, service and public infrastructure contracts that have implications on the
performance of local government authorities but were not prepared purposely for this
research. These documents were collated from key central government agencies that
exercise oversight responsibilities over local government authorities while others were
obtained from the selected local government authorities involved in this study.
5.6 Data analysis and interpretation
This section presents how data was analysed to address the research questions. Analysing
and interpreting qualitative data can be a challenge because qualitative research generates
vast database due to its reliance on research participant’s lived experiences expressed in
field notes, interview transcripts and documents (Bryman 2008:538). To Miles (1975),
qualitative data is an ‘attractive nuisance’ because despite the attractiveness of its richness,
it can be difficult to find analytic paths through that richness. Thus, I tried to guard against
being captivated by the richness of data at the expense of showing the broader significance
109
of the data that was collected from the field. To Lincoln and Guba (1985), this stage of the
research process is crucial because it produces and illuminates respondents’ realities.
Denzin (1994:502) describes data analysis and interpretation in qualitative research as:
“An art; [that] is not formulaic or mechanical [but] can be
learned, like any form of storytelling only through doing . . .
Fieldworkers can neither make sense of nor understand what
has been learned until they sit down and write the
interpretive text, telling the story first to themselves, and then
to their significant others, and then to the public”.
Taking this quotation into consideration and to find an analytical path for this study, some
immediate steps were taken after field work to lay the foundation for data analysis. For
instance, interview tapes were transcribed and coded using a template to structure and
organise the data in a manner that answered certain basic questions by clarifying who said
what, why they said what was said, how it was said, where and when a particular response
was made. Grouping the data in this format was a necessary step for generating themes,
interpreting and understanding the data within the context of the study. Details of post field
work data management procedures are presented in the ensuing sections.
5.6.1 Post field work data cleaning and transcription
Upon the completion of field work, the first analytic activity was to immerse myself in the
data by critically listening to each interview tape while transcribing alongside. Data were
transcribed and organized according to the description and status of research participants
and grouped on the basis of their responses to questions during the semi-structured
interviews. This way, the views of different interviewees such as Chief Executives, heads
of departments, assembly members (councillors) and opinions that emerged from focus
group discussions were organised and analysed in their own right. Transcripts for focus
group discussions were however separated from interview transcripts. As Mergenthaler
and Stinson (1992:129-30) advised, certain guiding principles were followed throughout
the transcription process that were meant to:
1) Preserve the morphologic naturalness of transcripts: By keeping word
forms and commentaries as close as possible to speech and ensure they are
consistent with what is typically acceptable in written text.
110
2) Preserve the naturalness of transcript structure: Keeping text clearly
structured by speech markers.
3) Made transcripts an exact reproduction of speech: Generating a verbatim
account rather than prematurely reducing text.
4) Transcription rules were universal and complete: Transcripts could be
used manually or with a computer and were written in non-technical
everyday language.
Adhering to these considerations during the transcription phase was important for two
reasons. Firstly, it made it possible for me to ‘engross’ myself into the data. Secondly, I
acquired a better contextual understanding of respondents’ perspectives about local
government performance. Respondents’ views were critically examined to identify
significant statements, phrases, sentences, or paragraphs that related directly to their
perception and knowledge of performance. Transcription of interviews was both thematic
and dynamic (Kvale 1996). Thematic in the sense that answers that were given to each
question was classified using a specific theme and dynamic because both explicit and
remote connections between responses were drawn using simple and clear words. The next
section presents how data were analysed and interpreted.
5.6.2 Coding and categorization of themes
Coding was used to start off analysing data but the procedure went on throughout the
period of data analysis. It is considered as ‘the fundamental analytic process used by the
researcher (Corbin and Strauss 1990 : 12). This phase of the study was crucial because it
served as the intersection for translating interview transcripts into meaningful forms.
Computer assisted qualitative analysis software, Nvivo 9 was used to code and
subsequently organise the data. Coding was both descriptive and inferential. Codes were
used as tags to label pieces of data during the early phase of the analysis and to form
specific groups of themes based on patterns inferred from the descriptive codes. Labels
were assigned to pieces of data to give them meaning and to provide a basis for storing and
retrieving the views of respondents. It also enhanced higher level coding by pulling
together themes and recognising patterns and generating sub headings (Punch 2005).
Open coding was done in the early stages of data analysis. This involved reading and
examining interview transcripts to identify and label specific words and phrases that
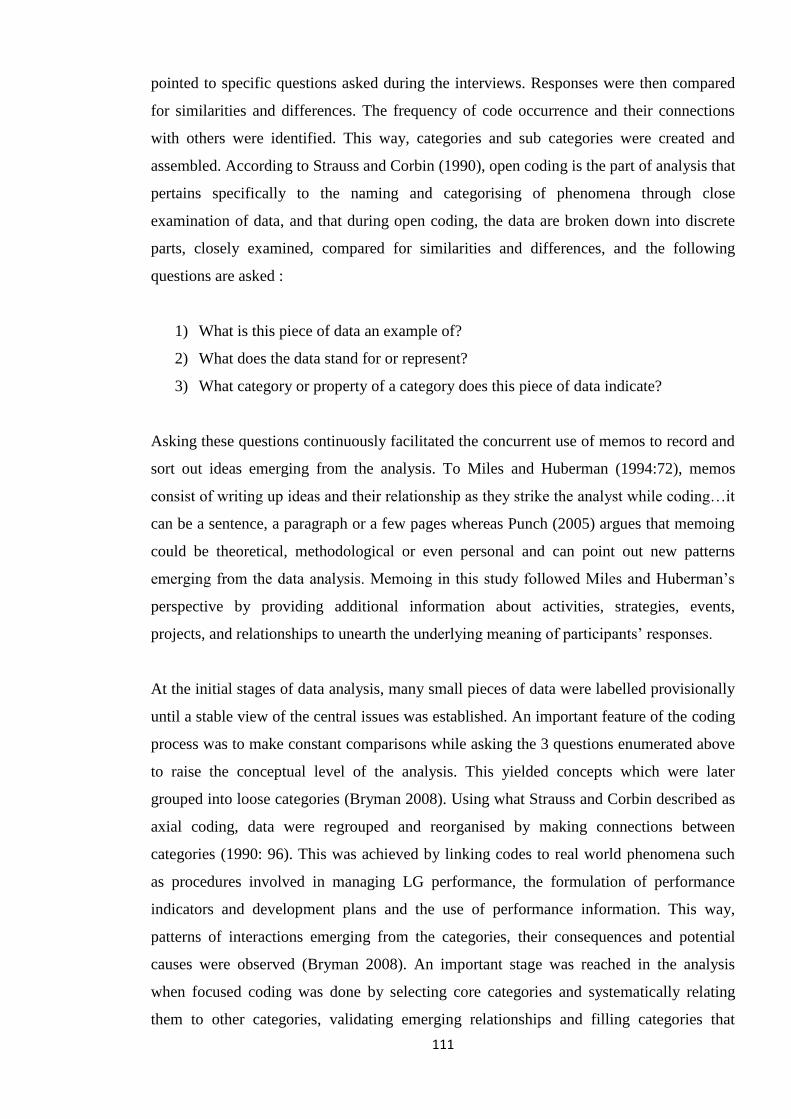
111
pointed to specific questions asked during the interviews. Responses were then compared
for similarities and differences. The frequency of code occurrence and their connections
with others were identified. This way, categories and sub categories were created and
assembled. According to Strauss and Corbin (1990), open coding is the part of analysis that
pertains specifically to the naming and categorising of phenomena through close
examination of data, and that during open coding, the data are broken down into discrete
parts, closely examined, compared for similarities and differences, and the following
questions are asked :
1) What is this piece of data an example of?
2) What does the data stand for or represent?
3) What category or property of a category does this piece of data indicate?
Asking these questions continuously facilitated the concurrent use of memos to record and
sort out ideas emerging from the analysis. To Miles and Huberman (1994:72), memos
consist of writing up ideas and their relationship as they strike the analyst while coding…it
can be a sentence, a paragraph or a few pages whereas Punch (2005) argues that memoing
could be theoretical, methodological or even personal and can point out new patterns
emerging from the data analysis. Memoing in this study followed Miles and Huberman’s
perspective by providing additional information about activities, strategies, events,
projects, and relationships to unearth the underlying meaning of participants’ responses.
At the initial stages of data analysis, many small pieces of data were labelled provisionally
until a stable view of the central issues was established. An important feature of the coding
process was to make constant comparisons while asking the 3 questions enumerated above
to raise the conceptual level of the analysis. This yielded concepts which were later
grouped into loose categories (Bryman 2008). Using what Strauss and Corbin described as
axial coding, data were regrouped and reorganised by making connections between
categories (1990: 96). This was achieved by linking codes to real world phenomena such
as procedures involved in managing LG performance, the formulation of performance
indicators and development plans and the use of performance information. This way,
patterns of interactions emerging from the categories, their consequences and potential
causes were observed (Bryman 2008). An important stage was reached in the analysis
when focused coding was done by selecting core categories and systematically relating
them to other categories, validating emerging relationships and filling categories that
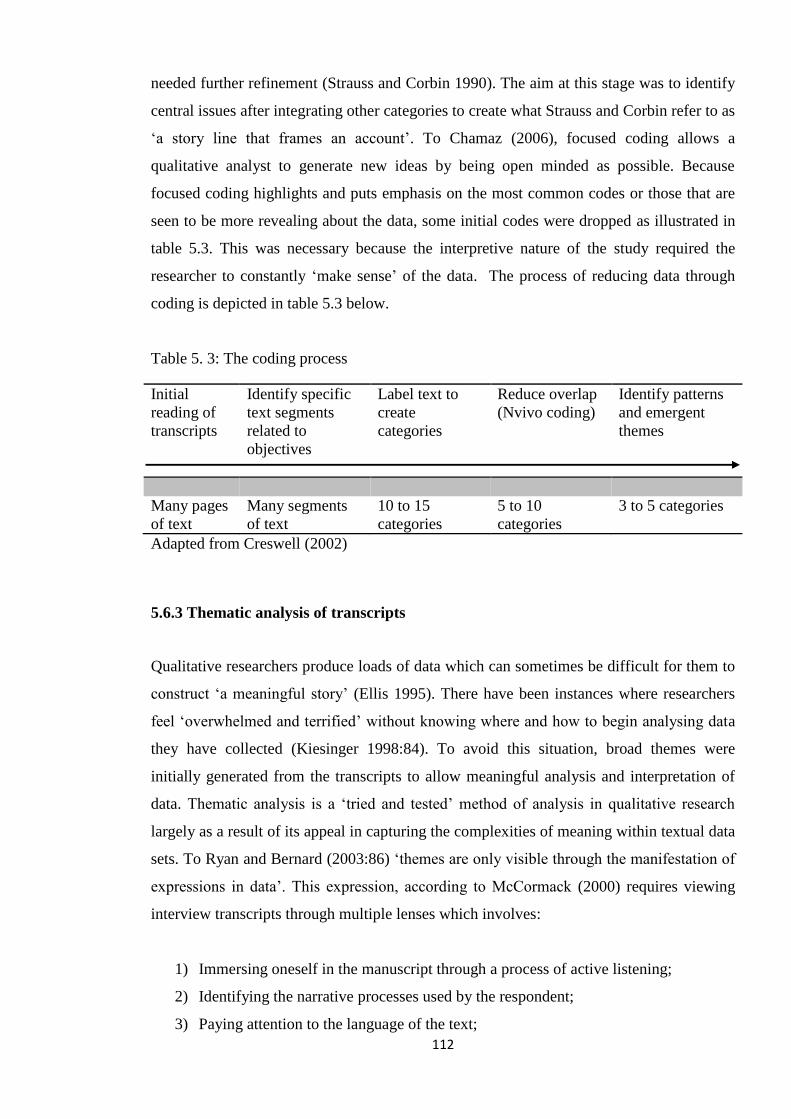
112
needed further refinement (Strauss and Corbin 1990). The aim at this stage was to identify
central issues after integrating other categories to create what Strauss and Corbin refer to as
‘a story line that frames an account’. To Chamaz (2006), focused coding allows a
qualitative analyst to generate new ideas by being open minded as possible. Because
focused coding highlights and puts emphasis on the most common codes or those that are
seen to be more revealing about the data, some initial codes were dropped as illustrated in
table 5.3. This was necessary because the interpretive nature of the study required the
researcher to constantly ‘make sense’ of the data. The process of reducing data through
coding is depicted in table 5.3 below.
Table 5. 3: The coding process
Initial
reading of
transcripts
Identify specific
text segments
related to
objectives
Label text to
create
categories
Reduce overlap
(Nvivo coding)
Identify patterns
and emergent
themes
Many pages
of text
Many segments
of text
10 to 15
categories
5 to 10
categories
3 to 5 categories
Adapted from Creswell (2002)
5.6.3 Thematic analysis of transcripts
Qualitative researchers produce loads of data which can sometimes be difficult for them to
construct ‘a meaningful story’ (Ellis 1995). There have been instances where researchers
feel ‘overwhelmed and terrified’ without knowing where and how to begin analysing data
they have collected (Kiesinger 1998:84). To avoid this situation, broad themes were
initially generated from the transcripts to allow meaningful analysis and interpretation of
data. Thematic analysis is a ‘tried and tested’ method of analysis in qualitative research
largely as a result of its appeal in capturing the complexities of meaning within textual data
sets. To Ryan and Bernard (2003:86) ‘themes are only visible through the manifestation of
expressions in data’. This expression, according to McCormack (2000) requires viewing
interview transcripts through multiple lenses which involves:
1) Immersing oneself in the manuscript through a process of active listening;
2) Identifying the narrative processes used by the respondent;
3) Paying attention to the language of the text;

113
4) Acknowledging the context in which the text was produced; and
5) Identifying moments in the text where something unexpected is happening.
Meanwhile, it is not straight forward to robustly analyse interview transcripts because
themes may appear to be abstract or fuzzy constructs. To Ryan and Bernard (2003:87), a
researcher will know a theme when they are able to answer the questions, ‘what is this
expression an example of’? Answering this question involved looking for broad themes
and constructs that linked different expressions in a meaningful way. Ryan and Bernard
(2003:88) have argued that “themes can be derived from different sources, notably from
raw data or from the researcher’s prior theoretical understanding of the subject under
investigation”. This means that the former refers to themes that originate from data and
may have an empirical basis while the latter involves professional definitions found in
literature reviews or from local, common-sense constructs and from researcher’s values,
theoretical orientations, and personal experiences. In the words of Strauss and Corbin
(1990), this is called ‘theoretical sensitivity’. In this study, the generation of themes had
two main origins the first of which was influenced by the existing literature on
organisational performance whilst the second was directly drawn from interview data.
Because interviews were tape recorded and transcribed, generating themes from multiple
sources laid a solid foundation while at the same time, it allowed some flexibility to
thoroughly analyse and interpret data beyond respondents’ answers to interview questions.
Ryan and Bernard (2003:88-94) have noted that looking for themes in interview transcripts
and other written materials involves more than just reading repetitively and marking with
coloured ink but also looking out for the factors outlined in box 5. 1.
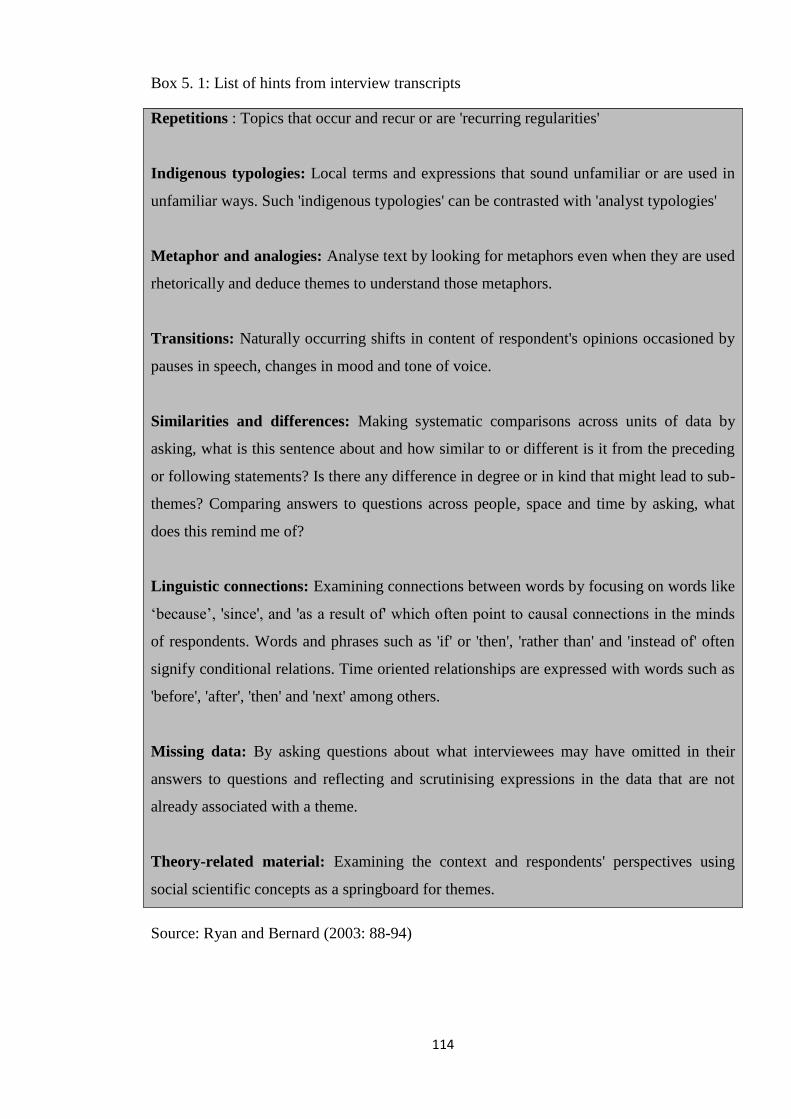
114
Box 5. 1: List of hints from interview transcripts
Repetitions : Topics that occur and recur or are 'recurring regularities'
Indigenous typologies: Local terms and expressions that sound unfamiliar or are used in
unfamiliar ways. Such 'indigenous typologies' can be contrasted with 'analyst typologies'
Metaphor and analogies: Analyse text by looking for metaphors even when they are used
rhetorically and deduce themes to understand those metaphors.
Transitions: Naturally occurring shifts in content of respondent's opinions occasioned by
pauses in speech, changes in mood and tone of voice.
Similarities and differences: Making systematic comparisons across units of data by
asking, what is this sentence about and how similar to or different is it from the preceding
or following statements? Is there any difference in degree or in kind that might lead to sub-
themes? Comparing answers to questions across people, space and time by asking, what
does this remind me of?
Linguistic connections: Examining connections between words by focusing on words like
‘because’, 'since', and 'as a result of' which often point to causal connections in the minds
of respondents. Words and phrases such as 'if' or 'then', 'rather than' and 'instead of' often
signify conditional relations. Time oriented relationships are expressed with words such as
'before', 'after', 'then' and 'next' among others.
Missing data: By asking questions about what interviewees may have omitted in their
answers to questions and reflecting and scrutinising expressions in the data that are not
already associated with a theme.
Theory-related material: Examining the context and respondents' perspectives using
social scientific concepts as a springboard for themes.
Source: Ryan and Bernard (2003: 88-94)
115
To process the data, a simple template was developed to determine who said what, why
they said it and within what context (Silverman 2010). Word lists and Key Words in
Contexts (KWIC) technique was used to count various responses to questions and issues
that emerged from the transcripts (Bernard and Ryan 2010). The aim was to create themes
using data labels and descriptors that are linked to the study’s objectives. The data labels
and categories were then sorted in the form of themes and sub-headings to answer the
research questions. These were further analysed, expanded, interpreted and presented in the
form of headings and sub headings in the empirical chapters. Hence, the process of
analysing and interpreting data was driven by the data itself. It is important to emphasise
that field notes and memos were useful for the analysis of data because points that were
written down during the data collection phase served as filters for determining themes
worthy of examining and interpreting.
5.7 Ethical considerations
It is important to be mindful of ethical issues while conducting research in organisational
studies because data collection involves human beings who are often required to share
information that may intrude into their personal lives or expose ‘organisational secrets’.
Thus, researchers are increasingly required to adhere to ethical standards in data collection
and reporting, especially in qualitative studies because such studies often focus on
sensitive, intimate and innermost aspects of peoples’ lives. To Punch (2005: 276), ethical
issues in social science disciplines can be categorised into 2 main types. The first one
relates to codes of professional and ethical conduct for research assignments laid down by
universities or research institutions such as the University of Manchester, the European
Social Science Research Council (ESRC) or the Arts and Humanities Research Council
(AHRC) amongst others. The second category refers to conventions and research best
practices found in the literature especially those that offer commentaries and
recommendations for social science research in general or specific disciplines as covered in
Miles and Huberman (1994) and Denzin and Lincoln (2011) to mention a few.
It is expected that ethical guidelines will enable researchers to deal with issues that concern
the rights and welfare of research participants and remind researchers about obligations to
their respondents. Being ethically sensitive helped me to prepare against issues that could
arise at any stage of the research process with ethical implications. Therefore, in order to
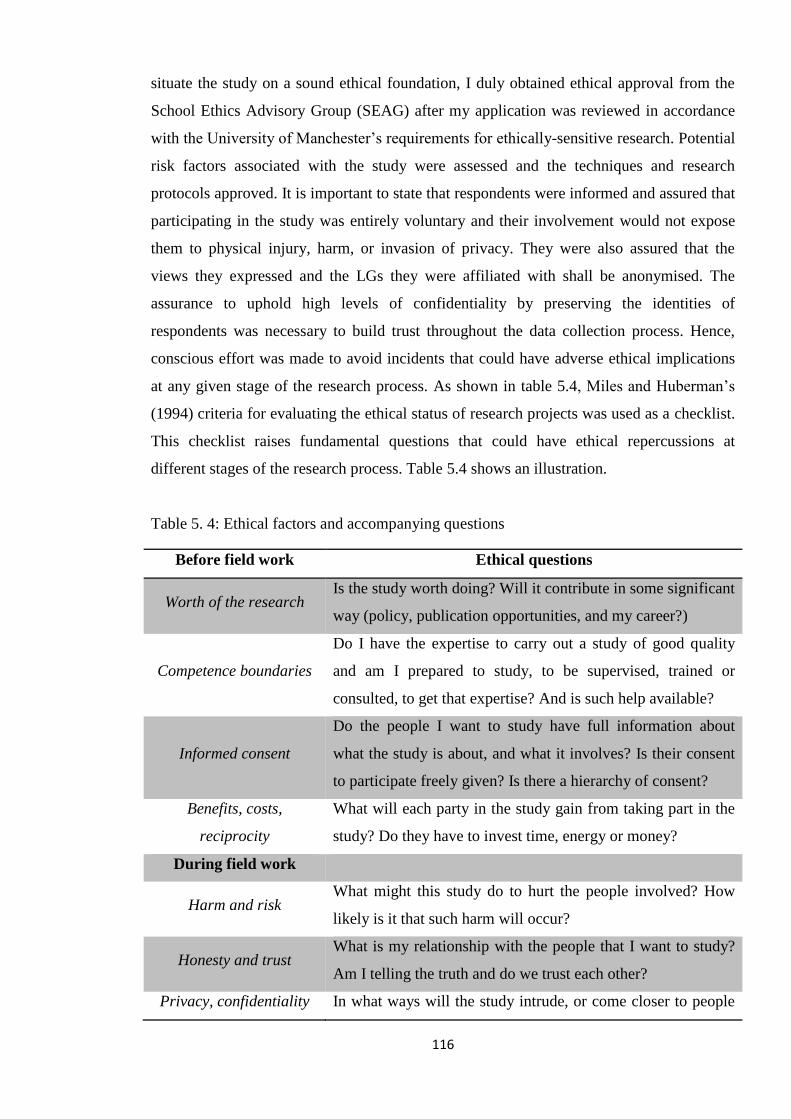
116
situate the study on a sound ethical foundation, I duly obtained ethical approval from the
School Ethics Advisory Group (SEAG) after my application was reviewed in accordance
with the University of Manchester’s requirements for ethically-sensitive research. Potential
risk factors associated with the study were assessed and the techniques and research
protocols approved. It is important to state that respondents were informed and assured that
participating in the study was entirely voluntary and their involvement would not expose
them to physical injury, harm, or invasion of privacy. They were also assured that the
views they expressed and the LGs they were affiliated with shall be anonymised. The
assurance to uphold high levels of confidentiality by preserving the identities of
respondents was necessary to build trust throughout the data collection process. Hence,
conscious effort was made to avoid incidents that could have adverse ethical implications
at any given stage of the research process. As shown in table 5.4, Miles and Huberman’s
(1994) criteria for evaluating the ethical status of research projects was used as a checklist.
This checklist raises fundamental questions that could have ethical repercussions at
different stages of the research process. Table 5.4 shows an illustration.
Table 5. 4: Ethical factors and accompanying questions
Before field work Ethical questions
Worth of the research Is the study worth doing? Will it contribute in some significant
way (policy, publication opportunities, and my career?)
Competence boundaries
Do I have the expertise to carry out a study of good quality
and am I prepared to study, to be supervised, trained or
consulted, to get that expertise? And is such help available?
Informed consent
Do the people I want to study have full information about
what the study is about, and what it involves? Is their consent
to participate freely given? Is there a hierarchy of consent?
Benefits, costs,
reciprocity
What will each party in the study gain from taking part in the
study? Do they have to invest time, energy or money?
During field work
Harm and risk What might this study do to hurt the people involved? How
likely is it that such harm will occur?
Honesty and trust What is my relationship with the people that I want to study?
Am I telling the truth and do we trust each other?
Privacy, confidentiality In what ways will the study intrude, or come closer to people
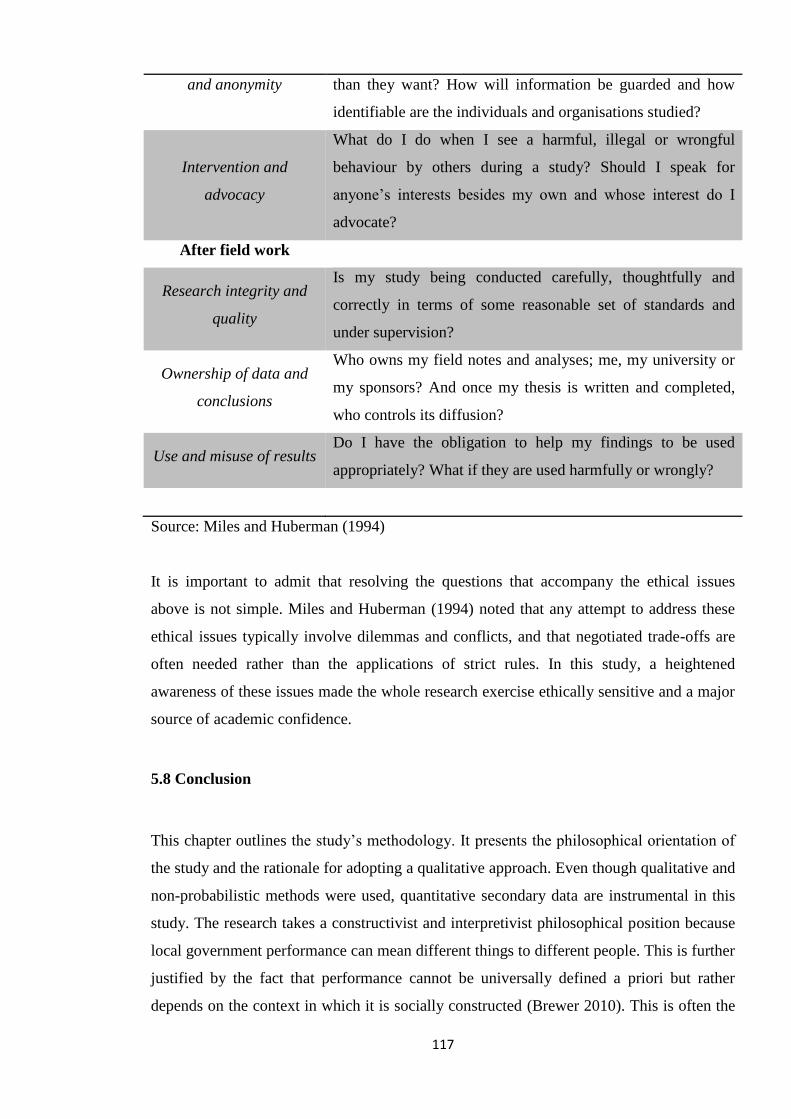
117
and anonymity than they want? How will information be guarded and how
identifiable are the individuals and organisations studied?
Intervention and
advocacy
What do I do when I see a harmful, illegal or wrongful
behaviour by others during a study? Should I speak for
anyone’s interests besides my own and whose interest do I
advocate?
After field work
Research integrity and
quality
Is my study being conducted carefully, thoughtfully and
correctly in terms of some reasonable set of standards and
under supervision?
Ownership of data and
conclusions
Who owns my field notes and analyses; me, my university or
my sponsors? And once my thesis is written and completed,
who controls its diffusion?
Use and misuse of results Do I have the obligation to help my findings to be used
appropriately? What if they are used harmfully or wrongly?
Source: Miles and Huberman (1994)
It is important to admit that resolving the questions that accompany the ethical issues
above is not simple. Miles and Huberman (1994) noted that any attempt to address these
ethical issues typically involve dilemmas and conflicts, and that negotiated trade-offs are
often needed rather than the applications of strict rules. In this study, a heightened
awareness of these issues made the whole research exercise ethically sensitive and a major
source of academic confidence.
5.8 Conclusion
This chapter outlines the study’s methodology. It presents the philosophical orientation of
the study and the rationale for adopting a qualitative approach. Even though qualitative and
non-probabilistic methods were used, quantitative secondary data are instrumental in this
study. The research takes a constructivist and interpretivist philosophical position because
local government performance can mean different things to different people. This is further
justified by the fact that performance cannot be universally defined a priori but rather
depends on the context in which it is socially constructed (Brewer 2010). This is often the
118
case in the public sector. Therefore, this research was not influenced by the assumptions of
positivists that research can be pre-determined, value free and neutral because a
constructivist approach assumes that realities are multiple and relies on human interactions,
life experiences of research participants and how the researcher interprets those
experiences.
Furthermore, the chapter outlined the research design which is based on a case study
strategy. It involves 3 selected local government authorities from three geographically
dispersed regions, notably a Metropolitan Assembly in the Greater Accra region, a
Municipal Assembly in the Brong Ahafo region and a District Assembly in the northern
region. Thus, LGs are the unit of analyses in this study. The chapter also presents primary
sources of data such as interviews and focus group discussions as well as secondary
sources of data. Details of activities such as ethical clearance and pilot studies that
preceded the actual field work are also described. This is followed by a description and
presentation of activities after the field work of the study was completed. The next chapter
tackles the first objective of the study by examining performance management practices of
local government authorities in Ghana and to understand how the national development
policy environment shapes the management of LG performance.
119
Chapter 6: Analysis and discussion of local government performance management
practices
“The task of measuring and assessing performance in local government
depends very much on who you are, what you want and where you stand in the
scheme of things” (Jackson, 1984:25)
6.1 Introduction
This chapter addresses the first research objective which seeks to understand how local
government authorities evaluate and manage organisational performance in Ghana and
what shapes their performance. It begins by examining the mission of local government
authorities and LG officials’ multiple interpretations of performance. Understanding
practitioners’ perspectives indicates that LG performance could be interpreted in terms of
departmental roles as well as LG activities, services and projects that have been prioritised
and set out for implementation in Medium Term Development Plans (MTDPs). The
formulation of performance indicators, medium term development plans and the
intersection between national development policy and local government performance are
analysed in this chapter. Development plans of LGs are analysed in detail to understand
their performance management practices and the extent to which LG priorities are
influenced by the national development policy framework.
From the analyses of data, performance management practices of LGs are grouped into two
categories. The first consists of internal administrative practices such as management
meetings used to discuss LG policy where heads of departments update LG managers on
the status of work such as the implementation of projects and also deliberate on strategies
to improve upon organisational performance. The second category involves external
agencies such as the RCCs, NDPC, MLGRD and the DACF secretariat that supervise local
government authorities. It was evident that intergovernmental relations between central
and LGs did shape how LGs manage their performance in contrast to the expectation of
LG autonomy. The ensuing sections analyses and discusses mechanisms for managing
local government performance in Ghana but it starts by exploring the local government’s
interpretations of performance.

120
6.2 Understanding the mission of local government authorities and bureaucrats’
perception of performance
Analysing the performance of local governments in Ghana anchors on statutory functions
assigned to them under the 1992 constitution. These functions are expressed in broad goals
- mission and vision statements - that outline their expectations for the future. According to
goal theorists, organisations that clarify their goals are likely to create a common vision
amongst employees, management and other stakeholders (Senko et al. 2011). It is believed
that since a well-managed local authority should know what it wants to achieve and when
it is successful, its performance management processes should be linked to the authority’s
aims and should show whether, and how these aims are being met (Audit Commission and
IDeA 2002). To Rainey and Steinbauer (1999), external stakeholders and members of an
organisation should interactively establish the organisation’s mission by connecting its
purpose to its goals. In a local government context, it is ideal to build consensus by
integrating and aligning the aspirations of various constituencies into the mission of LGs
so that assessing the process of organisational performance can be harmonised. This is
however not the case in Ghana because the mission and vision statements of LGs are
embedded in the local government law 1993 (Act 462). Thus, mission statements of all the
LGs in this study, as indicated in chapter 2, explicitly focused on improving the public
good. Yet, because local communities whom LGs serve do not have a role in formulating
these mission statements, it affects ordinary people’s knowledge about LG’s obligations to
them and weakens citizens’ demand for accountability as discussed in this chapter and
subsequent chapters.
Whereas the local government law in Ghana defines the functions of LGs based on which
organisational performance could be interpreted, technocrats at the national level
understood performance as the contribution of their directorates to the goals of the
Ministry of Local Government and Rural Development. This view was expected because
respondents were subject to the Public Service Performance Management Policy that was
introduced in 1997. The policy had a component for assessing the performance of senior
staff of the civil service such as Chief Directors for government ministries as well as
Directors at the RCCs. Similar views were expressed at the district level where local
government officials described performance as the contribution of individual employees to
the achievement of departmental goals and how this ultimately translates into the
achievement of organisational goals. In practice, Chief Directors and Coordinating

121
Directors, who are usually the most senior civil servants within the local government
bureaucracy, assign tasks and performance targets to their subordinates. Yet, monitoring
employee performance is irregular and less documented. Even for Coordinating Directors
and Chief Executives who sign performance agreements with regional ministers, enforcing
such agreements has been ineffective due to weak monitoring systems (Adei and Boachie-
Danquah 2003). This affects the performance culture within local government authorities.
Ironically, signing performance agreements was an integral part of the Civil Service
Performance Improvement Programme introduced in the 1990s but its impact on LGs was
minimal compared to central government ministries and State Owned Enterprises (Ayee
2001;Ohemeng 2009). When staff of the LGs were asked to explain the frequency of their
performance assessments, it was surprising that they could not recall the last time they
participated in a performance appraisal. No wonder a recent study concluded that
employee performance appraisal in Ghana is ineffective to improve the attitudes and
productivity of civil servants (Bawole et al. 2013). Nonetheless, LG officials
acknowledged that individual performance assessments are only necessary for employee
promotion rather than ascertaining how they impact upon organisational performance. A
research participant noted that:
“Members of staff are aware that the performance appraisal
system is used during promotion interviews and not to
determine their everyday performance which is impossible
for the Chief Executives and the Directors to do. People are
mostly busy and it is assumed that whatever they do is part of
their job description” [Field data, interview transcript, ‘C’
District Assembly]
Indeed, the above quotation suggests the need to undertake individual performance
appraisal on a regular basis. This is particularly important because LG officials presume
that their work automatically fall under their official tasks and for that reason do not
warrant routine assessment. It is difficult to sustain such assumptions in a public
organisation where less supervision increases the possibility of carrying out activities that
may not be professionally acceptable nor approved by management (Antwi and Analoui
2008).
122
When elected Assembly members and Chief Executives were asked about their own
performance, they avoided being ‘judges in their own courts’ and refrained from talking
about their own performance; a function they felt should be left to citizens or residents in
their communities to determine. In their view, the performance of LG is the extent to
which decisions made during General Assembly meetings are implemented effectively.
Assembly Members and Chief Executives who were serving their full tenure in office
indicated that any assessment of their performance needs to cover a period of four years -
consistent with their tenure of office. This realistically makes it possible to confirm
whether campaign pledges Assembly Members and Chief Executives made before serving
in public office had been fulfilled. It therefore comes as no surprise that many LGs strive
to provide physical development facilities to fill infrastructure gaps in local communities
since such tangible projects are easy for the electorate to verify. Provision of services by
the local authorities have therefore become the commonest way of determining whether
they perform their functions or not.
Whereas respondents’ opinions about performance covered both individual and
organisational spheres, this study focuses on organisational performance and not individual
performance. This is because organisational performance is the focus of local government
policy in Ghana. It is therefore vital to identify and analyse mechanisms LGs employ to
manage organisational performance. According to the National Development Planning
Commission (2009), LG performance assessment should reflect the extent to which
proposed programmes, projects and activities have been implemented to determine
whether they were fully implemented, partially implemented, on-going or not implemented
at all. And that performance assessment should focus on the extent to which set goals,
objectives and targets have been achieved and indicate reasons for any deviation or failure
and if possible, identify measures and actions that have been taken to address
implementation problems. Verifying the extent to which these conditions are met require
detail analysis of how LG set goals and performance indicators since they form the basis
for managing organisational performance.
6.3 Operationalising performance of local governments
It is intuitive to analyse the performance of LGs on the basis of their statutory functions.
Performance can also be studied by focusing on internal operations such as financial
performance and revenue mobilisation as well as local government outputs (Crook and

123
Manor, 1998: 8). This implies that evaluating local government performance goes beyond
intra organisational processes and capabilities by attempting to show whether the transfer
of authority, resources, and responsibility work in ways that meet local priorities (Smoke
and Oluwu, 1992). In the Ghanaian context, the analysis of LG performance is done within
the scope of statutory functions assigned to LGs. However, because it is impractical to
capture all the functions of LGS in one study, the analysis of performance management
practices in this thesis is done in two layers; the first one is limited to administrative roles
(processes) LGs perform while the second layer focuses on substantive performance with
respect to service delivery. The first category, which focuses on internal administrative
procedures, involves supervisory agencies and activities that may not have a direct effect
on local communities. It thus highlights “how” LGs operate. On the other hand, the
substantive performance category describes “what” LGs have done in terms of projects and
programmes that have a direct impact on citizens. These tangible outputs and services
include activities such as the maintenance of roads, construction of schools, market places
and the provision of water and sanitary services. But even before these process and
substantive approaches to analysing LG performance can be harnessed, it is important to
understand the fundamental issues that explain the performance of LGs.
6.3.1 Formulation of performance indicators: Whose responsibility?
The analysis of LGs performance in Ghana can be approached from two perspectives. The
first one considers LGs as an extension of central government and the second views LGs as
servants of citizens in local communities. This implies that LGs as agents have more than
one principal to serve. Contrary to the underlying logic of decentralisation, LGs appear to
be an offshoot of the central government rather than being an autonomous unit that serve
the general public. The influence of central government (CG) over LGs cannot be
underestimated given that Chief Executives (the equivalent of mayors) and 30% of LG
councillors are nominated and appointed by the President of the Republic of Ghana. In
addition, the over reliance of LGs on central government grants creates a relationship that
makes it difficult for local communities and ordinary citizens to set performance targets for
their LGs. As people who directly benefit from and are affected by the work of LGs, one
would have expected that at least, their elected representatives to the LGs would have had
a voice in formulating performance indicators for LGs to fulfil. On the contrary, indicators
that guide the performance of LGs are not locally generated as they are shaped by
guidelines developed and disseminated by the NDPC to all LGs throughout the country.
124
6.3.2 Intersections between national development policy and local government
performance
The National Development Planning Commission (NDPC) is constitutionally mandated to
advise the President on matters of development planning, policy and strategy. It also issues
planning guidelines to sector Ministries Departments and Agencies (MDAs) including LGs
for every planning cycle. Since the NDPC was established in 1995, it has developed four
(4) different national development policies each of which aspired to transform Ghana into
a middle income country. The first national development strategy the commission prepared
was known as the Ghana Vision 2020. This was subsequently replaced by the Ghana
Poverty Reduction Strategy (GPRS I) in 2003. The aim of the strategy was ‘to ensure
sustainable equitable growth, accelerate poverty reduction and protect the vulnerable and
the excluded within a decentralized, democratic environment’ (NDPC 2003).
In 2005, the GPRS I was modified into a Growth and Poverty Reduction Strategy (GPRS
II). The focus of the second strategy was “to accelerate economic growth and achieve the
status of a middle-income country within a measurable planning period”(NDPC 2005: I).
Despite claims that Ghana has become a low middle income country (Moss and
Majerowicz 2012) , the current government of Ghana upon assuming office after the 2008
presidential and parliamentary elections formulated a new national development policy
framework known as the Ghana Shared Growth and Development Agenda (GSGDA) to
advance its ‘Better Ghana Agenda’. Government Ministries, Departments and Agencies at
the national level, RCCs at the regional level as well as Metropolitan, Municipal and
District Assemblies (MMDAs) nationwide are required to implement this policy by
initiating and supporting projects and programmes consistent with the themes and priorities
of the national development blueprint. The GSGDA (2010-2013) represents the first phase
of a coordinated programme which forms the basis for the preparation of development
plans and annual budgets at the sector and district levels throughout the country (NDPC
2010).
Just like previous medium term development frameworks, the current national
development policy contains macro and micro level goals that require LGs to align their
plans in accordance with the themes of the policy. For example, LG plans are expected to
focus on, but not limited to enhancing private sector competitiveness; agricultural
modernization and natural resource management; infrastructure, energy and human
settlements development; human development, employment and productivity and promote
125
transparent and accountable governance. But in practice, translating these national policy
objectives at the LG level involves activities such as creating an enabling environment for
small scale businesses to operate, expanding access to basic needs such as potable water,
heath, education and sanitation facilities, reducing geographic disparities in the distribution
of infrastructure and improving transparency and accountability in the use of public funds.
While these ideals are undoubtedly vital, persistent calls for LGs to comply with the
directives and guidelines of the NDPC undermines the essence of adopting a bottom up
approach to development planning at the LG level. How this affects goal setting in
development planning processes of local government authorities is discussed in the next
section.
6.3.3 Medium term development plans at sub-national level
Mainstreaming development planning into local government administration is believed to
have a positive effect on organisational outcomes (Bochie 2000). In Ghana, LGs are the
highest planning authorities at the sub national level. Thus, LGs use guidelines from the
NDPC to formulate their Medium Term Development Plans (MTDPs) which have a
lifespan of 3-4 years. Aligning these plans to the national development policy framework
appears to limit the extent to which the MTDPs are grounded on local needs but policy
makers are of the view that adhering to the NDPC’s guidelines ensures harmony and
uniformity in LG’s attempt to meet national development targets. It is also perceived that
adopting similar guidelines makes it easier to evaluate and compare performance.
In practice, the extent to which LGs implement activities, projects and programmes from
their plans is crucial for understanding their performance. This view was reiterated by
development planning officers who claimed that MTDPs are a product of development
needs and aspirations of local communities. Obviously, plans had accompanying budgets
that outlined the objectives of LGs and provided the basis for allocating resources to
achieve certain objectives. Additionally, the use of plans enabled LG managers to take
decisions between alternative options on the basis of information rather than relying on
intuition alone (Boyne 2010). In the Ghanaian context, MTDPs are formulated by a
Development Planning and Coordinating Unit (DPCU) which is headed by a Coordinating
Director and a Development Planning Officer serving as Secretary. Across the study areas,
it was found that different heads of decentralised departments constituted the DPCU. This
is intended to encouraged team work, harmony and inter-sectoral coordination. The need to
126
build consensus amongst different stakeholders in formulating LG plans and budgets is
widely noted (Ayee, 2008; Mensah, 2005; Yankson, 2007).
Meanwhile, it is important to indicate that in complying with the NDPC’s planning
guidelines, LGs attempt in varying degrees to promote bottom up decision making by
incorporating Community Action Plans into Area Council Plans which are then infused
into the Medium Term Development Plans of LGs. However, this bottom up approach to
planning faces serious setbacks due to the absence of sub-district structures, particularly
area/zonal, town councils and unit committees in many districts. In the few places where
these sub-structures exist, they are unable to function properly for lack of funds (Yankson
2007). For these reasons, residents of local communities do not feel motivated to develop
Community Action Plans (CAPs) because they have no hope such plans will bring about
any meaningful development to their communities. There is also a perception that
managers of LGs are unwilling to listen to local sentiments about development needs and
priorities. Apathy towards community level consultations in particular and decentralised
planning process in general is affirmed by Ayee (2004) who observes that public hearings
neither stimulate discussions that directly concern local communities nor generate debate
on issues understood by the public. This results in a sense of disinterest and lack of
ownership amongst local residents when public hearings are held. In the northern regions
of Ghana, it was noted that pilot projects have been implemented in the ‘C’ district to
strengthen sub-district structures to address this problem by facilitating effective
development planning; yet, such initiatives could not be sustained after donor funds run
out1.
Respondents were explicit that stakeholder dialogues such as community fora and town
hall meetings are encouraged; yet, these consultations are more likely to be used to elicit
simple community needs rather than collect inputs into LG plans and budgets. Focus group
discussions revealed that budget hearings were rarely held in local communities and this
further raises doubt about local governments’ commitment to transparency and
accountability in financial management. It was reported that officials of LGs selected
secondary towns to organise community meetings to the neglect of remote villages. It was
also confirmed that community consultations were rarely held in the district capitals
1 The Ministry of Local Government and Rural Development introduced the Northern Region Poverty Reduction
Programme (NORPREP) and the Community Based Rural Development Programme (CBRDP) to support local
governments to prepare action plans based on local community priorities (MTDP:‘C’ District Assembly).
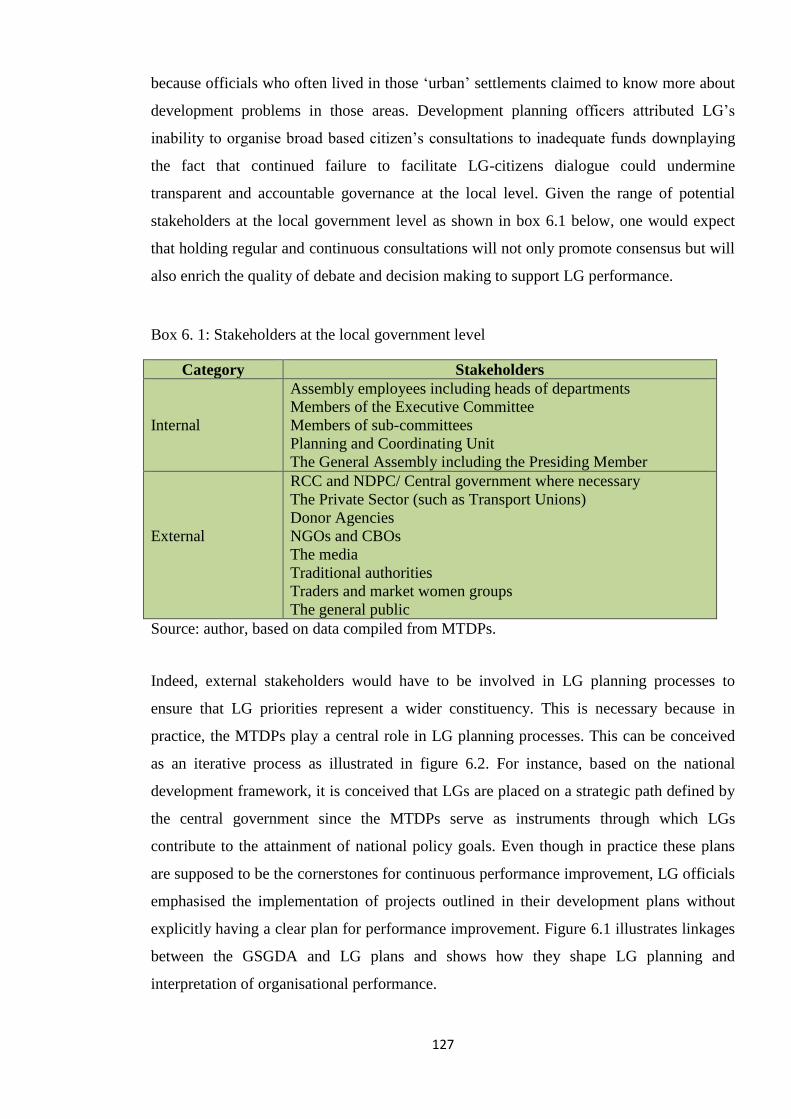
127
because officials who often lived in those ‘urban’ settlements claimed to know more about
development problems in those areas. Development planning officers attributed LG’s
inability to organise broad based citizen’s consultations to inadequate funds downplaying
the fact that continued failure to facilitate LG-citizens dialogue could undermine
transparent and accountable governance at the local level. Given the range of potential
stakeholders at the local government level as shown in box 6.1 below, one would expect
that holding regular and continuous consultations will not only promote consensus but will
also enrich the quality of debate and decision making to support LG performance.
Box 6. 1: Stakeholders at the local government level
Category Stakeholders
Internal
Assembly employees including heads of departments
Members of the Executive Committee
Members of sub-committees
Planning and Coordinating Unit
The General Assembly including the Presiding Member
External
RCC and NDPC/ Central government where necessary
The Private Sector (such as Transport Unions)
Donor Agencies
NGOs and CBOs
The media
Traditional authorities
Traders and market women groups
The general public
Source: author, based on data compiled from MTDPs.
Indeed, external stakeholders would have to be involved in LG planning processes to
ensure that LG priorities represent a wider constituency. This is necessary because in
practice, the MTDPs play a central role in LG planning processes. This can be conceived
as an iterative process as illustrated in figure 6.2. For instance, based on the national
development framework, it is conceived that LGs are placed on a strategic path defined by
the central government since the MTDPs serve as instruments through which LGs
contribute to the attainment of national policy goals. Even though in practice these plans
are supposed to be the cornerstones for continuous performance improvement, LG officials
emphasised the implementation of projects outlined in their development plans without
explicitly having a clear plan for performance improvement. Figure 6.1 illustrates linkages
between the GSGDA and LG plans and shows how they shape LG planning and
interpretation of organisational performance.
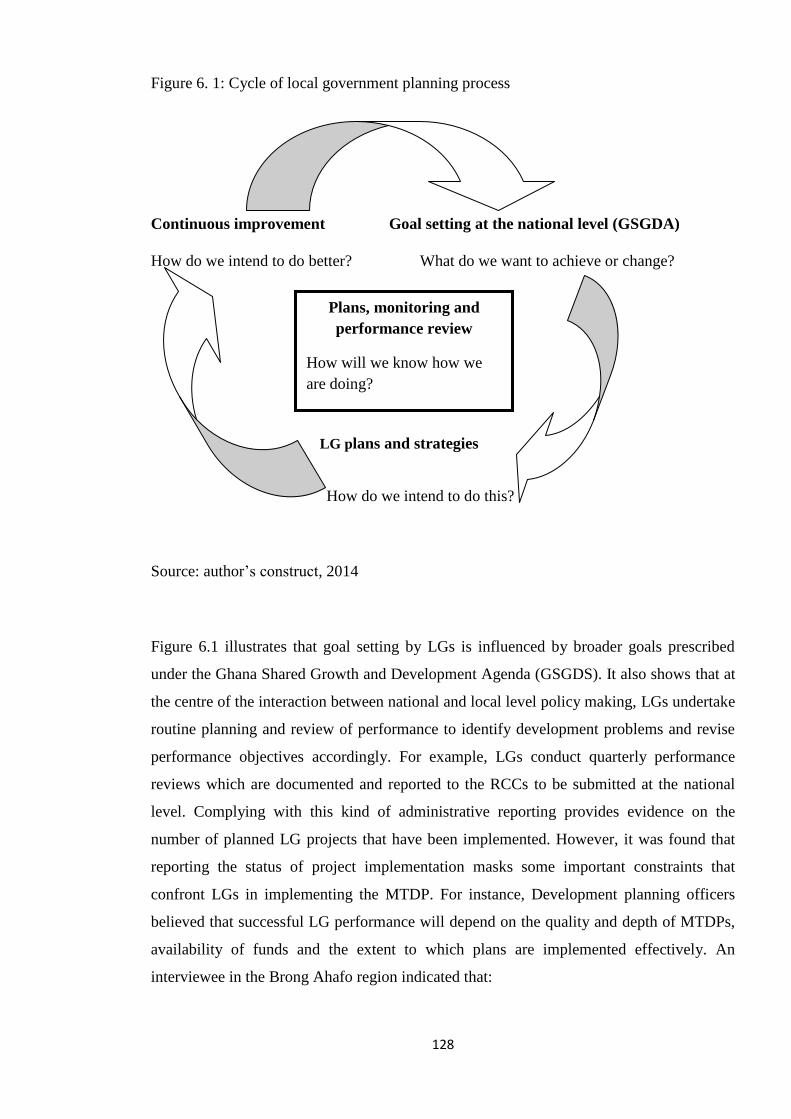
128
Figure 6. 1: Cycle of local government planning process
Continuous improvement Goal setting at the national level (GSGDA)
How do we intend to do better? What do we want to achieve or change?
LG plans and strategies
How do we intend to do this?
Source: author’s construct, 2014
Figure 6.1 illustrates that goal setting by LGs is influenced by broader goals prescribed
under the Ghana Shared Growth and Development Agenda (GSGDS). It also shows that at
the centre of the interaction between national and local level policy making, LGs undertake
routine planning and review of performance to identify development problems and revise
performance objectives accordingly. For example, LGs conduct quarterly performance
reviews which are documented and reported to the RCCs to be submitted at the national
level. Complying with this kind of administrative reporting provides evidence on the
number of planned LG projects that have been implemented. However, it was found that
reporting the status of project implementation masks some important constraints that
confront LGs in implementing the MTDP. For instance, Development planning officers
believed that successful LG performance will depend on the quality and depth of MTDPs,
availability of funds and the extent to which plans are implemented effectively. An
interviewee in the Brong Ahafo region indicated that:
Plans, monitoring and
performance review
How will we know how we
are doing?
129
“We assess ourselves based on the plans that we draw up;
and then at the end of the year, we prepare something we call
annual progress report or annual performance report to see
whether we have achieved our targets or not. By doing this,
we review our strategies and plough back lessons into future
strategies” [Field data; interview transcript from ‘B’
Municipality].
This statement confirms that development planning has become widely accepted and
mainstreamed into local government administration. A review of MTDPs revealed that LG
performance indicators were generally progressive and futuristic in nature in a way that
focused more on inputs and outputs compared to outcomes. While focusing on
performance outcome would require the incorporation of peoples’ expectations into LG
plans, the views from focus group discussions concerning the de-emphasis of LG outcomes
in MTDPs was contrary to the opinions of local government officials. For instance, LG
officials claimed that adherence to MTDPs represented their commitment to the
improvement of LG delivery of social services. However, this was completely rejected by
a unit committee member who reiterated that:
“We do not even know the content of their plans and this is
mostly the case when you are not a member of the assembly.
So when they say they plan to improve basic services, we will
challenge them because they do what they like with the
money they receive [presumably from external sources].
Since they do not come to tell us what they have done
[achieved], how can we know whether they are working to
please us”? [Field data: FGD transcript from ‘C’ District].
This rhetorical question indicates the divergent interpretation of citizens and local
government bureaucrats’ understanding of the relevance of MTDPs. Indeed, the MTDPs of
LGs were reviewed to examine the extent to which their content was influenced by the
national development policy framework (tables 6.1 and 6.2). The MTDPs explicitly outline
baseline information about the local authorities, the problems they face and the priorities
they have for implementing development projects in local communities. This is why the
MTDPs are a useful source of data for analysing the extent to which planned activities had
been carried out efficiently, effectively and to ascertain whether they were responsive to
meet the needs and demands of local communities. These planned interventions were more
often tangible and intangible projects. The former consist of activities that can be
physically verified after they have been implemented while the latter comprised intangible
130
projects such as those often described as “capacity building” initiatives that may not be
visible even after they have been implemented. Even though tangible and intangible
projects are complementary rather than substitutes, it can be argued that high levels of
poverty and infrastructure deficits in Ghana is a crucial reason why local governments tend
to prioritise projects that are visible and physically verifiable. In the words of a participant
from one of the focus group discussions:
“We will not know how the Assembly is doing (this is
interpreted as performance) if we do not see around us,
projects they have constructed for people in local
communities” [Field data, FGD transcript, ‘B’ Municipality].
It is therefore less surprising that most local governments’ priorities outlined in their
development plans tend to be physical infrastructure projects such as education, health,
roads and electrification projects. The emphasis on physical verification of LG projects to
exercise judgement of performance reinforces the focus on output performance which
consequently leads to generating performance information on output indicators rather than
desired performance outcomes. To further understand the fundamental aspects of LG
performance is to explore how LG determine organisational priorities and whose interest
such priorities serve.
6.4 Development priorities of local governments under the GSGDA: Whose
priorities?
Due to resource constraints, LGs prioritise local development problems because they are
unable to address them all at once. Meanwhile, priority development needs that emerge
from performance reviews and stakeholders’ consultations are given immediate attention.
Interviews with LG officials affirmed that members of the district planning and
coordinating units (DPCUs) select priority projects by using a pair-wise ranking procedure
that takes into account, the most serious development problems identified during
community consultations and matching these issues against themes of the Ghana shared
growth and development agenda (GSGDA). A weighting scheme is used to rank
development priorities after tallying them individually with the themes of the GSGDA. For
example, any matching pair of a local development problem and a theme of the GSGDA is
assigned a score of 2 if it is perceived as having a strong impact within a local government

131
area; a score of 1 if it is considered to have a weak impact and a score of 0 if it is
considered to have no impact.
An important reason for matching development needs and aspirations emerging from local
communities to the GSGDA is to ensure that local government plans are able to:
Meet basic human needs;
Impact on a large proportion of citizens especially the poor and the
vulnerable;
Have a multiplier effect on the local economy by creating an enabling
environment to attract small and medium scale enterprises, create jobs and
increase incomes and earnings;
Reduce rural-urban disparities in access to public goods and services; and
Tackle cross-cutting issues such as HIV/AIDS, gender equality,
environmental sustainability, and any other emerging issues (Government
of Ghana 2010).
These objectives are laudable because local governments’ MTDPs tend to achieve both
local and national level development goals. Hence, an attempt was made to examine the
extent to which LG priorities are consistent with the GSGDA. Meanwhile, since LG
determine their priorities based on local development challenges, the problems that
confront LGs were first and foremost identified and categorised according to the GSGDA
focal areas in order to ascertain whether the priorities are in anyway related to perceived
local needs. As illustrated in table 6.1 below, identifying development problems was
important because it served as a reference point for comparing and checking whether
development priorities of LGs were consistent with local development needs.
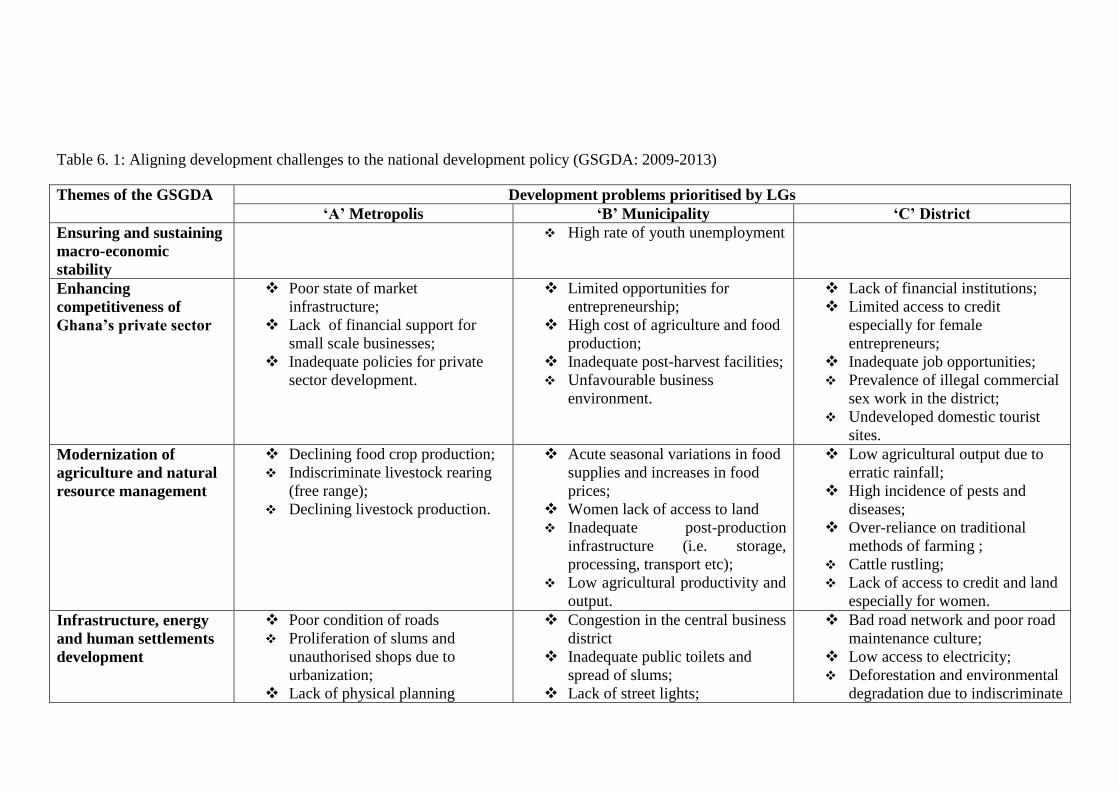
Table 6. 1: Aligning development challenges to the national development policy (GSGDA: 2009-2013)
Themes of the GSGDA Development problems prioritised by LGs
‘A’ Metropolis ‘B’ Municipality ‘C’ District
Ensuring and sustaining
macro-economic
stability
High rate of youth unemployment
Enhancing
competitiveness of
Ghana’s private sector
Poor state of market
infrastructure;
Lack of financial support for
small scale businesses;
Inadequate policies for private
sector development.
Limited opportunities for
entrepreneurship;
High cost of agriculture and food
production;
Inadequate post-harvest facilities;
Unfavourable business
environment.
Lack of financial institutions;
Limited access to credit
especially for female
entrepreneurs;
Inadequate job opportunities;
Prevalence of illegal commercial
sex work in the district;
Undeveloped domestic tourist
sites.
Modernization of
agriculture and natural
resource management
Declining food crop production;
Indiscriminate livestock rearing
(free range);
Declining livestock production.
Acute seasonal variations in food
supplies and increases in food
prices;
Women lack of access to land
Inadequate post-production
infrastructure (i.e. storage,
processing, transport etc);
Low agricultural productivity and
output.
Low agricultural output due to
erratic rainfall;
High incidence of pests and
diseases;
Over-reliance on traditional
methods of farming ;
Cattle rustling;
Lack of access to credit and land
especially for women.
Infrastructure, energy
and human settlements
development
Poor condition of roads
Proliferation of slums and
unauthorised shops due to
urbanization;
Lack of physical planning
Congestion in the central business
district
Inadequate public toilets and
spread of slums;
Lack of street lights;
Bad road network and poor road
maintenance culture;
Low access to electricity;
Deforestation and environmental
degradation due to indiscriminate
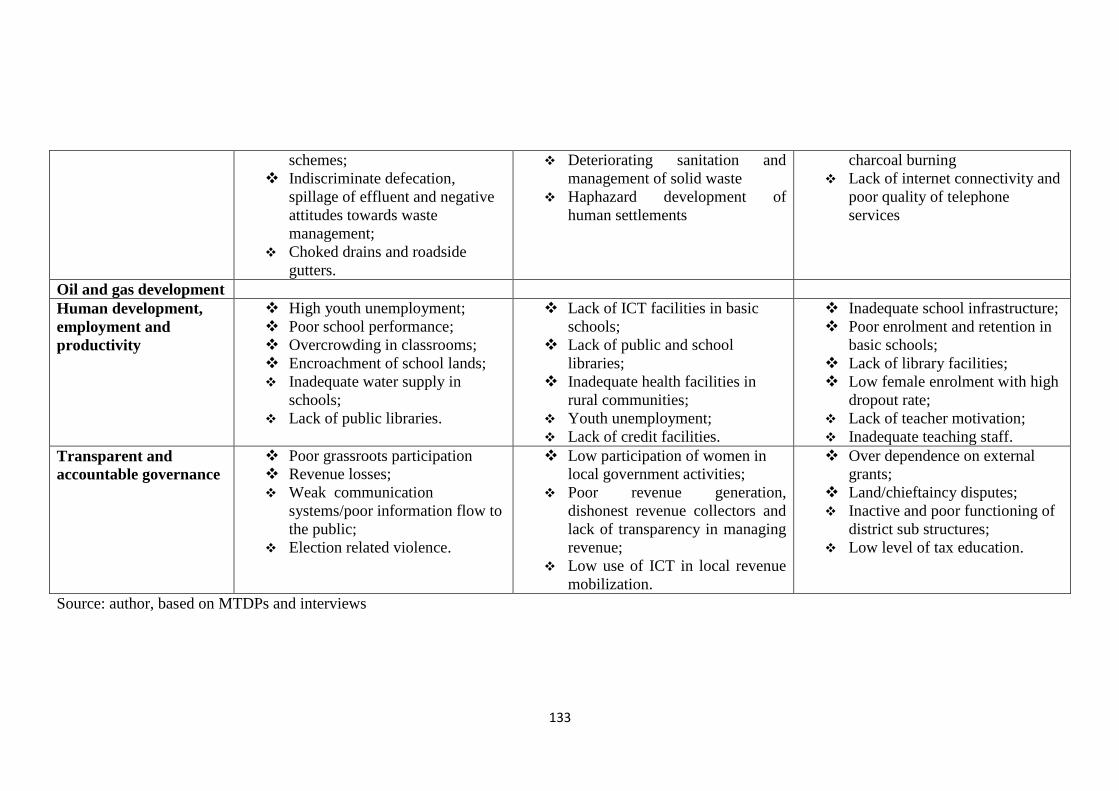
133
schemes;
Indiscriminate defecation,
spillage of effluent and negative
attitudes towards waste
management;
Choked drains and roadside
gutters.
Deteriorating sanitation and
management of solid waste
Haphazard development of
human settlements
charcoal burning
Lack of internet connectivity and
poor quality of telephone
services
Oil and gas development
Human development,
employment and
productivity
High youth unemployment;
Poor school performance;
Overcrowding in classrooms;
Encroachment of school lands;
Inadequate water supply in
schools;
Lack of public libraries.
Lack of ICT facilities in basic
schools;
Lack of public and school
libraries;
Inadequate health facilities in
rural communities;
Youth unemployment;
Lack of credit facilities.
Inadequate school infrastructure;
Poor enrolment and retention in
basic schools;
Lack of library facilities;
Low female enrolment with high
dropout rate;
Lack of teacher motivation;
Inadequate teaching staff.
Transparent and
accountable governance
Poor grassroots participation
Revenue losses;
Weak communication
systems/poor information flow to
the public;
Election related violence.
Low participation of women in
local government activities;
Poor revenue generation,
dishonest revenue collectors and
lack of transparency in managing
revenue;
Low use of ICT in local revenue
mobilization.
Over dependence on external
grants;
Land/chieftaincy disputes;
Inactive and poor functioning of
district sub structures;
Low level of tax education.
Source: author, based on MTDPs and interviews
Aligning priority development problems that LGs face to the themes of the GSGDA is seen
as a starting point for outlining measures and strategies to tackle them. Even though every
LG in Ghana adheres to the GSGDA, they employed different strategies based on the most
pressing needs in their localities. This is not surprising because the problems of LG are not
homogenous in nature. For instance in ‘A’ Metropolis, the LG set out to increase food
production in the area by 30% between 2009 and 2013; create a harmonious environment
for economic and social activities; and provide opportunities to equip unemployed youth
with employable skills. In ‘B’ Municipality, the LG sought to involve the private sector in
a public private partnership to construct public toilets that will be managed under a Build,
Operate and Transfer (BOT) arrangement whereas in the ‘C’ District, the focus was to
support ‘zoomlion’, a private waste management company, to improve upon its operations
in the district. The LG also aims to improve access to electricity and to construct roads in
rural communities to enable farmers transport their farm produce to market centres.
Meanwhile, it is important to note that matching the most pressing development problems
confronting LGs to the themes of the GSGDA is only a means to an end since that should
ultimately enable local authorities to identify measures of priority to address the problems
enumerated in table 6.1. In other words, some of the measures as shown in table 6.2 are
intended to resolve the issues outlined in table 6.1. Details of LG’s development priorities
are presented in table 6.2 below.
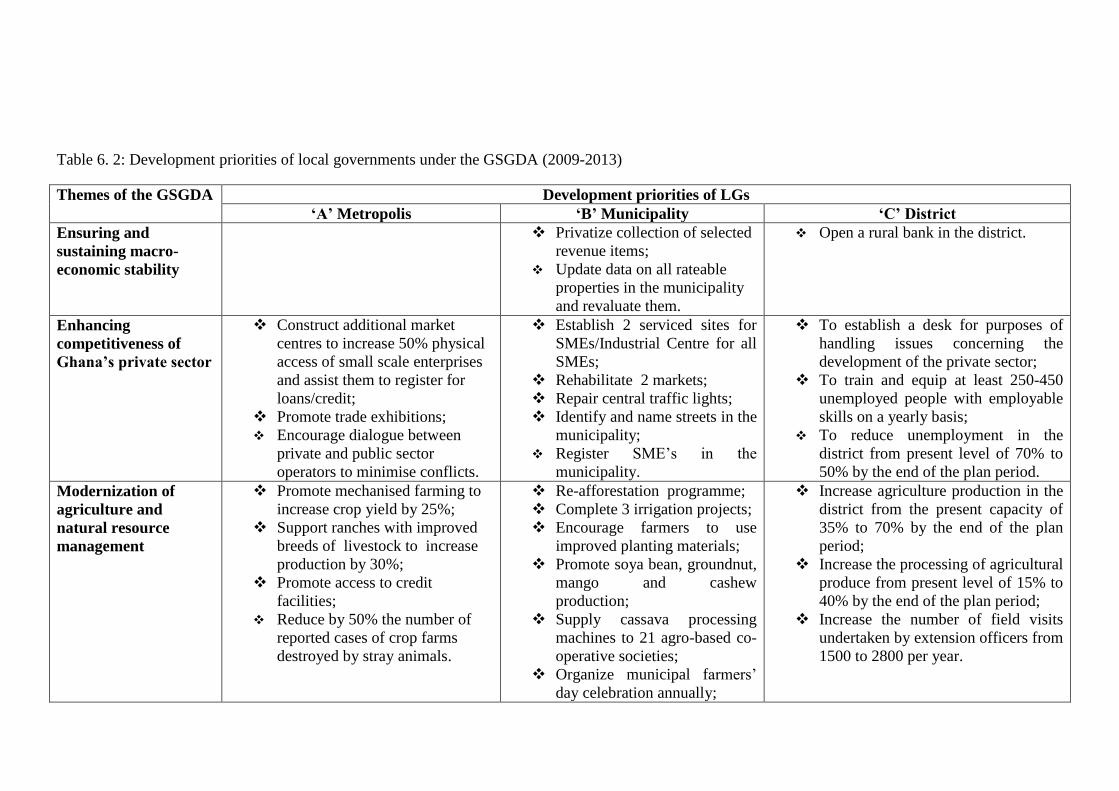
Table 6. 2: Development priorities of local governments under the GSGDA (2009-2013)
Themes of the GSGDA Development priorities of LGs
‘A’ Metropolis ‘B’ Municipality ‘C’ District
Ensuring and
sustaining macro-
economic stability
Privatize collection of selected
revenue items;
Update data on all rateable
properties in the municipality
and revaluate them.
Open a rural bank in the district.
Enhancing
competitiveness of
Ghana’s private sector
Construct additional market
centres to increase 50% physical
access of small scale enterprises
and assist them to register for
loans/credit;
Promote trade exhibitions;
Encourage dialogue between
private and public sector
operators to minimise conflicts.
Establish 2 serviced sites for
SMEs/Industrial Centre for all
SMEs;
Rehabilitate 2 markets;
Repair central traffic lights;
Identify and name streets in the
municipality;
Register SME’s in the
municipality.
To establish a desk for purposes of
handling issues concerning the
development of the private sector;
To train and equip at least 250-450
unemployed people with employable
skills on a yearly basis;
To reduce unemployment in the
district from present level of 70% to
50% by the end of the plan period.
Modernization of
agriculture and
natural resource
management
Promote mechanised farming to
increase crop yield by 25%;
Support ranches with improved
breeds of livestock to increase
production by 30%;
Promote access to credit
facilities;
Reduce by 50% the number of
reported cases of crop farms
destroyed by stray animals.
Re-afforestation programme;
Complete 3 irrigation projects;
Encourage farmers to use
improved planting materials;
Promote soya bean, groundnut,
mango and cashew
production;
Supply cassava processing
machines to 21 agro-based co-
operative societies;
Organize municipal farmers’
day celebration annually;
Increase agriculture production in the
district from the present capacity of
35% to 70% by the end of the plan
period;
Increase the processing of agricultural
produce from present level of 15% to
40% by the end of the plan period;
Increase the number of field visits
undertaken by extension officers from
1500 to 2800 per year.
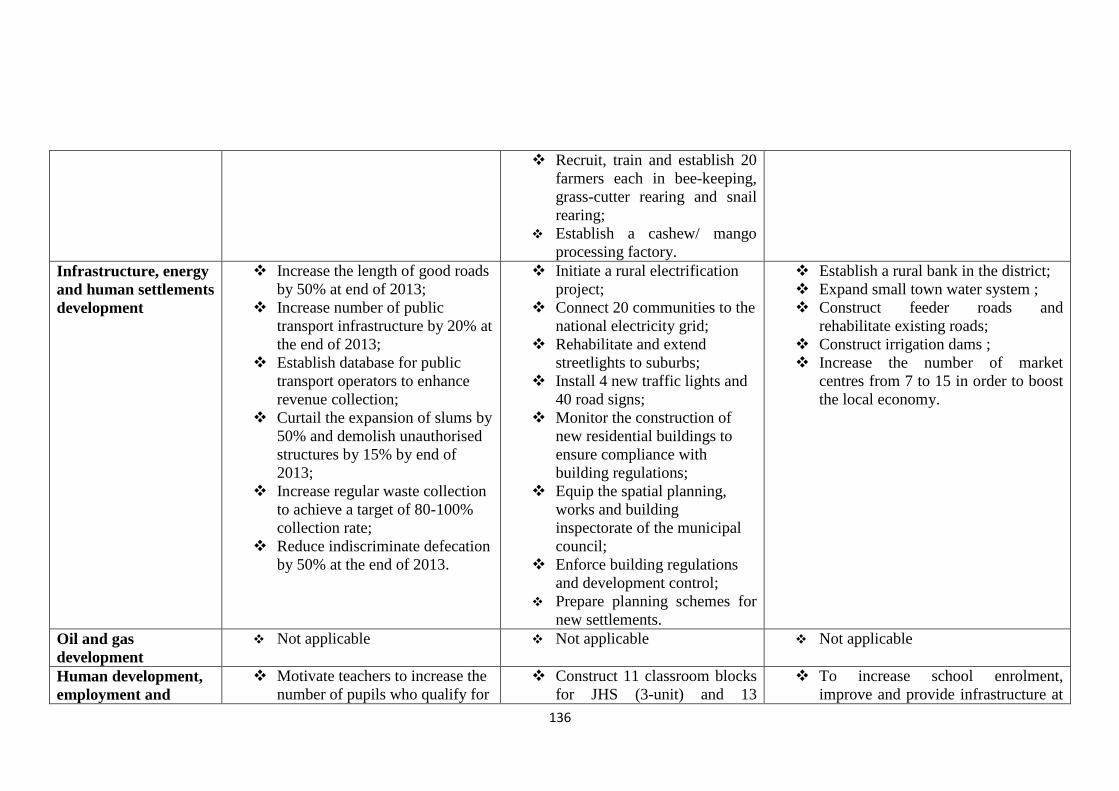
136
Recruit, train and establish 20
farmers each in bee-keeping,
grass-cutter rearing and snail
rearing;
Establish a cashew/ mango
processing factory.
Infrastructure, energy
and human settlements
development
Increase the length of good roads
by 50% at end of 2013;
Increase number of public
transport infrastructure by 20% at
the end of 2013;
Establish database for public
transport operators to enhance
revenue collection;
Curtail the expansion of slums by
50% and demolish unauthorised
structures by 15% by end of
2013;
Increase regular waste collection
to achieve a target of 80-100%
collection rate;
Reduce indiscriminate defecation
by 50% at the end of 2013.
Initiate a rural electrification
project;
Connect 20 communities to the
national electricity grid;
Rehabilitate and extend
streetlights to suburbs;
Install 4 new traffic lights and
40 road signs;
Monitor the construction of
new residential buildings to
ensure compliance with
building regulations;
Equip the spatial planning,
works and building
inspectorate of the municipal
council;
Enforce building regulations
and development control;
Prepare planning schemes for
new settlements.
Establish a rural bank in the district;
Expand small town water system ;
Construct feeder roads and
rehabilitate existing roads;
Construct irrigation dams ;
Increase the number of market
centres from 7 to 15 in order to boost
the local economy.
Oil and gas
development
Not applicable Not applicable Not applicable
Human development,
employment and
Motivate teachers to increase the
number of pupils who qualify for
Construct 11 classroom blocks
for JHS (3-unit) and 13
To increase school enrolment,
improve and provide infrastructure at
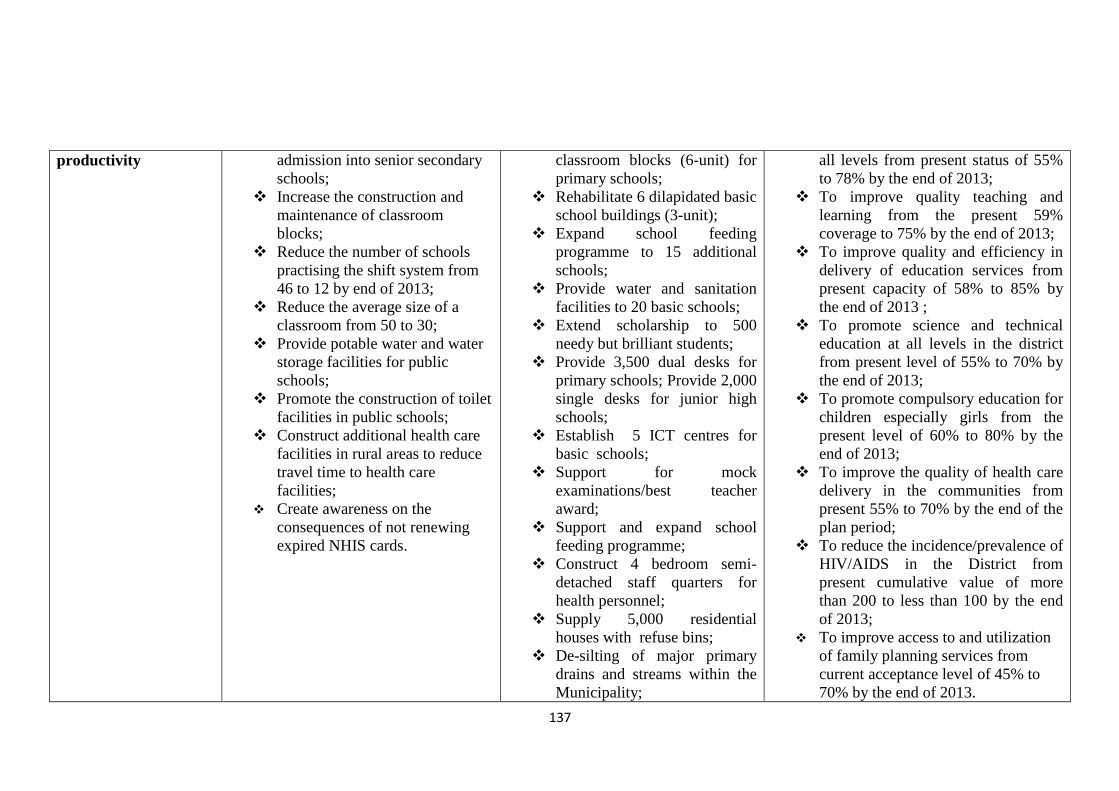
137
productivity
admission into senior secondary
schools;
Increase the construction and
maintenance of classroom
blocks;
Reduce the number of schools
practising the shift system from
46 to 12 by end of 2013;
Reduce the average size of a
classroom from 50 to 30;
Provide potable water and water
storage facilities for public
schools;
Promote the construction of toilet
facilities in public schools;
Construct additional health care
facilities in rural areas to reduce
travel time to health care
facilities;
Create awareness on the
consequences of not renewing
expired NHIS cards.
classroom blocks (6-unit) for
primary schools;
Rehabilitate 6 dilapidated basic
school buildings (3-unit);
Expand school feeding
programme to 15 additional
schools;
Provide water and sanitation
facilities to 20 basic schools;
Extend scholarship to 500
needy but brilliant students;
Provide 3,500 dual desks for
primary schools; Provide 2,000
single desks for junior high
schools;
Establish 5 ICT centres for
basic schools;
Support for mock
examinations/best teacher
award;
Support and expand school
feeding programme;
Construct 4 bedroom semi-
detached staff quarters for
health personnel;
Supply 5,000 residential
houses with refuse bins;
De-silting of major primary
drains and streams within the
Municipality;
all levels from present status of 55%
to 78% by the end of 2013;
To improve quality teaching and
learning from the present 59%
coverage to 75% by the end of 2013;
To improve quality and efficiency in
delivery of education services from
present capacity of 58% to 85% by
the end of 2013 ;
To promote science and technical
education at all levels in the district
from present level of 55% to 70% by
the end of 2013;
To promote compulsory education for
children especially girls from the
present level of 60% to 80% by the
end of 2013;
To improve the quality of health care
delivery in the communities from
present 55% to 70% by the end of the
plan period;
To reduce the incidence/prevalence of
HIV/AIDS in the District from
present cumulative value of more
than 200 to less than 100 by the end
of 2013;
To improve access to and utilization
of family planning services from
current acceptance level of 45% to
70% by the end of 2013.
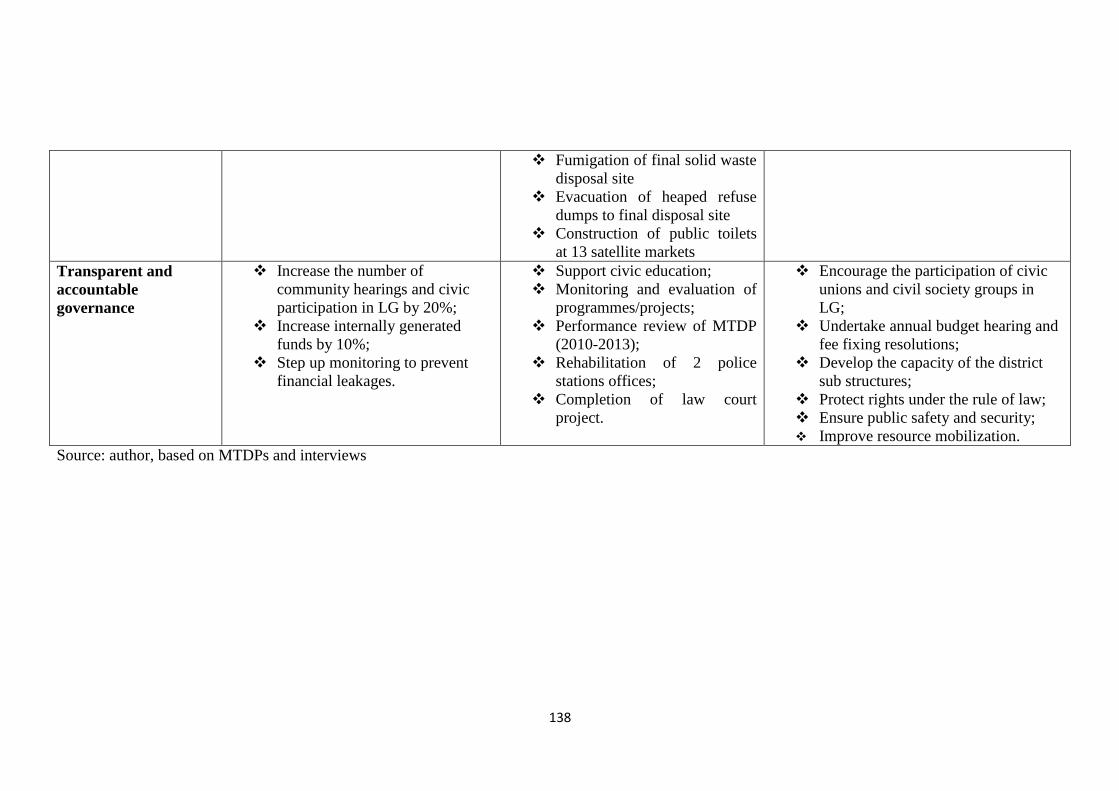
138
Fumigation of final solid waste
disposal site
Evacuation of heaped refuse
dumps to final disposal site
Construction of public toilets
at 13 satellite markets
Transparent and
accountable
governance
Increase the number of
community hearings and civic
participation in LG by 20%;
Increase internally generated
funds by 10%;
Step up monitoring to prevent
financial leakages.
Support civic education;
Monitoring and evaluation of
programmes/projects;
Performance review of MTDP
(2010-2013);
Rehabilitation of 2 police
stations offices;
Completion of law court
project.
Encourage the participation of civic
unions and civil society groups in
LG;
Undertake annual budget hearing and
fee fixing resolutions;
Develop the capacity of the district
sub structures;
Protect rights under the rule of law;
Ensure public safety and security;
Improve resource mobilization.
Source: author, based on MTDPs and interviews
Even though the above tables have highlighted problems that confront local government
authorities and measures that have been proposed to address them, some of the proposals
appeared to be vague. Nonetheless, LG officials maintained that these measures were relevant
because they fit into the GSGDA. While the NDPC’s guidelines obviously influences the way
LGs use the GSGDA to plan and identify their development priorities, there are certain practical
observations worth mentioning. Firstly, LG officials in ‘A’ Metropolitan and ‘B’ Municipal
Assemblies were unsure about how they could contribute to a generic objective such as macro-
economic stability. It was also unclear how their MTDPs could be used to assess progress with
respect to that objective. Secondly, the issue of oil and gas development specifically requires
local governments to plan towards developing oil and gas infrastructure in their respective areas
although not every region in Ghana is endowed with oil and gas resources. It is therefore
impractical for LGs to propose projects under these 2 sub themes given the inherent difficulties
involved. This does not however stop LGs from attempting to measure and manage their
performance in other operational areas. The next sections present mechanisms involved in
managing local government performance in Ghana.
6.5 Internal measures for managing local government performance
It was found that LGs carried out certain administrative procedures to keep track of
organisational performance. These procedures involved convening weekly or monthly
management meetings to closely monitor the performance of various departments under the local
authority. For instance, management meetings were steered by the Coordinating Directors and
the Chief Executives, with the latter as chair. Heads of departments and senior officers who
participated in these meetings discussed pertinent policy issues bothering on the Assemblies’
performance. Through such meetings, heads of departments are able to give updates concerning
ongoing activities, projects and programmes that are being implemented by their respective
departments. Among other things, participants of management meetings are able to explain
whether milestones and targets have been achieved and discuss any challenges that constrain
project implementation. The use of management meetings to routinely review performance
enable LGs to track progress and revise targets that have been set with respect to internal
revenue generation, infrastructure projects completion rates, waste management and sanitation
targets among others. In addition, management meetings have become a platform for monitoring
the implementation of administrative reforms. For example, it was affirmed that LG officials are

140
able to share ideas on the warrant system; a new arrangement which require the approval of three
or more officers before money is released for departmental expenses.
Apart from these management meetings, LGs in Ghana use the committee system to deliberate
on issues and take decisions that become central to local government performance. Interviewees
indicated that Sub-Committees of the Executive Committee (EXECO) were required to take
decisions which were then forwarded to the Executive Committee. This way, the actions of the
Sub-Committees defined the agenda of the EXECO where the chairperson of each subcommittee
is also a member. The committee system has become embedded into the management of LGs to
the extent that by effectively adhering to the operations and standing orders of the EXECO and
its sub-committees legitimises the administrative practices of LGs. To encourage regular
executive meetings, an indicator that specifically focuses on the frequency of these meetings is
included into the FOAT assessment framework (see appendix 4). While this is aimed at
motivating local governments to organise regular EXECO meetings prior to general assembly
meetings, it is a common secret that most LGs convene General Assembly meetings without first
holding an EXECO meeting. In the northern region, an interviewee indicated that:
“The assembly owe us [assembly members] sitting allowances from
our previous meetings. Sitting allowances for sub-committee
meetings are in arrears of more than three sittings. This has made
it difficult for the assembly to convene an Executive Committee
meeting because all the chairpersons of the sub-committees who
are also automatic members of the Executive Committee have
unanimously agreed to press for the payment of our arrears. Even
though we [assembly members] were recently invited to a General
Assembly meeting, the Executive Committee failed to sit before the
General Assembly met” [field data, interview transcript, ‘C’
District].
This response reveals how local government authorities occasionally circumvented their own
laid down procedures (model standing orders) despite the consequences that may follow. Yet,
local government administrators rely on these internal performance monitoring practices to keep
local officials informed and up to date with regard to the work of the local authority. Hence,
these internal mechanisms are crucial for identifying issues that deserve the attention of the
Executive Committees of the Assemblies. However, the exclusion of local government
councillors, both appointed and elected, from these meetings tends to make management of LG
the preoccupation of bureaucrats alone. It is therefore less surprising that bureaucratic capture
has become entrenched in the management of LGs. This is supported by previous research
findings which revealed “that some sub-committees had only one meeting per year while others

141
had no meetings at all. Inadequate meetings were attributed to the lack of schedules for meetings
and the lack of funding. Almost three-quarters (73 per cent) of the sub-committees were
described by the district coordinating directors (DCDs) as ineffective, mostly because the
majority of the members had little knowledge for discussing substantive issues and had poor
understanding of the tenets of the local government system. The Assemblies also had limited
funds to finance regular meetings so they often relied on decisions taken by the heads of
decentralised departments, the executive committees and the presiding members” (Mensah,
2005: 258).
In addition to the administrative processes described above, an important component of
managing LGs is rooted in the formulation and implementation of medium term development
plans (MTDPs). Ideally, these plans are supposed to be the result of a combination and
harmonisation of various community action plans, area level plans and sectoral plans. The
MTDPs of LGs and their accompanying budgets are implemented after they have been discussed
and adopted by the General Assembly. Meanwhile, because all the activities captured in plans
cannot be carried out at once due to resource constraints, local government authorities, through
their DPCUs, develop annual action plans which are spread over a three year period for
implementation. In addition to this, planning officers prepare quarterly, mid-year and annual
performance progress reports that serve as a reference document for evaluating LG performance.
These reports are prepared using data collated from various departments based on activities they
have undertaken or services that have been delivered. By consciously keeping record of activities
and projects that have been implemented, local government officials are able to gather
performance information by comparing targets with actual achievements. The use of such
information by LGs themselves or by external supervisory agencies is vital for managing LG
performance. Hence, the plans of LG play a crucial role in providing performance information.
The ensuing section examines modalities through which LGs manage their performance based
on inter-organisational relations involving supervisory agencies.
6.6 External measures for managing local government performance
Local government’s performance management practices goes beyond the use of internal
organisational structures and performance monitoring procedures. It also involves external
supervisory agencies that exercise oversight over LGs. These agencies include the Regional
Coordinating Councils and the National Development Planning Commission, the office of the
District Assembly Common Fund Administrator and the Ministry of Local Government. The
142
specific ways in which these agencies institutionalise performance management at LG level is
examined below.
6.6.1 Local government authorities and regional coordinating councils interface
The oldest approach to managing LG performance in Ghana involves monitoring the
performance of LGs by the RCCs. This mechanism is enshrined in Article 142 (1) of the Local
Government Act (1993) Act 462 which requires RCCs to monitor, co-ordinate and evaluate the
performance of the Metropolitan, Municipal and District Assemblies in the regions; monitor the
use of funds allocated to LGs by central government agencies; and to review and co-ordinate
public services in the regions.
In a typical bottom-up approach to performance reporting, it was found that LGs did prepare and
submit performance reports to the NDPC through the RCCs to fulfil the above statutory
performance management requirement. The purpose for reporting LG performance is to ascertain
whether planned projects and services earmarked for communities have been implemented or not
and to identify relevant issues associated with such projects. Thus, the RCCs are strategic
intermediaries between central and local governments due to the role they play in disseminating
performance information to the centre. There have been instances where RCCs requested LGs to
modify their plans to conform to NDPC planning guidelines for the purpose of uniformity. Some
LG managers view the interaction between the RCCs and LGs as crucial especially when the
outcome of monitoring LG performance affects disbursement of their share of the DACF. For
example, it was indicated that DACF allocation for the ‘A’ Metropolis was withheld in 2008
because the RCC detected the authority’s failure to invest previous DACF allocations as
specified in their plans and budgets. The impact of the DACF delay however had very little
impact on the Metropolitan Authority’s operations because they relied on their huge IGF base.
Another important outcome of RCC supervision of LG performance culminates in the collation
of MTDPs of LGs at the regional level into a composite regional plan which is submitted to the
NDPC and MLGRD at the central government level. Yet, there are certain issues that affect the
efficacy of the RCCs in managing LG performance. Firstly, the RCC is perceived by some
elected Assembly members as an off-shoot of central government that unnecessarily interferes
with LG affairs. Secondly, the Regional Coordinating Councils and their Regional Planning and
Coordinating Units neither have the powers of local governments nor sufficient resources to
143
undertake regular performance monitoring. Even though the RCCs often report the performance
of LGs to the NDPC based on the implementation of MTDPs, there are certain concerns that
need to be redressed. A study on LGs’ implementation of MTDPs in Ghana noted that even
though:
“The NDPC conduct spot-checks on a regular basis...the NDPC
and RPCUs [only] harmonised the plans [of LGs] without
monitoring plan implementation. Such lapses allowed the DAs to
put aside the plans and act according to the whims and caprices of
the few powerful people in the districts” (Mensah 2005:266).
While this assertion may hold true for many LGs in Ghana, it appears the close proximity of the
RCCs to Metropolitan, Municipal and District Assemblies is not being used to prevent this from
happening. Despite their supervisory powers, the RCCs could not directly influence the
performance of LGs beyond encouraging them to stick to priorities in their MTDPs. Yet, some
research participants were critical about the role of the RCCs in managing LG performance to
reflect national policy objectives. An interviewee emphatically stated that:
“The NDPC does not properly monitor how the assemblies are
implementing the national policy framework. The policy framework
is always one year late because we have to wait for them [NDPC]
to finalise the policy before we formulate our plans accordingly.
This is affecting our performance as an assembly so I think the
NDPC should organise a stakeholders’ forum to see what is
happening on the ground” [Field data, interview transcript, ‘A’
Metropolitan Assembly].
Implicit in the above quotation is an affirmation that managing LG performance is inextricably
linked to the overall national development policy framework. Yet, growing concern amongst LG
officials about the role of national policy and actual LG performance needs attention. Pragmatic
measures are therefore needed to strengthen the RCCs role in managing LG performance in
order to reverse the perception that performance reporting to the RCCs and the NDPC amount to
a mere bureaucratic procedure as the RCCs are not able to provide adequate information about
the status of LG performance in the regions.
144
6.6.2 Local government authorities and the district assembly common fund interface
Local governments face financial constraints in fulfilling their expenditure functions and
assignments. To ensure that finance follows functions, the 1992 Constitution under article 252
established a District Assembly Common Fund (DACF), a common-pool fund set aside to
receive and disburse not less than 5% of total government revenues to LGs. Subsequently, a
District Assemblies Common Fund Act 1993 (act 455) defined total revenues of Ghana as “all
revenue collected by or accruing to the central government other than foreign loans, grants, non-
tax revenue and revenues already collected by or for DAs under any enactment in force”. The
fund is allocated to all LGs on the basis of a formula approved by Parliament and should ideally
be disbursed in quarterly instalments by the DACF Administrator (Banful 2011). The DACF
share of government expenditure was increased to 7.5% in 2007 and has become the most
significant source of funds to LGs compared to the share of Internally Generated Funds (IGF),
that is, the funds that LGs themselves raise from local fees and taxes (SEND, Foundation, 2013).
Thus, LGs depend almost entirely on the district assembly common fund and other external
sources for funds even though this undermines their independence (Crook and Manor, 1998;
Ayee, 2008). And because the DACF is used to fund most LG capital budgets, its utilisation is
closely monitored by the Office of the DACF Administrator, and integrated into LG performance
management system. An interviewee in the northern region affirmed that:
“Without the DACF, the Assembly cannot exist because if we
compare the DACF to IGF, it tells us that the Assembly cannot
survive without the DACF” [Field data, interview transcript, ‘C’
District Assembly].
From figure 6.2 below, it is obvious that LGs have not been able to generate revenue to
match increasing external funds. Some experts have attributed declining locally generated
funds to the increasing trend of central government funds and the fact that DACF
disbursement are sometimes politically motivated and not tied to specific performance
criteria (Mogues et al. 2010;Banful 2011). In fact, disbursement of the DACF has become
infamous for persistent delays, being irregular and unpredictable in ways that adversely
affect the accuracy of financial forecasts, development planning, and budgeting and
overall local government performance.
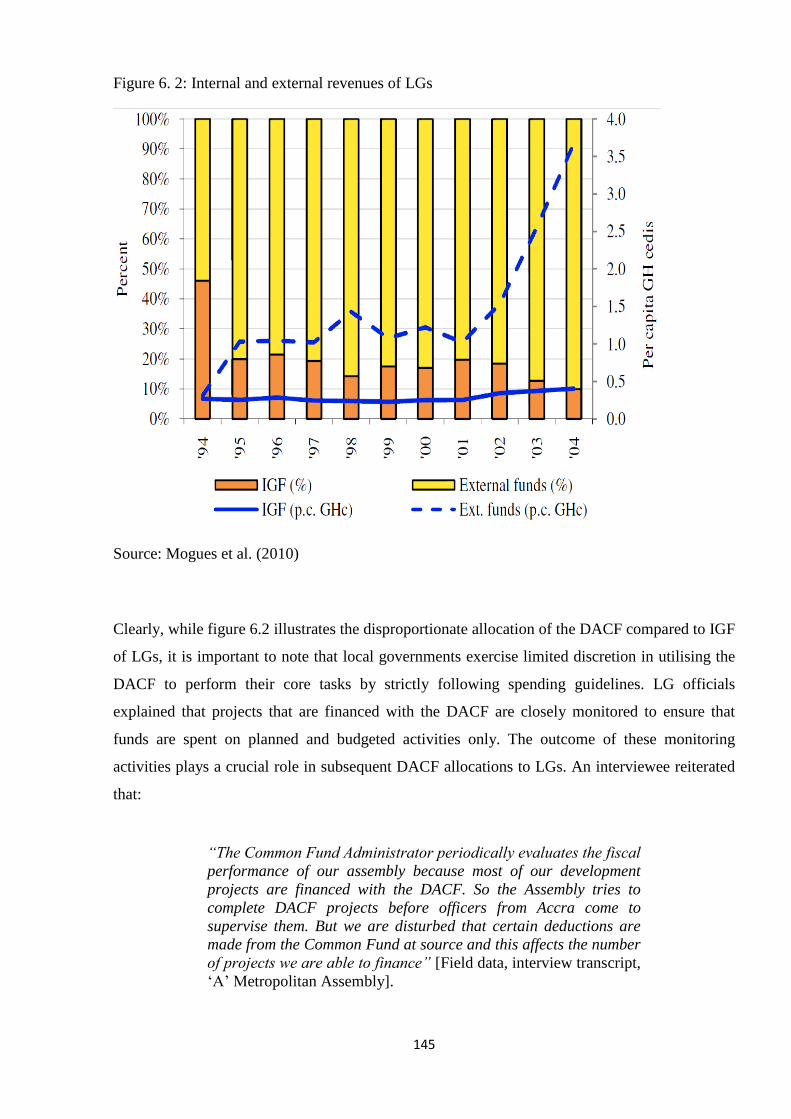
145
Figure 6. 2: Internal and external revenues of LGs
Source: Mogues et al. (2010)
Clearly, while figure 6.2 illustrates the disproportionate allocation of the DACF compared to IGF
of LGs, it is important to note that local governments exercise limited discretion in utilising the
DACF to perform their core tasks by strictly following spending guidelines. LG officials
explained that projects that are financed with the DACF are closely monitored to ensure that
funds are spent on planned and budgeted activities only. The outcome of these monitoring
activities plays a crucial role in subsequent DACF allocations to LGs. An interviewee reiterated
that:
“The Common Fund Administrator periodically evaluates the fiscal
performance of our assembly because most of our development
projects are financed with the DACF. So the Assembly tries to
complete DACF projects before officers from Accra come to
supervise them. But we are disturbed that certain deductions are
made from the Common Fund at source and this affects the number
of projects we are able to finance” [Field data, interview transcript,
‘A’ Metropolitan Assembly].
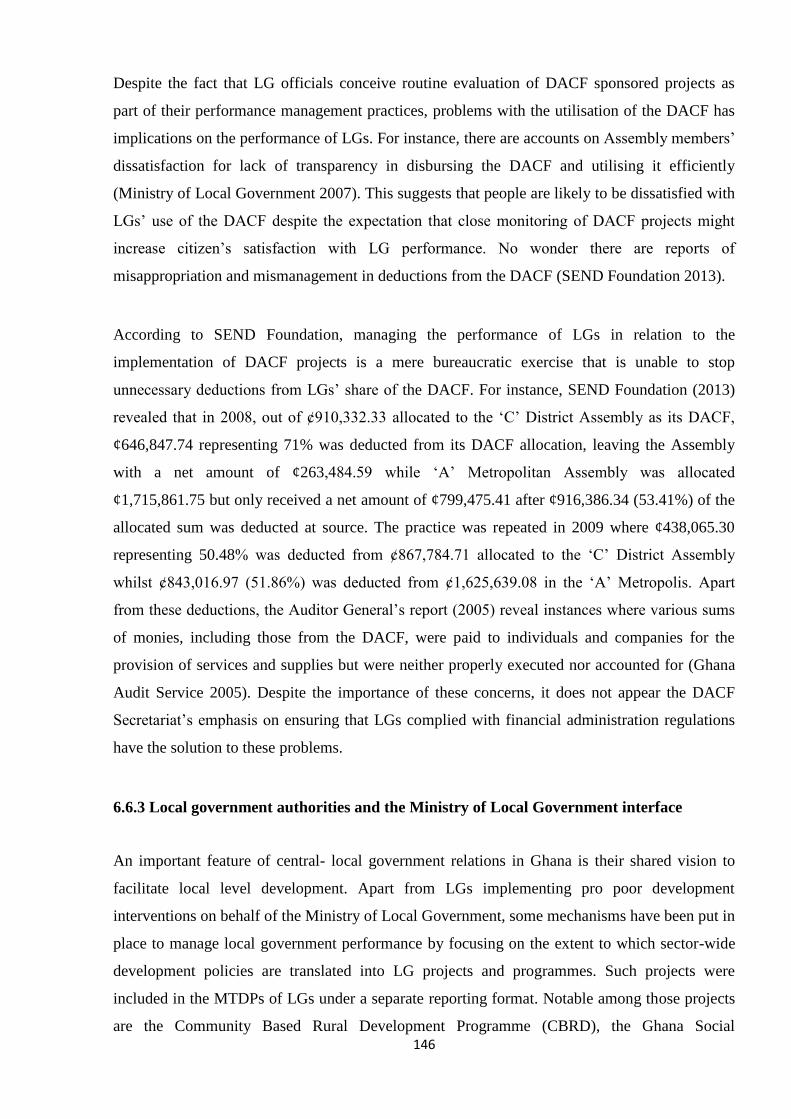
146
Despite the fact that LG officials conceive routine evaluation of DACF sponsored projects as
part of their performance management practices, problems with the utilisation of the DACF has
implications on the performance of LGs. For instance, there are accounts on Assembly members’
dissatisfaction for lack of transparency in disbursing the DACF and utilising it efficiently
(Ministry of Local Government 2007). This suggests that people are likely to be dissatisfied with
LGs’ use of the DACF despite the expectation that close monitoring of DACF projects might
increase citizen’s satisfaction with LG performance. No wonder there are reports of
misappropriation and mismanagement in deductions from the DACF (SEND Foundation 2013).
According to SEND Foundation, managing the performance of LGs in relation to the
implementation of DACF projects is a mere bureaucratic exercise that is unable to stop
unnecessary deductions from LGs’ share of the DACF. For instance, SEND Foundation (2013)
revealed that in 2008, out of ¢910,332.33 allocated to the ‘C’ District Assembly as its DACF,
¢646,847.74 representing 71% was deducted from its DACF allocation, leaving the Assembly
with a net amount of ¢263,484.59 while ‘A’ Metropolitan Assembly was allocated
¢1,715,861.75 but only received a net amount of ¢799,475.41 after ¢916,386.34 (53.41%) of the
allocated sum was deducted at source. The practice was repeated in 2009 where ¢438,065.30
representing 50.48% was deducted from ¢867,784.71 allocated to the ‘C’ District Assembly
whilst ¢843,016.97 (51.86%) was deducted from ¢1,625,639.08 in the ‘A’ Metropolis. Apart
from these deductions, the Auditor General’s report (2005) reveal instances where various sums
of monies, including those from the DACF, were paid to individuals and companies for the
provision of services and supplies but were neither properly executed nor accounted for (Ghana
Audit Service 2005). Despite the importance of these concerns, it does not appear the DACF
Secretariat’s emphasis on ensuring that LGs complied with financial administration regulations
have the solution to these problems.
6.6.3 Local government authorities and the Ministry of Local Government interface
An important feature of central- local government relations in Ghana is their shared vision to
facilitate local level development. Apart from LGs implementing pro poor development
interventions on behalf of the Ministry of Local Government, some mechanisms have been put in
place to manage local government performance by focusing on the extent to which sector-wide
development policies are translated into LG projects and programmes. Such projects were
included in the MTDPs of LGs under a separate reporting format. Notable among those projects
are the Community Based Rural Development Programme (CBRD), the Ghana Social

147
Opportunities Programme (GSOP), the Urban Poverty Reduction Programme (UPRP), School
Feeding Programme (FSP), Food Security Programme (FSP), and the Ghana Urban Management
Programme. All these projects fall within the remit of the Ministry of Local Government but co-
financed by donors and the government of Ghana. Most of the projects also tend to concentrate
more on the economically impoverished northern regions compared to urban areas in the South.
For example, EU funded micro projects and village infrastructure projects have increased access
to basic services upon the construction of schools and health facilities in the three northern
regions. Donor funded projects have enabled LGs to implement local economic development
projects, provide public infrastructure and sponsor training workshops to build organisational
capacity. An interviewee indicated that:
“Project coordinators from the Ministry [of Local Government]
come here to observe how the Assembly is performing in terms of
implementing activities in relation to specific projects whether
under the CBRDP or GSOP [sic]. It is discomforting when we have
nothing to show during such trips, therefore, we strive to ensure
that our activity schedules are up to date” [Field data, interview
transcript, ‘C’ District Assembly].
Indeed, periodic field trips by officers from project coordinating units at the Ministry of Local
Government are used to ‘put local officials on their toes’, thereby promoting a sense of
timeliness in project completion rates. Similar to the findings related to the RCCs, the
submission of ‘quarterly progress reports’ to the MLGRD is conceived as an administrative
necessity particularly when LG inspectors from the Ministry fail to verify whether the contents
of plans are visible on the ground. Research participants claimed the MLGRD focuses on
verifying the implementation of LG projects funded by the Ghana Education Trust Fund
(GETFUND), Social Investment Fund (SIF), and the District Development Facility (DDF).
Nonetheless, officials at the Ministry of LG proclaimed that physical verification of performance
through field trips has been useful, especially when documentary record of project status differ
from the reality. Yet, there are no rewards or sanctions for LGs or officials that either meet or
fail to meet performance targets associated with certain specific projects.
It is important to emphasise that officials who participated in this research unanimously agreed
that LGs manage their performance through the aforementioned interfaces. Opinions however
varied about the extent to which each of these performance management practices impacted on
LG performance. For instance, LGs received no direct benefit in terms of performance-based
148
rewards nor suffered any consequences from performance-based sanctions. This could render
the performance management regime ineffective contrary to what pertains in other countries
where publication of star ratings could expose managers of public service organisations to
‘naming and shaming’ and increase the risk of getting sacked as a result of poor organisational
performance (Bevan and Hood 2006). At the centre of all the above performance management
arrangements is the analysis and evaluation of LG plans to determine whether performance
targets have been achieved or not. This practice is consistent with the goal attainment model of
managing performance in which an organisation’s achievements are examined against set goals.
Yet in practice, there have been several instances where plans have not yielded the anticipated
performance outcomes (Mensah 2005). In this research, problems that affected effective
implementation of LG plans were linked to several factors some of which are discussed in the
next section.
6.7 Challenges with the implementation of plans and its implications for managing local
government performance
The implementation of MTDPs was fraught with obstacles that were predominantly
administrative, structural, political and financial in nature. Administratively, there were, as there
are today, serious lapses in terms of coordination within and between departments of LGs and
their satellite offices at the regional and national levels. Parallel and sometimes conflicting
reporting mechanisms between decentralised departments and their parent offices did create
confusion. For example, the Electricity Company of Ghana, the Ghana Police Service and the
Ghana Water Company Limited, three very crucial service agencies continue to report to their
regional offices in ways that do not enhance collaborative monitoring of performance. An
interviewee lamented that the situation is particularly worse when contracts for public projects
are awarded at the central government level without consulting local authorities only for them to
be pleasantly surprised about the existence of such ‘ghost’ projects later on. In the words of a
Coordinating Director:
“Sometimes, contractors working in this district bump into the
District Engineer’s office to sign their certificate (cheques) for
them when the engineer has no clue about the nature and quality of
work done. As beneficiaries, we (LG officials) expect more
coordination with Accra. This can simply mean giving us detail
information about projects initiated on our behalf; it is difficult to
ensure value for money without proper coordination” [Field data,
interview transcript, ‘B’ Municipal Assembly].
149
Also, given that MTDPs serves as the menu for implementing specific activities and projects at
the local level, they are crucial for examining the performance of LGs. Yet, detailed analysis of
quarterly, mid-year and annual performance review reports revealed that goals and targets were
mostly combined and vaguely stated; making it difficult to compare output performance. In
addition, planned projects were often diverted to locations that were not stated in development
plans of large urban LGs; and only few of the agencies identified as collaborators for the
implementation of LG projects were actively engaged. These constrained LGs from
implementing pre-planned projects within stipulated time frames. Throughout the study areas,
projects that failed or delayed to take off were often attributed to insufficient funds owing to
poor internal revenue generation and erratic disbursement of the DACF. Widening financing
gaps, worsened by resource wastage and poor monitoring and control systems often impeded the
implementation of development plans (GOG, 2010). There were consequences arising from local
government officials blaming their ‘lean-budgets’ on arbitrary deductions from the DACF. For
this reason, experienced contractors avoid bidding for DACF funded projects because irregular
flow of funds for such projects frustrates their businesses. LGs therefore pay the price when
infrastructure projects are awarded to inexperienced contractors- a phenomenon which often
ends up in poorly executed projects of substandard quality.
Another problem affecting the implementation of MTDPs with implications on the performance
of LGs relate to instances where Chief Executives interfered with the planning process by
influencing the implementation of projects that were not pre-planned. Within the ‘A’ Metropolis,
only 40% of planned projects were implemented from the MTDP in 2008 compared to 60%
unplanned projects. Because such variance implies that priority projects were abandoned for
unplanned and unbudgeted projects, the Metropolitan Assembly had its DACF withheld. Even
though it survived on its extensive pool of IGF, the situation would have been unbearable for
smaller rural LGs that barely have any IGF and only depend on the DACF to survive. It can thus
be argued that political manipulation of LG plans are bound to recur as long as partisan interests
continue to influence decisions taken at Executive Committees meetings since that is where the
agenda is set for General Assembly meetings.
Furthermore, it was found that lack of interest in, and support to the DPCU had implications for
the effectiveness of plans and their impact on the performance of LGs. In all the regions, the
DPCUs had insufficient funds and basic office equipment such as computers and printers to
work with. Also, many LG officials complained about the absence of vehicles to undertake
community visits and organise public hearings to consult communities on their development
150
priorities. Interestingly, in local communities that have powerful traditional leaders, tension
between LG officials and paramount chiefs create obstacles for effective implementation of
plans. As custodians of the land, traditional leaders often demand a proportion of LG revenues
(about 20% in the ‘B’ municipality for any land required for development projects) but low IGF
makes such payments unsustainable. In the ‘B’ municipality for instance, LG managers organise
periodic cultural durbars at the paramount chief’s palace to inform and update the populace
about progress and challenges they face in developing local communities. Such platforms are
used, albeit less frequently, to mobilise support and continued cooperation from community
leaders to foster greater development. This is intended to improve current low levels of
community awareness of LG development projects, increase public interest in the work of LGs,
and dissuade persistent political partisanship in LG decision making.
6.8 Conclusion
The study found that LG’s attempts to manage organisational performance are internally and
externally driven. Managing LG performance internally is based on the vibrancy and
effectiveness of management committees; executive committees and its sub-committees. In
addition to these internal mechanisms, the span of managing LG performance extends to, and
involves external supervisory agencies such as the Regional Coordinating Councils and the
National Development Planning Commission, the Ministry of Local Government and the
Administrator of the DACF who routinely inspect and evaluate LG’s adherence to legal and
administrative regulations to ensure that LGs comply with NDPC guidelines, financial
administration regulations and project monitoring guidelines among others. This finding is
consistent with the goal attainment model as it reveals the significance of comparing LG goals
outlined in MTDPs to actual performance information documented in annual performance
reports. It must be emphasised that both internal measures of monitoring performance and the
evaluation of LG performance by external supervisory agencies enhances what Hostefe (1981)
describes as ‘political’ and ‘managerial’ controls. But does the inspection of LGs show whether
they do things right and do the right things? Answering this question is important given that
external performance reporting to principals (politicians, clients or citizens) can create pressure
on an organisation to reform internally particularly when it is performing poorly (Moynihan
2008). However, as elaborated in subsequent chapters, it could be misleading to assume that “the
possession and submission of performance information symbolises (and demonstrates) the ability
and legitimacy of decision makers (LG managers) to resolve substantive uncertainties [when in
practice], decision makers gather information and do not use it” (Pollitt, 2013: 354).
151
With respect to the role of national development policy on how local governments manage their
performance, this chapter explored and discussed how performance management practices of
LGs are interwoven into the national development policy framework through planning and
reporting procedures. It was evident that while the formulation of MTDP is expected to follow a
bottom up participatory process, LG plans were unfortunately formulated with very minimal
input from local communities because community hearings were seldom held (Crawford 2009;
Ayee 2004). Indeed, contrary to the core values of decentralisation which encourages giving
power to people in local communities, the entire plan formulation process is rather characterised
by considerable bureaucratic capture. Even though this could be attributed to low level of
education and influence amongst elected Assembly members, the impact of the GSGDA in
shaping the content of LG plans and the work of LGs in Ghana cannot be underestimated and
this has serious implications for the independence of LGs.
For instance, LGs rarely developed their own unique performance management systems since
they look up the central government to assess their performance. Therefore, the criteria for
assessing LG performance is determined by, and satisfies only central government agencies
rather than local communities; the supposed principals of local government authorities anywhere
in the world. Clearly, these findings show that while the existing mechanisms for managing LG
performance have been mainstreamed into the management of LGs in Ghana, they have not been
able to provide clear linkages beyond LG’s compliance to performance guidelines imposed by
the central government. Thus, LGs continue to produce and submit performance information to
central government agencies without the latter scrutinizing how that represents actual
performance on the ground. This has consequently led to the institutionalisation of upward
accountability compared to downward accountability which further weakens the position of local
communities from holding their LGs accountable. Therefore, it can be concluded that the
consequences of reporting LG performance to supervisory agencies has a disempowering effect
on assembly members and the general public to genuinely set LG priorities in ways that reflect
local circumstances and demand for accountability from LG officials.
In sum, this chapter highlights the importance of development plans for managing LG
performance at the organisational level. This is why assessing LG performance in Ghana
involves the analysis of MTDPs, which is not only widely institutionalised, but also supported
and recognised by central government and local stakeholders, at least in official terms, as the
acceptable way of managing the performance of local government authorities. Meanwhile, the
successful implementation of LG plans is not always guaranteed due to poor inter-organisational

152
coordination, financial constraints, ineffective monitoring of projects and political interference in
LG performance. The findings in this chapter suggests that it is not enough for LGs to abide by
performance reporting procedures without having any incentive to motivate effective plan
implementation or sanction LG managers who indulge in impropriety without recourse to legal
and regulatory requirements. This inherent weakness of the mechanisms for managing LG
performance as discussed in this chapter has in part necessitated the introduction of a
performance-enhancing policy initiative which is often touted as a best-practice performance
management system. This is explored in the next chapters.
153
Chapter 7: Exploring the scope of performance–enhancing policy: The case of the District
Development Facility-Functional Organisational Assessment Tool
“A performance management system that seeks to improve organisational
performance in the public sector must recognise and involve multiple dimensions and
stakeholders” (Kaplan and Norton 2001b).
7.1 Introduction
The objective of this chapter is to examine the extent to which performance indicators under the
performance management regime cover multiple dimensions of local government performance.
The chapter specifically focuses on minimum conditions and performance measures under the
District Development Facility (DDF) and the Functional Organisational Assessment Tool
(FOAT) to understand whether and how they holistically evaluate LG performance in ways that
serve the interests of different stakeholders at the local level. To achieve this objective, the BSC
is used to analyse the extent to which MCs and PMs under the DDF FOAT assess LG
performance from a financial perspective, internal processes, learning and innovation and
citizens’ perspectives. Since the DDF-FOAT is a strategy for improving LG performance in
Ghana, applying the principles of the BSC is appropriate and significant because it is widely
recognised as a valuable tool not only for measuring organisational performance, but also for
implementing performance management systems; one that can help organizations to improve
upon the implementation of strategy (Kaplan and Norton 1992;Kaplan and Norton 1996a;Kaplan
and Norton 2001a). Thus, a critical analysis of the DDF-FOAT initiative will reveal whether
existing mechanisms for evaluating LG performance is balanced, efficient and effective; and
whether the framework promotes service delivery and puts value on results for LG employees
and local communities.
7.2 An overview of the district development facility and the functional organisational
assessment tool
To deal with performance related problems of LGs in Ghana, the government in collaboration
with four development partners; Canadian International Development Agency (CIDA); Danish
International Development Agency (DANIDA); the German Development Bank (KfW); and the
French Development Agency (AfD) introduced a District Development Facility (DDF) to
improve LG performance. The initiative is aimed at motivating local authorities to comply with
existing legal and acceptable administrative procedures by awarding performance-based grants
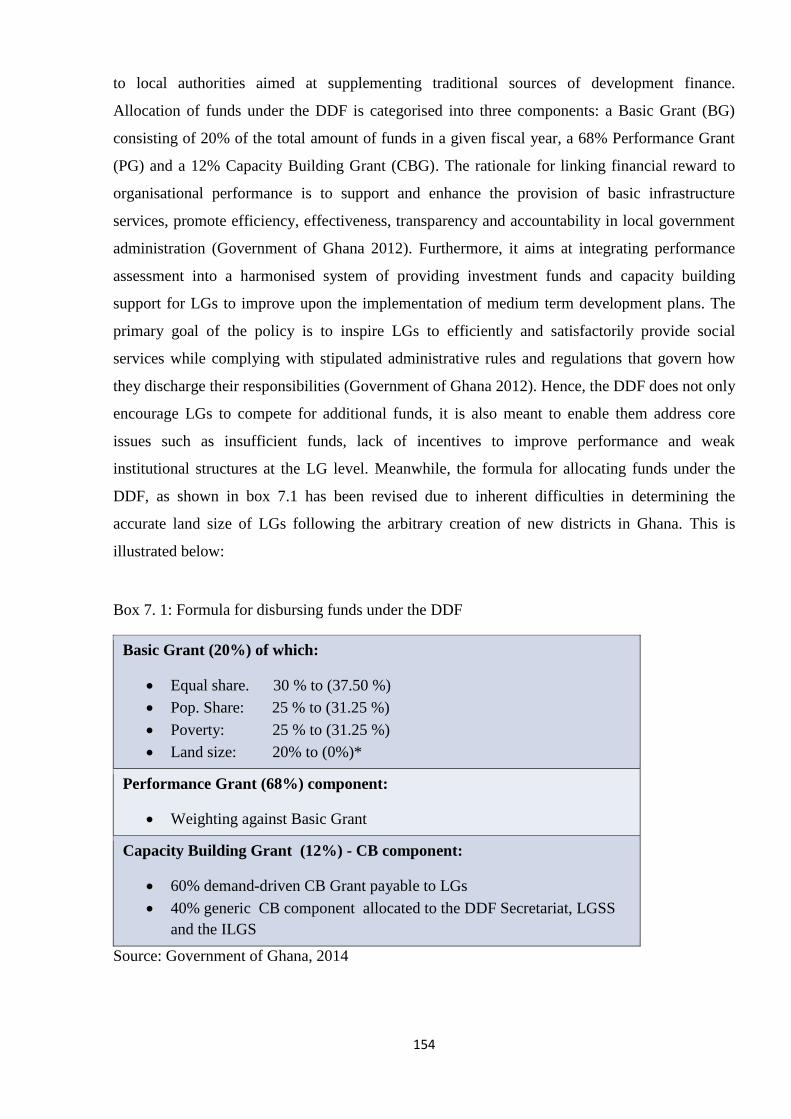
154
to local authorities aimed at supplementing traditional sources of development finance.
Allocation of funds under the DDF is categorised into three components: a Basic Grant (BG)
consisting of 20% of the total amount of funds in a given fiscal year, a 68% Performance Grant
(PG) and a 12% Capacity Building Grant (CBG). The rationale for linking financial reward to
organisational performance is to support and enhance the provision of basic infrastructure
services, promote efficiency, effectiveness, transparency and accountability in local government
administration (Government of Ghana 2012). Furthermore, it aims at integrating performance
assessment into a harmonised system of providing investment funds and capacity building
support for LGs to improve upon the implementation of medium term development plans. The
primary goal of the policy is to inspire LGs to efficiently and satisfactorily provide social
services while complying with stipulated administrative rules and regulations that govern how
they discharge their responsibilities (Government of Ghana 2012). Hence, the DDF does not only
encourage LGs to compete for additional funds, it is also meant to enable them address core
issues such as insufficient funds, lack of incentives to improve performance and weak
institutional structures at the LG level. Meanwhile, the formula for allocating funds under the
DDF, as shown in box 7.1 has been revised due to inherent difficulties in determining the
accurate land size of LGs following the arbitrary creation of new districts in Ghana. This is
illustrated below:
Box 7. 1: Formula for disbursing funds under the DDF
Basic Grant (20%) of which:
Equal share. 30 % to (37.50 %)
Pop. Share: 25 % to (31.25 %)
Poverty: 25 % to (31.25 %)
Land size: 20% to (0%)*
Performance Grant (68%) component:
Weighting against Basic Grant
Capacity Building Grant (12%) - CB component:
60% demand-driven CB Grant payable to LGs
40% generic CB component allocated to the DDF Secretariat, LGSS
and the ILGS
Source: Government of Ghana, 2014
155
Given the fact that evaluating the performance of LGs under the DDF focuses on statutory
functions prescribed under the Local Government Act (1993), indicators against which
performance is assessed are directly linked to political, administrative and financial aspects of
LG operations. Therefore, for a LG to become eligible for the DDF grant, an instrument known
as the Functional Organisational Assessment Tool (FOAT) is used to determine the
appropriateness of administrative procedures of LGs and their compliance to regulatory
requirements in performing their functions. This kind of inspection appears to be a movement
towards a ‘regulatory state’ or an ‘audit society’ as though LGs “cannot be trusted to regulate
themselves effectively, but must be monitored, checked, scrutinised and held accountable by
external agencies” (Boyne et al. 2002a:1198). Today, the FOAT represents a systematic process
for examining LGs as it attempts to create a shared understanding amongst LGs and the Ministry
of Local government about issues that are critical to the successful achievement of organisational
objectives. This is why it will be significant to explore whether using the FOAT to examine LG’s
compliance to administrative and regulatory conditions can be linked to performance in terms of
service delivery.
In practice, the FOAT consist of indicators broadly defined as Minimum Conditions (MCs) and
Performance Measures (PMs). These conditions and indicators are intended to measure the basic
capacity of LGs to perform their core functions and thus, form the basis for assigning
performance scores and allocating financial reward to local government authorities. In order to
qualify for the performance-based grant, a set of pre-determined indicators are used to assess
LGs to identify those that are performing well. Table 7.1 describes the minimum conditions
under the DDF FOAT.
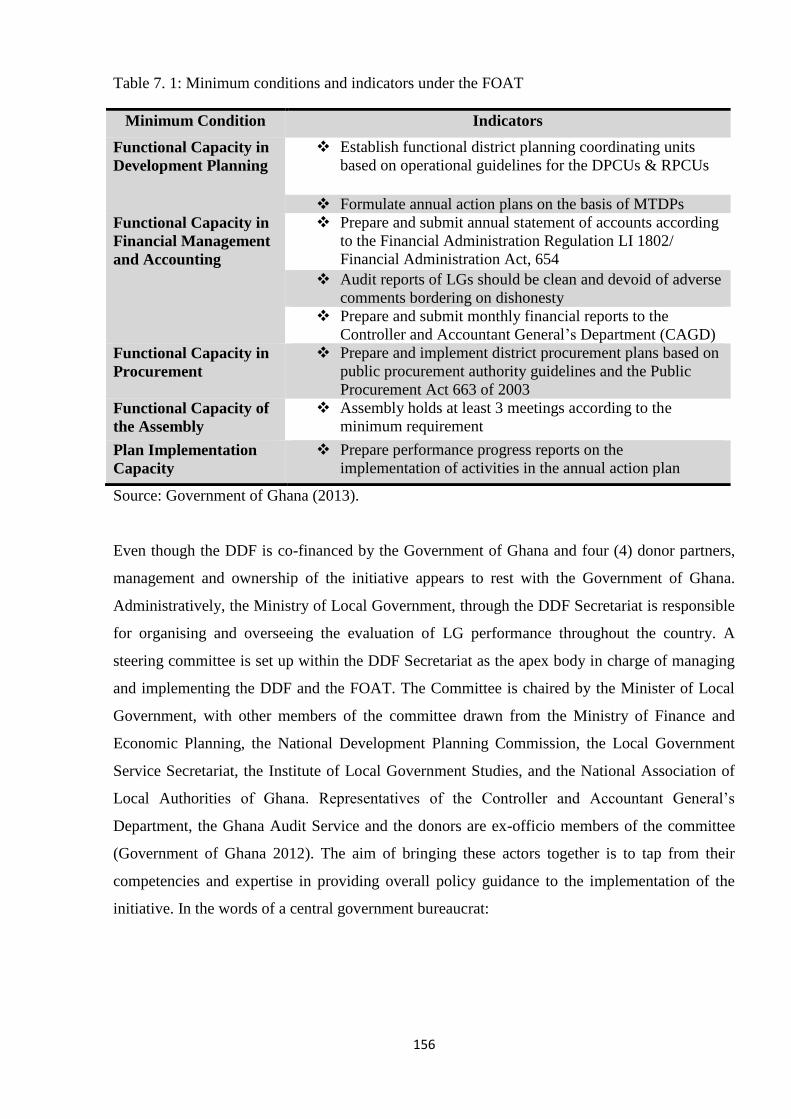
156
Table 7. 1: Minimum conditions and indicators under the FOAT
Minimum Condition Indicators
Functional Capacity in
Development Planning
Establish functional district planning coordinating units
based on operational guidelines for the DPCUs & RPCUs
Formulate annual action plans on the basis of MTDPs
Functional Capacity in
Financial Management
and Accounting
Prepare and submit annual statement of accounts according
to the Financial Administration Regulation LI 1802/
Financial Administration Act, 654
Audit reports of LGs should be clean and devoid of adverse
comments bordering on dishonesty
Prepare and submit monthly financial reports to the
Controller and Accountant General’s Department (CAGD)
Functional Capacity in
Procurement
Prepare and implement district procurement plans based on
public procurement authority guidelines and the Public
Procurement Act 663 of 2003
Functional Capacity of
the Assembly
Assembly holds at least 3 meetings according to the
minimum requirement
Plan Implementation
Capacity
Prepare performance progress reports on the
implementation of activities in the annual action plan
Source: Government of Ghana (2013).
Even though the DDF is co-financed by the Government of Ghana and four (4) donor partners,
management and ownership of the initiative appears to rest with the Government of Ghana.
Administratively, the Ministry of Local Government, through the DDF Secretariat is responsible
for organising and overseeing the evaluation of LG performance throughout the country. A
steering committee is set up within the DDF Secretariat as the apex body in charge of managing
and implementing the DDF and the FOAT. The Committee is chaired by the Minister of Local
Government, with other members of the committee drawn from the Ministry of Finance and
Economic Planning, the National Development Planning Commission, the Local Government
Service Secretariat, the Institute of Local Government Studies, and the National Association of
Local Authorities of Ghana. Representatives of the Controller and Accountant General’s
Department, the Ghana Audit Service and the donors are ex-officio members of the committee
(Government of Ghana 2012). The aim of bringing these actors together is to tap from their
competencies and expertise in providing overall policy guidance to the implementation of the
initiative. In the words of a central government bureaucrat:
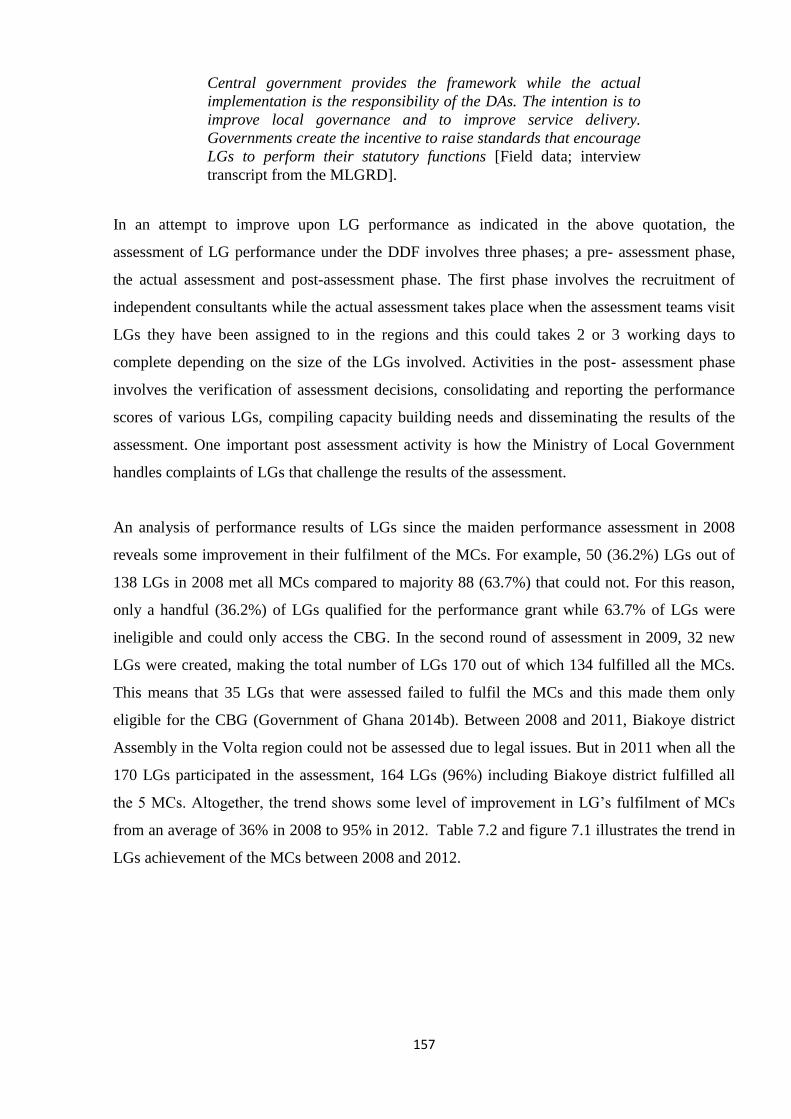
157
Central government provides the framework while the actual
implementation is the responsibility of the DAs. The intention is to
improve local governance and to improve service delivery.
Governments create the incentive to raise standards that encourage
LGs to perform their statutory functions [Field data; interview
transcript from the MLGRD].
In an attempt to improve upon LG performance as indicated in the above quotation, the
assessment of LG performance under the DDF involves three phases; a pre- assessment phase,
the actual assessment and post-assessment phase. The first phase involves the recruitment of
independent consultants while the actual assessment takes place when the assessment teams visit
LGs they have been assigned to in the regions and this could takes 2 or 3 working days to
complete depending on the size of the LGs involved. Activities in the post- assessment phase
involves the verification of assessment decisions, consolidating and reporting the performance
scores of various LGs, compiling capacity building needs and disseminating the results of the
assessment. One important post assessment activity is how the Ministry of Local Government
handles complaints of LGs that challenge the results of the assessment.
An analysis of performance results of LGs since the maiden performance assessment in 2008
reveals some improvement in their fulfilment of the MCs. For example, 50 (36.2%) LGs out of
138 LGs in 2008 met all MCs compared to majority 88 (63.7%) that could not. For this reason,
only a handful (36.2%) of LGs qualified for the performance grant while 63.7% of LGs were
ineligible and could only access the CBG. In the second round of assessment in 2009, 32 new
LGs were created, making the total number of LGs 170 out of which 134 fulfilled all the MCs.
This means that 35 LGs that were assessed failed to fulfil the MCs and this made them only
eligible for the CBG (Government of Ghana 2014b). Between 2008 and 2011, Biakoye district
Assembly in the Volta region could not be assessed due to legal issues. But in 2011 when all the
170 LGs participated in the assessment, 164 LGs (96%) including Biakoye district fulfilled all
the 5 MCs. Altogether, the trend shows some level of improvement in LG’s fulfilment of MCs
from an average of 36% in 2008 to 95% in 2012. Table 7.2 and figure 7.1 illustrates the trend in
LGs achievement of the MCs between 2008 and 2012.
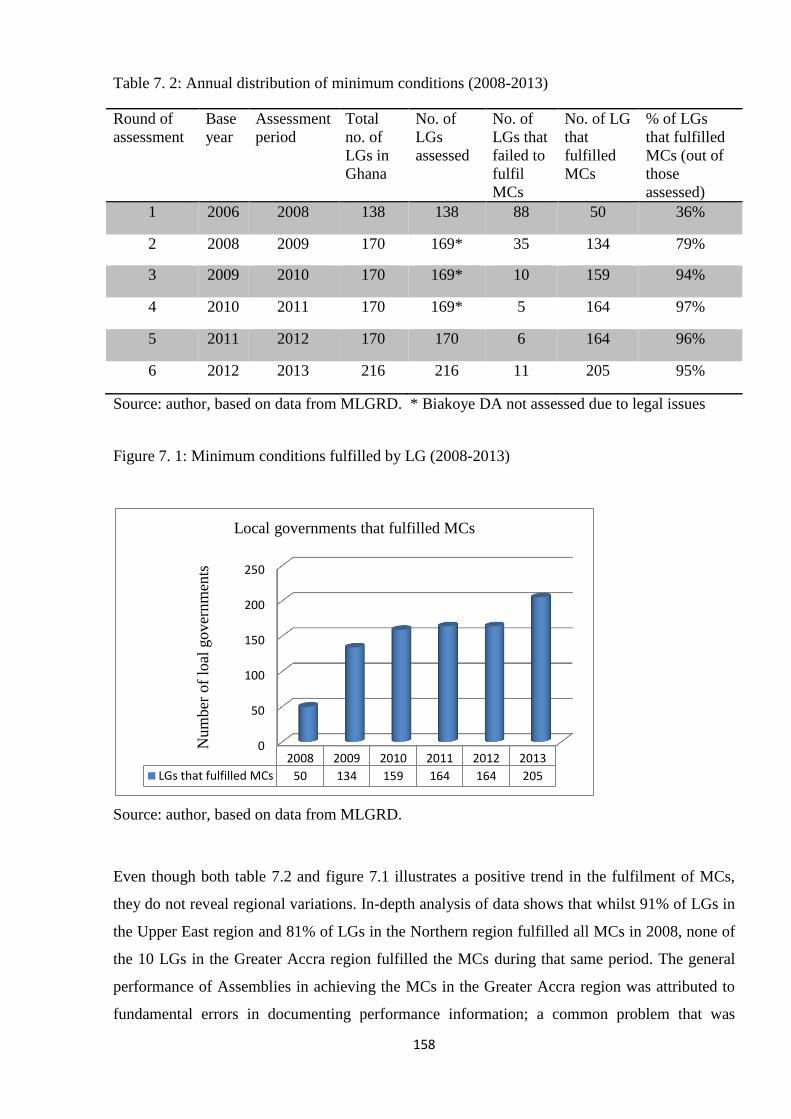
158
Table 7. 2: Annual distribution of minimum conditions (2008-2013)
Round of
assessment
Base
year
Assessment
period
Total
no. of
LGs in
Ghana
No. of
LGs
assessed
No. of
LGs that
failed to
fulfil
MCs
No. of LG
that
fulfilled
MCs
% of LGs
that fulfilled
MCs (out of
those
assessed)
1 2006 2008 138 138 88 50 36%
2 2008 2009 170 169* 35 134 79%
3 2009 2010 170 169* 10 159 94%
4 2010 2011 170 169* 5 164 97%
5 2011 2012 170 170 6 164 96%
6 2012 2013 216 216 11 205 95%
Source: author, based on data from MLGRD. * Biakoye DA not assessed due to legal issues
Figure 7. 1: Minimum conditions fulfilled by LG (2008-2013)
Source: author, based on data from MLGRD.
Even though both table 7.2 and figure 7.1 illustrates a positive trend in the fulfilment of MCs,
they do not reveal regional variations. In-depth analysis of data shows that whilst 91% of LGs in
the Upper East region and 81% of LGs in the Northern region fulfilled all MCs in 2008, none of
the 10 LGs in the Greater Accra region fulfilled the MCs during that same period. The general
performance of Assemblies in achieving the MCs in the Greater Accra region was attributed to
fundamental errors in documenting performance information; a common problem that was
0
50
100
150
200
250
2008 2009 2010 2011 2012 2013
LGs that fulfilled MCs 50 134 159 164 164 205
Num
ber
of
loal
gover
nm
ents
Local governments that fulfilled MCs
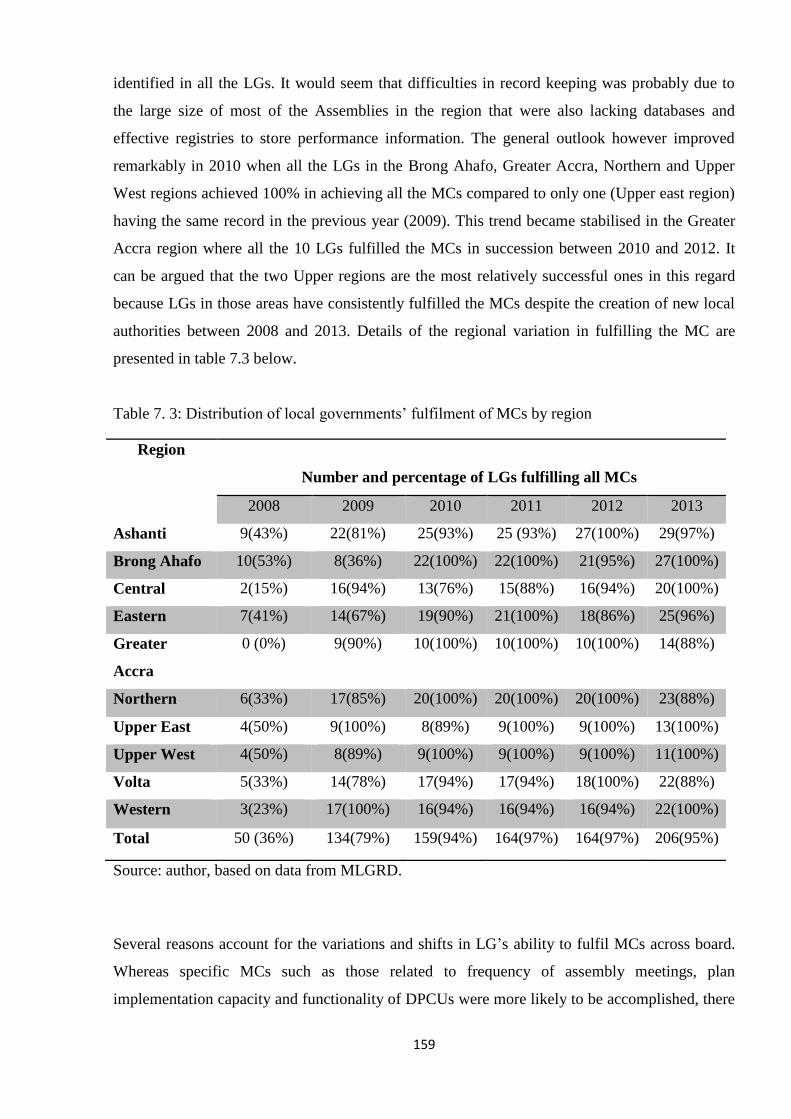
159
identified in all the LGs. It would seem that difficulties in record keeping was probably due to
the large size of most of the Assemblies in the region that were also lacking databases and
effective registries to store performance information. The general outlook however improved
remarkably in 2010 when all the LGs in the Brong Ahafo, Greater Accra, Northern and Upper
West regions achieved 100% in achieving all the MCs compared to only one (Upper east region)
having the same record in the previous year (2009). This trend became stabilised in the Greater
Accra region where all the 10 LGs fulfilled the MCs in succession between 2010 and 2012. It
can be argued that the two Upper regions are the most relatively successful ones in this regard
because LGs in those areas have consistently fulfilled the MCs despite the creation of new local
authorities between 2008 and 2013. Details of the regional variation in fulfilling the MC are
presented in table 7.3 below.
Table 7. 3: Distribution of local governments’ fulfilment of MCs by region
Region
Number and percentage of LGs fulfilling all MCs
2008 2009 2010 2011 2012 2013
Ashanti 9(43%) 22(81%) 25(93%) 25 (93%) 27(100%) 29(97%)
Brong Ahafo 10(53%) 8(36%) 22(100%) 22(100%) 21(95%) 27(100%)
Central 2(15%) 16(94%) 13(76%) 15(88%) 16(94%) 20(100%)
Eastern 7(41%) 14(67%) 19(90%) 21(100%) 18(86%) 25(96%)
Greater
Accra
0 (0%) 9(90%) 10(100%) 10(100%) 10(100%) 14(88%)
Northern 6(33%) 17(85%) 20(100%) 20(100%) 20(100%) 23(88%)
Upper East 4(50%) 9(100%) 8(89%) 9(100%) 9(100%) 13(100%)
Upper West 4(50%) 8(89%) 9(100%) 9(100%) 9(100%) 11(100%)
Volta 5(33%) 14(78%) 17(94%) 17(94%) 18(100%) 22(88%)
Western 3(23%) 17(100%) 16(94%) 16(94%) 16(94%) 22(100%)
Total 50 (36%) 134(79%) 159(94%) 164(97%) 164(97%) 206(95%)
Source: author, based on data from MLGRD.
Several reasons account for the variations and shifts in LG’s ability to fulfil MCs across board.
Whereas specific MCs such as those related to frequency of assembly meetings, plan
implementation capacity and functionality of DPCUs were more likely to be accomplished, there

160
were serious problems with record keeping that became obvious because LGs had to show
documentary proof of their performance - something they fumbled to justify. Also, it seems the
MC on financial management and accounting in general and auditing in particular is a huge
challenge for LGs. While the situation appears to be improving, some LGs still fail to prepare
and submit crucial documents such as audit reports to show the extent to which financial and
procurement rules and regulations have been followed. While this could genuinely reflect the
reality on the ground, the consequences have been enormous given that failure to achieve the
MCs can deprive LGs from accessing the basic grant and the performance grant under the DDF.
For instance, none of the 88 LGs that failed to fulfil the MCs in 2008 received additional funds
under the DDF beyond the CBG (Kenya, 2011). This however improved in the second and third
rounds of assessment when 35 and 10 LGs were unable to meet the MCs in 2009 and 2010
respectively. Since the highest number of LGs that fulfilled the MCs was in 2011, the trend in
subsequent years was expected to improve. For example, out of 170 LGs, only 5 of them failed
to achieve all the MCs in 2011 compared to 10 in the 2010 (see table 7.2). In addition, 4 out of
the 6 LGs that did not fulfil all MCs in 2011 were municipal assemblies, 2 of which were newly
created while the remaining 2 were district assemblies. What these fluctuations clearly suggest is
that there is no guarantee for LGs to automatically repeat their performance in fulfilling all MCs
in one particular year having done the same in the previous year. There have been instances
where LGs failed to fulfil MCs in a particular year despite fulfilling them in the previous year.
7.3 Performance measures and performance-based grants
Under the LG performance enhancing policy initiative, performance measures are made up of 9
themes which are used to determine each LG’s allocation of performance grant under the DDF.
As indicated earlier, the performance-based grant, which represents 68% of the overall DDF
pool is accessible to LGs that are awarded the Basic Grant for fulfilling all MCs. The amount
of performance-based grant allocated to each LG is the ratio of its score under the PMs to the
total score of LGs that met all MCs and weighted with the basic grant score. This implies that
a higher performance score arising from the performance measures leads to a relatively bigger
investment grant. Even though the themes of the PMs have remained the same since 2008, the
number of indicators and maximum weights of the themes have been revised. This is shown in
table 7.4 below:

161
Table 7. 4: Performance measures under the DDF
Thematic Area 2008-2011 2012-2013
No. of
Indicators
Max.
Score
No. of
indicators
Max.
Score
1 Management and organisation 6 10 5 9
2 Transparency and accountability 6 12 6 12
3 Planning system 10 16 13 18
4 Human resource management 3 7 5 6
5 Relationship with sub-district structures 2 6 2 3
6 Financial management and auditing 9 16 8 18
7 Fiscal capacity 6 15 6 21
8 Procurement 5 12 4 5
9 Environmental sanitation management 3 6 5 8
Total 50 100 54 100
Source: Government of Ghana (2014b).
All LGs that fulfilled the MCs between 2008 and 2013 were also eligible for the PBG even
though the amounts allocated to them differed markedly as a result of variations in performance
scores. The overall performance of LGs was seen to be poor in 2008 when the national average
for performance measures was only 47.38%. Conversely, except for the most recent assessment
in 2013 when the national average score for PM reached its peak, none of the LGs prior to that
assessment had managed to obtain the highest performance score. The trend of PMs is illustrated
in Table 7.5 below.
Table 7. 5: Distribution of performance measures (2008-2013)
Round of
assessment
Base
year
Assessment
period
No. of
LGs in
Ghana
No. of
LGs
assessed
No. of LG
that met
MCs
Performance
measures (%)
National
average of
PMs (%) Max Min
1 2006 2008 138 138 50 73 25 47.38
2 2008 2009 170 169 134 91 38 61.95
3 2009 2010 170 169 159 96 20 73.71
4 2010 2011 170 169 164 97 59 83.56
5 2011 2012 170 170 164 97 49 82.44
6 2012 2013 216 216 205 100 55 86.36
Source: Government of Ghana (2014b).
In order to understand how relevant LG officials think about the performance measures under the
DDF, the views of respondents at the district levels as well as officials who were interviewed at
162
the Local Government Ministry and other allied agencies were analysed. It was emphasised that
certain administrative procedures had to be met before LGs are assessed and awarded with
grants. Meeting the conditions set for qualifying for performance grants reinforce the perception
amongst LG bureaucrats that the DDF symbolises best-practice performance management
framework. Also, it was explained that independent consultants who are employed by the
MLGRD to conduct the assessment in the regions were given the assignment based on their
technical and professional competence. Hence, the recruitment of consultants is publicly
advertised2
and successful candidates are given a special training to effectively carry out the
assignment. Evaluators are required to be neutral and independent in discharging their duties by
using the FOAT to examine the extent to which LGs fulfil the MCs and PMs. Particular attention
is therefore focused on how LGs perform their political, administrative and financial obligations
to enable assessment teams determine whether internal processes and service delivery record
have been improving. In addition, the evaluation teams are expected to identify performance
bottlenecks and capacity gaps that must be addressed to strengthen local government
performance.
Evidently, the most attractive incentive for which LGs would strive to fulfil MCs and PMs was
to obtain the PBG under the DDF. After the first round of LG assessment in 2008, a total amount
of US$ 31.9 million was allocated and disbursed to LGs that met the performance criterion
(Kenya 2011). Since LGs that could not meet the MCs were eligible for capacity building grants,
‘A’ Metropolitan and the ‘C’ district Assemblies received a capacity building grant of
¢19,683.53 each while the ‘B’ Municipal Assembly received an amount of ¢534,149.82 as its
share of PBG. The situation improved slightly during the second round of assessment in 2009
because with a performance score of 59%, the ‘A’ Metropolitan Assembly received ¢598,601.37;
‘B’ Municipal Assembly with a score of 66% received ¢622,935.61 compared to ¢535, 793.16
awarded to ‘C’ District for having scored 61%. The total amount of funds under the DDF also
increased by 43.4% with a total allocation of $56.4 million disbursed to LGs.
In 2013, an amount of US$60.8 million was set aside for LGs that fulfilled the MCs and PMs.
This amounted to GH¢145.9 million based on an exchange rate of GH¢2.40 to US$1.00 and
categorised as follows:
2 Recruitment of independent consultants through a competitive process in line with the Public Procurement Law is expected to reduce perverse
incentives in the sense that no single consultancy firm is certain of getting hired, thereby reducing the risk of collision, favouritism and other
forms of corruption that may arise between the consultants and the LGs that are assessed.
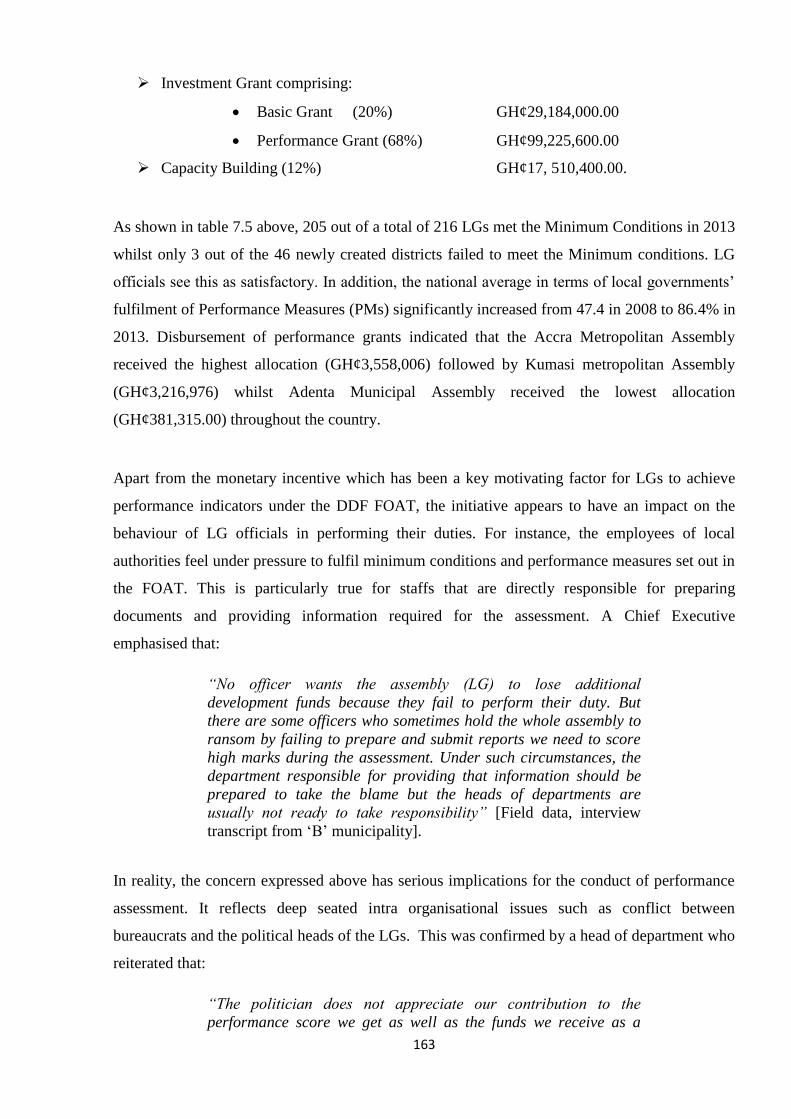
163
Investment Grant comprising:
Basic Grant (20%) GH¢29,184,000.00
Performance Grant (68%) GH¢99,225,600.00
Capacity Building (12%) GH¢17, 510,400.00.
As shown in table 7.5 above, 205 out of a total of 216 LGs met the Minimum Conditions in 2013
whilst only 3 out of the 46 newly created districts failed to meet the Minimum conditions. LG
officials see this as satisfactory. In addition, the national average in terms of local governments’
fulfilment of Performance Measures (PMs) significantly increased from 47.4 in 2008 to 86.4% in
2013. Disbursement of performance grants indicated that the Accra Metropolitan Assembly
received the highest allocation (GH¢3,558,006) followed by Kumasi metropolitan Assembly
(GH¢3,216,976) whilst Adenta Municipal Assembly received the lowest allocation
(GH¢381,315.00) throughout the country.
Apart from the monetary incentive which has been a key motivating factor for LGs to achieve
performance indicators under the DDF FOAT, the initiative appears to have an impact on the
behaviour of LG officials in performing their duties. For instance, the employees of local
authorities feel under pressure to fulfil minimum conditions and performance measures set out in
the FOAT. This is particularly true for staffs that are directly responsible for preparing
documents and providing information required for the assessment. A Chief Executive
emphasised that:
“No officer wants the assembly (LG) to lose additional
development funds because they fail to perform their duty. But
there are some officers who sometimes hold the whole assembly to
ransom by failing to prepare and submit reports we need to score
high marks during the assessment. Under such circumstances, the
department responsible for providing that information should be
prepared to take the blame but the heads of departments are
usually not ready to take responsibility” [Field data, interview
transcript from ‘B’ municipality].
In reality, the concern expressed above has serious implications for the conduct of performance
assessment. It reflects deep seated intra organisational issues such as conflict between
bureaucrats and the political heads of the LGs. This was confirmed by a head of department who
reiterated that:
“The politician does not appreciate our contribution to the
performance score we get as well as the funds we receive as a
164
result. Why then should I “kill” myself for the Assembly when the
Chief Executive thinks he’s the one responsible for our
performance? They have been calling me to come and I refused
because I have been posted to a different district where my work
will be appreciated” [Field data, interview transcript from ‘B’
Municipality].
Discontent and dissatisfaction as expressed by the interviewee above is quite common and often
result in perverse behaviours. There were several instances where heads of departments lacked
cordial working relations with their political superiors and this adversely affected their
commitment to the LG. To facilitate the fulfilment of MCs and PMs, some LGs surreptitiously
generated documents for activities and projects that were non-existent. Such impropriety and
dishonesty in an attempt to score higher performance scores was endorsed by the leadership of
some LGs who sometimes feigned ignorant of the practice. Interestingly, some of these
concocted documents were also used by the assemblies to balance their financial statements to
meet auditing purposes.
In spite of these practical realities that went unnoticed by the assessment teams, the DDF FOAT
was perceived by LG officials as a useful source of building their organisational capacities.
Unlike the DACF that has become notoriously infamous for its incessant delays, funds awarded
under the DDF can be predicted accurately in ways that fulfil the forecasts of LGs. Moreover,
compelling local authorities to spend their DDF allocations on ‘community benefiting’ projects
is seen as one of the best-practice values of the initiative. In the words of a Chief Executive:
“One good thing about the DDF is that right from the top it is
being monitored and the Assembly can only use the money to fund
projects on its shopping list. We strictly follow the codes of
expenditure that insist on physical structures. For instance you
cannot use DDF money to buy equipment for the office; you cannot
use DDF money to build an office. They have their priority, and
they insist on community and so any expenditure that is not
community benefiting is not allowed” [Field data; interview
transcript from ‘C’ district].
From an organisational development perspective, one could argue that perhaps the most
important aspect of the DDF is the attempt to strengthen LGs which allows consultants to
identify organisational capacity gaps and to prescribe recommendations for action3. From the
3 Capacity building needs encompass skills development, logistics and organisational needs such as establishing a
database, effective accounting and revenue mobilisation systems.

165
CBG component of the DDF, 60% is allocated to LGs on a demand-driven basis and 40% is
allocated to the DDF Secretariat at the Ministry of Local Government, the LGSS and the ILGS to
run the DDF Secretariat and carry out activities related to the performance enhancing policy such
as organising LG assessments, recruiting, training and paying consultants. In 2013, the total
capacity building grant component amounted to GH¢17,510,400.00 of which 60%
(GH¢10,506,240.00) was allocated for demand-driven activities at the LG level and 40%
(GH¢7,004,160.00) allocated to the DDF secretariat for generic capacity building activities.
7.4 Formulation of performance indicators under the DDF-FOAT, stakeholder expectation
and perceptions
The role of performance indicators (PIs) in assessing organisational performance cannot be
underestimated. Even though the use of performance indicators is often seen as a technical issue,
perception about their impact in politically charged contexts are worth analysing due to potential
doubts about their neutrality. The situation is not different in Ghana given that LGs are political
organisations where varying and competing interests characterise the agenda of LGs. It was
therefore imperative to understand people’s perceptions of the functional organisational
assessment tool which is used to allocate performance based grants under the DDF. It emerged
that research participants had different views with regard to the origin and significance of PIs
under the DDF. Respondents at the LG level saw the MCs and PMs as pre-packaged
bureaucratic requirements imposed on them by donors and the CG in a top-down manner. This
claim implies that central government agencies that oversee the policy are more influential in
determining what counts as a MC or a PM compared to the target beneficiaries at the community
level. Indeed, the exclusion of local communities in defining performance indicators for LGs can
only widen existing unequal balance of power and influence over the choice of performance
indicators despite the fact that ordinary citizens in local communities are better placed to
determine whether LGs are performing in accordance with their expectation and priorities or not.
Interestingly, not all the research participants had equal knowledge about the DDF due to their
different levels of involvement in managing LG performance. For instance, civil servants tended
to know more about the performance management system compared to elected assembly
members and community groups. Since discussions at General Assembly meetings cover a wide
range of issues including financial inflows to the assemblies, knowledge on the DDF was
166
expected to be high but this was not the case. Perhaps, this confirms the assertion that policy
discussions within LG are abstract and deliberated in a language that makes it difficult for
ordinary Assembly members to comprehend (Crook and Manor 1998). No wonder some elected
Assembly members who participated in this study even attempted to dismiss the DDF as
performance management framework; a position that could be attributed to inadequate
knowledge about the initiative. In contrast, not only is there consensus amongst LG officials that
DDF-FOAT assessment constitutes the most formalised performance management framework
for LGs in Ghana, it is further touted by officials of the MLGRD and the donor agencies as a
best practice performance management system aimed at motivating and raising standards of LGs
performance. Perhaps, contrary to views about the FOAT as the ‘Holy Grail’ for improving the
performance of LGs in Ghana, one could hypothesise that involving civil society in the
implementation of the DDF FOAT and in managing the performance of LGs could activate
citizens’ concerns and aspirations in relation to the performance of their LGs (Ho and Coates
2004;Melkers and John Clayton 1998). It is argued that “engaging the public in administrative
decision making is normatively desirable and can bring about important educative and
empowering benefits to citizens and communities” (Neshkova and Guo 2012). Hence, more
education on the significance of the DDF is probably needed in local communities before its
objective of enhancing accountability can be realised.
Nevertheless, it was noticed that whereas LG officials recognised the DDF FOAT as a
mechanism for exerting pressure on them to perform their functions, popular expectation about
the initiative was rather mixed between interviewees at central and local government levels.
According to civil servants at the CG level, the performance-enhancing policy must be seen as
an incentive for encouraging LGs to satisfactorily follow appropriate administrative procedure
rather than a viewing it as a framework for measuring the success of service delivery. In the
words of an officer at the Ministry of Local Government:
“The DDF is not a measurement of service delivery; it is an
assessment to distribute money, to provide an incentive to local
governments. But it is not created to measure the extent of success
in terms of service delivery” [Field data; interview transcript,
MLGRD].
There is an implicit assumption that the mechanism examines the extent to which LGs follow
laid down administrative and regulatory procedures in performing their functions which by
167
extension, connects to the development of local communities. Hence, by assessing LG
performance using MCs and PMs, CG does not only supervise the performance of LGs but also
demand higher performance from LGs on behalf of citizens. Ironically, the views of unit
committee members about the DDF were not entirely different from those of elected assembly
members. To confirm their limited knowledge about the initiative, participants of FGDs were
generally not sure about the way the DDF operates, how much their LGs had been awarded, how
the funds have been used and in most cases, they were unaware whether their communities had
benefited from the DDF or not. Obviously, there seem to have been no community sensitisation
prior to the introduction of the DDF and since performance grants are expected to be spent on
community development projects, it was unclear how residents of beneficiary communities could
demand value for money from LG officials without knowing much about the district
development facility. In the following section, the extent to which the DDF FOAT is able to
address the multiple aspects and or dimensions of LG performance is examined.
7.5 Analysis of DDF FOAT in managing local government performance in Ghana: A
balance score card approach
In the previous section, the DDF-FOAT was analysed to demonstrate how the system operates in
allocating performance-based incentives to LGs in Ghana. It also explored interviewees’
perceptions about the formulation of performance indicators under the policy initiative. This
section builds on that by critically examining the extent to which the DDF FOAT captures
multiple dimensions of LG performance consistent with the underlying principles of balance
scorecard (BSC) concept (Kaplan and Norton, 1992). The BSC is appropriate not only because it
provides generic inter-related perspectives that are carefully chosen to provide information for
better management but also because it provides a methodological framework for assessing
managerial decisions and for gauging performance improvements (McAdam and Walker 2003).
The value added for applying the BSC in this study does not only further our understanding of
the scope of the DDF-FOAT as a strategy for promoting LG performance; it could also reveal
the limitations of a top-down approach to managing LG performance.
As illustrated in figure 7.2 below, the BSC is adapted by categorising the most important and
recurrent themes in the data under each of its 4 perspectives. In view of the fact that the DDF
FOAT is a performance management system, it is placed at the centre of the BSC as a strategy
for LG performance. Thus, the FOAT is analysed to unravel the extent to which it targets,
enhances or ignore the various factors identified under each component of the framework

168
proposed for the analysis. Importantly, the mission of LGs is conceived as containing the
overarching goal of LGs, one which drives them to satisfy the citizenry and beneficiaries of LG
services. This analogy follows the presumption that LGs, as public organisations, do not
typically focus on making profits but rather seek to serve the public good. For this reason, the
citizens’ perspective is considered as the most crucial of all the four (4) perspectives as
conceived in this study.

169
Figure 7. 2: The balance scorecard approach
Author’s construct, adapted from Kaplan and Norton (1992)
DDF FOAT as a
strategy for local
government
performance
Learning and innovation perspective
Knowledge Management
Use of ICTs
Financial perspective
The effectiveness of
LGs budgeting
Expenditure and
investments
Revenue generation
Internal process
perspective
Leadership style of
LG managers
Effectiveness of
development
planning and
Human resource
capacity and team
work
Mission / vision of local governments
Citizen’s perspective
Community participation
Satisfaction with LG
performance
7.5.1 Financial performance
Even though the bottom line for LG performance is not to make profit, local authorities are
expected to efficiently and effectively utilise their limited financial resources to provide
basic services. Meanwhile, Olowu and Smoke (1992) argue that many LGs in Africa have
a low record of financial performance, and for which reason, the analysis of [financial]
performance must focus on the following:
i) The budget balance sheet: based on the assumption that a successful local
government should have surpluses than deficits within a period of 5 years;
ii) Major local revenue sources (direct local taxes, user charges and
intergovernmental transfers) should generally increase over time; and
iii) Local expenditures, both recurrent and capital, should support a range of
significant social and infrastructural services and grow at a reasonable rate.
This view is important in the Ghanaian context where LGs’ ability to productively invest in
development projects and generate sufficient revenue give important hints about their
performance. Even though the central government, donor agencies and sometimes non-
governmental organisations provide funds to LGs to specifically implement priority
projects and programmes, the DACF was evidently by far the major source of financial
inflows to LGs but was inadequate to address all their financial needs. Furthermore,
internally generated funds was found to be abysmally low in smaller districts where the
absence of viable commercial activities limited the revenue base of local government
authorities compared to urban areas where the operation of numerous businesses widens
the revenue base of LGs.
To determine whether the DDF-FOAT mechanism assesses local government’s financial
performance, three important themes emerged from the data as the most important
variables of financial performance. These were then analysed to understand whether or not,
the financial indicators of the FOAT addresses them. They are as follows:
1) The effectiveness of LGs budgeting;
2) Expenditure and investments;
3) Revenue generation.
171
To operationalise the themes enumerated above, it is conceived that a LG runs an effective
budget if that budget is directly linked to the MTDP and up to 75% of it is implemented as
planned. Also, expenditures and investments of LGs are required to be development
oriented by prioritizing physical infrastructure projects and social services. Furthermore,
internally generated funds, such as revenue from basic rates, royalties, property rates; fees,
licenses and permits should be sufficient to cater for recurrent expenses. It was however
observed that none of these issues was explicitly targeted by the FOAT’s indicators but are
rather treated broadly at different levels. One would have expected the MCs on financial
management, accounting and public procurement to have a direct link with these issues but
that appears not to be the case.
How does the FOAT then assist LGs to improve upon their performance in the areas
enumerated above? To answer this question, it was obvious that LGs had to submit
documents to the independent consultants to justify how they had complied with the legal
and regulatory frameworks in performing their functions. For example, independent
consultants had to scrutinise monthly financial statements such as trial balances of LGs
that had been submitted to the office of the Controller and Accountant General and then
verify that management letters accompanying financial audit reports did not highlight
financial irregularities. These are checked to ensure that budgets are effectively followed
as planned. On capital investments, acceptable procurement procedures must be followed
to avoid financial malpractices and corruption. This means that LGs that fulfilled the MC
on procurement prepared procurement plans based on which procurement decisions were
made. But from the nature of the assessment process, one could argue that regardless of
how significant it is for LGs to effectively implement their budgets, generate reasonable
revenue and invest in critical social infrastructure, the MCs of the FOAT alone seems to be
insufficient to stimulate financial performance of LGs. This is supported by the fact that
fulfilling the MCs is entirely based on financial records that may not necessarily represent
the actual reality on the ground. There have been instances where financial records have
been subjectively interpreted by assessment teams and their decisions challenged by LG
officials. Such disagreements can be attributed to the absence of weights assigned to MC in
awarding performance scores.
In contrast to the MCs, PMs on financial management and auditing, fiscal capacity and
procurement appear to focus on the financial performance of LGs. To fulfil the indicators
under these performance measures, LG managers had to show that budget committees
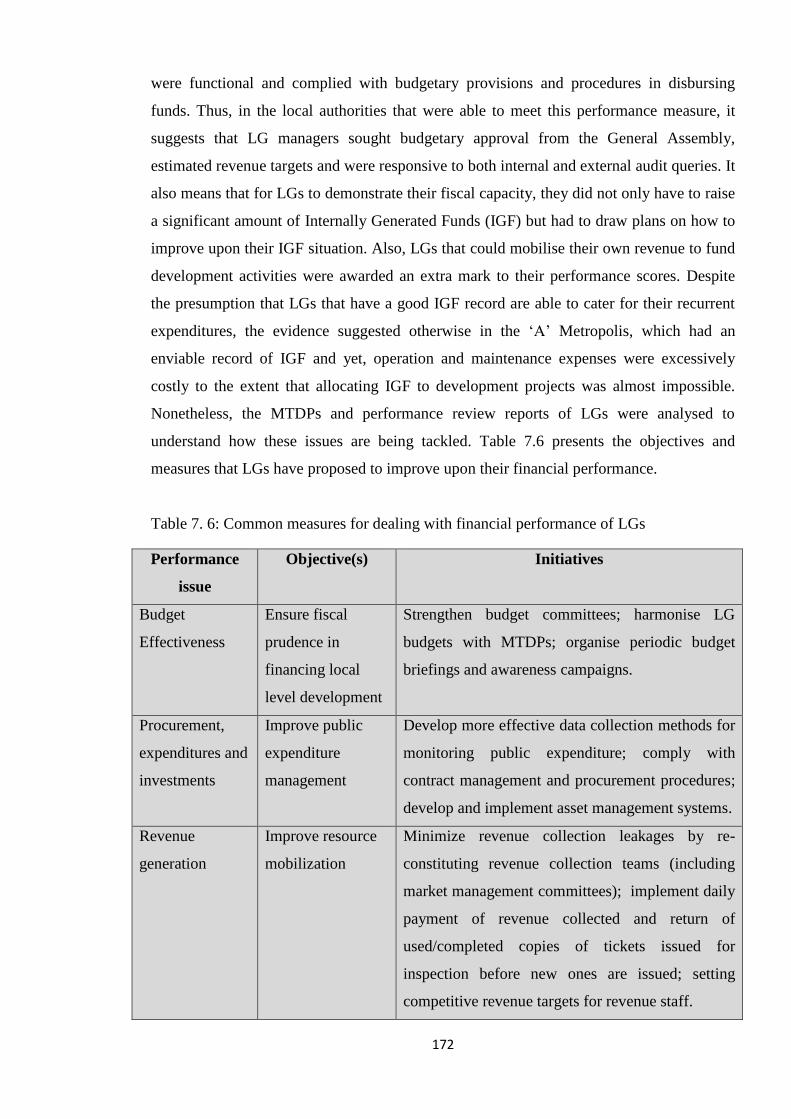
172
were functional and complied with budgetary provisions and procedures in disbursing
funds. Thus, in the local authorities that were able to meet this performance measure, it
suggests that LG managers sought budgetary approval from the General Assembly,
estimated revenue targets and were responsive to both internal and external audit queries. It
also means that for LGs to demonstrate their fiscal capacity, they did not only have to raise
a significant amount of Internally Generated Funds (IGF) but had to draw plans on how to
improve upon their IGF situation. Also, LGs that could mobilise their own revenue to fund
development activities were awarded an extra mark to their performance scores. Despite
the presumption that LGs that have a good IGF record are able to cater for their recurrent
expenditures, the evidence suggested otherwise in the ‘A’ Metropolis, which had an
enviable record of IGF and yet, operation and maintenance expenses were excessively
costly to the extent that allocating IGF to development projects was almost impossible.
Nonetheless, the MTDPs and performance review reports of LGs were analysed to
understand how these issues are being tackled. Table 7.6 presents the objectives and
measures that LGs have proposed to improve upon their financial performance.
Table 7. 6: Common measures for dealing with financial performance of LGs
Performance
issue
Objective(s) Initiatives
Budget
Effectiveness
Ensure fiscal
prudence in
financing local
level development
Strengthen budget committees; harmonise LG
budgets with MTDPs; organise periodic budget
briefings and awareness campaigns.
Procurement,
expenditures and
investments
Improve public
expenditure
management
Develop more effective data collection methods for
monitoring public expenditure; comply with
contract management and procurement procedures;
develop and implement asset management systems.
Revenue
generation
Improve resource
mobilization
Minimize revenue collection leakages by re-
constituting revenue collection teams (including
market management committees); implement daily
payment of revenue collected and return of
used/completed copies of tickets issued for
inspection before new ones are issued; setting
competitive revenue targets for revenue staff.
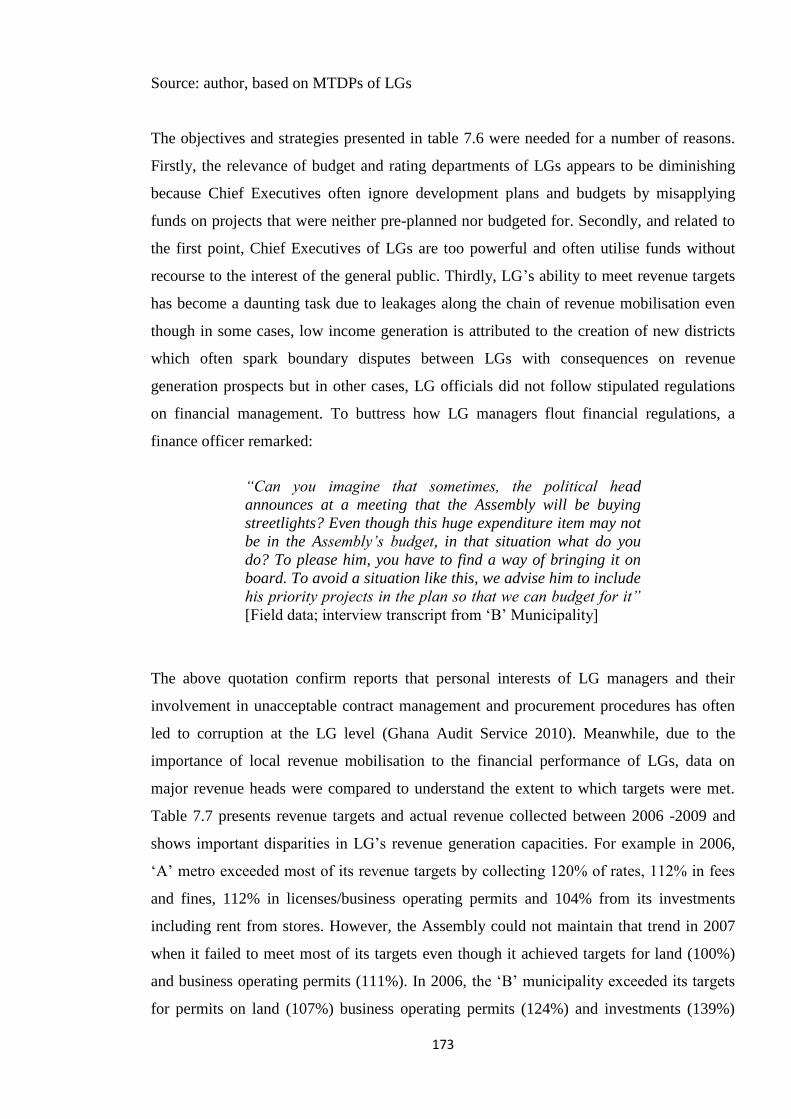
173
Source: author, based on MTDPs of LGs
The objectives and strategies presented in table 7.6 were needed for a number of reasons.
Firstly, the relevance of budget and rating departments of LGs appears to be diminishing
because Chief Executives often ignore development plans and budgets by misapplying
funds on projects that were neither pre-planned nor budgeted for. Secondly, and related to
the first point, Chief Executives of LGs are too powerful and often utilise funds without
recourse to the interest of the general public. Thirdly, LG’s ability to meet revenue targets
has become a daunting task due to leakages along the chain of revenue mobilisation even
though in some cases, low income generation is attributed to the creation of new districts
which often spark boundary disputes between LGs with consequences on revenue
generation prospects but in other cases, LG officials did not follow stipulated regulations
on financial management. To buttress how LG managers flout financial regulations, a
finance officer remarked:
“Can you imagine that sometimes, the political head
announces at a meeting that the Assembly will be buying
streetlights? Even though this huge expenditure item may not
be in the Assembly’s budget, in that situation what do you
do? To please him, you have to find a way of bringing it on
board. To avoid a situation like this, we advise him to include
his priority projects in the plan so that we can budget for it”
[Field data; interview transcript from ‘B’ Municipality]
The above quotation confirm reports that personal interests of LG managers and their
involvement in unacceptable contract management and procurement procedures has often
led to corruption at the LG level (Ghana Audit Service 2010). Meanwhile, due to the
importance of local revenue mobilisation to the financial performance of LGs, data on
major revenue heads were compared to understand the extent to which targets were met.
Table 7.7 presents revenue targets and actual revenue collected between 2006 -2009 and
shows important disparities in LG’s revenue generation capacities. For example in 2006,
‘A’ metro exceeded most of its revenue targets by collecting 120% of rates, 112% in fees
and fines, 112% in licenses/business operating permits and 104% from its investments
including rent from stores. However, the Assembly could not maintain that trend in 2007
when it failed to meet most of its targets even though it achieved targets for land (100%)
and business operating permits (111%). In 2006, the ‘B’ municipality exceeded its targets
for permits on land (107%) business operating permits (124%) and investments (139%)

174
compared to its revenue performance on rates (50%) and rent (64%) that were not met. The
‘C’ district also exceeded its targets on land permits by 765% in 2007, 125% in 2008 and
156% in 2009. Even though none of the district’s IGF targets was met in 2006, the ‘C’
district assembly exceeded three targets in 2009, making it the period within which most of
its IGF targets were realised.
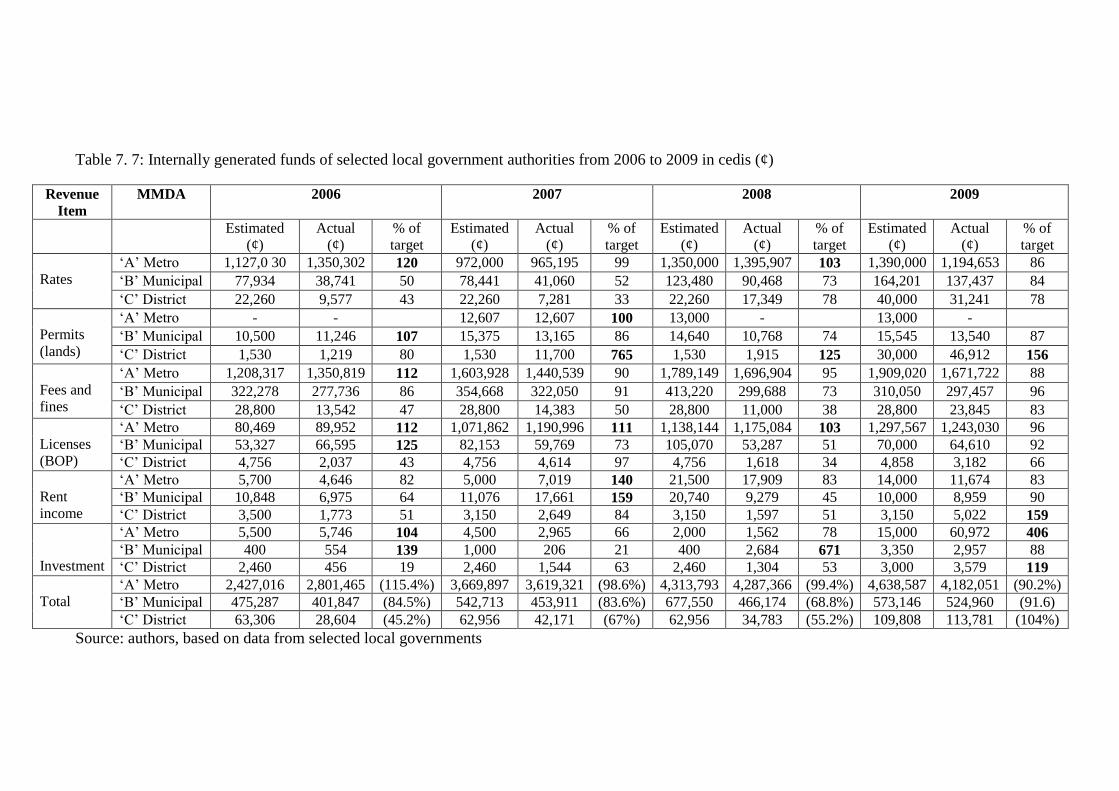
Table 7. 7: Internally generated funds of selected local government authorities from 2006 to 2009 in cedis (¢)
Revenue
Item
MMDA 2006 2007 2008 2009
Estimated
(¢)
Actual
(¢)
% of
target
Estimated
(¢)
Actual
(¢)
% of
target
Estimated
(¢)
Actual
(¢)
% of
target
Estimated
(¢)
Actual
(¢)
% of
target
Rates
‘A’ Metro 1,127,0 30 1,350,302 120 972,000 965,195 99 1,350,000 1,395,907 103 1,390,000 1,194,653 86
‘B’ Municipal 77,934 38,741 50 78,441 41,060 52 123,480 90,468 73 164,201 137,437 84
‘C’ District 22,260 9,577 43 22,260 7,281 33 22,260 17,349 78 40,000 31,241 78
Permits
(lands)
‘A’ Metro - - 12,607 12,607 100 13,000 - 13,000 -
‘B’ Municipal 10,500 11,246 107 15,375 13,165 86 14,640 10,768 74 15,545 13,540 87
‘C’ District 1,530 1,219 80 1,530 11,700 765 1,530 1,915 125 30,000 46,912 156
Fees and
fines
‘A’ Metro 1,208,317 1,350,819 112 1,603,928 1,440,539 90 1,789,149 1,696,904 95 1,909,020 1,671,722 88
‘B’ Municipal 322,278 277,736 86 354,668 322,050 91 413,220 299,688 73 310,050 297,457 96
‘C’ District 28,800 13,542 47 28,800 14,383 50 28,800 11,000 38 28,800 23,845 83
Licenses
(BOP)
‘A’ Metro 80,469 89,952 112 1,071,862 1,190,996 111 1,138,144 1,175,084 103 1,297,567 1,243,030 96
‘B’ Municipal 53,327 66,595 125 82,153 59,769 73 105,070 53,287 51 70,000 64,610 92
‘C’ District 4,756 2,037 43 4,756 4,614 97 4,756 1,618 34 4,858 3,182 66
Rent
income
‘A’ Metro 5,700 4,646 82 5,000 7,019 140 21,500 17,909 83 14,000 11,674 83
‘B’ Municipal 10,848 6,975 64 11,076 17,661 159 20,740 9,279 45 10,000 8,959 90
‘C’ District 3,500 1,773 51 3,150 2,649 84 3,150 1,597 51 3,150 5,022 159
Investment
‘A’ Metro 5,500 5,746 104 4,500 2,965 66 2,000 1,562 78 15,000 60,972 406
‘B’ Municipal 400 554 139 1,000 206 21 400 2,684 671 3,350 2,957 88
‘C’ District 2,460 456 19 2,460 1,544 63 2,460 1,304 53 3,000 3,579 119
Total
‘A’ Metro 2,427,016 2,801,465 (115.4%) 3,669,897 3,619,321 (98.6%) 4,313,793 4,287,366 (99.4%) 4,638,587 4,182,051 (90.2%)
‘B’ Municipal 475,287 401,847 (84.5%) 542,713 453,911 (83.6%) 677,550 466,174 (68.8%) 573,146 524,960 (91.6)
‘C’ District 63,306 28,604 (45.2%) 62,956 42,171 (67%) 62,956 34,783 (55.2%) 109,808 113,781 (104%)
Source: authors, based on data from selected local governments
Despite the fact that some revenue targets were exceeded as shown from table 7.7, both ‘B’
Municipal Assembly and ‘C’ District were unable to meet their overall annual IGF targets
compared to ‘A’ Metropolitan Assembly during the period under review. In fact, the
collection of rates, land permits, licenses, fees and fines were significantly lower in ‘B’
municipality compared to both ‘A’ Metropolis and ‘C’ Districts despite its vibrant
commercial centre. One would expect rent obtained from market stores to have been higher
than the 64% and 45% of the targets recorded in 2006 and 2008 respectively.
Comparatively, revenue in the ‘A’ Metropolis is one of the highest in Ghana, sometimes,
higher than their share of the District Assembly Common Fund; the major central
government grant to local authorities. Also, revenue is relatively higher in the ‘A’
Metropolis not only because of urbanisation and the operation of heavy factories and
industries that pay the LGs property rates and fees for permits but also because the
metropolitan assembly has an effective revenue task force. It is unlikely that LGs in the ‘B’
Municipality and ‘C’ Districts would be able to raise similar revenues without having the
potentials and institutional structures that enable the ‘A’ Metropolitan Assembly to
mobilise such huge sums of money as its IGF. Figure 7.3 shows the relative revenue
performance of the 3 Assemblies.
Figure 7. 3: Targets of internally generated funds achieved between 2006 and 2006
Source: author, based on data from selected local governments.
0
20
40
60
80
100
120
2006 2007 2008 2009
A Metropolitan Assembly 115.4 98.6 99.4 90.2
B Municipal Assembly 84.5 83.6 68.8 91.6
C District Assembly 45.2 67 55.2 104
Inte
rnal
reven
ue
targ
et a
chie
ved
Percentage of internally generated funds (2006-2009)
177
As indicated above, the notable revenue record in ‘A’ Metropolis can be attributed to the
formation of a proactive revenue task force which is given high targets to meet. The budget
and rating office is headed by an experienced officer whose vision is to widen the revenue
basket by ensuring that the LG generates funds from marriage registrations, vehicle
licensing, housing and building permits, business operating permits and permits for
outdoor advertisements. These sources of revenue, which are also available to the ‘B’
Municipal Assembly and the ‘C’ district, are yet to be taken seriously. This is crucial for
LGs since the mobilisation of low revenue weakens their financial status and adversely
affects their capacity to facilitate local level development. Meanwhile, because local
governments do not have control over the timing and the amount of funds they receive
from central government and donor agencies, one would expect local councils to generate
more funds internally especially to cater for their recurrent expenditure. This is however
not the case for a number of reasons.
First, the revenue base is weak and small in less urbanised areas and database on potential
sources of revenue is often lacking. Secondly, revenue targets are often ambitious despite
the fact that LGs may not be proactive in their attempt to achieve those targets. Thirdly,
there are reports of serious leakages in the revenue mobilisation process driven by
unprofessional conduct of some revenue collectors who either fail to collect revenues from
people with whom they have close interpersonal relations or sometimes even when funds
are collected, they are unaccounted for. Thus, financial records of most LG raise concerns
about the accuracy of IGF since revenue may not truly reflect the exact amount of funds
collected. Also, political impropriety in the management of LG finances is an open secret
in most LGs in Ghana and these concerns lend legitimacy to demand for transparency and
accountability in the management of local government finances. Furthermore, a remote but
important obstacle to revenue mobilisation relates to the inability of LGs to enforce their
own byelaws. This is exacerbated by frustration associated with slow legal processes
which tend to undermine LGs’ ability to prosecute people, including staffs that defy
financial management laws. Interviewees felt this emboldens potential lawbreakers due to
the perception that when people fail to pay their property rates or any other revenue due the
Assemblies, nothing can be done to them.
Ultimately, the consequences of inadequate funds and poor financial managements create a
situation where LG are unable to perform their functions effectively. Probably worse than
what Olowu and Smoke (1992) found in Nigeria and Zimbabwe, the situation even

178
becomes worse when ordinary and basic administrative processes grind to a halt due to
lack of funds. In the Brong Ahafo and Northern regions where IGF is very low, LGs face
problems in holding General Assembly meetings. A senior official expressed concern that:
“If we organise an assembly meeting now and there is no
money to pay the sitting allowance of the assembly members,
there will be a stalemate because they will hound us and put
pressure on management to find money to pay them.
Meanwhile, the IGF is supposed to be used for recurrent
expenditure but our low revenue base makes it difficult for us
to pay them” [Field data, interview transcript, ‘B’ Municipal
Assembly].
As the highest decision making body, General Assembly meetings are extremely important
and for that reason, LGs struggle to convene a minimum of at least 3 meetings in every
fiscal year. The quotation above further reinforces claims about different motives behind
General Assembly meetings. For instance, LG managers did not only convene General
Assembly meetings to obtain dejure approval to implement development projects and
programmes, such meetings were also used to boost their performance score under the
DDF FOAT. On the contrary, the main incentive for Assembly members (councillors) to
participate in General Assembly meetings was largely driven by financial gains associated
with these meetings. According to an elected member of the ‘C’ District Assembly:
“The work of the assembly member is voluntary and we are
not paid a salary. It is only through assembly meetings that
we get something small and can you imagine that we
(assembly members) have met two times without the assembly
paying our sitting allowance and that is why we will boycott
the upcoming General Assembly meeting until all outstanding
allowances are paid” [Field data, interview transcript, ‘C’
District].
As indicated above, the fact that Assembly members (councillors) are unremunerated is a
problem LGs have to contend with but it does not appear many LGs have the solution to
this problem due to the low revenues they generate. Certainly, the persistence of this
problem is perceived by LG officials and elected assembly members as a serious affront to
the performance of LGs. In sum, one could argue that the strategies outlined above could
boost the effective mobilisation and utilisation of funds in accordance with statutory
arrangements with the expectation that it will deepen transparency and accountability to
179
local communities. This is particularly useful given that numerous studies have reported
the lack of accountability in disclosing LG finances and how it is used (Ayee 2004;Ayee
2008;Crawford 2009;Crook and Manor 1998;Crook 1994). Thanks to the DDF FOAT for
making the disclosure of financial records a performance indicator. Even though LGs have
been encouraged to disclose their finances to civil society and the general public by
publishing their financial statements on notice boards within their premises this practice is
often ignored until performance assessment is underway.
7.5.2 Internal process perspective
This dimension refers to intra-organisational features that significantly drive organisational
performance. Underpinning this perspective of the BSC is the assumption that managers
can look within the internal processes of an organisation to identify factors in which they
must excel to meet the expectations of clients (Kaplan and Norton 1992). In the context of
this study, the opinions of research participants tended to highlight factors they felt were
crucial for the internal health of LGs. Even though they mentioned several issues as vital
for the effectiveness of LGs, the data reduction process led to the following themes:
1) The leadership style of LG managers
2) Effectiveness of development planning and
3) Human resource capacity and team work
In order to examine the scope of the DDF FOAT with respect to these themes, the analysis
focused on the degree to which the MCs and PMs address these themes in the evaluation of
LG performance. It was found that while the MCs did not explicitly prescribe a preferred
leadership style for the management of LGs, they did not also define parameters for HR
capacity but 3 out of the 5 MCs were focused on planning related functions such as the
functional capacity of development planning, plan implementation capacity and the
functional capacity of the General Assembly. Thus, LGs that fulfilled these performance
indicators had to demonstrate that key stakeholders such as project beneficiaries in local
communities were consulted and that Assembly members and service providers were
involved in formulating, implementing and monitoring development plans4. Similarly, the
FOAT also encourages quick project completion rates, harmonizing budgets with plans,
4 Minutes of meetings and records are crossed checked to verify whether 80-100% of the non-physical programmes involved the participation of key stakeholders. A score of 1 is awarded if participation was promoted and if there was no evidence of participation
then a score of 0 is given.
180
internal monitoring and evaluation of projects and initiating projects to support poor and
vulnerable populations to minimise existing inequalities. Meanwhile, it was found that
while plans were often harmonised with budgets (both main and supplementary budgets),
LG managers took their leadership styles and their staff for granted since the MCs do not
cover these issues in assessing LG performance.
With respect to PMs, ‘human resource capacity’, ‘planning system’ as well as
‘management and organisation’ are treated as independent performance measures with
different weights which ranks planning functions as more important compared to
management and human resource issues 5
. Meanwhile, the human resource policy of the
Local Government Service of Ghana recognises the need to recruit highly qualified and
motivated staff that will be committed to facilitating local government performance (LGSS
2009). It is believed that the right combination of knowledge, skills, experience and
attitudes are necessary for meeting increased demand for quality services. As one would
expect, the FOAT’s performance measure on HRM assesses staff vacancies of LGs, as
well as training and skills development needs. In practice, LGs had to update their staff
ledger every three months to reflect the numerical status of their employees to show staff
vacancy levels and to prove that training need assessments have been conducted and
implemented. In addition, they were also required to demonstrate that job applications
made to fill available vacancies have been acted upon. Beyond these conditions,
performance indicators did not set targets to assess individual work output and had no
provisions for rewarding or sanctioning employees in accordance with their performance
output.
Nonetheless, since an in-depth assessment of the internal processes can help managers
identify issues or concerns than can be changed or reformed to make citizens more
satisfied with LG performance, the opinions of research participants on these internal
drivers of LG performance were sought to explain how they impacted on LG performance.
Understanding their views was necessary to interpret the strategies LG have planned to
improve upon their internal processes. For instance, there was consensus amongst
respondents that the status of LG performance primarily depended on the vision and style
of Chief Executives and the Coordinating Directors who manage the local government
5 The maximum scores are now 6 for human resource management (used to be 7), 9 for organisational management (used to be 10), and
18 for development planning (used to be 16). This suggests that HRM and organisational management have lost weight/value to
development planning.
181
authorities. Meanwhile, the objectives set by the political leadership of local authorities
appeared to be a microcosm of the political goal of the central government, which is to
create a ‘better Ghana’. It is important to emphasise that this overarching vision of LGs in
Ghana turn out to be vague based on claims about the role of LG managers in facilitating
organisational performance. The controversy stems from the perception amongst many LG
staff and Assembly Members that the political heads frustrate rather than enable local level
development. This has become a major cause of apathy and dissatisfaction among LG
staff. This perception had earlier on caught the attention of Ayee (1997) who believe that
frustration at the institutional level is the result of LGs’ inability to improve development
performance whilst Crook (1994) further claim the lack of tangible development results
has undermined the creation of a more legitimate and responsive form of government at the
local level in Ghana. To Ayee (1997:41) “the marginal performance of LGs can be
attributed to the absence of political direction and leadership of the bureaucracy,
centralized nature of government and administration, lack of financial resources, poor
calibre of personnel, the failure of the DAs themselves to maximize the revenue resources
available to them and a poor and erratic commitment to development and services as
demonstrated by their actual expenditure patterns and widespread corruption”.
While LG managers who were interviewed in this study did not share these views, a fair
assessment of LG leadership should be critical of the FOAT’s quest to improve LG
performance especially when indicators do not seem to improve the managerial qualities of
Chief Executives, Coordinating Directors and members of staff. For example, instead of
explicitly making LG managers the target, it is surprising that the performance measures
on organisational management only seek to confirm the existence and functioning of
Executive Committees of LGs and their sub-committees and whether public buildings are
fit for use by people with physical disabilities. Thus, the presumption that LG managers
will automatically offer the type of leadership that will have ripple effects on other issues
such as getting the right calibre of staff into the local authority and facilitating effective
planning outcomes was inconclusive. However, it was observed that the style of leadership
had implications for staff commitment and team spirit within LGs. For instance, in the ‘C’
District where the Chief Executive appeared to be visionary and transformational in his
management style, the mood of his subordinates was positive and cooperative compared to
‘B’ Municipality where staff were generally dissatisfied because they felt the Chief
Executive was autocratic and divisive. Yet, there were no indicators to gauge the level of
staff morale and team work even though LG officials who participated in this study felt

182
these attributes were essential for job satisfaction and ultimately for organisational
performance. Given the inability of performance indicators to cover issues that emerged as
crucial for operational performance of the LGs in this research, it was important to
examine how they were positioning themselves to improve upon their internal processes in
order to satisfy the general public. Hence in table 7.8, key objectives and strategies
outlined in the MTDPs of LGs to fulfil key drivers of internal processes are presented.
Table 7. 8: Measures to improve internal processes
Performance
issue
Objective Initiatives
Leadership style
of LG managers
To accelerate
development under ‘the
better Ghana Agenda’
Organise regular public dialogue (town
hall meetings); follow up and review
milestones of key departments of the
Assembly; promote collaboration with
traditional authorities, etc.
Effectiveness of
development
planning
Encourage effective
participatory
community
development
Activate district sub-structures; undertake
frequent community hearings and
sensitization programmes on community
action planning; encourage participatory
monitoring and evaluation of projects
Human resource
capacity and team
work
To recruit and retain
the right staff to deliver
quality services to the
people and to achieve
LG targets.
Staff training (demand driven); encourage
staff participation at capacity building
workshops; promote training of trainers;
freedom to join labour unions (LGWU
and CLOSAG)
Source: author, based on MTDPs of LGs
Arguably, the objectives and strategies outlined in the MTDPs of LG manifested
differently in the 3 regions. For example, town hall meetings were rarely held as such, but
events such as cultural festivals and durbars were considered and recorded in LG
documents as town hall meetings even though such meetings were not used to collate
citizens’ opinions about LG performance. The inability to hold community hearings was
attributed to lack of funds. At the organisational level, it was noticed that apart from the
‘A’ Metropolitan Assembly where there was a department in charge of HR, the other LGs
183
only had relatively smaller personnel offices that kept staff files and distributed salary/pay-
slips. In all the LGs, human resource plans showed how LG officials seem to be obsessed
with ‘capacity building’ a phrase that loosely refers to training6. It is quite obvious from
table 7.8 that the strategies on human resource management focused more on training and
staff development even though performance indicators under the DDF-FOAT focuses on
staff vacancies, LG plans did not show how personnel vacancies could be addressed. This
is not surprising because local government authorities in Ghana do not directly recruit staff
but rather depend on the Office of the Head of Civil Service and the Local Government
Service Secretariat for staff recruitment and posting (Bukari Zakaria and Mamman
2014;Awortwi 2011). Hence, the performance indicator on staff vacancies appears
irrelevant because it is beyond the control of LGs in spite of the fact that LGs need to have
qualified personnel to function effectively.
In terms of training, a distinction is made between those organised by other organisations
that invite LG officials to participate and those that are planned and budgeted for by LGs
and implemented in-house. It was found that all the LGs prepared capacity building plans
that were at various stages of implementation. In the ‘A’ Metropolis, an amount of GH¢59,
649 was set aside for these trainings compared to GH¢34,500 in the ‘C’ District in 2011
alone. The location of training workshops was important for LG officials. It was obvious
that LG officials preferred to attend workshops in Accra or in the regional capitals.
Workshops in Accra were considered to be superior because it often involves attractive
travelling allowances and provided opportunities for networking. It was confirmed that the
MLGRD has a partnership with the Institute of Local Government Studies, Management
Development and Productivity Institute and the Ghana Institute of Management and Public
Administration to develop leadership skills of newly appointed LG managers (DCEs,
Coordinating Directors and Presiding Members) for every session of the Assembly. And
yet, under the CB component of the DDF, LG managers’ tended to disproportionately
benefit from capacity building budgets compared to chairmen of sub-committees and
officials in charge of Finance, Planning, Budget, Audit and Engineering departments. It is
therefore imperative for LG managers to recognise that in order for staff to be equipped
with requisite knowledge and new ideas related to their field, it is important to draw
beneficiaries of capacity building workshops from different departments in order to
6 This has its origin in donor assistance dating back to the 1980s when public sector reforms were introduced to address ‘capacity
challenges of weak institutions’. Currently, the ‘A’ Metropolitan Assembly and the ‘C’ District Assembly are part of 50 LGs benefiting
from a joint EU-Government of Ghana fund to set up HRM units (LGSS, 2009).

184
improve competences in financial management, budgeting and auditing, procurement and
contract management, project management, monitoring and evaluation, administrative
skills, records management, as well plan preparation, revenue mobilisation and gender
mainstreaming into the work of LGs.
This is important because research participants were in favour of expanding and supporting
junior officers to upgrade their skills because the overall performance score of LGs
depended on the output and accuracy of documents and performance information for each
department. For this reason, selecting administrative staff from LG registries for training
was seen as a priority because it strengthens their capacity to keep up to date information
on organisational performance. Nonetheless, in the ‘A’ Metropolis and ‘C’ Districts, it was
revealed that the registry’s ability to collate performance information also depended on the
supply of performance information by decentralised departments for filing. Meanwhile,
there were instances when lack of coordination between different departments undermined
the sharing of performance information and this had consequences on team spirit within
the LG.
In sum, two issues from the foregoing discussion are worth mentioning. First, it is evident
from the findings that LGs will have to tackle a host of issues if the expectations of their
constituents have to be met. This implies that conscious attempts must be made to identify
public preferences in terms of service delivery or ideals such as open and transparent LG
administration. Secondly, applying the internal process perspective of the BSC to analyse
performance indicators under the DDF FOAT provides counterfactual evidence which
revealed certain limitations of the performance policy initiative in targeting what LGs
themselves perceive as the most important factors for operational excellence. Hence,
performance indicators that seek to improve upon LG processes and operational
performance need to be aligned to priorities outlined in MTDPs of LGs that have the same
objective. Without such alignment, the value of the DDF FOAT to enable LGs meet the
expectations of the citizenry will be difficult if not impossible. The next section examines
the performance enhancing policy from a citizens’ perspective.
7.5.3 Citizens perspective
The adaptability of the BSC in non-profit organisations is one of its strengths especially
when the mission of the organisation is regarded as a top priority (Kaplan and Norton,

185
2001). In this study, the citizens perspective of LG performance is conceived as the most
important factor to consider in managing LG performance because the mission of LGs are
often directed towards society’s needs and the improvement of public welfare (Boyne,
2002). In the context of using the BSC to explain the scope of performance indicators
under the DDF FOAT, it is imperative to examine whether or not the policy initiative
creates space for citizens’ participation in assessing LG performance and whether
performance indicators target broader goals and aspirations of citizens. Some experts
believe that considering citizens as customers and getting them involved in designing,
implementing and evaluating performance management systems help to improve service
delivery (Pollitt and Bouckaert 2004).
In the case of Ghana, citizen’s participation in local governance tends to be superficial
because elected members of the Assembly who represent local communities have minimal
influence in steering the affairs of LGs (Crook and Manor, 1998). Even though previous
research has noted local governments’ ambivalence to promote citizens’ participation in
local government administration (Ayee 2004;Crawford 2009), it appears the DDF FOAT is
missing the opportunity to address this concern. This is particularly problematic because
none of the MCs and PMs explicitly targets citizens’ assessment of LG performance. Even
though MCs on the functional capacity of the general assembly requires elected assembly
members representing local communities to participate in general assembly meetings, the
purpose of these meetings is neither to assess nor review the performance of local
authorities. However, it is worth noting that the performance measure on planning system
encourages LG managers to involve project beneficiaries and service providers in
formulating community action plans. Similarly, in order to promote transparency and
accountability, there is a performance measure which requires LGs to disseminate
performance information and organisational achievements to the general public but in most
cases, these possibilities for mobilising citizens’ interests, aspirations and expectations at
the LG level leaves much to be desired. This can be attributed to a number of reasons.
First, it can be argued that 70% of the elected assembly members rarely represent the views
of their constituents because mechanisms for receiving memoranda and problems facing
local communities are not activated7
. Secondly, the Development Planning and
7Assembly members are unable to organise debriefing meetings with opinion leaders within their communities before and after General
Assembly meetings due to a plethora of reasons (mostly financial and apathy); a situation which is caused and reinforced by persistent
bureaucratic capture within local government authorities.
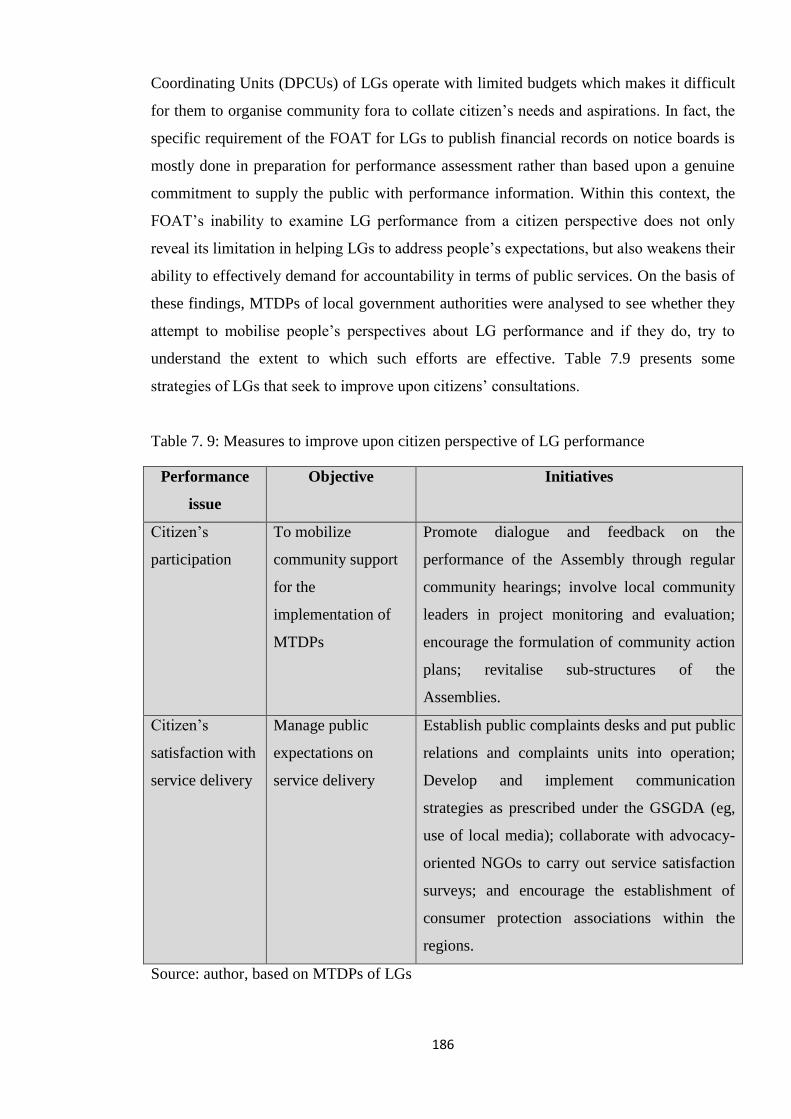
186
Coordinating Units (DPCUs) of LGs operate with limited budgets which makes it difficult
for them to organise community fora to collate citizen’s needs and aspirations. In fact, the
specific requirement of the FOAT for LGs to publish financial records on notice boards is
mostly done in preparation for performance assessment rather than based upon a genuine
commitment to supply the public with performance information. Within this context, the
FOAT’s inability to examine LG performance from a citizen perspective does not only
reveal its limitation in helping LGs to address people’s expectations, but also weakens their
ability to effectively demand for accountability in terms of public services. On the basis of
these findings, MTDPs of local government authorities were analysed to see whether they
attempt to mobilise people’s perspectives about LG performance and if they do, try to
understand the extent to which such efforts are effective. Table 7.9 presents some
strategies of LGs that seek to improve upon citizens’ consultations.
Table 7. 9: Measures to improve upon citizen perspective of LG performance
Performance
issue
Objective Initiatives
Citizen’s
participation
To mobilize
community support
for the
implementation of
MTDPs
Promote dialogue and feedback on the
performance of the Assembly through regular
community hearings; involve local community
leaders in project monitoring and evaluation;
encourage the formulation of community action
plans; revitalise sub-structures of the
Assemblies.
Citizen’s
satisfaction with
service delivery
Manage public
expectations on
service delivery
Establish public complaints desks and put public
relations and complaints units into operation;
Develop and implement communication
strategies as prescribed under the GSGDA (eg,
use of local media); collaborate with advocacy-
oriented NGOs to carry out service satisfaction
surveys; and encourage the establishment of
consumer protection associations within the
regions.
Source: author, based on MTDPs of LGs

187
It was found that all the LGs had plans of carrying out community hearings as part of their
community engagement and development planning process. In the ‘C’ District for
example, activities outlined to be undertaken by Unit Committees and Area Councils were
budgeted for. It is important to emphasise that the ‘C’ District Assembly was the only local
authority that could implement community participation activities between 2009 and 2012
because it received funding under the Northern Region Poverty Reduction Programme
(NORPREP) to strengthen its sub-structures and for that reason, did not have to squeeze its
lean budget to implement such activities. In the ‘B’ Municipality, only one out of three
Zonal Councils was active because it had a chairman who was proactive and committed to
keeping the Zonal Council in operation compared to the other two Zonal Councils whose
members were discouraged for lack of funds to cater for operational costs. Throughout the
three regions, LG managers recognised the need to interact more with citizens but were
ironically hesitant in approving funds for such activities. An official bluntly expressed his
views as follows:
“The truth is that our leaders do not like approving funds for
us to organise community fora and consult ordinary people in
this district. It is frustrating when an officer has to keep on
reminding the Coordinating Director to approve a simple
budget. My brother, last year, I had to put pressure on him
[Coordinating Director] before he reluctantly approved
funds for community sensitization and project monitoring”
[Field data, interview transcript, ‘B’ Municipal Assembly]
Interestingly, even in the ‘C’ District where LG officials frequently organised community
consultations to collate and incorporate citizen’s needs and development priorities into the
LG’s MTDP, there were no mechanisms for people to know whether their views were used
or not. Obviously, there have been many instances where people complained about delays
in the completion of projects in their communities but all their cries fell on deaf ears.
Therefore, if the intention to open public complaints units within local government
authorities will not end up being a mere rhetoric or public relations propaganda, they could
be a significant turning point for LGs in Ghana especially in terms of receiving complaints
and views from the general public. For this to be effective, one would expect LGs to
implement service charters that were introduced in Ghana under the Kufour led
government (Ohemeng 2010) or develop their own charters to serve as the basis on which
citizens and service users would assess local government authorities.

188
Based on the fact that performance indicators did not have a direct focus on citizens’ views
of local government performance, it will be inconsequential to expect the evaluation of LG
performance to reflect people’s perceptions of, and expectations from LGs. In this
research, it was observed that the procedures and actors involved in formulating
performance indicators under the DDF FOAT showed which of the principals of local
government authorities was more powerful. For instance, the outright exclusion of local
residents, community groups and service users in formulating performance indicators and
from expressing their views about LG performance in meaningful ways implies that local
governments will continue to satisfy their principals at the central government level
(including donor agencies) at the expense of the actual beneficiaries of local government
services. Under the prevailing circumstances in Ghana, measures are needed to ensure that
‘when citizens are engaged in defining results that matter, [it] becomes the standard for
performance reporting and for achieving accountability’ (Sanger 2008: 581).
7.5.4 Learning and innovation
This perspective of the BSC focused on factors that are important for the continued success
of an organisation. Kaplan and Norton (1992) note that since targets for outstanding
performance keep changing, organisations are required to make continual improvements to
their existing products and processes which largely depends on their ability to learn and to
be innovative. This is why shifting from a bureaucratic to an innovative paradigm is crucial
for organisational learning (Senge 2006) but ironically, it “is the very area in which
performance measurement and management is weakest in local government” (Kloot and
Martin 2000: 243). In the context of this study, it was therefore imperative to explore
whether and how the DDF FOAT assists LGs to develop and sustain the ability to change,
learn, adopt innovation and improve upon performance? Essentially, plausible answers to
this question require lessons from all the other three perspectives since they highlight
issues relating to personnel, technology, procedures and systems that LGs will need to
develop in order to be successful (Quinlivan 2000).
Meanwhile, two important themes that emerged from the analysis of data as crucial for
local governments’ learning and growth potentials were knowledge management and the
adoption of innovative practices. In the context of this study, ‘knowledge management’
refers to ‘capacity building’, a term loosely used in the Ghanaian context to describe staff
189
training, provision of basic office equipment and logistics. It could also describe the ability
to mainstream lessons learned through routine operations. And ‘innovation’ refers to a
process through which new ideas, objects and practices are created, developed or
reinvented and which are new and novel to the unit of adoption (Walker, 2006). In this
research, it was observed that local government officials’ realisation of these aspirations
would depend on the level of support they received both from within their organisation and
from other organisations in the external environment. But does the DDF FOAT per se
strategically help LGs to create a supportive climate that facilitate learning, innovation and
growth? On the contrary, it turned out that the performance-enhancing policy does not
explicitly have any performance indicators on learning or continuous improvement; neither
does it focus on knowledge management and innovation. But indirectly, and based upon
the diagnostic application of the FOAT, it can be argued that some form of what Argyris
(2006) called ‘single loop learning’ is plausible whereby problems hindering LG
performance can be identified and measures proposed to solve them rather than ‘double
loop learning’; which refers to learning that produces a significant change in the
assumptions and theories that people hold about cause and effect relationships.
For instance, in both ‘A’ Metropolis and ‘C’ District where the LGs could not fulfil the
MCs under the FOAT in 2008, the evaluators identified certain problems relating to
handling of performance information. Consequently, recommendations were made for the
LGs to train their staff on record keeping to avoid a recurrence of performance information
loss. Thus, it can be argued that initiatives that were taken to avoid failure in subsequent
assessments were part and parcel of LG’s learning process. Similar lessons were drawn by
LGs from implementing plans and submitting progress reports to the RCCs and other
supervisory agencies at the central government level. These lessons did reveal key issues
that needed to be changed for them to continue improving upon performance but the FOAT
per se did not intrinsically change the values and goals of LG managers. In spite of this
finding, MTDPs of LGs were analysed to understand measures identified to improve
knowledge management and use of innovation. These are presented in table 7.10 below.

190
Table 7. 10: LG strategies to improve learning and innovation
Performance issue Objective Initiatives
Knowledge
management
To build organisational
knowledge through
knowledge transfer and
retention
Establish internal performance
controls; participatory project
monitoring and evaluation;
implement training of trainers;
mainstream de-briefing of staff on
transfer and induction of new staff at
the local level; train senior staff on
Human Resource Management
Information System
Adoption of
innovation
To scale-up the use of
computers for local
government processes
Equip decentralised departments with
computers and replace outmoded
typewriters, train LG officials to use
modern ICT systems to facilitate
revenue mobilisation; revitalise LG
registries to shift from paper filing
systems to digital systems;
implement street naming and
property addressing system.
Source: author, based on MTDPs of LGs
The strategies outlined in table 7.10 reflect LGs’ response to issues such as high staff
turnover and limited skills transfer amongst LG officials which has implications for
‘organisational memory’ (Bukari Zakaria and Mamman 2014). Lack of proper mechanisms
such as databases for storing and retrieving performance information has implications for
knowledge management within local government authorities. Unfortunately, the FOAT
does not seem to have a solution to this problem. Interviewees also recognised that LGs
continued reliance on conventional labour intensive methods rather than modern
technology of mobilising revenue and valuing taxable properties has denied them huge
sums of revenue. Only in urban LGs were there plans to introduce innovative methods of
managing waste such as setting up a recycling plant which will be a significant shift from
traditional open refuse disposal and dumping practices. Even though LG officials
confirmed their support for innovative practices that could improve their response to
191
community needs, the reality is that LG operations are stuck to bureaucratic rigidities. For
example, Town and Country Planning Departments in all the study districts did not have
accurate topographical maps of the physical landscape, and this was cited as the prime
cause of multiple sale of land and associated conflicts linked to land ownership.
It is important to emphasise that many offices within the LGs in this study did not have
computers and offices were not connected to the internet. In fact, the main reason why LGs
are not innovative in social service delivery is due to poor ICT infrastructure in Ghana
which makes it almost impossible to implement e-governance initiatives. Given the low
access to internet connectivity, people living in local communities are unable to submit
service requests to LGs via the internet contrary to the status quo in developed countries
where innovation allows people to contact their LGs to either submit complaints or
demand for services needed in local neighbourhoods (Calista et al. 2010). The adoption of
e-governance initiatives, although wished by LG officials in Ghana, is not a top priority at
the sub-national level because LGs are neither connected to the internet nor have their own
websites with opportunities to interact with the public.
At a broader level, previous assessment of LG performance, especially by supervisory
agencies including the Auditor General has raised concerns about the incapacity of LGs to
learn from their own organisational practices. Most of these issues have recurred in
successive reports of the Auditor General. For example in 2012, the Auditor General
expressed grave concerns about the inability of LGs to learn from previous audit reports by
stating that:
“Outstanding and unresolved issues [pertaining to financial
management] are attributable to deficiencies and weaknesses
in internal controls in the operations of the audited
Assemblies. Weaknesses such as non-compliance with
existing legislative framework and instruments, managerial
lapses and weak monitoring procedures at both the
ministerial, legislative and administrative levels of the
Assemblies were pervasive as evidenced in my management
letters. The deficiencies noted in the operations of the
Assemblies created avenues for some officials to mismanage
the funds and resources of the Assemblies to a financial value
of approximately GH¢48,435,279.59 during the year under
review. The lapses and deficiencies were identified in
transactions such as cash management which repeatedly
recorded payment cycle irregularities, unsubstantiated
payments, misapplication of funds, unauthorised payments
192
and unaccounted payments. I [the Auditor General] also
noted procurement, store and contract irregularities in the
transactions of some Assemblies as well as tax irregularities.
This sordid state of affairs in the management of resources by
the MMDAs is primarily the result of the lack of interest and
dedication to duties and responsibilities exhibited by both the
Ministry of Local Government and management of the
MMDAs towards the implementation and enforcement of my
audit recommendations” (p, 3)
The perennial recurrence of passages like the above quotation in the Auditor General’s
report highlight serious weaknesses in the management of LGs as well as central
government’s inability to implement recommendations of the Auditor General. This further
raises concerns as to whether LGs learn from these observations.
7.6 Limitations of the FOAT for managing local government performance in Ghana
From the foregoing discussion in this chapter, the DDF FOAT is examined as a strategy or
a policy initiative for enhancing LG performance in Ghana. The framework encourages
LGs to document organisational processes, activities and achievements to know whether
performance indicators have been fulfilled or not. Financial rewards accompanying the
fulfilment of indicators aim at motivating and institutionalising practices that promote
LG’s compliance to legal and regulatory requirements. While this has been proclaimed as a
best-practice performance management system, the evidence reveals certain inherent
limitations. Using Kaplan and Norton (1992) BSC to analyse factors that research
participants perceive as critical for LG performance, the results show how the DDF FOAT
can enhance LG performance from financial and internal process perspectives of the BSC.
It was obvious that whilst the FOAT focuses on the fiscal capacity of LG and their
compliance to budgetary as well as financial management and auditing procedures, it does
not help independent performance evaluators to determine the efficient and effective
utilisation of funds by LGs. Furthermore, the FOAT was not found to be citizen-centred
nor people-led since it has no provisions for incorporating the views of citizens regarding
LG performance (Zakaria 2013). More so, mechanisms for continuous improvement of LG
performance are unclear due to over-dependence on lag performance indicators that neither
aim at organisational learning, nor innovation and growth. These could undermine people’s
demand for accountability from LGs especially when the performance management
193
process has no inbuilt mechanisms for knowing the preferences and expectations of local
communities and service users.
Arguably, the powerful role of the Ministry of Local Government and Rural Development
and donor agencies in implementing the DDF FOAT is in part, the reason why
performance indicators are imposed on local authorities in a top down manner. Indeed, the
depth of donor involvement raises concerns about ownership and sustainability of the DDF.
In addition, the implementation of the FOAT extremely relies on documents that LGs
submit to prove that appropriate procedures were followed in performing their functions
and to verify projects and programmes that have been implemented. This makes it an
inspection and a “desk-based review of existing documents and data” (Boyne et al. 2002a).
Since a central criterion for assessing performance indicators is whether they correspond
with important dimensions of organizational performance (Boyne, 2005), the FOAT would
have more value if it focuses on LG output performance, in addition to focusing on LG
processes as it does at the moment. In practice, there were claims that the inability of
performance evaluators to confirm the existence of what LGs claim to have achieved
reinforces the fabrication of documents in ways that do not adhere to the rules of the game
(Radnor 2008). Failure to put in place sufficient checks and balances leads to gaming of
the system whereby undeserving LGs receive performance rewards because they are
perceived as leading performers as per the official performance assessment criteria when in
reality they may be worse in discharging their core functions in fulfilling the needs of their
constituents. In sum, the DDF FOAT has the potential of stimulating organisational
performance if it is not just used to assess LG’s compliance with stipulated rules and
procedures. In other words, the mechanism could be used to evaluate LG outputs and
outcomes rather than processes alone. The strict compliance to pre-determined indicators
that are known by LGs has called the robustness of the FOAT into question particularly
when LGs are often pre-informed about the assessment dates and may conduct their own
trial assessment prior to the officially recognised assessment.
7.7 Conclusion
The chapter set out to analyse the scope of MCs and PMs under the DDF FOAT using the
concept of the BSC. It began with a discussion of how the initiative promotes ‘governance
by targets’ in which performance indicators are used to assess and award LGs with
development funds. An overview of the DDF FOAT shows that performance indicators are
specified in advance such that performance information of LGs can be used to determine

194
the extent to which they meet prior specifications. Also, a feedback mechanism in the form
of performance incentives is allocated to LGs on the basis of the assessment team’s
interpretation of performance using the MCs and PMs. Despite the fact that the DDF
FOAT is being touted as a model of performance management best-practice, the modified
BSC framework developed in this chapter and associated findings that emerged suggest
that performance indicators (MCs and PMs) are not comprehensive enough to incorporate
other critical factors that could add value to the evaluation of LG performance in the
Ghanaian context.
For example, indicators on financial performance do not target LG’s efficient nor effective
utilisation of funds even though LG plans recognise budget effectiveness as well as
revenue and investments as key drivers of financial performance. Similarly, indicators on
organisational management focus on whether LG structures such as the general assembly,
executive and management committees exist and operate or not. Beyond the existence and
operation of these management units, one would have expected the policy to help create
transformational and visionary leadership, which is arguably the most important factor
needed to steer LGs on the path of high performance. Furthermore, the fact that no specific
indicators are used to determine LG’s capabilities to learn from organisational practices
also point to the limited scope of the DDF FOAT. Based on these findings, a number of
conclusions can be made.
First, the findings have established that MCs and PMs focus more on internal processes
and financial aspects of organisational performance compared to citizens, learning and
innovation perspectives. Secondly, in terms of design, the DDF FOAT was driven by the
central government with significant donor influence. This explains why performance
indicators used for assessing LG performance specifically target compliance with
regulations of administrative processes that supervisory bodies seek to enforce rather than
actual performance outputs and outcomes. Furthermore, since only ‘official’ performance
information is used to assess and allocate performance grants to LGs, the basis on which
performance scores are given deliberately excludes what citizen’s think about LG
performance. The implications for not having a citizens’ perspective in the assessment of
LGs are manifold. For example, it creates the possibility of a ‘performance paradox’
caused by a “weak relationship between actual performance and what the performance
measures show” (Pollitt 2013 : 353;Thiel and Leeuw 2002). Under the current practice
where details of the DDF FOAT assessment can be accurately predicted, the risk of

195
performance paradox could be minimised by considering the following measures. For
instance, it is important to frequently revise and update the MCs and PMs to reflect
practical realities on the ground since indicators may become obsolete over time. This will
also minimise the tendency to cheat and game the assessment process since LG officials
would not expect a repetition of the same indicators over time. Thus, the DDF FOAT could
reflect the real performance of LGs if independent evaluators make unannounced visits to
assess the performance of local authorities as Pollitt (2013) suggests.
Based on the findings discussed in this chapter, it is clear that an effective performance
management regime at the local government level requires visionary leadership and
consensus between LG managers, assembly members, heads of departments and civil
servants. More importantly, there should be opportunities for citizens’ involvement in the
formulation and use of performance indicators. This implies that for performance
indicators to reflect LG priorities in a balanced manner there should be a link between LG
objectives and citizen’s aspirations. This could involve the use of outcome and output
indicators for Chief Executives and elected assembly members and process indicators for
heads of departments to track progress towards meeting their respective targets.
Importantly, systems should be put in place to ensure that performance data are accurate
and reliable. Lessons could also be drawn from modern performance management
practices in advanced countries where innovative ways of collecting and analysing data
optimises performance management outcomes (Calista et al. 2010). Thus, local
government authorities in Ghana could develop information systems that would allow
them set ambitious but achievable targets with a focus on improving service delivery. Also,
copies of performance reports submitted to supervisory agencies should be accessible by
ordinary citizens, civil society organisations and non-governmental organisations that
might be interested in the performance of local authorities.
In a typical multi-stakeholder environment, the scope of performance indicators should
enable local government authorities to produce factual and credible performance
information with which they could provide reasons for any performance that is off target
and specify actions that will be taken to get back on track. To achieve this objective, there
must be clear roles for different stakeholders to monitor LG performance so that lessons
that can be used to further drive improvement would be known to all stakeholders. In the
context of this study, one would advocate for a re-examination of performance indicators
under the DDF FOAT to ensure that they could have a lasting impact not only on LG
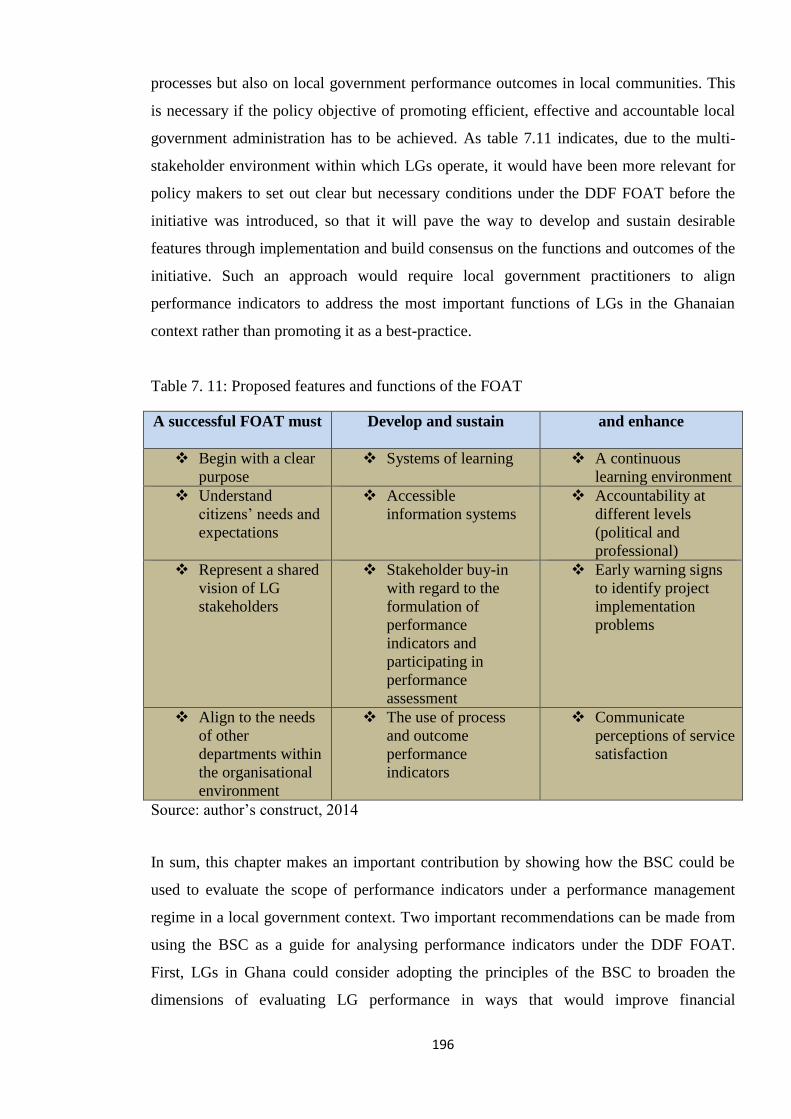
196
processes but also on local government performance outcomes in local communities. This
is necessary if the policy objective of promoting efficient, effective and accountable local
government administration has to be achieved. As table 7.11 indicates, due to the multi-
stakeholder environment within which LGs operate, it would have been more relevant for
policy makers to set out clear but necessary conditions under the DDF FOAT before the
initiative was introduced, so that it will pave the way to develop and sustain desirable
features through implementation and build consensus on the functions and outcomes of the
initiative. Such an approach would require local government practitioners to align
performance indicators to address the most important functions of LGs in the Ghanaian
context rather than promoting it as a best-practice.
Table 7. 11: Proposed features and functions of the FOAT
A successful FOAT must Develop and sustain and enhance
Begin with a clear
purpose
Systems of learning A continuous
learning environment
Understand
citizens’ needs and
expectations
Accessible
information systems
Accountability at
different levels
(political and
professional)
Represent a shared
vision of LG
stakeholders
Stakeholder buy-in
with regard to the
formulation of
performance
indicators and
participating in
performance
assessment
Early warning signs
to identify project
implementation
problems
Align to the needs
of other
departments within
the organisational
environment
The use of process
and outcome
performance
indicators
Communicate
perceptions of service
satisfaction
Source: author’s construct, 2014
In sum, this chapter makes an important contribution by showing how the BSC could be
used to evaluate the scope of performance indicators under a performance management
regime in a local government context. Two important recommendations can be made from
using the BSC as a guide for analysing performance indicators under the DDF FOAT.
First, LGs in Ghana could consider adopting the principles of the BSC to broaden the
dimensions of evaluating LG performance in ways that would improve financial
197
performance, internal processes, learning and innovation and more importantly, encourage
conscious and deliberate targeting of citizens’ priorities. In other words, policy makers
could maximise the benefits of the DDF FOAT by taking a citizen-centred approach in the
formulation, adoption, implementation and evaluation of LG performance in Ghana.
Second, the findings in this chapter call for a clarification of the relationship between LGs,
central government and residents of local communities. From a principal-agent
perspective, it is unclear who the principals of LGs are; whether it is central government or
citizens in local communities who benefit from the services of LGs. While the DDF FOAT
was introduced with the aim of improving efficiency, transparency and accountability at
local government level, the findings in this chapter have suggested that it appears to have
been introduced to legitimize the ‘institutional environment’ instead of stimulating
organisational learning, change and service improvement (McKevitt and Lawton 1996).
Nonetheless, it is imperative to explore and understand the relevance and impact of
performance management processes of local authorities by focusing on how performance
information is used to improve service delivery. The next chapter explores this issue in
detail.
198
Chapter 8: Impact of performance information and performance management
practices on social service delivery
‘Understanding the use of performance information is perhaps the most
pressing challenge for scholarship on performance management’ (Moynihan
and Pandey 2010: 849)
8.1 Introduction
The objective of this chapter is to understand how local government authorities use
performance management practices to improve social service delivery and to examine
reasons why and how LG managers utilise performance information to enhance service
delivery. In order to achieve this objective, the chapter attempts to answer two inter related
research questions. The first question looks at the extent to which local government
authorities use both internally and externally driven performance management practices to
deliver primary education and waste management services. The second question attempts
to unearth factors that explain local government managers’ utilisation of performance
information to achieve local government goals. In other words, the chapter seeks to find
out whether or not, LG managers use performance information within the performance
management context to deliver LG services. It further examines the perceptions of local
residents about primary education and waste management services. Findings that emerge to
fulfil the objective of this chapter are vital because some experts have argued that the
utilisation of performance information is probably the most difficult challenge that
managers face in implementing performance management systems (Halachmi, 2006; De
Lancer Julnes and Holzer, 2001). Given the mandate of LGs in providing social
infrastructure and basic services, it is imperative to understand how performance
management practices facilitate managerial decisions on social service provisioning in
general and the reasons why LG officials may use performance information in particular.
The chapter is structured into seven (7) parts including this introductory section. Section
8.2 examines research participants’ understanding of performance culture and how it is
expressed within local government authorities. Section 8.3 explores how LGs generate
performance information while section 8.4 analyses the way performance management
practices; including the DDF FOAT enable LGs to provide basic education, sanitation and
waste management services. Citizen’s opinions about LG performance is presented in
199
section 8.5 while section 8.6 presents key issues that account for the use of performance
information to improve service delivery. Section 8.7 presents a conclusion for the chapter.
8.2 Developing a performance culture
There are opposing debates about the significance of performance culture. On one hand, it
is argued that having a ‘culture of performance’ is a necessary condition for organisational
effectiveness especially if it promotes the use of performance indicators and targets to
achieve organisational objectives (Boyne and Chen 2007). For instance, Henri (2006)
found a positive relationship between culture and the utilization of performance
information for decision making, and reiterated the need for managers to be conscious of
dominant values within their organizations when implementing performance measurement
systems because cultural traits could affect a performance management system and
organisational performance. On the other hand, the counter argument is that performance
management systems may not necessarily lead to improved organisational performance
until behaviours and attitude positively supports its effective utilization (Elzinga et al.
2009). This makes it important to develop and if possible, institutionalise cultural traits that
facilitate the achievement of key performance indicators so as to make performance
management systems effective and sustainable. Even though culture remains a very broad
concept with multiple interpretations, much of the management literature suggest there is a
positive relationship between organisational culture and performance (Ashworth 2010) and
that organizations that have a mission-driven culture are likely to perform better in the
public’s interest compared to those that lack these features (Brewer and Selden
2000;Moynihan and Pandey 2005).
In this study, respondents’ interpretation of performance culture revolved around
administrative processes, ‘involving shared values and believes about appropriate
behaviours and actions’ (Rainey and Steinbauer, 1999: 17). For instance, heads of
departments conceived performance culture as the values of hard work and commitment
which employees require for promotion during performance appraisals. Meanwhile, Chief
Executives and Coordinating Directors described performance culture as the mind-set of
staff in performing their official duties in general and especially in preparing for
performance evaluation under the DDF FOAT. In both cases, respondents perceived
performance culture as part of normative practices of assessing LG performance. However,
none of the LG managers consciously attempted to identify the prevailing culture of

200
performance in their respective organisations but rather expected heads of departments to
have a positive performance culture which is conducive for team work within and between
departments of the LGs. In their view, every official of the LGs is required to have values
that are consistent with the vision of the political leadership even though in most cases, the
individual vision of the DCE was not known as it was always an off-shoot of the central
government’s vision. Meanwhile, it is important to note that Chief Executives made
pledges by spelling out their vision and expectations during their inaugural addresses to
members and staff of the Assemblies, but none of these pledges was traceable after three
years in office. From the 3 local authorities, these performance pledges appeared to be
insignificant especially in the ‘A’ Metropolis and ‘B’ Municipalities where the mayors
were busily campaigning for votes ahead of parliamentary elections. In the words of one
official:
“We are technocrats and use our expertise to serve any
government in power so it depends on any new political head
to inject a high performance spirit into the assembly in line
with his/her vision. If the Chief fails to build a team and
transmit his work ethic into the assembly then everyone will
relax and the assembly will perform poorly” [Field data,
interview transcript, ‘A’ Metropolitan Assembly].
The above quotation implies that LG managers were expected to inculcate into their staff, a
culture of performance. As duty bearers, there is perception that the vision of LG
managers, which plays a key role in facilitating local level development, is in part
influenced by their performance culture. Some LG officials were of the view that a
successful manager is one who constantly met with his or her support staff to understand
what issues ought to be supported in order to know if managerial decisions are required to
make them happen. It was therefore not surprising that local civil servants claimed their
performance depended on the direction, vision and effectiveness of Chief Executives and
Coordinating Directors, the only people capable of keeping officers on their toes. An
interviewee emphasised that:
“Those who are at the top - the Director and the DCE – play
an instrumental role in the performance of the Assembly. If
they are up and doing, there is no way you will fail but if they
are not performing well, definitely those under them will not
also perform [Field data, interview transcript, ‘C’ District
Assembly].
201
The concern raised in the above quotation recurred in the views of most interviewees
particularly in the ‘A’ metropolis and ‘B’ Municipality where the Chief Executives where
contesting in parliamentary elections during field work for this study and LG officials were
mostly dissatisfied with them for prioritizing political campaigns at the expense of LG
business. Consequently, this significantly slowed down internal administrative processes
and even halted the implementation of projects in some cases. For example, while the
dominant culture in ‘C’ district was to prioritise and commit to the implementation of
projects in their MTDPs, the situation was different in the urban LGs where projects in
development plans could easily be pushed aside for those projects to be replaced with
unplanned ones. An important distinction between the LG in ‘C’ District and its
counterparts in ‘A’ Metropolis and ‘B’ Municipality was that managers in the former
usually monitored targets set for departments and maintained clear lines of communication
between the central administration and the various decentralised departments in that
district. This was absent in ‘A’ Metropolis and ‘B’ Municipalities because Chief
Executives were preoccupied with personal political ambitions which competed for their
time to fully concentrate on the details of activities and projects of various departments.
Within this context, performance culture was understood as a reflection of LG managers’
commitment to the mission and vision statements of their authorities to, and the extent to
which they have tried to realise those aspirations. Though LGs had unambiguously worded
mission and vision statements (see section 2.6), it was obvious that managers of the ‘A’
Metropolitan Assembly and ‘B’ Municipal Assemblies took them for granted compared to
the manager of the ‘C’ District where development projects and LG activities were
consciously geared towards achieving the vision of the Assembly. This suggests that
having a clear organisational vision alone would not be enough to create a progressive
performance culture unless LG managers are able to translate their thirst for goal
achievement to improve organisation performance (de Lancer Julnes and Holzer 2001).
This means that embedding a culture of performance into LG activities would be
significant if it is able to improve organisational processes as well as change the attitudes
of the people who adopt it.
8.3 Generation of performance information
To Pollitt (2006a : 39) “performance information refers to systematic information which
describes outputs and outcomes of public programmes and organisations whether intended
202
or otherwise – generated by systems or processes intended to produce such information”.
In this study, it was found that not only did various decentralised departments generate
information about their performance, the implementation of action plans and the outcomes
of DDF FOAT assessments also provided relevant performance information. These
included records of daily activities and projects LGs have implemented from their plans
which are subsequently used to prepare quarterly performance reports submitted to the
RCCs. Within the LG setup, information was produced from direct services such as issuing
of business operating permits, building permits, licenses, and marriage certificates in the
urban LGs compared to the rural areas where the ineffectiveness of LGs in providing these
services has affected their internally generated revenues. It was found that routine
generation, collation and communication of performance information contributed to LG
decision making processes and perceived organisational performance. Since the
introduction of the DDF, LG officials are encouraged to keep performance information on
key LG outputs because the provision of documentary proof of organisational performance
play a crucial role in the performance scores that LGs obtain during performance
assessments. It was found that LGs that accurately prepared and stored performance
information on a regular basis were likely to qualify for funds under the DDF. For
example, 88 out of a total of 138 LGs that did not qualify for the DDF grants in 2008
missed out because they could not provide requisite performance information. Hence,
project documents and performance review reports serve as an important source of
performance information and this was affirmed by most LG officials who indicated that
purposeful documentation of performance information was improving their performance
consciousness. Post-performance assessment reports prepared by independent assessment
teams are also an important source of performance information.
At the individual level, it was indicated that communication between employees, heads of
departments and management play a key role in the availability of performance
information. For instance, LG managers got information both from their own observations
and from formal and informal interactions with colleagues from other districts, their
subordinates, and more importantly from performance reports. In all the LGs that
participated in this study, performance reports of various departments were collated by
development planning officers into composite plans of the LGs. Essentially, the MTDPs of
LGs is an important repository of baseline information not only because it is a compilation
of district level data on different sectors such as agriculture, education, health and the local
economy among others, but also because these plans give an overview of LGs’ past

203
achievements as well as priorities for the future. There have been instances, albeit on ad
hoc basis, where central government Ministries, Departments and Agencies requested LGs
to submit performance information on budgets and project outputs and outcomes to help
monitor the status of projects such as the school feeding programme, health insurance and
other development interventions being implemented at the LG level.
Whereas the LGs in this study did not classify performance information based on the key
descriptors of organisational performance, the analysis and interpretation of data highlight
important aspects of LG performance such as output quantity and quality, efficiency and
effectiveness of outputs, responsiveness and equity of outputs, all of which shape citizens’
satisfaction. These factors are significant because they describe respondent’s understanding
of LG performance beyond sheer number of projects; which is rather common in the
Ghanaian context. In the ensuing section, the way LGs use performance information is
discussed by highlighting the sort of projects they prioritise, the departments responsible
for implementing those projects and the status of such projects. As Behn (2003) pointed
out, producing performance information as part of a performance measurement or
management system is not an end in itself until someone uses them to accomplish
something. This is why the study sought to understand how and why performance
information is used to advance LG performance including the provision of basic service.
Meanwhile, since it is beyond the scope of this study to cover all LG services, the next
section presents and discusses findings on the utilisation of performance information and
performance grants under the DDF FOAT with a focus on two selected services.
8.4 Examining the use of performance information for service delivery
There are a number of ways for analysing performance information use. This can involve
“a comparison of performance information at current levels with past performance (all-
time highs and historical averages), normative standards (expected levels set by the
organization itself and by others such as national and international bodies), and the
performance of other organizations (comparative statistics) (Askim 2007: 455). In this
study, all these approaches are combined by focusing on the past performance of the
selected LGs involved in this study, expectations of their performance and a comparison of
these. Also, based on the fact that Chief Executives (mayors), as representatives of the
president of Ghana, are the most powerful officials whose decisions affect the performance
of LGs (Crawford, 2009), this section specifically focuses on how these senior officials
204
used performance information to make managerial decisions. Focusing on Chief
Executives of LGs is important because some scholars have argued that ‘knowledge about
whether and how politicians use performance information is limited’ and that politicians
rarely make direct instrumental use of performance information (Poister and Streib
1999;Askim 2007;de Lancer Julnes and Holzer 2001). For example, Pollitt (2006b: 41)
analyses the implementation of performance management across policy sectors in
European countries and concluded that measuring and managing performance has become
universal but that “politicians do not take much interest [in it] unless and until disasters,
scandals or breakdowns come along….; and that performance measurement and
performance management remain activities conducted chiefly by and for managers”. The
scepticism about politicians’ use of performance information suggests that even when they
attempt to use performance information, there is a tendency for such information to be
used opportunistically as a rhetorical device and to support pre-existing policy or
achievements rather than break new grounds. Within this context, Pollitt (2006b) further
claims that politicians are likely to discredit or reject performance information that
contradicts their policy position or undermines their record.
In this research, it emerged that the attempt to use performance information depended upon
several factors which included but not limited to the type of information, how it was
produced and used by whom and for what purpose. As already mentioned, performance
information was often generated through internal administrative processes and from the
implementation of MTDPs and the preparation of quarterly performance review and annual
reports. In this study, the direct usage of information by local politicians was subtle even
though LGs had to generate and submit performance information to higher supervisory
bodies such as the RCCs, NDPC and the MLGRD to fulfil formal reporting requirements.
It was observed that performance information was occasionally used to monitor employee
performance to determine whether tasks assigned to them had been accomplished or not.
Hence, routine production of information was used at strategic and operational levels
within LG organisations and not very much at the employee level. This also helped Chief
Executives to identify problems that needed attention and created opportunities for
learning and improving upon performance.
In the urban areas where the revenue base was wide, LGs ensured that departments that
were instrumental in bringing in revenues frequently recorded and reported their
performance to the leadership of the LG. For instance, information on the financial
205
performance of local authorities, especially with respect to revenue generation helped LG
managers in making budgetary allocations for activities and development projects. Chief
Executives of local authorities also relied on available information on the status of project
implementation and services in making decisions on the distribution of infrastructure
projects and services to local communities. Furthermore, it was found that performance
information from the DDF process also provided relevant information with which LG
could improve upon their activities. Meanwhile, the way Chief Executives used
performance information can be described as circumstantial because the use of information
was varied in degree, depth and based on different circumstances. In the ‘B’ Municipality,
the Chief could not recall how performance information influenced his decision on the
rehabilitation of a leisure park even though one of his subordinates, the head of planning in
particular admitted supplying information on the said project to the Chief Executive.
Furthermore, this research found little evidence of Chief Executives using performance
information outside decentralised departments of local government authorities. This means
that LG managers rarely communicated their work to the general public and service users
despite the fact that information helped them in making decisions on service delivery. This
exacerbates the perception that LGs are paranoid in sharing financial information with civil
society organisations; a situation which undermines accountability at the local level. This
issue substantiates findings of previous studies which indicated that access to LG budgets,
financial statements and other important documents to the general public is lacking. For
example, a study commissioned by an NGO in Ghana reported that 89% of respondents in
a survey admitted to not having access to local governments’ plans, budgets and financial
statement and that request for these documents is often associated with suspicion and
intense bureaucratic procedures (SEND Foundation 2013). In the context of this research,
it can be argued that the inability of Chief Executives to use performance data to
specifically promote accountability to local citizens raise concerns as to whether
performance management is worth the effort in practice. This concern is a valid one
because without knowing why LGs in Ghana cannot exercise their accountability
functions, it will be difficult to establish performance management success with certainty
(Moynihan and Pandey, 2010).
Nevertheless, almost all interviewees in this study felt it was the responsibility of LGs to
create an enabling environment for local level development. It was therefore not surprising
that medium term development plans and annual action plans of LGs were replete with
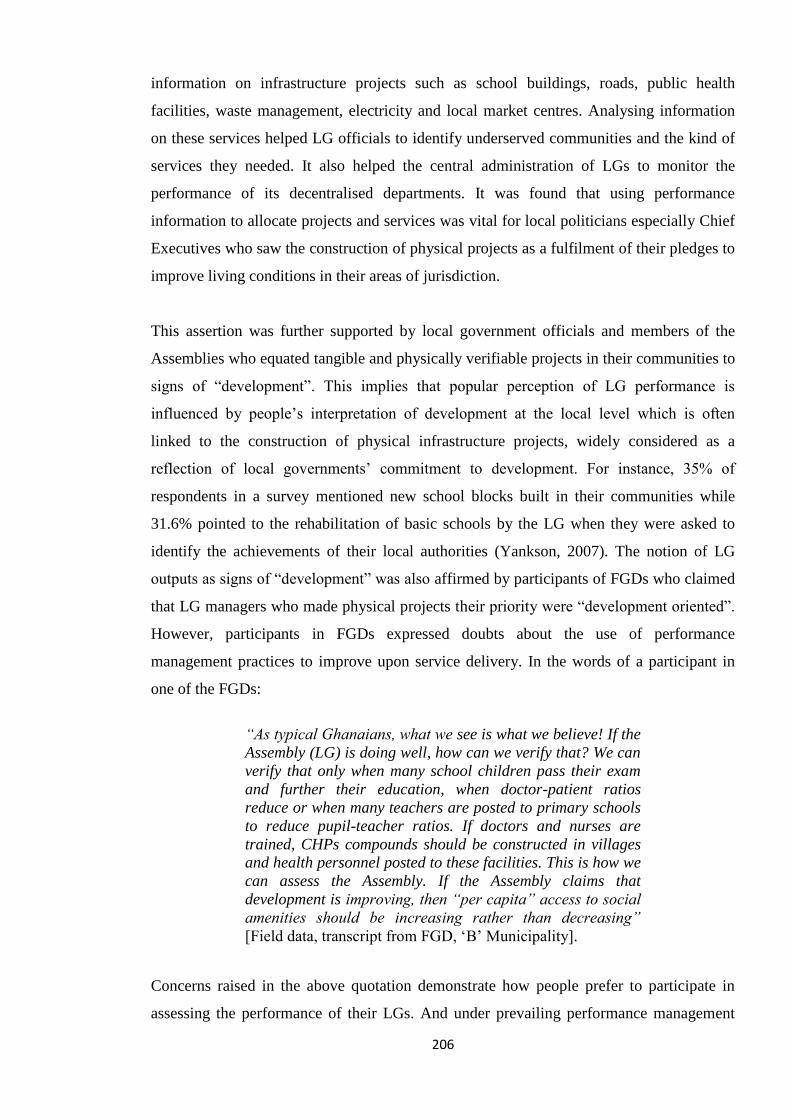
206
information on infrastructure projects such as school buildings, roads, public health
facilities, waste management, electricity and local market centres. Analysing information
on these services helped LG officials to identify underserved communities and the kind of
services they needed. It also helped the central administration of LGs to monitor the
performance of its decentralised departments. It was found that using performance
information to allocate projects and services was vital for local politicians especially Chief
Executives who saw the construction of physical projects as a fulfilment of their pledges to
improve living conditions in their areas of jurisdiction.
This assertion was further supported by local government officials and members of the
Assemblies who equated tangible and physically verifiable projects in their communities to
signs of “development”. This implies that popular perception of LG performance is
influenced by people’s interpretation of development at the local level which is often
linked to the construction of physical infrastructure projects, widely considered as a
reflection of local governments’ commitment to development. For instance, 35% of
respondents in a survey mentioned new school blocks built in their communities while
31.6% pointed to the rehabilitation of basic schools by the LG when they were asked to
identify the achievements of their local authorities (Yankson, 2007). The notion of LG
outputs as signs of “development” was also affirmed by participants of FGDs who claimed
that LG managers who made physical projects their priority were “development oriented”.
However, participants in FGDs expressed doubts about the use of performance
management practices to improve upon service delivery. In the words of a participant in
one of the FGDs:
“As typical Ghanaians, what we see is what we believe! If the
Assembly (LG) is doing well, how can we verify that? We can
verify that only when many school children pass their exam
and further their education, when doctor-patient ratios
reduce or when many teachers are posted to primary schools
to reduce pupil-teacher ratios. If doctors and nurses are
trained, CHPs compounds should be constructed in villages
and health personnel posted to these facilities. This is how we
can assess the Assembly. If the Assembly claims that
development is improving, then “per capita” access to social
amenities should be increasing rather than decreasing”
[Field data, transcript from FGD, ‘B’ Municipality].
Concerns raised in the above quotation demonstrate how people prefer to participate in
assessing the performance of their LGs. And under prevailing performance management
207
arrangements, significant progress has been made, at least in terms of implementing
projects and providing services funded from the DDF. Prior to the DDF, LGs had to rely
on meagre resources, mostly from the DACF and donor agencies to fund their budgets and
provide services (Ayee, 2008). This is changing under the DDF because performance
awards that LGs receive are often channelled into important projects while at the same
time, information from post assessment reports are useful for improving organisational
performance. The latter helped the LG in the ‘A’ Metropolis and ‘C’ District to
subsequently qualify for performance grants after failing to meet MCs and PMs in 2008.
By specifically focusing on infrastructure projects and ‘capacity building’ (training)
projects, the impact of the DDF is quite evident from table 8.1. In the ‘A’ Metropolis, it
was found that 604 projects (391 physical projects and 213 non-physical) were completed
between 2005 and 2008 compared to 1,474 projects (920 physical projects and 554 non-
physical) completed between 2009 and 2012. This represented a 59% increase in project
completion rate. Also, 600 projects completed in the ‘B’ Municipality between 2009 and
2012 represented 39% of planned projects for that period. Although this was slightly more
than the 407 projects that were completed between 2005 and 2008 in the same
municipality, many projects were halted due to financial setbacks and delays in
contractor’s execution of projects. In the ‘C’ district, the Assembly used the DDF to
finance 981 completed projects compared to 432 projects that were completed between
2005 and 2008 when the DDF had not been introduced. These are shown in table 8.1
below.
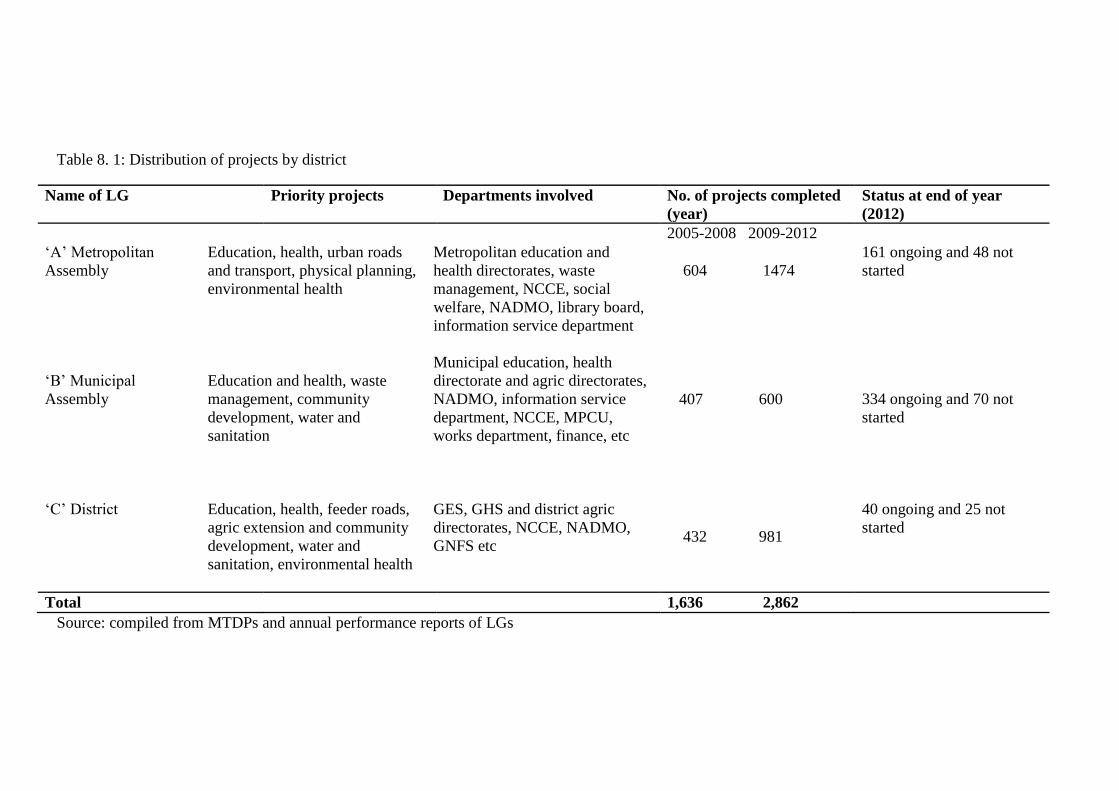
Table 8. 1: Distribution of projects by district
Name of LG Priority projects Departments involved No. of projects completed
(year)
Status at end of year
(2012)
2005-2008 2009-2012
‘A’ Metropolitan
Assembly
‘B’ Municipal
Assembly
‘C’ District
Education, health, urban roads
and transport, physical planning,
environmental health
Education and health, waste
management, community
development, water and
sanitation
Education, health, feeder roads,
agric extension and community
development, water and
sanitation, environmental health
Metropolitan education and
health directorates, waste
management, NCCE, social
welfare, NADMO, library board,
information service department
Municipal education, health
directorate and agric directorates,
NADMO, information service
department, NCCE, MPCU,
works department, finance, etc
GES, GHS and district agric
directorates, NCCE, NADMO,
GNFS etc
604 1474
407 600
432 981
161 ongoing and 48 not
started
334 ongoing and 70 not
started
40 ongoing and 25 not
started
Total 1,636 2,862
Source: compiled from MTDPs and annual performance reports of LGs

209
From table 8.1 above, a number of factors explain the relative gains in the ‘C’ District.
Firstly, management of the LG resolved to strictly adhere to their development plans as
the main reference document for information on service delivery. Being one of the 88
LGs to have failed the 2008 performance assessment, officials of the Assembly had
decided to stick to regulations by storing performance information and solely using
them for decision making. Obviously, the DDF has had a profound impact not only on
the ability of LGs to generate performance information but also to initiate new
development projects and sometimes continue with unfinished ones. Given that local
authorities can only finance allowable expenditure which tends to be service
infrastructure, it was found that LG managers had to be stubborn to divert DDF funds
from providing services they are allocated for. In districts where funds were diverted, it
was observed that the Chief Executive was more likely to have an ambition of
becoming a parliamentarian as was the case in the ‘A’ Metropolis and the ‘B’
Municipality where both Chief Executives were busily campaigning for votes during the
field work for this study. Funds were often misapplied and sometimes spent on
unplanned projects intended to please the electorate. Interestingly, the Chief Executive
of ‘A’ Metropolis had a nickname: “Mr Asphalt”, in order to appeal to voters for his
obsession in constructing asphalt-coated roads in the metropolis. Even though he
managed to upgrade some un-tarred roads in selected communities with asphalt, some
focus group participants believed those projects were politically motivated and not
based a genuine passion to improve upon infrastructure.
Even though the DDF is facilitating the use of information to allocate LG outputs, the
findings of this study suggests that sustaining the ability to use performance information
to deliver basic services depends on the commitment of LG managers to prioritise
physically verifiable projects in order to be seen as development oriented leaders. This
is not entirely surprising. It is obvious that LGs in Ghana are under pressure to increase
their development expenditures to meet peoples demand for services (Crook and Manor,
1998; Ayee. 2008). Within this context and based on ‘official’ performance information
from the three districts involved in this study, the next section presents LG performance
with regards to basic education, sanitation and waste management. These services were
selected not just because LGs have a direct responsibility to make them accessible but
because demand for them has driven LGs to make them a priority throughout the
country (Awortwi and Helmsing 2007).
210
8.4.1 Basic education
Improving access to education is one of the most important priorities of LGs in Ghana.
Apart from constructing schools and teacher’s accommodation, all the LGs in this
research collaborated with their district directorates of education to implement
interventions such as capitation grant, school feeding, free school uniforms and text
books scheme, elimination of schools under trees and the provision of classroom
furniture. It is important to note that performance information concerning education
targets and related interventions were fully captured in the plans and performance
reports of the Ghana Education service and those of the Assemblies. In 2011 for
instance, the LGs in the ‘B’ Municipality and ‘C’ District tackled the perennial shortage
of teachers by cooperating with the Ghana Education Service and the Youth
Employment and Entrepreneurship programme to recruit and post untrained teachers
(87 in ‘B’ Municipality and 60 in ‘C’ District) to remote villages that lacked teachers. In
addition , focus group discussions with school teachers and members of the Parents and
Teachers Association confirmed that LGs did sponsor some teacher trainees within the
district and also sponsored other events such as the best teacher award as well as ‘my
first day in school’ for kids who are attending school for the first time. In the C district,
the director of Education was satisfied with the Assembly’s support for brilliant but
needy children as well as teacher trainees from the area even though only 20 people got
sponsored between 2011 and 2012. More so, it emerged from the FGDs that support to
teachers and trainee nurses was characterised by nepotism, making it difficult for
deserving individuals to benefit from the sponsorship schemes. A participant
rhetorically asked that:
“If they claim to sponsor 30 teachers every year and there
are still empty classrooms without teachers, where are the
teachers then?” [Field data, transcript from FGD, ‘C’
District]
It was obvious that many teachers and parents were dissatisfied with LGs performance
on basic education and got infuriated when the Assemblies claim to have initiated
projects or supported education activities that could not be traced. A teacher in one of
the focus group discussions retorted quite emphatically that:

211
“But for the PTA [parents- teachers association] of this
school, there would be no electricity in this school”. The
LG does not have a maintenance culture and toilets in
many schools are broken and locked up because the old
asbestos pipes in the city have not been replaced so
children cannot use the toilets in the schools. Do you
expect the PTAs to change pipes/drains in the city? In this
regards, the performance of the assembly is nil” [Field
data, transcript from FGD, ‘A’ Metropolis]
Similar remarks were often made by members of the PTAs and SMCs due to
deteriorating schools blocks and school facilities in local communities. Meanwhile, the
role of PTA was acknowledged in the ‘B’ Municipality where the Chief Executive, in
his address to the General Assembly reported that
“I am happy to inform you that there was a remarkable
improvement in the BECE results released by the West
African Examination Council this year. The total score for
the Municipality was 64% and we owe this to the
partnership between the Assembly, the Ghana Education
Service and the various Parent-Teacher associations for
the wonderful collaboration that gave us this result”.
Apparently, the LG decided to sponsor mock examination for exam candidates prior to
the final examination. Nevertheless, there were certain genuine obstacles which
confronted LGs attempts to improve basic education and most of them persist up to
date. They include but not limited to lack of adequate funds to satisfactorily supply
schools with teaching and learning materials, deterioration of school buildings as a
result of shoddy work by contractors coupled with a poor maintenance culture and
ineffective supervision of pupils by teachers. Nonetheless, given that budgetary
allocation for education under the DDF has increased considerably, the expectation is
for LGs to correspondingly distribute educational projects to geographically
disadvantaged locations. Table 8.2 shows key LG objectives on basic education and
budgetary allocations before and after the DDF was introduced.
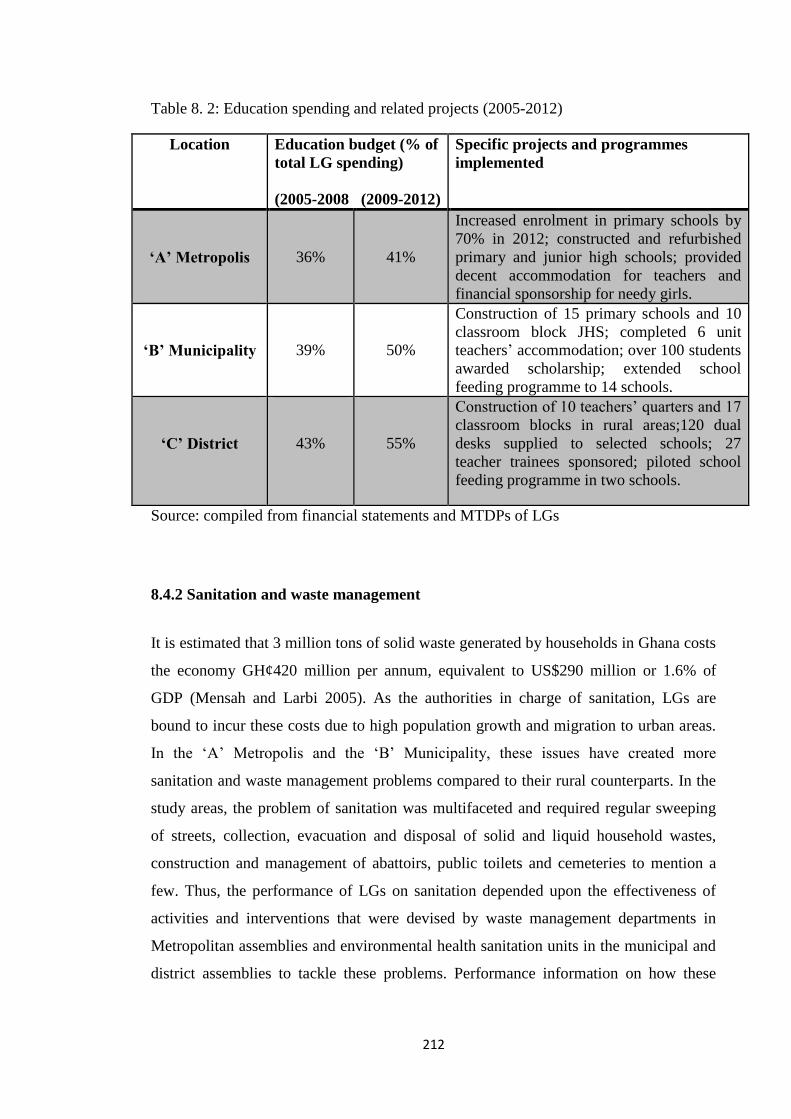
212
Table 8. 2: Education spending and related projects (2005-2012)
Location Education budget (% of
total LG spending)
(2005-2008 (2009-2012)
Specific projects and programmes
implemented
‘A’ Metropolis
36%
41%
Increased enrolment in primary schools by
70% in 2012; constructed and refurbished
primary and junior high schools; provided
decent accommodation for teachers and
financial sponsorship for needy girls.
‘B’ Municipality
39%
50%
Construction of 15 primary schools and 10
classroom block JHS; completed 6 unit
teachers’ accommodation; over 100 students
awarded scholarship; extended school
feeding programme to 14 schools.
‘C’ District
43%
55%
Construction of 10 teachers’ quarters and 17
classroom blocks in rural areas;120 dual
desks supplied to selected schools; 27
teacher trainees sponsored; piloted school
feeding programme in two schools.
Source: compiled from financial statements and MTDPs of LGs
8.4.2 Sanitation and waste management
It is estimated that 3 million tons of solid waste generated by households in Ghana costs
the economy GH¢420 million per annum, equivalent to US$290 million or 1.6% of
GDP (Mensah and Larbi 2005). As the authorities in charge of sanitation, LGs are
bound to incur these costs due to high population growth and migration to urban areas.
In the ‘A’ Metropolis and the ‘B’ Municipality, these issues have created more
sanitation and waste management problems compared to their rural counterparts. In the
study areas, the problem of sanitation was multifaceted and required regular sweeping
of streets, collection, evacuation and disposal of solid and liquid household wastes,
construction and management of abattoirs, public toilets and cemeteries to mention a
few. Thus, the performance of LGs on sanitation depended upon the effectiveness of
activities and interventions that were devised by waste management departments in
Metropolitan assemblies and environmental health sanitation units in the municipal and
district assemblies to tackle these problems. Performance information on how these
213
projects were implemented can be grouped into household or community level
interventions and institutional level ones.
For instance, at the community level, most houses, including some in the district capital
towns, are built without toilets or water closets. While this clearly contravenes building
regulations, some observers attribute it to the irregular flow of water in those areas or
poverty which forces inhabitants in local communities to defecate in the bush or on
refuse dumps (Yankson 2007). To address these problems, some LGs support
households to construct latrines and organise public education programmes to improve
upon sanitation in local communities. In the ‘C’ District, about 98 bins were distributed
to households and another 150 homes were assisted with inputs to construct simple
household latrines between 2010 and 2011. Progress reports of these projects were used
to identify households and communities that had benefited and to select beneficiaries in
other communities yet to be covered. While the availability of information helped LGs
to support sanitation projects, resource constraints undermined their performance in
terms of scaling-up coverage. For instance, households in the ‘B’ Municipality were
asked to submit requests for household latrines under a World Bank Community Water
and Sanitation Programme in 2010. In all, 1,453 requests were submitted but the LG
could not fulfil these requests and rather constructed 26 public toilets in disadvantaged
communities. Similarly, 24 new public toilets were constructed in 2011 even though the
Assembly received 1,115 requests from local residents. At the institutional level, all the
LGs involved in this research ensured that new public buildings, especially schools and
health centres were fitted with modern toilets. In places where sanitation problems were
discussed on the radio, as was the case in ‘A’ Metropolis and ‘B’ Municipality, Chief
Executives and their environmental health officers were under pressure to improve
waste management within communities compared to rural areas where such issues did
not attract media attention.
Furthermore, through the Ministry of Local Government, a private company; Zoomlion
Ghana Limited has been contracted to keep the streets of major towns clean, provide
sanitary containers and dispose refuse from collection points. The company operates in
all the 10 regions of Ghana with most of their employees recruited under the
government’s youth employment programme implemented at the LG level. However,
most research participants were not satisfied with the output of Zoomlion, questioning
214
why sanitation was deteriorating whilst the company was in operation at the LG’s
expense. In the words of one research participant:
“Zoomlion has 102 workers in this district trying to manage
the sanitation situation, but they need to be well equipped to
enable them work better. Much needs to be done in terms of
providing more refuse containers and to manage final
disposal sites. Polythene materials have become a major
problem since they are not easily degradable and recycling
them could be a better option and assistance is needed in this
area” [Field data, interview transcript, ‘C’ District
Assembly]
The need for creative solutions in managing all forms of household waste is obvious but
neither LGs themselves nor the private sanitation and waste management companies
have proposed any solutions as yet, probably due to capacity challenges. In both ‘A’
Metropolis and ‘B’ Municipalities where the LGs have contracted other private
companies besides ‘zoomlion’ to collect and dispose household waste, scarcity of land
has been a major problem for the final disposal of refuse. All the LGs involved in this
study acquired private lands to be used as sanitary landfill sites at very huge costs. This
corroborates the findings of Awortwi (2004) that LGs in Ghana are unable to make cost
savings in solid waste collection even when they enter into public private partnerships
aimed at reducing costs. On the contrary, table 8.3 suggests that LG spending and
budgetary allocation for sanitation related projects increased in all the 3 regions between
2009 and 2012 compared to 2005-2008. Local government officials also affirmed that
monies from the DDF enhanced their ability to increase spending on waste
management. In urban areas such as ‘A’ Metropolis and ‘B’ Municipality, the enormity
and scale of the sanitation issue is huge such that LG managers have procured heavy
equipment for the evacuation and disposal of solid and liquid wastes. However, the
gradual return to in-house delivery of sanitation and waste management functions needs
careful planning, both in terms of costs and engineering capability for routine
maintenance, if the aspirations of LG managers to develop engineered landfill sites in
future would be realised.
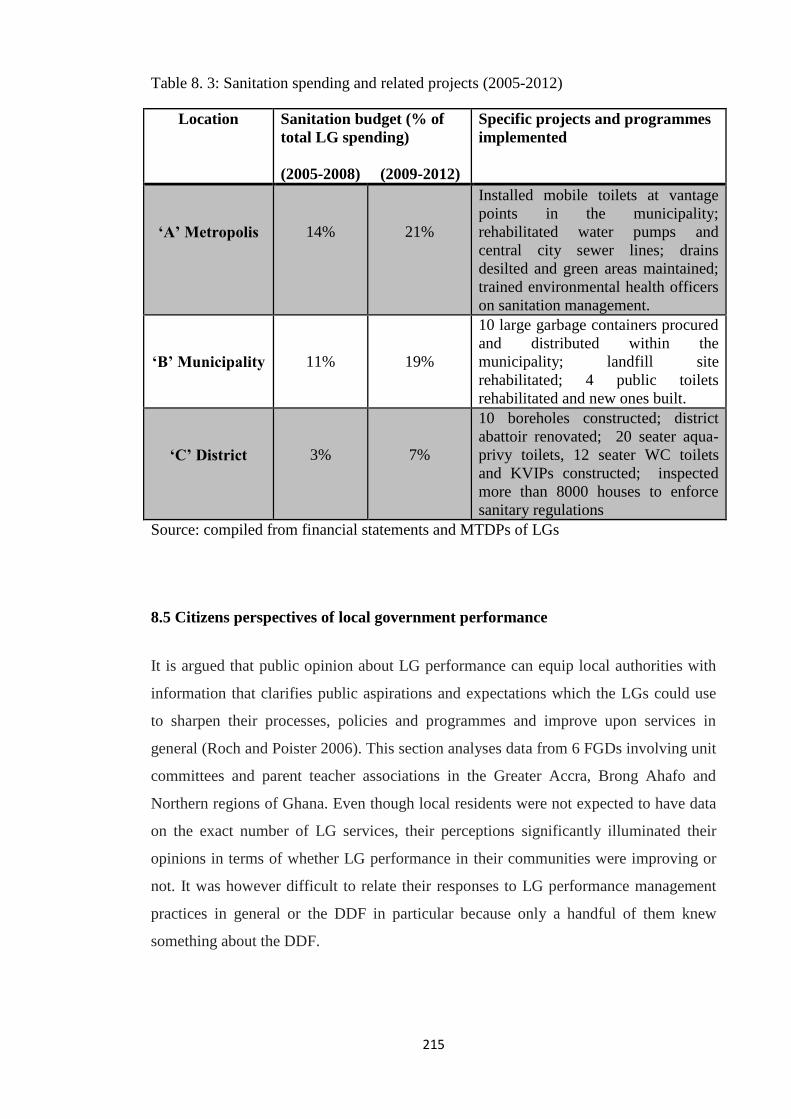
215
Table 8. 3: Sanitation spending and related projects (2005-2012)
Location Sanitation budget (% of
total LG spending)
(2005-2008) (2009-2012)
Specific projects and programmes
implemented
‘A’ Metropolis
14%
21%
Installed mobile toilets at vantage
points in the municipality;
rehabilitated water pumps and
central city sewer lines; drains
desilted and green areas maintained;
trained environmental health officers
on sanitation management.
‘B’ Municipality
11%
19%
10 large garbage containers procured
and distributed within the
municipality; landfill site
rehabilitated; 4 public toilets
rehabilitated and new ones built.
‘C’ District
3%
7%
10 boreholes constructed; district
abattoir renovated; 20 seater aqua-
privy toilets, 12 seater WC toilets
and KVIPs constructed; inspected
more than 8000 houses to enforce
sanitary regulations
Source: compiled from financial statements and MTDPs of LGs
8.5 Citizens perspectives of local government performance
It is argued that public opinion about LG performance can equip local authorities with
information that clarifies public aspirations and expectations which the LGs could use
to sharpen their processes, policies and programmes and improve upon services in
general (Roch and Poister 2006). This section analyses data from 6 FGDs involving unit
committees and parent teacher associations in the Greater Accra, Brong Ahafo and
Northern regions of Ghana. Even though local residents were not expected to have data
on the exact number of LG services, their perceptions significantly illuminated their
opinions in terms of whether LG performance in their communities were improving or
not. It was however difficult to relate their responses to LG performance management
practices in general or the DDF in particular because only a handful of them knew
something about the DDF.

216
8.5.1 Perceived quantity and quality of local government services
The performance of LGs in terms of quantity and quality of basic education and waste
management is examined in two ways. Firstly, participants of FGDs were asked to rate,
in their own words, LG performance with respect to basic education and waste
collection functions. In terms of basic education, they specifically made reference to the
availability of infrastructure and logistics such as school blocks, text books and
furniture; the qualification of teachers; and final exam performance or the likelihood
that pupils completing basic schools will be qualified for senior secondary schools.
With respect to waste collection, service quality was conceived as the reliability of
waste collection and evacuation by the LG or private companies contracted to manage
waste collection, perceptions about general sanitary conditions at community bin
location sites and how quick LGs responded to people’s complaints about waste piles
and unsanitary conditions.
In all the 3 regions, local residents did acknowledge the efforts of their LGs in trying to
improve the infrastructure of primary schools. There were however differences between
the views of unit committee members and those from the PTA FGDs. Participants in the
former group generally felt LGs seem to prioritise support for education, citing ongoing
projects as evidence to back their claims. However, members of the PTAs were
relatively unimpressed compared to participants of the unit committees claiming that
most of their requests to the local authorities for support ‘fell on deaf ears’. In addition,
there were claims that LG managers often paid lip service to education. In all the study
areas, teachers were concerned about falling standards of education; a situation often
attributed to increased enrolment without commensurate increase in the number of
teachers and classroom blocks. This has led to many schools resorting to a rotating shift
system in the ‘A’ Metropolis. It was emphasised that LG’s construction of schools and
provision of classroom furniture would be meaningless unless the performance of pupils
is improved accordingly. In the ‘B’ Municipality and ‘C’ District, many schools lacked
libraries while schools located outside the district capitals had inadequate qualified
teachers, all of which adversely affected the quality of teaching and learning.
Participants of FGDs were unanimous in their call for schools in their localities to
benefit from government’s school feeding programmes as well as free textbooks and
uniforms regardless of partisan political interests and allegiances.
217
In terms of sanitation and waste management, it was noted that Zoomlion operated in all
the regions but focused their work in city centres rather than residential
neighbourhoods. Yet, participants of the FGDs were generally dissatisfied with chocked
drains and limited waste containers in urban areas and sanitary conditions in market
squares. In the ‘A’ Metropolis, residents claimed the LG was failing to rid the city of
filth as evidenced by heaps of rubbish containers and chocked drains and roadside
gutters. Placing the responsibility squarely on the political head of the Metropolitan
Assembly, participants of a FGD in the ‘A’ Metropolis emphasised that:
“Previous assembly members organised self-help
activities for members of the community to clean their
surroundings but the new MCE has monetised cleaning of
the drains by paying the party youth (job for the boys) to
desilt the drains. This has made it difficult for any
assembly man to organise voluntary self-help initiatives”
[Field data, transcript from FGD, ‘A’ Metropolis].
Clearly, while residents were quick to absolve themselves from the sanitation woes in
their communities, it was obvious that sprawling slums were hindering the management
of waste in the metropolis. Similarly, local residents expressed doubts about Chief
Executives’ estimates on sanitation spending in the Greater Accra and Brong Ahafo
regions. It must be emphasised that in the urban areas, collection and disposal of waste
from affluent neighbourhoods were irregular and unreliable despite the fact that private
companies in the waste management business had increased waste collection charges
without a corresponding improvement in their responses to user complaints about poor
services (Awortwi 2004). This suggests that investments of LGs on sanitation, including
the privatisation of waste management have not sufficiently addressed problems
associated with sanitation in Ghana. Thus an important lesson could be drawn from
Crook and Manor (1998) who have argued that it is not sufficient to examine quantities
of LG outputs and pattern of resource allocation without asking whether the products of
these expenditures were valued by citizens; that is, whether they were reasonably
congruent with popular conceptions of development priorities. Therefore, an attempt
was made to understand citizen’s opinions about local government’s response to the
service needs of communities. These are discussed in the next section.
218
8.5.2 Responsiveness to citizens’ demands
Data from focus group discussions was analysed to understand how LGs were
responsive to local community needs. Responsiveness in this context refers to the
congruence between community preferences and LG policy choices. It also describes
the extent to which LG services match the preferences of community members who
may directly or indirectly use such services (Boyne, 2005). Even though community
preferences can be either latent or explicitly known, it is assumed that responsive LGs
in the context of this study will devise policies to reflect and address community
aspirations such that citizens would be aware if their LGs are taking care of their
interests or not (Yankson 2007). Based on the knowledge and experience of research
participants with respect to LG’s performance on waste management and basic
education services in their localities, questions were asked to understand their
perceptions about equity or fairness in the geographical distribution of LG outputs since
it is assumed that LGs allocate services on a criterion of need rather than ability to pay
(Boyne, 2002).
In all the regions, the priority of FGDs participants was to see some improvement in
primary school buildings and student performance, tarred roads within and between
communities, expansion of markets and facilities, regular collection of solid waste and
cleaning of road side gutters among other things. Yet, they were less positive about
LG’s response to requests of elected assembly members on behalf of their communities.
However, a distinction was made between LG response to ordinary requests and those
made during emergencies and natural disasters such as rainstorms and flooding, as is
often the case in Ghana. For instance, LGs did collaborate with the National Disaster
Management Organisation to supply schools with roofing sheets and building materials
when primary schools were hit by a rainstorm but in some cases, the response was said
to be low and inadequate. This implies that any information available to LG managers
under such circumstances would be susceptible to what some experts have referred to as
‘clean up use’ of performance data (Ingraham 2005; Pollitt, 2006).
It is important to emphasise that participants of FGDs believed that how quick their LGs
responded to development needs of local communities depended on the availability and
accessibility of Chief Executives to coordinate and expedite LG response. In the ‘C’
District for instance, the DCE was easily accessible and for this reason, assembly
members felt they could directly consult the Chief Executive when submitting requests

219
for development projects and complaints to their LGs compared to the ‘A’ Metropolitan
Assembly and ‘B’ Municipalities where the DCEs were scarcely seen in their offices. It
was observed that Chief Executives who were unavailable tended to use their positions
as a spring board to launch their parliamentary ambitions. It must be recalled that the
Chief Executives in the ‘A’ Metropolis and ‘B’ Municipality were both contesting in the
2012 parliamentary elections and could hardly expedite action on simple requests such
as refilling pot-holes, fixing broken bridges, streetlights and boreholes in rural
communities. Yet, in those two local authorities, the Chief Executives downplayed the
potential impact of their political activities on the internal controls and day to day
administration of their Assemblies. In order to ensure that LGs are accessible to their
constituents, assembly members in the ‘A’ Metropolis have decided to only confirm
nominees for the position of MCE on condition that they shall not contest parliamentary
elections in future. This condition was justified on the grounds that most Chief
Executives contested the parliamentary elections which made them too busy and
unavailable in the office to interact with elected assembly members and to respond to
their concerns. This was seen as reneging on the call to serve the people, contrary to the
pledges they often make upon getting nominated for that high office. While these views
appear to be legitimate, it clearly exposes the illusion of non- partisan politics at the LG
level in Ghana. It was emphasised that:
Some people and some communities will never be satisfied
with the performance of the LGs because of their political
orientation. Political interests have made it difficult for
assembly members to make meaningful contributions at
the General Assembly meetings and this affects the work
of the LG [Field data, transcript from FGD, ‘B’
Municipality].
Views such as the one in the above quotation does not only show how partisan politics
may affect the ability of assembly members to effectively discharge their duties, it also
shows how LG performance can be interpreted on the basis of political interests and
affiliation since party loyalist will give positive ratings to the performance of the Chief
Executives compared to persons from opposition parties.
It is worth mentioning that people’s opinions about LG responsiveness in this research
confirm the findings of some previous studies. For instance, Crook and Manor (1998)
220
found that LG’s ‘response to popular needs, particularly in rural areas was poor where
70% of survey respondents felt that the district assemblies did not respond to their needs
and only 22% felt it was better than the previous (unelected) district councils in Ghana.
In the same vein, Ayee (1994) reports that complaints to solve problems in local
communities such as sanitation and waste management, road infrastructure, water
supply, schools and electricity often fall on deaf ears in the local council because of
perceived competing partisan interests between the leadership of the assemblies and
some elected representatives. Similar findings from a case study showed that
‘community- level aspirations were completely ignored’ in LG planning processes
(Schiewer 1995) while a survey of residents in Kumasi revealed that majority of
respondents ‘strongly disagreed that the City Council was sensitive to residents’ needs
(Kessey 1995: 157). In this study, it was interesting that even under the current LG
performance management regime; residents of local communities have not seen
improvement in their LG’s response to service needs. It will therefore be significant for
researchers to explore and consider how LGs could use their PM practices to improve
their response to local service needs.
8.6 Understanding what drives the use of performance information
This section interprets the views of LG managers to understand their reasons for
purposively using performance information. It comes on the heels of Pollitt (2006c)
who summarised up 20 years of research on performance measurement and concluded
that there are only a few analyses of what elected politicians do with performance
information. In this study, Chief Executives and Coordinating Directors were first and
foremost asked to explain their views about LG performance management practices.
This was intended to establish whether LG officials viewed such practices as being part
of their management philosophy or an imposition from central government.
The response to this question in all the 3 regions recognised that various kinds of
supervision, performance monitoring and assessments have an impact on decision
making. Yet, none of the Chief Executives and Coordinating Directors interviewed
explicitly proclaimed performance management as their management philosophy. They
did not also see the fulfilment of performance indicators as an intrusion and imposition
of regulations by central government agencies. In fact, Coordinating Directors did not
actually see the importance of making such a distinction because as trained career civil

221
servants, they viewed themselves as working for the government and people of Ghana,
and try to perform their duties with the aim of achieving valuable results. Chief
Executives and Coordinating Directors were generally emphatic that the use of
performance information was inherently embedded in the performance of their official
functions. As table 8.4 shows, LG managers were generally positive about the way
information was used within the Assemblies. It was indicated that performance
information could be used to achieve purely internal and external targets such as
budgeting, goal clarification, project execution and completion as well as internal and
external accountability, even though each of these might involve different data
requirements. Also, since LG managers were generally optimistic about the impact of
their performance management practices and their use of performance information, it is
expected that they would be able to learn about what works and what does not, and
could improve upon administrative processes if they were to satisfy their constituents.
Table 8.4 presents the views of LG managers regarding the use of performance
information.
Table 8. 4: Perceived benefits and use of performance information
Perceived benefits of
using performance
information
How do you view performance management
practices in your LG?
‘A’ Metropolis ‘B’ Municipality ‘C’ District
Improved performance
monitoring
positive positive positive
Internal accountability positive positive positive
Clarified goals affirmative indifferent positive
Improved team work positive constructive encouraging
Project completion useful positive positive
Greater external
accountability
positive positive positive
Improved budgeting helpful positive positive
Improved service delivery positive Positive positive
Source: author’s construct, 2014
Based on these findings, it could be argued that production and use of performance
information, especially under the DDF represents a change process in which developing
a shared performance culture enhances the capabilities of LGs in fulfilling the eligibility
criteria for performance-based grants. LG officials agreed that team work enhances their
chances of ‘qualifying’ for performance grants since informational needs for the
assessments cannot be met by only one department but rather depends on the collation
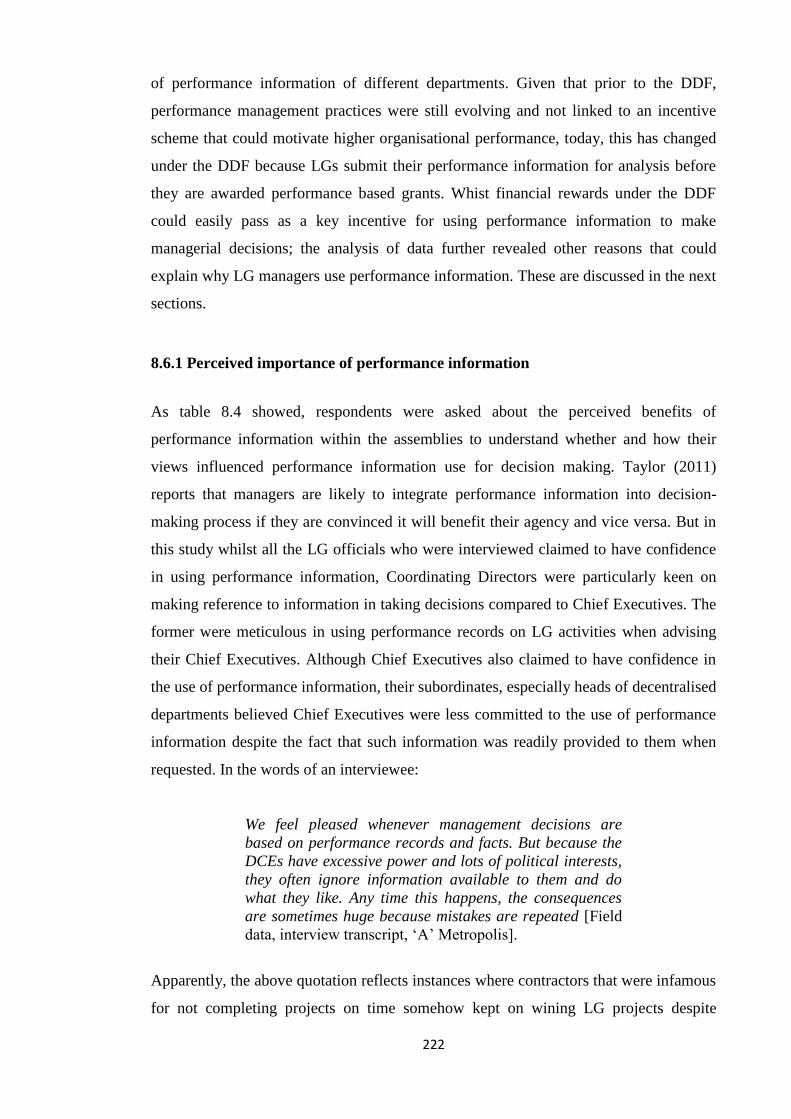
222
of performance information of different departments. Given that prior to the DDF,
performance management practices were still evolving and not linked to an incentive
scheme that could motivate higher organisational performance, today, this has changed
under the DDF because LGs submit their performance information for analysis before
they are awarded performance based grants. Whist financial rewards under the DDF
could easily pass as a key incentive for using performance information to make
managerial decisions; the analysis of data further revealed other reasons that could
explain why LG managers use performance information. These are discussed in the next
sections.
8.6.1 Perceived importance of performance information
As table 8.4 showed, respondents were asked about the perceived benefits of
performance information within the assemblies to understand whether and how their
views influenced performance information use for decision making. Taylor (2011)
reports that managers are likely to integrate performance information into decision-
making process if they are convinced it will benefit their agency and vice versa. But in
this study whilst all the LG officials who were interviewed claimed to have confidence
in using performance information, Coordinating Directors were particularly keen on
making reference to information in taking decisions compared to Chief Executives. The
former were meticulous in using performance records on LG activities when advising
their Chief Executives. Although Chief Executives also claimed to have confidence in
the use of performance information, their subordinates, especially heads of decentralised
departments believed Chief Executives were less committed to the use of performance
information despite the fact that such information was readily provided to them when
requested. In the words of an interviewee:
We feel pleased whenever management decisions are
based on performance records and facts. But because the
DCEs have excessive power and lots of political interests,
they often ignore information available to them and do
what they like. Any time this happens, the consequences
are sometimes huge because mistakes are repeated [Field
data, interview transcript, ‘A’ Metropolis].
Apparently, the above quotation reflects instances where contractors that were infamous
for not completing projects on time somehow kept on wining LG projects despite
223
repeated warning to the hierarchy of the Assemblies to refrain from offering such
companies contracts. It was obvious that DPCUs and planning officers were
instrumental in the preparation of performance reports and thus, backed the use of data
and performance information for making decisions since that enhanced the
implementation of pre-planned activities and projects. Not only did this enhance their
prospects of qualifying for grants under the DDF, it was also seen as a way of protecting
their reputation against failing the performance assessment.
Meanwhile, differences in the way departments approached the performance
information question is worth mentioning. For instance, the nature of operations of
some units such as the finance, budgeting and rating departments meant that day to day
documentation of financial records served as a useful tool for making decision and for
auditing purposes compared to dormant departments such as the registries, cooperatives,
and the birth and death registries that barely produce reliable performance information.
In the ‘A’ Metropolis and ‘B’ Municipality, there were doubts about the commitment of
LG managers to use performance information for accountability, despite persistent civil
society demand for transparency and accountability especially in relation to LG
finances. It was observed that despite decades of producing and collating performance
information in the form of MTDPs, local government officials were still grappling with
building reliable databases for managing performance information effectively.
8.6.2 Commitment to central government’s priorities
Across the study regions, it was found that Chief Executives felt obliged to implement
policies, projects and programmes that were prioritised by the central government under
the ‘better Ghana agenda’. For this reason, all the Chief Executives had to sign
performance agreements with their regional ministers to whom they reported the
performance of their local authorities. Performance reporting in this context referred to
specific interventions that were mostly the ruling party’s manifesto promises such as
increasing the number of people under the national health insurance scheme, reduction
of schools under trees or the distribution of free textbooks and school uniforms in
deprived communities. In the ‘A’ Metropolis, the Assembly had accomplished most of
its performance indicators on access roads after it had tarred and paved about 55 kms
stretch of principal streets and provided street lighting along them. Another central

224
government priority was the shift towards rural electrification. In an address to mark the
second ordinary session of the ‘B’ Municipality, the Chief Executive announced that:
“As part of government’s determination to make
electricity accessible to as many communities as possible,
the Assembly has procured 150 high tension electricity
poles (pylons) for distribution to various communities at a
cost of GH¢ 50,000.00. Government has identified and
approved 34 communities for rural electrification and
work has commenced in 17 communities whereas work in
the remaining 17 communities will soon commence”.
In the Ghanaian context, LG’s implementation of central government’s priority projects
diminishes the independence of the former, making them appear as mere extensions of
the latter. For instance, in the ‘C’ district too, rural electrification was high on the LG’s
development agenda and yet, none of the basic schools in that district was connected to
electricity even though it is fair to state that management had indicated their intention to
embark upon a district-wide school electrification programme. In addition to rural
electrification, the LG policy in the ‘B’ Municipality also supported youth employment
and skills training for people with disabilities. It was found that in the first half of 2012
alone, 200 beneficiaries were recruited and trained in computer and mobile phone
assembling and repairs under the Ghana Youth Employment and Entrepreneurship
Programme. Based on performance information on a 100% completion rate in the first 6
months of 2012, management accordingly distributed start-up kits to the beneficiaries
and recruited another batch of 300 young people to receive training in the second half of
the year under the same initiative. In sum, Chief Executives who use performance
information this way intended to show their commitment to the implementation of these
initiatives and to demonstrate their loyalty to the centre rather than to their constituents.
8.6.3 Adherence to project specific regulations
There were a number of donor funded development projects implemented by LGs all of
which had separate budgeting arrangements, accounting systems and performance
reporting procedures. Projects such as the Community Based Rural Development
Programme, Urban Poverty Reduction Program, the Ghana Social Opportunities
Programme, the District-wide Support Programme and the Food Security Programmes
among others required beneficiary LGs to keep separate performance information with
respect to the implementation of these projects to track progress and avoid duplication.
225
Research participants indicated that development partners such as the UNDP, WB, the
EU Commission and NGOs who funded some of these projects at the local government
level encourage evidence based project implementation, part of which require regular
data collection, analysis, and reporting of performance information. From the
beneficiaries’ perspective, using performance information to satisfy donors was crucial
for the continued funding of donor supported projects at the sub national level even
though it may as well serve as a means of demanding accountability from LGs in the
use of project funds.
8.6.4 Public service motivation
The views of LG managers regarding the use of performance information to make
decisions was somewhat stimulated by their willingness to serve the general public. In
addition to repeated claims of being public servants, research participants in the LGs
ensured that managerial decisions led to useful outcomes with the aim of serving the
public. Even though participants of focus group discussions did not entirely agree to this
claim, it is not uncommon for Chief Executives and their Coordinating Directors to
explicitly portray themselves as serving the public interest. To examine the public
service motives of LG officials in relation to the use of performance information, the
three theoretical elements of PSM were drawn from Perry and Wise (1990) namely;
rational, norm-based, and affective motives. Rational motives maximize the utility of
individuals that might influence them to take certain decisions, which in the context of
this study would be to use performance information proactively or show commitment to
LG priorities. Based on the rational motives, it was evident that LG officials had to
comply with official performance reporting procedures if they were to prove how well
they performed their functions or achieved their set targets as discussed in section 8.4.
Norm-based motives are often linked to a desire to serve the public interest, no matter
how the public interest is defined (Schott et al. 2014). And in this regard, LG managers
claimed that the ultimate aim of using performance information was to serve the general
public which is often inspired by unacceptable levels of poverty, illiteracy and unequal
development between cities, small towns and villages. It is however important to note
that identifying actions which are congruent with the public interest is difficult because
the concept of public interests is vague and contested and scholars do not agree on an
226
exact definition of the term (Downs 1967, 101–2; Rainey 1982, 298). In this study, the
tendency of local politicians to serve the public was not neutral as Chief Executives
were sometimes influenced by political loyalties of local communities in allocating
development projects. Lastly, affective motives are based on human emotion such as the
desire and willingness to help others, being altruistic, having empathy based on moral
conviction and other pro-social interests (Brewer et al. 2000). Within this context, local
government support to vulnerable groups such as people living with disabilities and
HIV/AIDS falls under the affective category but it was unclear whether the actions of
LG managers’ use of information to assist vulnerable, poor and needy people was by
virtue of their roles within the local government authority or as a result of some other
values external to their professional identity. Nonetheless, it was apparent that claims of
being motivated to use performance information to serve the public implies that LG
managers are inspired by values that are relevant in serving the public good even though
in the Ghanaian context, such claims could be used as a decoy to indulge in corrupt self-
serving behaviours.
8.7 Conclusion
The objective of this chapter was to examine how LG managers use performance
information to improve service delivery and to identify factors for and reasons why LG
managers use performance information to attain organisational targets. Findings in this
chapter shows that performance information is produced for management control
purposes and did appear in budgets, development plans, annual action plans of various
decentralised departments, performance monitoring documents and annual LG reports.
Although performance information is often generated through internal administrative
processes, they are not only used internally but also by external agencies. For instance,
it was found that individual performance reports of LGs submitted to the RCCs were
compiled into regional composite reports to inform the Ministry of Local Government
and the NDPC about LG performance. And within local government authorities,
performance information is used for administrative purposes in various departments
such as budgeting, supervision of tasks, internal controls as well as allocating and
monitoring development projects within and between local communities. The
availability of performance information enables LG officials to make informative inputs
and contributions to policy discussions during management meetings. This practice has
227
become institutionalised to the extent that the use of performance information can be
interpreted as a form of organizational behaviour that is embedded in LG performance
management practices. This assertion corroborates Bouckaert and Halligan’s (2008)
view that an organisation’s ability to functionally use performance information depends
in part, on its capacity to institutionalise mechanisms used to generate performance data
in addition to its capacity to incorporate performance information into organisational
procedures and decision making.
In this study, it was obvious that Chief Executives and Coordinating Directors, in
consultation with heads of departments, relied on MTDPs, annual action plans and
budgets in making managerial decisions even though in some cases, appropriate formal
procedures were not followed by these same senior officials. Yet, routine performance
reporting within LGs and between LGs and higher supervisory bodies still had a
significant influence on the perception and attitude of LG officials in terms of how they
value, evaluate, interpret and use performance information. Meanwhile, citizen’s
perception of service delivery in their communities was influenced by the availability of
performance information at the local government authority even though such
information is often inaccessible. While performance information helps LG managers to
budget properly and improve upon internal controls, it will be imperative for them to
also use performance information to deepen accountability to residents of local
communities.
The findings have shown that based on performance information, LG managers
increased allocations for basic education, sanitation and waste management across the
three regions. Although in practice, Chief Executives’ use of performance information
tended to be ad hoc and partial, but it did serve very important purposes. For example,
information enabled LG managers to learn about measures and activities that worked
and those that did not. Routine monitoring of LG performance meant that practical
lessons could be learned to improve upon LG performance in terms of project planning
and implementation. It does not however imply that the use of performance information
met all the 8 managerial uses proposed by Behn (2003). For instance, it can be argued
that performance management practices particularly under the DDF has enabled LGs to
evaluate, control, budget and sometimes motivate compliance to appropriate
administrative regulations and processes aimed at promoting LG performance. Yet,
228
there was little evidence that internal and external mechanisms for managing LG
performance helped Chief Executives, Coordinating Directors and heads of departments
to learn from, improve upon or even celebrate their performance if they were successful.
For example, performance incentives under the DDF did motivate LG officials in their
attempt to create progressive performance cultures by encouraging regular production,
storage and use of performance information at the LG level. However, it was unclear
how they learned and improved upon their performance apart from using the
performance grants their LGs received to increase the number of development projects
within their areas of jurisdiction. No wonder participants of community level FGDs
were generally dissatisfied with LG performance in terms of the quantity, quality and
responsiveness of the Assemblies in providing primary education, sanitation and waste
management services.
Furthermore, findings in this chapter have addressed the 4th
and 5th
research questions
by examining the extent to which LG managers use performance management practices
in making decisions on service delivery and identifying the underlying reasons for
which LG managers use performance information. It was evident that developing a
progressive performance oriented culture is crucial for local governments’ delivery of
basic social services. This is more vital under the DDF because LGs require a
performance culture that tests their capacities to produce and use performance
information in fulfilling the eligibility criteria for performance-based grants. The
findings have also established that the ability of LG managers to use performance
information to make decisions depended upon their perceptions about the importance of
information, their commitment to central government’s priorities, fulfilling project
specific reporting requirements and demonstrating a sense of public service motivation.
These findings have implications for the provision of local government services and the
overall performance of local authorities in Ghana.
229
Chapter 9: Summary of findings and conclusion
9.1 Introduction
This research focused on performance management and local government
administration to understand how local governments in Ghana manage their
performance; and the extent to which the implementation of a performance management
policy covers multiple dimensions and constituencies in evaluating local government
performance. In addition, the study further sought to understand whether and how LG
managers use performance management procedures to improve upon service delivery
and the reasons that drive the use of performance information. The study used a
qualitative research approach to answer research questions in order to achieve the
objectives of the study. The research findings that emerged from the study offer lessons
that could fill important gaps in the literature on performance management at the sub-
national level. For instance, the study shows how a performance management policy
that is described by policy makers as uniquely designed in line with best practices has
certain serious shortcomings. This underscores the need for policy makers to get the
fundamentals right by way of integrating key stakeholders in similar policy initiatives
and using performance indicators that will require data on service delivery rather than
examining LG’s compliance to administrative procedures. These concerns must take
centre stage when performance management interventions are designed in developing
countries.
This concluding chapter is structured as follows. In the next section, a general overview
of the study is presented to highlight key aspects of the study as well as the content of
each chapter. In addition, the major findings of the research are summarised and how
they have addressed specific research questions are discussed. The contribution of the
study to existing knowledge is also outlined. Finally, theoretical and practical
implications of the study are presented and proposed areas for further research
identified.
230
9.2 General overview of the study
The first chapter laid the foundation of the study by defining the research problem,
research aim and objectives and specific research questions that study sought to answer.
It also outlined the structure of the thesis. The second chapter described the context of
local government administration in Ghana. This was necessary because local
government systems are neither universal nor homogenous in nature and thus,
explaining the various LG structures, their functions and inter-governmental relations
was intended to put the study in a proper context. The evolution of local government
administration in Ghana is explored in this chapter as well as the legal and
constitutional foundation on which the local government system operates.
The third chapter reviewed public administration and public management literature to
highlight the complexity and ambiguity associated with the concept of performance in
the public sector. It also explored the theoretical foundations of managing
organisational performance as well as the scope and levels for studying performance.
Furthermore, the review explored the impact of local government administration in sub
Saharan Africa on perceptions of service delivery. From the literature review, the study
attempted to respond to the clarion call of scholars who have called for research to be
conducted from a non-western perspective, to investigate the scope of performance
management frameworks in a multi-stakeholder environment. The fourth chapter
presented the research framework that guided the study. It drew linkages between
specific research objectives and research questions and other key issues that were
explored further in this research.
Chapter five explained the research methodology. It highlighted the philosophical
orientation of the study and justified the rationale for using a qualitative approach. The
case study strategy is elaborated as the strategy adopted for this research. Also, the
chapter presented how primary data was gathered from a Metropolitan Assembly in the
Greater Accra region, a Municipal Assembly in the Brong Ahafo region and a District
Assembly in the Northern region. Altogether, 41 interviews were completed with LG
officials in addition to 6 Focus Group Discussions consisting of unit committees
operating within local communities as well as Parent Teacher Associations and School
Management Committees in the three regions.
231
The sixth chapter presented analysis of data and discussion of findings in relation to the
first research objective. The aim of the chapter was to explore and identify performance
management practices of LGs in Ghana and how the national policy environment
influenced performance management arrangements at LG level. It was found that LGs
performance management practices were internally and externally driven. Based on the
findings of this chapter, it can be concluded that development planning and routine
performance monitoring are inherent in managing LG performance in Ghana.
Furthermore, chapter seven adopted a case study strategy to examine the scope of
performance indicators under the performance management policy which is also known
as the District Development Facility. This chapter is inspired by claims in the literature
about the utility of best-practice performance management systems that often overlook
the fact that performance assessment of public organisations are bound to be associated
with competing interests (amongst public managers, staff, service users and citizens)
whose interpretation of performance reflect their support for or rejection of performance
measurement and management, the objects to be measured, and how performance
information should be collected and used (Ashworth et al. 2010). The findings
demonstrate that using the DDF FOAT to manage LG performance tend to focus on
compliance of pre-determined indicators that do not prioritise core service delivery
functions of LGs. Even though LGs receive performance-based grants, this study
highlighted the possibilities of having a performance paradox due to the exclusion of
local residents in evaluating LG performance. By applying the balanced scorecard
concept to analyse the performance indicators used to implement the DDF FOAT, the
study found certain limitations in using the performance management framework to
promote accountability due to the fact that ordinary citizens are not included in the
evaluation of LGs. Furthermore, it does not encourage the production of ratio data and
this makes it impossible to assess LGs on the efficient and effective utilisation of
financial resources. The DDF FOAT does not also focus on developing the leadership
qualities of LG managers. Even though, the policy appears to have the potential of
harnessing learning and innovation capabilities of LGs, this potential is yet to be
activated and lastly, it does not recognise nor seek to incorporate the perception of
citizens’ about LG performance. This blurs the type and form of principal-agent
relationships between local communities, local governments and the central
government.

232
Chapter eight was the final data analysis and discussion chapter. It examined the
intersections between LG performance management practices and how that affect the
provision of basic services. Data from FGDs was analysed to understand citizen’s
perspectives of LG performance. The chapter also analysed the use of performance
information by senior local government officials, including Chief Executives to
understand factors that influence the utilisation of information for the purpose of
delivering LG outputs. The findings offer insights into the importance of having a
distinctive culture of performance that is progressive as well as recognising the interplay
of internally and externally driven factors in using performance information for
allocating LG services. Chapter nine summarises the major research findings as well as
contribution and implications of the research for both theory and practice. This chapter
concludes the study.
9.3 Summary of major findings
The study was set out to answer the following research questions: (1) How do local
government authorities evaluate and manage organisational performance in Ghana? (2)
What core issues within the national policy space influence the management of local
government performance? (3) In which way does performance enhancing policy address
multiple perspectives of local government performance? (4) To what extent will local
government managers use performance management practices to improve service
delivery? and (5) What drives the use of performance information within local
government authorities in Ghana? Major findings that emerged from this research to
address these questions are discussed in the next sections and summarised in table 9.1.
9.3.1 Findings on mechanisms for managing local government performance
In this research, it is shown that performance of local governments is rooted in their
statutory functions part of which is expressed in broad goals and mission statements.
Thus, LG performance in this study is analysed by focusing on intra organisational
processes to establish whether the transfer of authority, resources, and responsibility
enable LGs to meet local priorities. With respect to performance management practices,
it emerged that mechanisms for managing LG performance were either internally or
233
externally driven. The study established that internal mechanisms for managing LG
performance were the task of management committees and executive committees. These
committees were used to regularly review departmental goals and achievements,
identify performance trajectories and take appropriate corrective action whenever
challenges were observed. On the other hand, it was found that externally driven
performance management practices involved processes in which LG performance was
monitored and inspected by supervisory agencies such as the RCCs and the NDPC, the
Ministry of Local Government and the office of the District Assembly Common Fund
Administrator. Findings with respect to performance management practices have shown
that development plans, performance monitoring and reporting of LG achievements in
terms of project implementation and service delivery play a key role in managing LG
performance because what actually counts as performance is based on documented
achievement of set targets.
Another important finding that emerged from this research is the role of the national
development policy framework in shaping the content of LG plans and directing their
priorities and performance. The study revealed that thematic areas of LG plans are
shaped by the priorities of central government as outlined in the Ghana Shared Growth
and Development Agenda (2010-2013). As the highest planning authorities responsible
for enhancing infrastructure development in local communities, LGs are required to use
bottom up approaches in identifying development priorities. In contrast, it was found
that stakeholder dialogues such as community fora and town hall meetings which could
be used for that purpose were rarely held. Although previous studies have often focused
on size, location, resource capabilities among other things to explain LG performance
(Crook and Manor, 1998), they have often overlooked the impact of the national policy
environment. Importantly, this study has shown that supporting LGs to manage their
performance by imposing planning and performance guidelines on them has
consequences such as weakening downward accountability; something performance
management should be geared towards achieving. It can thus be concluded based on the
findings of this study that reporting LG performance to supervisory agencies has a
disempowering effect on assembly members and the general public to genuinely set LG
agendas in ways that reflect local circumstances and enhance the demand for
accountability from LG officials. Therefore, institutionalised forms of performance
reporting must be re-examined so that LG managers can use performance information
234
generated from their performance management practices to communicate with residents
of local communities, civil society organisations, NGOs and the general public.
9.3.2 Findings on the scope of performance indicators under the district
development facility and the functional organisational assessment tool
The study found that government’s attempt to improve upon LG performance through
the DDF FOAT is creating some form of performance consciousness amongst LG
officials even though responsibility of developing a performance culture was placed on
the shoulders of Chief Executives, whose vision was expected to provide direction for
the performance of each local authority. It was found that a progressive performance
culture was necessary for LGs to fulfil conditions for performance grants under the
DDF. The DDF FOAT has become instrumental in providing supplementary funds to
LGs based on their performance, tightening internal organisational control and
complying with legal and regulatory procedures in performing LG functions. As a
result, advocates of the policy mainly from the Ministry of Local Government and its
donor partners claim it symbolises best practices in terms of managing organisational
performance. Yet, some fundamental shortcomings are worth mentioning.
For instance, this research revealed that all the performance indicators under the FOAT
were pre-determined by the central government and its donor partners without inputs
from local communities. Thus, the performance assessment criterion under the DDF
promotes compliance to indicators that are not sufficiently aligned to the expectations
and aspiration of people living in local communities. And because performance
indicators are determined by central authorities, there is an emphasis on following
administrative procedures rather than focusing on issues of service delivery or other
enablers of socio economic development at the local level which is the main reason why
LGs exist. Findings of this study reinforce the importance of using performance
indicators that do not only focus on the statutory functions of LGs, but thos which
emphasises service delivery (quantity, quality and LG responsiveness). Also, the
performance enhancing policy could also make provision for ordinary citizens in
evaluating LG performance because they are the ultimate beneficiaries of LG services.
Since LGs operate in a complex environment where the interpretation of organisational
performance could be varied, the BSC was used to examine whether the DDF FOAT
235
cover multiple dimensions and perspectives of performance. It was established that only
certain aspects of operational performance were highlighted which did not include
popular dimensions of performance such as efficiency and effectiveness. This is because
performance indicators do not focus on ratio variables. For instance, not even did we
find indicators on financial performance targeting LG’s efficient or effective utilisation
of funds even though LG plans did recognise budget effectiveness, revenue and
investments as key drivers of financial performance. Similarly, it was found that
indicators on organisational management only sought to verify the existence and
operation of specific LG structures such as the Executive Committees and its sub-
committees as well as the security committee. Beyond these, one would have expected
the performance management system to help create what is arguably the most important
factor (transformational and visionary leadership) needed to steer LGs to improve upon
their performance. Furthermore, the fact that no specific indicators are used to
determine LG’s capabilities to learn from practice points to the limited scope of the
DDF FOAT.
Based on these findings, a number of conclusions can be made. First, because policy
makers refer to the DDF FOAT as a performance management best practice due to the
fact that LGs that fulfil MCs and PMs receive performance grants; there is no genuine
commitment amongst LG officials to improve upon organisational performance to
better serve their constituents because it appears their main incentive is the financial
reward. Second, there are signs of a ‘performance paradox’ in the Ghanaian context
where LGs could be adjudged to be performing well when in reality, there is a
dissonance between ‘official’ performance and actual or acceptable levels of
performance (Thiel and Leeuw 2002). Third, even though LGs are supposed to be
serving multiple principals, this research has shown that reporting and accountability
tend to be geared toward the centre rather than local communities. This blurs principal-
agent relationships between local communities, local governments and the central
government and adversely affect collective action, accountability and citizen’s
satisfaction; values that a LG performance management should enhance.
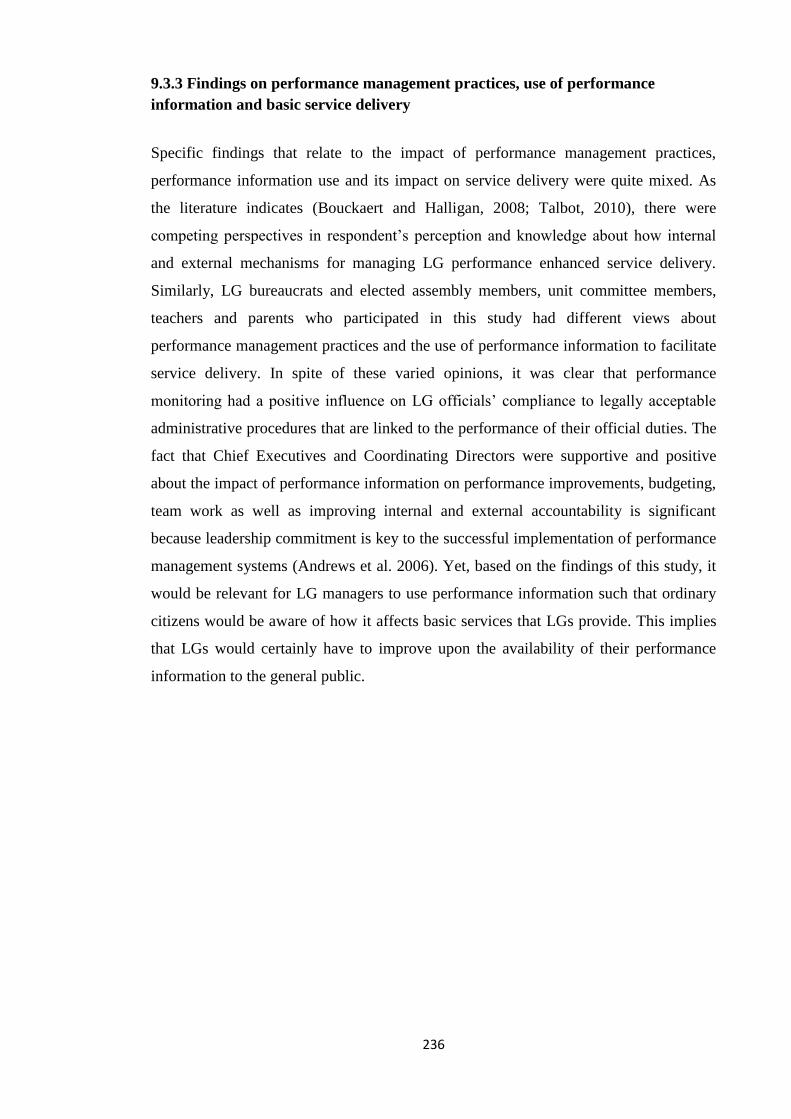
236
9.3.3 Findings on performance management practices, use of performance
information and basic service delivery
Specific findings that relate to the impact of performance management practices,
performance information use and its impact on service delivery were quite mixed. As
the literature indicates (Bouckaert and Halligan, 2008; Talbot, 2010), there were
competing perspectives in respondent’s perception and knowledge about how internal
and external mechanisms for managing LG performance enhanced service delivery.
Similarly, LG bureaucrats and elected assembly members, unit committee members,
teachers and parents who participated in this study had different views about
performance management practices and the use of performance information to facilitate
service delivery. In spite of these varied opinions, it was clear that performance
monitoring had a positive influence on LG officials’ compliance to legally acceptable
administrative procedures that are linked to the performance of their official duties. The
fact that Chief Executives and Coordinating Directors were supportive and positive
about the impact of performance information on performance improvements, budgeting,
team work as well as improving internal and external accountability is significant
because leadership commitment is key to the successful implementation of performance
management systems (Andrews et al. 2006). Yet, based on the findings of this study, it
would be relevant for LG managers to use performance information such that ordinary
citizens would be aware of how it affects basic services that LGs provide. This implies
that LGs would certainly have to improve upon the availability of their performance
information to the general public.

237
Table 9. 1: Summary of key research findings
Research questions Summary of findings
RQ1. How do local government
authorities evaluate and manage
organisational performance in
Ghana?
RQ2. What core issues within the
national policy space influence the
management of local government
performance?
Evaluating the performance of LG focuses on their core mandatory functions as enshrined in the
local government law of 1993, Act 462.
There are internal and external mechanisms for managing LG performance. Internal measures
involve routine performance monitoring within decentralised departments, the use of management
committees, Executive Committees and their sub-committees; analysis and use of performance
information contained in MTDPs, project progress reports and performance reviews.
External measures of managing LG performance entail periodic performance reporting to
supervisory agencies such as the Regional Coordinating Councils, the National Development
Planning Commission, Ministry of Local Government, and the Office of the District Assembly
Common Fund. It also includes routine monitoring and evaluation of project implementation at the
local government level.
Government priorities outlined in the overall national development policy framework (GPRS I&II
and now the GSGDA) significantly shapes the content of LG plans which implicitly influences their
performance.
Top-down, instead of a bottom-up approach to development planning adversely affects LG priorities
and goal setting in ways that undermine the autonomy of LGs.
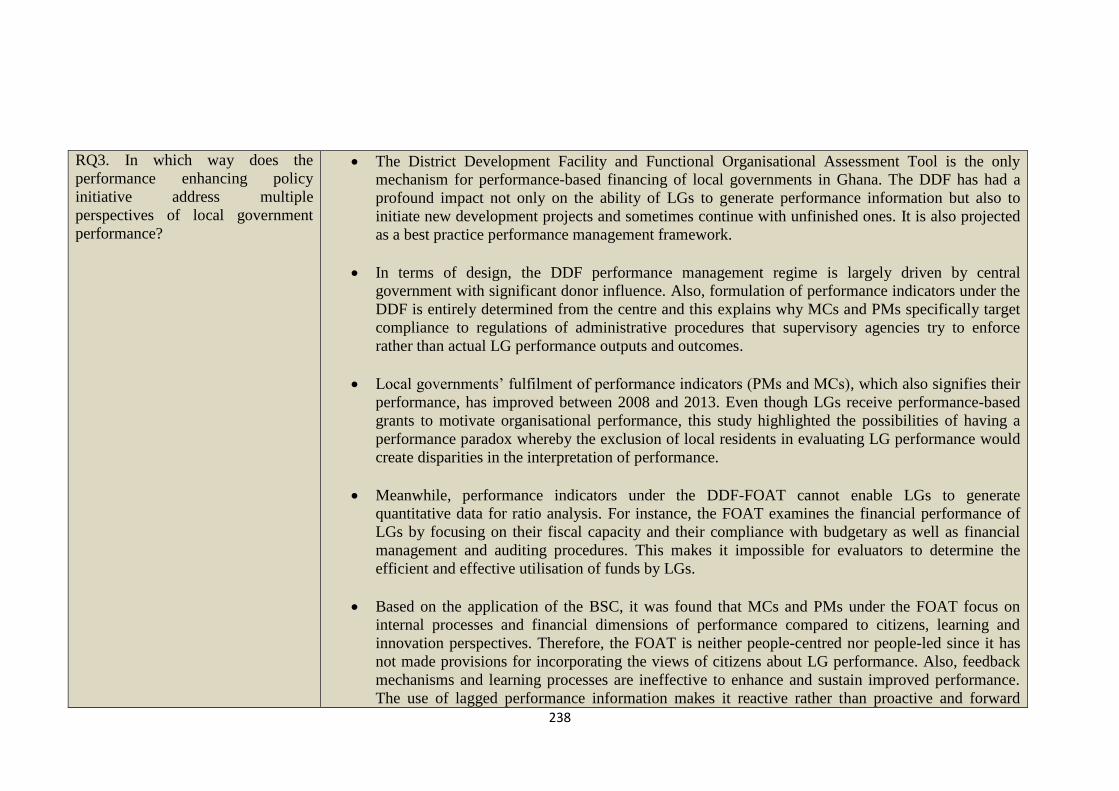
238
RQ3. In which way does the
performance enhancing policy
initiative address multiple
perspectives of local government
performance?
The District Development Facility and Functional Organisational Assessment Tool is the only
mechanism for performance-based financing of local governments in Ghana. The DDF has had a
profound impact not only on the ability of LGs to generate performance information but also to
initiate new development projects and sometimes continue with unfinished ones. It is also projected
as a best practice performance management framework.
In terms of design, the DDF performance management regime is largely driven by central
government with significant donor influence. Also, formulation of performance indicators under the
DDF is entirely determined from the centre and this explains why MCs and PMs specifically target
compliance to regulations of administrative procedures that supervisory agencies try to enforce
rather than actual LG performance outputs and outcomes.
Local governments’ fulfilment of performance indicators (PMs and MCs), which also signifies their
performance, has improved between 2008 and 2013. Even though LGs receive performance-based
grants to motivate organisational performance, this study highlighted the possibilities of having a
performance paradox whereby the exclusion of local residents in evaluating LG performance would
create disparities in the interpretation of performance.
Meanwhile, performance indicators under the DDF-FOAT cannot enable LGs to generate
quantitative data for ratio analysis. For instance, the FOAT examines the financial performance of
LGs by focusing on their fiscal capacity and their compliance with budgetary as well as financial
management and auditing procedures. This makes it impossible for evaluators to determine the
efficient and effective utilisation of funds by LGs.
Based on the application of the BSC, it was found that MCs and PMs under the FOAT focus on
internal processes and financial dimensions of performance compared to citizens, learning and
innovation perspectives. Therefore, the FOAT is neither people-centred nor people-led since it has
not made provisions for incorporating the views of citizens about LG performance. Also, feedback
mechanisms and learning processes are ineffective to enhance and sustain improved performance.
The use of lagged performance information makes it reactive rather than proactive and forward
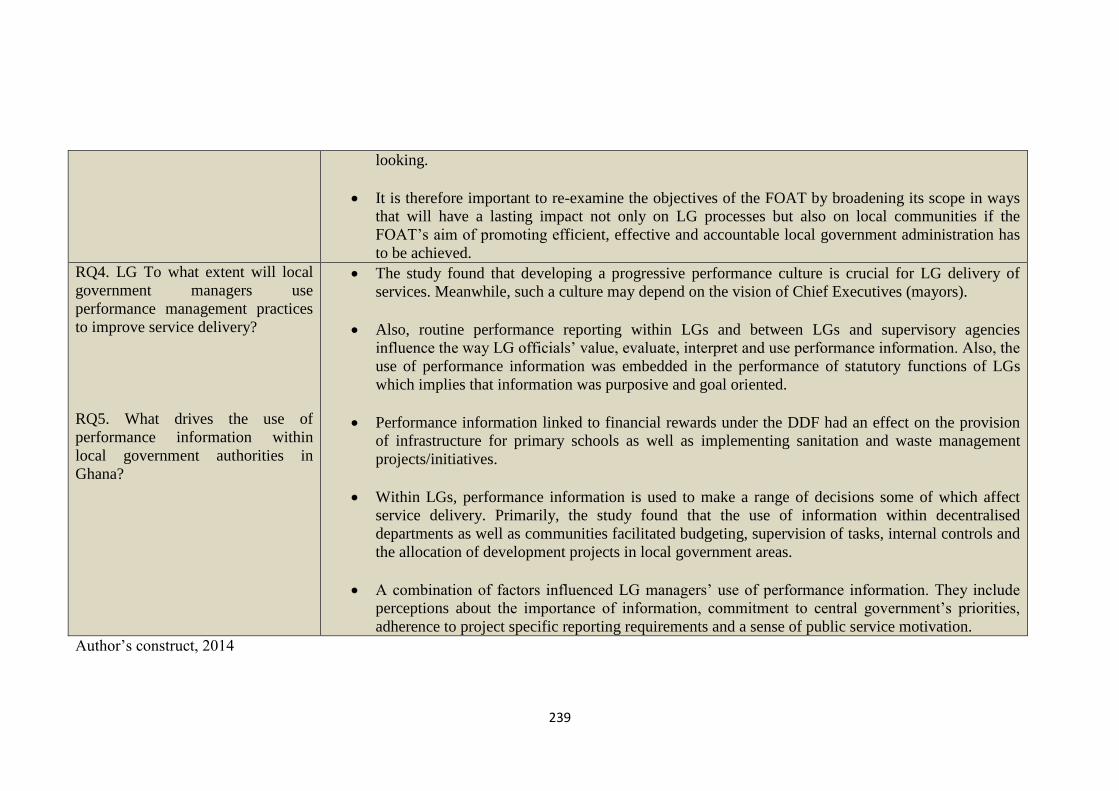
239
looking.
It is therefore important to re-examine the objectives of the FOAT by broadening its scope in ways
that will have a lasting impact not only on LG processes but also on local communities if the
FOAT’s aim of promoting efficient, effective and accountable local government administration has
to be achieved.
RQ4. LG To what extent will local
government managers use
performance management practices
to improve service delivery?
RQ5. What drives the use of
performance information within
local government authorities in
Ghana?
The study found that developing a progressive performance culture is crucial for LG delivery of
services. Meanwhile, such a culture may depend on the vision of Chief Executives (mayors).
Also, routine performance reporting within LGs and between LGs and supervisory agencies
influence the way LG officials’ value, evaluate, interpret and use performance information. Also, the
use of performance information was embedded in the performance of statutory functions of LGs
which implies that information was purposive and goal oriented.
Performance information linked to financial rewards under the DDF had an effect on the provision
of infrastructure for primary schools as well as implementing sanitation and waste management
projects/initiatives.
Within LGs, performance information is used to make a range of decisions some of which affect
service delivery. Primarily, the study found that the use of information within decentralised
departments as well as communities facilitated budgeting, supervision of tasks, internal controls and
the allocation of development projects in local government areas.
A combination of factors influenced LG managers’ use of performance information. They include
perceptions about the importance of information, commitment to central government’s priorities,
adherence to project specific reporting requirements and a sense of public service motivation.
Author’s construct, 2014
240
9.4 Contribution to knowledge and research conclusions
This thesis attempts to fill two research gaps that directly relate to managing organisational
performance. First and foremost, it investigates the presumption that a good performance
management system would use a balanced set of performance indicators (qualitative and
qualitative) to satisfy and address the interests of every key stakeholder. Secondly, it also
examines the assumption that once performance information is produced, it will
automatically be used to influence managerial decisions. Therefore, this research
contributes to knowledge by attempting to fill these gaps based on findings drawn from the
management of local government performance in Ghana. Theoretically, applying the BSC
framework to analyse the scope of performance indicators (MCs and PMs) provides
important insights for interpreting in diverse ways, the impact of the performance
enhancing policy as a strategy used to improve organisational performance. The findings
also contribute to our understanding of how the exclusion of local residents from the
formulation of performance indicators shapes power relations at the local level. In other
words, the ability of central government and donors to influence performance indicators
for LGs has consequences on the independence of the latter and who they account to. This
also has important implications for principal-agent relations at the local level where
ordinary citizens are disempowered to hold their local authorities accountable because of
their exclusion from participating in formulating performance indicators, defining focal
areas for development plans and evaluating LG performance. The study shows how
performance information asymmetries also affect citizens’ perceptions and interpretation
of LG performance. Furthermore, this research contributes to our understanding of
performance information use amongst power brokers in a local government context. It
established the importance of developing a ‘performance culture’ for stimulating the use of
performance information for the purpose of achieving LG goals.
This thesis also contributes significantly to existing public administration and public
management literature in the sub-Saharan African context. Even though decentralisation
and local government experience in Africa is widely documented, there are few studies, if
any at all, that focus on the implementation of organisational performance management
practices at the sub national level. Since research on performance management at the local
government level is an emerging field of research in Ghana, this study hopefully makes
some contribution to the public administration literature in the Ghanaian context. For
241
instance, in the course of the PhD research, some contribution has been made in terms of
publications that have appeared in peer-reviewed journals. Some of the research papers are
enlisted as follows:
1. Bukari, H. (2013). Looking back, moving forward: Towards improving local
governments' performance in Ghana. Commonwealth Journal of Local
Governance. 13(14).
2. Bawole, J., Hossain, F., Domfeh, K., Bukari, H., & Sanyare, F. (2013) Performance
Appraisal or Praising Performance? The Culture of Rhetoric in Performance
Management in Ghana Civil Service, International Journal of Public
Administration, 36 (13) 953-962.
3. Bukari, H., and Mamman, A. (2014) Where is the organisational memory? A tale of
local government employees in Ghana. Public Organisation Review. Springer.
4. Bukari, H., Ohemeng, F., and Mamman, A. (forthcoming) Best practice or best fit?
Making sense of local governments’ performance assessment in Ghana. Submitted
to Pubic Administration and Development.
5. Ohemeng, F. and Bukari, H. (forthcoming). Performance Appraisal and its use for
Individual and Organizational Improvement in the Civil Service of Ghana: The
Case of Much Ado about Nothing? Submitted to Pubic Administration and
Development.
9.5 Theoretical implications
There is no universal theory of performance and this study did not intend to develop a
theory of performance. However, the findings do have significant theoretical implications.
For example, findings of the study shows how mechanisms for prioritising development
interventions and goal setting in local government planning processes reverse the ideals of
‘giving power to the people’ (Ayee 2004;Ayee 2008). Based on goal setting theory, it is
expected that organisations will focus on their ‘bottom-line’ which in the case of local
government authorities, entail the provision of social services to people in local

242
communities. Meanwhile, the imposition of the national development policy framework on
LGs development plans and strategies significantly increases central government’s
influence over LGs. And since performance indicators exclude citizen’s expectations of
LG performance, it is difficult for local authorities to target the actual needs of local
communities and satisfy their interests. Clearly, adapting the BSC as used in this research,
has provided new insights for re-examining the multiple principal-agent relationship at the
local government level where the assessment of LG performance excludes the opinions and
perceptions of local residents but rather serves the whims and caprices of central
government and donor agencies. It can be concluded that using performance indicators to
assess compliance to regulatory processes alone is not enough to enable local governments
satisfy their constituents and neither will it strengthen accountability to their constituents
and ‘real principals’ in local communities. Throughout this research, the dominance of
external supervisory agencies representing the central government was obvious and this
even affected the use of performance information within local government authorities but
nonetheless, the lessons offer useful insights for understanding the dynamics of
performance management systems and service delivery within the context of local
government administration.
9.6 Implications for policy and practice
Important lessons can be learned from the implementation of performance management
practices which include a performance enhancing policy initiative aimed at improving
local government performance in Ghana. This research has showed how the performance
of local government is shaped by national level policy because central government
priorities determine the content of local government development plans. Similarly, the
study has showed the limitations in designing performance management systems and
formulating performance indicators at the central government level when implementation
would take place at the sub national level. Furthermore, the study has showed that the
ability of stakeholders to participate in formulating performance indicators affects their
influence in demanding for accountability, and has implications on unequal balance of
power. The extent of elite capture in the management of local government performance
further hampers the availability of performance information to the general public as
reported in this study. Although LG managers did use performance information for a
variety of reasons, failure to communicate and disseminate performance information made
it difficult for people to know whether their LGs were performing well or not and this has
243
consequences on citizens’ perceptions and satisfaction with local government performance
and could affect trust in local politicians and local authorities. In the long run, public
dissatisfaction will local government provision of basic services could even affect the
willingness to pay taxes to local authorities and this can adversely affect performance in
terms of service delivery.
9.7 Research limitations
Methodologically, studies on organisational performance often focus on financial data to
explain the efficiency and effectiveness of organisational performance. However, these
traditional approaches to analysing performance are irrelevant in public organisations
whose success is not contingent on making profit. Therefore, this study did not seek to
interpret performance based on financial indicators alone even though there is nothing
wrong with understanding how LGs use tax payers’ money. Despite the researcher’s
curiosity and interest in the management of local government finances in Ghana, it was
impractical to focus on financial efficiency of local authorities because LGs do not
generate the kind of performance data that is appropriate for ratio analysis.
In addition, field work for this study was fraught with serious financial and time
constraints due to the dispersion of the study areas across three geo-political regions. Also,
the timing of the field work coincided with the 2012 national presidential and
parliamentary elections in Ghana and this made some respondents to postpone their
interview appointments several times. For instance, Chief Executives for LGs in the
Greater Accra and Brong Ahafo regions who participated in this research as well as the
Presiding member for the ‘B’ Municipal Assembly were all parliamentary candidates in the
elections and this made it difficult to interview them as planned. It was also quite difficult
to organise community level unit committees at the peak of the political campaign as most
of the members were busily involved in grass-root political activities. Thus, some
interviews were recorded at the residence of respondents who were unavailable in their
offices during working hours due to their political activities in the run up to the elections.
The researcher was mindful and critical of the political rhetoric in the responses of
interviewees especially amongst local politicians who superlatively described the
performance of their local authorities. This made the FGDs extremely useful for checking

244
this limitation. Furthermore, every attempt was made not to allow any of these limitations
to compromise the quality of the outcome of the research.
9.8 Final remarks and suggestions for future research
The findings of this research underscore the need to re-examine the formulation and
implementation of systems and practices for managing local government performance.
Evidence from this research suggests that the utility of a LG performance management
framework depends on the scope of its performance indicators in addressing the interests
of multiple stakeholders at the local level. The adapted Balance Scorecard developed in
this study calls for LGs to focus on performing their core functions in an attempt to satisfy
residents of local communities. In an environment with multiple-stakeholders, performance
indicators (MCs and PMs) should be reviewed to focus beyond intra organisational
processes and LGs’ compliance with acceptable administrative procedures to explicitly
focus on addressing citizen’s perspectives of performance. It appears the financial reward
package under the performance enhancing policy affect the commitment of LG officials to
better serve and satisfy their constituents. Hence, there is a risk of creating a ‘performance
paradox’ where LGs could be adjudged to be performing creditably when in reality; users
of local government services think otherwise.
In this study, it was interesting that even under the current LG performance management
regime; residents of local communities have not seen improvement in their LG’s response
to service needs. It will therefore be significant for researchers to explore and consider how
LGs could use their PM practices to improve their response to local service needs. In
relation to the impact of LG performance management practices on service delivery, the
routine and systematic use of performance information suggests that duty bearers were
following due process in performing their tasks most of which showed different levels of
external pressure. Yet, it can be concluded that while performance information was used to
support certain useful decisions, managers of local government authorities rarely took
responsibility for performance lapses as there are neither sanctions nor punitive measures
against dysfunctional use of performance information that fail to meet expected
performance targets.
In sum, since these findings are based on an examination of LG performance management
practices in Ghana, there is need for further research within the Ghanaian context and if

245
possible, a comparative study could be conducted between Ghana and other sub-Saharan
African countries to establish whether and to what extent these findings can be obtained. In
the Ghanaian context, further research could focus on citizens’ surveys to understand
popular perceptions about LG performance in order to compare with official performance
record and to test the ‘performance paradox thesis’. Since this study focused on systematic
information use, a plausible area of future research could look at the unsystematic use of
performance information to see whether the factors that emerged in this research could be
verified. Last but not least, previous studies in some sub-Saharan African countries such as
Cote d’ Ivoire, Tanzania and Uganda have highlighted LGs inability to satisfactorily
provide services to their constitutes and for which reason, various donor led projects,
similar to the DDF in Ghana, have been introduced to assist LGs deliver on their mandates
(Fjelstad, 2001; Conyers, 2007; Robinson, 2007). For instance, in Uganda, a District
Development Project is used to explore ways of empowering local governments and
communities to identify, deliver and sustain locally determined investment priorities. In
Tanzania, there is a local government capital development grant system; a basket-funding
arrangement supported by donors while in Kenya; a local authority transfer fund is being
used to serve a similar purpose. A comparative study on these country cases will
undoubtedly make an immense contribution to our knowledge of performance management
policies and practices at local government level in sub- Sahara Africa.
246
References
Addicott, R. & Ferlie, E. (2006). A qualitative evaluation of public sector organisations: Assessing organisational performance in healthcare. In: Boyne, G. A., Meier, K. J., Laurence J. O'Toole, J. & Walker, R. M. (eds.) Public Service Performance: Perspectives on Measurement and Management. Cambridge: Cambridge University Press.
Adei, S. & Boachie-Danquah, Y. (2003). The Civil Service Performance Improvement Programme (CSPIP) in Ghana: Lessons of Experience. African Journal of Public Administration and Management, 14 (1 & 2), 10 – 23.
Africa Development Bank (2012). Republic Of Ghana Country Strategy Paper 2012-2016. Country Operations Department – West 1 Region Africa Development Bank.
Alonso, P. & Lewis, G. B. (2001). Public Service Motivation and Job Performance. The American Review of Public Administration, 31(4), 363-380.
Alvesson, M. & Deetz, S. (1996). Critical theory and postmodernism approaches to organizational studies In: Clegg, S. R., Hardy, C. & Nord, W. R. (eds.) Handbook of Organization Studies. London: Sage.
Alvesson, M. & Deetz, S. A. (2006). Critical Theory and Postmodernism Approaches to Organizational Studies. The Sage handbook of organization studies, 255.
Amirkhanyan, A. A., Kim, H. J. & Lambright, K. T. (2014). The Performance Puzzle: Understanding the Factors Influencing Alternative Dimensions and Views of Performance. Journal of Public Administration Research and Theory, 24(1), 1-34.
Ammons, D. N. (2002). Performance Measurement and Managerial Thinking. Public Performance & Management Review, 25(4), 344-347.
Andrews, M. (2008). The Good Governance Agenda: Beyond Indicators without Theory. Oxford Development Studies, 36(4), 379-407.
Andrews, R. (2010). Organisational Envrionments In: R. Ashworth, G. Boyne & T. Entwistle (eds.) Public Service Improvement: Theories and Evidence. New York: Oxford University Press.
Andrews, R., Boyne, G. A. & Enticott, G. (2006). Performance failure in the public sector: Misfortune or mismanagement? Public Management Review, 8(2), 273-296.
Antwi, K. B. & Analoui, F. (2008). Challenges in building the capacity of human resource development in decentralized local governments: Evidence from Ghana. Management Research News, 31(7), 504 - 517.
Appiah, F., Ayee, J. A., Appeah, J., Baah-Wiredu, K., Martin, R., Steffensen, J. & Trollegaard, S. (2000). Fiscal Decentralisation and Sub-National Government Finance in Relation to Infrastructure and Service Provision in Ghana. Fiscal Decentralisation and Sub-national Finance in Africa. World Bank
Argyris, C. (2006). Teaching smart people how to learn. In: Gallos, J. & Schein, E. H. (eds.) Organization Development: A Jossey-Bass Reader. John Wiley & Sons.
Aryeetey, E. & Kanbur, S. M. R. (2008). The economy of Ghana: analytical perspectives on stability, growth & poverty: James Currey.
Asante, F. & Ayee, J. R. A. (eds.) (2008). Decentralization and Poverty Reduction’ London: James Currey.
Ashworth, R. (2010). Organisational Culture. In: Ashworth, R., Boyne, G. & Entwistle, T. (eds.) Public Service Improvement: Theories and Evidence. . New York: Oxford University Press.
Ashworth, R., Boyne, G. & Entwistle, T. (eds.) (2010). Public Service Improvement: Theories and Evidence, Oxford: Oxford University Press.
Askim, J. (2004). Performance management and organizational intelligence: adapting the balanced scorecard in larvik municipality. International public management journal, 7(3), 415-438.
Askim, J. (2007). How do politicians use performance information? An analysis of the Norwegian local government experience. International Review of Administrative Sciences, 73(3), 453-472.
247
Atkinson, C. & Shaw, S. (2006). Managing Performance. In: Rosemary Lucas, B. L. a. H. M. (ed.) Human Resource Management in an International Context. CIPD.
Atkinson, P. A. & Coffey, A. J. (2010). Analysing documentary realities. In: Silverman, D. (ed.) Qualitative Research London: SAGE Publications.
Audit Commission and IDeA (2002). Acting on facts: Using performance measurement to improve local authority services. Belmont Press, Northampton, UK Audit Commission.
Awortwi, N. (2004). Getting the fundamentals wrong: woes of public–private partnerships in solid waste collection in three Ghanaian cities. Public Administration and Development, 24(3), 213-224.
Awortwi, N. (2011). An unbreakable path? A comparative study of decentralization and local government development trajectories in Ghana and Uganda. International Review of Administrative Sciences, 77(2), 347-377.
Awortwi, N. & Helmsing, A. H. J. (2007). Governance of basic services provision in sub-Saharan Africa and the need to shift gear AEGIS European Conference on African Studies. Leiden, The Netherlands
Ayee, J. R. (2001). Civil Service Reform in Ghana: A Case Study of Contemporary Reform Problems in Africa African journal of political science, 6(1), 1-41.
Ayee, J. R. A. (1996). The Measurement of Decentralization: The Ghanaian Experience, 1988-92. African Affairs, 95(378), 31-50.
Ayee, J. R. A. (1997). The Adjustment of Central Bodies to Decentralization: The Case of the Ghanaian Bureaucracy. African Studies Review, 40(2), 37-57.
Ayee, J. R. A. (1999). Decentralisation and the provision of public services. In: Wohlmuth, K., Bass, H. H. & Messner, F. (eds.) Good Governance and Economic. Development. Munster and Hamburg: LIT Verlag.
Ayee, J. R. A. (2004). Ghana: A Top-Down Initiative. In: Olowu, D. & Wunsch, J. (eds.) Local Governance in Africa: The Challenges of Democratic Decentralization. London: Lynne Rienner.
Ayee, J. R. A. (2008). The Balance Sheet of Decentralization in Ghana In: Saito, F. (ed.) Foundations for Local Governance. Physica-Verlag HD.
Bandura, A. (1997). Self-efficacy: The exercise of control: Freeman. Banful, A. B. (2011). Do formula-based intergovernmental transfer mechanisms eliminate
politically motivated targeting? Evidence from Ghana. Journal of Development Economics, 96(2), 380-390.
Bawole, J. N., Hossain, F., Domfeh, K. A., Bukari, H. Z. & Sanyare, F. (2013). Performance Appraisal or Praising Performance? The Culture of Rhetoric in Performance Management in Ghana Civil Service. International Journal of Public Administration, 36(13), 953-962.
Beebe, L. H. (2007). What Can We Learn From Pilot Studies? Perspectives in Psychiatric Care, 43(4), 213-218.
Behn, R. D. (1995). The Big Questions of Public Management. Public Administration Review, 55(4), 313-324.
Behn, R. D. (2003). Why Measure Performance? Different Purposes Require Different Measures. Public Administration Review, 63(5), 586-606.
Bernard, H. R. & Ryan, G. W. (2010). Analyzing Qualitative Data: Systematic Approaches: SAGE Publications.
Bevan, G. & Hood, C. (2006). WHAT’S MEASURED IS WHAT MATTERS: TARGETS AND GAMING IN THE ENGLISH PUBLIC HEALTH CARE SYSTEM. Public Administration, 84(3), 517-538.
Bierbusse, P. & Siesfeld, T. (1997). Measures that matter. Journal of Strategic Performance Measurement, 1(2), 6-11.
Bititci, U. S., Mendibil, K., Nudurupati, S., Garengo, P. & Turner, T. (2006). Dynamics of performance measurement and organisational culture. International Journal of Operations & Production Management, 26(12), 1325 - 1350.
Bochie, G. (2000). Rural District Planning in Ghana: A Case Study. Environmental Planning Issues No. 21, December 2000. UK Department for International Development

248
Boselie, P., Dietz, G. & Boon, C. (2005). Commonalities and contradictions in HRM and performance research. Human Resource Management Journal, 15(3), 67-94.
Bouckaert, G. & Dooren, W. V. (2002). Performance Measurement: Getting Results. Public Performance & Management Review, 25(3), 329-335.
Bouckaert, G. & Halligan, J. (2006). A Framework for Comparative Analysis of Performance Management. Conference of European Group of Public Administration. Università Bocconi, Milan, : Study Group on Productivity and Quality in the Public Sector.
Bouckaert, G. & Halligan, J. (2008). Managing Performance: International Comparisons. London: Routledge.
Bouckaert, G. & Peters, B. G. (2002). Performance Measurement and Management: The Achilles' Heel in Administrative Modernization. Public Performance & Management Review, 25(4), 359-362.
Bourne, M., Neely, A., Platts, K. & Mills, J. (2002). The success and failure of performance measurement initiatives: Perceptions of participating managers. International Journal of Operations & Production Management, 22(11), 1288 - 1310.
Boyne, G. (2010). Srategic Planning. In: Rachel Ashworth, G. B. a. T. E. (ed.) Public Service Improvement: Theories and Evidence. Oxford: Oxford Uniuversity Press.
Boyne, G., Day, P. & Walker, R. (2002a). The evaluation of public service inspection: A theoretical framework. Urban Studies, 39(7), 1197-1212.
Boyne, G., Gould-Williams, J., Law, J. & Walker, R. (2002b). Plans, performance information and accountability: The case of best value. Public Administration, 80(4), 691-710.
Boyne, G., Jenkins, G. & Poole, M. (1999). Human resource management in the public and private sectors: An empirical comparison. Public Administration, 77(2), 407-420.
Boyne, G. A. (1999). Introduction: Processes, Performance and Best Value in Local Government. Local Government Studies, 25(2), X1-15.
Boyne, G. A. (2002). Concepts and indicators of local authority performance: An evaluation of the statutory frameworks in England and Wales. Public Money and Management, 22(2), 17-24.
Boyne, G. A. (2003). What is public service improvement? Public Administration, 81(2), 211-227. Boyne, G. A. & Chen, A. A. (2007). Performance Targets and Public Service Improvement. Journal
of Public Administration Research and Theory, 17(3), 455-477. Boyne, G. A., Meier, K. J., Laurence J. O'Toole, J. & Walker, R. M. (2010). Public Service
Performance: Perspectives on Measurement and Management: Cambridge University Press.
Brewer, G. A. (2010). All measures of perfomance are subjective:more evidence on US federal agencies. In: Boyne, G. A., Meier, K. J., Laurence J. O'Toole, J. & Walker, R. M. (eds.) Public Service Performance: Perspectives on Measurement and Management. Cambridge University Press.
Brewer, G. A. & Selden, S. C. (1998). Whistle Blowers in the Federal Civil Service: New Evidence of the Public Service Ethic. Journal of Public Administration Research and Theory, 8(3), 413-440.
Brewer, G. A. & Selden, S. C. (2000). Why Elephants Gallop: Assessing and Predicting Organizational Performance in Federal Agencies. Journal of Public Administration Research & Theory, 10(4), 685.
Brewer, G. A., Selden, S. C., Facer, I. & Rex, L. (2000). Individual conceptions of public service motivation. Public Administration Review, 60(3), 254-264.
Briscoe, D. B. & Claus, L. M. (2008). Employee performance management: policies and practices in multinational enterprises. In: Budwah, P. W. & Denisi, A. (eds.) Performance management systems: a global perspective. Abingdon: Routledge.
Bryman, A. (2008). Social Research Methods: Oxford University Press, Incorporated. Buelens, M. & Van den Broeck, H. (2007). An Analysis of Differences in Work Motivation between
Public and Private Sector Organizations. Public Administration Review, 67(1), 65-74.
249
Bukari Zakaria, H. & Mamman, A. (2014). Where is the Organisational Memory? A Tale of Local Government Employees in Ghana. Public Organization Review, 1-13.
Bulmer, M. (2001). Social Measurement: What stands in its way? : New School for Social Research.
Burrell, G. & Morgan, G. (1979). Sociological Paradigms and Organizational Analysis. London: Heinemann.
Calista, D. J., Melitski, J., Holzer, M. & Manoharan, A. (2010). Digitized Government in Worldwide Municipalities between 2003 and 2007. International Journal of Public Administration, 33(12-13), 588-600.
Callahan, K. (2007). Elements of Effective Governance: Measurement, Accountability, and Participation. New York: Taylor and Francis.
Carmeli, A. & Tishler, A. (2004). The relationships between intangible organizational elements and organizational performance. Strategic Management Journal, 25(13), 1257-1278.
Carroll, B. W. & Dewar, D. I. (2002). Performance Management: Panacea or Fool’s Gold. In: Dunn, C. (ed.) The Handbook of Canadian Public Administration. Toronto: Oxford University Pres.
Charbonneau, É. (2011). Assessing the effects of an Intelligence Performance Regime: Quebec's Municipal Management Indicators, 1999–2010. International Review of Administrative Sciences, 77(4), 733-755.
Charmaz, K. (2006). Constructing Grounded Theory: A Practical Guide Through Qualitative Analysis: SAGE Publications.
Chenhall, R. H. & Langfield-Smith, K. (2007). Multiple Perspectives of Performance Measures. European Management Journal, 25(4), 266-282.
Christensen, T. & Lægreid, P. (2005). Trust in Government: The Relative Importance of Service Satisfaction, Political Factors, and Demography. Public Performance & Management Review, 28(4), 487-511.
Conyers, D. (2007). Decentralisation and service delivery lessons from Sub-Saharan Africa IDS bulletin 38(1), 18-32.
Coop, C. F. (2006). Balancing the balanced scorecard for a New Zealand mental health service. Australian Health Review, 30(2), 174-180.
Corbin, J. & Strauss, A. (1990). Grounded theory research: Procedures, canons, and evaluative criteria. Qualitative Sociology, 13(1), 3-21.
Cowton, C. (1998). The Use of Secondary Data in Business Ethics Research. Journal of Business Ethics, 17(4), 423-434.
Crawford, G. (2004). Democratic decentralization in Ghana: Issues and prospects. POLIS Working Paper, 9.
Crawford, G. (2008). Decentralization and the Limits to Poverty Reduction: Findings from Ghana. Oxford Development Studies, 36(2), 235-258.
Crawford, G. (2009). ‘Making democracy a reality’? The politics of decentralisation and the limits to local democracy in Ghana. Journal of Contemporary African Studies, 27(1), 57-83.
Crawford, K. & Cox, J. (1990). Designing performance measurement systems for just in time operations. International Journal of Production Research, 28(11), 2025-36.
Creswell, J. W. (2002). Educational research: Planning, conducting, and evaluating quantitative and qualitativeresearch. Upper Saddle River, NJ: Pearson Education.
Crook, R. & Manor, J. (1998). Democracy and Decentralisation in South Asia and West Africa: Participation, Accountability, and Performance: Cambridge University Press.
Crook, R. C. (1994). Four years of the Ghana district assemblies in operation: Decentralization, democratization and administrative performance. Public Administration and Development, 14(4), 339-364.
Crook, R. C. (2003). Decentralisation and poverty reduction in Africa: the politics of local–central relations. Public Administration and Development, 23(1), 77-88.
de Bruijn, H. (2002a). Managing performance in the public sector. London: Routledge.
250
de Bruijn, H. (2002b). Performance measurement in the public sector: strategies to cope with the risks of performance measurement. International Journal of Public Sector Management, 15(7), 578 - 594.
de Lancer Julnes, P. & Holzer, M. (2001). Promoting the Utilization of Performance Measures in Public Organizations: An Empirical Study of Factors Affecting Adoption and Implementation. Public Administration Review, 61(6), 693-708.
de Waal, A. A. (2006). The Role of Behavioral Factors and National Cultures in Creating Effective Performance Management Systems. Systemic Practice and Action Research, 19(1), 61-79.
Debrah, Y. (ed.) (2001). Human Resources Management in Ghana, London: Routledge. Demirkaya, Y. (2006). The changing management of local government under new labour in
england: best value policy. Public Administration and Management, 11(2), 44-74. Denzin, N. K. (1994). The art and politics of interpretation. In: Denzin, N. K. & Lincoln, Y. S. (eds.)
Handbook of qualitative research. Thousand Oaks, CA, US: Sage Publications, Inc. Denzin, N. K. & Lincoln, Y. S. (2005). The Sage Handbook of Qualitative Research: Sage
Publications. Denzin, N. K. & Lincoln, Y. S. (2011). The SAGE Handbook of Qualitative Research: SAGE
Publications. Dess, G. G. & Robinson, R. B., Jr. (1984). Measuring Organizational Performance in the Absence of
Objective Measures: The Case of the Privately-Held Firm and Conglomerate Business Unit. Strategic Management Journal, 5(3), 265-273.
Dilley, P. (2004). Interviews and the philosophy of qualitative research. The Journal of Higher Education, 75(1), 127-132.
Doornbos, M. (2001). 'Good Governance': The Rise and Decline of a Policy Metaphor? The Journal of Development Studies, 37(6), 93-108.
Drucker, P. F. (2009). Management: HarperCollins. Eisenhardt, K. M. (1989). Building Theories from Case Study Research. Academy of Management
Review, 14(4), 532-550. Ellis, C. (1995). Final Negotiations: A Story of Love, and Chronic Illness: Temple University Press. Elzinga, T., Bé, A. & Kluijtmans, F. (2009). Behavioral factors influencing performance
management systems' use. International Journal of Productivity and Performance Management, 58(6), 508-522.
Fjeldstad, O.-H. (2001). Intergovernmental fiscal relations in the developing world: A review of issues. In: Levy, N. & Tapcott, C. (eds.) (eds) Intergovernmental Relations in South Africa: The Challenges of Cooperative Government. Cape Town: School of Government, University of Western Cape.
Forsythe, D. W. (2001). Quicker, Better, Cheaper? Managing Performance in American Government. Albany, NY: Rockefeller Institute Press.
Fountain, J. (1997). Are State and Local Governments Using Performance Measures? . PA Times, 20(1), 2, 8.
Frankfort-Nachmias, C. & Nachmias, D. (2007). Research methods in the social sciences: Macmillan.
Friedrich-Ebert-Stiftung (2010). A Guide to District Assemblies in Ghana. Institute for Local Government Studies and Friedrich-Ebert-Stiftung Ghana.
Fryer, K., Antony, J. & Ogden, S. (2009). Performance management in the public sector. International Journal of Public Sector Management, 22(6), 478 - 498.
Gabris, G. T. & Simo, G. (1995). Public Sector Motivation as an Independent Variable Affecting Career Decisions. Public Personnel Management, 24(1), 33-51.
Gaster, L. (1999). Quality Management in Local Government - Issues and Experience. Public Policy and Administration, 14(3), 35-53.
Ghana Audit Service (2005). Report of the Auditor-General on the accounts of District Assemblies for the three financial years ended 31 December 2005-2007. In: GHANA AUDIT SERVICE (ed.). Accra.
251
Ghana Audit Service (2010). Report of the Auditor-General on the Management and Utilisation of District Assemblies Common Fund (DACF) and Other Statutory Funds for the year ended 31 December 2010. In: Ghana Audit Service (ed.). Accra.
Ghana Education Service (2011). Director-General’s Annual Report to GES Council In: Education, M. o. (ed.). Accra.
Ghana Statistical Service (2003). Ghana - Ghana Core Welfare Indicators Questionnaire Survey Accra: Government of Ghana and the World Bank
Ghana Statistical Service (2012). 2010 Population and Housing Census: Final Results Accra: Ghana Statistical Service.
Gocking, R. (2005). The history of Ghana: Greenwood Publishing Group. Gould Williams, J. (2010). Human Resource Management. In: Ashworth, R., Boyne, G. & Entwistle,
T. (eds.) Public Service Improvement: Theories and Evidence. . Oxford University Press. Government of Ghana (2010). Medium-term national development policy framework: Ghana
shared growth and development agenda (GSGDA), 2010-2013 Volume I: Policy framework In: National Development Planning Commission (ed.). Accra.
Government of Ghana (2012). Operational Manual for the implementation and administration of the District Development Facility. In: Ministry of Local Government and Local Government (ed.). Accra.
Government of Ghana (2014a). The budget statement and economic policy of the Government of Ghana for the 2014 financial year In: Ministry of Finance and Economic Planning (ed.). Accra.
Government of Ghana (2014b). Consolidated Report FOAT VI (2012) on the Assessment of Metropolitan, Municipal and District Assemblies. 6thCycle of FOAT 2012 Ministry of Local Government and Rural Development.
Greiling, D. (2006). Performance measurement: a remedy for increasing the efficiency of public services? International Journal of Productivity and Performance Management, 55(6), 448 - 465.
Grindle, M. S. (2007). Going Local: Decentralization, Democratization, And The Promise of Good Governance: Princeton University Press.
Guba, E. G. & Lincoln, Y. S. (1992). Effective Evaluation: Improving the Usefulness of Evaluation Results Through Responsive and Naturalistic Approaches: Wiley.
Guthrie, J. & Farneti, F. (2008). Italian and Australian Local Governments: Balanced Scorecard Practices: A Research Note. Journal of HRCA: Human Resource Costing and Accounting 12(1), 4–13.
Halachmi, A. (2002). Performance Measurement, Accountability, and Improved Performance. Public Performance & Management Review, 25(4), 370-374.
Halachmi, A. (2005). Performance measurement: test the water before you dive in. International Review of Administrative Sciences, 71(2), 255-266.
Halligan, J., Bouckaert, G. & Dooren, W. V. (2010). Performance Management in the Public Sector: Routledge.
Hammersley, M. & Atkinson, P. (1983). Ethnography: Principles in Practice: Tavistock. Hardy, C. & Clegg, S. (1997). Relativity Without Relativism: Reflexivity in Post-Paradigm
Organization Studies. British Journal of Management, 8, 5-17. Hartley, J. F. (1994). Case studies in organizational research. In: Cassell, C. & Symon, G. (eds.)
Qualitative methods in organizational research: A practical guide. London: Sage. Heinrich, C. J. (2002). Outcomes–Based Performance Management in the Public Sector:
Implications for Government Accountability and Effectiveness. Public Administration Review, 62(6), 712-725.
Henri, J. F. (2006). Organizational Culture and Performance Measurement Systems. Accounting, Organizations and Society, 31(1), 77–103.
Heyink, J. & Tymstra, T. (1993). The function of qualitative research. Social Indicators Research, 29(3), 291-305.
252
Ho, A. (2003). Perceptions of Performance Measurement and the Practice of Performance Reporting by Small Cities. State & Local Government Review, 35(3), 161-173.
Ho, A. & Coates, P. (2004). Citizen-Initiated Performance Assessment: The Initial Iowa Experience. Public Performance & Management Review, 27(3), 29-50.
Hofstede, G. (1981). Management control of public and not-for-profit activities. Accounting, Organizations and Society, 6(3), 193-211.
Hood, C. (1991). A public management for all seasons. Public Administration 69(1), 3–19. Houston, D. J. (2000). Public-Service Motivation: A Multivariate Test. Journal of Public
Administration Research and Theory, 10(4), 713-728. Hughes, C. (1994). From field notes to dissertation: analysing the stepfamily In: Bryman, A. &
G.Burgess, R. (eds.) Analysing Qualitative Data London and New York: Taylor & Francis Group.
Ingraham, P., Joyce, P. G. & Donahue, K. A. (2003). Government Performance: Why Management Matters. Baltimore and London: Johns Hopkins University Press.
Jackson, W. U. (1984). Performance assessment in local government. Long Range Planning, 17(3). Jacobs, K. & Manzi, T. (2000). Performance indicators and social constructivism: conflict and
control in housing management. Critical Social Policy, 20(1), 85-103. Jarrar, Y. & Schiuma, G. (2007). Measuring performance in the public sector: challenges and
trends. Measuring Business Excellence, 11(4), 4 - 8. Jones, S. (1985). Depth interviewing. In: Walker, R. (ed.) Applied qualitative research Aldershot,
UK: Gower Pub Co. Kaplan, R. S. (2001). Strategic Performance Measurement and Management in Nonprofit
Organizations. Nonprofit Management and Leadership, 11(3), 353-370. Kaplan, R. S. & Norton, D. P. (1992). The Balanced Scorecard--Measures That Drive Performance.
Harvard Business Review, 70(1), 71-79. Kaplan, R. S. & Norton, D. P. (1996a). The Balanced Scorecard: Translating Strategy Into Action:
Harvard Business School Press. Kaplan, R. S. & Norton, D. P. (1996b). Using the Balanced Scorecard as a Strategic Management
System. HARVARD BUSINESS REVIEW, 75. Kaplan, R. S. & Norton, D. P. (2000). The Strategy-Focused Organization: How Balanced Scorecard
Companies Thrive in the New Business Environment. Boston, MA: Harvard Business School Press.
Kaplan, R. S. & Norton, D. P. (2001a). The strategy-focused organization: How balanced scorecard companies thrive in the new business environment: Harvard Business school press.
Kaplan, R. S. & Norton, D. P. (2001b). Transforming the balanced scorecard from performance measurement to strategic management: Part 1. Accounting Horizons, 15(1), 87-104.
Kaplan, R. S. & Norton, D. P. (2001c). Transforming the balanced scorecard from performance measurement to strategic management: Part II. Accounting Horizons, 15(2), 147-160.
Karataş-Özkan, M. & Murphy, W. D. (2010). Critical Theorist, Postmodernist and Social Constructionist Paradigms in Organizational Analysis: A Paradigmatic Review of Organizational Learning Literature. International Journal of Management Reviews, 12(4), 453-465.
Kaufmann, D., Kraay, A. & Zoido-Lobatón, P. (1999). Aggregating Governance Indicators. . Policy Research Working paper. Washington: The World Bank. .
Kenya, K. (2011). Performance Management and Performance Indicators for Local Government Development: The Case of Ghana. In: Alam, M. & Koranteng, R. (eds.) Decentralisation in Ghana. London: the Commonwealth Secretariat.
Kessey, K. D. (1995). Financing local development in Ghana. mobilization and management of fiscal resources in Kumasi Metropolis. PhD Dissertation.
Kiesinger, C. E. (1998). From Interview to Story: Writing Abbie's Life. Qualitative Inquiry, 4(1), 71-95.
Kim, S. (2005). Individual-Level Factors and Organizational Performance in Government Organizations. Journal of Public Administration Research and Theory, 15(2), 245-261.
253
Kloot, L. & Martin, J. (2000). Strategic performance management: A balanced approach to performance management issues in local government. Management Accounting Research, 11(2), 231-251.
Kuhn, T. S. (1970). The Structure of Scientific Revolutions. Chicago, IL.: University of Chicago Press. Kvale, S. (1996). InterViews: An Introduction to Qualitative Research Interviewing: SAGE
Publications. Lebas, M. J. (1995). Performance measurement and performance management. International
Journal of Production Economics, 41(1–3), 23-35. Lemieux-Charles, L., McGuire, W., Champagne, F., Barnsley, J., Cole, D. & Sicotte, C. (2003). The
use of multilevel performance indicators in managing performance in health care organizations. Management Decision, 41(8), 760 - 770.
LGSS (2009). Human Resource Management Policy. Accra: Local Government Service Secretariat Lincoln, Y. S. & Denzin, N. K. (2003). The seventh moment: Out of the past. In: Denzin, N. K. &
Lincoln, Y. S. (eds.) The landscape of qualitative research: Theories and issues Thousand Oaks, CA: Sage.
Lincoln, Y. S. & Guba, E. G. (1985). Naturalistic Inquiry: SAGE Publications. Lincoln, Y. S. & Guba, E. G. (2000). Paradigmatic controversies, contradictions, and emerging
confluences. In: Denzin, N. K. & Lincoln, Y. S. (eds.) Handbook of Qualitative Research. 2nd ed. Thousand Oaks, CA.: Sage
Lynn, L. E., Heinrich, C. J. & Hill, C. J. (2000). Studying Governance and Public Management: Challenges and Prospects. Journal of Public Administration Research and Theory, 10(2), 233-262.
Makara, S. (2000). Decentralization for Good Governance and Development: Uganda’s Experience. Regional Development Dialogue 21(1), 73–92.
Manor, J. (1999). The Political Economy of Democratic Decentralisation. Directions in Development Series Washington DC: World Bank.
Marshall, M. N. (1996). Sampling for qualitative research. Family Practice, 13(6), 522-526. Marvasti, A. (2010). Interviews and Interviewing. In: Editors-in-Chief: Penelope, P., Eva, B., Barry
McGawA2 - Editors-in-Chief: Penelope Peterson, E. B. & Barry, M. (eds.) International Encyclopedia of Education (Third Edition). Oxford: Elsevier.
Mason, D. J. & Zuercher, S. L. (1995). Pilot studies in clinical nursing research. Journal of the New York State Nursing Association 26: 11.
Mayne, J. (2007). Challenges and Lessons in Implementing Results-Based Management. Evaluation 13(87).
McAdam, R. & O’Neill, E. (1999). Taking a critical perspective to the European Business Excellence Model using a balanced scorecard approach: a case study in the service sector. Managing Service Quality, 9(3), 191-197.
McAdam, R. & Walker, T. (2003). An Inquiry into Balanced Scorecards within Best Value Implementation in UK Local Government. Public Administration, 81(4), 873-892.
McCormack, C. (2000). From Interview Transcript to Interpretive Story: Part 1—Viewing the Transcript through Multiple Lenses. Field Methods, 12(4), 282-297.
McCunn, P. (1998). The Balanced Scorecard...the eleventh commandment. Management Accounting: Magazine for Chartered Management Accountants, 76(11), 34.
McKevitt, D. & Lawton, A. (1996). The manager, the citizen, the politician and performance measures. Public Money & Management, 16(3), 49-54.
Meekings, A. (1995). Unlocking the potential of performance measurement: A practical implementation guide. Public Money & Management, 15(4), 5-12.
Meier, K. J. & Brudney, J. L. (2002). Applied statistics for public administration: Harcourt College Publishers.
Melkers, J. & John Clayton, T. (1998). What Do Administrators Think Citizens Think? Administrator Predictions as an Adjunct to Citizen Surveys. Public Administration Review, 58(4), 327-334.

254
Melkers, J. & Willoughby, K. (2005). Models of Performance-Measurement Use in Local Governments: Understanding Budgeting, Communication, and Lasting Effects. Public Administration Review, 65(2), 180-190.
Mensah, A. & Larbi, E. (2005). Solid Waste Disposal in Ghana. Well factsheet - Regional Annex [Online]. Available: available at http://www.lboro.ac.uk/well/resources/fact-sheets/fact-sheets-htm/RSA%20Solid%20waste.htm [Accessed 19-05-2014].
Mensah, J. (2005). Problems of District Medium-Term Development Plan implementation in Ghana: The way forward</i>. International Development Planning Review, 27(2), 245-270.
Mergenthaler, E. & Stinson, C. (1992). Psychotherapy transcription standards. Psychotherapy Research, 2(2), 125-142.
Meyer, C. B. (2001). A Case in Case Study Methodology. Field Methods, 13(4), 329-352. Miles, M. B. & Huberman, A. M. (1994). Qualitative Data Analysis: An Expanded Sourcebook: SAGE
Publications. Ministry of Education (2013). Report on Basic Statistics and Planning Parameters for Basic
Education in Ghana. . Accra: Ministry of Education Ministry of Local Government (2007). Joint Government of Ghana and Development Partner
Decentralisation Policy Review Accra: Ministry of Local Government and Rural Development
Mogues, T., Benin, S. & Cudjoe, G. (Year). Do External Grants to District Governments Discourage Own-resource Generation? A Look at Local Public Finance Dynamics in Ghana. In: International Food Policy Research Institute (IFPRI) - Ghana Strategy Support Program (GSSP) Workshop on “Agricultural Services, Decentralization, and Local Governance”, 2010 Accra. IFPRI.
Morgeson, F. V. & Petrescu, C. (2011). Do they all perform alike? An examination of perceived performance, citizen satisfaction and trust with US federal agencies. International Review of Administrative Sciences, 77(3), 451-479.
Moss, T. & Majerowicz, S. (2012). No Longer Poor: Ghana’s New Income Status and Implications of Graduation from IDA. In: Center for Global Development (ed.) CGD Working Paper 300. Washington, D.C.
Motowildo, S. J., Borman, W. C. & Schmit, M. J. (1997). A Theory of Individual Differences in Task and Contextual Performance. Human Performance, 10(2), 71-83.
Moynihan, D. P. (2008). The Dynamics of Performance Management: Constructing Information and Reform: Georgetown University Press.
Moynihan, D. P. & Ingraham, P. W. (2003). Look for the Silver Lining: When Performance‐Based Accountability Systems Work. Journal of Public Administration Research and Theory, 13(4), 469-490.
Moynihan, D. P. & Pandey, S. K. (2005). Testing How Management Matters in an Era of Government by Performance Management. Journal of Public Administration Research and Theory, 15(3), 421-439.
Moynihan, D. P. & Pandey, S. K. (2007). The Role of Organizations in Fostering Public Service Motivation. Public Administration Review, 67(1), 40-53.
Moynihan, D. P. & Pandey, S. K. (2010). The Big Question for Performance Management: Why Do Managers Use Performance Information? Journal of Public Administration Research and Theory, 20(4), 849-866.
MTDP: ‘B’ Municipal Assembly (2010). Medium Term Development Plan under the Ghana Shared Growth and Development Agenda (GSGDA: 2010-2013).
MTDP: ‘C’ District Assembly (2010). District Medium - Term Development Plan (2010 – 2013) under the Ghana Shared Growth and Development Agenda. In: Unit, D. P. a. C. (ed.).
NDPC (2003). Ghana Poverty Reduction Reduction Strategy (2003-2005) Medium Term National Development Policy Framework. Accra: National Development Planning Commission.
NDPC (2005). Growth and Poverty Reduction Strategy (2006-2009). Accra: National Development Planning Commission.

255
NDPC (2009). Guidelines for the preparation of District Medium-Term Development Plan under the Medium-Term Development Policy Framework 2010-2013 In: Commission, N. D. P. (ed.). Accra.
NDPC (2010). Ghana Shared Growth and Development Agenda. Medium Term National Development Policy Framework. Accra: National Development Planning Commission.
Neely, A. (1998). Measurement business performance – why, what and how. The Economist. London.
Neshkova, M. I. & Guo, H. (2012). Public Participation and Organizational Performance: Evidence from State Agencies. Journal of Public Administration Research and Theory, 22(2), 267-288.
OECD-PUMA (1997). In Search of Results: Performance Management Practices. Paris: OECD. OECD (1997). Managing across Levels of Government Paris: OECD. Ohemeng, F. L. K. (2009). Constraints in the Implementation of Performance Management
Systems in Developing Countries. International Journal of Cross Cultural Management, 9(1), 109-132.
Ohemeng, F. L. K. (2010). The new Charter System in Ghana: the ‘holy grail’ of public service delivery? International Review of Administrative Sciences, 76(1), 115-136.
Olowu, D. & Smoke, P. (1992). Determinants of success in African local governments: An overview. Public Administration and Development, 12(1), 1-17.
Oquaye, M. (1995). Decentralisation and development: The Ghanaian case under the provisional national defence council (PNDC). The Journal of Commonwealth & Comparative Politics, 33(2), 209-239.
Oyugi, W. (2000). Decentralisation for good governance and development: The unending debate. Regional Development Dialogue 21(1), 3–22.
Padgett, D. K. (2008). Qualitative Methods in Social Work Research (2nd ed.). Los Angeles, CA: SAGE.
Parasuraman, A., Zeithaml, V. A. & Berry, L. L. (1985). A Conceptual Model of Service Quality and Its Implications for Future Research. The Journal of Marketing, 49(4), 41-50.
Parasuraman, A., Zeithaml, V. A. & Berry, L. L. (1988). SERVQUAL: A Multiple-Item Scale for Measuring Consumer Perceptions of Service Quality. Journal of Retailing, 64(1), 12-40.
Perry, J. L. (1996). Measuring Public Service Motivation: An Assessment of Construct Reliability and Validity. Journal of Public Administration Research and Theory, 6(1), 5-22.
Perry, J. L. & Hondeghem, A. (2008). Motivation in public management: The call of public service. Oxford, UK: Oxford University Press.
Perry, J. L. & Wise, L. R. (1990). The motivational bases of public service. Public Administration Review, 50(3), 367-373.
Perry, S. E. (2001). Appropriate Use of Pilot Studies. Journal of Nursing Scholarship 33(2), 107. Poister, T. H. (2003). Measuring Performance in Public and Nonprofit Organizations. San Francisco:
Jossey-Bass. Poister, T. H. & Streib, G. (1999). Performance Measurement in Municipal Government: Assessing
the State of the Practice. Public Administration Review, 59(4), 325-335. Pollitt, C. (2006a). Performance Information for Democracy. Evaluation, 12(1), 38-55. Pollitt, C. (2006b). Performance management in practice: a comparative study of executive
agencies. Journal of Public Administration Research and Theory, 16(1), 25-44. Pollitt, C. (2006c). Who are we, what are we doing, where are we going? A perspective on the
performance management community. keynote at A performing public sector, June, 1. Pollitt, C. (2013). The logics of performance management. Evaluation, 19(4), 346-363. Pollitt, C. & Bouckaert, G. (2004). Public management reform: a comparative analysis: Oxford
University Press. Pollitt, C., Talbot, C., Caulfied, J. & Smullen, A. (2005). Agencies - How Government's Do Things
Through Semi-Autonomous Organizations. NY: Palgrave: Macmillan. Prasad, A. & Prasad, P. (2002). The Coming of Age of Interpretive Organizational Research.
Organizational Research Methods, 5(1), 4-11.
256
Punch, K. F. (2005). Introduction to Social Research: Quantitative and Qualitative Approaches: Sage.
Quinlivan, D. (2000). Rescaling the Balanced Scorecard for Local Government. Australian Journal of Public Administration, 59(4), 36-41.
Radin, B. A. (2006). Challenging the Performance Movement - accountability, complexity and democratic values. Washington DC: Georgetown University Press.
Radnor, Z. (2008). Muddled, massaging, manœuvring or manipulated?: A typology of organisational gaming. International Journal of Productivity and Performance Management, 57(4), 316 - 328.
Radnor, Z. J. & Barnes, D. (2007). Historical analysis of performance measurement and management in operations management. International Journal of Productivity and Performance Management, 56(5/6), 384 - 396.
Rainey, H. G. & Steinbauer, P. (1999). Galloping Elephants: Developing Elements of a Theory of Effective Government Organizations. Journal of Public Administration Research and Theory, 9(1), 1-32.
Rashid, N. (1999). Managing Performance in Local Government: Kogan Page. Republic of Ghana (1992). Constitution of the Republic of Ghana. Tema: Ghana Publishing
Corporation. Republic of Ghana (2009). Local Government (Departments of District Assemblies)
(Commencement) Instrument, 2009 (L.I. 1961). Ghana. Resnick, M. L. (2009). When Performance Management Fails - Forensic Case Studies from the
Front Lines. Proceedings of the Human Factors and Ergonomics Society Annual Meeting, 53(9), 558-562.
Rheem, H. (1996). Performance Management Programs. Harvard Business Review, 74(5), 8-9. Ribot, J. C. (2003). Democratic decentralisation of natural resources: institutional choice and
discretionary power transfers in Sub-Saharan Africa. Public Administration and Development, 23(1), 53-65.
Robinson, M. (2007). Does Decentralisation Improve Equity and Efficiency in Public Service Delivery Provision? IDS Bulletin, 38(1), 7-17.
Roch, C. H. & Poister, T. H. (2006). Citizens, Accountability, and Service Satisfaction. Urban Affairs Review, 41(3), 292-308.
Roe, R. A. (1999). Work performance: A multiple regulation perspective. In: Cooper, C. L. & Robertson, I. T. (eds.) International Review of Industrial and Organizational Psychology. Chichester: Wiley.
Roulston, K., deMarrais, K. & Lewis, J. B. (2003). Learning to Interview in the Social Sciences. Qualitative Inquiry, 9(4), 643-668.
Rubin, H. J. & Rubin, I. (2005). Qualitative Interviewing: The Art of Hearing Data: Sage Publications.
Ruff, C. C., Alexander, I. M. & McKie, C. (2005). The use of focus group methodology in health disparities research. Nursing Outlook, 53(3), 134-140.
Ryan, G. W. & Bernard, H. R. (2003). Techniques to Identify Themes. Field Methods, 15(1), 85-109. Safdar, R. (2011). HRM: Performance Relationship: Need for Further Development? International
Journal of Public Administration, 34(13), 858-868. Sandberg, J. (2005). How Do We Justify Knowledge Produced Within Interpretive Approaches?
Organizational Research Methods, 8(1), 41-68. Sanderson, I. (2001). Performance Management, Evaluation and Learning in ‘Modern’ Local
Government. Public Administration, 79(2), 297-313. Sanger, M. B. (2008). From Measurement to Management: Breaking through the Barriers to State
and Local Performance. Public Administration Review, 68, S70-S85. Schick, A. (2001). Getting Performance Measures to Measure Up. In: Forsythe, D. W. (ed.) Quicker
Better Cheaper: Managing Performance in American Government. Albany, NY: The Rockefeller Institute Press.
257
Schiewer, H. (1995). Incorporation of Village Level Needs into District Planning in Ghana Planning from below or Continuation of Planning for Elites? Africa Spectrum, 293-314.
Schneiderman, A. M. (1999). Why balanced scorecards fail. Journal of Strategic Performance Measurement, 2(S 6), 11.
Schott, C., van Kleef, D. D. & Steen, T. (2014). What Does It Mean and Imply to be Public Service Motivated? The American Review of Public Administration.
Seidman, I. (2012). Interviewing as Qualitative Research: A Guide for Researchers in Education and the Social Sciences: Teachers College Press.
SEND Foundation (2013). Managing Public Finance for Effective Local Development: A District Assembly Common Fund Perspective Accra: Socia Enterprises Network for Development (SEND) Foundation.
Senge, P. M. (2006). The Fifth Discipline: The Art and Practice of the Learning Organization: Random House Business.
Senko, C., Hulleman, C. S. & Harackiewicz, J. M. (2011). Achievement Goal Theory at the Crossroads: Old Controversies, Current Challenges, and New Directions. Educational Psychologist, 46(1), 26-47.
Shah, A. (ed.) (2006). Local Governance in Developing Countries, Washington DC: World Bank. Sharma, B. & Gadenne, D. (2011). Balanced Scorecard Implementation in a Local Government
Authority: Issues and Challenges. Australian Journal of Public Administration, 70(2), 167-184.
Silverman, D. (2010). Doing Qualitative Research: SAGE Publications. Silverman, D. (2011). Interpreting Qualitative Data: SAGE Publications. Smith, P. (1995). On the unintended consequences of publishing performance data in the public
sector. International Journal of Public Administration, 18(2-3), 277-310. Sole, F. & Schiuma, G. (2010). How to Use Different Measures for Different Purposes: A Holistic
Performance Management Model for Public Organizations. In: Taticchi, P. (ed.) Business Performance Measurement and Management: New Contexts, Themes and Challenges. Berlin Heidelberg Springer.
Sonnentag, S. & Frese, M. (2002). Performance Concepts and Performance Theory. Psychological Management of Individual Performance. John Wiley & Sons, Ltd.
Sonnentag, S., Volmer, J. & Spychala, A. (2008). Job Performance. In: Barling, J. & Cooper, C. L. (eds.) The SAGE Handbook of Organizational Behavior. . London. : Sage.
Stake, R. E. (2000). Case Studies. In: Norman, K. D. & Yvonna, S. L. (eds.) Handbook of Qualitative Research. 2nd ed. London: Sage Publications.
Stoker, G. (1998). Government as Theory: Five Propositions. Oxford: UNESCO. Strauss, A. L. & Corbin, J. M. (1990). Basics of qualitative research: grounded theory procedures
and techniques: Sage Publications. Summermatter, L. & Siegel, J. P. (2009). Defining Performance in Public Management: Variations
over time and space. Paper for IRSPM XXIII. Copenhagen. Tahvanainen, M. (2000). Expatriate performance management: The case of Nokia
Telecommunications. Human Resource Management, 39(2-3), 267-275. Talbot, C. (1999). Public Performance - towards a new model? Public Policy and Administration,
14(3), 15-34. Talbot, C. (2010). Theories of Performance: Organisational and service improvement in the public
domain: Oxford University Press. Tangen, S. (2004). Evaluation and revision of performance measurement systems. doctoral thesis,
The Royal Institute of Technology. Tangen, S. (2005). Analysing the requirements of performance measurement systems. Measuring
Business Excellence, 9(4), 46 - 54. Taylor, J. (2007). The usefulness of key performance indicators to public accountability authorities
in East Asia. Public Administration and Development, 27(4), 341-352.

258
Taylor, J. (2011). FACTORS INFLUENCING THE USE OF PERFORMANCE INFORMATION FOR DECISION MAKING IN AUSTRALIAN STATE AGENCIES. Public Administration, 89(4), 1316-1334.
Therkildsen, O. (2000). Contextual issues in decentralization of primary education in Tanzania. International Journal of Educational Development, 20(5), 407-421.
Therkildsen, O. (2006). Elusive Public Sector Reform in East and Southern Africa. In: Bangura, Y. & Larbi, G. A. (eds.) Public Sector Reforms in Developing Countries: Capacity Challenges to Improve Services. Hampshire: Palgrave.
Thiel, S. V. & Leeuw, F. L. (2002). The Performance Paradox in the Public Sector. Public Performance & Management Review, 25(3), 267-281.
Thomas, G. P. (2006). Performance Measurement, Reporting, Obstacles and Accountability recent Trends and Future Directions. In: University, A. N. (ed.). University Printing Services.
Tronvoll, B., Brown, S. W., Gremler, D. D. & Edvardsson, B. (2011). Paradigms in service research. Journal of Service Management, 22(5), 560 - 585.
Van Ryzin, G. G. (2004). Expectations, performance, and citizen satisfaction with urban services. Journal of Policy Analysis and Management, 23(3), 433-448.
van Teijlingen, E. & Hundley, V. (2001). The Importance of Pilot Studies Social Research Update [Online], 35, 1-4. Available: http://sru.soc.surrey.ac.uk/SRU35.pdf.
Vandenabeele, W. (2007). Toward a public administration theory of public service motivation. Public Management Review, 9(4), 545-556.
Verbeeten, F. H. M. (2008). Performance management practices in public sector organizations: Impact on performance. Accounting, Auditing & Accountability Journal, 21(3), 427 - 454.
Wang, X. & Berman, E. (2001). Hypotheses about Performance Measurement in Counties: Findings from a Survey. Journal of Public Administration Research and Theory, 11(3), 403-428.
Wholey, J. S. (1999). Performance-Based Management: Responding to the Challenges. Public Productivity & Management Review, 22(3), 288-307.
Williams, D. W. (2003). Measuring Government in the Early Twentieth Century. Public Administration Review, 63(6), 643-659.
Wisniewski, M. (1996). Measuring service quality in the public sector: The potential for SERVQUAL. Total Quality Management, 7(4), 357-366.
World Bank (1989). Sub-Saharan Africa: From Crisis to Sustainable Growth – A Long-Term Perspective Washington, DC: World Bank.
World Bank (1997). World Development Report 1997 – The State in a Changing World. Washington: World Bank.
World Bank (2000). Entering the 21st Century: World Development Report 1999/2000. Oxford: World Bank.
World Bank (2003). World Development Report 2004: Making Services work for poor people. Washington, DC World Bank.
Wright, B. E. & Pandey, S. K. (2008). Public Service Motivation and the Assumption of Person—Organization Fit: Testing the Mediating Effect of Value Congruence. Administration & Society, 40(5), 502-521.
Wright, P. M., Gardner, T. M. & Moynihan, L. M. (2003). The impact of HR practices on the performance of business units. Human Resource Management Journal, 13(3), 21-36.
Yang, K. & Holzer, M. (2006). The Performance–Trust Link: Implications for Performance Measurement. Public Administration Review, 66(1), 114-126.
Yang, K. & Rho, S.-Y. (2007). E-Government for Better Performance: Promises, Realities, and Challenges. International Journal of Public Administration, 30(11), 1197-1217.
Yankson, P. W. (2007). Decentralised governance, access to social services and poverty reduction in the Gomoa District, Ghana. International Development Planning Review, 29(3), 379-412.
Yin, R. (2009). Case Study Research: Design and Methods (4th ed.). London: Sage Publications.
259
Zakaria, H. B. (2013). Looking back, moving forward: Towards improving local governments' performance in Ghana. Commonwealth Journal of Local Governance, (13/14).
List of appendices
Appendix 1: Participant information sheet and informed consent
As a potential participant, the information below explains your role and rights if you offer
to partake in this study. After reading through this information sheet, any questions or
concerns you may need to be clarified to allow you make an informed decision are readily
welcome as I will be delighted to address them. You are kindly reminded that it is not a
bother to ask me questions. Your decision to agree or refuse to participate in this study will
be highly respected and you are not obliged to participate by merely reading this
document. I will be very grateful however, if you decide to participate. Thank you for your
time.
Who will conduct the research?
The study will be carried out by Hamza Bukari Zakaria, PhD Candidate at the Institute for
Development Policy and Management (IDPM); School of Environment, Education and

260
Development (SEED), University of Manchester under the supervision of Dr. Aminu
Mamman and Dr. Chris Rees.
Title and aim of research
Performance Management and Local Government Administration in Ghana: The Case of
the District Development Facility and the Functional Organisational Assessment Tool. The
study aims at examining performance management practices of local governments in
Ghana by drawing on the knowledge of local government officials and community groups
to understand the nature of existing performance management processes, the scope of
performance indicators, and the use of performance information to enhance service
delivery.
Why you have been chosen?
You are selected to participate in this study because you meet the requirements for this
research. This is reinforced by virtue of your position, knowledge, experience and role in
the selected local government authority. We assume your opinions about local government
performance would be relevant in achieving the objectives of the study.
What will happen if I agree to participate in this research?
You will be agreeing to grant an interview to the principal researcher for a period of not
more than 2 hours or participate in a focus group discussion not exceeding 2 hours.
What happens to the data collected?
The conversation during the interviews and focus group discussions will be tape-recorded
and transcribed for analysis. The results will be presented as part of a thesis to the
University of Manchester for the award of PhD Degree. Other parts of this may be
published in peer-review journals. You are reminded that all the data gathered by the
researcher will be secured, properly protected and anonymised to prevent your identity
from being disclosed.
How is confidentiality maintained?
Neither the names of participants nor the institutions they work for will be mentioned in
the thesis that will be written with the data. All identifiers will be ignored and data access
will be restricted to the principal investigator and the supervisory team. In addition, all data
and related reports will be password protected and kept under lock and key. Data will be
destroyed within a period of ten years.
What happens if you do not want to take part or if you change your mind?
Your participation is entirely voluntary and so, you are entitled to change your mind and
exercise the right to decline participation at any time even if you do not want to give
reasons. Your right will be respected and at your request, all data collected from you will
be destroyed.
Will you be paid for participating in the research?

261
The study does not include the payment of allowances to participants. However,
respondents could indirectly derive satisfaction from the interaction since the issues to be
discussed will reflect their practical experiences, most of which are important for the
development of Ghana.
What is the duration of the research?
The research is expected to take 3 years to complete but the data collection is expected to
take up to 5 -7 months but your participation is limited to not more than 2 hours.
Where will the research be conducted?
In three Assemblies in the Greater Accra, Brong Ahafo and Northern regions but the
names of selected local governments cannot be disclosed to other participants outside the
jurisdiction of selected LG organisations.
What if something goes wrong?
If during the research process, there are issues, concerns, questions or if you want to make
a formal complaint about the conduct of the research do please contact the Head of the
Research Office, Christie Building, University of Manchester, Oxford Road, Manchester,
M13 9PL.
Contact for further information
I can be reached at the following address:
Institute for Development Policy and Management (IDPM)
School of Environment, Education and Development,
The Arthur Lewis Building, (1st floor), University of Manchester,
United Kingdom
M13 9PL
Email: [email protected]
Consent Form
If you are completely satisfied with the above information and willing to participate in this
study, kindly complete and sign this consent form.
I confirm that I have read and understood the attached information sheet on the study and
have been offered the opportunity to ask any questions.
I understand that my participation in the study is voluntary and that I am free to withdraw at
any time without giving a reason and without detriment to any service

262
I understand that the interviews will be audio-recorded
I agree to the use of anonymous quotes
I agree to take part in the above project
Name of participant
Date Signature
Name of person taking
consent
Date Signature
Appendix 2: Interview schedule for local government officials
1. How do you conceptualize local government performance? In other words, how do
you evaluate performance as a local government authority and what mechanisms do
you have in place to manage organisational performance? Probe
2. How do you formulate your key performance indicators? From your point of view,
what are the most important measures or indicators? Have there been any
significant recent changes in the way in which performance is thought about here?
Probe.
3. Who determines what the current set of performance measures should be? Do you
set your own indicators or, alternatively, how far are indicators imposed on from
outside?
4. How far, by whom, and for what purpose is performance information used?
5. What do you expect from the performance management system and have these
expectations been met?

263
6. Has the performance management system been able to address the core functions of
your local government authority? Please explain how. Do you think local residents
are satisfied with your performance as a local government authority?
7. What do you think are the drivers and impediments of organisational performance?
In other words, what do you think contributes to the performance of your MMDA
under the current performance regime? Which of the items identified above do you
think account for the achievement of your performance targets?
8. What are the outcomes of the prevailing performance management system? In other
words, what would you identify as the deliverables of existing performance
management practices? How does it relate to service delivery? Could you elaborate
on how it affects basic education, sanitation and waste management services?
9. Are performance data much discussed within the local authority, and who makes
the most use of them inside the local government?
10. Who (if anyone) makes the most use of them outside the agency? Can you please
give an example of their use?
11. As a local government functionary, are you satisfied with the implementation and
outcomes of the performance management system? Probe
12. What factors inhibit the implementation of the performance management system?
In other words, what challenges do you encounter in implementing the PMS?
13. What lessons have you learned from the implementation of the performance
management system? In what ways do you think the system could be improved?
Schedule for in depth interviews with Directors of Education
1. What is the total number of educational institutions under your directorate?
Categorize them according to hierarchical levels of education (general condition of
educational infrastructure; population of teachers; population of students/pupils;
teacher-pupil ratio, etc)
2. What are local government’s plans for the development of basic education in your
metropolis, municipality or district? Are these plans consistent with the needs of
basic education at the local level? Probe
3. How is the performance of basic education delivery measured and managed? How
is performance indicators formulated and measured for the delivery of basic
education?
4. How is the delivery of basic education influenced by local government’s
performance management practices? Probe
5. What do you expect from local government performance management practices?
6. Given what you may consider as the performance of basic education in your
district, have your expectations been met? Could you explain why or why not?
7. Is the staff of the Ghana Education Service satisfied with the local government
performance management system, and why?
8. How would the performance management regime enhance the delivery of basic
education?
9. What are the results, outcomes, lessons and challenges associated with the
prevailing performance management regime?

264
Questions for directors of sanitation and waste management departments
1. What are local government’s plans for the development of waste management in
your metropolis, municipality or district?
2. Are these plans consistent with the sanitation needs at the local level? Probe
3. How is the delivery of waste management services influenced by local
government’s performance management practices? Probe
4. How is the performance of waste management services measured and managed?
5. How is performance indicators formulated and measured for the delivery of waste
management services?
6. Given what you may consider as the performance of sanitary services in your
district, have your expectations been met? Could you explain why or why not?
7. How would the performance management regime improve the sanitation and waste
management in your district?
Questions for local government managers on the use of performance information for
decision making
1. How do you view performance management practices in your LG? Do you see it as
a management philosophy or an imposition from central government? Please
explain.
2. How far do you think the performance data reflects the really important aspects of
the LG’s ‘real’ performance?
3. What are the main external influences on how well the agency performs?
4. To what extent to you link LG goals, desired outcome or objectives to the type of
performance information you produce. In other words, will performance
information measure what they are meant to measure? And do they meet your
performance information needs.
5. How often do you subject conduct performance audits and reviews?
6. To what extent do you allow performance information to influence your decisions,
including those on service delivery? Please elaborate
7. Has performance management brought more advantages than disadvantages to your
outfit? Please elaborate
8. How often are you concerned about making performance information accessible to
CSOs, NGOs and the media?
Appendix 2: Schedule for focus group discussions
1. How is ‘‘Performance’’ conceived of and measured in the local government
context? If I say to you ‘‘the performance of your Assembly’’ what are the first
things that come to mind?
2. What do you expect from your Metropolitan, Municipal or District Assembly and
how do you think these expectations will be met?

265
3. What are your expectations of local government efforts on basic education
development/sanitation and waste management?
4. How responsive is your local government authority to demands for quality basic
education/ sanitation and waste management?
5. Considering the amount of resources available to your LG, do you think that basic
education provided by your local government authority should be excellent?
All of the time Most of the
time
Some of the
time
Rarely Never Do not know
6. Considering the amount of resources available to your LG, do you think you should
have an excellent quality household and city refuse collection service?
All of the time Most of the
time
Some of the
time
Rarely Never Do not know
7. Considering the amount of resources available to your LG, do you think that the
overall services provided by your local authority should be of excellent quality?
All of the time Most of the
time
Some of the
time
Rarely Never Do not know
8. How do you form your opinion about local government performance? And what is
your opinion about the performance of your local government? Could you please
elaborate? Probe
9. How satisfied are you with the performance of your local authority in terms of
developing basic education?
Very dissatisfied Dissatisfied Indifferent Satisfied Very satisfied Do not
know
10. How satisfied are you with the performance of your local authority’s household
refuse collection services?
Very dissatisfied Dissatisfied Indifferent Satisfied Very satisfied Do not know
11. How satisfied are you with the performance of your local authority’s overall
services?

266
Very dissatisfied Dissatisfied Indifferent Satisfied Very satisfied Do not know
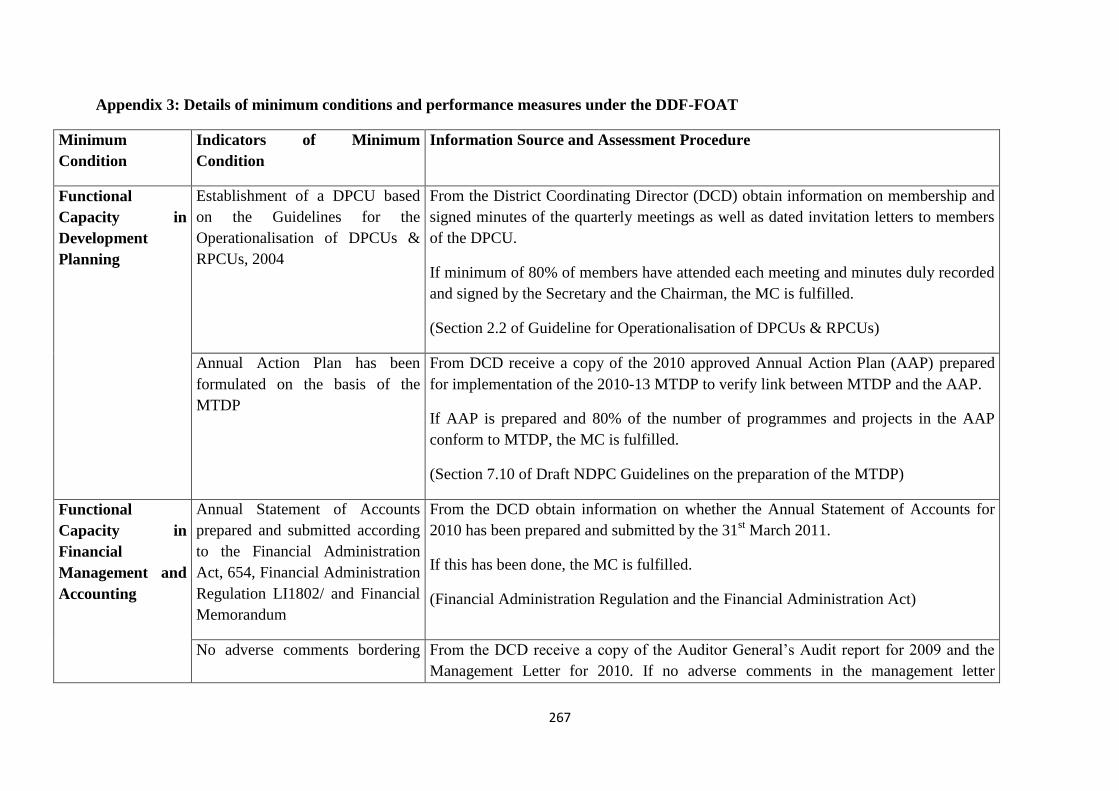
267
Appendix 3: Details of minimum conditions and performance measures under the DDF-FOAT
Minimum
Condition
Indicators of Minimum
Condition
Information Source and Assessment Procedure
Functional
Capacity in
Development
Planning
Establishment of a DPCU based
on the Guidelines for the
Operationalisation of DPCUs &
RPCUs, 2004
From the District Coordinating Director (DCD) obtain information on membership and
signed minutes of the quarterly meetings as well as dated invitation letters to members
of the DPCU.
If minimum of 80% of members have attended each meeting and minutes duly recorded
and signed by the Secretary and the Chairman, the MC is fulfilled.
(Section 2.2 of Guideline for Operationalisation of DPCUs & RPCUs)
Annual Action Plan has been
formulated on the basis of the
MTDP
From DCD receive a copy of the 2010 approved Annual Action Plan (AAP) prepared
for implementation of the 2010-13 MTDP to verify link between MTDP and the AAP.
If AAP is prepared and 80% of the number of programmes and projects in the AAP
conform to MTDP, the MC is fulfilled.
(Section 7.10 of Draft NDPC Guidelines on the preparation of the MTDP)
Functional
Capacity in
Financial
Management and
Accounting
Annual Statement of Accounts
prepared and submitted according
to the Financial Administration
Act, 654, Financial Administration
Regulation LI1802/ and Financial
Memorandum
From the DCD obtain information on whether the Annual Statement of Accounts for
2010 has been prepared and submitted by the 31st March 2011.
If this has been done, the MC is fulfilled.
(Financial Administration Regulation and the Financial Administration Act)
No adverse comments bordering From the DCD receive a copy of the Auditor General’s Audit report for 2009 and the
Management Letter for 2010. If no adverse comments in the management letter

268
on dishonesty in the Audit Report. bordering on dishonesty have been reported, the MC is fulfilled. ***
Preparation and submission of
monthly financial reports to
CAGD
From DCD obtain and review copies of monthly financial reports prepared and
submitted to CAGD.
If all twelve monthly financial reports for 2010 were prepared and submitted to CAGD
by 15 January 2011 and at least 9 reports were submitted within 15 days after the month
to which they relate, the MC is fulfilled
(FAR LI 1802, section 189)
Functional
Capacity in
Procurement
District procurement plan
available and prepared based on
Public Procurement Act (PPA)
663 of 2003 and the Guidelines
From the DCD receive information on the preparation and approval of the 2010
Procurement Plan by 30th
November 2009 and obtain quarterly updated plans on the
procurement plan for 2010.
If the plan and the review reports follow the PPA and guidelines, then MC is fulfilled.
(Part III Section 21, Sub section 1, PPA 663, 2003 on the preparation of procurement
plan)
Functional
Capacity of
Assembly
Assembly meeting according to
minimum demands
From the DCD receive a copy of invitation letters and signed minutes of meetings of the
General Assembly held in 2010.
If the assembly has met at least three times and minutes duly recorded and signed by
PM and DCD in 2010, the MC is fulfilled.
(Section 18 of Local Government Act, Act 462)
Plan
Implementation
Capacity
Progress Reports on the
implementation of activities in the
Annual Action Plan
From the DCD obtain information whether the MMDA has submitted quarterly and
annual progress reports on the implementation of the 2010 Annual Action Plan to the
Regional Coordinating Council (RCC).

269
If the quarterly reports for 2010 have been prepared and submitted by the 15th
of April,
15th
of July and 15th
of October and the annual report prepared and submitted before the
28 of February 2011, the MC is fulfilled.
(NDPC District M&E guideline 2009)
***Examples bordering on dishonesty are embezzlement, misappropriation, over invoicing for purchasing, inflation of contract sums, etc
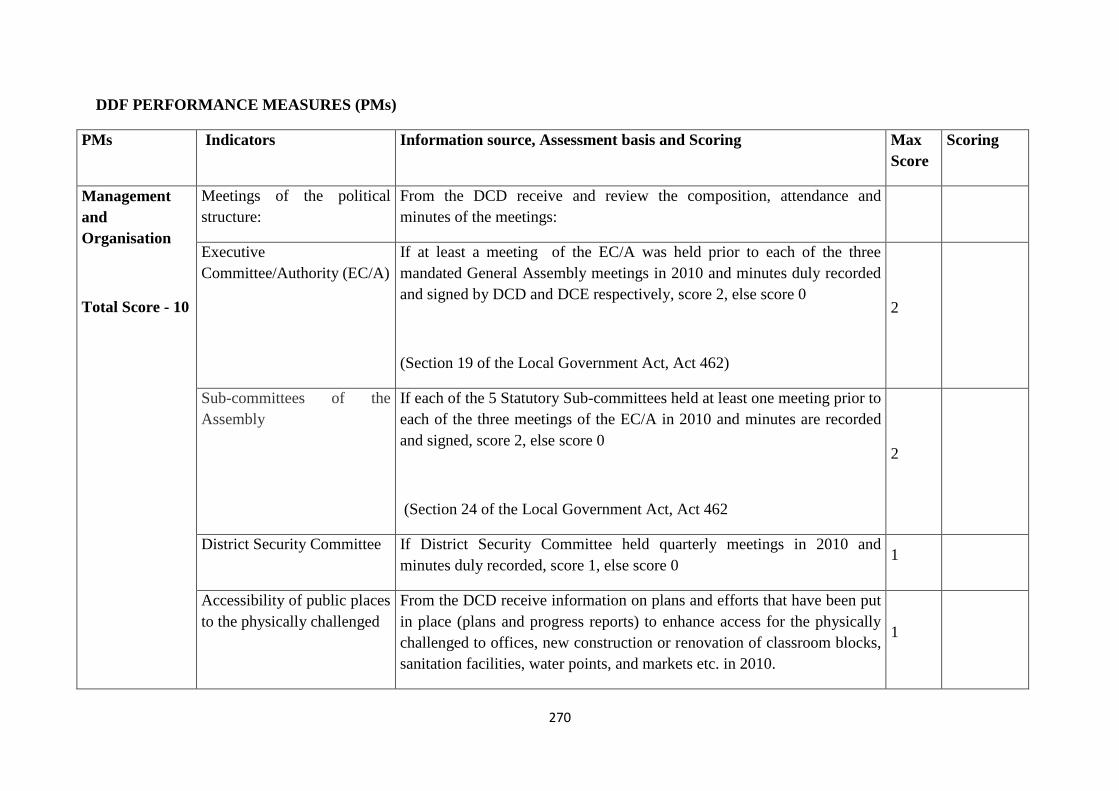
270
DDF PERFORMANCE MEASURES (PMs)
PMs Indicators Information source, Assessment basis and Scoring Max
Score
Scoring
Management
and
Organisation
Total Score - 10
Meetings of the political
structure:
From the DCD receive and review the composition, attendance and
minutes of the meetings:
Executive
Committee/Authority (EC/A)
If at least a meeting of the EC/A was held prior to each of the three
mandated General Assembly meetings in 2010 and minutes duly recorded
and signed by DCD and DCE respectively, score 2, else score 0
(Section 19 of the Local Government Act, Act 462)
2
Sub-committees of the
Assembly
If each of the 5 Statutory Sub-committees held at least one meeting prior to
each of the three meetings of the EC/A in 2010 and minutes are recorded
and signed, score 2, else score 0
(Section 24 of the Local Government Act, Act 462
2
District Security Committee If District Security Committee held quarterly meetings in 2010 and
minutes duly recorded, score 1, else score 0 1
Accessibility of public places
to the physically challenged
From the DCD receive information on plans and efforts that have been put
in place (plans and progress reports) to enhance access for the physically
challenged to offices, new construction or renovation of classroom blocks,
sanitation facilities, water points, and markets etc. in 2010.
1
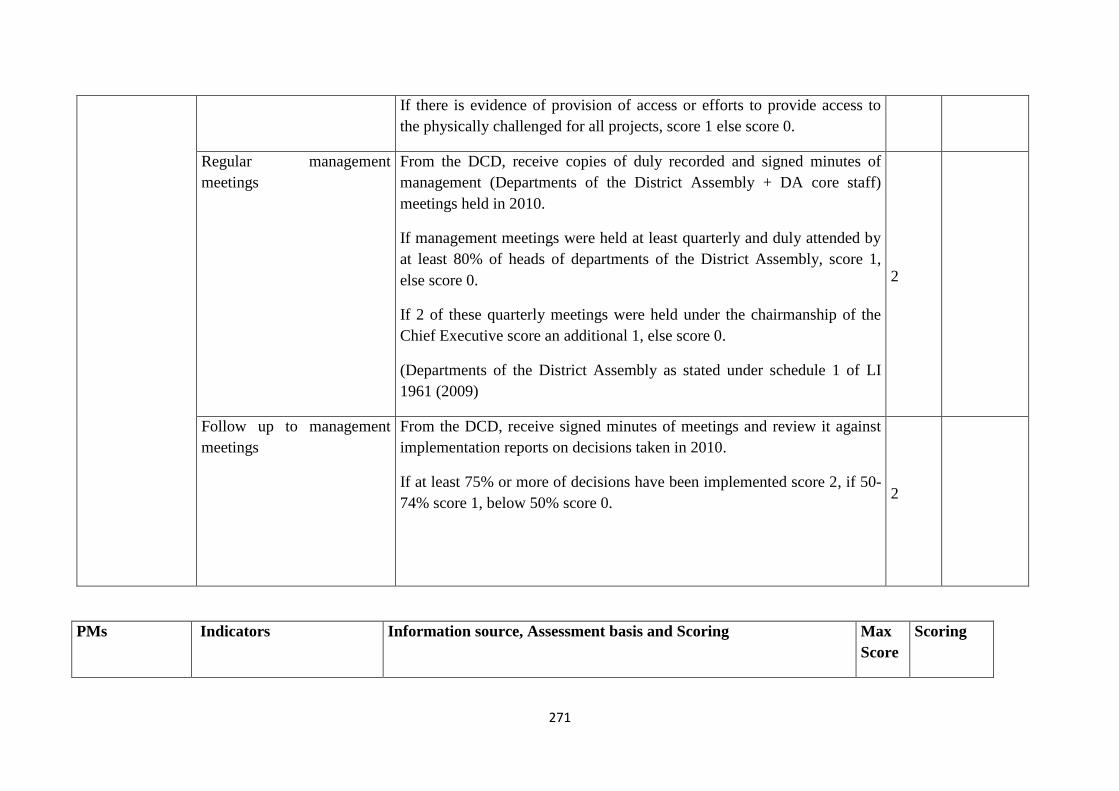
271
If there is evidence of provision of access or efforts to provide access to
the physically challenged for all projects, score 1 else score 0.
Regular management
meetings
From the DCD, receive copies of duly recorded and signed minutes of
management (Departments of the District Assembly + DA core staff)
meetings held in 2010.
If management meetings were held at least quarterly and duly attended by
at least 80% of heads of departments of the District Assembly, score 1,
else score 0.
If 2 of these quarterly meetings were held under the chairmanship of the
Chief Executive score an additional 1, else score 0.
(Departments of the District Assembly as stated under schedule 1 of LI
1961 (2009)
2
Follow up to management
meetings
From the DCD, receive signed minutes of meetings and review it against
implementation reports on decisions taken in 2010.
If at least 75% or more of decisions have been implemented score 2, if 50-
74% score 1, below 50% score 0. 2
PMs Indicators Information source, Assessment basis and Scoring Max
Score
Scoring

272
Transparency,
Openness and
Accountability
Total score - 12
Establishment and
functionality of the Public
Relations and Complaints
Committee (PRCC)
From the DCD receive information on the establishment (secretariat
with staff) and operationalization, list of empanelled for the purpose of
complaints received, complaints received and actions taken.
If there is a secretariat/desk with staff, score 1
If files/records are available on complaints , score an additional 1
(Section 27 of the Local Government Act, Act 462)
2
Information to the Public From the DCD receive information on evidence of dissemination of the
Assembly’s activities to the public (e.g. public hearings, consultations,
publications, available newsletters, letters of notice boards, receipt for
radio discussions and announcements).
If evidence of dissemination to public exist score 1, else score 0.
1
Publication of annual
statement of accounts
(LGA Section 125)
From the DCD receive documentation of publication of the 2010 annual
statement of accounts which should include the following:
Balance sheet
Revenue and expenditure statement
cash flow statement
Notes to the account
If copies of 2010 statement of accounts have been given to DA
members, score 1, and if published on notice board score an additional
3
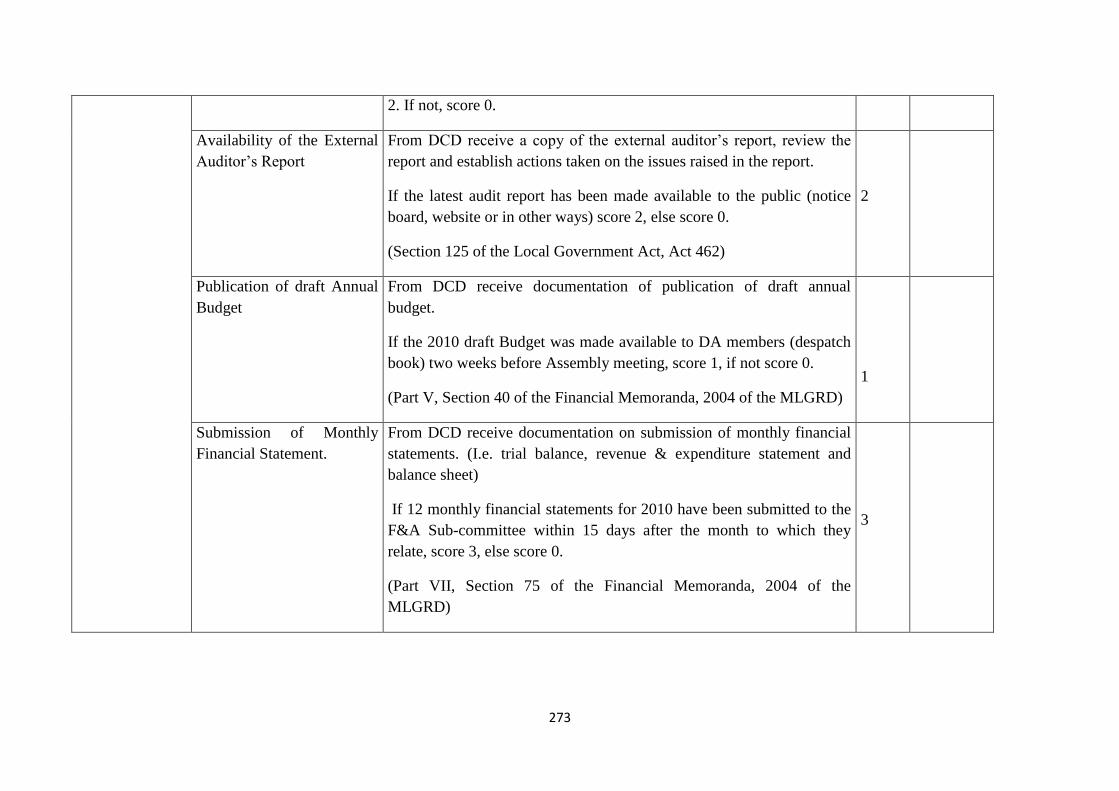
273
2. If not, score 0.
Availability of the External
Auditor’s Report
From DCD receive a copy of the external auditor’s report, review the
report and establish actions taken on the issues raised in the report.
If the latest audit report has been made available to the public (notice
board, website or in other ways) score 2, else score 0.
(Section 125 of the Local Government Act, Act 462)
2
Publication of draft Annual
Budget
From DCD receive documentation of publication of draft annual
budget.
If the 2010 draft Budget was made available to DA members (despatch
book) two weeks before Assembly meeting, score 1, if not score 0.
(Part V, Section 40 of the Financial Memoranda, 2004 of the MLGRD)
1
Submission of Monthly
Financial Statement.
From DCD receive documentation on submission of monthly financial
statements. (I.e. trial balance, revenue & expenditure statement and
balance sheet)
If 12 monthly financial statements for 2010 have been submitted to the
F&A Sub-committee within 15 days after the month to which they
relate, score 3, else score 0.
(Part VII, Section 75 of the Financial Memoranda, 2004 of the
MLGRD)
3
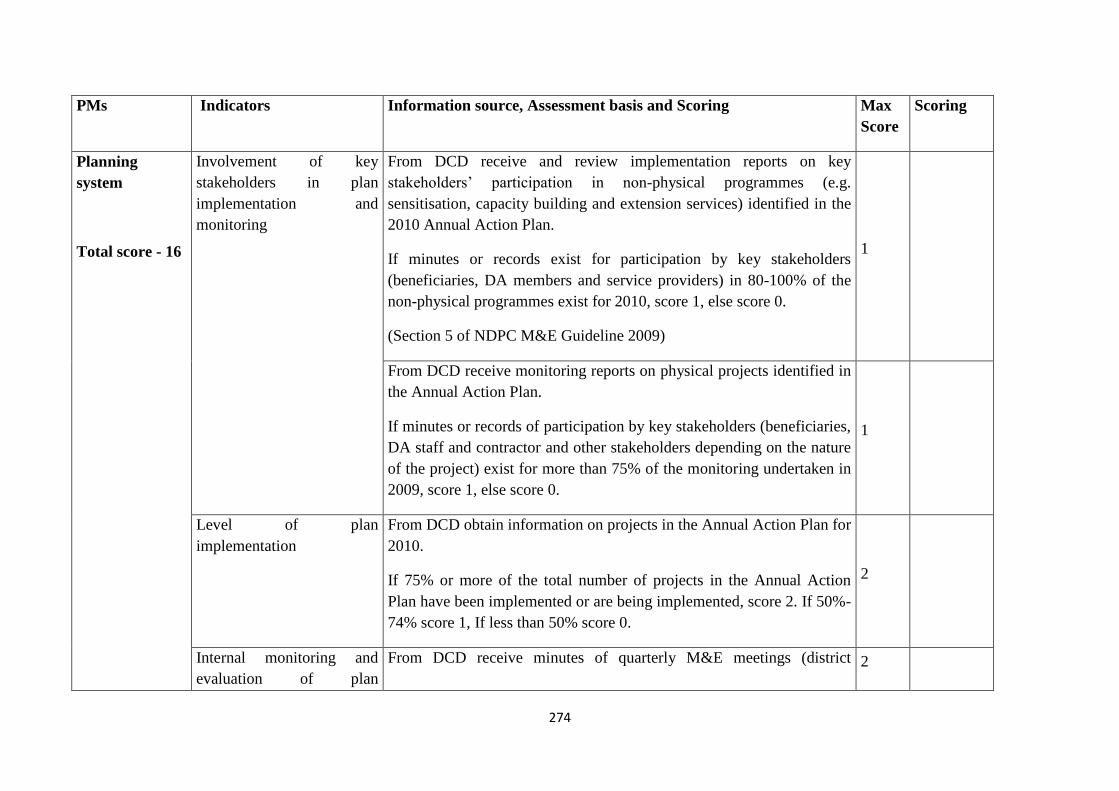
274
PMs Indicators Information source, Assessment basis and Scoring Max
Score
Scoring
Planning
system
Total score - 16
Involvement of key
stakeholders in plan
implementation and
monitoring
From DCD receive and review implementation reports on key
stakeholders’ participation in non-physical programmes (e.g.
sensitisation, capacity building and extension services) identified in the
2010 Annual Action Plan.
If minutes or records exist for participation by key stakeholders
(beneficiaries, DA members and service providers) in 80-100% of the
non-physical programmes exist for 2010, score 1, else score 0.
(Section 5 of NDPC M&E Guideline 2009)
1
From DCD receive monitoring reports on physical projects identified in
the Annual Action Plan.
If minutes or records of participation by key stakeholders (beneficiaries,
DA staff and contractor and other stakeholders depending on the nature
of the project) exist for more than 75% of the monitoring undertaken in
2009, score 1, else score 0.
1
Level of plan
implementation
From DCD obtain information on projects in the Annual Action Plan for
2010.
If 75% or more of the total number of projects in the Annual Action
Plan have been implemented or are being implemented, score 2. If 50%-
74% score 1, If less than 50% score 0.
2
Internal monitoring and
evaluation of plan
From DCD receive minutes of quarterly M&E meetings (district 2
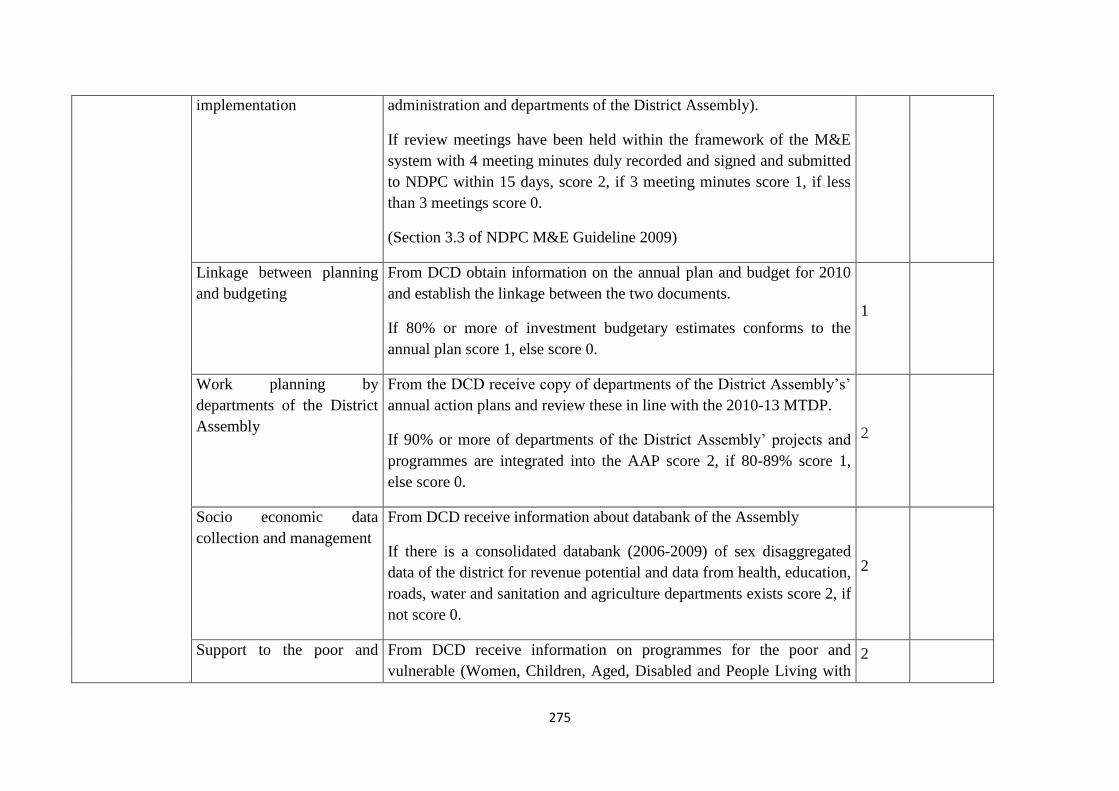
275
implementation administration and departments of the District Assembly).
If review meetings have been held within the framework of the M&E
system with 4 meeting minutes duly recorded and signed and submitted
to NDPC within 15 days, score 2, if 3 meeting minutes score 1, if less
than 3 meetings score 0.
(Section 3.3 of NDPC M&E Guideline 2009)
Linkage between planning
and budgeting
From DCD obtain information on the annual plan and budget for 2010
and establish the linkage between the two documents.
If 80% or more of investment budgetary estimates conforms to the
annual plan score 1, else score 0.
1
Work planning by
departments of the District
Assembly
From the DCD receive copy of departments of the District Assembly’s’
annual action plans and review these in line with the 2010-13 MTDP.
If 90% or more of departments of the District Assembly’ projects and
programmes are integrated into the AAP score 2, if 80-89% score 1,
else score 0.
2
Socio economic data
collection and management
From DCD receive information about databank of the Assembly
If there is a consolidated databank (2006-2009) of sex disaggregated
data of the district for revenue potential and data from health, education,
roads, water and sanitation and agriculture departments exists score 2, if
not score 0.
2
Support to the poor and From DCD receive information on programmes for the poor and
vulnerable (Women, Children, Aged, Disabled and People Living with 2
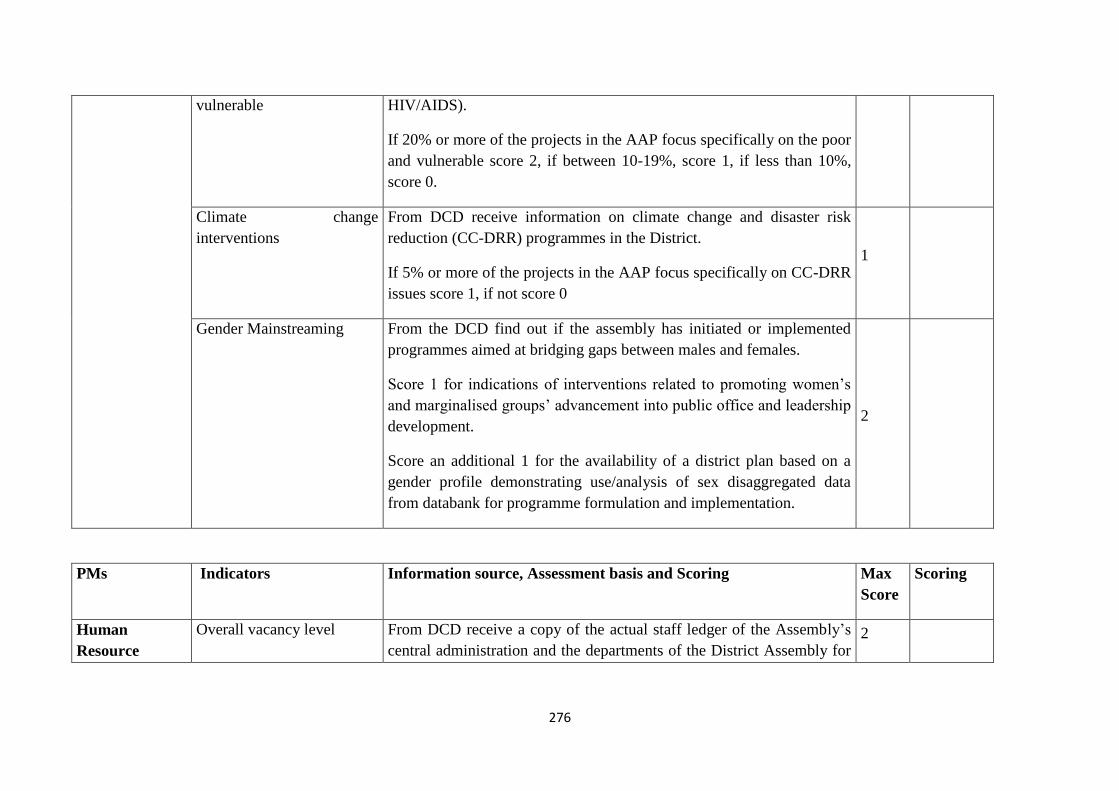
276
vulnerable
HIV/AIDS).
If 20% or more of the projects in the AAP focus specifically on the poor
and vulnerable score 2, if between 10-19%, score 1, if less than 10%,
score 0.
Climate change
interventions
From DCD receive information on climate change and disaster risk
reduction (CC-DRR) programmes in the District.
If 5% or more of the projects in the AAP focus specifically on CC-DRR
issues score 1, if not score 0
1
Gender Mainstreaming
From the DCD find out if the assembly has initiated or implemented
programmes aimed at bridging gaps between males and females.
Score 1 for indications of interventions related to promoting women’s
and marginalised groups’ advancement into public office and leadership
development.
Score an additional 1 for the availability of a district plan based on a
gender profile demonstrating use/analysis of sex disaggregated data
from databank for programme formulation and implementation.
2
PMs Indicators Information source, Assessment basis and Scoring Max
Score
Scoring
Human
Resource
Overall vacancy level From DCD receive a copy of the actual staff ledger of the Assembly’s
central administration and the departments of the District Assembly for 2
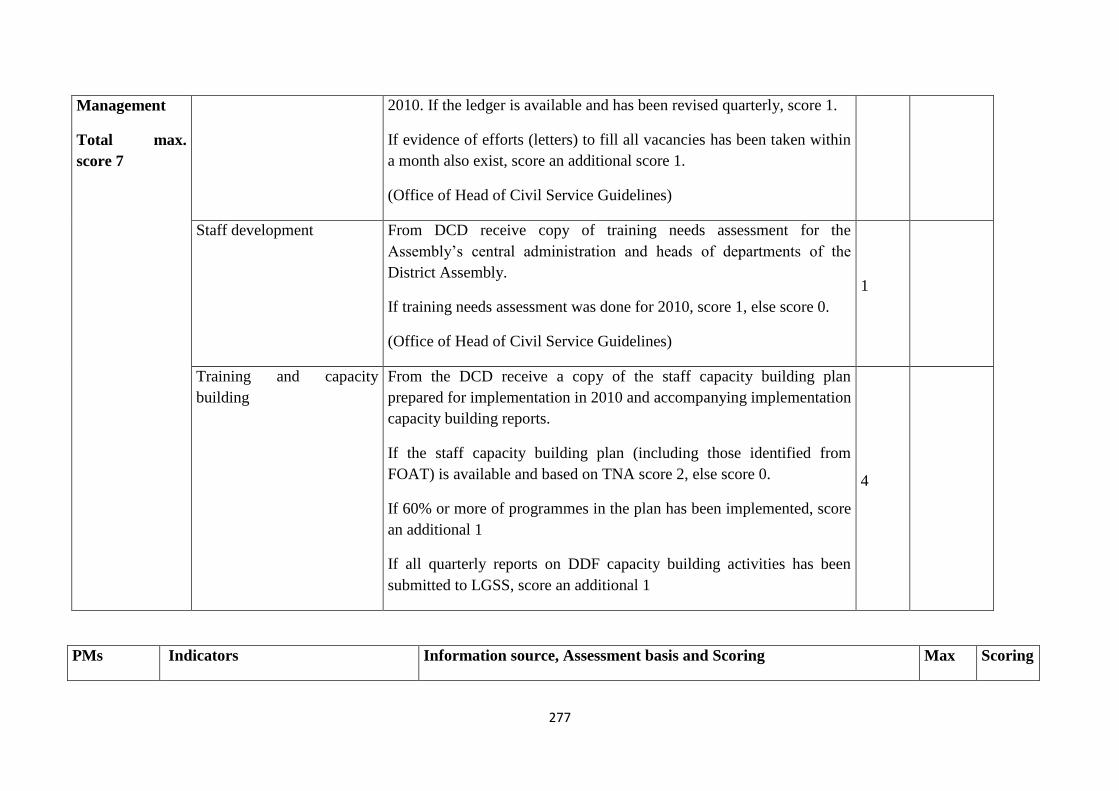
277
Management
Total max.
score 7
2010. If the ledger is available and has been revised quarterly, score 1.
If evidence of efforts (letters) to fill all vacancies has been taken within
a month also exist, score an additional score 1.
(Office of Head of Civil Service Guidelines)
Staff development From DCD receive copy of training needs assessment for the
Assembly’s central administration and heads of departments of the
District Assembly.
If training needs assessment was done for 2010, score 1, else score 0.
(Office of Head of Civil Service Guidelines)
1
Training and capacity
building
From the DCD receive a copy of the staff capacity building plan
prepared for implementation in 2010 and accompanying implementation
capacity building reports.
If the staff capacity building plan (including those identified from
FOAT) is available and based on TNA score 2, else score 0.
If 60% or more of programmes in the plan has been implemented, score
an additional 1
If all quarterly reports on DDF capacity building activities has been
submitted to LGSS, score an additional 1
4
PMs Indicators Information source, Assessment basis and Scoring Max Scoring

278
Score
Relationshi
p with sub
structures
Total max.
score 6
Revenue sharing between Assembly
and sub structures (transfer to sub-
districts 50% of ceded revenues
collected in sub structures)
From the DCD, obtain information (payment voucher/receipts) on transfer
or remittance of 50% of revenue collected to sub structures on behalf of the
District Assembly.
If the MMDA has evidence on remittance of funds to 50% or more of sub
structures score 3, else score 0.
(Legislative Instrument 1967)
3
Extent to which sub district structures
have been mandated to perform
functions outlined in LI 1967
From the DCD receive (quarterly??) progress report for 2010 from the sub-
structures on the implementation of their mandated functions, and the extent
to which these functions are being performed.
If at least one quarterly report for 2010 is available from at least 50% of the
sub-structures, score 3
(Legislative Instrument 1967)
3
PMs Indicators Information source, Assessment basis and Scoring Max
Score
Scoring
Financial
Management
and Auditing
Functionality of Budget
Committee
From the DCD receive information on the composition and functionality of the
Budget Committee.
If Budget Committee is functional and duly recorded and signed minutes of 4
meetings of 75% of members are available and demonstrate consideration and
1
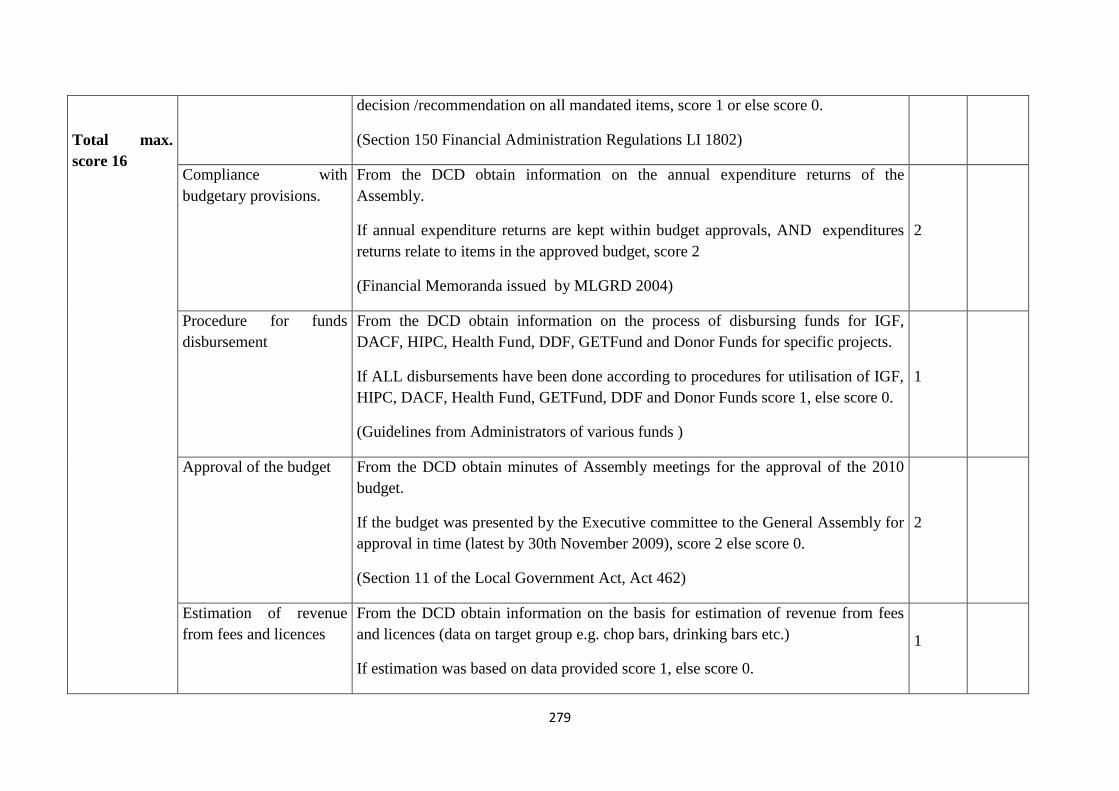
279
Total max.
score 16
decision /recommendation on all mandated items, score 1 or else score 0.
(Section 150 Financial Administration Regulations LI 1802)
Compliance with
budgetary provisions.
From the DCD obtain information on the annual expenditure returns of the
Assembly.
If annual expenditure returns are kept within budget approvals, AND expenditures
returns relate to items in the approved budget, score 2
(Financial Memoranda issued by MLGRD 2004)
2
Procedure for funds
disbursement
From the DCD obtain information on the process of disbursing funds for IGF,
DACF, HIPC, Health Fund, DDF, GETFund and Donor Funds for specific projects.
If ALL disbursements have been done according to procedures for utilisation of IGF,
HIPC, DACF, Health Fund, GETFund, DDF and Donor Funds score 1, else score 0.
(Guidelines from Administrators of various funds )
1
Approval of the budget From the DCD obtain minutes of Assembly meetings for the approval of the 2010
budget.
If the budget was presented by the Executive committee to the General Assembly for
approval in time (latest by 30th November 2009), score 2 else score 0.
(Section 11 of the Local Government Act, Act 462)
2
Estimation of revenue
from fees and licences
From the DCD obtain information on the basis for estimation of revenue from fees
and licences (data on target group e.g. chop bars, drinking bars etc.)
If estimation was based on data provided score 1, else score 0.
1
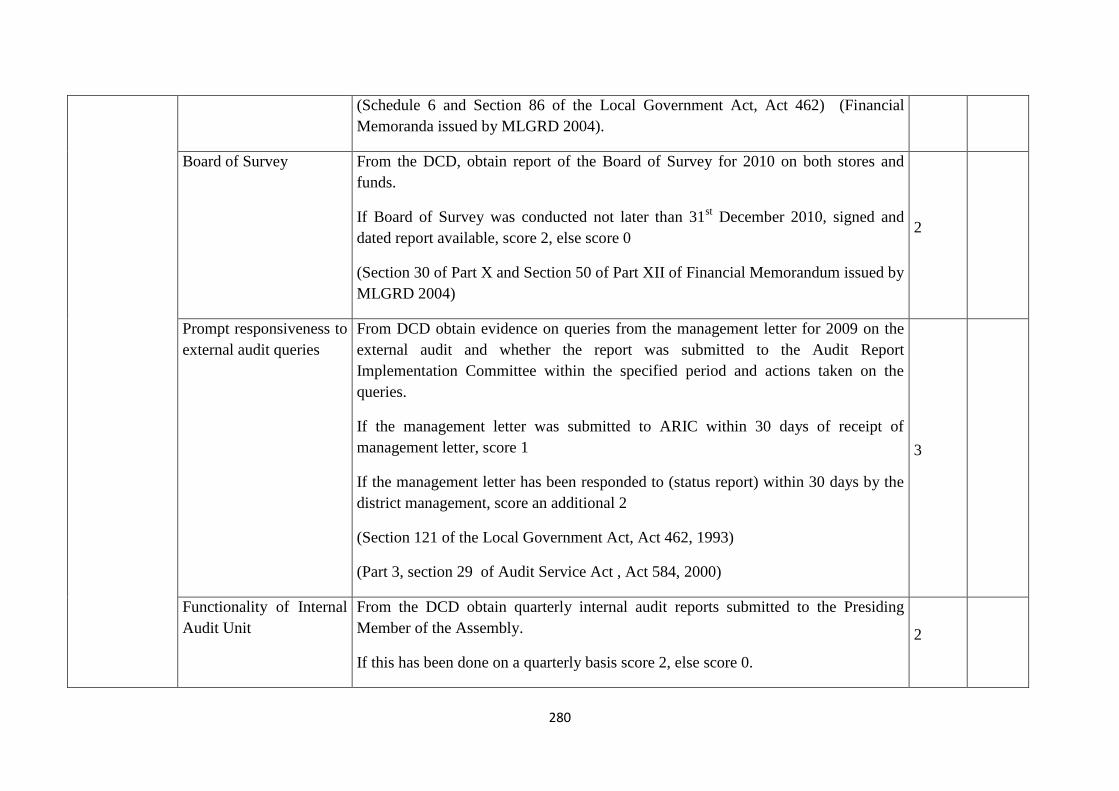
280
(Schedule 6 and Section 86 of the Local Government Act, Act 462) (Financial
Memoranda issued by MLGRD 2004).
Board of Survey From the DCD, obtain report of the Board of Survey for 2010 on both stores and
funds.
If Board of Survey was conducted not later than 31st December 2010, signed and
dated report available, score 2, else score 0
(Section 30 of Part X and Section 50 of Part XII of Financial Memorandum issued by
MLGRD 2004)
2
Prompt responsiveness to
external audit queries
From DCD obtain evidence on queries from the management letter for 2009 on the
external audit and whether the report was submitted to the Audit Report
Implementation Committee within the specified period and actions taken on the
queries.
If the management letter was submitted to ARIC within 30 days of receipt of
management letter, score 1
If the management letter has been responded to (status report) within 30 days by the
district management, score an additional 2
(Section 121 of the Local Government Act, Act 462, 1993)
(Part 3, section 29 of Audit Service Act , Act 584, 2000)
3
Functionality of Internal
Audit Unit
From the DCD obtain quarterly internal audit reports submitted to the Presiding
Member of the Assembly.
If this has been done on a quarterly basis score 2, else score 0.
2
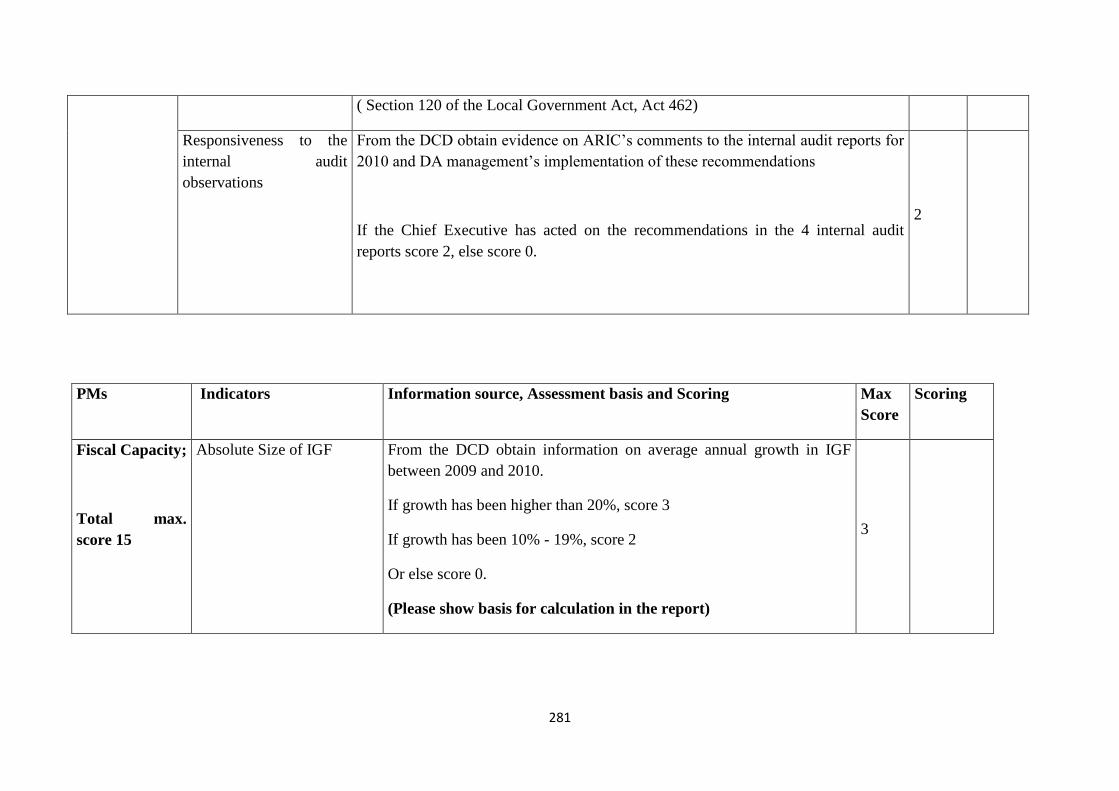
281
( Section 120 of the Local Government Act, Act 462)
Responsiveness to the
internal audit
observations
From the DCD obtain evidence on ARIC’s comments to the internal audit reports for
2010 and DA management’s implementation of these recommendations
If the Chief Executive has acted on the recommendations in the 4 internal audit
reports score 2, else score 0.
2
PMs Indicators Information source, Assessment basis and Scoring Max
Score
Scoring
Fiscal Capacity;
Total max.
score 15
Absolute Size of IGF
From the DCD obtain information on average annual growth in IGF
between 2009 and 2010.
If growth has been higher than 20%, score 3
If growth has been 10% - 19%, score 2
Or else score 0.
(Please show basis for calculation in the report)
3
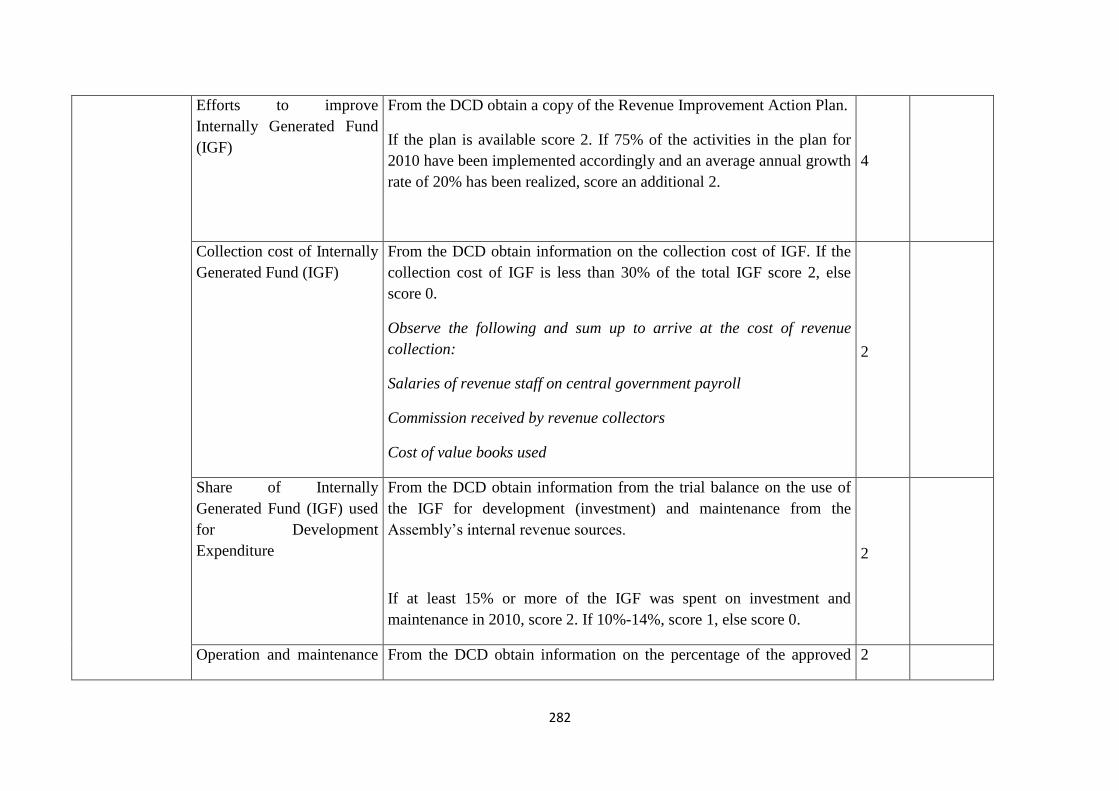
282
Efforts to improve
Internally Generated Fund
(IGF)
From the DCD obtain a copy of the Revenue Improvement Action Plan.
If the plan is available score 2. If 75% of the activities in the plan for
2010 have been implemented accordingly and an average annual growth
rate of 20% has been realized, score an additional 2.
4
Collection cost of Internally
Generated Fund (IGF)
From the DCD obtain information on the collection cost of IGF. If the
collection cost of IGF is less than 30% of the total IGF score 2, else
score 0.
Observe the following and sum up to arrive at the cost of revenue
collection:
Salaries of revenue staff on central government payroll
Commission received by revenue collectors
Cost of value books used
2
Share of Internally
Generated Fund (IGF) used
for Development
Expenditure
From the DCD obtain information from the trial balance on the use of
the IGF for development (investment) and maintenance from the
Assembly’s internal revenue sources.
If at least 15% or more of the IGF was spent on investment and
maintenance in 2010, score 2. If 10%-14%, score 1, else score 0.
2
Operation and maintenance From the DCD obtain information on the percentage of the approved 2
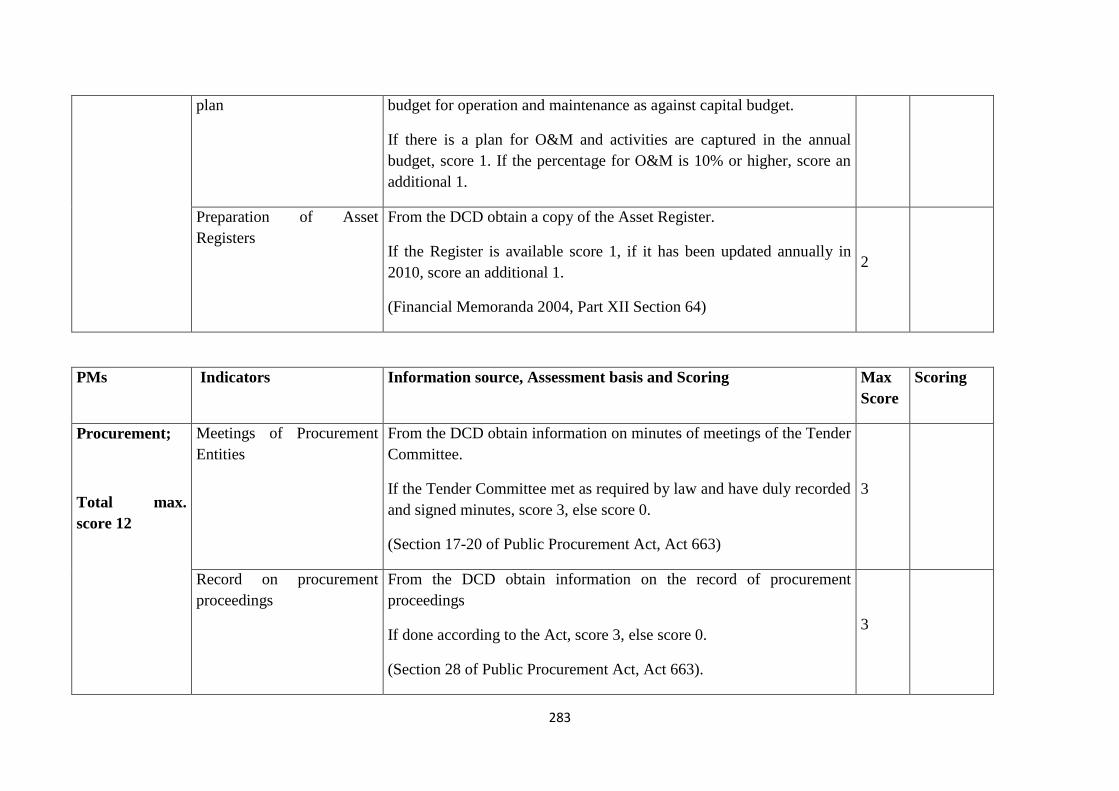
283
plan budget for operation and maintenance as against capital budget.
If there is a plan for O&M and activities are captured in the annual
budget, score 1. If the percentage for O&M is 10% or higher, score an
additional 1.
Preparation of Asset
Registers
From the DCD obtain a copy of the Asset Register.
If the Register is available score 1, if it has been updated annually in
2010, score an additional 1.
(Financial Memoranda 2004, Part XII Section 64)
2
PMs Indicators Information source, Assessment basis and Scoring Max
Score
Scoring
Procurement;
Total max.
score 12
Meetings of Procurement
Entities
From the DCD obtain information on minutes of meetings of the Tender
Committee.
If the Tender Committee met as required by law and have duly recorded
and signed minutes, score 3, else score 0.
(Section 17-20 of Public Procurement Act, Act 663)
3
Record on procurement
proceedings
From the DCD obtain information on the record of procurement
proceedings
If done according to the Act, score 3, else score 0.
(Section 28 of Public Procurement Act, Act 663).
3
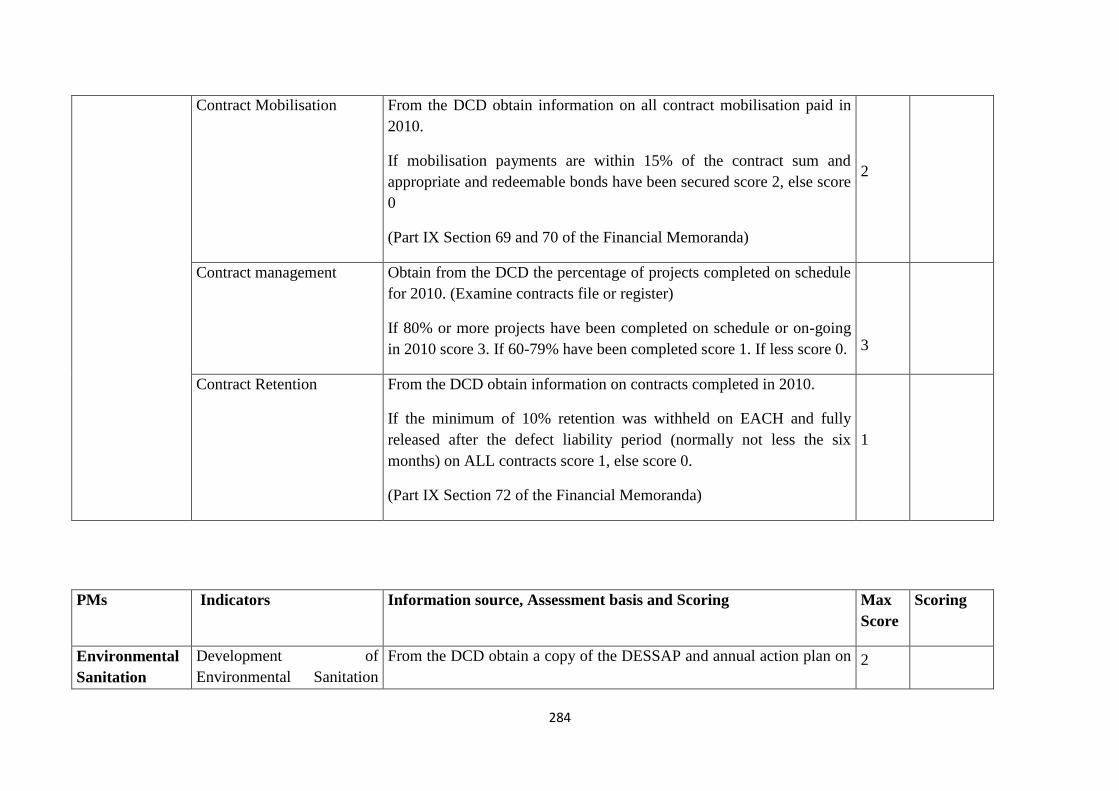
284
Contract Mobilisation From the DCD obtain information on all contract mobilisation paid in
2010.
If mobilisation payments are within 15% of the contract sum and
appropriate and redeemable bonds have been secured score 2, else score
0
(Part IX Section 69 and 70 of the Financial Memoranda)
2
Contract management Obtain from the DCD the percentage of projects completed on schedule
for 2010. (Examine contracts file or register)
If 80% or more projects have been completed on schedule or on-going
in 2010 score 3. If 60-79% have been completed score 1. If less score 0.
3
Contract Retention From the DCD obtain information on contracts completed in 2010.
If the minimum of 10% retention was withheld on EACH and fully
released after the defect liability period (normally not less the six
months) on ALL contracts score 1, else score 0.
(Part IX Section 72 of the Financial Memoranda)
1
PMs Indicators Information source, Assessment basis and Scoring Max
Score
Scoring
Environmental
Sanitation
Development of
Environmental Sanitation
From the DCD obtain a copy of the DESSAP and annual action plan on 2
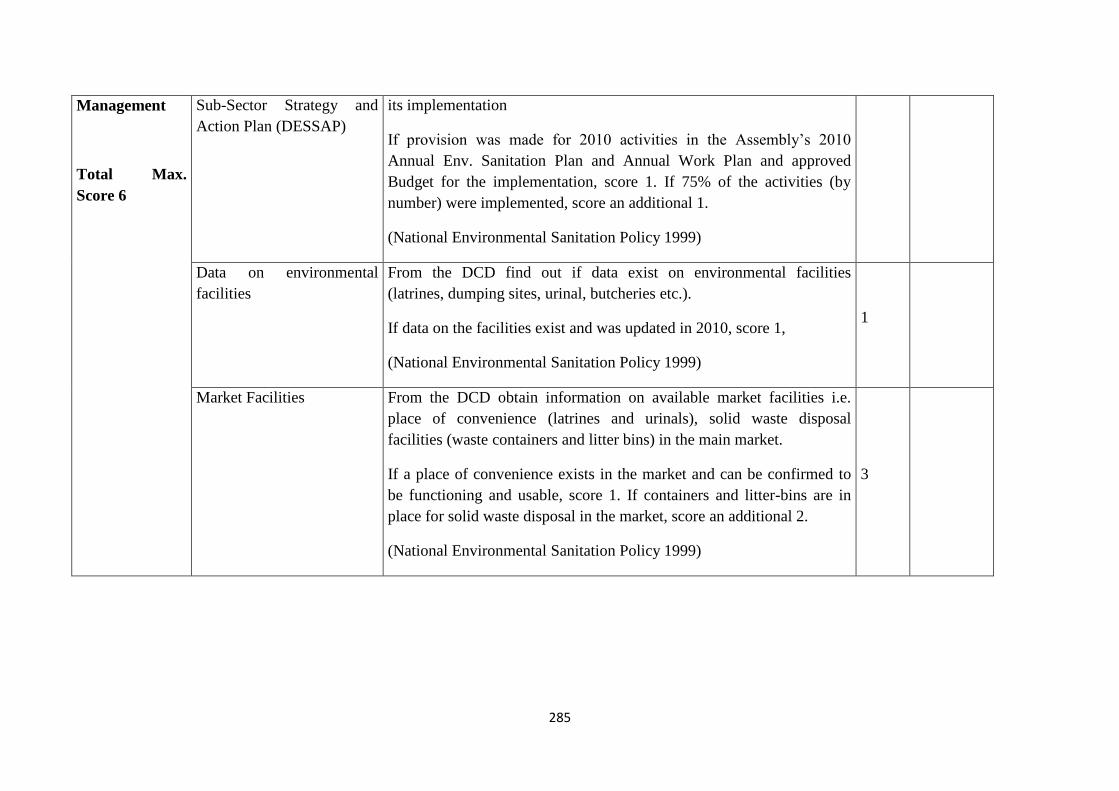
285
Management
Total Max.
Score 6
Sub-Sector Strategy and
Action Plan (DESSAP)
its implementation
If provision was made for 2010 activities in the Assembly’s 2010
Annual Env. Sanitation Plan and Annual Work Plan and approved
Budget for the implementation, score 1. If 75% of the activities (by
number) were implemented, score an additional 1.
(National Environmental Sanitation Policy 1999)
Data on environmental
facilities
From the DCD find out if data exist on environmental facilities
(latrines, dumping sites, urinal, butcheries etc.).
If data on the facilities exist and was updated in 2010, score 1,
(National Environmental Sanitation Policy 1999)
1
Market Facilities
From the DCD obtain information on available market facilities i.e.
place of convenience (latrines and urinals), solid waste disposal
facilities (waste containers and litter bins) in the main market.
If a place of convenience exists in the market and can be confirmed to
be functioning and usable, score 1. If containers and litter-bins are in
place for solid waste disposal in the market, score an additional 2.
(National Environmental Sanitation Policy 1999)
3

Appendix 4: List of conferences and workshops attended during PhD study
1. Africa Research Group Workshop, Nottingham Business School. University of
Nottingham. 24th
October, 2011. Nottingham, United Kingdom.
2. Discourse Analysis Workshop. 17th
May, 2012. Samuel Alexander Building,
University of Manchester.
3. School of Environment and Development (SED) Post Graduate Research Conference
held at the Humanities Bridgeford Street Building, University of Manchester, UK.
May 14th
, 2012.
4. London Centre for Social Studies PhD Conference 2013 Methodological Choices and
Challenges. Friday 19 April 2013 King’s College London, Strand London.
5. SEED Postgraduate Research Conference 2013 School of Education, Environment
and Development (SEED) held at the Humanities Bridgeford Street Building,
University of Manchester, UK. Wednesday, 1st May, 2013.
6. Commonwealth Local Government Forum Research Colloquium, 13-14th
May, 2013.
Uganda Management Institute (UMI), Kampala.
7. 7th
Commonwealth Local Government Conference, Developmental Local
Government: Putting Local Government at the heart of Development. 14-17th
May,
2013, Kampala, Uganda.
8. 3rd
International Conference on Management in Africa. Hosted by the Centre for
Organizations in Development, Manchester University Africa Research Group and,
Nottingham University Business School. 5-6th
September 2013, Humanities
Bridgeford Street, University of Manchester.

287
Seminar and conference presentations
1. Centre for Continuing Education and Inter-disciplinary Research (CCEIR), Internal
Quarterly Seminars, 30th
October, 2012, University for Development Studies, Tamale,
Ghana. Paper Presented: Towards A Reflexive Approach to Interviewing in
Organizational Research.
2. Centre for Continuing Education and Inter-disciplinary Research (CCEIR), Internal
Quarterly Seminars, 31st October, 2012, University for Development Studies, Tamale,
Ghana. Paper Presented: Performance Appraisal or Praising Performance? The
Culture of Rhetoric in Performance Management in Ghana Civil Service
3. Bawole J, Hossain F, Mamman A, Bukari H & Sanyare F. Does promotion come from
above? Superstition and Spirituality in workplace promotion in Ghana Civil Service.
Paper presented at the Second International Conference on HRM and the
Management of Organizations in Africa. Nottingham, UK. 6-7th
September, 2012.
4. Commonwealth Local Government Forum Research Colloquium, 13-14th
May, 2013.
Uganda Management Institute (UMI), Kampala. Title of Paper Presented: Looking
back, moving forward: Towards Local Government Performance Improvement in
Ghana.
5. 3rd
International Conference on Management in Africa. Hosted by the Centre for
Organizations in Development, Manchester University Africa Research Group and,
Nottingham University Business School. 5-6th
September 2013, Humanities
Bridgeford Street, University of Manchester. Titles of papers: Where is the
Institutional Memory? A tale of Local Government Employees in Ghana and Looking
Back, Moving Forward: Towards local government performance improvement in
Ghana.
6. 18th
Annual International Research Society for Public Management (IRSPM)
Conference, 9th
-11th
April, 2014, Carleton University, Ottawa, Canada. Paper
presented: Performance assessment of local government authorities: perspectives
from Ghana.

288
Appendix 5: Skills training workshops attended
Unit Code Title Event Date Event Venue
SAHC81011
Methods in Transcription &
Conversation Analysis 21/02/2013 Mansfield Cooper 2.04
LBRYS0130
Beginners Reference Management
with Endnote: Faculty of
Humanities 17/04/2012
Blue 4 Teaching Suite, Main
Library
HUMNS8880 Preparing for Your Review Panel 13/03/2012 Roscoe 3.9
LBRYS0130
Beginners Reference Management
with Endnote: Faculty of
Humanities 05/03/2012
Blue 4 Teaching Suite, Main
Library
TTL10
Graduate Teaching Assistant
Training 24/01/2012
STDU Training Suite,
Humanities Bridgeford Street
HUMNS8340 Presenting a Research Poster 14/12/2011 Roscoe 3.1
LBRYS0110 Keeping up to Date 25/11/2011
Blue 4 Teaching Suite, Main
Library
RSCHS0070
Searching the literature with
Scopus 23/11/2011
Blue 4 Teaching Suite, Main
Library
HUMNS8800
Graduate Teaching Assistant
(GTA) Training 21/11/2011
STDU, Humanities Bridgeford
Street (2nd Floor
HUMNS8070 Academic Writing 4 15/11/2011 Simon 4A (4.63)
LBRYS0170
Lunchbite: keeping up to date with
RSS feeds 10/11/2011
Blue 4 Teaching Suite, Main
Library
HUMNS8060 Academic Writing 3 08/11/2011 Simon 4A (4.63)
HUMNS8050 Academic Writing 2 01/11/2011 Simon 4A (4.63)
HUMNS8760 Presentation Skills for Beginners 27/10/2011 Simon 2(2.39)
HUMNS8040 Academic Writing 1 25/10/2011 Simon 4A (4.63)