performance management scorecard ...communityactionmidne.com/wp-content/uploads/2017/02/...in...
TRANSCRIPT

PERFORMANCE MANAGEMENT SCORECARD
A performance measurement instrument for Community Action Agencies
Revised: 02/2017
Page | 1

PERFORMANCE MANAGEMENT SCORECARD
The creation of the Performance Management Scorecard (Scorecard) was fostered by Mid’s involvement in the Pathways process. We felt that we needed a way to evaluate the “health or condition” of the various agency programs. While all programs are not created equal in their ability to pay a living wage; their propensity for on-the-job injuries; or to provide additional training hours. This scorecard was not meant to be a total reflection of a Program Director’s ability, but more a report of the condition of the program. The process continues to be a work in progress, and we hope that others may use it as a basis for establishing their own versions. Community Action Partnership of Mid-Nebraska (Mid) welcomes your suggestions and comments. You can visit us at www.communityactionmidne.com or email Jackie Harpst [email protected] or Carrie Eurek [email protected], if you have any questions or comments.
WHY A PERFORMANCE MANAGEMENT SCORECARD?
1. It assists in meeting the Organizational Standards, Pathways and Award for Excellence requirements.
2. It provides benchmarks that can be used to evaluate the program’s and agency’s
core weaknesses. 3. It provides benchmarks that can be used to evaluate the program’s and agency’s
core strengths. 4. It promotes greater efficiencies in support services (support staff should not have to
be continuously following up on requirements). 5. It fosters a spirit of competition. (No one likes to be last) 6. It can provide a partial basis for managerial evaluations. 7. It provides a measure of risk assessment in daily operations. 8. It provides a measure of assurance to funding sources (existing and potential) that
additional internal controls are in place. 9. Keeps the Executive Director/CEO informed. 10. Keeps the Board of Directors informed.
Page | 2

PERFORMANCE MANAGEMENT SCORECARD INTERPRETATION
The Scorecard looks at the non-subjective elements of what makes each of Mid’s programs function as follows:
1. Under the Category heading the basic elements for review are listed. A base point scale (Base) was established that is weighted by the interpreted value of the item to Mid’s overall operation. For instance, #17. Budget: Revenues meet or exceed expenditures has a base point value of 30; whereas, #4. Accidents involving staff injuries has a base point value of 10. This is not to say that staff accidents are not an important portion of Mid’s operation, but realistically the importance to the overall program function is not as important as budgetary considerations.
2. The Point is the multiplier based on how well the program scored for each category. If we looked at # 1. Job descriptions current and the program had 100% of their job descriptions current, they would have a point of 3. We would take that 3 and multiply it by the Base which in this case is 20. The resulting score would be 60. This would continue through each of the categories.
3. If a program does not have to achieve any results in a category, they may receive a non-applicable (n/a) score in that category. For instance in our agency, Public Transportation does not keep customer files, thus #11. Customer File review is not-applicable. This is an adjustment from the “Total Possible” points.
4. To recap, the determination of the Base scale was our interpretation of value to the overall function of the agency. This is not to say that an agency should not change this to fit their individual situation. For instance, if your “mod” factor under Worker’s Comp happens to be out of control you may want to rate # 4. Accidents involving staff injuries at a higher Base value.
As you can see, there is not much flexibility in the timelines or the achievement of the elements for the score. These elements are essential to our core operational strength and they need to be strictly followed. Categories 6, 11, 12, and 15 rely on internal control review forms which are included at the end of this document for your reference. For instance, #11. Customer File review the reviewer looks at the key elements a funding source audit would review in a particular program’s client files (Proof of income, proof of citizenship, etc.) Checklists were developed that outline the required items and a review of a minimum of 3 files is conducted. In #12. Site Review, an instrument was created that verifies key elements of safety, accessibility, compliance, which are factors in our Risk Assessment Worksheets, as well as, the visibility of our offices. Mid has over 30 offices and classroom locations scattered over 23,000 square miles and consistency and visibility of these locations is important to our overall operation. In 2010-2011, we started tracking and scoring #15. Advocacy. This category tracks public presentations and interactions made by individual programs. This information is used to determine what the acceptable level of advocacy should be in our organization.
Page | 3

In the development of the Performance Management Scorecard, we originally tried to avoid areas that involved the achievement of a program’s individual ROMA goals. We were trying to look at what makes the “engine” run well and not necessarily at the destination. We ultimately decided that we were evolving sufficiently in our goal predictions to incorporate the data from National Performance Indicators (NPI) report into a scoring format. In 2010, we incorporated # 10. ROMA Goals (Target) Achieved. It is important to note that we are still emphasizing accuracy in this category, by scoring not only the achievement of the goals but how closely it was predicted. In addition to this Performance Management Scorecard, we also use another instrument, the Strategic Planning Scorecard. This incorporates the use of the ROMA logic models and the corresponding CSBG/NPI reports in a different scoring format. In 2013, we started scoring program input with Strategic Plan Goals Tracked.
Page | 4
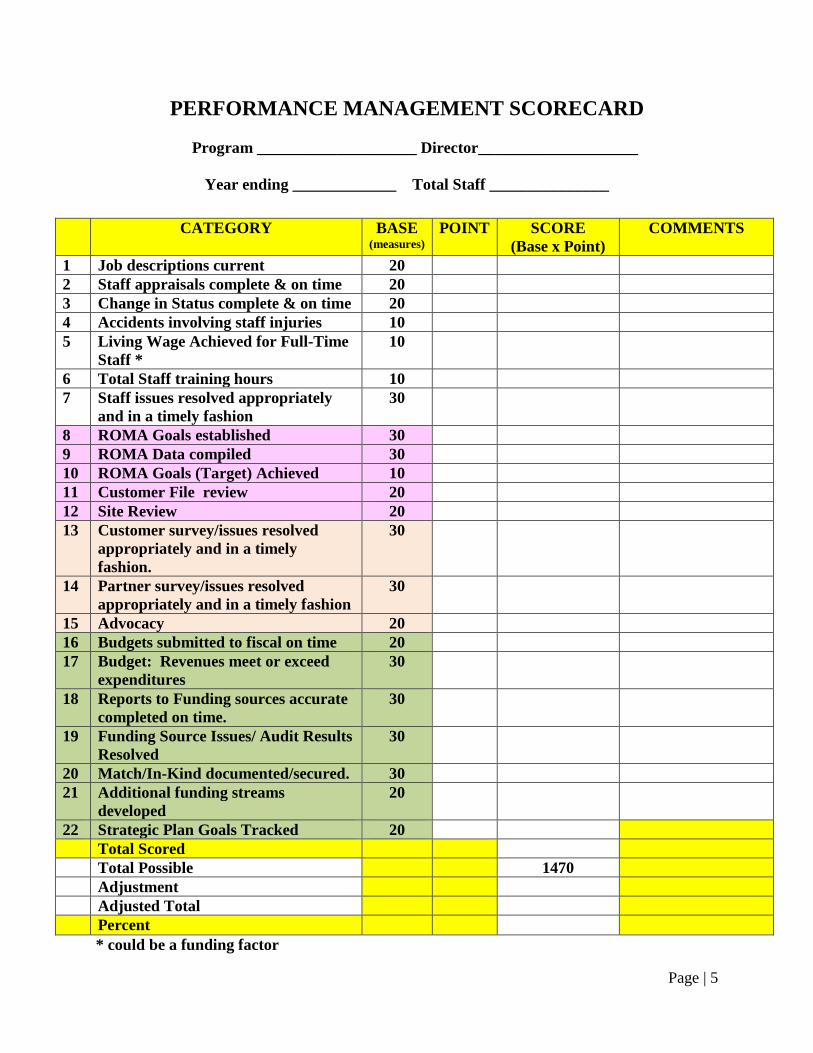
PERFORMANCE MANAGEMENT SCORECARD
Program ____________________ Director____________________
Year ending _____________ Total Staff _______________
CATEGORY BASE (measures)
POINT SCORE (Base x Point)
COMMENTS
1 Job descriptions current 20 2 Staff appraisals complete & on time 20 3 Change in Status complete & on time 20 4 Accidents involving staff injuries 10 5 Living Wage Achieved for Full-Time
Staff * 10
6 Total Staff training hours 10 7 Staff issues resolved appropriately
and in a timely fashion 30
8 ROMA Goals established 30 9 ROMA Data compiled 30 10 ROMA Goals (Target) Achieved 10 11 Customer File review 20 12 Site Review 20 13 Customer survey/issues resolved
appropriately and in a timely fashion.
30
14 Partner survey/issues resolved appropriately and in a timely fashion
30
15 Advocacy 20 16 Budgets submitted to fiscal on time 20 17 Budget: Revenues meet or exceed
expenditures 30
18 Reports to Funding sources accurate completed on time.
30
19 Funding Source Issues/ Audit Results Resolved
30
20 Match/In-Kind documented/secured. 30 21 Additional funding streams
developed 20
22 Strategic Plan Goals Tracked 20 Total Scored Total Possible 1470 Adjustment Adjusted Total Percent
* could be a funding factor
Page | 5

SCORING CRITERIA
1. JOB DESCRIPTIONS CURRENT (Current is defined as reviewed in last 3 years in alignment with Strategic Plan)
Standard 7.3: “The organization has written job descriptions for all positions, which have been updated within the last five years.” Job descriptions should be notated when they were last updated/reviewed.
Basis Score
100% of regular staff have current job descriptions
3
90-99% of regular staff have current job descriptions 2 80-89% of regular staff have current job descriptions 1 < 80% of regular staff have current job descriptions 0 Verifying party
Human Resources
2. STAFF APPRAISALS COMPLETED ANNUALLY AND ON TIME (In alignment with individual’s employment anniversary or set program review date) Standard 7.6: “The organization has a policy in place for regular written evaluations of employees by their supervisors.” This standard requires that the agency have a formal process for conducting staff reviews on an annual basis.
Basis Score
100% of regular staff appraisals are complete & on time
3
90-99% of regular staff appraisals are complete & on time
2
80-89% of regular staff appraisals are complete & on time
1
< 80% of regular staff appraisals are complete & on time
0
Verifying party
Human Resources
Page | 6

3. CHANGE IN STATUS (Salary Adjustments, FTE, Position Changes) ARE COMPLETE & ON TIME
(Prior to the completion of the next eligible payroll)
Basis Score 100% of regular staff salary adjustments are complete & on time.
3
90-99% of regular staff salary adjustments are complete and on time.
2
80-89% of regular staff salary adjustments are complete and on time.
1
< 80% of regular staff salary adjustments are complete and on time.
0
Verifying party
Human Resources
4. ACCIDENTS INVOLVING STAFF INJURIES Source: OSHA 300 Form
Basis Score
Less than 2% of total staff reported staff injuries. 3 2-5% of total staff reported staff injuries 2 Over 5% of total staff reported staff injuries 0 Verifying party
Human Resources
5. LIVING WAGE ACHIEVED FOR REGULAR FULL-TIME STAFF (Based on single person using Living Wage Calculator (Penn State), or (Appleseed Data)
Basis Score
100% of staff earn Living Wage 3 90-99% of staff earn Living Wage 2 75-89% of staff earn Living Wage 1 <75% of staff earn a living wage 0 Verifying party
Human Resources/Payroll
Page | 7

6. STAFF TRAINING HOURS Source: Staff Development Report Form
Basis Score
Average training hours per employee 10 or more hours
3
Average training hours per employee 5-9 hours 2 Average training hours per employee 1-4 1 No training hours recorded 0 Verifying party
Human Resources
7. STAFF ISSUES RESOLVED APPROPRIATELY AND IN A TIMELY MANNER
Source: Employee Grievance Procedure/staff survey
Basis Score No staff issues or staff issues resolved appropriately and in a timely manner.
3
Issues require follow up by Administrative Staff due to complexity. (may still have been handled appropriately)
1
Issues inappropriately handled 0 Verifying party
Human Resources, Administration
8. ROMA GOALS ESTABLISHED
Recommended by July 15th for submission to ROMA Coordinator/Committee (Plan due Aug 1) Standard 9.4: “The organization submits its annual CSBG Information Survey Data Report and it reflects client demographics and organization-wide outcomes.”
Basis Score ROMA goals for the annual Plan are established & submitted on time.
3
ROMA goals are established & submitted within 3 working days of the internal deadline.
2
ROMA goals are established & submitted within 4 working days of internal deadline.
1
ROMA goals are established & submitted after the 4th working day of internal deadline.
0
Verifying party
ROMA Coordinator
Page | 8

9. ROMA DATA COMPILED CSBG reports are due April 1 and October 1 to Mid’s ROMA Coordinator/Committee (Results are due to State annually in February) Standard 9.3: “The organization has presented to the governing board for review or action, at least within the past 12 months, an analysis of the agency’s outcomes and any operational or strategic program adjustment or improvements identified as necessary.” Could be demonstrated via program committee review and the resulting committee minutes of the discussion and via the report to the full board.
Basis Score ROMA data is compiled & submitted by the internal deadline.
3
ROMA data is compiled & submitted within 3 working days of deadline.
2
ROMA data is compiled & submitted within 4 working days of deadline.
1
ROMA data is compiled & submitted to the ROMA trainer after the 4th working days of deadline.
0
Verifying party
ROMA Coordinator
10. ROMA GOALS (Target) ACHIEVED Source: CSBG/National Performance Indicator
From reports compiled as of November 1
Basis Score Average Percentage achieving outcomes in all categories. 80% > and <120%
3
Average Percentage achieving outcomes in all categories. 60%-79% or 120%-140%
2
Average Percentage achieving outcomes in all categories. < 59% or 141%>
1
If not required, adjust from point total n/a Verifying party
ROMA Coordinator
Page | 9

11. CUSTOMER FILE REVIEW Source: File Review Form
Minimum of 3; maximum of 1% of Program Customers Basis Score
Files complete, kept confidential 3 Minor issues with data reviewed, correctable (i.e. checklists, staff signatures etc.)
2
Major issues with data reviewed, correctable (i.e. proof of income or qualifying information)
1
Major issues with data reviewed, not correctable (i.e. over income or not qualified)
0
If not required, adjust from point total n/a Verifying party
Admin review team
12. SITE REVIEW
Source: Site Review Form Number of office/center sites __________ Basis Score
Sites achieve all 11 of the required elements from the Site Review form.
3
Sites achieve 10 of the required elements from the Site Review form.
2
Sites achieve 9 of the required elements from the Site Review form.
1
Sites achieve 8 or less of the required elements from the Site Review form.
0
Verifying party
Review team
13. CUSTOMER SURVEY/ISSUES RESOLVED APPROPRIATELY AND IN A TIMELY MANNER
Source: Grievance Form/correspondence/surveys as of tracking year. Standard 1.3: The organization has a systematic approach for collecting, analyzing and reporting customer satisfaction data to the governing board.
Basis Score No issues or Customer/Stakeholder survey/issues resolved appropriately and in a timely manner.
3
Issues require follow up by Administrative Staff. 1 Issues inappropriately handled 0 Verifying party
Grievance Committee, Administration
Page | 10

14. PARTNER SURVEY/ISSUES RESOLVED APPROPRIATELY AND IN A TIMELY MANNER
Source: administrative correspondence/partner surveys/grievance reports as of tracking year. Standard 2.2: “The organization utilizes information gathered from key sectors of the community in assessing needs and resources, during the community assessment process or other times. These sectors would include at minimum: community-based organizations, faith-based organizations, private sector, public sector and educational institutions.”
Basis Score No issues or Partner survey/issues resolved appropriately and in a timely manner.
3
Issues require follow up by Administrative Staff. 1 Issues inappropriately handled 0 Verifying party
Administration
15. PROGRAM ADVOCACY Source: Advocacy Interactions Form, Advocacy tracking file
Basis Score
Three or more Advocacy Interactions (maximum of 2 from each category worksheet)
3
Two Advocacy Interactions 2 One Advocacy Interaction 1 No Interactions 0 Verifying party
Grants
16. BUDGETS SUBMITTED TO FISCAL ON TIME Budgets submitted to fiscal office by both the program fiscal year and agency fiscal year deadlines.
Basis Score Budgets completed and submitted to fiscal on time 3 Budget submitted within 3 working days of deadline 2 Budgets submitted after 4 working days of deadline 1 Budgets submitted after 5 working days of deadline 0 Verifying party
Fiscal Department
Page | 11

17. BUDGET: REVENUES MEET OR EXCEED EXPENDITURES Source: Revenue and Expenditure Reports as of program fiscal year
Basis Score
Revenues meet or exceed expenditures (within budget)
3
Expenditures exceed revenues (<2%) 1 Expenditures exceed revenues (>2%) 0 Verifying party
Fiscal Department
18. NEW & ONGOING GRANT APPLICATIONS/ REPORTS TO FUNDING SOURCES
ACCURATE & COMPLETED ON TIME Source: Correspondence, funder surveys, internal control
Basis Score
Grants/Reports to funding sources on time & accurate
3
Grants/Reports on time, but returned for correction 2 Grants/ Reports late 0 If not required, deduct from point total n/a Verifying party
Grants, Fiscal Department
19 FUNDING SOURCE ISSUES/AUDIT RESULTS RESOLVED
Source: Funder survey, programmatic audits, monitoring reports, reviews, correspondence Standard 8.2 “All findings from the prior year’s annual audit have been assessed by the
organization and addressed where the governing board has deemed it appropriate.”
Basis Score No findings/issues 3 Minor corrections (deficiencies) required 2 Major corrections (deficiencies) required 0 If not required, adjust from point total n/a Verifying party
Administration Fiscal Department
Page | 12

20. MATCH/IN-KIND DOCUMENTED AND SECURED
Basis Score Match/In-kind documented on an on-going basis 3 Match/In-kind documented only at end of year 2 Match/In-kind not secured as required 0 If not required, adjust from point total n/a Verifying party
Fiscal Department
21. ADDITIONAL FUNDING DEVELOPED
Basis Score Program is successful in securing additional funding outside of primary grant.
3
Program is active in seeking (not successful) additional funding outside of primary grant.
2
Program is not active in seeking additional funding outside of primary grant.
1
Program is not required to seek additional funds. n/a Verifying party
Grant Managers, Administrative Staff
22. STRATEGIC PLAN GOALS ARE TRACKED AND REPORTED
Basis Score Strategic Plan goals, objectives, and outcomes (relevant to program) are tracked and progress submitted by deadline (updated every 6 months)
3
Strategic Plan goals, objectives, and outcomes are submitted with 3 working days of deadline.
2
Strategic Plan goals, objectives, and outcomes are submitted with 4 working days of deadline
1
Strategic Plan goals, objectives, and outcomes are submitted after the 4th working day of the deadline
n/a
Verifying party
Grant Managers, Administrative Staff
Page | 13

PERFORMANCE MANAGEMENT SCORECARD RECAP
The recap is basically a report card. With our first review of our agency programs in 2007, it was interesting to note that the two programs that scored the highest scores (100%), represented our largest program (Head Start with the greatest number of staff) and one of our smallest programs (RSVP with one staff member). We felt that this gave some validity to our scoring criteria and demonstrated that it did not favor either a larger or smaller program. This trend has continued. Note: This is not to say that a larger program is as easy to manage as a smaller program, just that the standards to which they are held should be the same.
Page | 14

PERFORMANCE SCORECARD 2016 RECAP
90-100% 80-89% 70-79% Below 70%
Agency Average 97%
Code Program Director (italics=new director)
Budget Staff Score
31300 Housing
98%
31400 Community Services
97%
31600 Senior Companion
98%
31700 RAFT 92% 32200 Head Start
98%
32600 Child Abuse and Resource Education (CARE)
96%
33000 North Platte Senior Center
99%
Peterson Senior Center 98% 33500 Minden Senior Center
98%
34000 Women Infants & Children (WIC)
98%
34300 Commodity Supplemental Foods (CSFP)
93%
34600 Mid-Nebraska Food Bank
94%
34900 Immunization
100%
36500 Weatherization 95% 36700 Owner Occupied Rehab 95% 38400 Transportation 99% CAHI/Rental Housing 100%
The goal is that all programs score in the blue (80-89%) to green (90-100%) categories. Scoring in the “Yellow” (70-79%) represents at least a passing or acceptable grade. However, scoring in the “Red” (>70%) is unacceptable.
Page | 15

We have charted the results of the total agency scoring since 2007. In 2009, we hit our previous peak in scoring with an agency high of 97% which was repeated in 2016. In 2011, we returned to our agency norm in the mid 90’s. This probably is related to the additional categories we added. In 2011’s Performance Management Scorecard, we added # 15. Advocacy and utilized a revised #12 Site Review criteria which we outlined above. Previously we were measuring accessibility and appearance, the revised standard grades elements from our Risk Assessment & Management Checklists as well.
PERFORMANCE MANAGEMENT SCORECARD RESULTS 2007-2016
88%
89%
90%
91%
92%
93%
94%
95%
96%
97%
98%
2007 2008 2009 2010 2011 2012 2013 2014 2015 2016
Page | 16

By taking the original scorecard and calculating the individual category scores separately for our 17 programs, we have identified areas of improvement. From 2015 to 2016, we saw great improvement in the reduction of staff accidents and our advocacy tracking. Areas of improvement are still needed in ROMA Goals Achieved and Staff Training. ROMA Goals Achieved are based on targeting percentages and numbers served at the beginning of the year. This is difficult to predict due to the changing needs of both our programs and clients throughout the year. Providing quality staff training is essential to our programs but can be effected by program budgets and availability of training. The main issue with this category is making sure staff are turning in their training hours. We did see some improvement here from 2015 but more work needs to be done. CATEGORY MAX Total
Scored Total
Possible Adjust Adjust
Total Percent
1 Job Descriptions 60 960 1020 60 960 100% 2 Staff Appraisals 60 960 1020 60 960 100% 3 Change in Status 60 960 1020 60 960 100% 4 Accidents 30 440 510 30 480 92% 5 Living Wage 30 480 510 30 480 100% 6 Staff Training 30 300 510 30 480 63% 7 Staff Issues 90 1440 1530 90 1440 100% 8 ROMA Goals 90 1440 1530 90 1440 100% 9 ROMA Data 90 1440 1530 90 1440 100% 10 ROMA Targets 30 340 510 30 480 71% 11 Customer File Review 60 540 1020 480 540 100% 12 Site Review 60 1020 1020 0 1020 100% 13 Customer Survey 90 1530 1530 0 1530 100% 14 Partner Survey 90 1530 1530 0 1530 100% 15 Advocacy 60 720 1020 180 840 86% 16 Budgets Submitted 60 1020 1020 0 1020 100% 17 Revenues/Expenditures 90 1530 1530 0 1530 100% 18 Reports to Funding 90 1320 1530 180 1350 98% 19 Funding Source Issues 90 1470 1530 0 1530 96% 20 Match Documented 90 690 1530 810 720 96% 21 Additional Funds 60 720 1020 240 780 92% 22 Strategic Plan Goals 60 840 1020 180 840 100%
Page | 17
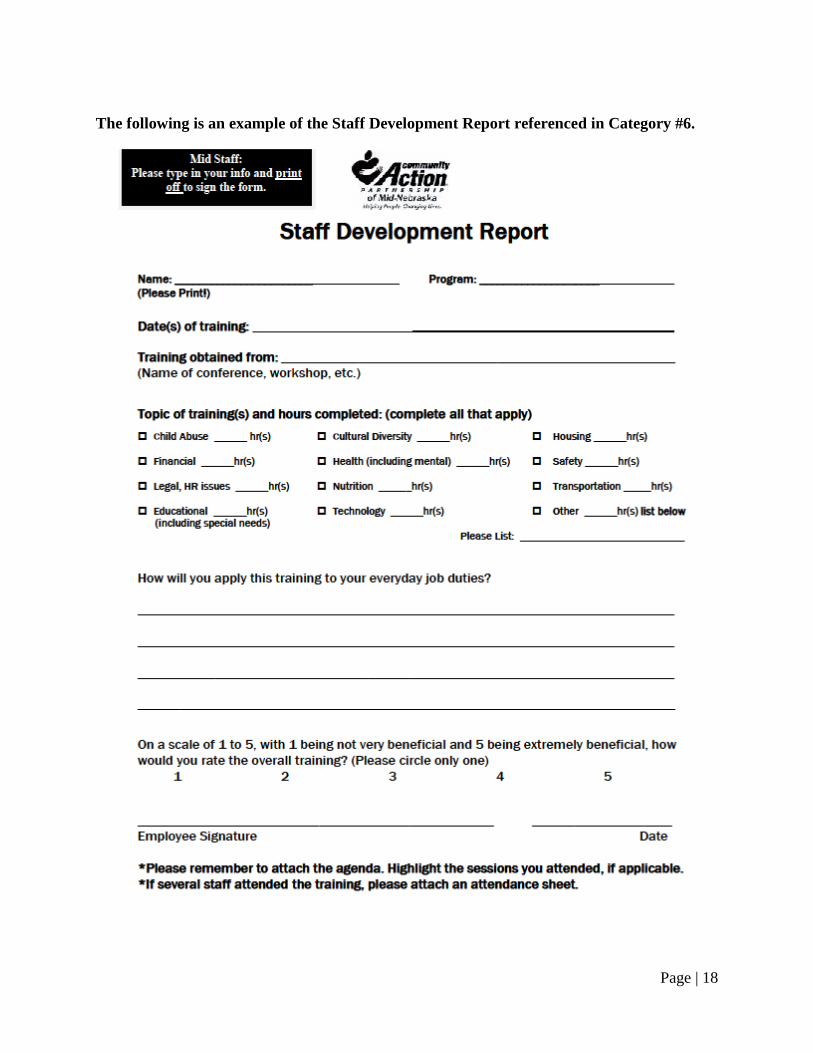
The following is an example of the Staff Development Report referenced in Category #6.
Page | 18

The following is an example of a File Review Form as referenced in Category #11.
FILE REVIEW _______________________________(date)
Program: RAFT
Reviewer ______________________________________ Number of files checked _______
File
Criteria
Yes No Yes No Yes No
Information Sheet
Agency Referral
NMIS Service point entry permission
Application for Admission
Background Check release
Personal Housing History
Psychosocial Assessment
Insurance verification (if applicable)
Identification: Green Card, Social Security
Packet Review (Committee)
Program Agreement
Page | 19

The following is an example of a “Site Review” as referenced in Category #12.
SITE REVIEW PART I
(All highlighted items required & used in scoring)
Date: _________________________________
Location Program
YES NO N/A COMMENTS MID SIGN OUTSIDE OFFICE
OR BUILDING
MISSION STATEMENT (framed 8.5 x 11)
BRAND PROMISE (framed 8.5 x11)
CODE OF ETHICS (framed 8.5 x11)
FEDERAL LABOR POSTER (dated 2008 bottom right)
NEBRASKA or KANSAS LABOR POSTER
(minimum wage of $9.00/hour)
GRIEVANCE POLICY APPEARANCE
Office/Classroom clean and free of hazards. Site appealing to
Customers (paint, décor, building appearance)
ADA* Is Office/Classroom (ADA)
Accessible or can accommodate
If accommodation required, please note:
NOTICE OF FEDERAL INTEREST (only in Lexington and Ravenna Head Start sites)
VEHICLE NOTEBOOK (up to date ins/safety info)
In sites with agency vehicles
FAIR HOUSING POSTER (Community Service Coordinator
sites, + admin only )
*ADA audit form is available, if required by program.
Page | 20

SITE REVIEW PART II
LOCATION PROGRAM
SAFETY ISSUES
(This is an evaluation, not a requirement that all offices be so equipped) Exception: Fire & Emergency Plan, Emergency Response (Contact List)
YES NO N/A COMMENTS
CRISIS MANUAL or EMERGENCY RESPONSE
PLAN (part of Policy & Procedure Manual) Utility Contact, etc. info complete on one or other
FIRE & EMERGENCY EVACUATION PLAN
ENTRANCE ALARMS SECURITY CAMERAS
AT ENTRANCE
CARBON MONOXIDE ALARM
RADIO/EMERGENCY BAND SPRINKLER SYSTEM
(fire suppression)
FIRE EXTINGUISHERS SMOKE ALARMS
FLASHLIGHT FIRST AID KIT
Other occupants in building?
Page | 21

The following is an example of the Staff and Board Advocacy Form as referenced in Category #15.
STAFF and BOARD Presentation and Advocacy Interactions*
Form Name : ___________________________________ Date of Interaction : ________________
Program: _________________________________ Please circle the correct category: Category A Category B Category C Category D Category E
Legislative Representatives:
State & Federal
Elected Public Officials:
County, City
Civic Organizations:
United Way, Jaycees, etc.
Media interview/coverage
Television, Radio, Newspaper
High Schools,
Youth Groups, Churches,
Other
Name/Type of group, or person contacted: ______________________________
Estimated size of audience: __________________________________________ Were you scheduled as a presenter? ______ Yes _____No Did you provide them with an Agency overview? _____ Yes ___No Did you provide them with a Program overview? _____ Yes ___No Was the Strategic Plan’s key priorities (key advocacy goals) of FINANCIAL LITERACY/LIFE SKILLS, EDUCATION, HEALTH, HOUSING, FOOD SECURITY OR TRANSPORTATION presented? _____yes ______no (please circle those presented) Was this a training presentation _________ Yes _______ No Subject matter discussed or presented:_______________________________________________ *Advocacy requires interaction. If you are not presenting or actively participating in the discussion that provides information or advances an agenda for your program or customer, it would not be considered an advocacy interaction. Please see advocacy policy for addition clarification. Return completed form to Martha Stribling, [email protected], at the Administrative Office.
Page | 22