performance measurement in agile development …
TRANSCRIPT
Ida Korpivaara
PERFORMANCE MEASUREMENT IN AGILE DEVELOPMENT ORGANIZATIONS
JYVÄSKYLÄN YLIOPISTO
INFORMAATIOTEKNOLOGIAN TIEDEKUNTA 2020

ABSTRACT
Korpivaara, Ida Performance measurement in Agile development organizations Jyväskylä: University of Jyväskylä, 2020, 80 pp. Information Systems, Master’s Thesis Supervisor: Tuunanen, Tuure
Performance measurement plays a key role in enabling continuous improvement in Agile software development organizations. While previous studies and experience reports have suggested various metrics, little is known on the metrics and practices that Agile organizations use to measure their performance in practice. Particularly, there is a knowledge gap regarding the use of metrics on organizational level, even if Agile development methods are being increasingly adopted also by large organizations. This thesis aims to fill this gap by investigating what kind of performance objectives Agile development organizations have on different organizational levels and which metrics are used to measure them. The study follows qualitative research tradition and employs case study as its primary research method. The primary data consists of 10 semi-structured interviews conducted in two development units of a large multinational corporation operating in the financial sector. The interview participants represent a variety of Agile roles, from product owners to developers and executive management. The results are analysed through qualitative content analysis and triangulated by using documents as a secondary data source. The findings reveal that performance objectives in Agile development organizations address three key performance dimensions: customer value, financial value and performance of internal processes. In addition, the results suggest that performance dimensions of collaboration and culture and innovation and learning are important in enabling performance. Objectives, metrics and their prioritization were found to differ across organizational levels. Based on the findings, the study suggests a framework and identifies best practices for selecting performance objectives and metrics in Agile development organizations.
Keywords: Agile software development, performance objectives, measurement, case study

TIIVISTELMÄ
Korpivaara, Ida Mittaaminen ja tavoiteasetanta ketteriä kehitysmenetelmiä käyttävissä organi-saatioissa Jyväskylä: Jyväskylän yliopisto, 2020, 80 s. Tietojärjestelmätiede, pro gradu -tutkielma Ohjaaja: Tuunanen, Tuure
Mittaamisella on keskeinen rooli jatkuvan kehittymisen mahdollistamisessa ketteriä ohjelmistokehitysmenetelmiä käyttävissä organisaatioissa. Vaikka aiemmat tutkimukset ja kokemusraportit ovat ehdottaneet useita mittareita ketteriä kehitysmenetelmiä seuraaville organisaatioille, tiedetään organisaatioiden todellisuudessa käyttämistä mittareista ja mittaamiskäytännöistä vähän. Erityisen vähän mittareiden käyttöä on tutkittu suurten organisaatioiden osalta, vaikka ketteriä ohjelmistokehitysmenetelmiä käytetään yhä enemmän myös niissä. Tämä tutkimus pyrkii vastaamaan ongelmaan tutkimalla, millaisia tavoitteita ketteriä ohjelmistokehitysmenetelmiä käyttävillä organisaatioilla on eri organisaatiotasoilla ja miten ne pyrkivät niissä suoriutumistaan mittamaan. Tutkimus on toteutettu laadullisena tutkimuksena ja käyttää menetelmänään tapaustutkimusta. Päätutkimusaineisto koostuu 10 puolistrukturoidusta haastattelusta, jotka on toteutettu suuren monikansallisen rahoitusalan yrityksen kahdessa eri ohjelmistokehitysyksikössä. Haastateltavat edustavat laajasti ketterän kehityksen eri rooleja ohjelmistokehittäjistä tuotevastaaviin ja ylimpään johtoon. Haastattelut on analysoitu laadullisella sisältöanalyysilla ja tulosten luotettavuutta on pyritty parantamaan käyttämällä dokumentteja toissijaisena aineistona. Tutkimus osoittaa, että ketteriä menetelmiä käyttävien organisaatioiden tavoitteet koskevat pääasiallisesti kolmea osa-aluetta: asiakasarvoa, taloudellista arvoa sekä sisäisten prosessien tehokkuutta. Näiden lisäksi yhteistyö ja yrityskulttuuri sekä oppiminen ja innovointi ovat tulosten mukaan tärkeitä mahdollistajia tavoitteiden saavuttamiselle. Tavoitteiden, mittareiden ja niiden priorisoinnin huomattiin vaihtelevan organisaatiotasojen välillä. Tulosten perusteella tutkimus esittää viitekehyksen ja suositeltuja käytäntöjä tukemaan tavoiteasetantaa ja mittarien valintaa ketteriä kehitysmenetelmiä käyttävissä organisaatioissa.
Asiasanat: ketterä ohjelmistokehitys, tavoitteet, mittaaminen, tapaustutkimus

FIGURES
Figure 1. Execution of the study .................................................................................. 9
Figure 2. Agile Values from The Agile Manifesto .................................................. 13
Figure 3. Selected dimensions determining choice of software development method .......................................................................................................................... 16
Figure 4. The Iron Triangle of project performance measurement ...................... 20
Figure 5. Software value map .................................................................................... 24
Figure 6. Performance dimensions of Agile software development .................... 31
Figure 7. Performance measurement structure in the case organizations .......... 43
Figure 8. Objectives, expected benefit and example metrics for Agile metrics .. 44
Figure 9. Framework for measuring performance in Agile development organizations ................................................................................................................ 62
TABLES
Table 1. Evolution of ISD methodologies ................................................................. 11
Table 2. Comparison of traditional and Agile software development methods 15
Table 3. Software trends towards continuous value delivery ............................... 18
Table 4. Top 5 most prioritized of value aspects in Agile organizations ............ 25
Table 5. Examples of performance dimensions of stakeholder driven measurement ................................................................................................................ 27
Table 6. Examples of performance metrics derived from Agile principles ......... 29
Table 7. Quotes on categorizing KPIs ....................................................................... 41
Table 8. Performance objectives and metrics in the units ...................................... 41
Table 9. Quotes on learning and innovation approaches ...................................... 48
Table 10. Quotes on employee satisfaction and empowerment ........................... 49
Table 11. Quotes on disconnect between operational and organizational metrics ........................................................................................................................................ 50
Table 12. Quotes on data availability and its impact .............................................. 53
Table 13. Quotes on performance reporting effort and systems support............ 54
Table 14. Quotes on lack of performance reporting guidance .............................. 54
Table 15. Quotes on focus on end-to-end processes ............................................... 56
Table 16. Performance objectives in Agile development organizations .............. 61
Table 17. Summary of practical implications to industry practitioners .............. 66

CONTENTS
ABSTRACT ...................................................................................................................... 2
TIIVISTELMÄ ................................................................................................................. 3
FIGURES .......................................................................................................................... 4
TABLES ............................................................................................................................ 4
CONTENTS ..................................................................................................................... 5
1 INTRODUCTION ................................................................................................. 7
2 EVOLUTION OF SOFTWARE DEVELOPMENT .......................................... 10
2.1 Traditional software development .......................................................... 10
2.2 Agile software development .................................................................... 12
2.3 Continuous software development ......................................................... 16
3 PERFORMANCE MEASUREMENT IN SOFTWARE DEVELOPMENT ... 19
3.1 Performance measurement in traditional software development ...... 19
3.2 Performance measurement in Agile software development ............... 21
3.2.1 Balanced Scorecard .......................................................................... 21
3.2.2 Stakeholder-driven measurement ................................................. 25
3.2.3 Measuring based on Agile principles and maturity ................... 28
3.2.4 Summary of approaches .................................................................. 31
4 METHODOLOGY ............................................................................................... 34
4.1 Research method and case description ................................................... 34
4.2 Data collection ............................................................................................ 36
4.3 Data analysis ............................................................................................... 37
4.4 Validity and reliability .............................................................................. 38
5 STUDY FINDINGS ............................................................................................. 39
5.1 Performance objectives and metrics on unit level ................................ 39
5.2 Performance objectives and metrics below unit level .......................... 42
5.3 Performance enablers ................................................................................ 47
5.4 Challenges and observations on performance measurement ............. 50
5.4.1 Disconnect between organizational and operational KPIs ........ 50
5.4.2 Data availability and measurement effort .................................... 52
5.4.3 Dependencies and end-to-end measurement .............................. 55
6 DISCUSSION ....................................................................................................... 58
6.1 Performance objectives and metrics in Agile development organizations .............................................................................................. 58

6.2 Performance measurement challenges and practices ........................... 63
7 CONCLUSIONS .................................................................................................. 67
7.1 Findings and contribution ........................................................................ 67
7.2 Limitations of the study ............................................................................ 70
7.3 Suggestions for future research ............................................................... 71
SOURCES ....................................................................................................................... 73
APPENDIX 1: INTERVIEW QUESTIONS ................................................................ 78

1 Introduction
Popularity of Agile development methods has grown significantly over the past decade. Through adoption of Agile, organizations seek to shorten their product release cycles, improve quality and introduce flexibility into their development processes. Despite Agile methods being originally designed for organizations consisting of one or two teams, experience reports on their potential to accelerate product delivery and to enable stronger customer focus have encouraged also large organizations to adopt them (Paasivaara, Behm, Lassenius & Hallikainen, 2018).
Prior studies have found that performance metrics used in traditional soft-ware development support Agile development methods poorly (Hartmann & Dymond, 2006; Oza & Korkala, 2012). Since traditional software development is structured in projects, it is usually evaluated by measuring the extent to which the projects meet their budget, scope and time restrictions. Moreover, traditional software development is based on a plan, which means that its success can be defined by measuring whether the plan is realized (Agarwal & Rathod, 2006; Wa-teridge, 1998). Agile software development, in turn, is based on close customer collaboration and continuously reprioritised features. Structured in iterations in-stead of projects, it requires rethinking of the traditional performance metrics (Hartmann & Dymond, 2006).
Despite the crucial role of performance measurement in enabling organiza-tions to continuously improve, existing studies on performance measurement in Agile development organizations are scarce. While industry practitioners and Agile literature have suggested various performance objectives and metrics, little is known on the objectives and metrics that organizations have chosen to use in practice (Alahyari et al., 2017; Kupiainen, Mäntylä & Itkonen, 2015). In particular, there is a knowledge gap regarding the use of metrics in Agile development units on organizational level, since most of the existing studies have focused on per-formance measurement on team level. The importance of holistic organizational understanding of performance measurement, however, is increasing as the prev-alence of large-scale Agile adaptations grows.
8
This study wishes to contribute to existing literature on performance meas-urement by investigating performance objectives and metrics in Agile develop-ment organizations. The results that emerge from the study aim to increase the current understanding on the objectives and metrics that Agile development or-ganizations use to measure performance on different organizational levels. At the same time, however, the research findings can also have practical implications for organizations adopting Agile development methods and aiming at optimiz-ing their performance measurement practices.
The overall aim of this research is to investigate how Agile development organizations measure their performance. Specifically, the study examines per-formance objectives of Agile development organizations, the metrics and indica-tors used to measure them and the extent to which the objectives and metrics differ from those suggested by prior literature. For this purpose, the following three research questions were formed:
1. What are performance objectives in Agile development organizations?
2. Which metrics are used to measure the performance objectives?
3. How do the performance objectives and metrics compare to those sug-
gested in literature?
The study investigates performance objectives and metrics with primary focus on organizational or portfolio level performance measurement. Objectives and metrics used within Agile release trains and teams are considered as part of the organizational performance measurement framework, but the study does not ex-amine metrics of each team and release train individually. Furthermore, perfor-mance measurement of individuals is not within the scope of the study.
In addition to its organizational perspective, limitations of the study include its general perspective to Agile development methods. The study approaches Ag-ile development methods from an overall perspective, regarding them as a family of iterative development methodologies that share common principles. The study does not consider differences between specific Agile techniques or prac-tices or their impact on performance metrics. Regarding software development types, only in-house development is considered. Therefore, insights into the im-pacts that different development contracts may have on performance objectives and metrics are not provided.
In order to answer the research questions, the study first builds up a theo-retical background for the research by reviewing contemporary information sys-tems literature on performance measurement in Agile software development or-ganizations. The aim of the literature review is to create an understanding on characteristics of Agile software development as a development method, the di-mensions on which it creates value and the different approaches for measuring those dimensions. This is done by combining knowledge on Agile software de-velopment and performance measurement in software development in general.
The empirical part of the study follows qualitative research tradition and employs case study as its primary research method. The case units are two soft-ware development departments of a large company operating in the financial

9
sector. The data sources of the study consist of 10 semi-structured interviews con-ducted in person in the case units as well as several performance reports and documents. The data is analysed through computer-aided content analysis. The analysis follows an abductive approach, in which the initial themes are first iden-tified inductively from the data and then the coding is refined by deducting ad-ditional themes with findings from the literature review. The results from the empirical analysis are then compared against the findings from the literature to provide answers to the research questions. The execution of the study is further detailed in Figure 1.
Figure 1. Execution of the study
The main findings of the study show that performance objectives in Agile devel-opment organizations address primarily three performance dimensions: cus-tomer value, financial value and performance of internal processes. In addition, the results suggest that performance dimensions of collaboration and culture and innovation and learning are important in enabling performance. Performance ob-jectives, metrics and their prioritization are found to differ across organizational levels. Based on the findings, the study suggests a framework and identifies best practices for selecting performance objectives and metrics in Agile development organizations. The findings contribute to existing literature especially by provid-ing insights into the role of financial value as a performance dimension.
This study is structured as follows. After a first introductory chapter, the second chapter introduces the concepts of traditional and Agile software develop-ment and compares the characteristics of the two. The third chapter presents dif-ferent approaches to performance measurement and objectives within traditional and Agile development organizations. The chapter concludes with a summary on performance dimensions and objectives for Agile development organizations. The fourth chapter provides information on the execution of the study and its methodological choices, while the fifth chapter presents the results of the empir-ical study. The sixth chapter discusses the findings and their theoretical and prac-tical implications. Finally, the research questions are answered in a seventh, final chapter that also engages with the limitations of the study and suggests topics for future research in the area.

10
2 Evolution of software development
This chapter presents the evolution of software development from the early com-puting days to contemporary times. Firstly, it presents software development ap-proaches known as traditional software development. Secondly, it introduces the concept of Agile software development and compares it to the earlier develop-ment methods. The chapter concludes with the presentation of continuous soft-ware development practices.
2.1 Traditional software development
The history of software development stretches over half a century back to 1950’s when the first computers were taken into commercial use. While the first decades of software development consisted mostly of data processing and information management activities, the focus soon shifted to business process integration. Previous literature has described the history of software development by classi-fying it into several stages or eras based on shifts in for example employed hard-ware (Kroenke, 2007; O’Brien, 1999). One example of these classifications is the framework of Petter, DeLone and McLean (2012) that divides the history of soft-ware development from 1990s to 1950s in into four eras based on the dominating applications:
1. The Data Processing Era (1950-1960) 2. The Management Reporting and Decision Support Era (1960-1980) 3. The Strategic and Personal Computing Era (1980-1990) 4. The Enterprise System and Networking Era (1990-2000)
Along with the applications, the methodologies used for software develop-
ment have also evolved and changed over time. Avison and Fitzgerald (2003) classify the evolution of software development methodologies from 1950s to the twenty-first century into four eras: pre-methodology, early-methodology, meth-odology and post-methodology eras. The eras and their respective decades are presented in Table 1 below.

11
Table 1. Evolution of ISD methodologies (Avison & Fitzgerald, 2003)
Era Years Description
Pre-methodology From 1960s to 1970s
Computer applications were developed without a formalized methodology.
Early-methodol-ogy
From late 1970s to early 1980s
Systems Development Life Cycle (SDLC), also known as waterfall model, was dominating devel-opment method.
Methodology From late 1980s to early 1990s
New approaches emerged as a response to the limitations of SDLC. New tools were developed to support the contemporary methodologies
Post-methodology From late 1990s to early 2000s
Usefulness of early development approaches was reappraised, resulting often in simplification.
The first era of the framework, pre-methodology, took place during the in-
itial days of computing when computers were primarily seen as sophisticated calculators (Petter et al., 2012). Computer applications were developed without explicit or formalized methodologies, and the emphasis of the era was in data processing and overcoming technical challenges set by the limited hardware. De-velopers often took an individualistic approach and had little understanding on business contexts in which the systems were to be used, which resulted in poor control of projects and sub-optimal outcomes. (Avison & Fitzgerald, 2003)
The shortcomings of the pre-methodology era soon led to an effort to iden-tify the different stages and phases of software development process to improve the management of systems development. The resulting model is known as Sys-tems Development Life Cycle (SDLC) or waterfall model, in which each stage had to be completed before the next one could be commenced. While this meth-odology improved the overview of the development process, it had several defi-ciencies. It was, for example, considered inflexible, because it welcomed user re-quirements only in the beginning. Overall, the waterfall method was criticised for focusing more on technical efficiency than user satisfaction. (Avison & Fitz-gerald, 2003)
The third era of software development methodologies, the methodology era, collided with the Strategic Computing Era of software development. During this era, organizations increasingly realized the potential of information systems as decision support tools (Petter et al. 2012). The resulting focus on software devel-opment lead to refinement and improvement of the first methodologies devel-oped during the early-methodology era. The new refined methodologies did not only specify the stages of development, but also included recommendations for procedures, tools, techniques, documentation, management and training. In ad-dition to increased sophistication, there emerged several new themes in the meth-odologies during this era. These included for example structured programming, prototype development, stakeholder participation and focus on strategy. (Avison & Fitzgerald, 2003)
Despite of the ever more sophisticated methodologies, many organizations did not achieve the productivity increases and other benefits claimed by the soft-ware development methodologies. Many of the methodologies were perceived

12
overly complex and difficult to use and therefore only suitable for the largest and most complex projects. This disappointment with the methodologies, combined with an increasing focus on complex integrated enterprise systems, led to post-methodology era in which the usefulness of early development methods was se-riously reappraised (Petter et al. 2012, Avison & Fitzgeral, 2003). While some or-ganizations continued to develop the methodologies further to better suit their needs, others abandoned their use. As an alternative, many organizations de-cided to simply emphasize the concepts behind the methodologies such as step-by-step development. (Avison & Fitzgerald, 2003)
Despite of the incremental developments in the software development methodologies from 1960s to 1990s, all the development methods still shared sig-nificantly common features when coming to the 21st century. All the methodolo-gies were for example based on sequential process steps and relied on docu-mented plans. Due to these common features, the pre-21st century software de-velopment methodologies are commonly referred to as traditional or heavy-weight software development. (Dybå & Dingsøyr, 2009)
Overall, during its first half a century of existence, software development evolved from sophisticated computing to an essential business function with the emphasis on integrating business processes (Petter et al.,2012). As complexity of applications increased, software development methodologies evolved from sim-ple waterfall models into sophisticated process methodologies outlining also de-velopment tools and techniques. Despite of the evolution, however, many of the methodologies were perceived as overly complex and inflexible by the end of the century. Next chapter presents Agile software development that emerged as a response to these shortcomings.
2.2 Agile software development
The inflexibility and process-centricity of traditional software development methods in late 1990s created a call for more customer-centric software development. Prevailing heavyweight development practices were perceived as overly complex, causing frequent budget and delivery overruns in development projects. Late changes or additional requests were furthermore difficult to accommodate to the plan-driven processes. As a response, a group of industry practitioners popularized a new iterative approach to software development that was soon to be known as Agile software development. (Dybå & Dingsøyr, 2009)
Agile software development was first introduced by the publication “The Agile Manifesto” in 2001 (Beck et al., 2001). Created by software development practitioners and consultants, the manifesto defined ”agile philosophy” through four key values and twelve principles. The key values, presented in Figure 2, em-phasized customer-centricity and highlighted the importance of end results. In-stead of focusing on execution of pre-defined plans and processes, Agile devel-opment fostered continuous requirements gathering and close collaboration with

13
customers. The values encouraged organizations to provide experienced devel-opers with freedom to deliver value through their technical expertise in the form of working software.
Figure 2. Agile Values from The Agile Manifesto (Beck et al., 2001)
Even if Agile software development has been studied significantly since the ar-ticulation of the manifesto, there is still no clear consensus of the definition of agility. While responsiveness to change is in core of all agility definitions, per-spectives to scope of the change differ. For example Erickson, Lyytinen and Siau (2005) see the concept of agility broadly as the ability to promote quick responses to “changing environments, changes in user requirements, accelerated project deadlines, and the like” whereas Lee and Xia (2010) limit the scope of change to “changing user requirements”. Similarly, while Fowler and Highsmith (2001) see agility merely as the ability to respond to change, Conboy (2009) highlights also the capabilities to create and learn from the changes. Despite of the differences in details, quick responsiveness to changes can be seen to be in the very core of agil-ity and Agile software development.
Instead of a single method, Agile software development comprises of a set of iterative and incremental software engineering methods inspired by the Agile values. Most popular of these are Scrum (Schwaber & Beedle, 2002), Extreme Pro-gramming (Beck & Andres, 2004) and Lean Software Development (Poppendieck & Poppendieck, 2003). Scrum emphasizes the project management perspective of agile development by structuring the development into time-boxed sprints in which increments of software are developed and status of tasks is tracked daily. Extreme Programming (XP) aims at efficient and responsive software develop-ment by combining best practices for incremental development such as pair pro-gramming, unit testing, continuous integration and small releases. Lean Software development combines elements from Scrum and XP with principles from Lean manufacturing such as elimination of waste. Despite of the differences, all Agile methods emphasize short development cycles, frequent face-to-face communica-tion and continuous learning. In practice, many implementations combine sev-eral of the different Agile methods.
Even if the Agile methods mostly re-branded and re-packaged already known good software development practices, the Agile movement is considered

14
alternative to the plan-driven traditional software development introduced ear-lier. Dybå and Dingsøyr (2009) and Boehm and Turner (2003) have compared Agile and traditional software development perspectives and identified funda-mental differences between the two starting with their primary goals. While tra-ditional methods aim at providing high assurance and optimal results, Agile methods focus on delivering rapid value and responding to change. Due to the different objectives, the methods are also designed for different application cir-cumstances: traditional methods for stable and predictable environments and Agile methods for turbulent ones with high rates of change. Traditional methods have roots in logical positivism, whereas Agile methods have arisen from action learning and pragmatism. (Dybå & Dingsøyr, 2009)
In addition to goals and application environments, Boehm and Turner (2003) suggests that Agile and traditional software development methods differ with respect to management and processes. Management of traditional methods is typically characterized by careful up-front planning, explicit contracts and docu-mented controls. Design processes are deliberate and formal and follow a linear sequence of steps. (Dybå & Dingsøyr, 2009) Customer relationships are primarily focused on contract provisions and communication relies on explicit written doc-uments. (Boehm & Turner, 2003) Management of agile methods, in turn, is char-acterized by collaboration and interpersonal communication, exploration and in-ternalized plans. Design processes are emergent, exploratory and advance through multiple iterations, and learning is an important part of them. Commu-nication with customers is frequent and takes place on-site, focusing on priori-tized increments. Overall, Dybå and Dingsøyr (2009) suggest that management of traditional development is mostly centralized around control, whereas within Agile the primary attention falls on facilitation.
The differences in the goals and processes between traditional and Agile software development require also different organizational setups (Boehm & Turner, 2003). The absence of formal plans and documentation in Agile requires the development teams to be relatively small to avoid coordination problems. Furthermore, Agile teams should be co-located to facilitate the close and frequent communication. Compared to traditional methods, developers in Agile should also be more experienced as they are given a high degree of independence when it comes to the implementation of prioritized features. In contrast, traditional methods can be adopted also by large teams and distributed organizations.

15
Table 2. Comparison of traditional and Agile software development methods
Traditional meth-ods
Agile methods Source
Objectives and appli-cation
Primary goal Optimization Flexibility, respon-siveness
Beck et al., 2007; Dybå & Dingsøyr, 2009
Environment Stable; predictable Turbulent; constant change
Boehm & Turner, 2013
Manage-ment and processes
Manager Controller Facilitator Dybå & Dingsøyr, 2009
Design pro-cesses
Formal and planned; steps fol-low a linear se-quence
Explorative and emergent; consist of iterative increments
Dybå & Dingsøyr, 2009
Customer re-lationships
As-needed; focus on contract provisions
Frequent; focus on prioritized incre-ments
Boehm & Turner, 2013; Beck et al., 2007
Communica-tion
Explicit documented knowledge
Tacit interpersonal knowledge
Boehm & Turner, 2013
Control Documented plans Qualitative control Beck et al., 2007; Dybå & Dingsøyr, 2009
Organiza-tion
Size Large teams Small teams Boehm & Turner, 2013
Experience level of the project team
All levels of experi-ence
High level of experi-ence
Boehm & Turner, 2013
Location Not always co-lo-cated
Co-located Boehm & Turner, 2013
Culture Hierarchical and ra-tional
Low formality Boehm & Turner, 2013
Table 2 summarizes the differences of Agile and traditional development
methods. In short, traditional methods reflect a problem-solving approach in which a problem is first fully defined and then solved through well-planned ac-tivities, whereas Agile methods are better described by learning through experi-mentation. The main benefits of Agile methods compared to traditional methods are higher customer satisfaction, better responsiveness to changes and improved efficiency. Traditional methods, on the other hand, provide more control and documentation for controlled environments.
Boehm and Turner (2003) suggests that organizations should consider five dimensions when choosing between Agile and traditional development methods presented in Figure 3: dynamism, culture, size, criticality and personnel. Higher rate of requirements changes, culture that thrives on chaos, small size, low criti-cality and high share of experienced developers characterize organizations that are likely to benefit from Agile methods. On the other hand, large and hierar-chical organizations working with complex projects and high criticality may ben-efit more from traditional methods. In conclusion, Boehm and Turner (2003) sug-gest each organization to seek for their own combination of Agile and traditional methods.

16
Figure 3. Selected dimensions determining choice of software development method (modi-fied based on Boehm & Turner, 2003)
In summary, Agile software development refers to a set of iterative software development methods that have emerged as a response to rigid plan-driven tra-ditional development. Key characteristics of Agile development include flexibil-ity and responsiveness to change, iterative development cycle and independent developer teams. In the following, next chapter focuses on recent trend towards continuous software development that has been introduced to further improve iterative development and deliver benefits also in large organizations.
2.3 Continuous software development
Even if Agile methods have been found to improve customer satisfaction, productivity and employee satisfaction, the methods have also faced criticism (Dybå & Dingsøyr, 2009). Absence of plans and rapidly changing priorities form challenges for integrating non-development functions such as finance and HR into Agile organization (Overby et al., 2006). Furthermore, they complicate rela-tionships between customers and suppliers by for example making contracting and long-term planning difficult (Dingsøyr & Lassenius, 2016). Overall, all dis-continuities and boundaries that remain between planning, development and im-plementation have been identified to set limitations for organizational perfor-mance. Fitzgerald and Stol (2017) suggest that, in order to optimize software de-velopment, organizations should aim to integrate their development activities into a continuous process as fully as possible.
The aim towards a more holistic integration of organizational activities has resulted in the emergence of several new software development trends. One of the most popular ones is DevOps that addresses the disconnects between devel-opment and operations activities (Fitzgerald & Stol, 2017). The term DevOps re-fers to the need to align the development of software and its deployment into production. While there is no consensus of a common definition for the term, Humble and Molesky (2011) have identified four principles for the concept: cul-

17
ture, automation, measurement and sharing. Culture refers to the need for cul-tural change to accept joint responsibility over development and deployment, whereas automation means the need to automate build, deployment and testing. The two other principles, measure and share, are necessary to facilitate learning and therefore enable continuous improvement.
In addition to the discontinuity between development and deployment, emerging trends have addressed disconnects between other development activi-ties. Continuous integration, for example, addresses the gap between deploy-ment and integration by aiming at frequent integration of changes through auto-mation (Fitzgerald & Stol, 2017; Ghanbari, Tuunanen, Rossi & Kemell, 2019). Continuous delivery, in turn, addresses gap between development and delivery by deploying good software builds automatically to some environment. The aim of continuous delivery is to keep software always releasable (Laukkanen, Itkonen & Lassenius, 2017). Continuous deployment implies continuous delivery and re-fers to the practice of ensuring that software is continuously ready for deploy-ment to end customer. Ghanbari et al. (2019) suggest that the continuous devel-opment activities enable organizations to constantly improve the quality and market fit of their products and services. Furthermore, continuous activities in-crease productivity of developers, which contribute also to enterprise agility. (Ghanbari et al., 2019)
Apart from connecting development activities to each other, Fitzgerald and Stol (2017) suggest that a continuous linkage is important also between develop-ment functions and other business activities such as strategic planning. Integra-tion of strategic planning and development functions could accelerate strategy implementations and allow managers to identify and address problems earlier. Alignment between strategic planning and development could also remove ob-stacles that hinder managers from responding to change such as annual budget-ing cycles. Fitzgerald and Stol (2017) suggest the term BizDev to be used to de-scribe this continuous alignment between strategic planning and software devel-opment activities.
The trends towards continuous activities in development have also in-creased the popularity of continuous improvement and continuous innovation. Arising from the philosophy of lean software development, continuous improve-ment adopts the principles of data-driven decision-making and elimination of waste to achieve small incremental improvements. Continuous innovation, in turn, aims at creating a sustained process to response to evolving market condi-tions and deliver improvements across the full value chain. According to Fitzger-ald and Stol (2017), continuous innovation practices can include for example beta testing or A/B tests to ensure continuous customer feedback loop to the devel-opment life cycle. Dingsøyr and Lassenius (2016) describe similar activities with the term continuous experimentation that stresses the importance of understand-ing customer value of delivered functionalities. While continuous improvement reflects a reactive response to inefficiencies, continuous innovation seeks im-provement proactively. (Fitzgerald & Stol, 2017)

18
Table 3. Software trends towards continuous value delivery
Activity Method Source
Operations DevOps Humble & Molesky, 2011; Ghanbari et al., 2019
Development Continuous Integration Ghanbari et al., 2019; Fitz-geral & Stol, 2017; Lauk-kanen, Itkonen & Lasse-nius, 2017; Dingsøyr & Las-senius, 2016
Continuous Delivery
Continuous Deployment
Learning Continuous Improvement Fitzgeral & Stol, 2017; Dingsøyr & Lassenius , 2016
Continuous Innovation
Continuous Experimenta-tion
Strategic Planning BizDev Fitzgeral & Stol, 2017
Table 3 summarizes the new software development trends towards contin-
uous activities and holistic perspective to development. While some studies treat the new methods as independent initiatives, others suggest that they are part of a larger change ragerding perspective to software development. As an example, Dingsøyr and Lassenius (2016) employ the umbrella term of continuous value delivery to describe the trends towards a more holistic approach to software de-velopment. Similarly, Fitzgerald and Stol (2017) call the trend continuous soft-ware engineering. Ghanbari et al. (2019) adopt the concept of continuous infor-mation system development to describe the undisrupted delivery of software and maintenance to markets.
Overall, this chapter has described the evolution of software development methods for over half a century from 1950s to presence. In their search of control and structure, organizations first adopted life cycle development models and other plan-driven development methods. Need for flexibility and faster time-to-market later resulted in the adoption of value-driven Agile methods. Recently, a more holistic perspective to organizational performance has led to further opti-mization of development activities through continuous software development approaches. In the following, next chapter evaluates the implications of these changes to performance metrics and measurement.
19
3 Performance measurement in software development
This chapter focuses on performance measurement in software development or-ganization. Firstly, the chapter presents performance measurement objectives and metrics in traditional software development. Secondly, the chapter reviews performance measurement approaches when moving towards Agile software de-velopment. Finally, the chapter concludes with a summary on performance ob-jectives in Agile software development organizations.
3.1 Performance measurement in traditional software develop-ment
Ability to measure, evaluate and manage performance is crucial for any organi-zation aiming to learn and improve. Performance metrics ensure that organiza-tional activities deliver towards business objectives, guide and direct improve-ment efforts and empower managers to make decisions and take actions. Hauser and Katz (1998) argue that, if the metrics are chosen carefully, they will lead into managers and employees taking the right decisions and actions that enable the organization to achieve its long-term goals.
Traditional or plan-driven software development is structured in projects. Therefore, also the performance measurement is focused on evaluating individ-ual projects. Project metrics, referring to measures designed to capture if project change activities were executed successfully, play a key role in this. Similar as with projects in other industries, commonly mentioned performance objectives for plan-driven software development projects include cost, time and scope (Mi-tra, Sambamurthy & Westerman, 2011; Agarwal & Rathod, 2006; Wateridge, 1998). These objectives are also known as the “Iron triangle” as presented in Fig-ure 4. Project metrics set on these objectives measure the extent to which a given software project meets the customer requirements and the time and budget re-strictions outlined in the project plan. The scope in the measurement context is viewed from a holistic perspective and therefore covers both functional and non-functional customer requirements as well as their quality aspects (Agarwal &Rathod, 2006).
According to Agarwal and Rathod (2006), the Iron triangle objectives rep-resent internal view of the project success. External examination of project suc-cess focuses on value delivered to customers and other external stakeholders with metrics such as product performance, customer satisfaction or profitability. In contrast, the internal view that the Iron triangle represents, examines the per-formance of the project organization and its ability to deliver. Therefore, the Iron triangle performance indicators do not directly evaluate whether the project de-livers value to its stakeholders, but whether the project organization is able to implement the value outlined in the project plan. The responsibility over external

20
value, meaning whether the project has in fact been able to solve the problem it was aimed at, rests on the roles of project owner and customer that define the project characteristics.
Figure 4. The Iron Triangle of project performance measurement
In addition to the internal view to the project success, Wateridge (1998) has suggested that software development projects should adopt also external measures of success. These should be selected depending on the context but could include for example customer satisfaction, profitability and achievement of the purpose of the project. Wateridge (1998) argues that, by focusing only on short-term internal process of delivering the project, managers ignore the long-term ‘product’ development aspect. Furthermore, Wateridge (1998) suggests that delivering scope is a priority over meeting time and budget constraints in pro-jects aiming at commercial success.
Like Wateridge (1998), also Mitra et al. (2011) have addressed the im-portance of measuring external value creation in software development projects. Mitra et al (2011) suggest that measuring only IT-specific project performance such as delivering on-time and on-scope limits the understanding of value and impact delivered to the business. In order to measure business value realized from the projects, IT leaders need to use performance measures that matter to stakeholders and evaluate how their projects and deliveries improve those measures. In order to identify relevant metrics, Mitra et al (2011) encourage IT leaders to be proactive in defining metrics and discuss IT performance in busi-ness terms.
Both Agarwal and Rathod (2006) and Wateridge (1998) observe that percep-tions of software success differ from stakeholder to stakeholder. While for exam-ple customers might value requirements fulfilment, user satisfaction and achievement of purpose over budget and time, project managers prioritise time and budget over happy customers (Wateridge, 1998). On the other hand, a can-celled project that is failure from the point of project managers and customers may be successful from the perspective of developers if it resulted in substantial learnings that can be applied in future projects (Agarwal & Rathod, 2006). The differences between stakeholder perceptions create trade-offs that need to be ad-dressed for example by clearly established power relationships within the project organization (Wateridge, 1998).
Cost
Time
Project
success
Scope

21
In summary, the performance measurement of traditional software devel-opment focuses on the delivery of the predefined project plan. Instead of evalu-ating the external value that a software development project creates to its stake-holders, traditional software development evaluates the internal project aspects of delivering the agreed scope within time and budget. The responsibility of the external value creation rests on the business management and customers that de-fined the project scope and requirements. While the commonly evaluated perfor-mance objectives include meeting the project scope, budget and time specifica-tions, previous research has also suggested complementing the internal objec-tives with external ones such as customer satisfaction or achievement of the pur-pose.
While the performance metrics and frameworks for traditional software de-velopment are well-established, they can only be applied to project-based devel-opment. The next chapter examines the change in performance objectives and metrics when moving from project-based towards iterative software develop-ment organizations.
3.2 Performance measurement in Agile software development
As discussed previously, performance measurement of traditional software de-velopment is structured around individual development projects. The same ap-proach, however, is not applicable to Agile or continuous software development because of its iterative nature. According to Hartmann and Dymond (2006), tra-ditional plan-driven metrics may even hamper organisations trying to excel with Agile development methods. Due to absence of predefined project objectives and success criteria, performance objectives and outcomes against which Agile devel-opment is measured need to be explicitly defined. By other words, Agile devel-opment organizations are required to consider the value that they aim to create as part of their performance measurement process.
Prior studies have presented several approaches for determining perfor-mance objectives and metrics for Agile development organizations. These ap-proaches include Balanced Scorecard (Alahyari et al., 2017; Khurum et al., 2013; Kaplan & Norton, 1992), stakeholder-driven approach (Oza & Korkala, 2012; Mahnic & Zabkar, 2008; List et al., 2005; Neely et al., 2002; Kueng, 2000) and Agile principles and values. The approaches and metrics used in them are presented in the following chapters.
3.2.1 Balanced Scorecard
Balanced Scorecard (BSC) model developed by Kaplan and Norton (1992) in the early 1990’s is one of the first and best-known approaches to determine perfor-mance objectives and measure business performance. The aim of the model was "to align business activities to the vision and strategy of the business, improve

22
internal and external communications, and monitor business performance against strategic goals" (Kaplan & Norton, 1992). The model attempted to pro-vide a comprehensive view to business value by considering both financial and non-financial metrics, internal and external perspectives as well as present and future orientations. In order to ensure the broad picture of organizational health, the model identified four “perspectives” on which organizations should be meas-ured on: financial, customer, internal and learning and growth. (Kaplan & Nor-ton, 1992)
Since its introduction, Balanced Scorecard model has been revisited by sev-eral researchers and a range of modifications have been developed to better fit different industries. These include for example the Generalised Scorecard Model (Brook, 2000) that aims at expanding the scope of BSC model from business strat-egy and planning to any type of task. Within IT, one of the most comprehensive efforts to define performance objectives based on the BSC model has been the Software value map taxonomy developed by Khurum et al. (2013). By using the perspectives of the BSC model as its base, the model identifies a complete map of value dimensions and constructs relevant for software development.
The first value dimension in the software value map is customer value. Khurum et al. (2013) define this as the “capability to develop and deliver a prod-uct that satisfies customer requirements while offering high value that provides increased support for market success”. Value constructs within customer value are further divided into two categories: perceived value and customer lifetime value. Perceived value refers to the value that customer experiences. Instead of only considering the value that is delivered, perceived value includes also for example service and delivery aspects and the performance with respect to expec-tations. The concept of perceived value or, to use the same name, perceived net benefits has been used also by Rai et al. (2012), who identified it as one of the key determinants for information systems success.
In addition to perceived value, Khurum et al. (2013) identified customer lifetime value as another constituent of customer value. Customer lifetime value refers to the total value that a customer obtains by acquiring a given product in terms of revenues and costs. As the value is evaluated throughout the entire life-time of the product, the profit considerations include not just revenue and costs from the product itself but also costs from its acquisition, marketing and termi-nation (Khurum et al. 2013).
While customer value considers the external value of software development, the second value construct of the software value map, financial value, focuses on the business owner perspective. In their study of value in Agile software devel-opment, Alahyari et al. (2017) suggest financial value to “include all the strategies and aspects that organizations consider to improve their bottom-line”. Support-ing a similarly wide perspective, Hartmann and Dymond (2006) define financial value within software development as “software put into production that can return an investment over time”. From the financial perspective, shareholder value is a fundamental aspect of business valuation. Despite of its importance for the business owners, Khurum et al. (2013) suggest that financial measures such

23
as economic value added (EVA) often shift focus on attaining short-term goals and targets while long-term investments and objectives such as process improve-ment with considerably less attention.
The third value dimensions of the software value map, internal business perspective, considers value aspects that are related to maintaining the quality and competitiveness of the business processes. Internal business perspective can be further divided into two aspects: production value and differentiation value. Production value refers to the value of the software development process with respect to both market requirements as well as physical value such as production process with respect to time, cost or quality. In their study of value in Agile soft-ware development, Alahyari et al. (2017) suggests that especially delivery pro-cess with respect to time is regarded as an important production value aspect in Agile development organizations. Differentiation value, on the other hand, means the value that makes the end products attractive on the market with re-spect to the offerings of competitors. As was the case with the customer value, the differentiation value does not necessarily emerge from the product qualities but could also be related to another part of the sales funnel such as delivery, availability or price. (Khurum et al., 2013)
The last value dimension of the software value map is innovation and learn-ing. While the value construct of internal business processes looks at present business processes, the value construct of innovation and learning has its focus in the future. Khurum et al. (2013) classifies innovation and learning value into three aspects: value of technology, value of market and value of intellectual cap-ital. Value of technology refers to the potential that the subject technology could have in the future, whereas value of market considers the practical value that can be obtained by employing a technology in the market or internal processes. In-tellectual capital, on the other hand, includes all the knowledge about the soft-ware product and processes. In their study of proactive performance metrics, Brook (2001) suggest that performance measures within innovation and learning are particularly important for indicating future success.

24
Figure 5. Software value map (adopted from Khurum et al., 2013)
The entire software value map is presented in Figure 5. While the software value map has been developed for software development context, it has not been cus-tomized specifically for Agile development method. In their study the interpre-tation and prioritization of value in Agile development organizations, Alahyari at el. (2017) investigated the relevance of the different value dimensions and con-structs of the software value map in the context of Agile development. As their main finding, Alahyari et al (2017) identified customer value as the most priori-tized value dimension. Within the customer value dimensions, the organizations focused on perceived value and prioritized delivery process aspects such as time and quality over product aspects. Of the product aspects, functionality was per-ceived as the most important. (Alahyari et al. 2017) The findings were aligned with Kasauli et al. (2017), who also identified perceived customer value as the interpretation of value in Agile development organizations.
Regarding the other performance dimensions than customer value, Alah-yari et al (2017) found internal business processes to be another priority dimen-sion for Agile development organizations. Within internal business processes, there was mostly interest in quality aspects such as production process and prod-uct architecture. Interestingly, organizations only focused on production, while ability to differentiate from competitors received almost no attention. Alahyari et al. (2017) suggest, however, that this could differ between industrial domains de-pending on the complexity and size of deliveries.
Interestingly, innovation and learning and financial value received almost no attention in the study on value prioritization within Agile development or-ganizations. However, with respect to financial value, Racheva et al. (2009) have also obtained similar results. In their study of value creation in Agile projects, Racheva et al. (2009) find that most studies in Agile development performance do not explicitly define the concept of business value. Rather, the business value
Software value map
Customer value
Perceived value
Customer life time value
Financial value
Internal business
Production value
Differentiation value
Innovation and learning
Value of technology
Value of market
Intellectual capital
25
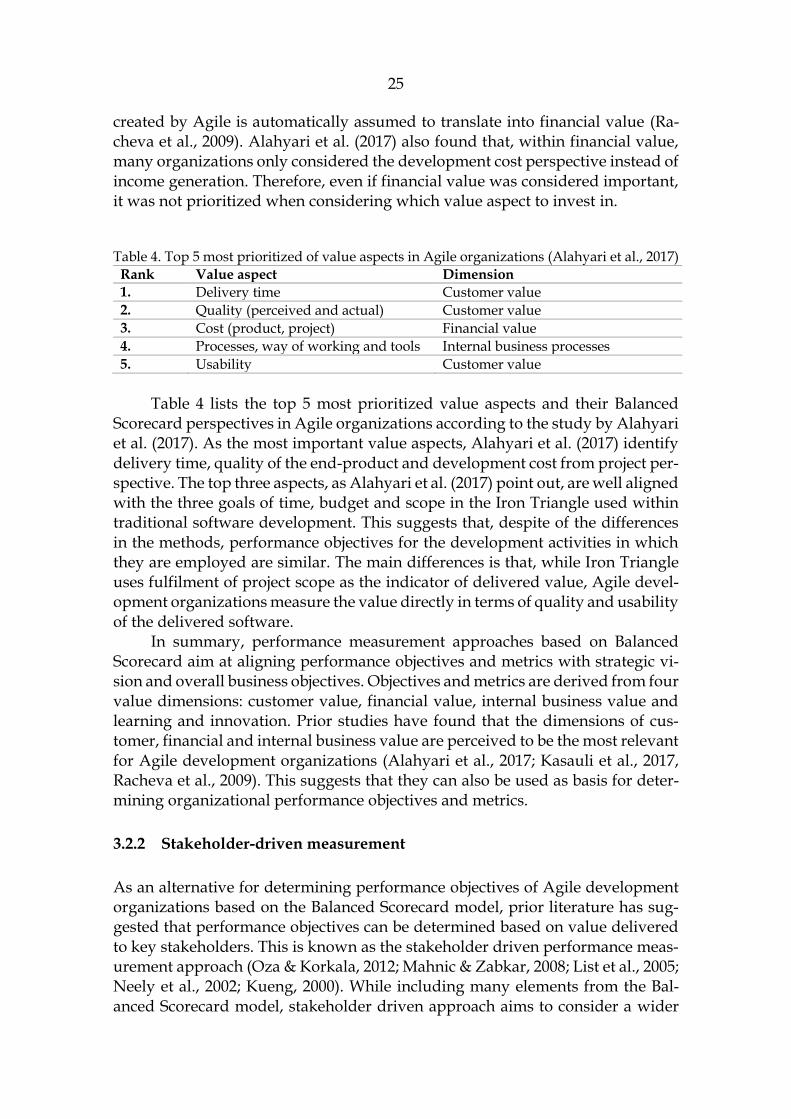
created by Agile is automatically assumed to translate into financial value (Ra-cheva et al., 2009). Alahyari et al. (2017) also found that, within financial value, many organizations only considered the development cost perspective instead of income generation. Therefore, even if financial value was considered important, it was not prioritized when considering which value aspect to invest in.
Table 4. Top 5 most prioritized of value aspects in Agile organizations (Alahyari et al., 2017)
Rank Value aspect Dimension
1. Delivery time Customer value
2. Quality (perceived and actual) Customer value
3. Cost (product, project) Financial value
4. Processes, way of working and tools Internal business processes
5. Usability Customer value
Table 4 lists the top 5 most prioritized value aspects and their Balanced
Scorecard perspectives in Agile organizations according to the study by Alahyari et al. (2017). As the most important value aspects, Alahyari et al. (2017) identify delivery time, quality of the end-product and development cost from project per-spective. The top three aspects, as Alahyari et al. (2017) point out, are well aligned with the three goals of time, budget and scope in the Iron Triangle used within traditional software development. This suggests that, despite of the differences in the methods, performance objectives for the development activities in which they are employed are similar. The main differences is that, while Iron Triangle uses fulfilment of project scope as the indicator of delivered value, Agile devel-opment organizations measure the value directly in terms of quality and usability of the delivered software.
In summary, performance measurement approaches based on Balanced Scorecard aim at aligning performance objectives and metrics with strategic vi-sion and overall business objectives. Objectives and metrics are derived from four value dimensions: customer value, financial value, internal business value and learning and innovation. Prior studies have found that the dimensions of cus-tomer, financial and internal business value are perceived to be the most relevant for Agile development organizations (Alahyari et al., 2017; Kasauli et al., 2017, Racheva et al., 2009). This suggests that they can also be used as basis for deter-mining organizational performance objectives and metrics.
3.2.2 Stakeholder-driven measurement
As an alternative for determining performance objectives of Agile development organizations based on the Balanced Scorecard model, prior literature has sug-gested that performance objectives can be determined based on value delivered to key stakeholders. This is known as the stakeholder driven performance meas-urement approach (Oza & Korkala, 2012; Mahnic & Zabkar, 2008; List et al., 2005; Neely et al., 2002; Kueng, 2000). While including many elements from the Bal-anced Scorecard model, stakeholder driven approach aims to consider a wider

26
group of stakeholders and therefore have a more holistic and long-term approach (Neely et al., 2002).
According to the stakeholder driven approach, best performance is achieved when the needs and objectives of all stakeholder groups have been met. While not all stakeholder groups may be equally relevant in all contexts, Oza and Korkala (2012) suggest that stakeholder driven approach leads to a balanced ap-proach considering different viewpoints and provides therefore a comprehensive foundation for performance metrics collection strategy. List et al (2005) also high-light the ownership aspect of the stakeholder driven measurement: once every indicator has been assigned a stakeholder group with interest in the performance and ability to impact it, performance evaluation is likely to yield results. Due to the importance of stakeholder relationships, Neely et al (2002) have used stake-holders as the foundation of their Performance Prism performance measurement model.
In their application of stakeholder driven performance measurement in software development, List et al. (2005) consider four principal stakeholder groups identified originally by Kueng (2000): investors, employees, customers and society. Mahnic and Zabkar (2008) present a more granular classification of stakeholders consisting of business management, team members, scrum master and customers in their study of process measurement in a scrum-based develop-ment organization. The objectives of the two key stakeholder groups, customers and owners or investors, are largely aligned with the value constructs of cus-tomer value and financial value in the software value map. Customer satisfaction consists of customer perceptions on net benefits of the software and overall pro-cess quality, such as timely delivery, completeness and flexible handling of changed requirements (Mahnic & Zabkar, 2008; Lis et al., 2005). Investor satisfac-tion is aligned with the financial value of the software development and can be measured with such indicators as profitability (Lis et al., 2005).
The stakeholder perspective of employees can include a wider variety of objectives. While Mahnic and Zabkar (2008) define employee satisfaction in terms of work conditions, well-being at work and workload, List et al. (2005) con-sider that it includes also development opportunities and learning. Similarly, the stakeholder perspective of society, that is mostly concerned with third-party im-pacts of software development, can be seen in multiple ways depending on the context. Despite of the context, the value constructs of employee satisfaction and impacts to society are unique to the stakeholder driven performance measure-ment approach since they are not explicitly included in the dimensions of the balanced scorecard.
Neely et al. (2002) suggests that, in addition to stakeholder wishes and re-quirements, organizations should also consider their own needs from the stake-holders in their performance measurement process. Neely et al. (2002) call this stakeholder contribution. As an example, employees may need to receive com-pensation and feeling of purpose from their work at the organization, whereas the organization needs them to be productive, flexible and loyal. Missing the per-spective of contribution may limit the value of the performance metrics.

27
Table 5. Examples of performance dimensions of stakeholder driven measurement STAKE-HOLDER GROUP
Performance dimen-sion
Examples of perfor-mance objectives
Source
INVESTORS Financial value Profitability, EBIT List et al., 2005; Kueng, 2000
EMPLOYEES Employee satisfaction Workload, working conditions, develop-ment at work
Neely et al., 2002; Mahnic & Zabkar, 2008; List et al., 2005
CUSTOM-ERS
Customer satisfaction Perceived net benefits, product quality, deliv-ery time
Neely et al., 2002; Mahnic & Zabkar, 2008
SOCIETY Value of externalities Impact on economy List et al., 2005; Kueng, 2000
The key stakeholder groups and performance objectives of the stakeholder
driven measurement approach are presented in table 5. As List et al. (2005) note, the list of stakeholders is not comprehensive nor universal but rather should be constructed and adjusted for each context. As an example, in their study of a Scrum-based organization, Mahnic and Zabkar (2008) evaluated the stakeholder objectives separately for the different roles in Scrum such as product owner and scrum master. The stakeholder dimension of competitors is missing from the key stakeholder groups in the original tool presented by Kueng (2000). This is be-cause competitors, along with enterprise-wide objectives, were regarded as inde-pendent forces driving performance indicators.
When comparing the stakeholder driven performance measurement ap-proach to the Balanced Scorecard model, the stakeholder driven approach cap-tures the value better with respect to for example employee satisfaction. In addi-tion, the value created for society at large, meaning the externalities of software development, is better addressed in the stakeholder driven approach than in the Balanced Scorecard that only considers business objectives. However, the stake-holder driven approach also has its shortcomings. As List et al. (2005) point out, the stakeholder driven approach does not consider for example the value of learning and continuous improvement. In order to capture this value construct, List et al. (2005) suggest adding innovation as a fifth key aspect in the stakeholder driven performance measurement model. Neely et al (2002) suggest even more adaptations by complementing stakeholder dimensions with strategy, process and capability dimensions.
All in all, both business-objective-driven Balanced Scorecard as well as stakeholder-driven measurement highlight the importance of covering both in-ternal and external perspectives as well as both short-term and long-term orien-tations in the performance objectives. Key performance dimensions include cus-tomer value, financial value and value to society as well as process value, em-ployee satisfaction and innovation and learning. Next chapter introduces perfor-mance measurement based on Agile principles.
28
3.2.3 Measuring based on Agile principles and maturity
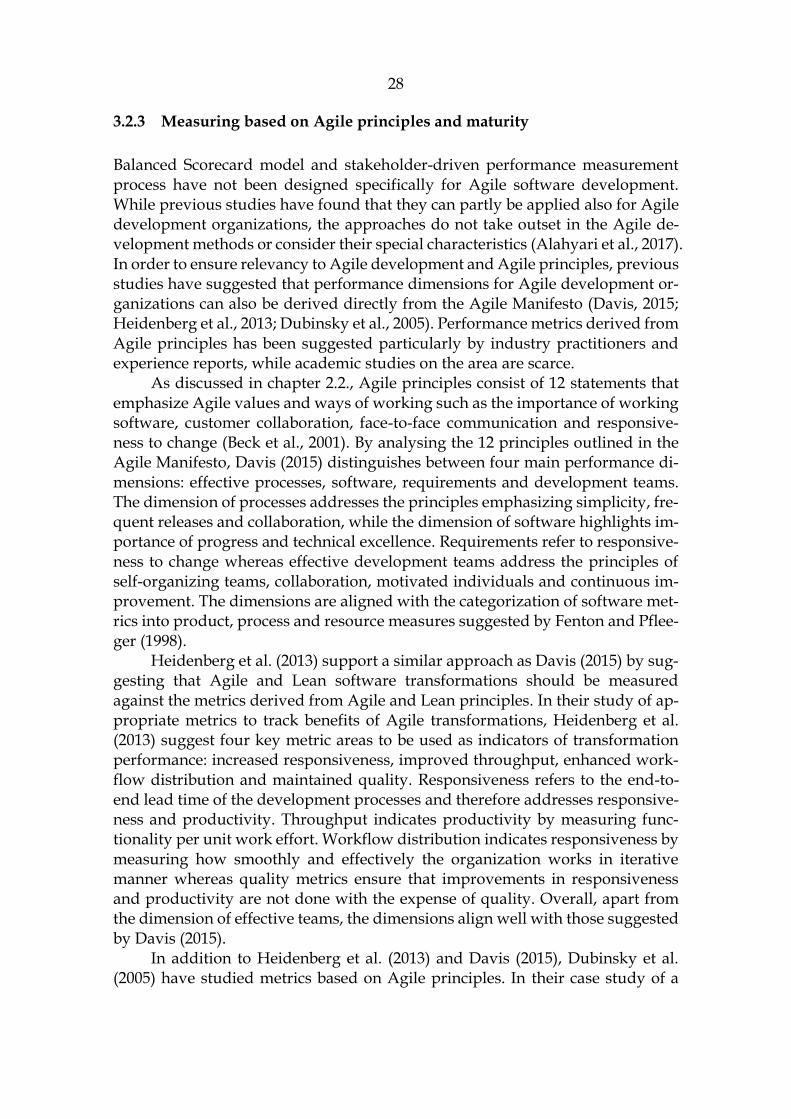
Balanced Scorecard model and stakeholder-driven performance measurement process have not been designed specifically for Agile software development. While previous studies have found that they can partly be applied also for Agile development organizations, the approaches do not take outset in the Agile de-velopment methods or consider their special characteristics (Alahyari et al., 2017). In order to ensure relevancy to Agile development and Agile principles, previous studies have suggested that performance dimensions for Agile development or-ganizations can also be derived directly from the Agile Manifesto (Davis, 2015; Heidenberg et al., 2013; Dubinsky et al., 2005). Performance metrics derived from Agile principles has been suggested particularly by industry practitioners and experience reports, while academic studies on the area are scarce.
As discussed in chapter 2.2., Agile principles consist of 12 statements that emphasize Agile values and ways of working such as the importance of working software, customer collaboration, face-to-face communication and responsive-ness to change (Beck et al., 2001). By analysing the 12 principles outlined in the Agile Manifesto, Davis (2015) distinguishes between four main performance di-mensions: effective processes, software, requirements and development teams. The dimension of processes addresses the principles emphasizing simplicity, fre-quent releases and collaboration, while the dimension of software highlights im-portance of progress and technical excellence. Requirements refer to responsive-ness to change whereas effective development teams address the principles of self-organizing teams, collaboration, motivated individuals and continuous im-provement. The dimensions are aligned with the categorization of software met-rics into product, process and resource measures suggested by Fenton and Pflee-ger (1998).
Heidenberg et al. (2013) support a similar approach as Davis (2015) by sug-gesting that Agile and Lean software transformations should be measured against the metrics derived from Agile and Lean principles. In their study of ap-propriate metrics to track benefits of Agile transformations, Heidenberg et al. (2013) suggest four key metric areas to be used as indicators of transformation performance: increased responsiveness, improved throughput, enhanced work-flow distribution and maintained quality. Responsiveness refers to the end-to-end lead time of the development processes and therefore addresses responsive-ness and productivity. Throughput indicates productivity by measuring func-tionality per unit work effort. Workflow distribution indicates responsiveness by measuring how smoothly and effectively the organization works in iterative manner whereas quality metrics ensure that improvements in responsiveness and productivity are not done with the expense of quality. Overall, apart from the dimension of effective teams, the dimensions align well with those suggested by Davis (2015).
In addition to Heidenberg et al. (2013) and Davis (2015), Dubinsky et al. (2005) have studied metrics based on Agile principles. In their case study of a
29
development team in Israeli Air Forces, Dubinsky et al. (2005) examined the ef-fects of adopting four performance metrics based on Agile principles: completed work in terms of test points, frequency of releases, burn-down of committed work and number of faults. The metrics were adopted to reach reduced delivery times, increased productivity, enhanced predictability and improved quality. The metrics were found to support the performance objectives well while there remained questions of their scalability. The 12 Agile principles and examples of performance categories and metrics derived from them are presented in Table 6.
Table 6. Examples of performance metrics derived from Agile principles
Dimen-sion
Agile principles Metric examples
Source
Producti-vity and work-flow
Simplicity—The art of maximizing the amount of work not done is essential.
Iteration ve-locity, throughput, workflow distiribution
Davis, 2015; Heidenberg, 2013; Dubin-sky, 2005
Deliver working software frequently, from a couple of weeks to a couple of months, with a preference to the shorter timescale.
Maintain a constant pace indefinitely—Ag-ile processes promote sustainable develop-ment. The sponsors, developers, and users should be able to maintain a constant pace indefinitely.
Our highest priority is to satisfy the cus-tomer through early and continuous deliv-ery of valuable software.
Respon-siveness
Welcome changing requirements, even late in development. Agile processes harness change for the customer’s competitive ad-vantage.
Lead time, re-lease fre-quency
Davis, 2015; Heidenberg, 2013
Quality Working software is the primary measure of progress.
Number of in-cidents, cus-tomer satis-faction
Davis, 2015; Heidenberg, 2013; Dubin-sky, 2005
Continuous attention to technical excellence and good design enhances agility.
Collabo-ration
The best architectures, requirements, and designs emerge from self-organizing teams.
Employee en-gagement, knowledge-sharing, im-provement ideas
Davis, 2015; Fontana et al. 2014 Business people and developers must work
together daily throughout the project.
Build projects around motivated individu-als. Give them the environment and support they need, and trust them to get the job done.
At regular intervals, the team reflects on how to become more effective and then tunes and adjusts its behavior accordingly.
Face-to-face conversation—The most effi-cient and effective method of conveying in-formation to and within a development team.

30
Performance measurement based on Agile principles focuses on measuring the benefits that Agile development methods are designed to deliver. Therefore, it assumes that the benefits outlined by Agile manifesto, such as shorter lead time, do indeed create value for the customer. Some studies take the reasoning even further by assuming that, when properly implemented, Agile development methods deliver value in all cases and therefore it is enough to simply measure the extent to which an organization follows and is able to implement them. This concept is known as maturity of Agile practices (Fontana et al., 2014; Leppänen, 2013). In contrast to metrics derived from Agile principles, maturity metrics do not attempt to measure outcomes of Agile development but rather organizational capabilities and the extent to which organizational practices and values are aligned with the Agile manifesto.
Concept of maturity within Agile software development has been studied for example by Fontana et al. (2014). They suggest that, since Agile development methods are based on shared principles rather than strictly defined processes, the definition of Agile software development maturity should include subjective capabilities such as collaboration, communication and commitment in addition to quantitative management capabilities. In their mixed method study of Agile maturity, Fontana et al. (2014) define Agile maturity in terms of eight Agile team practices: collaboration on projects, care for customer, acceptance of requirement changes, knowledge-sharing, use of agile tools, self-organization, continuous im-provement and generation of perceived management and customer outcomes. As the highest-maturity practices Fontana et al. (2017) identified those support-ing sustainable self-organization and test-driven development.
In addition to Fontana et al. (2014), Agile maturity has been studied by Leppänen (2013). In his comparison of six existing Agile maturity models, Leppänen (2013) identified five common dimensions on which the maturity of Agile is measured. Easiness-of-adoption evaluates the complexity of the princi-ples and practices that an organization has adopted. Essence of agility evaluates the extent to which the used practices and principles represent the core of Agile Manifesto. Level of understanding measures the extent to which an organization has understood the Agile values and degree of standardization the extent to which processes are optimized. Finally, focus measures the extent of the organi-zation that has adopted Agile practices. Most of the dimensions have been de-rived from the values of the Agile manifesto.
Overall, performance objectives and metrics derived from Agile principles emphasize responsiveness, productivity, quality and collaboration (Davis, 2015; Heidenberg, 2013; Dubinsky et al., 2005). Therefore, they primarily address the performance dimensions of customer value, internal processes and employees suggested by Balanced Scorecard model and stakeholder-driven performance measurement approach. Apart from measuring performance in terms of out-comes of Agile development methods, previous studies have suggested organi-zations to measure the maturity of their Agile practices and capabilities (Fontana et al., 2014; Leppänen, 2013). Even if the maturity metrics do not measure perfor-

31
mance directly, they indicate the sufficiency of organizational capabilities to per-form Agile development practices and therefore reach benefits outlined by them (Fontana et al., 2014).
While performance objectives derived from Agile Manifesto emphasize the value delivered to customer, the focus is on internal perspective of customer value and not on the value perceived by the customer. Instead of asking custom-ers for their satisfaction, Agile metrics focus on delivering for example frequent releases that are assumed to please customers. The measured value is also limited to benefits outlined by the Agile principles. Due to the internal focus, perfor-mance metrics derived from Agile principles and especially those focusing on maturity can be seen to resemble traditional software development in the sense that it is limited to a predefined scope. Instead of measuring external value di-rectly, both Agile metrics and traditional software development metrics measure fulfilment of internal criteria that are assumed to create value externally.
3.2.4 Summary of approaches
Due to the iterative nature of Agile software development, prior literature has suggested that project-based performance metrics used in traditional software development support Agile development poorly (Hartmann & Dymond, 2006). Instead, previous studies have suggested several approaches for determining performance objectives and metrics for Agile development organizations. These approaches, as presented in the previous chapters, include determining metrics based on strategic objectives of a business (Alahyari et al., 2017; Khurum et al., 2013; Kaplan & Norton, 1992), value derived to stakeholders (Oza & Korkala, 2012; Mahnic & Zabkar, 2008; List et al., 2005) and Agile principles and values (Davis, 2015; Heidenberg et al., 2013; Fontana et al., 2014). While approaches based on strategic objectives and stakeholders enable organizations to consider their performance holistically, approach based on Agile principles captures bet-ter the specific benefits that organizations aim to reach by adopting Agile devel-opment methods. Despite of their different perspectives, all approaches highlight the importance of customer value and improvement of internal processes.
Figure 6. Performance dimensions of Agile software development

32
Figure 6 presents a summary of the key performance dimensions of Agile development organizations based on all the three approaches (Alahyari et al., 2017; Fontana et al., 2014; Heidenberg et al., 2013; Oza & Korkala, 2012; Mahnic & Zabkar, 2008). Overall, previous studies have identified five performance di-mensions for Agile software development organizations: financial value, cus-tomer value, internal processes, collaboration and culture and innovation and learning. Two first ones of the dimensions, financial value and customer value, represent external performance while the other dimensions consider benefits to the development organizations themselves. In the figure, the performance di-mensions are structured according to value chain model introduced by Porter (1985) to highlight the stakeholders and value chain processes that they address.
First of the performance dimensions, financial value, refers to economic value of the activities carried out in the Agile development organization. It arises from Balanced Scorecard model as well as stakeholder needs of business owners. (Alahyari et al., 2017; Hartmann & Dymond, 2006). Customer value refers to all benefits delivered to the customer and, as the most emphasized performance di-mension, is present in all the measurement approaches. Internal processes ad-dress the efficiency of internal activities and operations. The importance of the dimension is especially emphasized in the Agile principles. Collaboration and culture address the resources of the organization focusing on the stakeholder group of employees. (Davis, 2015; Fontana et al., 2014; Oza & Korkala, 2012) Fi-nally, innovation and learning focus on the capabilities of the organization and its future ability to perform (Alahyari et al., 2017; Khurum et al., 2013).
Instead of suggesting an approach for determining appropriate perfor-mance metrics for Agile development organizations, Kupiainen et al. (2015) have examined which metrics organizations use in practice and for what purpose. In their systematic literature review of 30 primary studies, Kupiainen et al. (2015) found progress tracking and fixing or improving software process problems as the most common reasons for using software metrics. Common metrics used for both purposes such metrics as completed work, story flow and burndown while processes were additionally measured with for example lead time and processing time. In addition to tracking progress and improving processes, understanding and improving quality formed another key reason for using metrics, while using metrics for motivating people or planning was less common. The results are quite well aligned with the findings from other studies that suggest responsiveness, productivity, people and collaboration as the key performance areas for Agile development organizations. However, the study was limited to examine soft-ware development on team level.
In their review of appropriate Agile metrics, Harmann and Dymond (2006) argue that not all Agile principles and therefore performance dimensions are equally important. In their view, Agile organizations should have one key metric that addresses the delivered business value preferably in financial terms. All sub-ordinate metrics should be regarded as simply diagnostics that provide tools to achieve the targets on the main metric. (Hartmann & Dymond, 2006) Interest-ingly, Racheva et al. (2009) find that, despite of the importance of business value,

33
there is no clear definition of the concept in the context of Agile development organizations.
Despite of determining appropriate performance objectives and metrics, previous studies have suggested that organizations may struggle with creating value through performance measurement due to the difficulty to measure and use the selected metrics. In their study on the use of Agile metrics in a multina-tional technology company, Oza and Korkala (2012) identify several challenges in evaluating the value of Agile software development in practice. First, the view on appropriate metrics and their visibility may differ significantly between or-ganizational members. Product line management and quality assurance are typ-ically aware of more shortcomings related to metrics than the senior management. Second, use of team-specific metrics and measuring impact only on micro level may lead to sub-optimization and shift focus away from collective progress. Alahyari et al. (2017) have similarly identified the challenge of dependencies and need for holistic perspective. Third, visibility of the impact of micro metrics on macro objectives may be difficult to establish but crucial for the organization. To overcome these challenges, Oza and Korkala (2012) suggest that organizations should choose performance indicators whose impact can be measured on all lev-els and that promote holistic visibility to collective organizational progress.
In addition to Oza and Korkala (2012), Pfleeger (2008) and Hartmann and Dymond (2006) have realized the challenges in measuring performance in Agile development organizations and the importance of ‘how’ aspect in measuring. In order to avoid and overcome challenges in performance measurement in Agile development organizations, they propose several best practices for measurement. As one of the key recommendations, they suggest focusing on trends instead of numbers. Pfleeger (2008) points out that simple scales may give valuable infor-mation on trends and performance on a given area even if the exact data points are uncertain. Furthermore, they recommend selecting only few metrics that are easy to collect data and provide feedback on frequent basis. (Hartmann & Dy-mond, 2006; Oza & Korkala, 2012) Harmann and Dymond (2006) also highlight the importance of ensuring that there is someone responsible for each metric with the ability to make changes based on the results to create value based on the in-formation.
In summary, this chapter has studied the performance and performance measurement of both traditional and Agile software development. While soft-ware development has been suggested to create value on multiple dimensions both internally and externally, the performance evaluation of traditional software development has been mostly based on the fulfilment of predefined success cri-teria instead of the generated value. Performance evaluation of Agile develop-ment organizations, in turn, is more founded in the value that the development delivers in terms of customer value and business objectives and important measures include for example delivery process time and product quality. Next, the following chapters present the findings from the empirical part of the study.
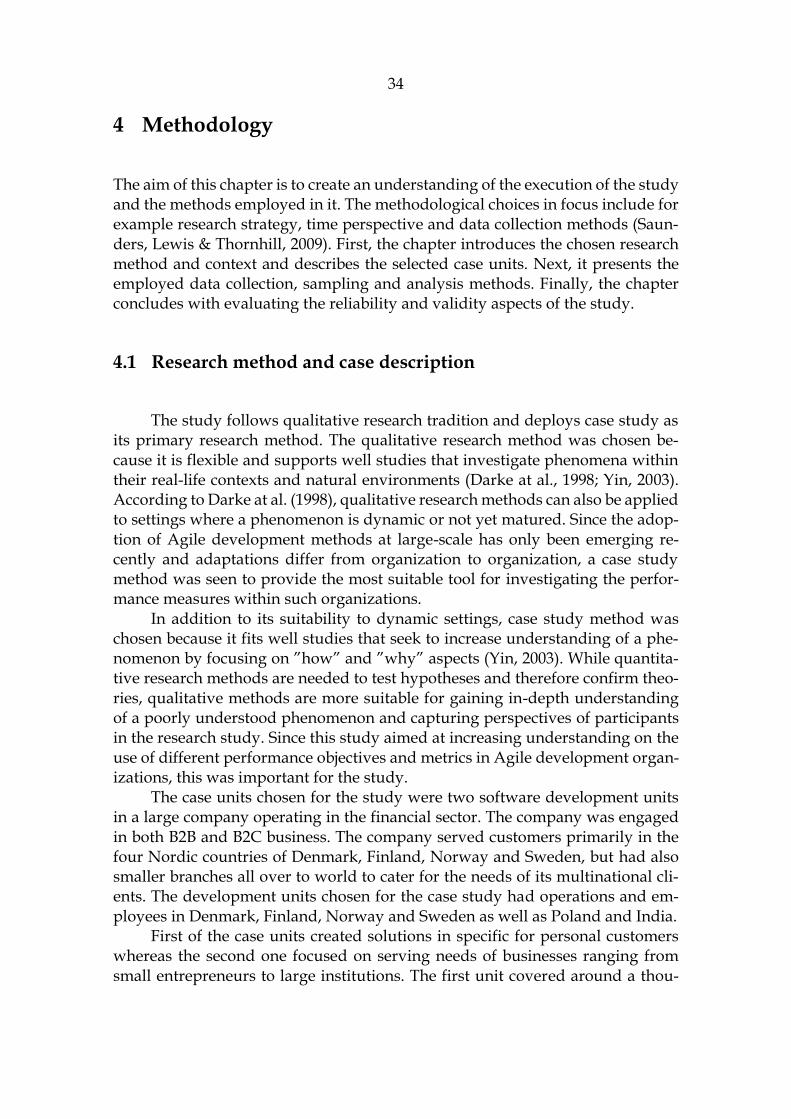
34
4 Methodology
The aim of this chapter is to create an understanding of the execution of the study and the methods employed in it. The methodological choices in focus include for example research strategy, time perspective and data collection methods (Saun-ders, Lewis & Thornhill, 2009). First, the chapter introduces the chosen research method and context and describes the selected case units. Next, it presents the employed data collection, sampling and analysis methods. Finally, the chapter concludes with evaluating the reliability and validity aspects of the study.
4.1 Research method and case description
The study follows qualitative research tradition and deploys case study as its primary research method. The qualitative research method was chosen be-cause it is flexible and supports well studies that investigate phenomena within their real-life contexts and natural environments (Darke at al., 1998; Yin, 2003). According to Darke at al. (1998), qualitative research methods can also be applied to settings where a phenomenon is dynamic or not yet matured. Since the adop-tion of Agile development methods at large-scale has only been emerging re-cently and adaptations differ from organization to organization, a case study method was seen to provide the most suitable tool for investigating the perfor-mance measures within such organizations.
In addition to its suitability to dynamic settings, case study method was chosen because it fits well studies that seek to increase understanding of a phe-nomenon by focusing on ”how” and ”why” aspects (Yin, 2003). While quantita-tive research methods are needed to test hypotheses and therefore confirm theo-ries, qualitative methods are more suitable for gaining in-depth understanding of a poorly understood phenomenon and capturing perspectives of participants in the research study. Since this study aimed at increasing understanding on the use of different performance objectives and metrics in Agile development organ-izations, this was important for the study.
The case units chosen for the study were two software development units in a large company operating in the financial sector. The company was engaged in both B2B and B2C business. The company served customers primarily in the four Nordic countries of Denmark, Finland, Norway and Sweden, but had also smaller branches all over to world to cater for the needs of its multinational cli-ents. The development units chosen for the case study had operations and em-ployees in Denmark, Finland, Norway and Sweden as well as Poland and India.
First of the case units created solutions in specific for personal customers whereas the second one focused on serving needs of businesses ranging from small entrepreneurs to large institutions. The first unit covered around a thou-

35
sand full-time employees and the other one couple of hundreds. Both units rep-resented in-house development, meaning that they developed solutions to serve the needs of the respective division’s own customers instead of creating the soft-ware for an external client.
Both the development units broadly followed Agile development methods. Specifically, the unit focusing on personal customers had adopted Scaled Agile framework (SAFe). The second case unit followed a less prudent adaptation of SAFe and made use of different adaptations of Scrum depending on the depart-ment and team in question. Even if the software developers had been working in Agile setup for more than 5 years, the other members of both organizations had transformed into Agile development methods only two years ago and hence still felt relatively new to the ways of working. This had naturally implications also to performance metrics and measurement setup, that was described as being still in the middle of a transition and perceived to be improving month by month.
Following SAFe, the development portfolios in the units were structured in Agile release trains known as program level. The Agile release trains were cross-functional virtual teams of Agile teams that shared a purpose and a development domain. Altogether, each of them consisted of 50-125 individuals. The trains were further organized in larger structures called hubs based on the customer journey or problem they focused on serving. These structures, however, were more of a strategic nature than part of the execution organization. To further complicate the execution structure, the people working within it were managed according to line organization. In contrast to development purpose and domain, the line organization units were organized according to roles and capabilities. This meant that for example mobile software developers were gathered in one line organiza-tion unit and UX designers in another.
In the unit focusing on solutions for personal customers, the development process consisted of 12-week program increments (PI) that were further divided into two-week sprints. Each of the cadences began by sprint planning where backlog items were organized and prioritized into the sprint. The development cadence was completed with a demo of the results in terms of working software. In the end of the PI, there was also a retrospective and a review per each train to discuss progress and impediments hindering it. The end of the PI served there-fore also as an opportunity to revise prioritization and resourcing.
In the unit focusing on corporate customers, the development process was equally structured into two-week sprint but was not aggregated further into 12-week PIs. The performance follow-up and prioritization process were organized according to the annual cadence of the business with monthly follow-ups. In team level, development practices and ceremonies were mainly adopted and modified from Scrum or Lean Agile.

36
4.2 Data collection
The main data collection method used in the study was interviews with open-ended questions. Interviews were selected because they enable researcher to ob-tain rich data that gives real in-sights to the phenomenon under investigation. In interviews, it is also possible to ask additional questions to clarify issues, which improves validity. On the other hand, interviews are affected by the artificiality of the situation, which can affect the results. Furthermore, the researcher charac-teristics can influence the data and for example lack of trust between the inter-viewee and the inter-viewer may decrease the quality of the data (Myers & New-man, 2007; Singleton, Straits & Straits, 2005).
There can be identified several different types of interviews, of which the main types are structured interview, semi-structured or unstructured interview and group interview. In structured interview, the complete question script is pre-pared beforehand and there is no room for improvisation. In semi-structured in-terview, researcher has prepared some questions beforehand, but there is also possibility to discuss topics outside the script. In group interview, there are in-terviewed several people at once. In this study, the data was collected by semi-structured interviews, because they leave flexibility to clarify questions or raise points beyond the predefined questions while still being structured enough to address the research topic. (Myers & Newman, 2007)
The interview participants were chosen intentionally, making use of a snowball sampling method were the first interviewees were asked to nominate suitable other interviewees. In order to be selected, the interviewees were re-quired to work closely with performance management or have a good under-standing of performance measurement in their unit. The sampling also aimed at ensuring that there was a good balance between different Agile roles, organiza-tional levels, genders, locations and the two case units within the interviewees. The purpose of the diversity was to capture different perception of the phenom-enon and therefore improve validity of the results.
Altogether, ten people were interviewed to the study. Of these, five repre-sented the first case unit and another five represented the other one. The inter-view participants represented different functional roles as follows:
2 Portfolio-Level Manager 2 Operational-Level Managers 2 Business Developers 1 Subject-Matter Expert 1 Agile Coach 1 Product Owner 1 Software Developer The interviewees had been in their roles in average 2,5 years. Most of them
had, however, had years of previous experience from digital development. Seven

37
participants had their background primarily from business development while the others had mainly worked with IT development from the technical side.
The interview participants were based either in Denmark or Finland but represented six different nationalities. The age of them ranged from late 20s to late 50s, and both genders were equally represented. In order to protect the ano-nymity of the participants, detailed demographics are not presented.
All interviews were conducted individually and hold in English. They were started with an introduction to clarify the concepts of the study and the topics of the interview. After that, the interview was structured in three sections: perfor-mance objectives, performance metrics and performance measurement process. The interviewees had a chance to ask clarifying questions throughout the inter-view. The time reserved for each interview was 60 minutes, while the average length excluding the introduction phase was 35 minutes. All the interviews were recorded, and answers transcribed afterwards for the data analysis. The inter-view questions and the interview structure are presented in Appendix 1.
According to Singleton et al. (2005), one of the best ways to avoid weak-nesses of single methodological choices and measures is to use triangulation meaning the use of multiple data sources. The principle of triangulation was fol-lowed in this study by using documents concerning the performance metrics as a secondary data source. These included for example performance reports and presentations for executive decision boards. Documents as data sources do not share the same weaknesses as interviews and therefore improve the reliability of the results (Singleton et al., 2005).
4.3 Data analysis
Data analysis means the activity of structuring and transforming data in order to discover useful information, understand results and draw conclusions. In this study, qualitative content analysis has been employed as the primary research method. Qualitative content analysis can be defined as a ”research method for subjective interpretation of the content of text data through the systematic classi-fication process of coding and identifying themes or patterns” (Hsieh & Shannon, 2005). By other words, it aims to provide detailed and contextual understanding of the studied phenomenon by examining patterns or themes in the data. Quali-tative content analysis is a flexible method for analysing textual data and popular within qualitative research. (Hsieh & Shannon, 2005; Braun & Clarke, 2006)
There can be identified several different approaches to qualitative content analyses. Conventional content analysis refers to an approach where coding cat-egories are derived directly from the text data. It is most commonly used in in-ductive analyses. Directed content analysis, in turn, uses theory or research find-ings as guidance for the coding categories and is mostly used in deductive studies. This study mainly followed the conventional approach as it is considered the best option for studying phenomenon on which previous studies are scarce. (Hsieh & Shannon, 2005) However, the data was also coded for the performance objectives

38
and metrics identified in the literature to complement the inductive categories. The mix the two methods is known as abductive approach.
The qualitative content analysis process was carried out by following the six-step process for thematic analyses presented by Braun and Clarke (2006). The process started by familiarizing with the data, which was done by reading the interview transcripts through and writing initial ideas down as notes. In the sec-ond step, generating initial codes, the data was reviewed again, this time system-atically transforming all interesting quotes into named codes. On the third step, these initial codes were grouped into code categories or themes. On the fourth step, the themes were checked against the text extracts to make sure the interpre-tation fitted the data. Once refined and finalized, the themes were given names. The process concluded by producing a report of the analysis by selecting vivid and representative examples for each theme. Atlas.ti software for qualitative analyses was used to assist in the coding.
4.4 Validity and reliability
Validity can be defined as the extent to which a study measures the concepts that it is designed to investigate. Reliability, in turn, refers to the repeatability of the results under different circumstances. Yin (2003) distinguishes between three type of validity regarding case study research: construct validity, internal valid-ity and external validity. While construct validity measures if the study has used correct operational measures, internal validity refers to non-spuriosity of internal relationships. External validity means the extent to which the results can be gen-eralized to different domains. (Yin, 2003)
Despite of the popularity of qualitative research approaches, they have faced criticism for lack of scientific rigour and credibility. In this study, several actions have been taken to ensure validity and reliability of the results. Firstly, the data collection has been designed according to a protocol recommended by Braun and Clarke (2006) and the methodology has been described in this chapter. Secondly, as recommended by Myers and Newman (2007), there has been made an effort to capture a variety of views among the interviewees by having a range of different roles, organizational units and nationalities represented among them. In addition to this ”triangulation of subjects”, the data has been triangulated by using performance reports and presentations as a secondary data source. Finally, both the data collection and analysis of the results were grounded and reflected to prior literature in order to establish a domain for generalization. Through these measures, the study aimed at maximizing the validity and generalisability of the results.

39
5 Study findings
This chapter presents the results of the empirical part of the study. The first part of the chapter focuses on identifying and presenting the performance objec-tives and metrics used in the case organizations on organizational level. The sec-ond part presents performance objectives and metrics used below the organiza-tion-level in Agile release trains and teams. The last subchapter outlines other observations from the study focusing especially on the challenges within perfor-mance measurement. Citations from the data are used to illustrate and support the propositions.
5.1 Performance objectives and metrics on unit level
The most important performance objective in both case units was value de-livered to the customer. “We measure our performance on if we are able to pro-vide digital solutions that make our customers' life easier”, as one of the inter-view participants (I9) summarized their main unit objective. The objective was commonly phrased as customer satisfaction or customer experience. Customer satisfaction was perceived both as an end goal as well as a lead indicator for in-come generation. Satisfied customers were assumed to have higher engagement with the company in the future than unsatisfied customers and therefore gener-ate more income. Satisfied customers were also assumed to attract more new cus-tomers and therefore contribute to the future income more than their own share.
On unit level, there were two main metrics used to determine the perfor-mance in the units: Net Promoter Score (NPS) and Customer Experience Index (CEI). NPS is an index that it is based on customers’ likelihood to recommend a company’s products or services to others on scale from 1 to 10. To arrive in NPS, one must first calculate the difference between customers promoting the com-pany (answers 9-10) and those detracting from others from the company (an-swers 1-6) and then compare it to the with the number of all respondents. CEI, on the other hand, is an average of customers’ overall satisfaction with the prod-ucts and services they are receiving. While the use of NPS and CEI as metrics was a company standard, the customer based that they were measured on varied be-tween the units and their subunits. On unit level, the case units measured the two indices from the service channels that they were responsible for.
In addition to value delivered to the customer, another key performance objective for both the case units was financial value. Financial value was ap-proaches through both of its main components of income and cost and typically compared to results in the past. On the income side, the main metrics included income, turnover and sales. Similarly to customer satisfaction, those were meas-ured for the service channels that the units were in charge of. Since the official accounting model in the company was based on customer responsible units and

40
neither of the development units had direct responsibility over customers or products, the metrics formed a sort of shadow accounting and hence were used only internally. This means that they were not visible on the company P/L sheet.
On the cost side, the financial objectives were two-fold. Naturally, both units had their budgets that were regularly followed up and set boundaries for the activities. However, instead of an explicit objective, the budgets were per-ceived mostly as a given scope or capacity limit to operate within. This might have also been influenced by the organizational setup that only enabled cost ag-gregation on unit level and thus did not support cost responsibilities on team level. “The plan we had about having a hub "account", so you could see the spending per hub, we don't have that. That is a miss-out, because the managers we have in hubs cannot see the spend for example in travel” one of the interview participants(I1) illustrated.
More than budgets and direct costs generated by the development units, cost side objectives in the development units focused on enabling cost savings and efficiencies elsewhere in the organization. The units might for example aim at digitalizing a workflow that previously required physical meetings or at auto-mating a manual report in order to save postal expenses and free up advisory time. Another example could be adding digital services that had the potential to reduce incoming requests to call centre. Since the time and resources saved by these activities could either be converted to cost savings or reinvested as a time for new sales, these activities were commonly referred as building enablers rather than delivering cost savings. They were also considered to have an impact on the income generation, as one of the interview participants demonstrated: “a lot of these digital solutions we deliver, of course they give us cost savings, but many times they are also a driver for income because if for customers things are too cumbersome and too paper-based, it is a factor in winning deals.”(I9) The metrics used for the cost saving potentials varied according to the activity and were not necessarily aggregated on unit level.
Tightly linked to customer satisfaction and financial value, IT stability was another important performance objective in the case units. IT stability was per-ceived to signal overall quality in the product development and implementation. Another motivation for its selection was its high impact on the two other primary objectives, customer satisfaction and financial value. “If we have downtime all the time and people are not able to use the channel, we don't earn any money” (I8) one of the interviewees described. IT stability was measured in terms of num-ber of incidents reported and application downtime.
In addition to customer satisfaction, income generation, enabled cost sav-ings and IT stability, the development units also had performance objectives re-lated to growth of the user base and the services offered. These objectives, how-ever, were not necessarily perceived as end goals but rather as secondary metrics supporting the main ones. The linkages between the metrics were in general rec-ognized to a large extent and, even if there was no formalized categorization, a a distinction was often made between primary and secondary objectives. The pri-mary objectives could often by characterised as reactive or lagging performance

41
metrics, while the secondary objectives were more proactive in nature and there-fore predicted performance going forward. As an example, income generated by a specific digital platform might be perceived as a primary objective, whereas the net change in active users might be used as a supporting objective to ensure that the income would keep on developing into the desired direction also in the fu-ture. Quotes regarding this kind of categorization are presented in Table 7.
Table 7. Quotes on categorizing KPIs INTERVIEW QUOTATION
1 The overarching should be the value creation. The others are then just in-dicators on what is our ability to do that.
4 The platform objectives of being stable and having a higher customer sat-isfaction that everybody else, that really ties back because we make more money when the customers are happy.
4 But obviously the biggest objective with every little feature is product health. It just needs to work.
9 I guess those [income and turnover] are the primary ones. Then there are a lot of complementary numbers around that like how many users on the platform are active and how many users are habitual users
Table 8 below summarizes the key performance indicators and the objec-tives they measure for the two development units on unit level. While there are variations in the metrics, customer satisfaction, financial performance and IT sta-bility were perceived as key performance objectives in both units. Efficiency, in-terestingly, was not measured on unit level in either of the units even if it often brought up as an important objective.
Table 8. Performance objectives and metrics in the units
Case unit Performance objective Key Performance Indicators
Case Unit 1 Customer satisfaction Net Promoter Score (NPS)
Income growth Digital sales
Products available digitally
Operational efficiency Call reduction in call centres
Chatbot deflaction
Self servicing coverage
Product quality IT stability and availability
Case Unit 2 Customer satisfaction Net Promoter Score (NPS)
Likelihood to recommend
Income growth Income
Turnover
Number of active customers
Product quality IT stability and availability

42
The performance objectives on unit level were mainly determined by over-all strategic priorities of the company. The Group priorities could either be used directly as unit performance objectives or the unit objectives could be derived from them. Instead of being just a source of inspiration for selecting performance objectives for the units, contribution towards the Group priorities was in fact re-garded as the primary motivations for measuring performance in the first place. The Group objectives themselves were dictated by shareholders.
In addition to the Group priorities, market and competitors were regarded as another important factor in determining which objectives to prioritize on unit level. Changing customer requirements and competitive pressure were per-ceived to have major implications for income generation and were therefore con-sidered carefully when setting the objectives and KPIs. Due to digital services representing a relatively unmatured industry and service channel, market condi-tions tended to change even more rapidly than in some other business areas.
Some market conditions were also influenced by regulation, and therefore regulation could also act as a direct or indirect driver for the performance metrics. As an example, new PSD2 regulation reduced barriers to enter the market for financial services for many non-bank enterprises and increased therefore com-petitive pressure for the banking sector. Regulation might also impact the cus-tomers, requiring for example a different kind of documentation on their finan-cial activities, and impact the market therefore through changing customer needs. “The customers also have a reporting burden on their end. We then have to deliver the required data in a way that is easy for the customers to consume and work with” (I9) one of the interview participants explained.
Interestingly, Agile ways of working were not perceived to have any role in setting the performance objectives for the unit. While the Agile frameworks that the units had adopted included suggestions for metrics to guide organizations to mature in their ways or working and maximize the benefits from their use, these were only measured on operational levels or then used as a support metric in-stead of key performance indicator for the unit. Next, the following chapter pro-vides on overview of performance objectives and metrics below the unit level.
5.2 Performance objectives and metrics below unit level
On organizational levels below the unit level, organization structure had a major impact on performance measurement and metrics. As described in chapter 4, ex-ecution organization was separated from line organization in both the case units. The dimensions of the resulting matrix were also followed up on separate met-rics. To further complicate the performance measurement structure, there existed a major divide in terms of performance follow-up between the hubs and Agile release trains in the execution organization. The overall structure with main per-formance measures is presented below in Figure 7.
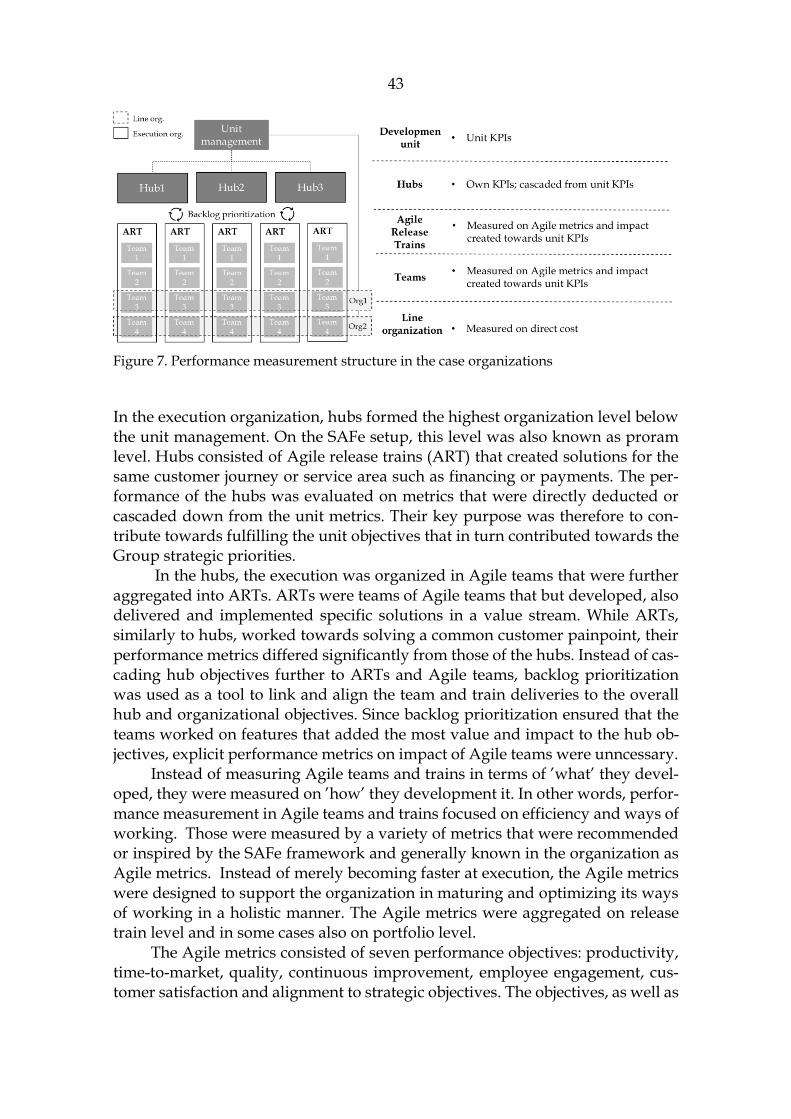
43
Figure 7. Performance measurement structure in the case organizations
In the execution organization, hubs formed the highest organization level below the unit management. On the SAFe setup, this level was also known as proram level. Hubs consisted of Agile release trains (ART) that created solutions for the same customer journey or service area such as financing or payments. The per-formance of the hubs was evaluated on metrics that were directly deducted or cascaded down from the unit metrics. Their key purpose was therefore to con-tribute towards fulfilling the unit objectives that in turn contributed towards the Group strategic priorities.
In the hubs, the execution was organized in Agile teams that were further aggregated into ARTs. ARTs were teams of Agile teams that but developed, also delivered and implemented specific solutions in a value stream. While ARTs, similarly to hubs, worked towards solving a common customer painpoint, their performance metrics differed significantly from those of the hubs. Instead of cas-cading hub objectives further to ARTs and Agile teams, backlog prioritization was used as a tool to link and align the team and train deliveries to the overall hub and organizational objectives. Since backlog prioritization ensured that the teams worked on features that added the most value and impact to the hub ob-jectives, explicit performance metrics on impact of Agile teams were unncessary.
Instead of measuring Agile teams and trains in terms of ’what’ they devel-oped, they were measured on ’how’ they development it. In other words, perfor-mance measurement in Agile teams and trains focused on efficiency and ways of working. Those were measured by a variety of metrics that were recommended or inspired by the SAFe framework and generally known in the organization as Agile metrics. Instead of merely becoming faster at execution, the Agile metrics were designed to support the organization in maturing and optimizing its ways of working in a holistic manner. The Agile metrics were aggregated on release train level and in some cases also on portfolio level.
The Agile metrics consisted of seven performance objectives: productivity, time-to-market, quality, continuous improvement, employee engagement, cus-tomer satisfaction and alignment to strategic objectives. The objectives, as well as
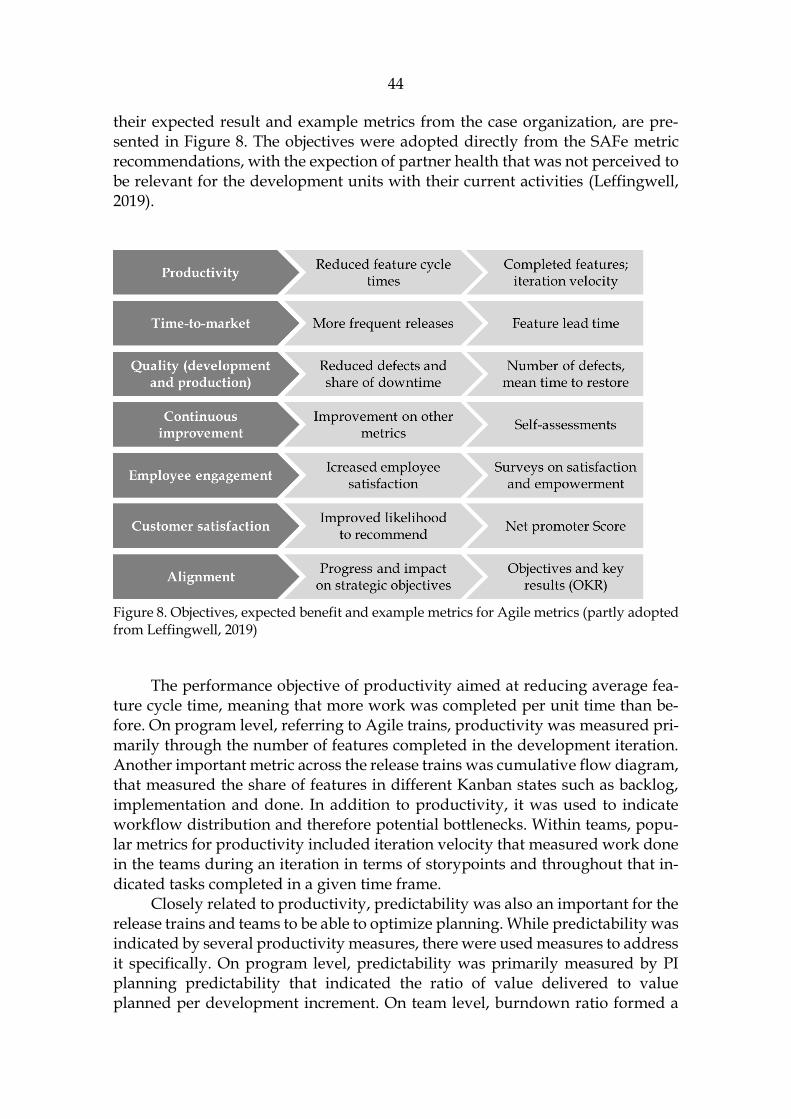
44
their expected result and example metrics from the case organization, are pre-sented in Figure 8. The objectives were adopted directly from the SAFe metric recommendations, with the expection of partner health that was not perceived to be relevant for the development units with their current activities (Leffingwell, 2019).
Figure 8. Objectives, expected benefit and example metrics for Agile metrics (partly adopted from Leffingwell, 2019)
The performance objective of productivity aimed at reducing average fea-ture cycle time, meaning that more work was completed per unit time than be-fore. On program level, referring to Agile trains, productivity was measured pri-marily through the number of features completed in the development iteration. Another important metric across the release trains was cumulative flow diagram, that measured the share of features in different Kanban states such as backlog, implementation and done. In addition to productivity, it was used to indicate workflow distribution and therefore potential bottlenecks. Within teams, popu-lar metrics for productivity included iteration velocity that measured work done in the teams during an iteration in terms of storypoints and throughout that in-dicated tasks completed in a given time frame.
Closely related to productivity, predictability was also an important for the release trains and teams to be able to optimize planning. While predictability was indicated by several productivity measures, there were used measures to address it specifically. On program level, predictability was primarily measured by PI planning predictability that indicated the ratio of value delivered to value planned per development increment. On team level, burndown ratio formed a

45
similar key metric for predictability by measuring the percentage of work deliv-ered in the teams to the work that the teams had committed to.
The performance objective of time-to-market focused on efficiency from the customers’ perspective, meaning the frequency of releases. Time-to-market was measured by feature lead time that formed one of the most important perfor-mance indicators in the execution parts of the case units. Lead time measurement covered both the time from idea to execution as well as time from execution to implementation. By measuring feature lead times, the development units aimed at improving the speed and efficiency of the flow from an idea to an implemented product. Despite its importance, the maturity levels of the units had its impact on the usability of the lead time data and hence the units experienced several challenges with the metrics, as one of the interview participants described: “When you measure feature lead time, we have trains who are breaking up that so that now we have a planning feature, then we have a preparation feature, then we have a run feature and then an implementation feature, and those will look super good on the feature lead time because they are sequencing the feature but basically the total feature lead time is plus+plus+plus+plusp+plus. Then we have others that work correctly with this. So right now it's about understanding the data, getting equipped and behind the figures” (I1).
Apart from productivity and time-to-market, quality of work formed an-other key performance objective for the Agile release trains and teams. In devel-opment, these included number of defects and test automation ratio, referring to number of automated test to all test. In production, the metrics consisted of num-ber of business critical incidents and mean time to restore, meaning time it took to restore service after incident. The exact metrics could vary between teams and sometimes also qualitative evaluations such as self-assessments and peer reviews were made use of in the measurement.
Even if included as one one of the key objectives within the Agile metrics, continuous improvement had almost no metrics to follow performance on. This was partly due to the maturity levels of the development units: when establishing performance metrics, they had prioritized other performance areas. Recently, however, one of the case units had started to measure continuous development through DevOps self-assesments and by looking at the participation of teams in innovation events.
Complementing the efficiency measures, performance obejctives for the Ag-ile release trains and teams included also customer satisfaction and employee en-gagement. Customer satisfaction was measured though app ratings and Net Pro-moter Scores on the digital platforms that the trains and teams were responsible for. The measures varied across trains and were not aggregated on portfolio level. Employee engagement, in turn, was measured with a group wide quarterly sat-isfaction survey. To capture the satisfaction dimensions that were most critical for the development organizations, the units had complemented the common survey with additional questions on empowerment, purpose and collaboration.
Despite of all teams being measured on the Agile metrics and some metrics being aggregated also on portfolio level, the teams were rarely compared or

46
benchmarked to each other at least formally. While that was partly due to miss-ing data and low quality of metrics, main reason behind it was a conscious deci-sion. The management did not wish the teams to compete with each other and focus their efforts on beating another team on some metrics but more to build internal ways of working and improving their own performance. ”This is usually the fail in many organizations in the beginning”, one of the interviewees (I3) de-scribed and continued ”they start comparing and benchmarking the teams with each other. That is not the right way of doing it.”
Even if Agile teams were not measured or evaluated on the organizational objectives, they were encouraged to measure the impact that they create with their features. This was also addressed in the Agile metrics with the performance objective of alignment that aimed at ensuring that the release trains and teams created impact in terms of the startegic objectives of the units. However, setting these performance metrics and following them up was entirely up to the teams. The autonomy aimed at maximising the ownership that the teams felt regarding their KPIs and providing the teams with freedom to choose how to achieve the end goal. The measures were also primarily used only within the Agile teams to create and maintain motivation and therefore did not need to capture the impact created on unit level. Unlike the more formalized efficiency-related KPIs, these measures were also not necessarily followed up on regular intervals but depend-ing on when impact of a feature could be visible.
In order to assist teams in setting their own feature KPIs and standardize practices, both units had recently introduced “Objectives and Key results” (OKR) framework. The purpose of OKR was to guide teams in setting and evaluating metrics for their development features. Introduced originally by Intel and used among others in Google and Amazon, OKR required all features to have an over-all objective as well as 2-5 quantitative Key Results that could be used to measure process towards the objective. “We have a lean business case for every project that we develop. Those are driven by OKRs, so you have to have an objective and key results. Key result could be anything: ‘tested on five customers and all of them got 5’ or ‘the unit test was perfect’.” described one fo the interviewees (I4). Apart from saving time and effort from development teams, the framework was adopted to increase alignment across the development teams.
Even if the main KPIs were often quantitative and the OKR framework highlighted the importance of being able to measure and quantify progress, there was also made use of qualitative data in the teams. Qualitative data was per-ceived to balance quantitative metrics and provide a more holistic view of per-formance. While qualitative metrics were not necessarily used as actual KPIs due to the difficulty to objectively evaluate them, they were viewed as important in-put when creating concepts and making decisions regarding future direction. Qualitative data was perceived to add depth and explanatory value to the per-formance level indicated by a numeric metric. “We don’t complement the numer-ical metrics with them, but rather we complement people’s perception of our cur-rent state with that” (I10).

47
All in all, efficiency and productivity were seen as the most important per-formance objectives for execution organization below the unit level. While hub management had the responsibility to ensure that the execution organization was continuously working on most value-adding features, Agile trains and teams were responsible for doing it as efficiently as possible.
The line organization had a very minor role in performance measurement in the development units. As described in chapter 4, its primary function was to provide resources for the execution organization, and thus it was mainly meas-ured on direct cost. Apart from that, it was responsible for developing and man-aging individuals in the organization, for which reason it was measured on em-ployee satisfaction. In the following, next chapter will present the performance meatricss on employee satisfaction and other performance enablers in detail.
5.3 Performance enablers
As described, the development units addressed performance measurement ho-listically and recognized interdependencies between different metrics. Some met-rics were regarded as primary performance metrics, whereas some were meas-ured because they had a close relationship to a primary KPI or indicated its future performance. In addition to supporting KPIs, there were some performance areas that were recognized as important for achieving the overall performance objec-tives but had such an indirect impact that their formal measurement was not per-ceived to be worth the effort. Within this study, these performance areas are called enablers.
One of the most frequently mentioned performance enabler in the develop-ment units was learning. While it was not measured at all or only measured on portfolio level, both the case units addressed it through different initiatives and had systematic plans for improving them. Perhaps as the most important, each unit regularly organized a retrospective, a meeting to look back at previous de-velopment cadence and identify learnings for the future. Retrospectives were commonly organized monthly and part of the rituals belonging to the Scaled Ag-ile Framework.
In addition to retrospectives, learning and innovation were fostered in the development units by arranging quarterly hackathons and innovation days. Both events allowed participants to leave their normal work and focus intensively on solving a single important problem for a day or two. Often arranged in cross-functional and cross-ART teams, the events provided the participants also with an opportunity to learn and get inspired from each other. Regular knowledge-sharing meetings, demos and developer communities facilitated learning within and across the development teams further. Even if there were no follow-up in learning progress made on those events, one of the case units followed up team participation in the learning and innovation events to encourage and ensure im-provement.

48
Even if learning was not formally measured on team level, one of the case units set so called ‘cultural behavioural goals’ for all their teams. The cultural goals required the teams to identify specific improvement areas in their ways of working, take actions to learn and improve them and score their progress each sprint. The progress was reviewed after each sprint as well as quarterly. Despite of being regularly discussed, however, there were no specific measures or targets for learning in the units. Table 9 presents examples on learning and innovation approaches in the case units.
Table 9. Quotes on learning and innovation approaches INTERVIEW QUOTATION
2 We are following how many teams have participated either in cross-hub hackathons or hub innovation days
3 We do arrange hackathons and learning sprints. In SAFE in general inno-vation and learning should be an incorporated part of the ways of work-ing. So in every retrospective you should find some learning points that you’d like to place into the backlog of the team or the hub
4 We also have monthly experience meetings where the developers and front-enders actually show what they develop. It is not necessarily a sum-mary, it is more like a demo, but is anyway a knowledge-share which also helps you just to know how people are doing.
4 What we do, we also have retrospectives every two weeks. And we are raising as managers – or the scrum masters will raise – how was the col-laboration with other teams. Did you improve anything? Did you learn anything? Each team has cultural goals. Our cultural goals in my team are learning and automating.
5 For the past three years we have had regular hackathons in our unit where we take 1,2 or 3 days where we make improvements. That can either be internal improvements or to our product. The purpose of doing the Hacka-thons is also to learn about new ways of working and new technology and to experiment across teams. Then we also have both front-end and back-end developer communities with regular intervals, around every half year, that are self-organized conferences that developer use to share knowledge. Then we have monthly experience meetings across all roles where we share both from the business side and the technical side presen-tations and highlights of the activities we have done, projects we have done etc. That is to facilitate knowledge-sharing across the whole floor.
6 When I think about, we actually do some things like the retros. So we try to identify any obstacles or impediments that we meet in the process or outside it. But we do not keep any soft metrics on that level.
8 We of course have a high objective ensuring that we don't always keep doing as we do all the time but that we think it through. But that's again inserted in our ways of thinking, it's not part of our performance KPIs.
Similar with innovation and learning, employee satisfaction and working culture was another area that was not necessarily regarded as an objective itself

49
but as an enabler for achieving primary performance objectives. Employee satis-faction was measured quarterly in the units and actions were taken to address the issues and improvement areas arising from the satisfaction survey. However, in most cases, the follow-up was mainly conducted due to a Group wide require-ment initiated by the Human Resources organization, not a practise initiated by the unit itself. While the quarterly survey was published for teams following the line organization, results from some of the questions were also summarized for the development teams. The results, however, were not presented and discussed on the same forum and to the same audience as the unit-level performance objec-tives.
Regarding employee satisfaction and working culture in the Agile teams, there was a specific focus on employees and teams feeling empowered and au-tonomous and that their work had a real impact that contributed towards the organizational objectives. These aspects of employee satisfaction were followed up and discussed separate from the employee satisfaction survey. There were also constantly introduced new initiatives to improve them for example through organizational setup. In addition to empowerment and impact, collaboration and teamwork created a third focus area. Perceptions on employee satisfaction and its importance for Agile development are demonstrated in Table 10.
Table 10. Quotes on employee satisfaction and empowerment INTERVIEW QUOTATION
1 We measure quarterly, in what we call the Pulse check, what is the level of empowerment: ”do I feel empowered in my job”, super important. The other thing that we really care about is the impact part: ”in my team, we deliver impact to customers”
2 So it is the overall average of a People Pulse survey results, and then cer-tain questions like “we are good at measuring the impact of our deliver-ies”, “in my team people challenge and support each other” and then also “I feel empowered to take ownership and influence”.
8 For instance we work very much with what we call autonomous teams. Meaning to be autonomous, it means that you put a lot of decision power into the team instead of that they need to ask manager or manager's man-ager. So we put a lot of that mandate into the team and that creates a lot of motivation
8 We know that happy people work better and take large ownership. I would not say that we have specific measurements that we measure it on, but we know that the results are better on our deliveries if people are happy.
In short, learning, employee satisfaction and collaboration were regarded
as the most important performance enablers in the Agile execution organization. While they were not part of formal KPIs, they were systematically addressed through multiple initiatives. Employee and team empowerment, in particular, was an area that was perceived as highly important or even requirement for hav-ing success on formal KPIs.

50
5.4 Challenges and observations on performance measurement
An all levels and roles of the development units, intervieview participants had a good understanding on performance measures in their units and the over-all performance measurement structure. Despite understanding what was ex-pected, interview participants named numerous challeges with the prevailing structure and had multiple ideas to improve it. This chapter presents those chal-lenges and improvement ideas as well as other key observations form the inter-views.
5.4.1 Disconnect between organizational and operational KPIs
Perhaps the most frequently mentioned and obtrusive challenge was a feel-ing of disconnect between the unit KPIs and the work delivered in the teams. Many of the interview participants perceived that it was difficult for the teams to know how, if at all, they contributed to the overall unit KPIs or to identify what direct impact they created on them. On one hand, the disconnect was perceived to be caused by the unit level objectives and KPIs being on such macro level that it was difficult to cascade them down to the micro features. On the other hand, since the teams were in charge of measuring the impact of their development work themselves, another explanation for the disconnet was the inability of the teams to select and implement metrics that would demonstrate the connection. If the team members did not fully know or understand the overall KPIs or their constituents, for example, it could create a feeling that their work has no signifi-cance for the organizational KPIs. The feeling of disconnect is demonstrated by quotes in Table 11.
Table 11. Quotes on disconnect between operational and organizational metrics
INTERVIEW QUOTATION
5 But I do hear from a lot of colleagues and developers, for example, that there is this disconnect between these high level KPIs that are reported regularly every quarter - talking about customer retention, active use base, turnover and income - and then the work that they individually are doing and understanding how it affects these high level KPIs
6 Then the translation of these objectives or helping to understand how they work in everyday life is not always working.
7 I would also elevate the Agile metrics or the development efficiency met-rics to the train and the unit level in order to include that also because much of our activity and investment is on the Agile structure or release train level there. It would be very good to follow that up on a higher or-ganizational level as well.
9 I would say it is a challenge. It is something that we talk about in the team regularly. We would like to see a more direct result. It is quite indirect the way we work. Not just our team.

51
External factors impacting the KPIs formed another related and frequently
mentioned challenge for the teams in their performance measurement. Even if a team felt that their delivery did matter for one of the overall organizational KPIs, they felt that the KPI was influenced by so many or so powerful other factors beyond their control that their ability to have an impact was negligible. As an example, a team might cnsider that an additional feature that they developed for a platform did add value for the customers, but since the unit-level measure of customer value was a general satisfaction question presented to a random sample of customers, the impact of the single feature on the whole banking experience felt insignificant for them.
While the interviewees responsible for designing the organizational KPIs recognized the challenge, they also saw a downside in setting more specific and actionable KPIs. In their view, operational and actionable KPIs increased motiva-tion for the teams that worked on the area and could directly impact them, but were irrelevant for most other teams and made it harder to see the overall organ-izational progress. In order to cover all the teams and activities, the organizations would then need to have tens of KPIs, which in turn was impractical for top man-agement. “It is a hard problem to solve. I haven’t found a good solution even though I have been thinking about it for very very long time” (I10) one of the interviewees commented on the trade-off between actionable and holistic perfor-mance metrics. The interviewee also described the problem further: “If we have KPIs that are like unit level, if they are very high teams don’t feel connected to them. Then if they are very granular, then instead of three high level KPIs we have 20. Then one is that it is hard to digest all of them, like how are we doing. But then also, maybe 15 of them are relevant for one hub, and 5 of them relevant for another hub. Then you are not interested in the whole, because you cannot impact the whole.”
Despite of the trade-off, more throughtfully designed measures and well-established causality mapping between them were mentioned as ways to close the disconnect. By being able to clearly demonstrate how the results of a single team contributes to the unit KPIs, management believed they could convince the Agile teams on their ability to have an impact and make a difference. ”I think that for the organisation to understand what is a strategy and why they are here – meaning the Agile teams and developers – they do need to pin it to the metrics and to the strategy. That is the learning point for us at the moment that people don’t always understand why they are here. So the metrics will help them.” (I3) one of the interview participants commented. Interestingly, all interview partici-pants perceived the connection between operational and organizational level KPIs crucial for the organization to deliver optimal results. It was not considered enought if the objectives were aligned if there was no connect between the met-rics.
Apart from difficulties to see how their work contributed to the unit objec-tives, some interview participants expressed concern on if the objectives were the

52
right ones. Especially interviewees from the operational levels of the organiza-tion perceived contradiction between creating customer value and financial value, also known as business value. Members of the development teams felt that some features that had major impact on customer satisfaction might not have equally significant impact in terms of increased income or reduced cost. They were concerned that, when this was the case, the leaders on higher levels of the organization chose to prioritise the features with higher financial impact, even if impact on customer satisfaction was lower. As the interviewees recognized them-selves, whether this in fact was the case was difficult to track and discuss since there was no data to enable the discussions, but nevertheless the concern was shared by several people especially on the operational levels of the units. “We can give a label of some sort of the customer experience impact, but this is not necessarily something that is driving the feature priorities right now. My percep-tion from the things that I find on these hub boards is that business impact is the one that is deciding”(I6) one of the interview participants described.
5.4.2 Data availability and measurement effort
In addition to concerns on contradictory objectives and the disconnect be-tween organizational KPIs and operational level metrics, data availability formed another frequently named challenge for performance measurement. Almost all interviewees mentioned inadequate data availability or consistency as a factor limiting their ability to measure performance and use the measurement to guide activities. However, approaches for measuring performance on areas that lacked available data seemed to differ. Some interviewees, especially those representing operational level in the organizations, used data availability as one of the criteria for setting metrics. If there was no data to measure something, that would not become a metric or KPI. Others, in contrast, chose to select their metrics regard-less of whether there was data available or not. If a selected metrics turned out to be unavailable, they started working towards having data to measure it and used other metrics in the meantime. Quotes in Table 12 demonstrate these contradict-ing views.

53
Table 12. Quotes on data availability and its impact
INTERVIEW QUOTATION
2 Well, we started with high ambition level. We didn’t care if we had data or not, we just decided that we’ll find the data later on. For that reason, for some of the measures like lead time, we have only recently started to get the data.
5 From my experience a big driver has been to develop KPIs that are good enough proxies to the change we want to affect but is also realistic and relatively cheap to collect. So it can be a bit of a balance between mapping the behaviour change that we really want to some data we can realistically get
6 In a situation where we have a customer facing product, we could be better at collecting data and reaching out to customers for understanding what is important and what is not.
7 Data availability, so that is one key point. We would be able to make more sophisticated metrics if data would be more consistent and more available to be used and the data quality would be on a better level. We have been a bit limited on setting the metrics because of the underlying data, so what we can measure and report.
9 I would say the data availability is really key, having the overview. Know-ing whether you cover everything in a big organization like this, where it is difficult to know for sure that you have the full answer to the question.
Closely related to data availability, effort required to collect and process data for performance metrics was also named as a challenge for performance measurement. The effort was perceived as a cost that needed to be minimized and overweighed by a sufficient benefit in order for a metric or even the meas-urement practice to make sense. Should the measurement of a specific metric take too long time or require a capability to be acquired, many interviewees said they would drop it. Especially interviewees in teams with no adequate tools or addi-tional resources available to support with the measurement struggled with this challenge. They also perceived the data collection and processing effort as a lim-iting factor for performance measurement in their area. Quotations regarding performance reporting effort and systems support are presented in Table 13.

54
Table 13. Quotes on performance reporting effort and systems support
INTERVIEW QUOTATION
4 But in terms of the feature teams or my team objectives, you know we want to automate everything, so that ties back to the organization. Because it is a cost saving opportunity, people don’t need to hunt down correlations. So we really try and automate everything, we really try and be as fast as possible with the follow-up and also, be part of the analysis process.
5 Then we have also had some issues with that it actually takes a lot of time to collect the data and process it in a systematic and reproduceable way. So getting these thing to work out again and again and again is actually a lot of work.
7 Then I would say the second point is the tools, so how do we put the met-rics together and what are the tools available for reporting purpose. As I mentioned, we are using to large extent excel and then that of course re-quires quite much manual effort when putting the metrics together or parsing the data in order to populate the metrics and report on it.
8 Because I don't have any systems to support it either which is another im-provement area. I only report on financials. It is handled manually
In addition to lack of time and resources, lack of skills and guidance for setting KPIs and processing data were also recognized to limit the ability to per-form performance measurements and evaluations. This was perceived to be a challenge especially on operational level in the Agile teams that were themselves responsible for setting KPIs for their development features. While the practise was designed to maximize ownership that the teams felt on their KPIs, many in-terviewees felt that the teams had insufficient capabilities for selecting KPIs and linking them to the organizational performance objectives. They also suffered from lack of baselines and benchmarks to be able to interpret their performance metrics in a meaningful way as demonstrated in quotes in Table 14. The chal-lenge was also recently recognized and acted upon by management, since both case units had recently adopted the OKR framework to guide performance metric selection and reporting.
Table 14. Quotes on lack of performance reporting guidance
INTERVIEW QUOTATION
9 When we do new projects and new features, we do habitually have a dis-cussion about the KPIs, but if I reflect on it I would say that it is hard to come up with meaningful KPIs. Because we can for example easily track the number of users, but that doesn’t necessarily tell us anything, give any meaningful insights
9 Also having a clear framework for how we actually define what is a rele-vant KPI.
10 We have a lot of data, it is more like making people aware of where to get them. Making data available and making people aware of where to get them.

55
Apart from Agile teams, lack of guidance and structured approach for set-ting and reporting performance metrics formed a challenge also for managers on unit level. In absence of standard procedures, each team and unit performed per-formance evaluation as they saw fit, if at all. This made it difficult to benchmark the units and learn from best-in-class. It also resulted in to varying quality of data used to support decisions on prioritization between the units which was a major concern for management. “But other areas [] don't measure the same way. Then they just take decisions on best guesses and not necessarily on facts. So we could definitely improve the output if we had more facts and facts is also about how you measure.” one of the interviewees (I8) described the problem.
5.4.3 Dependencies and end-to-end measurement
In addition to challenges that specifically concerned performance metrics and measurement, there were mentioned some general organizational challenges that also had implications on performance measurement. One of these was col-laboration across units that followed different ways of working. While Agile setup was perceived to have improved collaboration within the units, it had com-plicated working with other units. The challenge arose mainly from different ca-dences: even if two units both followed Agile ways of working, one of them might have two-week sprints while the other one could follow three-month ca-dences. The lack of synchronization made it difficult to fit schedules together and have support in reasonable time frame. “Where I see a big issue is when the sup-port organizations like GDMO became Agile. You know, we don’t use SAFE, we don’t have three-month PIs but just two-week sprints. But when a support or-ganization where you have a dependency turns Agile and they use three month sprint, you immediately have not a dependency but an interdependency because when everyone works Agile, you cannot get anything done” exemplifies one of the interviewees (I4).
Despite its challenges, enhanced collaboration across units – including those having different cadences and ways of working – was of increasing im-portance in the case units. There was focus especially on creating and improving end-to-end processes. Each unit typically had good control of the part of the pro-cess that it was directly responsible for, but nobody had overview and ownership of the entire process. Hence, initiatives to integrate processes and improve the end-to-end flow were also limited. However, now that Agile maturity level in the individual units had increased and every team had control over their own pro-cess, there was interest for measuring the processes more holistically and starting to improve them in collaboration across units. This increasing focus on end-to-end processes is demonstrated through quotes in Table 15.

56
Table 15. Quotes on focus on end-to-end processes
INTERVIEW QUOTATION
3 Also on the full end-to-end ability to integrate things because now we have been focusing mainly on the front-end perspective and we have left the back-end a little bit. We have not measured that. How well is the end-to-end journey digitalised, for instance. So we have strategically chosen only to focus on the customer part, because that increases customer satis-faction. But then now, we need to understand that we need to start work-ing with the end-to-end, because the customer satisfaction can go down if the end-to-end journey has not been completed.
7 Something is cooking, we are moving towards closed loop development, where we would go into measuring for example released features in terms of self-servicing features, where we would then also measure the overall impact across the value chain so also the process improvement
8 So we did sent a lot of documents out by post and then we wanted to digitalize those flows. But changing the processes behind that, we had pro-cess people for that in our projects. We only were responsible for the digital part of it, not the process part. But in the new context I do think we will]so
Apart from end-to-end process measurement, organizational maturity level was mentioned as an enabler also for other processes and improvement initia-tives. Several interview participants mentioned that it also played an important role when selecting and prioritizing performance metrics especially related to Agile ways of working. Many of the Agile practices built on each other, and hence, if one did not have the basics in place, there was no use for measuring and ad-vanced practice. Therefore, the relative importance of the KPIs was viewed to depend on the Agile maturity level of the organization and the KPIs were there-fore prioritized and reviewed from time to time. “I would say that some of them are more relevant for the time being”, one of the interview participants (I2) com-mented. ”For example these lead times are very relevant for the time being as we are starting to have good data related to those. So it gives us excellent data to start to improve our throughput time in certain areas of development.”
Despite of the numerous challenges that the interview participants reported, perceptions to performance measurement in the units were overall positive. Both units still perceived themselves as relatively young and immature as Agile de-velopment units. They had seen a lot of progress in ways or working – both re-garding development and performance measurement activities – during the past years and therefore expected also the current situation to improve significantly in the near future as they were to become more mature. To complement their words, they referred to numerous ongoing development and improvement initi-atives. In both units, there were special business development teams dedicated to ensuring that those improvements were implemented and ways or working therefore enhanced.
As the most important enabler for improving their performance measure-ment setup, interview participants especially from managerial level mentioned data-driven mindset and setup in Agile principles. While there were evident needs also for improving systems and tools and redesigning measures, mindset

57
and old ways of thinking were seen as equally essential for achieving high impact levels and delivering value. Basically, the development units perceived that one cannot mature in Agile ways of working without also having a business transfor-mation and the other way around. ”[In the beginning] we very much saw the Agile and the business transformation as separate items or the Agile transfor-mation as a lever to achieve the business transformation but now we see it all as one. That is basically a learning we have been having. If you don’t have an Agile mindset and outset in real data, then we will never achieve the business transfor-mation”(I1).

58
6 Discussion
Performance measurement is essential for enabling continuous improvement in Agile software development organizations. Prior studies have suggested numer-ous metrics, yet little is known on the metrics and practices that Agile organiza-tions use to measure their performance in practice. Particularly, there is a knowledge gap regarding the use of metrics on organizational level, since most prior studies have focused on teams (Kupiainen et al., 2015). This chapter com-bines empirical evidence with insights from contemporary research literature to describe what kind of performance objectives Agile development organizations have, which performance metrics they use to measure the objectives and how do the objectives compare to those suggested by prior literature. In addition, the chapter highlights factors impacting and challenging performance measurement in Agile development organization.
6.1 Performance objectives and metrics in Agile development or-ganizations
Previous studies on performance measurement suggested that Agile develop-ment organizations deliver value on five key performance dimensions. The di-mensions also formed key objectives to measure performance towards. As the most frequently mentioned value dimension and performance objective, previ-ous studies identified customer value (Alahyari et al. 2017; Heidenberg et al., 2013; Oza & Korkala, 2012). Financial value was highlighted especially from cost perspective (Alahyari et al. 2017; Hartmann & Dymond, 2006). Internally, Agile software development created value for processes (Alahyari et al. 2017; Hei-denberg et al., 2013), collaboration and culture (Fontana et al., 2014) as well as ability to innovate and learn (Alahyari et al., 2017). The performance dimensions are summarized in Figure 6.
In line with the prior literature, also the empirical part of the study found value delivered to the customer to be the most important performance objective for the case units. The definition of customer value, however, was on defined in a more limited manner than in the literature. Prior studies had for example con-sidered product quality, functionality and usability as well as responsiveness and delivery time to indicate customer value in addition to customer satisfaction (Alahyari et al., 2017). In contrast, the case units covered value delivered to cus-tomers on unit level with mainly two performance objectives, customer satisfac-tion and IT stability. While program level metrics covered also responsiveness in terms of lead time and included some usability and functionality metrics, they were not aggregated or reviewed on unit level. One explanatory factor for the relatively narrow scope could be the in-house nature of the development: the units developed services mainly to keep existing customers loyal and satisfied,

59
not to sell the services to new customers and hence delivery factors had perhaps less importance. Furthermore, the units covered a large range of applications, due to which it might have been difficult to find universally relevant usability and functionality metrics on unit level. Nevertheless, a wider scope might still have enabled the case units to capture the customer value in a more holistic man-ner. In addition, it could have improved the visibility of the impact that Agile trains had on the unit level performance, which Oza and Korkala (2012) suggest to be of high importance.
Another performance dimension that was equally highlighted in literature and the empirical findings was performance regarding internal processes (Alah-yari et al. 2017, Davis, 2015; Heidenberg et al., 2013). As suggested by literature, the case units measured productivity, predictability and production and devel-opment quality as part of their Agile metrics. Interestingly, however, the use of these metrics was limited to the Agile execution organization, meaning Agile teams and trains. Even if some of the measures were aggregated on portfolio level, they were not part of KPIs for neither of the units. The Agile metrics were also not always discussed and presented in the same forums as the unit KPIs. This was explained and justified mainly by their internal nature and the context that was required to read and interpret them. Furthermore, the internal use was partly a quality issue, since for many of the metrics, the units had managed to obtain relevant data only recently, and the measurement quality still varied even within teams of the same unit.
While value customer value and internal processes were regarded as prior-ities both in literature and the empirical findings, financial performance was em-phasized more in the case units than in previous studies. Even if previous litera-ture had recognized financial value as one of the key performance dimensions and suggested it to be used as a key metrics, prior research had found only its cost dimension to be prioritized in Agile development organizations (Alahyari et al. 2017; Hartmann & Dymond, 2006). The case units, on the other hand, per-ceived financial value as the one of the key objectives that most of the other per-formance objectives supported. The units had metrics on both generated income as well as time and cost savings enabled by the development activities. The dif-ference could be partly driven by the organization structure: instead of merely developing new software, both the case units had responsibility over certain ser-vice channels that made the measurement of financial value more convenient and important than in case of pure development units. Furthermore, the status of the case units as parts of a publicly listed company may also partly explain their need to measure and emphasize value delivered to shareholders.
The performance dimension of collaboration and culture, mostly focusing on employees as stakeholders, was mentioned both in contemporary research lit-erature as well as by the interview participants (Davis, 2015; Fontana et al., 2014.). However, there were some variations to the views. In the case units, employee satisfaction and collaboration were perceived mostly as enabler for achieving other performance objectives, not as KPIs in themselves. Apart from couple of collaboration and engagement related questions as part of the Agile metrics that

60
teams and trains were measured on, collaboration and employee satisfaction were not formally measured. There were systematic efforts and initiatives to im-prove them and some teams even set objectives for them, but they were not part of performance objectives as literature suggested. Furthermore, the case units perceived people-related metrics to concern mostly employee satisfaction and engagement. Acceptance of changes or self-organization or other metrics focus-ing on Agile mindset suggested by Fontana et al. (2014) were not, at least explic-itly, considered to performance metrics.
Similar as with collaboration and culture, the performance dimension of in-novation and learning was also highlighted both in literature review and in the empirical findings (Alahyari et al., 2017; Fontana et al., 2014). However, as with employee satisfaction, the case units considered innovation and learning rather as an enabler or supporting factor in achieving main performance objectives than as a performance objective of its own. As one of Agile principles, continuous im-provement was perceived as an integral part of SAFe framework and Agile prac-tices. Instead of focusing on measuring their success within innovation and learn-ing, the units had put effort into integrating learning and innovation related rit-uals such as retrospectives, knowledge-sharing sessions and hackathons into their habits and work cadence. The metrics that existed concentrated on captur-ing organizational participation and use of the established rituals.
It appeared that all performance objectives used in the case units on unit and program level could be identified to represent one of the performance di-mensions suggested by prior literature. Value delivered to society at large, sug-gested by stakeholder-driven performance measurement approach (List et al., 2005), was not addressed neither in the case units nor in prior literature focusing on metrics use particularly in Agile development organizations. Apart from cus-tomers and owners, only regulators formed an external stakeholder group that was considered when setting performance objectives such as IT stability. How-ever, that had necessarily nothing to do with Agile software development but more with the highly regulated industry domain that the case company operated on.
Table 16 presents an overview on performance dimensions and objectives in Agile software organizations based on both prior research literature and em-pirical findings of the study. In summary, customer value, financial value and internal processes can be observed to form the most important performance di-mensions for Agile development organizations. Relevant performance objectives for them include for example customer satisfaction, product quality, production cost, productivity and predictability. Apart from financial value, employee satis-faction, working culture and innovation and learning were further identified as key enablers for achieving high performance. Even if all the performance dimen-sions and objectives suggested by prior literature were reflected in the case units to some extent, they were not all used on the unit level as Table 16 demonstrates. Most of the unit level objectives were also measured on program level in Agile trains and teams, or at least the teams were encouraged to develop metrics to
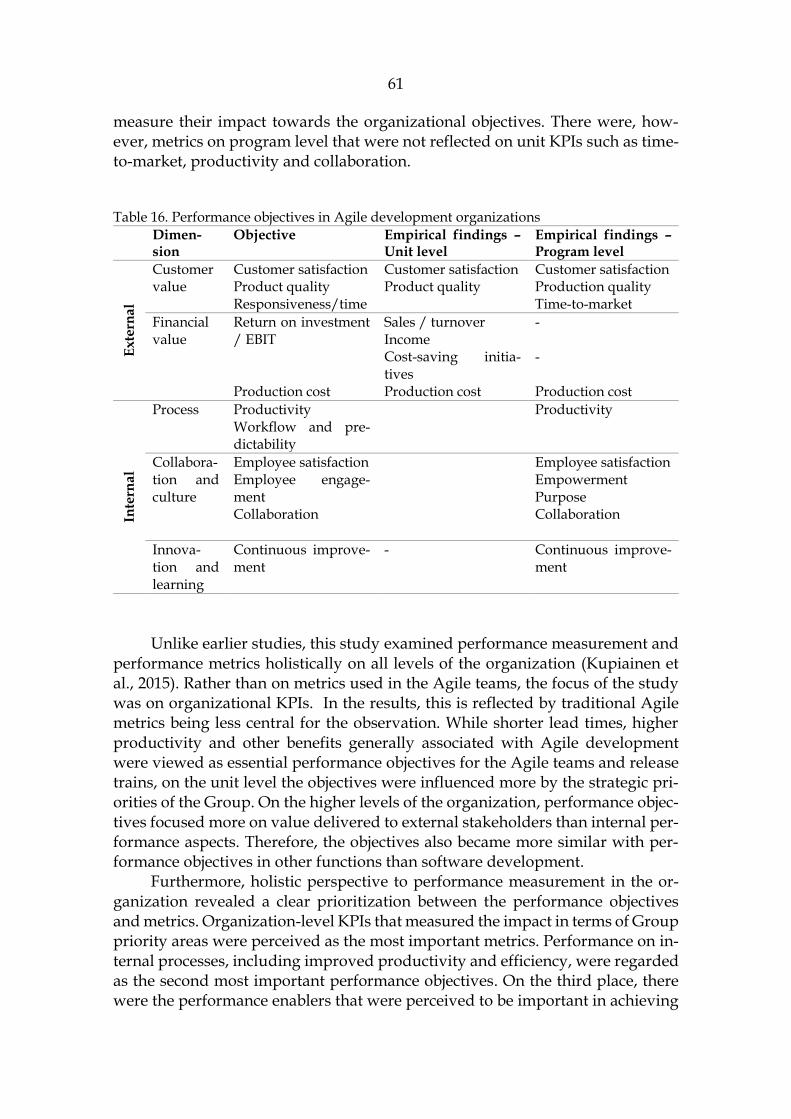
61
measure their impact towards the organizational objectives. There were, how-ever, metrics on program level that were not reflected on unit KPIs such as time-to-market, productivity and collaboration.
Table 16. Performance objectives in Agile development organizations
Dimen-sion
Objective Empirical findings – Unit level
Empirical findings – Program level
Ex
tern
al
Customer value
Customer satisfaction Product quality Responsiveness/time
Customer satisfaction Product quality
Customer satisfaction Production quality Time-to-market
Financial value
Return on investment / EBIT Production cost
Sales / turnover Income Cost-saving initia-tives Production cost
- - Production cost
Inte
rnal
Process Productivity Workflow and pre-dictability
Productivity
Collabora-tion and culture
Employee satisfaction Employee engage-ment Collaboration
Employee satisfaction Empowerment Purpose Collaboration
Innova-tion and learning
Continuous improve-ment
- Continuous improve-ment
Unlike earlier studies, this study examined performance measurement and performance metrics holistically on all levels of the organization (Kupiainen et al., 2015). Rather than on metrics used in the Agile teams, the focus of the study was on organizational KPIs. In the results, this is reflected by traditional Agile metrics being less central for the observation. While shorter lead times, higher productivity and other benefits generally associated with Agile development were viewed as essential performance objectives for the Agile teams and release trains, on the unit level the objectives were influenced more by the strategic pri-orities of the Group. On the higher levels of the organization, performance objec-tives focused more on value delivered to external stakeholders than internal per-formance aspects. Therefore, the objectives also became more similar with per-formance objectives in other functions than software development.
Furthermore, holistic perspective to performance measurement in the or-ganization revealed a clear prioritization between the performance objectives and metrics. Organization-level KPIs that measured the impact in terms of Group priority areas were perceived as the most important metrics. Performance on in-ternal processes, including improved productivity and efficiency, were regarded as the second most important performance objectives. On the third place, there were the performance enablers that were perceived to be important in achieving

62
the performance objectives but not as objectives as such. These included innova-tion and learning, collaboration and employee satisfaction. The structure was not formalized but it was demonstrated both by how the performance objectives were used and communicated. As on example, the metrics on the key objectives were reported externally, whereas internal process metrics were only used within the units. Furthermore, while organizational KPIs were cascaded down to hubs and used in feature prioritization processes across, the use of other metrics varied between trains and depended significantly on the release train or team in question. Overall, the prioritization was aligned with recommendations from Oza and Korkala (2012) and Hartmann and Dymoned (2006) that suggest the use of business value as an overall priority metric to indicate organizational success.
Figure 9. Framework for measuring performance in Agile development organizations
Combining findings from both the literature review and the case study, Figure 9 presents a framework for selecting performance objectives in Agile software or-ganizations. The framework refines the summary of performance objectives sug-gested in prior literature in Figure 6 by dividing performance objectives into three categories based on their prioritization in the case units. Primary perfor-mance objectives measure impact on the end beneficiaries of the value chain by Porter (1985): customers and owners. While primary performance objectives in-dicate the ultimate value and include therefore the most important objectives, the metrics within this category are lagging and indicate more historical than future performance. Secondary performance objectives measure the ‘how’ aspect of ac-tivities in the value chain, meaning how efficiently activities and operations are performed. Finally, performance enablers measure the conditions for performing within primary and secondary objectives, focusing on resources and capabilities. While performance enablers indicate performance only indirectly, they are lead-ing in nature and therefore able to indicate future performance better than the performance objectives.
This chapter has confirmed customer value, financial value and internal processes as the key performance dimensions for Agile development organiza-

63
tions. Furthermore, empirical findings have enriched prior literature by suggest-ing prioritization for the objectives. In the following, next chapter discusses the implications of the findings in practice.
6.2 Performance measurement challenges and practices
In addition to performance objectives and metrics, the findings of the study in-cluded also several observations and challenges regarding performance meas-urement practices in Agile development organizations. This chapter examines the additional findings and their implications for theory as well industry practi-tioners aiming to optimize their performance. Based on the findings, the chapter suggests recommended actions to the case units and other industry practitioners.
The findings of the study identified disconnect between organizational KPIs and operational level metrics as one of the main sources of concern regarding performance measurement in the case organizations. Agile team members lacked visibility to the impact that their work had on the primary performance objectives of the unit which impacted their motivation and feeling of purpose. The chal-lenge of establishing visibility of the impact of micro metrics on macro objectives has also been identified previously by Oza & Korkala (2012) who, despite of its difficulty, see the visibility crucial for development organizations. As a solution, Oza & Korkala suggest promoting holistic visibility to progress by using, when-ever possible, same metrics and dashboards on all levels of the organization. In the case units, one way of promoting same measures could be widening the per-spective to performance dimensions of customer value and financial value. As an example, customer value was measured both on unit and on program level, but on unit level the metrics consisted only of customer satisfaction and availability. Elevating some of the program-level metrics for customer value, such as lead time or customer complaints related to new releases, could both widen the un-derstanding of customer value in the units and support in establishing connec-tion between metrics on micro and macro level.
In addition to widening the perspective to measuring customer value cus-tomer value, another way for Agile development organizations to promote visi-bility to the impact that Agile teams deliver on the overall organizational objec-tives would be to increase guidance for the Agile teams to measure the impact themselves. Already, the case units were facilitating alignment between organi-zational objectives and operational-level execution by encouraging Agile teams to define the impact of the features they developed and to set metrics for meas-uring that. In practice, however, the results of the study show that the practice had turned out to be very challenging to the Agile teams. One part of the diffi-culty consisted of technical issues such as data availability, data quality and time and effort required to collect data and measure performance that were highly dependent on resources. Another part of the difficulty arose simply form lack of guidance, training and good examples on how to define the impact and set met-rics for capturing it. Even if improving the technical challenges might turn out to

64
be impossible in the short term, the case units could achieve incremental im-provements to the feeling of purpose by increasing guidance and training that they provide to the units on measuring impact of features. Instead of or in addi-tion to traditional training days and materials, the situation could be addressed for example by sharing best practices and good examples within the organization. Hartmann and Dymond (2006) also emphasize the importance of selecting met-rics that are easy to collect and find data for to decrease time and effort used in measuring.
Apart from assisting Agile teams to measure the impact they created and feel connection to organizational KPIs, increased guidance in performance meas-urement could improve alignment in measures and practices across the Agile teams. This would concern not just the feature KPIs, but also measurement of the Agile metrics followed up on program level. The results of the study revealed that, currently, there were large variations between the teams in how they meas-ured the different Agile KPIs and how much effort they put into doing that. Higher degree of alignment of practices between the teams could provide man-agement with better quality metrics to steer the organization and remove imped-iments. In addition, it could provide benchmarks and facilitate learning from best in class.
Previous studies have suggested that quality of performance metrics and ease of measurement increases along with organizational capabilities and Agile maturity (Pfleeger, 2008; Oza & Korkala, 2012). Due to the essential role of learn-ing for both the ability to measure performance and perform, the case units could benefit from reconsidering their measurement approach with respect innovation and learning. Even if the case units did address the performance dimension of innovation and learning through various initiatives such as knowledge-sharing sessions and retrospectives, they did not use measure or track the dimension in any systematic way. Since innovation and learning influence performance in other dimensions, investments in learning should eventually be visible for exam-ple in increased efficiency and customer satisfaction. By applying even simple metrics such as participation in the learning and innovation related initiatives holistically all around the organizations, the units could better evaluate if organ-izational development was on the right track in the short term. Systematic learn-ing objectives on team level, as already used in one of the case units, could even further help to ensure that the units will have returns from their investments into learning and innovation. Apart from quantitative metrics, the units could meas-ure the area with qualitative evaluations such as self-assessments as one of them already was planning to do.
Most of the performance measurement challenges identified in the case units were issues that could occur in any organization, no matter if it followed Agile ways of working or not. However, there was one important challenge clearly standing out as something specific for Agile development organizations: collaboration with units that had different ways of working. In particular, differ-ent cadences had been observed to set barriers for collaboration and create inter-dependencies between units as they limited the time frame during which units

65
could reprioritize and agree on new tasks. The challenge of dependencies as a barrier for performing had also been identified previously by Alahyari et al. (2017). In order to ensure that unit borders would not hinder collaboration and that potential issues were addressed early, the units should aim at not limiting focus in their performance measures to their own unit. By measuring processes end-to-end instead of measuring only the parts in their direct control, Agile de-velopment units could detect points of discontinuity early and create incentives for both parties to improve and align their collaboration practices.
Both previous studies and well as the case study participants highlighted the importance of performance measurement for ability to improve and learn (Fenton & Pfleeger, 1998). However, the measurement only adds value if the in-dividual or organization is both willing and able to make changes and adjust-ments based on the measurements. Even if empowerment and autonomous teams is one of the key principles of Agile ways of working, there were still found situations in the case study units in which people were measured on dimensions that they had no mandate to change or any reasonable way to influence. In order to make sure that a unit captures full benefit from the time and effort it invests in measuring performance, it should include actionability as a fundamental ac-ceptance criterion for its metrics on all levels. In order to make sure that all met-rics serve a purpose, Hartmann and Dymond (2006) suggest ensuring that each metric has a responsible “customer” assigned to them. In addition to improving return of performance measurement efforts, ability to influence measures has the potential of also increasing employee satisfaction and engagement.
Apart from making sure that selected metrics are actionable, the empirical findings suggested that evaluating their ability to indicate performance is also important. The ability and potential benefits should then be weighed against ex-pected costs: even the most informative of metrics might not be worth measuring if the effort takes weeks from entire team. These evaluations often involve trade-offs, as if something is not measured due to the effort it requires, there is no focus on developing systems and capabilities and, hence, reducing the required effort. Therefore, it may be difficult to make clear guidance and set limits on when to measure and when the effort is too much. However, it is equally necessary to make sure that resources are not wasted on something with low potential to yield returns. To make sure that they do not hinder long-term development, the deci-sions should be taken only in short term and the situation should be reviewed regularly as the maturity of the organization develops and priorities change. In the meantime, organizations would also benefit from finding other ways to make team members feel motivated and see their impact than metrics, such as qualita-tive evaluations and self-assessment. Oza and Korkala (2012) and Hartmann and Dymond (2006) also point out that focusing on few representative and easy-to-collect metrics may lead to better outcomes than attempt to measure everything.

66
Table 17. Summary of practical implications to industry practitioners
# Recommendation Benefit or rationale 1 Consider measuring value delivered to
customer from a wider perspective than customer satisfaction
• Deeper insights to customer impact
• Stronger connection between opera-tional activities and top-level KPIs
2 Consider increasing training and guid-ance for Agile teams on how to define and measure the impact of their features
• Stronger feeling of purpose and abil-ity to impact within teams
• Higher quality in impact measure-ment
3 Aim at aligning practices across all teams within the same organization through guidance and example
• Higher quality of metrics
• Ability to benchmark and learn from best in class
4 Consider setting measures also for per-formance enablers such as innovation and learning
• Improved insights into future perfor-mance
• Better control over progress and re-turn to investment in the areas
5 Make collaboration with other units not following same ways of working a prior-ity – within metrics, reflect that by meas-uring all processes end-to-end to ensure that no points of discontinuity arise be-tween unit or process borders
• Dependencies and challenges arising from different cadences and ways of working between units are solved early
• Better use of capabilities and exper-tise beyond own unit
6 Consider setting limits and guidance on when to engage in performance meas-urement and when not – however, re-view the situation regularly
• Optimal return from efforts invested into performance measurement
• Too many metrics could divert focus
7 Ensure that there are possibilities to make changes based on outcomes from performance measurements
• Higher benefits from performance measurement
• Stronger sense of empowerment for employees
Recommendations to the case units and other industry practitioners based on findings from both the empirical study and prior literature are presented in Table 17. The table also outlines the key reasons or benefits for each recommendation. In addition to these recommendations, the findings suggest that organizations can also improve the return of their performance measurements by investing into high quality data base, processing tools and reporting systems as well as by in-creasing the number of people and teams available for measuring performance. However, as these depend highly on the resources that organizations have avail-able, they are excluded from the list.
In short, this chapter has discussed the main findings of the study with respect to prior research. In addition to theoretical implications, it has sug-gested practical recommendations by reflecting the findings and observations to prior literature. In the following, the next chapter concludes the findings of the study, summarizes answers to the research questions and examines limitations and future research opportunities.

67
7 Conclusions
Performance measurement plays a key role in enabling continuous improvement in Agile software development organizations. Even if previous studies have found that performance metrics of traditional software development support Ag-ile methods poorly (Hartmann & Dymond, 2006), knowledge on performance metrics and practices that Agile development organizations use in practice is scarce. Particularly, there is a knowledge gap regarding the use of metrics on or-ganizational level, since most prior studies have focused on Agile teams. This study attempted to fill the gap by investigating the use of performance metrics in Agile development organizations. The study aimed at contributing to research on performance measurement in software development organizations as well as outlining practical suggestions for industry practitioners.
This chapter concludes the answers to the research questions presented in the introduction and summarizes their theoretical and practical implications. In addition, it also outlines and discusses the limitations of the study. The chapter concludes with the identification of future research opportunities to further in-vestigate performance measurement in Agile development organizations.
7.1 Findings and contribution
This study aimed at investigating how Agile development organizations meas-ure their performance. Specifically, the study examined performance objectives of Agile software organizations, the metrics used to measure the objectives and the extent to which the objectives and metrics aligned with those suggested by prior literature. For this purpose, the following three research questions were formed:
1. What are performance objectives in Agile development organizations? 2. Which metrics are used to measure the performance objectives? 3. How do the performance objectives and metrics compare to those sug-
gested in literature?
Review of the contemporary research literature identified 11 key performance objectives for Agile development organizations. The objectives represented five different performance dimensions: financial value, customer value, internal pro-cesses, collaboration and culture and innovation and learning. Of these, customer value and internal processes were perceived to be the most important dimensions specifically for Agile development organizations. Examples of objectives within customer value included customer satisfaction, product quality and product us-ability whereas internal process value consisted of objectives such as efficiency, predictability and standardization.

68
The qualitative case study identified four key performance objectives on or-ganizational level: customer satisfaction, income growth, operational efficiency and product quality. Customer satisfaction and product quality addressed the performance dimension of customer value and were measured on Net Promoter Score and IT stability respectively. Income growth and operational efficiency rep-resented the performance dimension of financial value and were measured on turnover or sales, generated income and different cost-saving initiatives. The per-formance objectives were derived primarily from strategic priorities of the com-pany and further been influenced by prevailing market conditions and competi-tors.
In addition to the organization level performance objectives and metrics, the case study identified performance objectives that were used only in Agile re-lease trains and teams. These objectives included time-to-market, productivity, quality in development and production, continuous improvement and employee satisfaction in terms of engagement, empowerment and collaboration. The objec-tives were measured primarily on feature lead time, burndown ratio and itera-tion velocity. The objectives were primarily chosen based on recommendations from the Agile frameworks that the units followed and therefore known as Agile metrics. Apart from the Agile metrics, Agile release trains had some objectives derived from the organizational KPIs. Furthermore, Agile teams were encour-aged to define and measure the impact of their features in terms of the organiza-tional performance objectives. The main tool used for aligning objectives between the unit and team level was backlog prioritization.
Findings from the case study revealed a clear prioritization between the performance objectives and metrics. Organization-level KPIs that measured the external impact were perceived as the most important, while efficiency of inter-nal processes came second. On the third place, there were objectives that enabled performance with respect to the priorities, such as learning, collaboration and employee satisfaction. The structure was not formalized but it was demonstrated both by how the performance objectives were used and communicated.
Comparison of findings between the literature review and the case study revealed that performance dimensions of customer value, internal processes and collaboration and culture were present in both, even if they were not all included in the primary organization-level objectives in the case study findings. Financial value, while recognized by literature, was emphasized more in the empirical re-sults and addressed with a higher number of metrics. The dimension of innova-tion and learning was perceived as an important enabler for performance, but not regarded as a performance objective in the case study. Based on findings from both prior studies and the case interviews, the study suggests a framework for selecting and prioritizing performance objectives in Agile development organi-zations as presented in Figure 9.
In addition to performance objectives, metrics and their structure, the case study revealed various challenges regarding performance measurement in Agile development organizations. The most frequently mentioned ones included dis-connect or lack of transparency between organizational and operational KPIs,
69
lack of available data, resources and guidance for measuring features, misalign-ment between teams and dependencies to units with different cadences and ways of working. The disconnect and the difficulties with measuring features con-cerned especially Agile teams who felt that, either due to the organizational KPIs being too broadly defined or their feature metrics poorly defined, they could not see the impact they created for the organizational KPIs. The challenge of misa-lignment, on the other hand, affected mostly management for whom it was diffi-cult to compare and guide teams due to misaligned practices. The challenges of disconnect, lack of guidance and dependencies align with those identified in pre-vious studies.
The findings of the study make three contributions to contemporary litera-ture in performance measurement of software development organizations. As the first one, the study provides an overview of performance objectives and met-rics used in Agile development organizations on organizational, release train and team level. While prior research and experience reports have suggested several metrics to be used in Agile development organizations, existing knowledge on the metrics that are used in practice has been scarce (Kupiainen et al., 2015). As the second contribution, the study suggests that the performance dimension of financial value is of relevance for Agile development organizations. Even if ear-lier studies have recognized its importance and suggested business value as a key metric for Agile development organizations (Oza & Korkala, 2012; Hartmann & Dymond, 2006), there has also been presented contradicting evidence of its pri-oritization (Alahyari et al., 2017). Finally, the study provides insights into the pri-oritization and structuring of performance objectives in Agile development or-ganizations. Since prior studies have examined performance measurement pri-marily within Agile teams, little is known how organizations balance between strategic and software-related performance objectives in the different organiza-tional levels.
In addition to theoretical contributions, the findings of the study have im-plications for industry practitioners aiming at optimizing their performance met-rics and measurement practices. The framework presented in Figure 9 provides guidance for Agile development organizations in setting their performance ob-jectives. The findings from the study suggest that selecting performance objec-tives from all the three categories supports organizations in addressing perfor-mance holistically and achieving a balance between external and internal impact and leading and lagging indicators. The framework emphasizes especially cus-tomer value, financial value and performance on internal processes. Apart from providing guidance for selecting performance objectives, the study identified several specific practices that may help organizations in optimizing their perfor-mance measurement practices and avoiding challenges arising from Agile meth-ods. These practices are outlined in Table 17.

70
7.2 Limitations of the study
This study has several limitations to be considered. First of all, the study examines Agile development organizations holistically on organization level. While this allows to account for differences in performance objectives and measures between the different levels, it limits the depth on analysis on each level. For example, the study did not consider differences in performance objectives and metrics between different teams. The implications of the study may therefore not be applicable on all teams or Agile trains or may need to be adjusted to the-circumstances of each suborganization.
The study interprets and describes Agile development on a general level. The differences between specific Agile techniques, methodologiess and ways of working are not described in detail and their implications to performance meas-urement are not considered. Therefore, the results may not be applicable for all Agile frameworks and adaptations. Furthermore, the study has only observed performance management in scaled Agile environment.
Another limitation of the study is that observations are limited to one in-dustry only. Development activities in financial industry differ from those in soft-ware industry in multiple aspects that are not all considered in the results. It should also be noted that all data is collected from units that develop digital so-lutions in-house. The results may therefore not be applicable to settings where software is developed on contract for external customers.
In addition to the limitations arising from the research scope and setting, the research method further limits the application of the results. While single case study can provide valuable insights to a phenomenon in real-life settings, it is not descriptive enough to create a conclusive overview of a research topic. Further studies and additional case settings could improve the generalizability of the re-sults. Furthermore, they could increase understanding on the influence that dif-ferent circumstances may have on performance measurement and applicability of specific metrics in Agile development organizations. Examples on such cir-cumstances or factors could include for example the size of the Agile organiza-tion or its degree of maturity.
Apart from the research method, the chosen sampling and data collection methods also expose the results for certain weaknesses and constraints. While non-probability sampling and snowball sampling in specific supported well the aim of finding interview participants with the desired characteristics and experi-ence on the research topic, they also may have resulted in a biased or non-repre-sentative interview sample. Furthermore, the number of interview participants per development unit was relatively small and therefore limited especially the ability to reliably compare the two case units to each other. Larger interview sam-ple or enriching the study with a variety of additional data sources could have provided more insights and increased the reliability of the results.

71
7.3 Suggestions for future research
Both the results of the study as well as the limitations revealed opportuni-ties for further research to increase understanding of performance measurement in Agile development organizations. Firstly, it could be interesting to examine the influence of different Agile techniques and frameworks such as Scrum, XP or Lean Agile for performance measurement and metrics. This could increase un-derstanding of the role that development method and framework play in perfor-mance measurement and objectives. Furthermore, such research could reveal if there are differences in the adaptability or suitability of performance objectives and measurement practices between the Agile techniques. Due to Agile methods being increasingly adopted also in large scale, this investigation would be partic-ularly relevant between different frameworks for scaling Agile practices.
Since this study was limited to the financial industry, it would be interesting to replicate it within other industrial domains. As Agile methods are being in-creasingly adopted also beyond the software development companies, there is a growing interest towards understanding the influence of industrial settings on performance measurement and applicability of metrics. In addition to industrial domains, it would be important to gain understanding on differences between organizations developing software in-house for own purposes and organizations developing software as outsourced subcontractors.
Apart from impacts of Agile methods and industrial domains, the impact of Agile maturity level on performance measurement would be another relevant topic for future research. Understanding whether the adaptability of certain per-formance metrics and practices depend on the maturity level of the organization would be of practical value especially for industry practitioners planning to adapt Agile development methods. This kind of research would require collect-ing longitudinal data from several years or at least comparing multiple cases at different maturity levels. These activities, while being beyond the time and re-source limitations for this study, could provide valuable insights also into the effects of using specific performance objectives and practices.
Unlike most prior studies, this study examined performance objectives and metrics in Agile development organizations focusing on organization level in-stead of team level. As discussed in the conclusions, the perspective revealed in-sights into prioritization of metrics and differences in their usage on the different organizational levels. However, further studies in the area are necessary to con-firm the findings and increase their reliability. Especially the role of collaboration and culture and innovation and learning as performance enablers would provide a fruitful topic for future research as prior studies on the area are limited.
While this study focused on performance measurement in Agile develop-ment organizations and highlighted some of the differences between traditional and Agile software development, it did not address performance measurement in continuous development. Perceived as the next phase in the evolution of soft-

72
ware development methods, continuous software development aims at optimiz-ing development process by removing all boundaries between planning, devel-opment and implementation. Due to its recent emergence, insights into perfor-mance measurement and relevant performance objectives for continuous devel-opment organizations could provide valuable understanding on a new and un-explored phenomenon. In addition to theoretical implications, research on per-formance measurement and metrics in continuous development organizations could benefit industry practitioners adopting continuous development methods.
Even if qualitative research can provide valuable insights into perceptions on performance measurement and advantages and disadvantages of specific metrics and measurement practices, it provides little quantified evidence of one metric leading to better outcomes than another. Furthermore, qualitative re-search methods limit the generalisability of the findings. Therefore, it would also be interesting to enrich the qualitative research with quantitative data and con-duct research on the ability of different metrics to support performance objectives. While such a study would require well-controlled circumstances, it would have the potential to significantly increase understanding of the role of metrics in sup-porting performance within software development organizations. In particular, quantitative research could provide insights into the generalizability of perfor-mance objectives and measurement practices. As the popularity of Agile devel-opment methods grows, insights into performance measurement and appropri-ate metrics for Agile development organizations is likely to be of increasing im-portance also in the future.

73
SOURCES
Agarwal, N., & Rathod, U. (2006). Defining ‘success’ for software projects: An exploratory revelation. International journal of project management, 24(4), 358-370.
Alahyari, H., Svensson, R. B., & Gorschek, T. (2017). A study of value in Agile software development organizations. Journal of Systems and Software, 125, 271-288.
Avison, D., and Fitzgerald, G. (2003) Where now for development methodologies? Communications of the ACM, 46, 1, 79-82.
Beck, M. Beedle, A. van Bennekum, A. Cockburn, W. Cunningham, M. Fowler, J. Grenning, J Highsmith, A. Hunt, R. Jeries, J. Kern, B. Marick, R. C. Martin, S. Mellor, K. Schwaber, J. Sutherland, and D. Thomas. 2001. Manifesto for Agile software development.
Beck, K. and Andres, C. (2004). Extreme Programming Explained: Embrace Change. Addison Wesley Professional, 2nd edition.
Boehm, B. and Turner, R., 2003. Using risk to balance agile and plan-driven methods. IEEE Computer Society 36 (6), 57–66.
Braun, V. and Clarke, V. (2006). Using thematic analysis in psychology. Qualitative research in psychology, 3(2), 77-101.
Brook, Phil, "Proactive Metrics: A Framework for Managing IS Development Projects" (2001). ACIS 2001 Proceedings. 11.
Conboy, K., 2009. Agility from first principles: reconstructing the concept of agility in information systems development. Information Systems Research 20 (3), 329–354
Darke, P., Shanks, G., & Broadbent, M. (1998). Successfully completing case study research: combining rigour, relevance and pragmatism. Information systems journal, 8(4), 273-289.
Davis, C. W. (2015). Agile metrics in action: Measuring and enhancing the performance of agile teams.
Dikert, K., Paasivaara, M., & Lassenius, C. (2016). Challenges and success factors for large-scale agile transformations: A systematic literature review. Journal of Systems and Software, 119, 87-108.

74
Dingsøyr, T. and Lassenius, C. (2016). Emerging themes in Agile software development: Introduction to the special section on continuous value delivery. Information and Software Technology, 77, 56-60.
Dubinsky, Y., Talby, D., Hazzan, O., and Keren, A. (2005). Agile metrics at the israeli air force. In Agile Development Conference (ADC'05) (pp. 12-19). IEEE.
Dybå, T. and Dingsøyr, T. (2009). What Do We Know about Agile software development?. IEEE Software, (5), 6-9.
Ebert, C. and Paasivaara, M. (2017). Scaling agile. IEEE Software, 34(6), 98-103.
Erickson, J., Lyytinen, K., and Siau, K. (2005). Agile modeling, Agile software development, and extreme programming: the state of research. Journal of Database Management (JDM), 16(4), 88-100.
Fenton, N. E. and Pfleeger, S. L. (1998). Software Metrics: A Rigorous and Practical Approach. Brooks.
Fitzgerald, B. and Stol, K. J. (2017). Continuous software engineering: A roadmap and agenda. Journal of Systems and Software, 123, 176-189.
Fontana, R. M., Fontana, I. M., da Rosa Garbuio, P. A., Reinehr, S., and Malucelli, A. (2014). Processes versus people: How should Agile software development maturity be defined?. Journal of Systems and Software, 97, 140-155.
Fowler, M. and Highsmith, J. (2001). The agile manifesto. Software Development, 9(8), 28-35.
Ghanbari,H., Tuunanen,T., Rossi,M., Kemell , K.-K. (2019). Moving From Enterprise Plumbing to Delivering Digital Innovations: Continuous Information Systems Development.
Hartmann, D., and Dymond, R. (2006). Appropriate agile measurement: using metrics and diagnostics to deliver business value. In AGILE 2006 (AGILE'06) (pp. 6-pp). IEEE.
Hauser, J. and Katz, G. (1998). Metrics: you are what you measure!. European Management Journal, 16(5), 517-528.
Heidenberg, J., Weijola, M., Mikkonen, K., and Porres, I. (2013). A metrics model to measure the impact of an agile transformation in large software development organizations. In International Conference on Agile Software Development (pp. 165-179). Springer, Berlin, Heidelberg.
Hsieh, H. F. and Shannon, S. E. (2005). Three approaches to qualitative content analysis. Qualitative health research, 15(9), 1277-1288.

75
Humble, J., and Molesky, J. (2011). Why enterprises must adopt devops to enable continuous delivery. Cutter IT Journal, 24(8), 6.
Kasauli, R., Knauss, E., Nilsson, A., and Klug, S. (2017). Adding Value Every Sprint: A Case Study on Large-Scale Continuous Requirements Engineering. In REFSQ Workshops.
Kaplan RS and Norton DP. 1992. The Balanced Scorecard—Measures that Drive Performance. Harvard Business Review.
Khurum, M., Gorschek, T., and Wilson, M. (2013). The software value map—an exhaustive collection of value aspects for the development of software intensive products. Journal of software: Evolution and Process, 25(7), 711-741.
Kroenke, D. M. (2007). Using MIS. Upper Saddle River, NJ: Pearson Prentice Hall.
Kueng, P. (2000). Process performance measurement system: a tool to support process-based organizations. Total Quality Management, 11(1), 67-85.
Kupiainen, E., Mäntylä, M. V. and Itkonen, J. (2015). Using metrics in Agile and Lean Software Development–A systematic literature review of industrial studies. Information and Software Technology, 62, 143-163.
Laukkanen, E., Itkonen, J. and Lassenius, C. (2017). Problems, causes and solutions when adopting continuous delivery—A systematic literature review. Information and Software Technology, 82, 55-79.
Lee, G. and Xia, W., 2010. Towards agile: an integrated analysis of quantitative and qualitative field data on software development agility. MIS Quarterly 34 (1), 87–114.
Leffingwell, Dean. 2019. Metrics – Scaled Agile Framework. Scaled Agile Inc. Available at: https://www.scaledagileframework.com/metrics/
Leppänen, M. (2013). A comparative analysis of agile maturity models. In Information Systems Development (pp. 329-343). Springer, New York, NY.
List, B., Bruckner, R. M. and Kapaun, J. (2005). Holistic software process performance measurement from the stakeholders' perspective. In 16th International Workshop on Database and Expert Systems Applications (DEXA'05) (pp. 941-947). IEEE.
Mahnic, V. and Zabkar, N. (2008). Using COBIT indicators for measuring scrum-based software development. Wseas transactions on computers, 7(10), 1605-1617.
Mitra, S., Sambamurthy, V. and Westerman, G. (2011). Measuring IT performance and communicating value. MIS Quarterly Executive, 10(1).

76
Myers, M. D. and Newman, M. (2007). The qualitative interview in IS research: Examining the craft. Information and organization, 17(1), 2-26.
Neely, A. D., Adams, C. and Kennerley, M. (2002). The performance prism: The scorecard for measuring and managing business success. London: Prentice Hall Financial Times.
O'Brien, J. A. (1999). Management information systems: Managing information technology in the internetworked enterprise (4th ed.). Boston: Irwin McGraw Hill
Overby, E., Bharadwaj, A. and Sambamurthy, V. (2006). Enterprise agility and the enabling role of information technology. European Journal of Information Systems, 15(2), 120-131.
Oza, N. and Korkala, M. (2012). Lessons Learned in Implementing Agile software development Metrics. In UKAIS (p. 38).
Paasivaara, M., Behm, B., Lassenius, C. and Hallikainen, M. (2018). Large-scale agile transformation at Ericsson: a case study. Empirical Software Engineering, 23(5), 2550-2596.
Petter, S., DeLone, W. and McLean, E. R. (2012). The past, present, and future of" IS Success". Journal of the Association for Information Systems, 13(5), 341.
Pfleeger, S. L. (2008). Software metrics: Progress after 25 years?. IEEE Software, 25(6), 32-34.
Poppendieck, M. and Poppendieck, T. (2003). Lean Software Development: An Agile Toolkit: An Agile Toolkit. Addison-Wesley.
Racheva, Z., Daneva, M. and Sikkel, K. (2009,). Value creation by agile projects: Methodology or mystery?. In International Conference on Product-Focused Software Process Improvement (pp. 141-155). Springer, Berlin, Heidelberg.
Rai, A., Lang, S. S. and Welker, R. B. (2002). Assessing the validity of IS success models: An empirical test and theoretical analysis. Information systems research, 13(1), 50-69.
Saunders, M., Lewis, P. and Thornhill, A. (2009). Research methods for business students. Essex. Financial Times/Prentice Hall.
Schwaber, K. and Beedle, M. (2002). Agile software development with Scrum (Vol. 1). Upper Saddle River: Prentice Hall.
Singleton, R. A., Straits, B. C. and Straits, M. M. (2005). Approaches to Social Sciences.

77
Wateridge, J. (1998). How can IS/IT projects be measured for success?. International journal of project management, 16(1), 59-63.
Wendler, R. (2016). Dimensions of Organizational Agility in the Software and IT Service Industry: Insights from an Empirical Investigation. CAIS, 39, 21.
Yin, R. K. (2003). Case study design.

78
APPENDIX 1: Interview questions
Research and its objectives:
• The research investigates performance measurement of Agile software
development organizations on organizational level
• The intended outcome of the research is a framework for selecting appro-
priate measures for Agile software development organizations
o Intended theoretical contributions: increased understanding of the
value that Agile development units are expected to deliver and
the metrics they use to measure that value
o Intended practical contributions: assistance for managers and in-
dustry practitioners to choose relevant metrics for their Agile de-
velopment organizations
• Scope of the research is performance measurement on organizational
(unit) level, not teams
• The research is independent (no external client or financing)
• Practicalities:
o The interview will be recorded and the recording will be used as
part of the research (on consent)
o All responses will be treated confidentially when reporting the re-
sults of the study
o The interview will take about 45 min
Structure of the interview:
1. Introduction (5 min)
a. Research topic and researcher
b. Interview structure
2. Background information (5 min)
3. Interview: Performance Measurement in software development units/or-
ganizations
a. Phase A: Performance Objectives (10 min)
b. Phase B: Performance Metrics (10 min)
c. Phase C: Performance Reporting and Measurement Process (10
min)
4. Closing words (5 min)
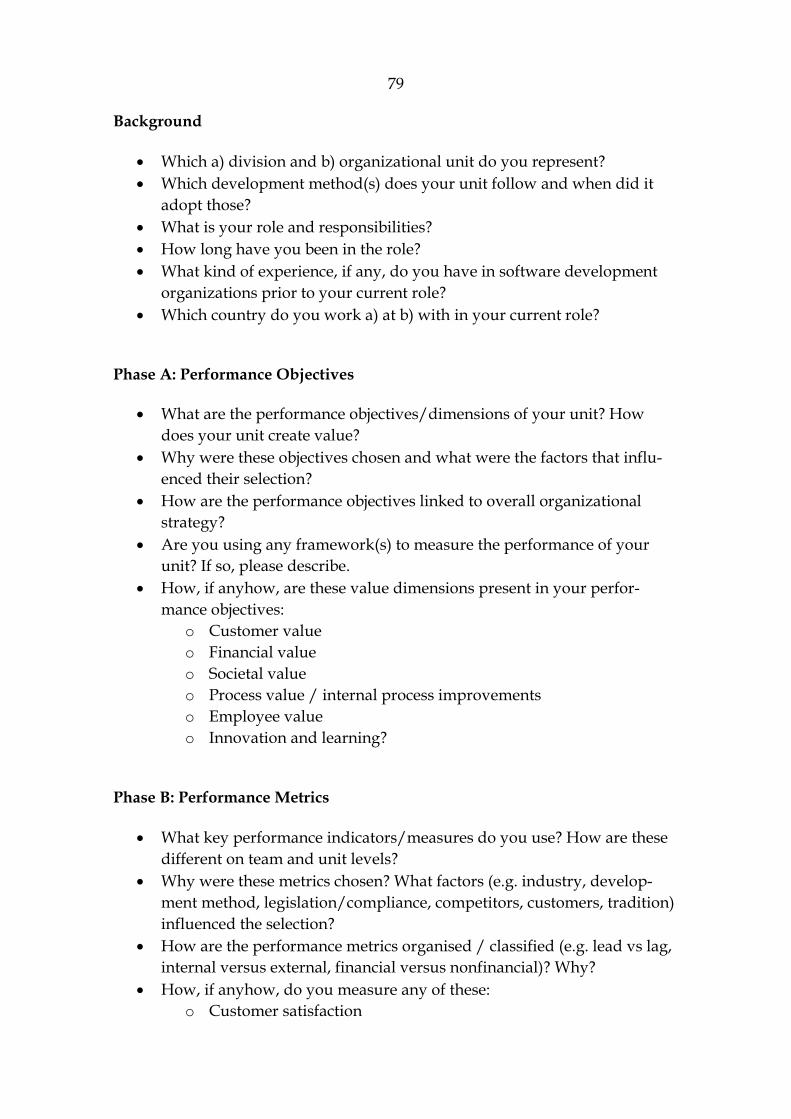
79
Background
• Which a) division and b) organizational unit do you represent?
• Which development method(s) does your unit follow and when did it
adopt those?
• What is your role and responsibilities?
• How long have you been in the role?
• What kind of experience, if any, do you have in software development
organizations prior to your current role?
• Which country do you work a) at b) with in your current role?
Phase A: Performance Objectives
• What are the performance objectives/dimensions of your unit? How
does your unit create value?
• Why were these objectives chosen and what were the factors that influ-
enced their selection?
• How are the performance objectives linked to overall organizational
strategy?
• Are you using any framework(s) to measure the performance of your
unit? If so, please describe.
• How, if anyhow, are these value dimensions present in your perfor-
mance objectives:
o Customer value
o Financial value
o Societal value
o Process value / internal process improvements
o Employee value
o Innovation and learning?
Phase B: Performance Metrics
• What key performance indicators/measures do you use? How are these
different on team and unit levels?
• Why were these metrics chosen? What factors (e.g. industry, develop-
ment method, legislation/compliance, competitors, customers, tradition)
influenced the selection?
• How are the performance metrics organised / classified (e.g. lead vs lag,
internal versus external, financial versus nonfinancial)? Why?
• How, if anyhow, do you measure any of these:
o Customer satisfaction

80
o Product quality
o Product functionality
o Delivery time
o Delivery quality
o Process Efficiency
o Process predictability / standardization
o Productivity / throughput
o Employee satisfaction
o Collaboration
o Continuous improvement?
• Do you think that some of the metrics are more important or effective
than others? Why?
Phase C: Performance Reporting and Measurement Process
• How do you use the information from the performance measurements
(e.g. for monitoring, planning, improvements, decision-making)?
• How do you report the measurement of performance (verbally, dash-
boards, webpage)?
• To what levels (top, middle and operational) do you report the perfor-
mance measures and why?
• On what frequency do you and report the performance measurements
and why?
• What are the outcomes (decisions, actions, behaviour change) from the
reporting of performance measurements?
• Do you review the effectiveness of the performance metrics?
Please provide any other relevant information on performance measure-
ment in your unit?