performance measurement of corporate tax...
TRANSCRIPT

Performance Measurement of CorporateTax Departments
John R. RobinsonThe University of Texas at Austin
Stephanie A. SikesUniversity of Pennsylvania
Connie D. WeaverTexas A&M University
ABSTRACT: We investigate why firms choose to evaluate a tax department as a profitcenter �“contributor to the bottom line”� as opposed to as a cost center and the asso-ciation between this choice and effective tax rates �ETRs�. Using data from a confiden-tial survey taken in 1999 of Chief Financial Officers, we develop and test a theory forchoosing between these two methods of evaluating a tax department. We find that thelikelihood of evaluating the tax department as a profit center is increasing in firm de-centralization characteristics and tax-planning opportunities. We then employ instru-mental variables to investigate whether evaluating a tax department as a profit centerprovides an effective incentive for the tax department to contribute to net incomethrough lower ETRs. We find that our instrument for profit center firms is associatedwith significantly lower ETRs than cost center firms.
Keywords: tax department; effective tax rates; profit centers; managerial incentives.
JEL Classifications: H25; L33; M41; M43.
I. INTRODUCTION
In this study, we focus on the choice between two performance measurement models for taxdepartments. Many corporate administrative departments �i.e., accounting, finance, communi-cations, and human resources� are evaluated using a cost center model, a measurement system
designed to minimize departmental costs. Traditionally, tax departments were also evaluated using
The authors thank Ernst & Young for providing data necessary to complete this project, and appreciate constructivecomments from Ben Ayers, Michelle Hanlon, Ross Jennings, Lillian Mills, Tom Omer, Sonja Rego, Doug Shackelford,Terry Shevlin, David Weber, Ryan Wilson, and workshop participants at Notre Dame University, The University of Texasat Austin, the National Tax Association’s 99th Annual Conference on Taxation, the 2007 American Taxation Association’sMidyear Meeting, the 2007 American Accounting Association Annual Meeting, and the 2008 Lone Star Conference. Theauthors gratefully acknowledge research support provided by their respective institutions: Professor Robinson �Red Mc-Combs School of Business and C. Aubrey Smith Professorship� and Professor Weaver �Mays Research Fellowship�.
Editor’s note: Accepted by Dan Dhaliwal.
THE ACCOUNTING REVIEW American Accounting AssociationVol. 85, No. 3 DOI: 10.2308/accr.2010.85.3.10352010pp. 1035–1064
Submitted: April 2008Accepted: September 2009
Published Online: May 2010
1035

cost center models, with an emphasis on minimizing the cost of tax compliance �Ernst & Young2004�. However, during the 1990s, some firms began to use profit centers as the performancemeasurement model for tax departments. Broadly speaking, the performance of a profit centerdepartment is evaluated by the difference between costs and revenue associated with the depart-ment. For these firms, the performance of the corporate tax department is judged by its contribu-tions to reported financial income rather than cost minimization.1 It is unlikely that one particularmeasurement system is optimal for all firms; rather, firm characteristics �e.g., industry and pro-duction technology� determine what performance measurement model is best for each firm �Jensenand Meckling 1998�.
Our objectives are twofold. First, based upon the organizational design literature, we developand test a model for predicting whether firms choose to evaluate their tax departments as profit orcost centers. This model fills a void in the literature by addressing the question of which factorscontribute to the design of performance measurement systems and, more specifically, which fac-tors lead firms to choose different methods for evaluating administrative functions. Second, weinvestigate whether a specific tax-related financial attribute, the effective tax rate �ETR�, is asso-ciated with the expected choice of performance measurement model, namely profit or cost center.2
Specifically, we test whether firms with characteristics conducive to a profit center measurementsystem are associated with lower ETRs.
We base our empirical tests on a unique data set constructed from confidential survey re-sponses from more than 200 Chief Financial Officers �CFOs� of Fortune 1000 companies. Theconfidential survey, conducted in 1999 at the behest of Ernst & Young, was designed to explorethe role tax plays in the corporate strategic decision-making process and how CFOs measure thesuccess of their tax departments. In this study, we focus on the survey question that asks CFOs todescribe whether their firm manages and measures the tax department as a “contributor to thebottom line” �i.e., profit center� or as a cost center.
To investigate the determinants of this choice, we estimate a logistic regression that modelsthe performance measurement choice as a function of firm variables representing four constructs:firm decentralization, the degree of coordination between the tax department and operating divi-sions within the firm, firm growth and tax-planning opportunities, and the importance of financialtax management to the firm. We find that the likelihood of evaluating the tax department as a profitcenter is positively related to attributes associated with decentralized firms—firm size, number ofproduct lines and geographic segments, and the degree of coordination between the tax departmentand operating units. We also find that the likelihood of evaluating the tax department as a profitcenter is associated with tax-planning opportunities and resources �R&D activity, amount of in-tangible assets, and proportion of the tax department budget allocated to tax planning�. Theseresults suggest that firms are more likely to adopt profit center models to motivate additional taxplanning when the firm is large, diverse, and has tax-planning opportunities that can affect anumber of business units.
To address our second objective, we estimate a regression that tests whether effective tax ratesare associated with the underlying characteristics that determine the profit or cost center choice. Inthis ETR regression, we utilize an instrumental variable to represent a firm’s choice to evaluate its
1 Certain strategies allow managers to increase financial income but do not change taxable income. For example, desig-nating foreign earnings as “permanently” reinvested abroad increases reported earnings by reducing reported tax ex-pense yet does not affect taxable income or taxes paid �Krull 2004�.
2 Lower ETRs do not always imply effective tax planning. Jennings et al. �2010� describe how implicit taxes reducepre-tax returns by the amount of any explicit tax savings. However, ETRs will capture the financial accounting effectsof tax planning �i.e., financial tax management�. We capture the financial accounting effects of tax planning by mea-suring ETR as the ratio of total tax expense to reported pre-tax income.
1036 Robinson, Sikes, and Weaver
The Accounting Review May 2010American Accounting Association

tax department as a profit center, the likelihood of profit center choice predicted by our logisticprofit center choice regression. We use this two-stage approach to address the potential for endo-geneity between the choice of performance measurement model and ETR.3 We find that firmspredicted to utilize profit centers have, on average, lower ETRs. This finding is consistent with theconjecture that a profit center performance measurement model provides an effective incentive toreduce ETRs.
Lower ETRs can result from planning strategies designed to either reduce tax paymentsand/or manage tax accruals �Hanlon and Heitzman 2009�. In supplemental analyses, we testwhether we can attribute our profit center results to cash tax planning or tax accrual planning orboth. We substitute a measure of real tax planning, cash-ETR, for our measure of financial ETRand find that managing and evaluating a tax department as a profit center has no incremental effecton cash tax savings. Taken together with our main results, this result suggests that evaluation ofthe tax department as a profit center encourages tax departments to focus on tax-planning activitiesthat reduce reported financial ETRs rather than generate incremental cash tax savings.
This study contributes to the literature in several ways. We identify how the determinants oforganizational architecture/design influence firms’ choices of performance evaluation systems forthe tax department. This research provides the first documentation of the factors contributing tothe choice of performance measurement in the context of an administrative function of a firm, suchas a tax department. Second, we provide evidence that through these factors, firms expected toevaluate their tax departments by their contributions to the “bottom line” have lower effective taxrates, which increases their reported financial earnings. We do not find that the performancemeasurement system choice affects cash ETRs.
Our findings should be of primary interest to researchers and investors who seek to under-stand the causes and financial reporting consequences of the design of performance measurementand evaluation. In particular, our results should be of interest to researchers who study the designof incentives and choice of performance measurement systems. Regulators such as the Securitiesand Exchange Commission, the Financial Accounting Standards Board, and the Internal RevenueService should be interested that the method of evaluating specific administrative units, such as thetax department, has specific and predictable effects on results presented for financial reportingpurposes. Finally, policy makers should be interested in results indicating that performance mea-surement choices can encourage financial reporting aggressiveness and are, in part, responsible forlower ETRs.
Section II develops our hypotheses. Section III describes our data and research design andSection IV discusses our empirical results. Section V summarizes the results and offers conclu-sions.
II. HYPOTHESES DEVELOPMENTResearch that examines tax implications of managerial incentives generally focuses on how
compensation provides an incentive for aggressive tax reporting. For example, prior research hasfound a positive association between tax aggressiveness and annual bonus compensation �Hanlonet al. 2007�, equity-based compensation �Desai and Dharmapala 2006�, and compensation levelsof CFOs and CEOs �Rego and Wilson 2008�. Additionally, Dyreng et al. �2010� examine the effectof individual managers on corporate tax planning and report that corporate tax planning is afunction of individual tax managers’ characteristics. Phillips �2003� finds that compensating busi-
3 As described by Larcker �2003�, studies of management choice are typically confronted by endogeneity, and this studyis no exception. Hanlon et al. �2003� address similar endogeneity issues in their study of executive stock options. Wedescribe our approach in more detail in the research method section.
Performance Measurement of Corporate Tax Departments 1037
The Accounting Review May 2010American Accounting Association

ness unit managers �but not CEOs� on an after-tax basis reduces ETRs.4 In contrast to thisliterature, we investigate the firm characteristics associated with a choice to measure and evaluatethe tax department as a profit or cost center. In addition, we examine whether the performancemeasurement system encourages tax managers to utilize available tax-planning strategies to reduceETRs.
Evaluating Tax Departments as Profit or Cost Centers
Organizational design theory depicts performance measurement as one of three “rules of thegame” that determine how individuals behave in an organization.5 Divisional performance mea-surement consists of a system of measuring and evaluating the performance of the firm’s subunits�e.g., departments�. The suitability and effectiveness of divisional and individual performancemeasurement systems relate to the cost of acquiring and transferring knowledge in the organiza-tion �Jensen and Meckling 1998�. Information transfer costs depend on the type of knowledgerequired to be acquired and/or transferred where knowledge can be characterized along a con-tinuum where one end is general knowledge and the other end is specific knowledge. Generalknowledge is easily aggregated and transferred at a relatively low cost, whereas specific knowl-edge is idiosyncratic information that is difficult to aggregate and is costly to transfer. Knowledgethat resides in tax departments can be characterized along this same continuum. Some tax knowl-edge could be viewed as general because tax accounting relies on general financial principles andoften corresponds to financial accounting precepts. However, most tax knowledge is specificbecause tax rules �1� vary from accounting principles in peculiar ways, �2� vacillate over time, and�3� are often contextual and difficult to interpret and apply.
When specific knowledge is located in a subunit �i.e., the tax department�, the performancemeasurement system should correspond to the costs of transferring the knowledge within the firm.The literature describes several different performance measurement systems, but for purposes ofthis study we compare only two: cost centers and profit centers �Brickley et al. 1995; Jensen andMeckling 1998�. A cost center is a performance measurement system based on minimizing costsfor a given output, maximizing output for a given cost, or minimizing average cost. In contrast, aprofit center is a system based on evaluating the department by the difference between its costsand revenue �as defined by the system�.
Much prior research �both theoretical and empirical� focuses on the importance of perfor-mance measures in compensation contracts; however, relatively little empirical evidence exists toidentify the determinants of performance measure choices. The empirical evidence tends to focuson performance measurement for firm executives �Lambert and Larcker 1987; Sloan 1993; Bush-man et al. 1996� or general workers �Ittner and Larcker 2002� rather than on the performancemeasurement of business units or departments. There are exceptions. A handful of studies �Govin-darajan and Gupta 1985; Simons 1987; Bushman et al. 1995; Keating 1997� investigate the factorsassociated with the choice of performance measures for business units. However, business unitsare typically operating divisions rather than administrative functions with responsibilities perme-ating the entire firm. Nonetheless, these studies provide insight into the determinants of perfor-
4 Mills et al. �1998� investigate investments in tax planning and find that effective tax planning is a function of tax-planning costs and opportunities to engage in tax planning; however, they do not investigate the incentives in place toencourage tax planning.
5 The other two rules are the reward system and the method of partitioning decision rights. The three rules are related. Forexample, rewards must be coordinated with performance measurement to have the intended effect on behavior. Oursurvey data limit us to an investigation of performance measurement only. As we discuss below, to the extent that thethree rules are contradictory, the choice of performance measurement system could be ineffectual.
1038 Robinson, Sikes, and Weaver
The Accounting Review May 2010American Accounting Association

mance measures for business units. We draw upon these studies to develop our performancemeasurement model for tax departments.
Prior research finds that firm decentralization, diversification, and growth opportunities areassociated with the use of corporate performance measures in division manager compensation�Bushman et al. 1995; Keating 1997�.6 In our study, the corporate “bottom line” is a firm-wide orcorporate performance measure, implying that a profit center performance measure is equivalent toa firm-wide measure. In contrast, a cost center performance measure is more closely aligned witha divisional- or departmental-level performance measure.
DecentralizationFirms may be decentralized in a number of ways, such as along product lines, by legal
entities, or across geographic regions. In decentralized firms, the manager of each business unit ordivision is granted the right to make business decisions for the division �Brickley et al. 1995�. Incontrast, business decisions at centralized firms are made at the corporate level. Regardless ofwhether their operating divisions are centralized or decentralized, in most firms, administrativefunctions such as the tax department operate at the corporate level.7 For example, Johnson &Johnson is a decentralized company divided by product lines; however, the tax function forJohnson & Johnson is highly centralized.8 Tax departments of centralized firms are likely toconsider the overall firm effects of their tax-planning decisions even without an explicit perfor-mance measurement system incentive. However, tax managers at decentralized firms might need afirm-wide performance measure �i.e., profit center� to encourage them to consider overall firmperformance in making their tax-planning decisions. Consequently, firm diversification and decen-tralization are likely to affect the choice of tax department performance measure. Based on thisdiscussion, we posit the following hypothesis �stated in alternative form�:
H1a: The likelihood that a firm will measure its tax department as a profit center increaseswith firm size and decentralization.
Departmental Interdependencies and CoordinationInformation problems vary with the degree of firm centralization �Matejka and DeWaegenaere
2005�, and tax plans must often integrate specific tax knowledge with specific knowledge fromoperating units. Because effective tax plans must consider the economic environment and businessstrategies across different operating units, managers of large, decentralized firms may have diffi-culty determining if all tax-planning opportunities have been identified or effectively imple-mented. Therefore, even within decentralized firms, the optimal choice of performance measuremay depend on the coordination between the divisions or departments. In the case of a firm that isdecentralized but has no coordination among its divisions, measuring the performance of the taxdepartment as a profit center might influence a tax manager to engage in tax saving strategies thatwill not only reduce tax expense, but also reduce overall firm profitability �Jensen and Meckling1998�.
To illustrate this point, assume that a tax department determines that it is optimal for the firmto operate a manufacturing facility in a specific low tax jurisdiction. If labor or materials for the
6 Keating �1997� finds that the use of division-level metrics is positively related to the correlation between divisionearnings and value in the division’s industry. However, we do not incorporate this result in our study because we areunable to assess either the tax department’s earnings or value.
7 We do not intend to imply that a decentralized firm is likely to have either a centralized or decentralized tax department.Instead, we expect that, all else equal, a decentralized firm is more likely to have a tax department evaluated using aprofit center model.
8 We thank an anonymous reviewer for this example.
Performance Measurement of Corporate Tax Departments 1039
The Accounting Review May 2010American Accounting Association

facility are not readily available in this jurisdiction, additional costs to obtain these critical pro-duction inputs might exceed any tax savings from a reduced tax rate. Operating managers might beaware of the lack of resource availability, but might not communicate this information to the taxdepartment in the absence of coordination between the tax department and operating units. Con-sequently, net income could actually decrease rather than increase. Additionally, without coordi-nation, many tax strategies developed by profit center tax departments might be impossible toimplement. With coordination, profit center tax departments can modify tax plans to includeconstraints identified by the operating units to enhance overall firm profits. In contrast, cost centertax departments lack any explicit incentive to either identify or engage in costly coordination oftax-planning strategies because they seek to minimize costs. Accordingly, we hypothesize that thedegree of coordination can affect the performance measurement choice �stated in alternativeform�:
H1b: The likelihood that a firm will measure its tax department as a profit center increaseswith the degree of coordination between the tax department and operating units.
Firm Growth and Tax-Planning OpportunitiesFinancial performance metrics do not always reflect the expected future performance effects
of present actions or decisions. A critical factor is the time horizon from initiation to fruition. Forexample, investment in R&D may not result in increases in profitability for several years, yet theexpenditures associated with those investments reduce current profits. Prior research providesevidence that the use of firm-wide accounting metrics is negatively associated with firm growthopportunities �Keating 1997�. Consistent with this research, we expect a negative associationbetween firm growth opportunities and the likelihood of measuring the tax department as a profitcenter.
Jensen and Meckling �1998� caution that the choice of performance measurement systemmust fit the circumstances of the firm. A cost center performance measure is optimal when cor-porate management can easily assess the quantity and quality of departmental output. In contrast,“if the knowledge required to make the product mix, quantity, and quality decisions is specific tothe division and therefore costly or impossible for managers at higher levels to obtain, the profitcenter can be an effective performance measurement system” �Jensen and Meckling 1998, 352�.As tax-planning opportunities become more evident, it is likely that managers will lack the spe-cific tax knowledge necessary to assess either the quantity or quality of the tax department’stax-planning efforts. In this situation, a firm-wide performance metric, such as contribution to netincome, might be a more useful performance measure than a departmental measure such asquantity or quality of tax-planning efforts. Therefore, as tax planning becomes a greater focus ofthe tax department, a profit center performance measurement system is likely to provide a bettermeasure of a tax department’s performance.
However, a performance measurement system based upon a firm-wide metric will not beeffective unless: �1� the tax department has potential tax-planning opportunities and �2� corporatemanagement can measure efforts expended on tax planning. Prior research documents cross-sectional variation in investments in tax planning and finds that this variation is related to firmcharacteristics such as firm size, growth, extent of foreign operations, capital intensity, and othercharacteristics associated with tax-planning opportunities �Mills et al. 1998; Dunbar and Phillips2001�. Wilson �1995� explains that the tax terrain �i.e., the underlying tax opportunities� affects thevalue that the tax department can add to stakeholders.
In addition, corporate managers must be able to determine the contribution of tax planning tothe corporate bottom line. In general, the time horizon for evaluating tax-planning opportunities isfairly short. Jennings et al. �2010� investigate the persistence of tax preferences and document that
1040 Robinson, Sikes, and Weaver
The Accounting Review May 2010American Accounting Association

most of the benefits of tax planning are reflected in current earnings. Thus, the outcome of taxplanning ought to be measurable using current earnings. In addition, Mills et al. �1998� find that a$1 investment in tax-planning results in a $4 decrease in tax liabilities. This suggests that tax-planning efforts will be at least partially revealed in effective tax rates and by extension, netincome. Based on this discussion, we posit the following hypothesis �stated in alternative form�:
H1c: The likelihood that a firm will measure its tax department as a profit center increaseswith tax-planning opportunities.
Importance of Financial Tax ManagementIn addition to tax-planning opportunities, firm management must also place value on tax
department functions, and this value can be revealed in various managerial actions or incentives.For example, management’s choice to compensate officers and business unit managers on a pre-tax or after-tax basis could reveal tax function value �Phillips 2003�. Additionally, a competitiveindustry might push managers to seek innovative ways �including tax strategies� to increase firmvalue �Hou and Robinson 2006�. Finally, firms engaging in earnings management to meet or beatearnings targets might use tax accounts to manage their book earnings �Phillips et al. 2003;Dhaliwal et al. 2004; Badertscher et al. 2009�. Thus, to the extent that firm managers view taxesas a tool to meet earnings targets, managers would view the tax function as valuable. We posit thefollowing hypothesis �stated in alternative form�:
H1d: The likelihood that a firm will measure its tax department as a profit center increaseswith the value firm management places on the tax function.
ETR Consequences of Evaluating Tax Departments as Profit CentersIn this section we describe how the choice of a performance measurement model for a tax
department impacts firm profitability through its effect on a firm’s effective tax rate.9 Jensen andMeckling �1998� suggest that cost centers work best for evaluating units where departmentaloutput is externally determined and when firm management can easily and inexpensively measurethe quality and quantity of the output of the department. In the context of a tax department, thisoccurs when the tax department’s primary function is tax compliance.10 Compliance tasks arerelatively easy for firm managers to monitor, as external agencies �state, federal, and internationalenforcement agencies� require firms to file returns with fixed deadlines and enforce these require-ments. Thus, compliance-oriented tax departments evaluated as cost centers would maximize firmvalue if compliance activities are certain and/or management can ascertain and evaluate the speci-fied output externally. If no external incentive exists for tax planning in cost center tax depart-ments, tax planning would only occur to the extent that either tax planning is inseparable from taxcompliance or tax personnel are intrinsically motivated to engage in such activities �Osterloh andFrey 2000�.
9 Although tax managers of both profit and cost centers can improve net income by engaging in cost-saving measures, weexpect that these cost savings will be smaller in magnitude than the potential savings from tax planning. As a result, wefocus our discussion on the tax-planning activities of tax departments as revealed in firms’ effective tax rates. Werecognize that using effective tax rates as a measure of the consequences of the different performance measures haslimitations. For example, effective tax rates will not capture benefits from deferral tax-planning techniques nor will itreflect tax-planning strategies if implicit taxes offset the benefits �Halperin and Sansing 2005; Jennings et al. 2010�.Nevertheless, effective tax rates are reported in published financial statements and represent the observed output fromthe tax department.
10 We assume that tax departments’ tasks are twofold: tax compliance and tax planning. We acknowledge that the tasks arerelated and, at times, inseparable. However, we proceed, as has prior literature, under the premise that the two tasks areseparable �Mills et al. 1998�.
Performance Measurement of Corporate Tax Departments 1041
The Accounting Review May 2010American Accounting Association

As tax planning becomes more important for tax departments, operating as a cost centerbecomes more challenging and can result in reduced firm profits. Firms sacrifice profits because,ceteris paribus, a department evaluated as a cost center will seek to operate at a level thatminimizes average costs for tasks that do not have fixed output requirements �e.g., tax planning�rather than operate at the optimal level of output �Jensen and Meckling 1998�. We use Figure 1�modified from Jensen and Meckling 1998� to illustrate how the performance measurement modelfor a tax department might affect firm profitability. The figure depicts a U-shaped cost function fora firm’s tax department, where cost is represented on the Y-axis and quantity of tax-planningservices is represented on the X-axis.
Figure 1 models a firm that has many tax-planning opportunities, with the optimal demandcondition requiring tax-planning output Q*. However, assume that the knowledge necessary toobtain the optimal amount of tax planning is specific to the tax department and inaccessible tothose higher in the firm hierarchy. Because the optimal level of tax planning and its cost are notexternally determined, a department evaluated as a cost center will seek to minimize average costs�quantity QC in Figure 1�. Actual firm profitability is lower at point QC because the tax departmentoperates at a suboptimal level of tax planning to minimize costs. At the same time, firm manage-
FIGURE 1Desired Output of Manager Evaluated as a Cost Center with No Quantity Constraint
Average Cost
QC Q*
Cost
Quantity
Source: Jensen and Meckling (1998).The vertical axis represents the cost of tax services and the horizontal axis represents the quantity of tax-planning services for a specific demand condition. QC represents tax-planning output when the tax departmentis evaluated using a cost center model, and Q* represents the optimal tax-planning output for a firm with unusedtax-planning opportunities.
1042 Robinson, Sikes, and Weaver
The Accounting Review May 2010American Accounting Association

ment is unable to correct the tax department’s suboptimal choice because it lacks the specificknowledge to detect the effort and assess the quality of tax-planning activities.11
In contrast, suppose that the firm in Figure 1 uses a profit center to evaluate the tax depart-ment. Although firms can operationalize the contribution to firm profits in different ways, we positthat firms evaluate profit center tax departments by the incremental reduction in income taxexpense because this metric directly contributes to the firm’s bottom line, reported after-tax finan-cial income. Rather than minimizing costs, profit center tax departments will engage in tax-planning activities until marginal costs equal marginal benefits. Thus, in contrast to the cost centerdepartment, a tax department evaluated as a profit center will increase tax-planning activities thatcontribute to reported income �a reduction in ETR� until reaching Q*.12
Hence, a profit center can be a more effective performance measurement system when knowl-edge is necessary to determine the optimal output and this knowledge is specific to the department�i.e., it is very costly for higher-level managers to ascertain the optimal level of the department’soutput�. In the case of a tax department, the application of the tax law �specific knowledge� cannotbe measured, but its output �tax savings� can be assessed and compensated according to its valueto the firm �Osterloh and Frey 2000�. Consequently, the effectiveness of the decision to measureand evaluate a tax department as a profit or a cost center is dependent on firm characteristicsrelated to whether tax-planning opportunities exist and the extent to which the tax function isvalued by the firm.
Of course, several factors could preclude profit center tax departments from reducing ETRsby increasing tax-planning activities. First, a lack of coordination could prevent the requiredinformation transfers between the tax department and operating units, thereby diminishing thelikelihood of identifying or implementing optimal tax plans for the firm as a whole. If tax depart-ments find it difficult to identify or implement tax strategies because of a lack of informationtransfer and coordination between divisions, then the marginal costs of tax-planning strategiesincrease. As a result, the likelihood of pursuing a beneficial tax strategy decreases. Second, im-plicit taxes can constrain tax planning designed to reduce ETRs. Using the example of locating afacility in a low tax jurisdiction, if demand for labor or materials increases operating costs, thenany tax savings on the investment could be offset and possibly dominated by increasing costs. Theoverall effect could be a decrease in net income rather than the expected increase. To the extentthat implicit taxes erode explicit tax benefits, we would not expect to observe any difference inETRs between profit and cost center firms. Finally, recall that the performance measurementsystem is one of three “rules” of organizational design. If the other two rules, the reward systemand the method of partitioning decision rights, are incompatible or inconsistent with the perfor-mance measurement system, then there might not be any difference between firms using profitcenters versus those using cost centers. Based on this discussion, we predict the following hy-pothesis �stated in alternative form�:
H2: Firms more likely to use a profit center model to evaluate their tax departments will beassociated with lower effective tax rates than firms more likely to use a cost centermodel.
11 Note that if a firm does not have many tax-planning opportunities �or resources�, the firm may be operating optimallyby only investing in QC level of planning.
12 Recall that tax departments must provide �directly or indirectly� a minimum amount of tax compliance services. Hence,quantity Q in Figure 1 could also be interpreted as the minimum cost of tax compliance. This assumes that the firm hasunutilized tax-planning opportunities that make the profit center system a viable option.
Performance Measurement of Corporate Tax Departments 1043
The Accounting Review May 2010American Accounting Association
III. RESEARCH METHODSurvey Data and Sample
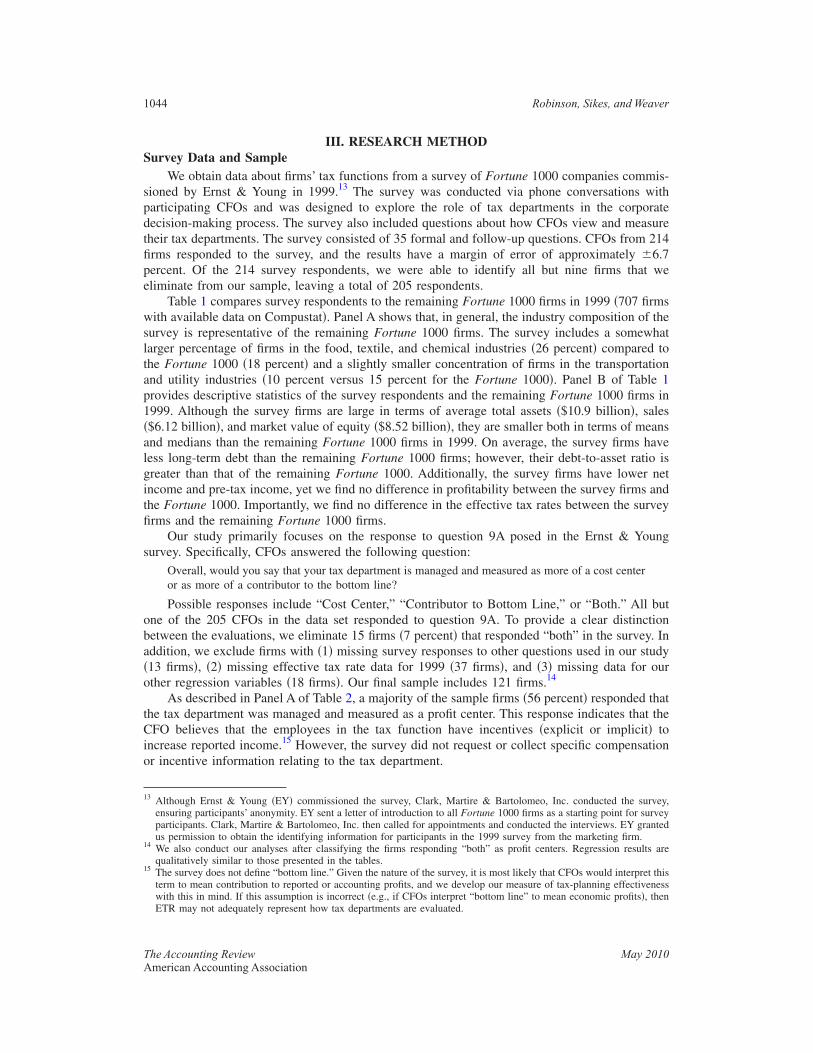
We obtain data about firms’ tax functions from a survey of Fortune 1000 companies commis-sioned by Ernst & Young in 1999.13 The survey was conducted via phone conversations withparticipating CFOs and was designed to explore the role of tax departments in the corporatedecision-making process. The survey also included questions about how CFOs view and measuretheir tax departments. The survey consisted of 35 formal and follow-up questions. CFOs from 214firms responded to the survey, and the results have a margin of error of approximately �6.7percent. Of the 214 survey respondents, we were able to identify all but nine firms that weeliminate from our sample, leaving a total of 205 respondents.
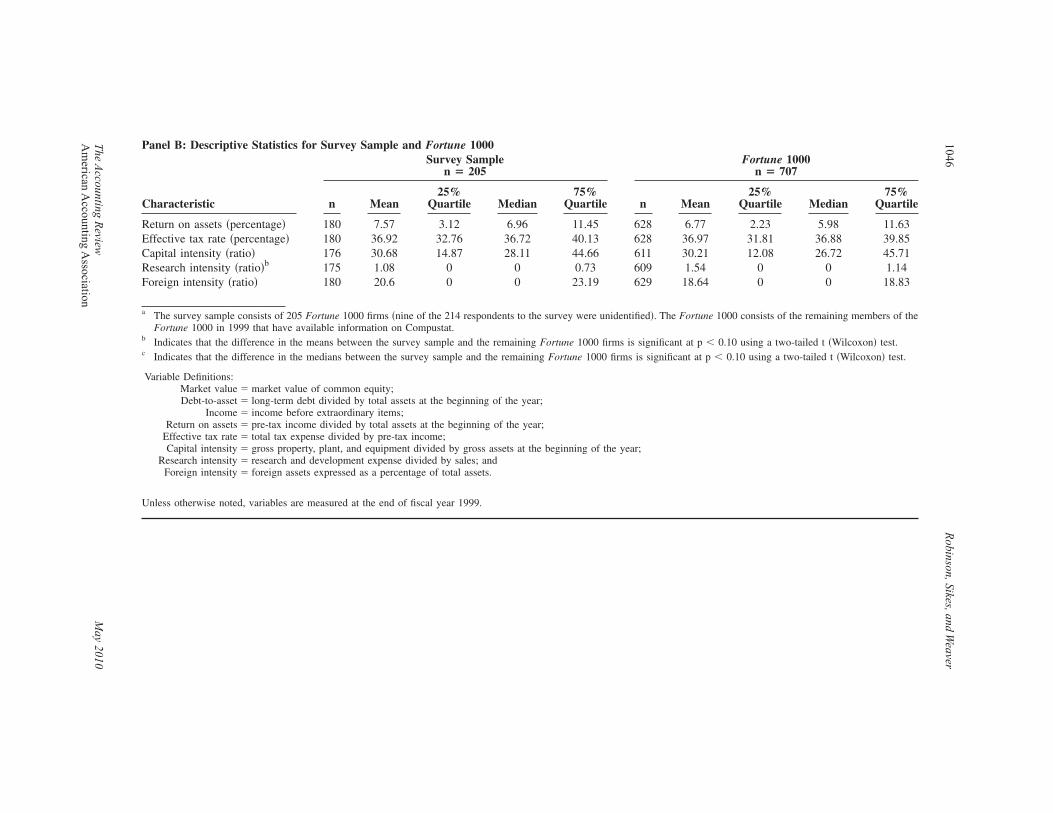
Table 1 compares survey respondents to the remaining Fortune 1000 firms in 1999 �707 firmswith available data on Compustat�. Panel A shows that, in general, the industry composition of thesurvey is representative of the remaining Fortune 1000 firms. The survey includes a somewhatlarger percentage of firms in the food, textile, and chemical industries �26 percent� compared tothe Fortune 1000 �18 percent� and a slightly smaller concentration of firms in the transportationand utility industries �10 percent versus 15 percent for the Fortune 1000�. Panel B of Table 1provides descriptive statistics of the survey respondents and the remaining Fortune 1000 firms in1999. Although the survey firms are large in terms of average total assets �$10.9 billion�, sales�$6.12 billion�, and market value of equity �$8.52 billion�, they are smaller both in terms of meansand medians than the remaining Fortune 1000 firms in 1999. On average, the survey firms haveless long-term debt than the remaining Fortune 1000 firms; however, their debt-to-asset ratio isgreater than that of the remaining Fortune 1000. Additionally, the survey firms have lower netincome and pre-tax income, yet we find no difference in profitability between the survey firms andthe Fortune 1000. Importantly, we find no difference in the effective tax rates between the surveyfirms and the remaining Fortune 1000 firms.
Our study primarily focuses on the response to question 9A posed in the Ernst & Youngsurvey. Specifically, CFOs answered the following question:
Overall, would you say that your tax department is managed and measured as more of a cost centeror as more of a contributor to the bottom line?
Possible responses include “Cost Center,” “Contributor to Bottom Line,” or “Both.” All butone of the 205 CFOs in the data set responded to question 9A. To provide a clear distinctionbetween the evaluations, we eliminate 15 firms �7 percent� that responded “both” in the survey. Inaddition, we exclude firms with �1� missing survey responses to other questions used in our study�13 firms�, �2� missing effective tax rate data for 1999 �37 firms�, and �3� missing data for ourother regression variables �18 firms�. Our final sample includes 121 firms.14
As described in Panel A of Table 2, a majority of the sample firms �56 percent� responded thatthe tax department was managed and measured as a profit center. This response indicates that theCFO believes that the employees in the tax function have incentives �explicit or implicit� toincrease reported income.15 However, the survey did not request or collect specific compensationor incentive information relating to the tax department.
13 Although Ernst & Young �EY� commissioned the survey, Clark, Martire & Bartolomeo, Inc. conducted the survey,ensuring participants’ anonymity. EY sent a letter of introduction to all Fortune 1000 firms as a starting point for surveyparticipants. Clark, Martire & Bartolomeo, Inc. then called for appointments and conducted the interviews. EY grantedus permission to obtain the identifying information for participants in the 1999 survey from the marketing firm.
14 We also conduct our analyses after classifying the firms responding “both” as profit centers. Regression results arequalitatively similar to those presented in the tables.
15 The survey does not define “bottom line.” Given the nature of the survey, it is most likely that CFOs would interpret thisterm to mean contribution to reported or accounting profits, and we develop our measure of tax-planning effectivenesswith this in mind. If this assumption is incorrect �e.g., if CFOs interpret “bottom line” to mean economic profits�, thenETR may not adequately represent how tax departments are evaluated.
1044 Robinson, Sikes, and Weaver
The Accounting Review May 2010American Accounting Association

TABLE 1
Comparison of Survey Firms and Other Fortune 1000 Firms
Panel A: Industry Affiliation of Survey Sample and Fortune 1000a
SIC Industry Affiliation (SIC)
Survey Sample Fortune 1000
Number Percent Number Percent
0000 Agricultural and forestry 2 1 2 11000 Metal and construction 14 7 19 32000 Food, textile, and chemicals 53 26 129 183000 Rubber, metal, and machine
products39 19 150 21
4000 Transportation and utilities 20 10 107 155000 Wholesale and retail trade 28 13 128 186000 Financial services 31 15 108 157000 Hotel and other services 10 5 45 68000 Health and other services 6 3 16 29000 Utilities 2 1 3 1
Total 205 100 707 100
Panel B: Descriptive Statistics for Survey Sample and Fortune 1000
Characteristic
Survey Samplen � 205
Fortune 1000n � 707
n Mean25%
Quartile Median75%
Quartile n Mean25%
Quartile Median75%
Quartile
Assets �$ in millions�b,c 180 10,881 1,271 2,662 7,123 629 21,961 1,682 4,393 13,441Sales �$ in millions�b,c 180 6,122 1,733 2,735 5,874 631 8,365 1,903 3,375 8,582Market value �$ in millions�b,c 169 8,524 512 1,691 4,587 603 15,285 1,071 3,401 9,544Long-term debt �$ in
millions�b,c180 2,001 252 729 1,473 628 3,501 311 854 2,552
Debt-to-asset �ratio in percent�c 180 24.67 12.49 23.6 33.85 628 22.83 8.78 21.7 32.61Income �$ in millions�b,c 180 340 39 124 289 631 529 57 185 501Pretax income �$ in millions�b,c 180 546 72 196 462 630 842 94 293 778
(continued on next page)
Performance
Measurem
entofCorporate
TaxD
epartments
1045
The
Accounting
Review
May
2010A
merican
Accounting
Association
Panel B: Descriptive Statistics for Survey Sample and Fortune 1000
Characteristic
Survey Samplen � 205
Fortune 1000n � 707
n Mean25%
Quartile Median75%
Quartile n Mean25%
Quartile Median75%
Quartile
Return on assets �percentage� 180 7.57 3.12 6.96 11.45 628 6.77 2.23 5.98 11.63Effective tax rate �percentage� 180 36.92 32.76 36.72 40.13 628 36.97 31.81 36.88 39.85Capital intensity �ratio� 176 30.68 14.87 28.11 44.66 611 30.21 12.08 26.72 45.71Research intensity �ratio�b 175 1.08 0 0 0.73 609 1.54 0 0 1.14Foreign intensity �ratio� 180 20.6 0 0 23.19 629 18.64 0 0 18.83
a The survey sample consists of 205 Fortune 1000 firms �nine of the 214 respondents to the survey were unidentified�. The Fortune 1000 consists of the remaining members of theFortune 1000 in 1999 that have available information on Compustat.
b Indicates that the difference in the means between the survey sample and the remaining Fortune 1000 firms is significant at p � 0.10 using a two-tailed t �Wilcoxon� test.c Indicates that the difference in the medians between the survey sample and the remaining Fortune 1000 firms is significant at p � 0.10 using a two-tailed t �Wilcoxon� test.
Variable Definitions:Market value � market value of common equity;Debt-to-asset � long-term debt divided by total assets at the beginning of the year;
Income � income before extraordinary items;Return on assets � pre-tax income divided by total assets at the beginning of the year;
Effective tax rate � total tax expense divided by pre-tax income;Capital intensity � gross property, plant, and equipment divided by gross assets at the beginning of the year;
Research intensity � research and development expense divided by sales; andForeign intensity � foreign assets expressed as a percentage of total assets.
Unless otherwise noted, variables are measured at the end of fiscal year 1999.
1046R
obinson,Sikes,andW
eaver
The
Accounting
Review
May
2010A
merican
Accounting
Association
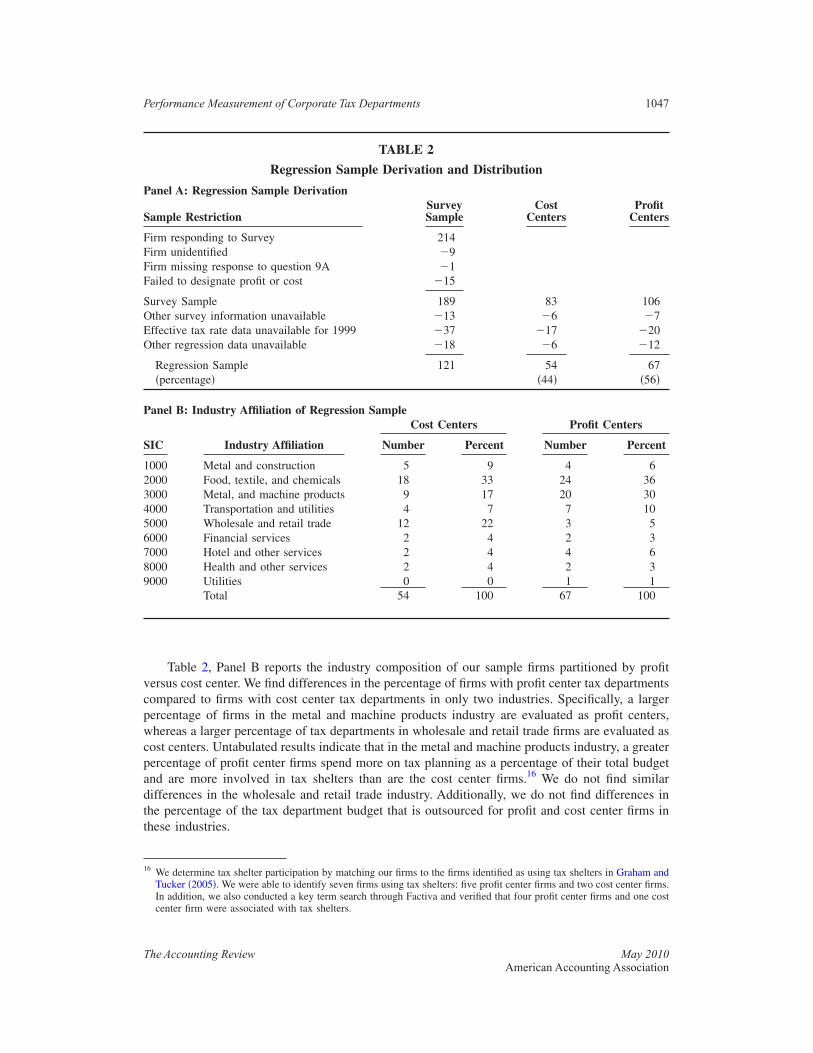
Table 2, Panel B reports the industry composition of our sample firms partitioned by profitversus cost center. We find differences in the percentage of firms with profit center tax departmentscompared to firms with cost center tax departments in only two industries. Specifically, a largerpercentage of firms in the metal and machine products industry are evaluated as profit centers,whereas a larger percentage of tax departments in wholesale and retail trade firms are evaluated ascost centers. Untabulated results indicate that in the metal and machine products industry, a greaterpercentage of profit center firms spend more on tax planning as a percentage of their total budgetand are more involved in tax shelters than are the cost center firms.16 We do not find similardifferences in the wholesale and retail trade industry. Additionally, we do not find differences inthe percentage of the tax department budget that is outsourced for profit and cost center firms inthese industries.
16 We determine tax shelter participation by matching our firms to the firms identified as using tax shelters in Graham andTucker �2005�. We were able to identify seven firms using tax shelters: five profit center firms and two cost center firms.In addition, we also conducted a key term search through Factiva and verified that four profit center firms and one costcenter firm were associated with tax shelters.
TABLE 2
Regression Sample Derivation and Distribution
Panel A: Regression Sample Derivation
Sample RestrictionSurveySample
CostCenters
ProfitCenters
Firm responding to Survey 214Firm unidentified �9Firm missing response to question 9A �1Failed to designate profit or cost �15
Survey Sample 189 83 106Other survey information unavailable �13 �6 �7Effective tax rate data unavailable for 1999 �37 �17 �20Other regression data unavailable �18 �6 �12
Regression Sample 121 54 67�percentage� �44� �56�
Panel B: Industry Affiliation of Regression Sample
SIC Industry Affiliation
Cost Centers Profit Centers
Number Percent Number Percent
1000 Metal and construction 5 9 4 62000 Food, textile, and chemicals 18 33 24 363000 Metal, and machine products 9 17 20 304000 Transportation and utilities 4 7 7 105000 Wholesale and retail trade 12 22 3 56000 Financial services 2 4 2 37000 Hotel and other services 2 4 4 68000 Health and other services 2 4 2 39000 Utilities 0 0 1 1
Total 54 100 67 100
Performance Measurement of Corporate Tax Departments 1047
The Accounting Review May 2010American Accounting Association

Determinants of Profit/Cost Center ChoiceWe begin our analysis by operationalizing the model that represents the choice of perfor-
mance measure for a tax department �i.e., profit or cost center� as a function of decentralization,departmental coordination, firm growth, and tax-planning opportunities, and the emphasis the firmplaces on tax planning. Equation �1� provides the empirical specification:
PROFIT = �0 + �1SIZE + �2FOR + �3LINE + �4GEO + �5COOR + �6GROW + �7RDI
+ �8LEV + �9CAPI + �10INVI + �11INTAN + �12PLAN + �13HERF + �14TOOL
+ � . �1�
All variables other than those that are generated from answers to the survey questions�PROFIT, COOR, PLAN, and TOOL� are measured in fiscal year 1998. We include a summary ofvariable definitions in Table 3.
DecentralizationHypothesis 1a predicts that the likelihood that a firm will measure its tax department as a
profit center increases with firm size and decentralization. Because we do not have a directmeasure of firm decentralization, we rely on prior literature to identify characteristics associatedwith decentralized firms. Palmer et al. �1993� posit that decentralization occurs when firms expandeither the scope or the size of their operations beyond a point where a central management cancoordinate operations efficiently. Brickley et al. �1995� also note that larger companies, especiallythose facing stiff foreign competition, are more likely to decentralize decision rights. Decentral-ized firms are associated with departmental interdependencies, as measured by the degree ofproduct line and geographic diversification �Bushman et al. 1995�. Consistent with this literature,we include firm size �SIZE�, amount of foreign operations �FOR�, product line diversification�LINE�, and geographic diversification �GEO� as proxies for firm decentralization. We expectpositive coefficients on these variables and measure them as follows:
SIZE � natural logarithm of total assets at year-end;FOR � ratio of foreign assets to total assets at year-end;LINE � number of reported product line segments; andGEO � number of reported geographic segments.
Departmental CoordinationCoordination between the tax department and business operations is important in decentral-
ized firms to facilitate information transfer of both specific tax and general business knowledge.We include COOR to capture the degree of coordination between the tax department and operatingunits and expect a positive coefficient. We obtain this variable from question 2 of the Ernst &Young survey, which asks:
To what degree is your tax department involved in business operations? By business operations Imean both the day-to-day activities of your company as well as the more long-range or strategicfunctions.
CFOs responded using a five-point scale, with 5 �1� indicating the highest �lowest� level ofinvolvement. The variable COOR equals 1 if a CFO’s response is 4 or 5, and equals 0 otherwise.
Firm Growth and Tax-Planning OpportunitiesKeating �1997� finds that firms with greater growth opportunities are less likely to use a
firm-wide performance. Consistent with Keating �1997�, we measure firm growth using a firm’s
1048 Robinson, Sikes, and Weaver
The Accounting Review May 2010American Accounting Association
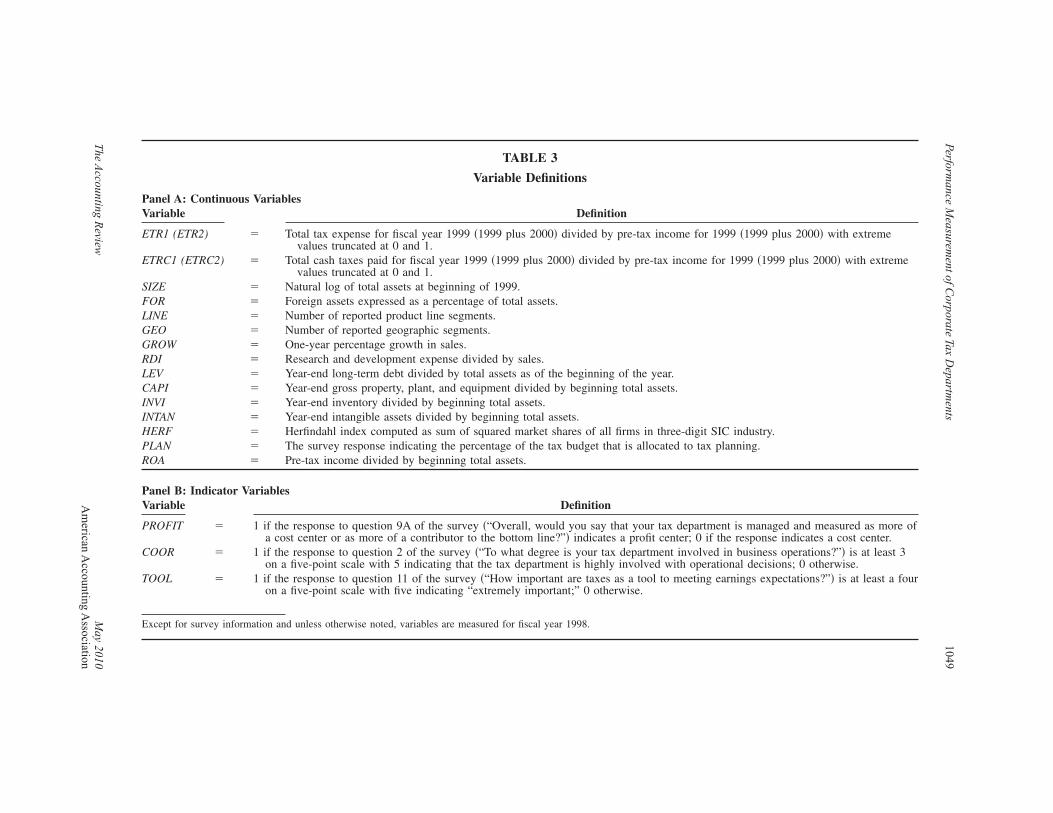
TABLE 3
Variable Definitions
Panel A: Continuous VariablesVariable Definition
ETR1 (ETR2) � Total tax expense for fiscal year 1999 �1999 plus 2000� divided by pre-tax income for 1999 �1999 plus 2000� with extremevalues truncated at 0 and 1.
ETRC1 (ETRC2) � Total cash taxes paid for fiscal year 1999 �1999 plus 2000� divided by pre-tax income for 1999 �1999 plus 2000� with extremevalues truncated at 0 and 1.
SIZE � Natural log of total assets at beginning of 1999.FOR � Foreign assets expressed as a percentage of total assets.LINE � Number of reported product line segments.GEO � Number of reported geographic segments.GROW � One-year percentage growth in sales.RDI � Research and development expense divided by sales.LEV � Year-end long-term debt divided by total assets as of the beginning of the year.CAPI � Year-end gross property, plant, and equipment divided by beginning total assets.INVI � Year-end inventory divided by beginning total assets.INTAN � Year-end intangible assets divided by beginning total assets.HERF � Herfindahl index computed as sum of squared market shares of all firms in three-digit SIC industry.PLAN � The survey response indicating the percentage of the tax budget that is allocated to tax planning.ROA � Pre-tax income divided by beginning total assets.
Panel B: Indicator VariablesVariable Definition
PROFIT � 1 if the response to question 9A of the survey �“Overall, would you say that your tax department is managed and measured as more ofa cost center or as more of a contributor to the bottom line?”� indicates a profit center; 0 if the response indicates a cost center.
COOR � 1 if the response to question 2 of the survey �“To what degree is your tax department involved in business operations?”� is at least 3on a five-point scale with 5 indicating that the tax department is highly involved with operational decisions; 0 otherwise.
TOOL � 1 if the response to question 11 of the survey �“How important are taxes as a tool to meeting earnings expectations?”� is at least a fouron a five-point scale with five indicating “extremely important;” 0 otherwise.
Except for survey information and unless otherwise noted, variables are measured for fiscal year 1998.
Performance
Measurem
entofCorporate
TaxD
epartments
1049
The
Accounting
Review
May
2010A
merican
Accounting
Association

one-year percentage growth in sales and expect a negative coefficient on GROW. Firms with fewtax-planning opportunities are unlikely to measure their tax departments as profit centers. Weinclude several variables to capture firms’ tax-planning opportunities. Prior literature documentsan association between tax planning and various firm characteristics such as firm size, growth,extent of foreign operations, capital intensity, R&D intensity, leverage, intangibles, and industry�Gupta and Newberry 1997; Grubert and Slemrod 1998; Hanlon et al. 2007; Dyreng et al. 2008�.We include the following variables to proxy for tax-planning opportunities: R&D intensity �RDI�,leverage �LEV�, capital intensity �CAPI�, inventory intensity �INVI�, and intangibles �INTAN�. Weexpect a positive coefficient for each of these variables and we measure them as follows:
RDI � R&D expense divided by sales;LEV � year end long-term debt divided by beginning total assets;
CAPI � gross property, plant, and equipment divided by beginning total assets;INVI � year end inventory divided by beginning total assets; and
INTAN � intangible assets divided by beginning total assets.
Brickley et al. �1995� conclude that companies in the same industry tend to develop similarorganizational architectures. In addition, prior research controls for industry membership in taxburden regressions �Zimmerman 1983; Wilkie 1988; Collins and Shackelford 1996; Jacob 1996;Phillips 2003; Rego 2003; Dyreng et al. 2008�; thus, we control for industry by clustering byone-digit SIC code.
Importance of Financial Tax ManagementWe include three variables to represent the emphasis that firm management places on tax
management. One measure of the importance that a firm places on tax planning is the percentageof its total tax budget that it allocates to tax planning, as opposed to compliance. We include avariable from the survey, PLAN, which captures the percentage of the tax budget that is allocatedto tax planning as opposed to tax compliance �Mills et al. 1998�. We obtain this variable fromquestion 5A of the 1999 Ernst & Young survey, which asks:
Thinking now of your total tax department budget, what proportion is spent on tax-planningactivities and what percentage on compliance?
We use a Herfindahl Index, calculated as the sum of squared market shares of all firms in anindustry, to measure industry concentration �Hou and Robinson 2006�. The variable HERF is aninverse measure of the level of competition in an industry. We measure a firm’s market share as itssales divided by the sum of the sales of all firms in its industry, which we define using three-digitSIC codes. TOOL captures the importance that a firm places on using taxes to meet earningstargets. We expect that firms that view taxes as a tool to meet earnings expectations are more likelyto organize their tax departments as profit centers to encourage this behavior. Question 11 in the1999 Ernst & Young survey asks:
How important are taxes as a tool to meeting earnings expectations?
Responses vary from 5 � Extremely Important to 1 � Not Important at All. TOOL equals 1if a firm responded with a 5 or 4, and 0 otherwise. We expect positive coefficients on PLAN andTOOL, and a negative coefficient on HERF.
Performance Consequences of Profit/Cost Center ChoiceHypothesis 2 predicts a negative relation between a firm’s likelihood of managing its tax
department as a profit center and the firm’s effective tax rate. An important econometric issue isthat the profit/cost center choice may be correlated with unobservables that affect firm perfor-
1050 Robinson, Sikes, and Weaver
The Accounting Review May 2010American Accounting Association
mance. That is, if firms with lower ETRs are more likely to be profit centers, then, ceteris paribus,failing to control for the endogeneity will yield profit center coefficient estimates that are incon-sistent. For instance, it is possible that firms choosing to evaluate tax departments as profit centersalso value tax planning and may provide any number of incentives to reduce ETRs, only one ofwhich we test. Indeed, anecdotal evidence suggests that in the 1990s �the same time period inwhich profit center tax departments developed�, firms stressed the value of tax planning throughETRs �Douglas et al. 1996; Krueger 1999; Martucci 2001�. These potential alternative incentivesto reduce ETRs may be correlated with the profit/cost center choice thereby creating an endoge-neity issue.
To address potential endogeneity, we test H2 using a two-stage approach. We recognize thata two-stage model may be inadequate to control for potential endogeneity �Larcker 2003�, and thisis an inherent limitation of our methodology.17 The first stage is the profit/cost center choice fromEquation �1�. This equation depicts the profit/cost center choice as a function of firm decentrali-zation and departmental coordination, firm growth, tax-planning opportunities, and the importanceof tax planning. In the second stage, we explain firm performance as a function of the predictedand residual components of the profit/cost center choice and other controls. The predicted com-ponent of PROFIT captures the systematic determinants of the profit/cost center choice that mayaffect firm performance. The residual component of PROFIT represents the unobservable or un-explained incentives that may contribute to firm performance. We test H2 with the followingequation:
ETR = �0 + �1PROFIT* + �2RESIDUAL + �3COOR + �4PLAN + �5TOOL + �6LEV
+ �7CAPI + �8FOR + �9RDI + �10INTAN + �11INVI + �12ROA + �13GROW + �14SIZE
+ � . �2�
Prior research demonstrates that ETRs reflect various tax-planning strategies used to manageearnings �Mills et al. 1998; Phillips 2003; Dhaliwal et al. 2004; Krull 2004�.18 We adopt ETR asour dependent variable because it is arguably the most direct way to assess the consequences ofthe profit center measurement system. If the systematic determinants of PROFIT drive the effectof the performance measurement system on ETRs, then we would expect a negative coefficient onPROFIT*, the predicted profit component ��1�. If the unobservable firm characteristics or incen-tives that lead firms to their profit/cost center choice also affect their ETRs, then we would expecta negative coefficient on RESIDUAL, the residual PROFIT component ��2�.
Dependent VariablesWe measure effective tax rates in two ways: 1999 ETR �ETR1� and, as an alternative measure,
a 1999–2000 average ETR (ETR2�. Consistent with Phillips �2003�, our measure of ETR1 is theratio of total tax expense to pre-tax income in 1999. We use total tax expense in the numerator ofETR1 because only actions that reduce total tax expense will decrease firms’ reported effective taxrate and thereby increase reported financial earnings. To control for unexplained year-to-yearfluctuations in annual ETRs, we also estimate Equation �1� using an average ETR calculated over
17 We also estimate Equations �1� and �2� simultaneously using a maximum likelihood method and find results �untabu-lated� that are qualitatively similar to those reported in the tables.
18 It is unlikely that alternative measures of tax aggressiveness would suit our research design as these measures do notalways directly affect net income. For example, prior research uses book-tax differences or cash ETRs as alternativemeasures of tax aggressiveness �Dyreng et al. 2008; Rego and Wilson 2008�. However, the deferral strategies reflectedin these measures will not affect net income.
Performance Measurement of Corporate Tax Departments 1051
The Accounting Review May 2010American Accounting Association

1999 and 2000 �ETR2�.19 We restrict the period over which we average ETR2 to 1999 through2000 because we want to test the effect of designating the tax function as a profit center in 1999on tax-planning effectiveness. Therefore, we do not use years prior to 1999. We do not includeyears after 2000 because of the dramatic changes beginning in 2001, including extension of taxshelter regulations, market fluctuations after September 11, 2001, and the enactment of theSarbanes-Oxley Act of 2002.
Consistent with prior literature, we constrain ETR1 and ETR2 to lie between 0 and 100percent to prevent estimation problems and unreasonable values of ETRs due to small denomina-tors �Gupta and Newberry 1997�.20 We set ETR1 and ETR2 to 0 percent for firms with tax refundsand to 100 percent for firms with positive taxes and negative �or zero� income. Several recentstudies document limitations regarding measuring tax burdens with financial statement data �Millsand Plesko 2003; Hanlon 2003; McGill and Outslay 2004�. For our study, given that the incentiveis to “contribute to the bottom line,” which we interpret as reported net income, it is important forus to use the measure of ETR used for financial reporting purposes regardless of these measure-ment issues. References to ETR in the following discussion refer to both ETR1 and ETR2.
Tax-Planning ResourcesWe include three variables to control for firms’ tax-planning resources in model �2�. We
control for the amount of coordination between the tax department and operations by including thevariable COOR. We do not sign COOR because effective coordination may work either to reducethe tax expense or to rein in infeasible tax-planning ideas. To control for tax department planningresources, we include PLAN, which captures the percentage of the tax budget that is allocated totax planning as opposed to tax compliance. We expect PLAN to be negatively associated withETRs. We include TOOL to capture the importance management places on using taxes to meetearnings targets. We expect that firms that view taxes as a tool to meet earnings expectations willhave lower ETRs.
Tax-Planning OpportunitiesConsistent with prior literature, we include several variables in Equation �2� to proxy for a
firm’s tax-planning opportunities. Only if the firm has opportunities to engage in tax planning willtax saving strategies be developed and implemented. We previously discussed these variables indeveloping the PROFIT equation as they also relate to the profit or cost center decision. Weinclude these variables in the ETR equation to account for their direct effect on ETRs. Specifically,we include variables for leverage �LEV�, capital intensity �CAPI�, foreign operations �FOR�, R&Dintensity �RDI�, intangible intensity �INTAN�, and inventory intensity �INVI�.
Prior research yields mixed results on the relation between leverage and ETRs; therefore, wedo not predict a sign on LEV �Gupta and Newberry 1997; Mills et al. 1998; Phillips 2003; Rego2003�.21 Firms with multinational operations �FOR� have more opportunities to avoid incometaxes than domestic firms �Phillips 2003; Rego 2003�; however, multinational firms also facetaxation on profits in multiple jurisdictions or may have foreign tax credit limitations �Markle andShackelford 2009�. Therefore, we do not predict a sign on FOR. We include variables for capitalintensity �CAPI�, R&D intensity �RDI�, and inventory intensity �INVI� expecting negative coeffi-
19 To calculate this variable, we sum total tax expense for years 1999 and 2000 for the numerator and divide by the sumof pretax income in 1999 and 2000. In supplemental analyses, we limit our sample to firms with a positive sum forpretax income, and the results are qualitatively similar to those presented in the tables.
20 As a sensitivity test, we constrain ETR to a maximum of 50 percent. The results are qualitatively the same as those wereport in Table 7.
21 The sign between LEV and ETR could be positive if firms with high tax rates are more likely to use debt financing.However, a negative relation between LEV and ETR would be consistent with interest expense deductibility.
1052 Robinson, Sikes, and Weaver
The Accounting Review May 2010American Accounting Association

cients on these variables consistent with Gupta and Newberry �1997�.22 Consistent with Chen et al.�2008�, we include INTAN to control for differing book and tax treatments of intangible assets.However, opportunities to shift income could also be represented by INTAN �Grubert and Slemrod1998�. Thus, we do not predict a sign on INTAN.
Controls
We include several additional variables because prior research has linked such factors asprofitability, growth, size, and industry to ETRs �Zimmerman 1983; Wilkie 1988; Bankman 1994;Gupta and Newberry 1997; Mills et al. 1998; Phillips 2003�. We include a firm’s profitability�ROA� to proxy for changes in book income. Bankman �1994� finds that high-growth firms gen-erally place less emphasis on tax planning, suggesting a positive relationship between firm growthand ETRs. We proxy for growth with a firm’s one-year percentage sales growth �GROW� for 1998.We expect ROA and GROW to be positively related to ETR. We control for firm size �SIZE� andindustry because prior research documents that they are important determinants of ETRs. Becauseprior research finds mixed results on the relation between firm size and ETRs, we do not predicta sign on SIZE. We control for industry effects by clustering the standard errors by one-digit SICcodes.
IV. RESULTSDescriptive Statistics
Table 4 presents descriptive statistics for our continuous regression variables partitioned bymeasurement scheme. Our comparison reveals several differences. Our sample consists primarilyof large firms: mean �median� values of the natural log of total assets �SIZE� is 7.55 �7.32� for costcenters and 8.04 �8.02� for profit centers. This translates into average total assets of $2.21 �$3.53�billion, untabulated, for cost �profit� center firms and indicates that profit center firms are largerthan cost center firms. Sample firms are profitable �by construction�, as shown by the inter-quartilerange for return on assets �ROA�, which runs from 4.4 to 13.0 percent for cost centers and from 6.4to 14.7 percent for profit centers.
The median ETR for cost center firms �0.387 for ETR1 and 0.382 for ETR2� is higher than themedian for profit center firms �0.36 for ETR1 and 0.362 for ETR2�. Firms that evaluate their taxdepartments as profit centers also spend a larger proportion of their tax budget on planning, aremore R&D- and intangible-intensive, have more geographic segments, and are less levered thanfirms evaluating their tax departments as cost centers. We find no significant differences betweenprofit and cost center firms in terms of foreign assets, number of product lines, percentage growthin sales, capital intensity, and industry competitiveness.
In untabulated tests, we find that a greater proportion of profit center firms have more coor-dination �COOR� between their tax department and business operations than do cost center firms�52 percent to 21 percent�. In addition, a larger proportion of firms that evaluate their tax depart-ments as profit centers as opposed to cost centers �48 percent to 33 percent� believe that taxes arean important tool for meeting earnings expectations �TOOL�.23 On the whole, these univariate
22 During the sample period of Gupta and Newberry �1997�, firms could take advantage of investment tax credits, whichreduced their total tax expense. Although firms in our sample period cannot take advantage of investment tax credits andaccelerated depreciation for tax purposes does not affect total tax expense, we still use capital intensity to proxy fortax-planning opportunities because we expect that firms that are more capital intensive can strategically locate theirassets.
23 The proportion of profit center firms that report coordination between their tax department and business operations�COOR� and use taxes as an earnings management tool �TOOL� is significantly greater than the proportion of cost centerfirms, p � 0.10 using a two-tailed Chi-square test �untabulated�.
Performance Measurement of Corporate Tax Departments 1053
The Accounting Review May 2010American Accounting Association
TABLE 4
Regression Sample Descriptive Statistics
Variable
Cost Centers(n � 54)
Profit Centers(n � 67)
Mean Std. Dev. 25% Quartile Median 75% Quartile Mean Std. Dev. 25% Quartile Median 75% Quartile
ETR1b,c 0.378 0.094 0.350 0.387 0.413 0.344 0.084 0.321 0.360 0.391ETR2a,c 0.366 0.105 0.350 0.382 0.412 0.356 0.118 0.324 0.362 0.388ETRC1a 0.310 0.236 0.145 0.323 0.383 0.258 0.134 0.176 0.260 0.331ETRC2a 0.309 0.201 0.184 0.309 0.396 0.299 0.180 0.200 0.252 0.361SIZEb,c 7.554 0.995 6.877 7.324 8.044 8.040 1.125 7.178 8.016 8.722FOR 0.044 0.125 0.000 0.000 0.000 0.089 0.184 0.000 0.000 0.000LINE 8.056 5.093 3.000 8.000 12.000 9.403 5.497 5.000 9.000 12.000GEOc 5.407 5.417 2.000 3.000 7.000 6.478 4.150 3.000 6.000 9.000GROW 0.151 0.356 0.001 0.071 0.169 0.067 0.196 �0.011 0.041 0.109RDIb,c 0.270 0.679 0.000 0.000 0.000 2.419 4.435 0.000 0.139 2.643LEVb,c 0.284 0.167 0.174 0.266 0.363 0.231 0.159 0.107 0.225 0.304CAPI 0.358 0.241 0.180 0.300 0.511 0.366 0.212 0.224 0.342 0.437INVIb,c 0.215 0.212 0.051 0.159 0.306 0.128 0.140 0.048 0.099 0.148INTANb,c 0.085 0.102 0.000 0.033 0.154 0.136 0.158 0.000 0.084 0.213HERF 0.487 0.454 0.217 0.336 0.528 0.460 0.353 0.195 0.321 0.697PLANb,c 0.313 0.171 0.200 0.300 0.400 0.376 0.189 0.250 0.330 0.500ROAb,c 0.093 0.060 0.044 0.089 0.130 0.124 0.110 0.064 0.106 0.147
a Statistics for ETR2, ETRC1, and ETRC2 were calculated using all non-missing values. The number of observations for ETR2, ETRC1, and ETRC2 equals 51, 53, and 50,respectively, for Cost Center firms and 62, 65, and 60 for Profit Center firms, respectively. Variables are defined in Table 3.
b Indicates that the difference in the means between cost centers and profit centers is significant at p � 0.10 using a two-tailed t test.c Indicates that the difference in the medians between cost centers and profit centers is significant at p � 0.10 using a two-tailed median test.
1054R
obinson,Sikes,andW
eaver
The
Accounting
Review
May
2010A
merican
Accounting
Association

results suggest that firms that measure and evaluate their tax departments as profit centers arelikely using taxes as a tool to contribute to bottom line earnings.
Table 5 presents the correlations among our continuous variables. The profit center choice,PROFIT, is positively correlated with SIZE, RDI, and INTAN and negatively correlated with ETR1and INVI. The effective tax rate for 1999 �ETR1� is highly correlated with the two-year effectivetax rate �ETR2�. Most correlations among the remainder of the variables are small, thereby miti-gating possible multicollinearity concerns.
Logistic Regression Results for Tests of Hypothesis 1Table 6 provides the logistic regressions results for testing our first set of hypotheses. Model
1 tests H1a and H1b, Model 2 tests H1c, Model 3 tests H1d, and Model 4 tests all three hypoth-eses. We estimate these regressions using robust standard errors adjusted for clustering acrossindustry �one-digit SIC�. In Model 1, we observe the positive relationship predicted by H1abetween the profit center choice and three of the four proxies for firm decentralization �SIZE,FOR, and LINE�. In addition, the positive and significant coefficient on COOR �1.593, p � 0.01�supports H1b. Together, our proxies for firm decentralization and interdepartmental coordinationexplain about 15 percent of the variation in the measurement system choice.
Model 2 in Table 6 tests H1c, which predicts that the likelihood that a firm will measure itstax department as a profit center increases with tax-planning opportunities. Together, the tax-planning variables explain slightly more than 17 percent of the variation in the choice to manageand measure the tax department as a profit center. However, only one of the tax-planning oppor-tunity coefficients is significant �RDI � 0.512, p � 0.01�.
Model 3 in Table 6 tests H1d, which predicts that the likelihood that a firm will measure itstax department as a profit center increases with the value that firm management places on the taxfunction.24 As predicted, we find that the choice to manage and measure the tax department as aprofit center is positively associated with the degree of importance a firm places on taxes as a toolto meet earnings expectations �TOOL � 0.619, p � 0.01� and with the percentage of the total taxbudget that the firm allocates to tax planning as opposed to compliance �PLAN � 1.76, p �0.037�. Together, the variables that proxy for the firm’s emphasis on tax planning explain only 4percent of the variation in firms’ performance measurement system choice.
In Model 4 the combination of independent variables explain almost 31 percent of the varia-tion in a firm’s choice to manage and measure its tax department as a profit center. This model isrelatively well fitted �Hosmer-Lemeshow �2 = 9.26, p � 0.32� and has substantial predictivepower �over 77 percent predicted accurately at a 50 percent cutoff�. The regression results for thefull model are consistent with firm decentralization and interdepartmental coordination resultsfrom Model 1, with the exception that FOR is insignificant and the estimated coefficient for GEOis negative. The tax-planning opportunity variable �RDI� from Model 2 remains significant in thefull model and another variable �INTAN � 5.976, p � 0.013� becomes significant in Model 4. Theestimated coefficient for TOOL is no longer significant in Model 4; however, PLAN remainsmarginally significant.
To provide a sense of magnitude we estimate the average marginal effects �at the samplemeans� of several coefficient estimates in Table 6 �untabulated�. We find that an increase of anadditional product line segment �from an average of 8.8 product lines to 9.8 product lines� in-creases the likelihood of a sample firm measuring tax department performance via a profit center
24 As sensitivity tests we alternately include a variable equal to the percentage of the tax department budget that isoutsourced and a variable equal to sales, general, and administrative expense expressed as a percentage of sales. Whileour sample size decreases with the inclusion of either of these variables, the results remain qualitatively unchanged andthe coefficient on the included variable is insignificant.
Performance Measurement of Corporate Tax Departments 1055
The Accounting Review May 2010American Accounting Association
TABLE 5
Pearson Correlation MatrixPROFIT ETR1 ETRC1 ETR2 ETRC2 SIZE FOR LINE GEO GROW RDI LEV CAPI INVI INTAN PLAN ROA
ETR1 �0.189 1.000ETR2 �0.045 0.754 1.000ETRC1 �0.139 0.265 0.225 1.000ETRC2 �0.025 0.091 0.093 0.752 1.000SIZE 0.222 �0.141 0.020 �0.039 �0.015 1.000FOR 0.140 0.055 �0.004 �0.027 �0.084 �0.053 1.000LINE 0.126 �0.225 �0.224 0.119 0.135 0.211 �0.239 1.000GEO 0.112 0.057 0.098 0.189 �0.022 0.266 0.259 0.133 1.000GROW �0.149 0.078 �0.139 0.109 �0.014 �0.238 �0.129 �0.017 �0.135 1.000RDI 0.307 �0.196 �0.103 �0.009 �0.081 0.322 0.197 0.084 0.153 �0.047 1.000LEV �0.163 0.065 0.028 �0.135 �0.163 0.060 �0.153 0.062 �0.099 0.197 �0.215 1.000CAPI 0.018 �0.098 �0.006 �0.178 �0.164 0.261 0.101 0.011 0.041 �0.206 �0.129 0.253 1.000INVI �0.241 0.109 �0.025 0.014 0.008 �0.329 �0.048 �0.228 �0.208 0.330 �0.127 0.226 �0.360 1.000INTAN 0.185 0.175 0.131 0.144 0.115 0.033 �0.035 �0.055 0.184 �0.007 0.025 0.127 �0.197 �0.158 1.000HERF �0.034 0.150 0.087 0.232 0.054 �0.102 0.061 0.002 0.115 �0.024 �0.125 0.045 0.049 �0.023 0.003 1.000PLAN 0.172 �0.112 �0.102 �0.024 �0.066 0.027 0.100 0.048 0.152 �0.097 0.288 �0.077 �0.048 �0.025 0.130 0.071 1.000ROA 0.171 0.074 0.084 0.076 0.053 �0.097 0.078 �0.059 �0.046 �0.004 0.185 �0.104 0.004 0.084 0.043 0.106 0.301
Bold indicates that the Pearson correlation is significant at p � 0.05. Variables are defined in Table 3.
1056R
obinson,Sikes,andW
eaver
The
Accounting
Review
May
2010A
merican
Accounting
Association

TABLE 6
Logistic Regression Results(n � 121)
Variables Prediction Model 1 Model 2 Model 3 Model 4
DecentralizationSIZE 0.447*** 0.487**
�5.03� �2.26�FOR 2.073** 1.189
�1.60� �0.74�LINE 0.074** 0.098***
�1.85� �2.39�GEO 0.003 �0.077**
�0.30� �2.29
Departmental CoordinationCOOR 1.593*** 2.003***
�4.43� �4.12�
Firm Growth and Tax-Planning OpportunitiesGROW � �0.600 0.035
��0.69� �0.03�RDI 0.512*** 0.494***
�4.00� �2.87�LEV �1.569 �2.714
��0.63� ��1.16�CAPI 0.921 0.882
�0.63� �0.51�INVI �1.324 �0.287
��0.89� ��0.21�INTAN 3.151 5.976**
�1.25� �2.25�
Emphasis on Tax PlanningHERF � �0.336 �0.042
��0.69� ��0.06�TOOL 0.619*** 0.353
2.64 �0.82�PLAN 1.76** 1.271*
�1.82� �1.30�Constant �4.629*** �0.199 �0.473 �5.817***
��4.45� ��0.40� ��1.24� ��4.39�Pseudo R2 0.149 0.173 0.039 0.307
Pearson �2 117.10 113.48 115.34 100.18p-value �0.43� �0.50� �0.42� �0.64�
*, **, *** Robust t-statistics in parentheses denote statistical significance at p � 0.10, p � 0.05, and p � 0.01,respectively, at the one-tailed level for variables with predictions, and two-tailed otherwise.Variables are defined in Table 3.
Performance Measurement of Corporate Tax Departments 1057
The Accounting Review May 2010American Accounting Association

by about 2 percent. The initiation of a research initiative by a sample firm that costs about 1percent of sales would increase the likelihood of a profit center by over 10 percent. An increase inintangible assets from the sample average of 11 percent of total assets to 21 percent increases thelikelihood of a profit center by almost 13 percent. Finally, a sample firm that significantly in-creased coordination with a tax department �COOR from 0 to 1� would increase the likelihood ofa profit center by almost 38 percent. Together these results suggest that decentralization, depart-mental coordination, tax-planning opportunities, and firm emphasis on tax planning are importantdeterminants in the choice of measuring and evaluating firms’ tax departments as profit or costcenters.
Results of Tests of Hypothesis 2
Hypothesis 2 posits that firms expected to adopt a profit center measurement system will haverelatively lower effective tax rates. Table 7 reports the results of our tests of H2, estimating ETRregressions with robust standard errors adjusted for clustering across industry �one-digit SIC�. Wereport the results of two models after eliminating influential observations.25 The first model usesETR1 as the dependent variable and the second model uses ETR2. Consistent with prior research,both ETR regressions exhibit significant explanatory power �36.1 percent of the variation in ETR1and 31.9 percent in ETR2�. Because the results for both ETR1 and ETR2 are largely consistent,below we discuss the ETR1 results and note where the ETR2 results differ.
The estimated coefficient in Table 7 for profit center status, PROFIT*, is negative and statis-tically significant �p � 0.01 for ETR1 and p � 0.05 for ETR2�, as predicted. Although this resultmust be viewed cautiously given the potential for endogeneity in the ETR regression, the negativecoefficient on PROFIT* ��0.148� is consistent with the contention that, conditional on the re-maining independent variables, firms predicted to use a profit center to evaluate the tax departmentare associated with lower ETRs. That is, based on this regression, we would expect to observe areduction in ETRs of 1.5 percent, on average, for every 10 percent increase in the likelihood thata firm would adopt a profit center measurement model. To further quantify this result, we comparethe predicted ETR for a firm with a 55 percent likelihood of choosing a profit center model �themedian for PROFIT*� with the predicted ETR for a firm whose characteristics increase thelikelihood of choosing a profit center by one standard deviation of PROFIT* �29 percent�. A onestandard deviation increase in the likelihood of using a profit center model to evaluate the taxdepartment is associated with a reduction in the predicted ETR from 35.8 to 31.5 percent.26
The estimated coefficient on RESIDUAL in Table 7 is not statistically significant, suggestingthat the potential unobservable characteristics or unmodeled incentives that lead firms to theirprofit/cost center choice do not separately affect their ETRs. In other words, the systematic deter-minants of PROFIT such as decentralization, firm size, and tax-planning opportunities and re-sources are the important factors that drive ETRs lower for profit center firms.
In addition to these primary results, several of the estimated coefficients for control variablesare statistically significant. Under tax-planning resources, the estimated coefficient for TOOL isnegative and significant. This result is consistent with firms having lower ETRs when their CFOsbelieve taxes are an important earnings management tool. With respect to tax-planning opportu-nities, the estimated coefficients for LEV, CAPI, FOR, INTAN, and INVI are statistically signifi-
25 The ETR1 �ETR2� regression excludes six �17� potentially influential observations identified using the procedures inBelsley et al. �1980�. Inclusion of these observations produces similar results.
26 We estimate the median sample firm’s reduction in ETR using the coefficients from the ETR1 model of Table 7 and themedian values of all variables except indicator variables, which we set to zero.
1058 Robinson, Sikes, and Weaver
The Accounting Review May 2010American Accounting Association

cant. Additionally, ROA and SIZE are both positive and significant. The estimated coefficients forthe remaining variables are not significant.27
27 We conduct multiple alternative tests to check sensitivity. We include a variable in the ETR equation indicating whetherfirms have negative pretax income to control for differences in incentives for firms with possible NOLs �Beaver et al.2007�. Next, we alternatively substitute different measures for variables such as size �market value of equity or sales�,extent of foreign operations �proportion of foreign income or sales�, and growth �market-to-book ratio�. The results wereport in Table 7 are robust to these alternate specifications.
TABLE 7
ETR Regression Results
Construct Prediction Variables ETR1 ETR2
Tax Department Evaluation � PROFIT* �0.148*** �0.107**��3.73� ��2.44�
RESIDUAL �0.005 �0.018��0.48� ��1.53�
Tax-Planning Resources ? COOR 0.033 0.019�1.56� �0.99�
� PLAN �0.011 �0.004��0.64� ��0.15�
� TOOL �0.015** �0.021***��1.86� ��4.57�
Tax-Planning Opportunities ? LEV 0.047* 0.066**�1.95� �2.98�
� CAPI �0.043** �0.085***��1.87� ��3.32�
? FOR 0.041** 0.056**�2.81� �2.48�
� RDI �0.001 �0.002*��0.52� ��1.60�
? INTAN 0.152*** 0.097**�3.91� �3.00�
� INVI �0.078*** �0.088***��3.67� ��3.42�
Controls ROA 0.048*** 0.070**�2.63� �1.87�
GROW 0.002 0.015�0.13� �1.08�
? SIZE 0.009*** 0.010***�4.29� �2.87�
Constant 0.375*** 0.352***�21.88� �11.37�
Observations 115 104R2 0.361 0.319
*, **, *** Robust t-statistics in parentheses denote statistical significance at p � 0.10, p � 0.05, and p � 0.01,respectively, at the one-tailed level for variables with predictions, and two-tailed otherwise. Variables are defined inTable 3.
Performance Measurement of Corporate Tax Departments 1059
The Accounting Review May 2010American Accounting Association

Supplemental AnalysesHanlon and Heitzman �2009� partition tax planning into two components: cash tax planning
and tax accrual planning. Many cash tax-planning strategies reduce firms’ cash tax paymentsthrough deferral techniques. These techniques, however, will not reduce the ETR reported in thefinancial statements because of the accrual concept of accounting for income taxes. A profit centerdesignation may lead firms to engage in tax accrual planning that is designed to reduce thefinancial ETR and not cash tax payments �e.g., designating foreign earnings as permanentlyreinvested�. Our primary tests cannot distinguish which of these two planning components con-tributes to our profit center results. In this section, we extend our analyses to test whether mea-suring and evaluating tax departments as profit or cost centers affects real tax planning that isreflected in cash ETRs.
To test this proposition, we alternatively substitute ETRC1 �1999 cash ETR� and ETRC2�average 1999–2000 cash ETR� for our dependent variable in Equation �2�.28 We measure ETRC1as the ratio of income taxes paid per the 1999 statement of cash flows to pretax income �Dyrenget al. 2008�. Consistent with our measure of effective tax rate, we measure ETRC2 as the ratio ofthe sum of taxes paid per the 1999 and 2000 statements of cash flows to the sum of pretax incomein 1999 and 2000. Table 4 Panel A shows that the mean median ETRC1 and ETRC2 are 25.8 �26.0�and 29.9 �25.2� percent, respectively, for profit center firms and 31.0 �32.3� and 30.9 �30.9�percent, respectively, for cost center firms. We find no statistical difference in mean and medianETRC1 or ETRC2 between profit and cost center firms. A negative coefficient on PROFIT* wouldsuggest that firms with underlying characteristics of profit centers have lower cash ETRs. Table 8presents the results from estimating these cash-ETR regressions.
The regressions estimated in Table 8 exhibit significant explanatory power, but we find thatPROFIT* and RESIDUAL are not significant in explaining either one- or two-year cash ETRs.These results are not entirely unexpected, given the inherent instability in short-term cash ETRs asdocumented by Dyreng et al. �2008�. In addition, discussions with tax professionals indicate that,during the time period of our survey, many firms were not interested in tax-planning strategies thatdid not generate a financial statement benefit. Consistent with this observation, the 1999 E & Ysurvey finds that 38 percent of survey respondents indicated that ETR is a “very important” metricfor measuring the performance of tax departments, whereas only 6 percent indicated that “cashsavings” was a very important metric for measuring the performance of tax departments. Theresults are also consistent with Armstrong et al. �2009�, who find little evidence that firms incen-tivize tax directors to lower cash tax burdens. Combined with our main results reported in Table 7,the results in Table 8 suggest that a profit center performance model is effective in motivating taxdepartments to reduce financial ETRs, but ineffective in motivating tax departments to reduce cashETRs. This indirect evidence underscores the difference between incentives to encourage real taxplanning �cash tax savings� versus tax accrual planning �financial tax management of ETRs�.29
V. CONCLUSIONWe use confidential survey data from 1999 that indicates whether firms manage and evaluate
their tax function as a profit center �“contributor to the bottom line”� or as a cost center to develop
28 Because cash ETRs tend to be quite volatile from year to year, we repeated the cash ETR regressions using average cashETRs over the three-year period 1998–2000 and the four-year period 1997–2000. The results are qualitatively similar tothose reported in Table 8.
29 The percentage of profit center firms in our sample that disclose information about permanently reinvested earnings andvaluation allowance accounts for years 1998–1999 is greater than the percentage of cost center firms that do so. Thehigher frequency of these disclosures among profit center firms is consistent with the contention that profit center firmsfocus on financial ETRs.
1060 Robinson, Sikes, and Weaver
The Accounting Review May 2010American Accounting Association

a model to identify determinants of corporate tax departments’ performance measurement systems.Our logit test results indicate that the extent of decentralization and departmental coordination areimportant considerations in the decision to utilize a profit center to measure the performance of atax department. We also find evidence that the availability of certain tax-planning opportunities,such as the level of R&D activity and the relative level of intangible assets, are important con-siderations in the choice of performance measurement technique. Finally, we provide weak evi-dence that the choice of performance measure for a tax department is related to the level ofresources committed to tax planning.
TABLE 8
Cash ETR Regression Results
Variables ETRC1 ETRC2
Tax Department Evaluation PROFIT* �0.095 �0.068��1.11� ��0.63�
RESIDUAL 0.014 0.011�1.26� �0.51�
Tax-Planning Resources COOR 0.008 0.002�0.42� �0.15�
PLAN �0.065 �0.130**��1.50� ��2.45�
TOOL �0.074*** �0.060**��4.15� ��2.35�
Tax-Planning Opportunities LEV �0.254*** �0.236***��3.82� ��3.53�
CAPI 0.021 0.013�0.39� �0.25�
FOR �0.031 0.028��1.05� �0.48�
RDI 0.002 0.001�1.32� �0.08�
INTAN 0.310*** 0.290**�3.51� �2.87�
INVI 0.031 0.086�0.53� �1.00�
Controls ROA 0.310 0.254�1.55� �1.59�
GROW 0.213*** 0.091**�4.16� �2.74�
SIZE 0.003 �0.004�0.14� ��0.28�
Constant 0.306** 0.390**�2.35� �2.29�
Observations 113 104R2 0.335 0.236
*, **, *** Robust t-statistics in parentheses denote statistical significance at p � 0.10, p � 0.05, and p � 0.01,respectively, at the one-tailed level for variables with predictions and two-tailed otherwise.Variables are defined in Table 3.
Performance Measurement of Corporate Tax Departments 1061
The Accounting Review May 2010American Accounting Association

Next, we analyze the effect of a firm’s choice to manage and measure its tax department as aprofit center on its effective tax rate. To address potential endogeneity, we use the likelihood ofprofit center measurement as predicted from a logit analysis. As expected, we find that firmsexpected to adopt profit center performance measures for their tax departments have lower effec-tive tax rates. In supplemental analyses, we investigate whether the profit center designationaffects real tax planning �cash ETR� in addition to tax accrual planning. We find no associationbetween the method of evaluating the tax function and the magnitude of cash ETRs, suggestingthat the profit center designation only affects financial tax management and not cash tax savings.
The E&Y survey took place in 1999. Subsequent to this survey, several important eventstranspired �tax shelter regulations and Sarbanes-Oxley� that reduced the predominance of profitcenter tax departments. Many tax departments are focused once again on compliance issuesincluding tax and SFAS No. 109 issues. This trend is consistent with our findings. Morecompliance-oriented tax departments may be acting optimally as cost centers because compliancecosts are relatively more externally driven than tax planning. As a firm’s opportunities for taxplanning and its ability to focus on tax planning shrink, a profit center performance measurementsystem may no longer be optimal, thereby explaining a shift back to cost centers.
The results in this study are important because they illustrate associations between organiza-tional design theory and methods of evaluating administrative functions that were previouslyundetected and untested in the literature. The findings are also important in that they indicate thatperformance measurement can act as an incentive for administrative units, such as a tax depart-ment, to contribute to reported earnings.
REFERENCES
Armstrong, C. S., J. L. Blouin, and D. F. Larcker. 2009. The incentives for tax planning. Working paper,University of Pennsylvania.
Badertscher, B., J. Phillips, M. Pincus, and S. Rego. 2009. Earnings management strategies and the trade-offbetween tax benefits and detection risk: To conform or not to conform? The Accounting Review 84 �1�:63–97.
Bankman, J. 1994. The structure of Silicon Valley start-ups. UCLA Law Review, University of California, LosAngeles, School of Law 41 �September�: 1737–1768.
Beaver, W. H., M. F. McNichols, and K. Nelson. 2007. An alternative interpretation of the discontinuity inearnings distributions. Review of Accounting Studies 12 �4�: 525–556.
Belsley, D. A., E. Q. Kuh, and R. E. Welsch. 1980. Regression Diagnostics: Identifying Influential Data andSources of Collinearity. New York, NY: John Wiley & Sons.
Brickley, J., C. Smith, and J. Zimmerman. 1995. The economics of organizational architecture. Journal ofApplied Corporate Finance 8 �2�: 19–31.
Bushman, R. M., F. J. Indjejikian, and A. Smith. 1995. Aggregate performance measures in business unitmanager compensation: The role of intrafirm interdependencies. Journal of Accounting Research 33�Supplement�: 101–128.
——–, R. J. Indjejikian, and A. Smith. 1996. CEO compensation: The role of individual performance evalu-ation. Journal of Accounting and Economics 21 �April�: 161–193.
Chen, S., X. Chen, Q. Cheng, and T. Shevlin. 2008. Are family firms more or less tax aggressive thannon-family firms? Journal of Financial Economics �forthcoming�.
Collins, J., and D. Shackelford. 1996. Corporate domicile and average effective tax rates: The cases ofCanada, Japan, the United Kingdom, and the United States. In The Taxation of Multinational Corpo-rations, edited by Slemrod, J., 51–79. Boston, MA: Kluwer Academic publishers.
Desai, M. A., and D. Dharmapala. 2006. Corporate tax avoidance and high-powered incentives. Journal ofFinancial Economics 79: 145–179.
Dhaliwal, D. S., C. A. Gleason, and L. F. Mills. 2004. Last chance earnings management: Using the taxexpense to meet analysts’ forecasts. Contemporary Accounting Research 21 �2�: 431–459.
1062 Robinson, Sikes, and Weaver
The Accounting Review May 2010American Accounting Association

Douglas, R. F., P. J. Ellingsworth, and J. P. McAndrews, III. 1996. What management expects: Evaluation ofthe tax department and its executives. Tax Executive �Jan/Feb�: 29–32.
Dunbar, A. E., and J. D. Phillips. 2001. The outsourcing of corporate tax function activities. The Journal ofthe American Taxation Association 23 �2�: 35–49.
Dyreng, S., M. Hanlon, and E. Maydew. 2008. Long-run corporate tax avoidance. The Accounting Review 83�1�: 61–82.
——–, ——–, and ——–. 2010. The effects of executives on corporate tax avoidance. The Accounting Review�forthcoming�.
Ernst & Young. 2004. Tax risk management: The evolving role of tax directors. Available at: http://www.ey.com/global/download.nsf/International/EY_-_Tax_-_Tax_Risk_Management/$file/EY_Tax_Risk_Survey_Report.pdf.
Govindarajan, V., and A. K. Gupta. 1985. Linking control systems to business unit strategy: Impact onperformance. Accounting, Organizations and Society 10 �1�: 51–66.
Graham, J., and A. Tucker. 2005. Tax shelters and corporate debt policy. Journal of Financial Economics 81�3�: 563–594.
Grubert, H., and J. Slemrod. 1998. The effect of taxes on investment and income shifting to Puerto Rico. TheReview of Economics and Statistics 80 �3�: 365–373.
Gupta, S., and K. Newberry. 1997. Determinants of the variability in corporate effective tax rates: evidencefrom longitudinal data. Journal of Accounting and Public Policy 16: 1–34.
Halperin, R., and R. Sansing. 2005. Is the effective tax rate an effective performance measure? Workingpaper, Dartmouth College.
Hanlon, M. 2003. What can we infer about a firm’s taxable income from its financial statements? NationalTax Journal 56 �4�: 831–863.
——–, and S. Heitzman. 2009. A review of tax research. Working paper, Massachusetts Institute of Technol-ogy.
——–, L. Mills, and J. Slemrod. 2007. An empirical examination of big business tax noncompliance. InTaxing Corporate Income in the 21st Century, edited by A. Auerbach, J. R. Hines, Jr., and J. Slemrod,171–210. Cambridge, U.K.: Cambridge University Press.
——–, S. Rajgopal, and T. Shevlin. 2003. Are executive stock options associated with future earnings?Journal of Accounting and Economics 36: 3–43.
Hou, K., and D. T. Robinson. 2006. Industry concentration and average stock returns. The Journal of Finance61 �4�: 1927–1956.
Ittner, C. D., and D. F. Larcker. 2002. Determinants of performance measure choices in worker incentiveplans. Journal of Labor Economics 20 �2�: S58–S90.
Jacob, J. 1996. Taxes and transfer pricing: Income shifting and the volume of intrafirm transfers. Journal ofAccounting Research 34: 301–312.
Jennings, R., W. Mayew, and C. Weaver. 2010. The effect of TRA86 on the extent of implicit taxes at thecorporate level. Working paper, The University of Texas at Austin, Duke University, and Texas A&MUniversity.
Jensen, M. C., and W. H. Meckling. 1998. Divisional Performance Measurement. Foundations of Organiza-tional Strategy. Cambridge, MA: Harvard University Press.
Keating, A. S. 1997. Determinants of divisional performance evaluation practices. Journal of Accounting andEconomics 24: 243–273.
Krueger, M. 1999. AICPA workshop identifies five management areas where controllers can generate value.The Controller’s Report �Jan�: 1, 15–19.
Krull, L. 2004. Permanently reinvested earnings, taxes, and earnings management. The Accounting Review79 �3�: 745–767.
Lambert, R. A., and D. F. Larcker. 1987. An analysis of the use of accounting and market measures ofperformance in executive compensation contracts. Journal of Accounting Research 25 �Supplement�:179–203.
Larcker, D. F. 2003. Discussion of: Are executive stock options associated with future earnings. Journal ofAccounting and Economics 36: 91–103.
Performance Measurement of Corporate Tax Departments 1063
The Accounting Review May 2010American Accounting Association

Markle, K., and D. Shackelford. 2009. Does the domicile of a multinational affect its worldwide corporateincome tax liability? Working paper, University of North Carolina.
Martucci, S. 2001. Fortune 1000 tax departments streamlining to handle strategy role. Global Finance�November�.
Matejka, M., and A. DeWaegenaere. 2005. Influence costs and implementation of organizational changes.Journal of Management Accounting Research 17: 43–52.
McGill, G., and E. Outslay. 2004. Lost in translation: Detecting tax shelter activity in the financial state-ments. National Tax Journal 57 �3�: 739–756.
Mills, L., M. Erickson, and E. Maydew. 1998. Investments in tax planning. The Journal of the AmericanTaxation Association 20 �1�: 1–20.
——–, and G. Plesko. 2003. Bridging the reporting gap: A proposal for more informative reconciling of bookand tax income. National Tax Journal 56 �4�: 865–893.
Osterloh, M., and B. S. Frey. 2000. Motivation, knowledge transfer, and organizational forms. OrganizationScience 11 �5�: 538–550.
Palmer, D., P. D. Jennings, and X. Zhou. 1993. Late adoption of the multidivisional form by large U.S.corporations: Institutional, political, and economic accounts. Administrative Science Quarterly 38:100–131.
Phillips, J. D. 2003. Corporate tax-planning effectiveness: The role of compensation-based incentives. TheAccounting Review 78 �3�: 847–874.
——–, M. Pincus, and S. Rego. 2003. Earnings management: New evidence based on deferred tax expense.The Accounting Review 78 �2�: 491–521.
Rego, S. 2003. Tax avoidance activities of U.S. multinational corporations. Contemporary Accounting Re-search 20: 805–833.
——–, and R. Wilson. 2008. Executive compensation, tax reporting aggressiveness, and future firm perfor-mance. Working paper, The University of Iowa.
Simons, R. 1987. Accounting control systems and business strategy: An empirical analysis. Accounting,Organizations and Society 12: 357–374.
Sloan, R. G. 1993. Accounting earnings and top executive compensation. Journal of Accounting and Eco-nomics 16: 56–100.
Wilkie, P. 1988. Corporate average effective tax rates and inferences about relative tax preferences. TheJournal of the American Taxation Association 10 �Fall�: 75–88.
Wilson, G. P. 1995. Corporate tax effectiveness: Adding value through the tax function. Working paper,Harvard University.
Zimmerman, J. 1983. Taxes and firm size. Journal of Accounting and Economics 5: 119–149.
1064 Robinson, Sikes, and Weaver
The Accounting Review May 2010American Accounting Association

Copyright of Accounting Review is the property of American Accounting Association and its content may not
be copied or emailed to multiple sites or posted to a listserv without the copyright holder's express written
permission. However, users may print, download, or email articles for individual use.