performance of a boundary layer ingesting (bli) propulsion...
TRANSCRIPT
American Institute of Aeronautics and Astronautics
1
Performance of a Boundary Layer Ingesting (BLI)
Propulsion System
A. P. Plas*, M. A. Sargeant**, V. Madani**, D. Crichton**, E. M. Greitzer*,
T. P. Hynes**, C. A. Hall**
*Gas Turbine Laboratory, Massachusetts Institute of Technology, Cambridge, MA
** Engineering Department, University of Cambridge, Cambridge, UK
This paper presents an assessment of the performance of an embedded propulsion system
in the presence of distortion associated with boundary layer ingestion. For fan pressure
ratios of interest for civil transports, the benefits of boundary layer ingestion are shown to
be very sensitive to the magnitude of fan and duct losses. The distortion transfer across the
fan, basically the comparison of the stagnation pressure non-uniformity downstream of the
fan to that upstream of the fan, has a major role in determining the impact of boundary
layer ingestion on overall fuel burn. This, in turn, puts requirements on the fidelity with
which one needs to assess the distortion transfer, and thus the type of models that need to be
used in such assessment. For the three-dimensional distortions associated with fuselage
boundary layers ingested into a subsonic diffusing inlet, it is found that boundary layer
ingestion can provide decreases in fuel burn of several per cent. It is also shown that a
promising avenue for mitigating the risks (aerodynamic as well as aeromechanical) in
boundary layer ingestion is to mix out the flow before it reaches the engine face.
Nomenclature
A = inlet duct area ratio, A(exit)/A(throat)
H = inlet duct offset ratio, H/D
L = L/D
AIP = Aerodynamic Interface Plane
BLI = Boundary Layer Ingestion
DC(60) = circumferential Distortion Coefficient (normalized by mean dynamic head)
D = drag on airframe
D = diameter at AIP
F = propulsive force produced by propulsion system
L = inlet duct length˙ m = mass flow
M = Mach number
p = static pressure
P = mechanical power
PR = inlet duct pressure recovery
PSC = power saving coefficient
TSFC = thrust specific fuel consumption
u = velocity
Greek
= efficiency
Subscripts
A = airframe
j = jet
REF = reference (optimised non-BLI podded)
BLI = with boundary ingestion
w = aircraft wake
= freestream
45th AIAA Aerospace Sciences Meeting and Exhibit8 - 11 January 2007, Reno, Nevada
AIAA 2007-450
Copyright © 2007 by A. Plas, M. Sargeant, V. Madani, D Chrichton, E. Greitzer, T. Hynes, C. Hall. Published by the American Institute of Aeronautics and Astronautics, Inc., with permission.

American Institute of Aeronautics and Astronautics
2
1. Introduction and Scope of the Paper
oundary layer ingestion (BLI) in the context used here means taking fuselage boundary layer fluid through a
propulsor for the purposes of improving fuel efficiency. The idea of applying the concept to aircraft has been
known since the early days of jet propulsion1,2
. Boundary layer ingestion also occurs in ships, torpedoes, and
missiles3. This paper presents an assessment of BLI as applied in the conceptual design of the Cambridge–MIT
Institute (CMI) “Silent Aircraft”, an aircraft with the goal of having a noise level below the ambient noise of an
urban area.
The benefit of boundary layer ingestion comes from re-energizing the aircraft wake. This enables less kinetic
energy to be wasted (in the sense that the kinetic energy produced is over and above the amount needed for
propulsion). The physical concept can be illustrated simply using the two idealized configurations shown in Fig. 1.
The upper part of the figure shows the situation with no boundary layer ingestion, corresponding to conventional
podded engines, and the lower part shows a situation with 100% of the aircraft wake ingested by the engine.
With podded engines the flow entering the engine has a freestream velocity u (the velocity “far upstream”). The
engine accelerates the flow to a velocity uj. For an ideally expanded nozzle the momentum excess thus created
balances the momentum deficit due to the drag of the airframe DA. With uw denoting an appropriate average velocity
in the aircraft wake,
Fengine = ˙ m u j u( ) = ˙ m u uw( ) = DA. (1)
The rate of addition of mechanical power, Pno BLI , given to the flow by the engine is proportional to the difference in
kinetic energy per unit mass between engine exit and far upstream:
Pno BLI =˙ m
2u j
2 u2( ) =F
2u j + u( )
. (2)
The mechanical power required for flight (the useful power) is therefore:
Puseful = DA u = ˙ m u j u( ) u . (3)
The useful power is less than the total power the engine puts into the flow, with the ratio of the two the propulsive
efficiency.
Suppose now that all the aircraft boundary layer is ingested and the engine increases the wake velocity to the far
upstream value. With reference to the lower part of Fig. 1 the aircraft drag, and hence the propulsive force provided
by the engine, is the same as for the podded engine,
Fengine = ˙ m u j uw( ) = ˙ m u uw( ) = DA. (4)
The mechanical power required to produce this force in the presence of boundary layer ingestion, PBLI, is
B
Figure 1. Benefits of BLI-podded case and 100% BLI. The momentum excess created by the
podded engine is equal to the momentum deficit of the airframe

American Institute of Aeronautics and Astronautics
3
PBLI =˙ m
2u j
2 uw2( ) =
˙ m
2u2 uw
2( ) =F
2uw + u( ) . (5)
Since uj > uw, comparison of Eqs. (2) and (5) shows that the power needed for the podded engine to propel the
aircraft at the specified velocity is larger than that for the boundary layer ingesting engine, Pno BLI > PBLI.
The difference in energy input between the two situations occurs because, with a given thrust force, less power
needs to be added to a flow that enters the engine with a lower velocity. Consider a flow that enters an engine with
an upstream velocity u1 and an exit velocity u2. The rate of mechanical power put into the flow is:
P =˙ m
2u2
2 u12( ) = F
u1 + u2
2= F u1 +
u
2
. (6)
The implication of Eq. (6) is most readily presented assuming a constant engine mass flow and constant
propulsive force, but analogous arguments can be made for other relevant situations (e. g., constant engine diameter,
constant propulsion force). For constant aircraft drag u is constant so a decrease in upstream velocity, u1 , results in
a decrease in power. Conversely, the lower inlet velocity due to boundary layer ingestion means that the same
propulsive force can be achieved with less power†.
The above arguments, although idealized, capture the concepts to be described, and the goal of the paper is to
extend them to a representative BLI situation in which the effects of the turbomachinery interaction with the
distortion associated with the aircraft wake are quantitatively addressed. Preempting the conclusion of the literature
survey in the next section, our view is that there has been no assessment of the benefits of BLI for a ducted
propulsor (turbofan) which includes consideration of this interaction and thus links the benefits to the
turbomachinery pumping characteristics. Providing such an assessment, within the context of the design constraints
for the specific aircraft application of interest, is the main contribution of this paper.
In the next section (2), the literature on BLI is briefly reviewed, followed by a general description of the different
effects to be addressed and the approach taken, in Section 3. Section 4 then defines the metric to be used for
evaluation of BLI benefits (the power saving coefficient, defined in the next section), leading into Section 5, which
presents computations of this quantity for a fan in a non-uniform engine flow. Section 6 then looks at an extension
of the basic propulsive efficiency definition for a BLI aircraft to give insight into the parametric dependence in a
more explicit manner and to illustrate the role that mixing of the flow (hence presenting a uniform flow to the
engine) can have. Section 7 then relates the theory to the design implementation, including discussion of the level of
fidelity associated with the analysis, while Section 8 defines risks associated with the use of BLI and the topics that
need to be addressed to overcome these.
2. Previous Work
A number of studies have assessed the benefits of boundary layer ingestion dating back, as stated, at least to
Smith1, followed by others at the Douglas Aircraft Company
4,5. Depending on the assumptions (for example level of
inlet losses, effect on fan performance) various values of benefits were found, ranging from 0 to 16%. While these
early analyses posed the conceptual problem in a clear manner, the main point to be taken from the numerical results
is that there is a potential saving in fuel burn, but that the assumptions need to be well defined in terms of being
appropriate for the situation at hand.
The earlier studies also did not explicitly consider how the engine or fan performance interacted with the non-
uniformity of the inlet flow. Smith3 carried out a thorough examination of an axisymmetric unducted propeller with
wake ingestion which did address this point. He performed an actuator disk analysis of an incompressible flow,
assuming no viscous forces or mixing, ambient static pressure at the inlet (in other words, the body and the propeller
are decoupled: the propeller is far behind the body), with a wake profile that was similar in shape (although different
in magnitude) across the propeller. A useful concept introduced was that of a power saving coefficient, the ratio of
the difference between the propulsive power without BLI and that with BLI to the power necessary to propel the part
† Equation (6) can also be interpreted in terms of classical actuator disk propulsor analysis, using the result that the
velocity at the disk is the mean of the upstream and downstream values. The mechanical power is the product of the
velocity at the disk and the disk force. For constant force, lowering the velocity across the disk lowers the mean
velocity and thus the power and, for constant power, lowering the velocity across the disk increases the disk force.
This gives some plausibility but the argument cannot be pushed too hard for a ducted propulsor where the velocity at
the disk is not necessarily the mean of the upstream and downstream values.

American Institute of Aeronautics and Astronautics
4
of the body whose drag is to be ingested, evaluated for no BLI. As stated, we will also use the power saving
coefficient as the general figure of merit for the effect of BLI.
Smith found the power saving coefficient is a function of the ratio of boundary layer displacement thickness to
boundary layer thickness */ , the shape factor H, the energy factor H*, the wake recovery R (basically a non-
dimensional parameter describing attenuation of the upstream stagnation pressure distortion), the airframe drag
coefficient, and the ratio of ingested drag to airframe drag. For the cases he examined, there was up to a 7% power
saving if all the wake were ingested. Other findings were that the power saving coefficient is not very sensitive to
wake recovery and that the power saving coefficient is higher for higher H and for higher thrust loadings.
Rodriguez6 carried out an analysis of unducted and ducted propulsors, also based on actuator disk assumptions
The flow was assumed incompressible, at ambient static pressure at the inlet (a decoupled body and engine), and
fully mixed prior to entering the actuator disk. He calculated a 2.2% increase in propulsive efficiency for his
estimated 3.6% ingested drag.
More recently there have been several studies of S-ducts7 as well as examinations of the use of active flow
control in the inlet8. These provided useful quantitative results not inconsistent with the above mentioned work, but
they also did not treat the fan and its interaction with the distortion, the focus of this paper.
3. Physical Phenomena and Approach to Assess Boundary Layer Ingestion
A number of different phenomena impact the benefits of BLI. While these were not all analyzed in depth, they
were all examined, either by parametric variation or by calculation, to define their importance and role. The items
considered, portrayed schematically in Fig. 2, include:
a) State of the boundary layer coming into the intake
b) Inlet design (outside and inside)
c) Evolution of the non-uniform inlet flow (distortion) from intake entrance to engine face
d) Distortion transfer across the fan
e) Response of the fan to the distortion (operability, aeromechanics)
f) Evolution of the flow downstream of the fan
g) Duct losses (high sensitivity because of low fan pressure ratio)
This section gives a qualitative discussion of the rationale for the approach taken to address the above concerns.
Figure 2. Features of an embedded engine propulsion system.
American Institute of Aeronautics and Astronautics
5
x
Throat
Mpre. (chosen)
(chosen)
(driven byfan design)
AIP0.5
0.6
0.7
Mac
h N
umbe
r
0.8
0.9
airframe
Mthairframe
Mth = 0.75intake
MAIP = 0.67intake
MAIPairframe
1
2
3
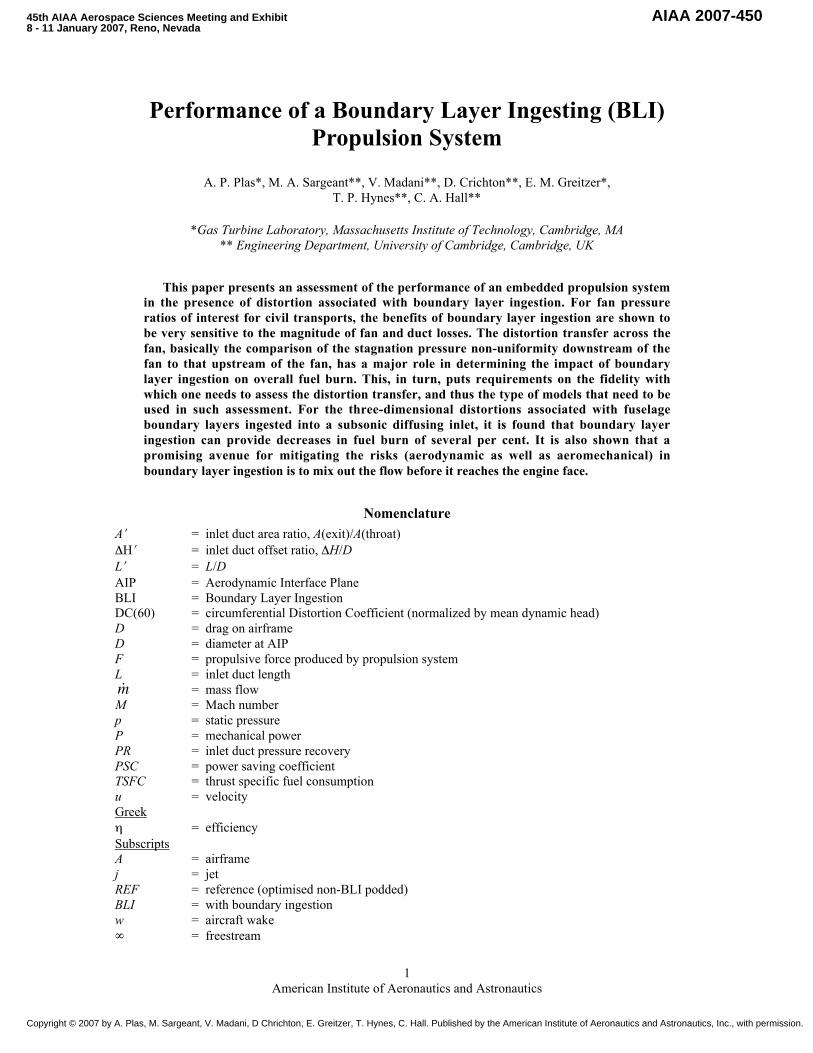
Figure 3. Mach number distribution over the centreline of the airframe. 1: Diffusion by the airframe,
2: Diffusion by the pre-compression zone, 3: Diffusion by the inlet duct.
For initial design work, one can characterize the turbulent boundary layer over the centerbody by a typical
turbulent profile and the usual boundary layer thicknesses. As the boundary layer is ingested into the inlet the flow
changes from an external to an internal one for which flow area blockage is key; the displacement thickness is the
primary measure of this. When boundary layer ingestion is employed, thrust and drag cannot be nicely separated and
the accounting becomes complicated. The requirement for thrust is that the net momentum, in the wake and in the
jet, crossing the Trefftz plane (a plane downstream of the aircraft at which the static pressure is equal to the
freestream value) is equal to that of the incoming flow. Thus, the jet momentum excess, or net thrust, should be
equal to the wake momentum deficit. The wake momentum deficit decreases with boundary layer ingestion. The
ingested boundary layer momentum thickness, a measure of the boundary layer momentum deficit relative to the
local free stream, characterizes the decrease in net thrust.
The thermodynamic benefits of boundary layer ingestion will ultimately show up in the engine power input to
the flow and the kinetic energy thickness of the boundary layer is the relevant parameter. How the various boundary
layer thicknesses respond to the processes involved in the flow through the propulsion system determine the effect
of ingestion. Because of the large difference in length scales between the airframe (centerbody chord, for example)
and engine (engine diameter) the airframe boundary layer can occupy on the order of one-half of the total engine
annulus area, a very different situation from that in a podded inlet. The description of the resulting flow non-
uniformity is carried out in terms of integrals over the flow cross-sectional area but the interpretation of these
parameters in terms of flow deficits of various fundamental quantities is unchanged.
Figure 3 shows the calculated Mach Number distribution (just outside the airframe boundary layer) at cruise over
the centerbody of a typical SAX‡ series aircraft, where the calculation is performed for a clean airframe (i.e. no
intakes present). The figure indicates the degree of coupling between the aircraft and intake aerodynamics. The
centerbody is lifting, so there is a fall in Mach number towards the rear of the aircraft. The intake diffusion
necessary to slow the flow to a fan face Mach number of 0.67 is greatly reduced by moving the intakes rearward.
For the final design, the center engine has its low pressure turbine aligned with the airframe trailing edge, with the
two outer engines as far rearward as disk burst geometrical considerations permit.
The intake length has been set at 2 fan diameters to allow for a large amount of acoustic liners for noise
absorption. Because of the acoustic shielding provided by the airframe, this is probably more than necessary to
absorb fan forward radiated noise (as estimated by conventional methods), but the length has been retained to allow
for any extra noise generated by the interaction of the fan with non-uniform flow. Within these constraints, the
intake has the usual requirements of a good balance between: minimum loss; a lip thickness sufficient to tolerate
‡ SAX, denoting “Silent Aircraft eXperimental" is the acronym that describes the series of aircraft conceptual
designs that have been carried out in this project.

American Institute of Aeronautics and Astronautics
6
changes in engine flow demand, aircraft speed and crosswind performance; and minimum drag over the outside of
the nacelle. Inlets designed for a large amount of boundary layer ingestion will have a comparatively large
(airframe) spanwise extent and there is a need to avoid high Mach numbers in the regions between intakes, and
attendant drag increases. Some alleviation can be achieved by cutting back (scalloping) the airframe surface between
the intakes or by using throat sections which are semi-circular rather than elliptical (the latter ingest a higher
proportion of airframe boundary layer). For a multiple-fan engine, such as in the final conceptual design, a common
intake that divides internally probably represents a more manageable solution to this problem. Complete semi-
circular throat intake designs were undertaken using compressible panel methods for combined intake and airframe
configurations to define the intake captured streamtube. Viscous calculations were employed on domains consisting
of the re-profiled aircraft shape and candidate intake designs.
A large number of geometric variables can be considered in developing an intake and there was only scope to
vary some of these. Where the effect of varying a parameter was not studied the philosophy was to choose a
conservative value. For example, lip thicknesses typical of the side of a modern civil turbofan nacelle were used
around the intake, with no attempt to thin the top lip or to redesign to take advantage of the fact that our intakes are
operating at a lower free stream Mach Number than a conventional podded inlet.
Parameter variations studied include the inlet duct offset,
curvature of the two bends, area ratio and scheduling, and
scalloping of the pre-compression region ahead of the intake
throat (as shown in Fig. 4) in order to increase the intake
pressure recovery and minimise the total pressure distortion
presented to the fan. The secondary flow within the curving
intake tends to concentrate the low stagnation pressure region
over the lower half of the intake and ultimately will detach the
secondary flow towards the centre of the duct. It was found that
duct offset was (by far) the most important parameter governing
the strength of the secondary flow and thus the impact on intake
recovery. Positioning the intakes as far to the rear of the aircraft
as possible to take advantage of the natural curvature of the
airframe considerably reduced the offset and the secondary flow.
Non-uniform flow into a fan will result in a non-uniform fan work distribution over the annulus. As is well
known9, the fan produces a higher pressure rise in the low velocity sector of the annulus, creating a lowered static
pressure in that region upstream of the fan. The consequent flow redistribution implies that the differential fan work
input is out of phase with the incoming distortion and the downstream distortion pattern more complex than the
incoming one. Characterisation using parameters based on extensions of boundary layer thicknesses is thus more
problematical because there is not a one-to-one circumferential correspondence, or distribution, of upstream and
downstream regions with large displacement thickness.
Predicting fan performance in non-uniform inflow as a full wheel calculation can now be done, but the time
required was not appropriate for running a number of computations to define the behavior under different
conditions. Models employing varying degrees of simplifying assumptions were thus used in order to assess the
effects of distortion on fan forced vibration, loss of fan performance and reduction in fan stall margin. These ranged
from simple versions of parallel compressor theory, through body force models and actuator disks operating in a
three-dimensional distorted flow, to full-annulus, unsteady calculation of the distorted flow through the rotor with
unsteady viscous effects in individual rotor passages modelled using body forces. The features of the flow that could
be shown were (of course) quite different, but, perhaps to a surprising extent, the overall conclusions about the
impact of BLI on fuel burn were not only qualitatively, but even quantitatively, similar. This comparison will be
discussed subsequently.
The stagnation pressure and temperature non-uniformity over a substantial fraction of the annulus affect the duct
and nozzle flow capacity and the gross thrust. High subsonic Mach number flow is sensitive to changes of flow area
and it is important to adjust geometry to ensure compatibility of the flow changes for different parts of the flow
domain. The interaction of the distorted flow downstream of the fan with the propelling nozzle was addressed using
compound compressible flow methods9.
Finally, a critical feature of the current aircraft are engines with a low (1.5) fan pressure ratio and with ducts that
are several times as long as those for conventional podded engines. The installed system performance is thus more
sensitive to the level of inlet pressure recovery than with podded engines, and this aspect was also examined in some
depth.
Aerodynamicinterface plane
S-duct inlet
Scalloped region
Figure 4. Schematic of the Silent Aircraft
embedded propulsion system installation.

American Institute of Aeronautics and Astronautics
7
4. Performance Metrics for Boundary Layer Ingestion
The aim of integrating the engine with the airframe should be to choose an engine and integration package which
minimizes the fuel burn needed to propel the aircraft at a given forward speed. The perspective adopted here is that
the metric by which to compare configurations should be defined such that by either minimizing (or maximizing,
depending on the definition) its value, fuel burn is minimized. Our observation is that conventional parameters such
as specific fuel consumption and propulsive efficiency are not the most useful metrics when boundary layer
ingestion is involved, and, as mentioned, the parameter used is the power saving coefficient of Smith3. It is
worthwhile, however, to briefly discuss the factors that go into this choice.
The definition of specific fuel consumption is given by Eq. (7),
TSFC =Mass flow rate of fuel
Net Thrust(7)
As described in Section 3, with BLI the net thrust required from the engine is reduced. Specific fuel consumption is
not the variable which most directly captures the situation because net thrust does not stay constant. Put another
way, in a BLI system, even though the mass flow rate of fuel is reduced compared to a non-BLI system, the
calculated value of TSFC could be larger with BLI. (This is a matter of definition rather than propulsion physics!)
The traditional definition of aircraft propulsive efficiency is given by useful work (total drag multiplied by
forward speed), normalized by the rate of production of kinetic energy by the engine.
prop =Total Drag( )u
u2( )2
udA
(8)
The velocities in the denominator are evaluated at freestream pressure. If changes in nacelle drag due to the use of
an embedded engine are included in the accounting, maximizing propulsive efficiency may not be an optimal
solution since the total drag is changed. However, if changes in nacelle drag are small, the propulsive efficiency will
capture the correct trends in terms of design changes to improve the overall system efficiency. We will examine this
situation in Section 6.
In summary, the proposed metric to use for the comparison of podded and embedded engines is the power saving
coefficient, PSC, defined below in Eq. (9). With Pref and PBLI denoting the power needed to propel the aircraft for the
reference (e.g., optimized non- BLI podded) engines and with BLI, respectively,
PSC =Pref - PBLIPref
(9)
The use of PSC is relevant because, for constant fan efficiency, the power requirement is directly related to fuel
burn. Any BLI design must have a positive PSC to be a worthwhile alternative to a (best) non-BLI configuration.
5. Interaction of the Turbomachinery with Flow-Nonuniformity (Distortion)
A key issue (and perhaps the most recognized high risk area) concerns the effect of the engine (particularly the
fan) on flow non-uniformity and its converse. The aerodynamic blockage associated with the fuselage boundary
layer is much larger than that due to the duct boundary layer and thus has a major role on the achievable flow rate
and the fan pressure rise for a given thrust. The non-uniformity also affects the nozzle exit momentum flux, and thus
the thrust, and the degree to which this occurs is much larger than that typically associated with civil engines. The
fan has the ability to attenuate this distortion and thus to create a more uniform flow through the downstream fan
duct and the nozzle. Hence the level of non-uniformity downstream (i.e., the distortion transfer through the fan) can
have a substantial role in setting thrust capability and fan power requirements.
Calculations of the distortion transfer and of the propulsion system performance have been carried out with three
models of different levels of fidelity, in order to examine the influence of features captured on the numerical results.
These were10
:
• A parallel compressor model which does not include mixing of the low stagnation pressure region and the
freestream, but does include the influence of fan characteristics, the effect of area changes on non-uniformities,
and compression ahead of the duct.

American Institute of Aeronautics and Astronautics
8
• A 2-D integral boundary layer model, which accounts for non-complete mixing, boundary layer behavior in a
duct, fan characteristics, and inlet and exhaust losses.
• 3-D compressible calculations of the flow in a ducted fan using a body force fan model; two levels of body
force model were used, one with discrete body forces and the other with a distributed body force.
In the comparisons between the engine with BLI and the engine without BLI, the bare airframe drag and the fan
diameter were kept constant. Although the assumptions for the three approaches were quite different, the overall
features of the system performance were not, showing that the most basic phenomena to capture are the inviscid
behavior of the non-uniformity upstream and downstream of the
fan and the ability of the fan to attenuate the stagnation pressure
distortion through differential work input.
To illustrate the magnitude of possible effects, Fig. 5
presents 2-D calculations of the power saving coefficient as a
function of the percent of the boundary layer ingested into the
fan. The different curves correspond to different values of
distortion transfer, defined in this example as the ratio of
displacement area and momentum defect area downstream of the
fan to the value of the corresponding quantity upstream of the
fan. The upper line (possibly most apt for a fan at near nominal
design conditions) corresponds to a reduction in displacement
and momentum defect areas across the fan of 50%. The lower
line corresponds to an increase in these quantities by a factor of
two across the fan. It can be seen that the power saving
coefficient can be either positive (beneficial effect of BLI) or
negative, depending on how the fan operates.
The physical reason for the trend is associated with the
overall (duct average) blockage, which becomes larger as the distortion transfer becomes worse. With a larger
blockage the fan must put more work into the stream to get the required net thrust.
An illustration of the non-uniformity representative of fuselage boundary layer ingestion is shown in Fig. 6,
based on three-dimensional computations of the flow over the aircraft. The region of low stagnation pressure
presented to the fan varies in both the circumferential and the radial directions and is thus not amenable to analyses
of distortions that are primarily circumferential or primarily radial. This is the main reason for the concern about the
type of model used.
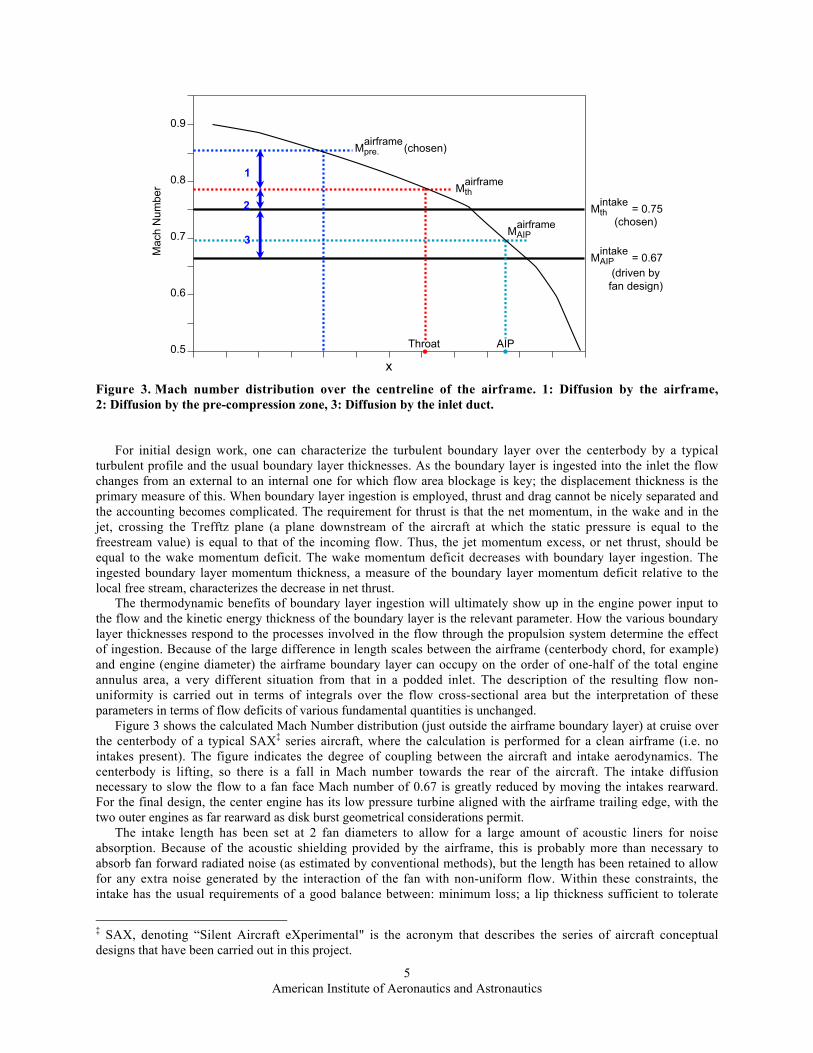
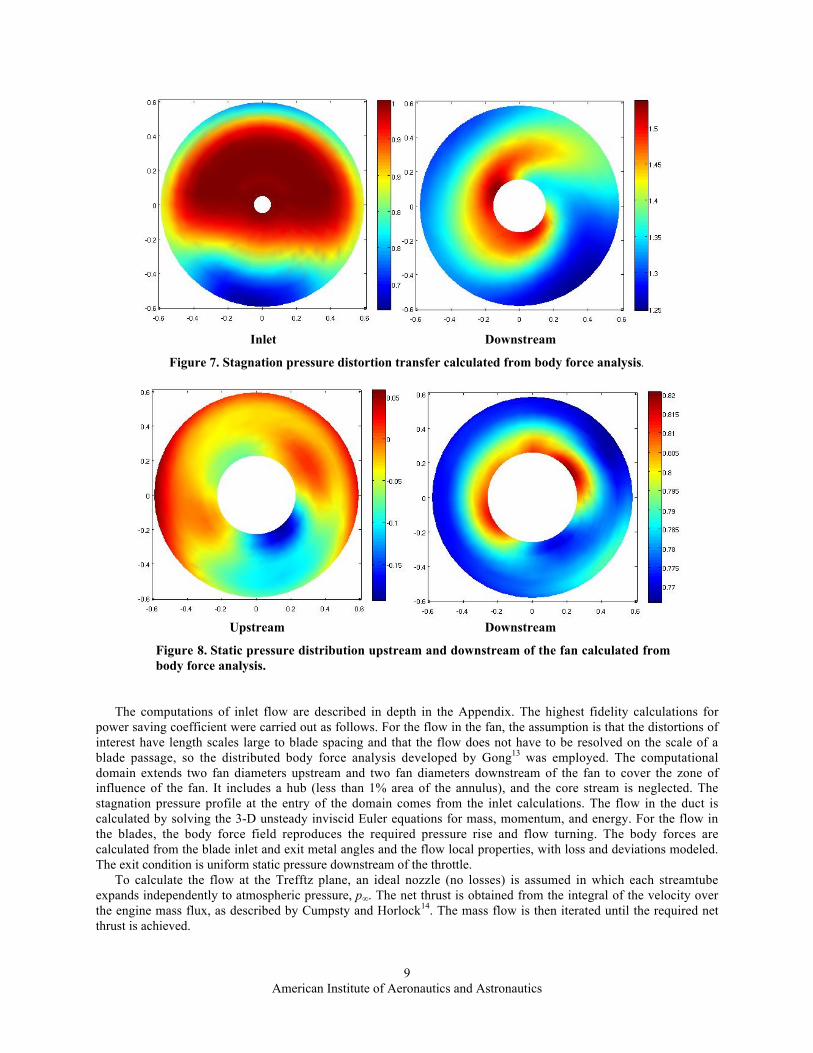
Figures 7 and 8, which are results from the three-dimensional body force calculation, show more information on
the stagnation and static pressures at the exit of a fan with upstream stagnation pressure distortion. The downstream
region of low stagnation pressure does not correspond in a simple manner to that seen upstream. In addition, the
static pressure is not uniform at fan exit, as assumed in the basic parallel compressor model9,12
.
The assumptions for the parallel compressor and integral models are thus not valid in terms of flow structure. In
spite of this, as stated, the 3-D calculations demonstrate the same trend for the power saving coefficient as shown by
the simpler models.
Figure 6. Normalized stagnation pressure at AIP, pt/pt ; left, contour interval 0.01 (Ref. 11); right,
scale shown.
0-6
-4
-2
0
2
4
6
8
2 4
Ingested drag / Airframe drag (%)
Pow
er s
avin
g co
effic
ient
(%
)
6 8
2x increasein δ*, θ
50% reductionin δ*, θ
1.5
1.0
Moredistortion
attenuation
10
Figure 5. Effect of distortion transfer
on power saving coefficient.
American Institute of Aeronautics and Astronautics
9
Inlet Downstream
Figure 7. Stagnation pressure distortion transfer calculated from body force analysis.
Upstream Downstream
Figure 8. Static pressure distribution upstream and downstream of the fan calculated from
body force analysis.
The computations of inlet flow are described in depth in the Appendix. The highest fidelity calculations for
power saving coefficient were carried out as follows. For the flow in the fan, the assumption is that the distortions of
interest have length scales large to blade spacing and that the flow does not have to be resolved on the scale of a
blade passage, so the distributed body force analysis developed by Gong13
was employed. The computational
domain extends two fan diameters upstream and two fan diameters downstream of the fan to cover the zone of
influence of the fan. It includes a hub (less than 1% area of the annulus), and the core stream is neglected. The
stagnation pressure profile at the entry of the domain comes from the inlet calculations. The flow in the duct is
calculated by solving the 3-D unsteady inviscid Euler equations for mass, momentum, and energy. For the flow in
the blades, the body force field reproduces the required pressure rise and flow turning. The body forces are
calculated from the blade inlet and exit metal angles and the flow local properties, with loss and deviations modeled.
The exit condition is uniform static pressure downstream of the throttle.
To calculate the flow at the Trefftz plane, an ideal nozzle (no losses) is assumed in which each streamtube
expands independently to atmospheric pressure, p . The net thrust is obtained from the integral of the velocity over
the engine mass flux, as described by Cumpsty and Horlock14
. The mass flow is then iterated until the required net
thrust is achieved.

American Institute of Aeronautics and Astronautics
10
Figure 9 shows the results of the calculations for power
saving coefficient. In terms of quantitative results, for a fan
diameter and flight condition representative of that employed in
the “Silent Aircraft,” boundary layer ingestion is estimated to
provide decreases in fuel burn of up to 3.8 percent. This is the
most important result of this section. Additional information on
the modeling and the results can be found in Plas10
.
6. Evaluation of BLI from a Propulsive Efficiency
Viewpoint
Section 5 attempts to ascertain the benefits from BLI by
describing the flow structure within the duct. Although this
analysis shows the effect of flow parameters such as blockage, to
provide guidance for optimizing the system, it is useful to work
in terms of a higher level framework. Beause simplifying
assumptions about how the fan deals with the incoming flow are
made, this framework is seen as a conceptual design tool rather
than an analysis tool to analyze any specific design.
The framework is developed as an extension of the propulsive efficiency formula. As mentioned, if changes in
nacelle drag are ignored (valid if the changes are small compared to the effect of BLI), the propulsive efficiency
shows the effect of changes in both mass flow (and hence FPR) and amount of BLI in terms of a commonly used
parameter. In addition, if we neglect the changes in nacelle drag, the thermodynamics of the problem can be
decoupled from the integration aspect, allowing a more straightforward description of the situation.
When formulating the propulsive efficiency, the velocities that appear in the calculation of kinetic energy flux
are evaluated at freestream pressure. As a result, it is consistent to “map” the ingested boundary layer quantities,
which are typically at a state with static pressure different than freestream, to the freestream pressure condition. This
transformation is done conserving entropy. The “mapped” boundary layer does not exist physically, but is a
surrogate for the quantities in terms of momentum and kinetic energy which would exist if the ingested boundary
layer were evaluated at freestream pressure.
Denoting by the momentum area, and by the kinetic energy area,
iui2
= (ui u) udA(10a)
iui3 * = (ui
2 u2) udA . (10b)
The momentum area “mapped” to freestream conditions, equivalent, is given by Eq. (11) which is obtained from the
zero shear stress form of the integral momentum equation.
equivalent = i uiu
2+Havg
. (11)
The equivalent kinetic energy area is found by assuming the boundary layer is returned to freestream pressure
without any energy dissipation,
*equivalent =uiu
3
* . (12)
Suppose the propulsor adds work such that the downstream flow has uniform velocity. This is the ideal
configuration. In that case, the rate of production of propulsive kinetic energy is given by Eq. (13).
u2
2udA =
1
2(u j
2 u 2) udA +1
2(u 2 u2) udA
BL
0
0
-2
2
4
6
8
10
12
5 10 15
Dw/DA (%)
PS
C (
%)
20 25 30
Figure 9. Power saving coefficient
(PSC) for different levels of ingested
drag (Dw/DA); calculations from three-
dimensional body force model.
American Institute of Aeronautics and Astronautics
11
=˙ m
2(u j
2 u 2) +u 3 *equivalent
2(13)
From the definition of propulsive efficiency,
prop =Total Drag u
u 3 *equivalent
2+˙ m
2(u j
2 u 2)
. (14)
The total drag in Eq. (14) is the summation of the ingested drag, i.e. the drag associated with fluid which is ingested
into the engine, and drag from fluid not ingested by the propulsor. For a podded engine there would be no
contribution from the former. The total drag is related to the equivalent momentum area by
Total Drag = Ingested Drag + Uningested Drag = u 2equivalent + Draguningested . (15)
It is useful to define the ratio as,
= Draguningested
u 2equivalent
. (16)
Substituting into Eq. (14) gives the propulsive efficiency as
prop =u 3
equivalent (1+ )
u 3 *equivalent
2+ ˙ m u (u j u ) 1+
u j u
2u
. (17)
Using the balance between net force and net drag [equivalentj uuum
2)( =& ] in Eq. (17),
prop =(1+ )
H *
2+ 1+
uj u
2u
. (18)
Limiting cases of Eq. (18) are as
approaches 0 (100% BLI) and (no BLI). In
the former case the propulsive efficiency
becomes
prop =2
H * . (19)
The maximum propulsive efficiency with
boundary layer ingestion is 2. In the latter
case, with no BLI, the propulsive efficiency
reduces to the famil iar resul t
prop = 2 1+ (u j u )[ ].
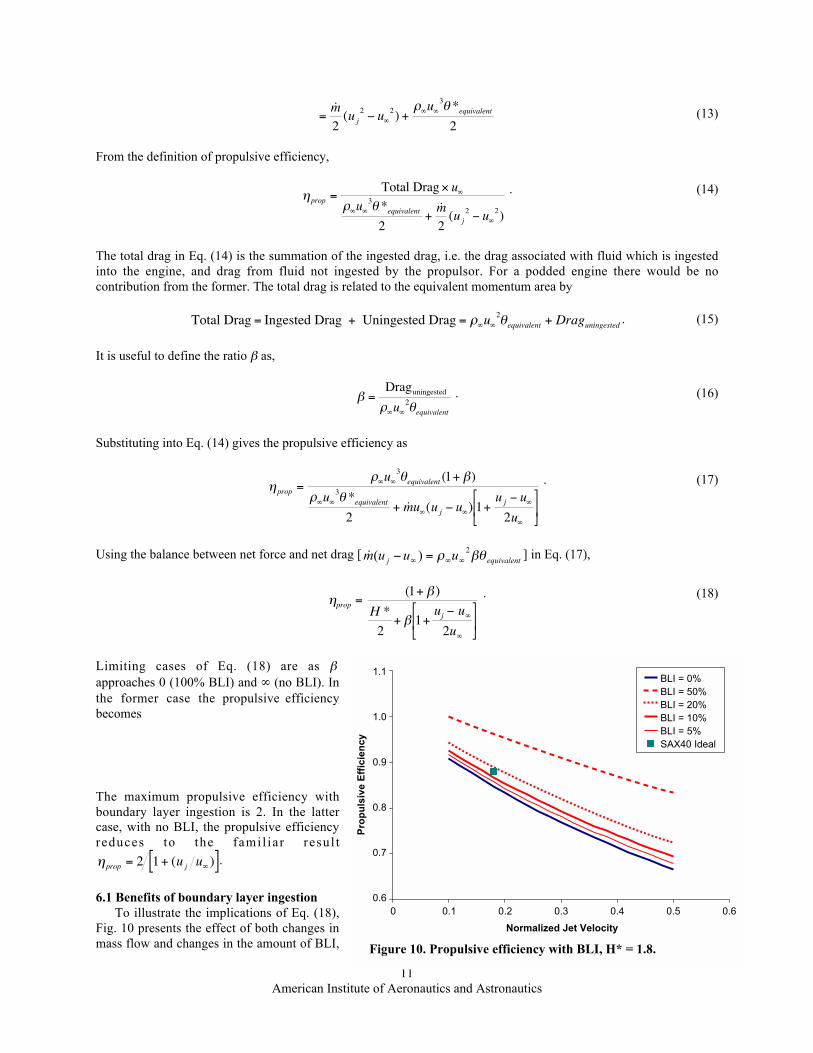
6.1 Benefits of boundary layer ingestion
To illustrate the implications of Eq. (18),
Fig. 10 presents the effect of both changes in
mass flow and changes in the amount of BLI,
0 0.1 0.2 0.3 0.4 0.5 0.60.6
0.7
0.8
0.9
1.0
1.1
Normalized Jet Velocity
Pro
pu
lsiv
e E
ffic
ien
cy
BLI = 0%BLI = 50%BLI = 20%BLI = 10%BLI = 5%SAX40 Ideal
Figure 10. Propulsive efficiency with BLI, H* = 1.8.

American Institute of Aeronautics and Astronautics
12
for a value of H* = 1.8. The
abscissa is the normalized jet
velocity, (uj – u )/(2u ) which
decreases as the fan pressure
ratio (FPR) is decreased. For
constant mass flow, the jet
velocity decreases for increasing
BLI.
With no BLI, increasing the
amount of mass flow through the
propulsor (which corresponds to
reducing the FPR) results in
increased efficiency. As in Fig.
10, increasing the amount of BLI
is beneficial, and the incremental
benefit increases as the jet
velocity increases. Although the
incremental benefit from BLI
increases as the FPR is
increased, the overall system is
more efficient if the FPR is
decreased.
Figure 11 shows the effect of H*, which has a value between 1 and 2, on propulsive efficiency. H* is also an
indicator of BL health, related (exactly for incompressible flow and approximately in the compressible regimes of
interest here) to stagnation pressure losses. The SAX40 configuration utilizes 16.6% of BLI and has a “mapped” H*
of 1.83 (H* is 1.79 locally where the BL is ingested from the airframe) and a normalized jet velocity of 0.18, a point
indicated in Fig. 10. This condition represents the maximum possible benefits from BLI for the SAX40
configuration, a value not reached because of losses in the fan and duct systems.
6.2 Effects of Fan, Duct, and Mixing Losses on the Impact of BLI
The propulsive efficiency of the system has been seen to be affected by the FPR, the amount of BLI, and the
specifics of the boundary layer ingested. Other important effects we need to account for are the impact of fan
inefficiencies, duct losses, and mixing losses. In this, it has been assumed that the condition of the fan flow is the
major driver in setting the impact of BLI, and the effect of any changes in the core flow is thus neglected. Another
way to state this assumption is that the bypass ratio is high enough so that changes in the core exit flow have only a
minor impact compared to the effects examined.
The results are presented as an “overall efficiency” since they capture not only the propulsive efficiency element
but also elements of the thermal efficiency term. The results are not presented in terms of a PSC since they would
have been influenced by the assumptions built into determining the non-BLI reference case.
In the analysis the comparisons are made based on conditions at the Trefftz Plane, with the engine modeled as a
black box defined by an efficiency value. A main use of the framework developed has been to ascertain the effect of
fully mixing the flow ahead of the propulsor. Having uniform flow through the fan would remove a major
uncertainty, the effect of inlet distortion, on the propulsion system, and thus reduce the risk considerably. The mixed
out case also allows the fan to operate at highest efficiency since it is presented with uniform flow. If the flow is
mixed prior to entering the diffusing intake duct, the intake performance is also likely to be improved relative to an
intake which has to diffuse a non-uniform flow. As shown below, mixing losses are low enough so that a mixed out
BLI engine is beneficial relative to a non-BLI design.
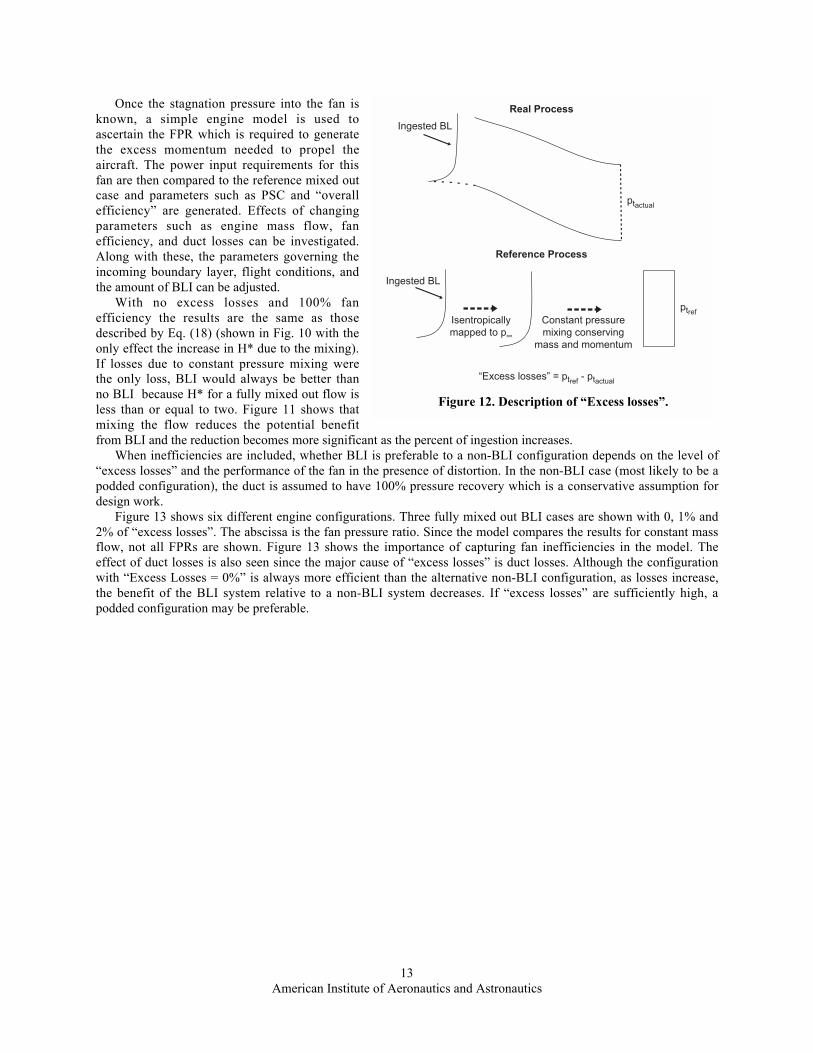
To evaluate the effect of mixing, the procedure used was as follows. The boundary layer parameters are
“mapped” to freestream pressure conditions. The boundary layer and freestream air to be ingested by the propulsor
are then fully mixed, conserving mass and momentum. The fully mixed out flow has an associated stagnation
pressure which is taken as a reference. The actual mixing process, which occurs at non-freestream pressure, can be
calculated, may include additional losses, but can be compared to the reference mixed out value. The difference
between the reference stagnation pressure and the actual stagnation pressure is classed as “excess losses”. These
excess losses may be due to an inefficient diffuser or to non-ideal mixing. This process is illustrated in Fig. 12. For
low pressure ratio fans the system is sensitive to these “excess losses”.
BLI = 0 %H* = 1.6 BLI = 10%H* = 1.8 BLI = 10%H* = 2.0 BLI = 10%H* = 1.6 BLI = 50%H* = 1.8 BLI = 50%H* = 2.0 BLI = 50%
0 0.1 0.2 0.3 0.4 0.5 0.60.6
0.7
0.8
0.9
1.0
1.1
Normalized Jet Velocity
Pro
pu
lsiv
e E
ffic
ien
cy
Figure 11. Propulsive efficiency with BLI for various shape factor
values.
American Institute of Aeronautics and Astronautics
13
Once the stagnation pressure into the fan is
known, a simple engine model is used to
ascertain the FPR which is required to generate
the excess momentum needed to propel the
aircraft. The power input requirements for this
fan are then compared to the reference mixed out
case and parameters such as PSC and “overall
efficiency” are generated. Effects of changing
parameters such as engine mass flow, fan
efficiency, and duct losses can be investigated.
Along with these, the parameters governing the
incoming boundary layer, flight conditions, and
the amount of BLI can be adjusted.
With no excess losses and 100% fan
efficiency the results are the same as those
described by Eq. (18) (shown in Fig. 10 with the
only effect the increase in H* due to the mixing).
If losses due to constant pressure mixing were
the only loss, BLI would always be better than
no BLI because H* for a fully mixed out flow is
less than or equal to two. Figure 11 shows that
mixing the flow reduces the potential benefit
from BLI and the reduction becomes more significant as the percent of ingestion increases.
When inefficiencies are included, whether BLI is preferable to a non-BLI configuration depends on the level of
“excess losses” and the performance of the fan in the presence of distortion. In the non-BLI case (most likely to be a
podded configuration), the duct is assumed to have 100% pressure recovery which is a conservative assumption for
design work.
Figure 13 shows six different engine configurations. Three fully mixed out BLI cases are shown with 0, 1% and
2% of “excess losses”. The abscissa is the fan pressure ratio. Since the model compares the results for constant mass
flow, not all FPRs are shown. Figure 13 shows the importance of capturing fan inefficiencies in the model. The
effect of duct losses is also seen since the major cause of “excess losses” is duct losses. Although the configuration
with “Excess Losses = 0%” is always more efficient than the alternative non-BLI configuration, as losses increase,
the benefit of the BLI system relative to a non-BLI system decreases. If “excess losses” are sufficiently high, a
podded configuration may be preferable.
Real Process
Reference Process
Ingested BL
Ingested BL
Isentropicallymapped to p∞
Constant pressuremixing conserving
mass and momentum
“Excess losses” = ptref - ptactual
ptref
ptactual
Figure 12. Description of “Excess losses”.

American Institute of Aeronautics and Astronautics
14
BLI, Ideal Fan (100%)Fully Mixed, Ideal Fan (92%)Fully Mixed, Ideal Fan (92%), Excess Losses = 1%Fully Mixed, Ideal Fan (92%), Excess Losses = 2%Non-BLI, Ideal Fan (100%)Non-BLI, Ideal Fan (92%)SAX 40 Esti ma te (92%)SAX 40 Esti ma te (90%)
1.30.74
0.76
0.78
0.80
0.82
0.84
0.86
0.88
0.90
0.92
1.4 1.5 1.61.35 1.45
FPR
Ove
rall
Eff
icie
ncy
1.55 1.65
Figure 13. Effect of duct losses and other inefficiencies.
6.3 SAX40 Comparison
The parameters below are representative of those for SAX40.
Parameter Value
BLI (%) 16.6
Fan Efficiency (%) 92
Cruise Mach Number 0.8
Cruise Altitude (ft) 40 000
The mass averaged duct PR for the SAX40 aircraft was 0.946. The referenced mixed out PR for the fully mixed
out flow is 0.959. Consequently, the “excess loss” is 1.3%. The SAX40 duct was not designed to fully mix out the
flow and hence the fan performance is less than that assumed by the model above. The effect of the 1.3% excess loss
is shown by the two marks in Fig. 12 which attempt to represent the SAX40 configuration at Begin Cruise. The
marks assume a fan efficiency of 92% and 90% respectively. The 92% efficiency assumes that the fan is unaffected
by the incoming distortion which is an optimistic estimate. The 90% fan efficiency is a more realistic estimate of the
fan efficiency in the presence of distortion. If the fan efficiency does drop to 90%, the drop in efficiency along with
the “excess losses” of the inlet duct mean that the SAX40 engine is no better than a podded configuration of the
same FPR. See Section 7 for a more detailed discussion on the fan efficiency for SAX40.
The design aim is to increase the overall efficiency, and the analysis shows that improvements in fuel burn could
be made if the fan pressure ratio were reduced or if the amount of “excess losses” were reduced. Mixing the flow
prior to entering the diffuser may be an attractive way of reducing “excess losses” while also improving the fan
efficiency. Although the system is more sensitive to excess losses as the FPR is reduced, the overall efficiency is
still higher as the FPR is decreased.
The above model does not capture the effects of changes in wetted area. In this context, the BLI configuration is
likely to be better than the alternative podded configuration even if the effects of duct loss and increased fan

American Institute of Aeronautics and Astronautics
15
inefficiency cancel out any propulsive efficiency benefits. This is because of the reduction in wetted area which
results from embedding the engines within the aircraft which is necessary to capture the boundary layer.
The results shown in Fig. 13 highlight the challenges of capturing the propulsive efficiency benefits promised by
utilizing BLI in aircraft design. The relatively low amounts of BLI which can be potentially ingested limit the gains
which are possible. The analysis performed shows that these gains can be eroded by duct losses and fan
inefficiencies. The proposed alternative configuration of mixing the flow prior to entering the intake shows promise
in alleviating some of these issues by improving the intake performance and allowing the fan to operate at peak
efficiency.
7 Assessment of Boundary Layer ingestion for the SAX40 Aircraft
This section describes the way that boundary layer ingestion was accounted for in the SAX design.
7.1 Distortion Calculation for cruise/top-of-climb.
It was beyond the computational resources available to the project to perform calculations over a full
airframe/intake/engine combination. A suite of smaller calculations were thus carried out to break the problem into
more manageable parts.
The state of the boundary layer to be ingested was estimated using the Navier-Stokes simulation performed by
Boeing15
over the clean airframe, as described in the Appendix. Boundary layer profiles were taken from this for the
airframe centreline and for the airframe spanwise location coinciding with the centreline of the outer engine. These
profiles were used as upstream boundary conditions for reduced-domain viscous CFD calculations of the flow
through the propulsion system and a part of the (scalloped) airframe surface.
A fundamental issue when framing such reduced-domain calculations concerns how to choose the reduced
domain and the appropriate boundary conditions on the domain edges. This was decided based on the results of a
separate, inviscid calculation using a commercial panel method which was performed over the airframe and intake
entry region (for which the correct engine mass flow was ingested into the intake). A streamtube enclosing part of
the airframe and the intake was extracted from this solution and used as the reduced domain (the intake captures
about 5% of the total mass flow through this stream surface). It was assumed that the edges of this domain would
remain a streamsurface and the boundary conditions on the outer edges (i.e. within the flow) were chosen as those
appropriate to an (inviscid) wall.
The flow at exit from the intake, at a nominal Aerodynamic Interface Plane (AIP) close to the fan location, was
then calculated for the reduced domain using a viscous method due to Denton as described in Ref. 16. The results at
the AIP define the various intake performance parameters and stagnation pressure distortion pattern presented to the
fan. A similar procedure was used to design the inlet duct which is described in more detail in the Appendix.
Calculations of this type were performed for a variety of intake designs early in the project, when the design was
for three engines each having a single fan. The final design, however, has a single core engine driving three fans in a
“cluster” (through a geared arrangement) with one cluster on the centreline and the two others outboard17
. Due to
time and resource constraints, it was not possible to complete the overall procedure for the multiple fan intake
clusters. Instead the intake ducting was re-optimised under the assumption the initial part of the intake could be
designed with performance equivalent to that of the single-fan cases.
The performance of the fan was estimated by a variety of methods as described in an earlier section. The most
sophisticated of these was a full-rotor unsteady calculation, using a viscous body force method due to Xu18
. The
major effect of distorted flow was to be a shift in fan characteristics to reduced mass flows, i.e. for a given pressure
ratio, there is a reduction in fan capacity (approximately 4.2% of mass flow). The calculated reduction in efficiency
was less, approximately 1%.
7.2 Top of Climb Stall Margin Requirement
Using mass weighted values extracted from the distorted flow calculation described above, the candidate fan
(diameter 1.2 m) would produce 12.7% excess thrust at top of climb at nominal design pressure ratio and fan speed
if operating in clean flow. Instead of reducing the fan diameter at this point (a weight saving could be obtained by
doing this; for reference, if the thrust margin were halved the saving would be 6% installation weight), it was
decided to keep the larger fan, partially in case of later growth in estimated airframe weight (which did not occur),
partially for take-off noise reasons, but mainly to allow for adverse effects of inlet distortion (i.e. stall margin
decrease, possible unpredicted efficiency penalty, possible flutter problem, etc.). It was assumed that the variable
area nozzle plus the excess thrust margin would give sufficientfreedom to find a suitable fan operating point.

American Institute of Aeronautics and Astronautics
16
7.3 Cruise Fuel Consumption
Earlier sections have highlighted the difficulties of providing a fully consistent audit for fuel burn under
conditions of significant boundary layer ingestion. The SAX engines were audited as if they were operating in clean
flow at a thrust requirement reduced to allow for the “ingested drag”, i.e. Cd for the airframe was reduced by 16.6%
to 0.00824, the AIP mass-weighted stagnation pressure recovery set at 0.946 for the centre engine and a slightly
higher value for the outboard ones, with a reduced fan performance extracted from the distorted calculation. As
indicated, the main effect of this was to reduce the fan flow capacity with only a small efficiency penalty and it may
be that our estimates of fuel burn are optimistic in this respect. Finally, the installation downstream of the fan was
assessed using loss estimates based on clean flow.
7.4 Other Flight Conditions
Some of the calculations in the above procedure were repeated for zero/low aircraft forward speed. The large
streamtube contraction of the flow into the inlet dramatically improves the flow delivered to the fan. The predicted
AIP mass-weighted intake recovery at high engine power and low aircraft forward speed was 0.98. Values of intake
recovery and inlet distortion were estimated at other flight conditions by linear interpolation between the low speed
and cruise/top-of-climb values based on flight Mach number.
The recovery levels of the intake system at cruise and at low forward speed are both comparable with those
obtained in the experiments by Berrier7. Our intake is shorter, has a much smaller offset, and takes in flow at lower
Mach number (thus does less diffusion) than the one used for the Berrier experiments. t is, however, operating with
a thicker airframe boundary layer to intake height ratio. As discussed in the Appendix, the smaller offset results in
relatively little secondary flow within the intake duct and a distortion pattern without any evidence of this secondary
flow bringing low stagnation pressure away from the intake casing.
8. The Road Forward: Technical Challenges and Risks
The work in this paper has demonstrated that there are significant fuel burn benefits to be gained from applying
boundary layer ingestion to an all-lifting wing airframe. To achieve these benefits, the performance of the airframe,
installation, and engine are all critically important. Further, with boundary layer ingestion there is stronger coupling
between the airframe, installation, and engine systems at all operating conditions of the engine and aircraft. There
are also new mechanical, aerodynamic stability, and acoustic issues which arose during the conceptual design
process, but which there was not sufficient time to address. In this sense, however, an important part of carrying out
the design represents a planning exercise to identify, in an explicit manner, the challenges that must be faced to
achieve the performance of an embedded engine. In this section we describe, in rough order of priority, the areas
that need attention in order to mitigate the risks presented by the challenges and thus realize the potential fuel burn
benefits of boundary layer ingestion in a robust and reliable system suitable for commercial aircraft operation.
8.1 Engine aeromechanical response
A major issue concerns the additional mechanical loads experienced by an engine operating with boundary layer
ingestion, because the flow will be less uniform than that in an equivalent podded engine. The non-uniformity will
excite cyclic stresses within the engine, in particular the fan system. Modern high performance engine fans are
designed to tolerate low levels of forcing from non-uniform flow and with boundary layer ingestion, the stresses are
likely to be an order of magnitude or more greater. Further, the levels of non-uniformity are maintained throughout
the aircraft flight, rather than only during transient aircraft operations. Research is needed to first determine the
levels of forcing expected for a boundary layer ingesting fan to determine what features of a fan design are required
to tolerate the levels of non-uniformity expected. Is a bulkier mechanical design needed? Can novel design
approaches, such as non-axisymmetric design, or flow control for flow uniformity be used to reduce the risk of high
cycle fatigue?
8.2 Engine Stability
Non-uniform flow entering an engine can cause instabilities that result in fan stall and even engine surge, and the
fan and compressor of an engine must have sufficient operating margin at all flight conditions to ensure that the risk
of these events is minimal. This is particularly important, because the stability margin requirement has a major
impact on the fan design and performance. Current design tools struggle to predict the onset of stability for
compressors with uniform inlet flow. With non-uniform inflow, stability prediction is more challenging, but the
distortion here is essentially a known quantity so there is scope for new approaches not only to determine the effect
American Institute of Aeronautics and Astronautics
17
of non-uniform flow in a boundary layer ingesting engine, but also to define what type of design approaches (flow
control, asymmetry) could be used to counter it.
8.3 Additional engine noise
The interaction between the engine and the non-uniform inlet flow from boundary layer ingestion is an
additional engine noise source. This “distortion noise” tends to be broadband in nature. Similar distortion noise is
observed in engines that operate with separated intake flow. There is limited data available on distortion noise, and
in the case of a boundary layer ingesting engine, the propagation of the noise will be strongly influenced by the
installation duct and location on the airframe. Although the magnitude of the distortion noise might be important for
a “Silent Aircraft”, for a design in which noise is not the principal objective, it may not be a major issue.
8.4 Off-design operation
To minimize fuel consumption, the design of the boundary layer ingesting system has been targeted at cruise
conditions. However, at off-design conditions, there is a different airframe flow and a new flow field at the engine
inlet. Particular off-design conditions that need to be examined on the path to a product include:
1. Static engine operation at high power in extreme crosswind
2. Aircraft take-off and rotation in strong wind
3. Take-off in hot and high conditions
4. Engine spool-up during approach to landing
5. Rain and hail ingestion
6. Ingested flow features from the airframe (vortices, wakes) during maneuver
7. Aircraft performance following a single engine failure
8.5 Engine Failure Cases
For a design as different as an all-lifting wing with boundary layer ingestion, work needs to be done at an early
stage to prove the aircraft is not more vulnerable to failure than a conventional configuration. For example, with
closely-coupled engines there is greater opportunity for the failure in one engine to lead to failure in another.
In summary, it is true that there is a great deal of further work required for boundary layer ingestion, but this
would be true for any other step-change technology. The studies in this paper have shown that the potential fuel burn
reductions are sufficiently great to merit continued research in this field.
9. Summary and Conclusions
1. An assessment is presented of the aerodynamic performance of an embedded engine propulsion system with
boundary layer ingestion (BLI). This includes a first-of-a-kind examination of the effect of ducted
turbomachinery on the benefits from BLI.
2. The most useful figure of merit relating to BLI is the power saving coefficient, i.e., the non-dimensional
difference in power delivered to the flow, for propulsion of an aircraft at the given flight speed, between
different values of boundary layer ingested. In the example here the fan diameter was constant in the
comparisons between podded and embedded engines, but the utility of the power saving coefficient holds for
comparisons made on other appropriate bases.
3. For the case of interest, the SAX40 aircraft, boundary layer ingestion offers an opportunity for between 3 and 4
% decrease in power input to the flow and hence fuel burn. This value is sensitive to duct losses because of the
low fan pressure ratio, and the duct performance needed to achieve this result is thus also examined.
4. For the special case in which the changes in nacelle drag between different configurations can be neglected, the
propulsion system performance can be related to the (more conventional) metric of propulsive efficiency. The
relation developed [Eq. (18)] is given in terms of ingested boundary layer integral properties and the ratio of the
ingested drag to the total aircraft drag.
5. In contrast to current civil engines, the non-uniformities (distortions) presented to the fan are present at the cruise
condition. The low stagnation pressure region extends over a substantial fraction of the fan annulus, so the
degree to which the fan attenuates the distortion can impact whether the effect of BLI is positive or negative.
6. The flow non-uniformities in the intake are three-dimensional, and do not fit assumptions generally used in
analyses of fan response to inlet distortion. To assess the impact of (level of) model fidelity on conclusions
concerning the influence of the turbomachinery, three different procedures were used, ranging from a one-
dimensional (parallel compressor) approach to a three-dimensional computation. The results for power saving
coefficient differed quantitatively by 10-40% but were qualitatively similar for the three methods, implying that
American Institute of Aeronautics and Astronautics
18
the most important features are the essentially inviscid response of the non-uniform flow to the fan and the
resulting distortion transfer across the fan.
7. A description is given of the design procedure for the intake ducting in terms of the length (enough provision for
acoustic liners), duct offset, area ratio, and engine position.
8. Non-uniform flow presented to the engine in a boundary layer ingesting inlet is a high risk item for the aircraft
design, in the sense of involving technology that has not yet been investigated at the level of detail needed for
product development. A discussion of specific aspects that need to be addressed for risk mitigation is thus
provided. Examination is also given relating to mixing out the non-uniformity before it reaches the engine, as
one possible approach to eliminating a number of these risks.
9. Although there are technical challenges, the use of embedded engines with boundary layer ingestion appears to
offer an opportunity for achieving substantial reduction in fuel burn compared to podded engines.
Appendix: Inlet Duct Design
The current Silent Aircraft design has three embedded boundary layer ingesting clustered intakes which house
three fans each. The inlets are in the shape of an S-duct in which the cross-sectional area varies from semi-circular at
the throat to a full circle at the exit. The ratio of the duct overall length to the exit diameter is 2 because of the
available design space and aerodynamic and acoustic restrictions. Figure 4 shows a schematic of the propulsion
system installation. Due to the design space limit and the specified small value of diffusion, we could not use inlets
with semi-elliptical throat cross-sectional area; otherwise, more advantage could be taken of the ingested boundary
layer.
Extensive numerical simulations were performed using a compressible Reynolds Averaged Navier-Stokes
solver, developed in the Cambridge University Engineering Department. The RANS equations are solved on multi-
block structured grids. The code also includes a multi-grid convergence acceleration routine. The ICEMCFD
commercial package was used for mesh generation of the domain. The flow simulation was performed for the entire
integrated area, including the airframe, the inlet, and the cowl of the propulsion system.
The duct inlet boundary condition was calculated using the flow simulation around the clean airframe. Figure A1
shows boundary layer profiles at the throat locations for the center and outer inlets. A difference with the work in
Ref. 7 is that the ingesting boundary layer is very thick. For the center core, almost 78% of the throat area is covered
by the ingested boundary layer.
Table A1 shows the effect of thickness of the ingesting boundary layer on the AIP distortion and pressure
recovery. The duct is one of the initial inlet candidates and the boundary layer profile at the throat (the border
between the lip and the inlet) is 1/7th
power law. The impact of boundary layer thickness on pressure recovery and
distortion level is evident. Further, as the ingested boundary layer becomes thicker, the flow momentum in the lower
part of the duct decreases. As a result, the two stretched vortices seen in the pictures will remain attached. This, in
turn, causes an increase in distortion in the AIP lower 60-degree sector.

American Institute of Aeronautics and Astronautics
19
Due to time constraints no examination of
boundary layer control was carried out and
optimization was applied only on the duct geometry.
From a series of parametric studies, it was found that
the offset and area ratios have the most important
impacts on the flow characteristics, both upstream
and inside the duct. In this investigation, duct offset
ratio ( H ), area ratio (A ), variation of area and
cross-sectional aspect ratio from throat to exit were
considered as the variable parameters. Table A2
shows several cases. For all cases, a 1/7th
power law
boundary layer profile was considered at the throat.
The range of variation for H was between 0.50 and
1.10 and for A was from 1.01 to 1.05.
The first (and reference) case is a straight semi-
circular to circular diffuser which, as expected,
provides the least distorted flow at the AIP.
Comparison between cases 2 and 6 and also cases 3
and 7 (which have identical geometries) reveals that
the duct losses increase as the throat moves forward
Table A1: Effect of BLI thickness on pressure
recovery, distortion intensity, and total pressure
distribution at AIP.
10%
BLI
20%
33%
45%
59%
0.962
PR
0.955
0.941
0.930
0.915
0.249
DC(60) Contours of Pt
0.324
0.418
0.474
0.512
Table A2: Effect of inlet duct geometry and pre-
compression region on pressure recovery, distortion
intensity, and total pressure distribution at AIP.
Case ∆H´ A´ PR DC (60) Contours of Pt
1
2
3
4
5
6
7
0.00
0.52
1.04
1.04
1.04
0.52
1.04(PreComp)
(PreComp)
(Reference)
1.03
1.03
1.03
1.01
1.05
1.03
1.03
0.923
0.921
0.916
0.916
0.912
0.913
0.907
0.414
0.503
0.572
0.548
0.602
0.603
0.625
0 0.20
0.2
0.4
0.6
0.8
0.4
Center inlet(78% of throat height)
Outer inlet(36% of throat height)
0.6u/U∞
z/H
0.8 1.0
Figure A1. Thickness of the ingested boundary layer
at the inlet throat.

American Institute of Aeronautics and Astronautics
20
Figure A2. Total pressure contours at different sections (left) and fan face (right), PR = 0.946.
within the pre-compression region. Since the area ratio determines the duct diffusion and as such the fan face Mach
number, during this study, it was fixed to 1.03 in order to get a Mach number of 0.67 at the AIP for the mass flow
required by the engine. To reduce the inlet duct offset and avoid high distortion levels at the aerodynamic interface
plane, the original airframe surface (the area ahead of the inlet duct) was cut back (scalloped), as shown in Fig. 4.
The longitudinal positions of the engines were determined based on the diffusion distribution between the
airframe, the pre-compression zone, and the intake within the integrated area, as depicted in Fig. 3. The curve shows
the distribution of the calculated Mach number over the centerbody for a clean airframe. The duct throat was placed
at a location where the Mach number was 0.75 for the clean airframe. The length of the pre-compression zone was
initially chosen based on the Mach number of the surface point in a way that about 40% of the overall diffusion
happens between this point and the inlet throat. CFD calculations showed that the initial location of this chosen point
was adequate. The choices on the range of the offset and vertical position of the engines were also based on the
aircraft balance, stability and control requirements.
Figure A2 shows the stagnation pressure distribution at different sections and AIP for one of the final candidates
for the center inlet at the cruise altitude and cruise speed of M = 0.8. (Details of the calculations will appear in a later
paper.) A major portion of the inlet duct is filled by the ingested boundary layer. However, even the center inlet,
which is exposed to the thickest boundary layer, shows only a small area of reversed flows in the second bend
resulting in high area-averaged pressure recovery of 0.96 (relative to the free-stream) and Mach number of 0.67 at
the engine face.
Acknowledgments
The Cambridge-MIT Institute (CMI) has provided the financial support for the Silent Aircraft Initiative (SAI)
propulsion system assessment and this support is gratefully acknowledged. Matthew Sargeant is supported by the
Cambridge Australia Trust. The authors are appreciative of the contributions of P. Freuler, M. Drela, Y. Gong, W.L.
Harris (all MIT), R.H. Liebeck (Boeing Phantom Works) and L. Xu (Cambridge) to the inlet and turbomachinery
modeling and design. We are also pleased to acknowledge the support of Rolls-Royce in terms of consultation and
in allowing use of their preliminary design engine and turbomachinery codes, and we would like to thank NASA
Langley Research Center for providing three-dimensional S-duct geometry for use in these studies, and the Boeing
Commercial Aircraft Company for providing comments on this work during several stages of the project. Finally it
is a pleasure to acknowledge the helpful interactions with the other members of the SAI team, especially the input
received from J.H. Hileman and Z.S. Spakovszky (MIT, Co-Chief Engineers) and the project leadership of Dame
Ann Dowling (Cambridge SAI Lead).
References1Smith A.M.O., and Roberts, H.E., “The Jet Airplane Utilizing Boundary Layer Air for Propulsion,” Journal of the
Aeronautical Sciences, Vol. 14, No. 2, 1947, pp. 97–109.2Küchemann, D., and Weber, J., Aerodynamics of Propulsion, New York: McGrawHill, 1953.
3Smith, L.H., “Wake Ingestion Propulsion Benefit,” Journal of Propulsion and Power, Vol. 9, No. 1, 1993, pp. 74–82.
4Lynch, F.T., “A Theoretical Investigation of the Effect of Ingesting Airframe Boundary Layer Air on Turbofan Engine Fuel
Consumption,” Douglas Aircraft Company, Tech. Rep. SM-23981, May 1960.

American Institute of Aeronautics and Astronautics
21
5Douglass, W.M., “Propulsive Efficiency with Boundary Layer Ingestion,” McDonnell Douglas, Tech. Rep. MDC J0860,
Aug. 1970.6Rodriguez, D.L., “A Multidisciplinary Optimization Method for Designing Boundary Layer Ingesting Inlets,” PhD
Dissertation, Stanford University, Dept. of Aeronautics and Astronautics, 2001.7Berrier, B.L. and Allan, B.G., “Experimental and Computational Evaluation of Flush-Mounted, S-Duct Inlets,” 42
nd AIAA
Aerospace Sciences Meeting, Reno, 2004.8Daggett, D.L., Kawai, R., and Friedman, D., “Blended Wing Body Systems Studies: Boundary Layer Ingestion Inlets with
Active Flow Control,” NASA CR-2003-, Langley Research Center, July 2003.9Greitzer, E.M., Tan, C.S., and Graf, M.B., Internal Flow:Concepts and Applications, Cambridge University Press,
Cambridge, England, 2004.10
Plas, A.P., “Performance of a Boundary Layer Ingesting Propulsion System”, MS Thesis, Massachusetts Institute of
Technology, Dept of Aeronautics and Astronautics, June 2006.11
Freuler, P.N., “Boundary Layer Ingesting Inlet Design for a Silent Aircraft,” MS Thesis, Massachusetts Institute of
Technology, Dept of Aeronautics and Astronautics, Jan. 2005.12
Longley, J.P., and Greitzer, E.M., “Inlet Distortion Effects in Aircraft Propulsion System Integration,” in AGARD Lecture
Series 183, Steady and Transient Performance Prediction of Gas Turbine Engines, 1992, pp. 6-1 – 6-18.13
Gong, Y., “Computational Model for Rotating Stall and Inlet Distortions in Multistage Compressors,” PhD Dissertation,
Massachusetts Institute of Technology, Dept. of Aeronautics and Astronautics, Feb. 1999.14
Cumpsty, N.A., and Horlock, J., “Averaging Non-Uniform Flow for a Purpose,” ASME J. Turbomachinery, Vol. 128, 2006,
pp. 120-129.15
Hileman, J.I., Spakovszky, Z.S., Drela, M., Sargeant, M.A., Liebeck, R.H., Roman, D., and Wakayama, S., “Airframe
Design for Silent Aircraft”, AIAA 2007-0453 to be presented at the 45th
AIAA Aerospace Sciences Meeting, Reno, Jan 8-11,
2007.16
Pullan, G., Denton, J.D., and Curtis, E., “Improving the Performance of a Turbine with Low Aspect Ratio Stators by Aft-
Loading,” ASME Journal of Turbomachinery, Vol. 128, 2006, pp. 492-499.17
de la Rosa Blanco, E., and Hall, C., “Challenges in the Silent Aircraft Engine Design,” to be presented at the 45th
AIAA
Aerospace Sciences Meeting, Reno, Jan 8-11, 2007.18
Xu, L., Hynes, T.P., and Denton, J.D., “Towards Long Length Scale Unsteady Modelling in Turbomachines”, Proceedings
of I. Mech. E, Part A: J. Power and Energy, Vol. 217, 2003, pp. 75-82.