performance of adults with and without …/67531/metadc2590/m2/1/high_res_d · inhibition and...
TRANSCRIPT
PERFORMANCE OF ADULTS WITH AND WITHOUT ATTENTION-
DEFICIT/HYPERACTIVITY DISORDER (ADHD) ON MEASURES OF RESPONSE
INHIBITION AND FRONTAL LOBE FUNCTIONING
Thomas R. Wodushek, B.S.
Thesis prepared for the Degree of
MASTER OF SCIENCE
UNIVERSITY OF NORTH TEXAS
August 2000
APPROVED:
Craig Neumann, Major ProfessorDavid Baker, Committeee MemberKenneth W. Sewell, Committee MemberErnest Harrell, Chair of the Department of
PsychologyC. Neal Tate, Dean of the Robert B. Toulouse
School of Graduate Studies
Wodushek, Thomas, R. Performance of Adults with and without Attention-
Deficit/Hyperactivity Disorder (ADHD) on Measures of Response Inhibition and Frontal
Lobe Functioning. Master of Science (Psychology), August 2000, 98 pp., 9 tables,
references, 92 titles.
In this study 2 groups of adults, those with and without ADHD, were studied in
terms of cognitive functioning and symptoms of ADHD, depression, anxiety, and
substance abuse. Due to the difficulties in diagnosing ADHD in this population three
methods of diagnosis were used and the resulting findings presented. The groups did not
differ in measures of depression, anxiety, substance abuse or age. Those adults who met
criteria for ADHD showed worse performance on a measure of response inhibition
compared to those without ADHD. The patterns of correlations among the cognitive
measures differed between the two groups. The conclusions from the findings are
discussed in relation to Barkley’s (1997) self-regulation model of ADHD.

ii
Copyright 2000
by
Thomas R. Wodushek
iii
TABLE OF CONTENTS
Page
LIST OF TABLES ........................................................................................................... vi
Chapter
1. INTRODUCTION.............................................................................................1
Frontal Lobe Functions and AnatomyAttention-Deficit/Hyperactivity Disorder
Symptoms of ADHDSubtypes: With and Without Hyperactivity
Barkley�s Model of Self-Regulation and ADHDWorking MemoryReconstitutionAttention
Frontal Lobe MeasuresBenton Controlled Oral-Word Association Test (COWAT)Wisconsin Card Sorting Test (WCST)
Tests of Response InhibitionThe Stroop Color-Word Association TaskThe Stop-Signal Task
Empirical Studies of the Cognitive and Behavioral Aspects of ADHDHyperactivity/ImpulsivityFrontal Lobe Functioning
Benton Controlled Oral Word Association TestWisconsin Card Sorting Test
Tests of Response Inhibition in ADHDThe Stroop Color-Word Association TestThe Stop-Signal TaskContinuous Performance Test
Studies of Adults with ADHD Investigating Psychiatric andCognitive Functioning
NeuroimagingMedicationAssessing ADHD in Adulthoood
Utah Criteria for Adult ADHD
iv
SummaryHypotheses
2. METHOD ...................................................................................................... 30
ParticipantApparatusMeasures
Letter-Number SequencingSpatial SpanCenter for Epidemiological Studies - Depression ScaleBarratt Impulsiveness Scale � 11State-Trait Anxiety Inventory: Form YStructured Interview for ADD-H SymptomsWide Range Achievement Test � Revised Edition � Reading
SectionDartmouth Assessment of Lifestyle Inventory
Procedure
3. RESULTS ...................................................................................................... 37
Group ClassificationsGroup Comparisons of Symptom VariablesGroup Comparisons of Cognitive VariablesRegression Investigations of ADHD SymptomatologySymptom and Cognitive Variable CorrelationsCognitive Variable Intercorrelations
4. DISCUSSION ................................................................................................ 49
Hypothesis #1Hypothesis #2Hypothesis #3Non-Significant FindingsSupport for Barkley�s ModelLimitations of the Current StudyFuture DirectionsClinical Implications
v
APPENDIX A ..................................................................................................................63
APPENDIX B ..................................................................................................................73
REFERENCE LIST ..........................................................................................................86
vi
LIST OF TABLES
Table Page
1. Demographic and Symptom Variables for Full Sample ..................................64
2. Demographic and Symptom Variables for Method 1 Diagnosis .....................65
3. Demographic and Symptom Variables for Method 2 Diagnosis .....................66
4. Demographic and Symptom Variables for Method 3 Diagnosis .....................67
5. Symptom and Cognitive Variable Pearson Correlations for Full Sample ������������������������������.68
6. Symptom and Cognitive Variable Pearson Correlations for Non ADHD Group: Diagnostic Method 1 �.�..������.��.�.�����.69
7. Symptom and Cognitive Variable Pearson Correlations for ADHD Group:Diagnostic Method ��..��������������������70
8. Cognitive Variable Intercorrelations for Full Sample ...���������71
9. Cognitive Variable Intercorrelations for Method 1 Diagnosis .������72
1
Frontal Lobe Functions and Anatomy
The human cerebral cortex consists of four neuroanatomically distinct lobes, the
occipital lobes, the parietal lobes, the temporal lobes, and the frontal lobes. The frontal
lobes occupy the region forward of the central sulcus and above the lateral fissure. They
encompass nearly one-third of the human cerebral cortex and have developed most
recently in our evolutionary progression. According to Martin (1988) the frontal
lobes:�(1) mediate the ability to engage in abstract thought, (2) organize behavior in
logical sequence and in temporal order, and (3) inhibit responses to the environment� (p.
198). The frontal lobes have been termed the brain�s �orchestra leader�, directing the
activity of other sensory, motor, and cognitive systems and coordinating inputs to and
outputs from all the major association sensory areas of the cortex as well as areas of the
limbic system� (Martin, 1998, p. 190). At the head of the frontal lobes are the prefrontal
cortices. Luria (1973) reports that these areas are crucial for the rise of so called �frontal
lobe� or �executive� functions such as strategy formation, setting goals and regulating
and verifying behavior.
The attribution of these functions to the frontal lobes has largely been the result of
studies investigating the cognitive and behavioral characteristics of patients with focal
frontal lesions. These studies find that such patients show deficiencies in the performance
of motor tasks, spontaneity, development of novel cognitive plans for problem solving,
response inhibition, associative learning, temporal memory, spatial orientation, and social
and sexual behaviors (Kolb & Whishaw, 1990, p. 470). Luria (1983) reported five general
areas of dysfunction among patients with frontal lobe lesions: problems of starting
2
behaviors, difficulties in making mental or behavioral shifts, problems in stopping an on-
gong behavior, deficiencies in self-awareness, and problems with abstract thinking. Such
patients have also shown problems in emotion-related behaviors and may show apathy,
lack of judgment, lack of reliability, social withdrawal, lack of restraint, restlessness,
decreased self-concern, distractibility, and egocentricity (Martin, 198, p. 208).
Attention-Deficit/Hyperactivity Disorder
Deficient functioning of the frontal lobes has been implicated in Attention-Deficit
Hyperactivity Disorder (ADHD), a disorder which involves problems in attention and
inhibition. As described in the Diagnostics and Statistics Manual of Mental Disorders:
Fourth Edition (DSM-IV), ADHD is marked by �a persistent pattern of inattention and/or
hyperactivity-impulsivity that is more frequent and severe than is typically observed in
individuals at a comparable level of development (p.78).� Approximately 3-7% of
children has a diagnosis of ADHD, with boys being diagnosed approximately three times
as often as girls are. The symptoms of ADHD typically onset before the age of seven with
the first manifestation being excessive motor activity in toddlers (DSM-IV, 1994). The
diagnosis of ADHD is usually reserved until the child starts school and shows school
performance that is deficient compared to normal peers. The DSM-IV (1994) suggests
that in the majority of cases the symptoms of ADHD slowly attenuate during late
adolescence and adulthood. However, Barkley, DuPaul, and McMurray (1990) report that
50-80% of children diagnosed with ADHD may continue to exhibit the disorder in
adolescence and 30-50% of these cases persists into adulthood.
3
Symptoms of ADHD
According to the DSM-IV (1994), individuals with this disorder may often fail to
show close attention to details which results in careless errors in schoolwork and other
tasks. Their work is often characterized as messy, careless, and completed without
thought. These individuals may show an inability to sustain attention to task completion,
along with frequent shifts from one activity to another without fully completing either
activity. When being spoken to, individuals with ADHD have trouble concentrating long
enough to follow a full conversation or comprehend a task�s instructions and may appear
to be ignoring or purposefully not listening to what is being said. These individuals often
fail to follow through on requests and instructions. They have difficulty organizing tasks
and may find activities that require sustained mental effort as aversive. Work habits and
plans are often extremely disorganized and items and materials for completing projects
are often misplaced or lost. These individuals are often forgetful in everyday activities
and are easily distracted by irrelevant stimuli which interrupt ongoing tasks (DSM-IV,
1994).
Hyperactivity in these individuals, especially children, may be manifested by their
inability to sit still, fidgeting or squirming in their seat. Other hyperactive symptoms
include: constant tapping of the fingers, legs and feet, playing with nearby objects in
situations where stillness is expected, excessive talking, and excessive noise making in
quiet situations. In older individuals these symptoms may be replaced by difficulties
engaging in quiet or sedentary activities and chronic feelings of restlessness (DSM-IV,
1994).
4
Impulsivity in these individuals is often seen in an inability to delay responses,
chronic impatience, intruding on others and excessively interrupting others�
conversations. They are more likely to commit dangerous or foolish acts without pausing
to consider the possible ramifications of their actions (DSM-IV, 1994).
Subtypes : With and Without Hyperactivity
The DSM-IV lists three subtypes of ADHD: combined type, predominantly inattentive
type, and predominantly hyperactive-impulsive type. For the purposes of this discussion
the former two will be focused upon, as the latter appears to be a precursor to the
combined type (Barkley, 1997). The diagnosis of predominantly hyperactive-impulsive
type occurs most often before children enter school. Upon school matriculation teachers
and parents are more likely to focus their evaluation upon attentional problems leading to
a change in diagnosis to the combined subtype (Hart, Lahey, Loeber, Applegate, & Frick,
1995). The rational for including both of these sets of symptoms as subtypes of ADHD
came from the seemingly similar deficiencies with inattention and its consequences. In a
comprehensive study by Barkley, DuPaul, and McMurray (1990) the investigators were
able to diagnose and group children into Attention-Deficit Disorder (ADD) with and
without hyperactivity categories. Complaints of a short attention span were mandatory
criteria for diagnosis into either group. The authors reported that children with ADD, both
with and without hyperactivity, showed a higher likelihood of having academic and
socio-emotional difficulties compared to children without a diagnosis. The authors also
reported that the two subtype groups showed significant differences in psychiatric
comorbidity, family psychiatric histories and cognitive test performance. Families of the
5
hyperactive children (ADD+H) showed greater histories of ADD, aggression and
substance abuse; while the families of the ADD children without hyperactivity (ADD-H)
exhibited more learning disturbances and anxiety disorders. From a behavioral
standpoint, the ADD+H group was described as more noisy, disruptive, irresponsible, and
immature, while the ADD-H was seen as more confused, daydreamy, and lethargic. The
ADD+H showed more aggressiveness, impulsivity, overactivity, and evidenced more
difficulty with peer relationships then did the ADD-H group. The results also indicated
the groups exhibited qualitative differences on the primary symptom (inattention).
Specifically, the ADD-H group showed patterns of impaired performances which
indicated a primary deficit in focused attention; whereas ADD+H group showed
performance patterns indicating a deficit in the sustained and disinhibition components of
attention. The authors have proposed that the two subtypes more likely represent separate
psychiatric disorders rather than subtypes of a disorder with a common root problem
(Barkley et al, 1990). Nonetheless, current conceptualizations of ADHD place the two
subtypes into the same diagnostic classifications.
ADHD in Adolescents and Adults
The diagnosis of ADHD in adolescents and especially adults has been a somewhat
controversial issue. Early researchers of ADHD proposed that it was a disorder of
childhood which would disappear with maturation, while others suggested it was a
precursor to other disorders, most likely antisocial personality disorder (Spencer,
Biederman, Wilens, and Faraone, 1998). However as previously noted, it has been
suggested that approximately 50-80% of childhood ADHD may persist into adolescence
6
and 30-50% of childhood ADHD cases will persist into adulthood (Barkley, DuPaul, and
McMurray, 1990).
Another inherit difficulty of diagnosing ADHD in adolescence and adulthood is that
one must retrospectively assess whether there is evidence of the diagnosis in childhood.
That is, because the disorder can not onset in adolescence or adulthood, one must be able
to determine that the individual did indeed have clinically significant symptoms of
ADHD in childhood. No doubt, this determination is a considerably difficult task
(Biederman et al., 1993, Roy-Byrne et al., 1997). Borland and Heckman (1996) reported
that adults with ADHD continue to exhibit the characteristic symptoms of hyperactivity,
impulsivity, and concentration difficulties. The authors also reported that these
individuals obtained lower socioeconomic status and shorter job tenure compared to
healthy controls and despite equivalent IQ�s and educational attainment. Many adults
with symptoms of ADHD indicate that job difficulties arose from boredom,
impulsiveness, and a low frustration tolerance (Borland & Heckman, 1996). On the other
hand, Hansen, Weiss, and Last (1999) found that young men with ADHD (mean age 21
years) were more likely to drop out of high school. An additional study by Barkley,
Murphy, and Kwasnik (1996) investigated a well-educated (mean 13 years of education),
young adult population (mean age 25 years) and again found significantly shorter job
duration for the ADHD individuals relative to healthy controls. The study also found that
adults with ADHD rated themselves as experiencing significantly greater psychological
distress compared to a control group. Participants in the ADHD group also reported
committing significantly more antisocial acts, specifically thefts and disorderly conduct.
7
These same individuals had also been arrested significantly more often than the controls;
this latter finding was also replicated by Hansen, Weiss, and Last (1999).
Barkley�s Model of Self-Regulation and ADHD
Recently, Barkley (1997) introduced a theory which proposes that behavioral
inhibition is a critical variable in the symptoms of ADHD. He named behavioral
inhibition the �first executive� (p.68) function. According to Barkley (1997) behavioral
inhibition consists of three interrelated processes. The first process is the �inhibition of
the initial prepotent response to an event� (p. 67). The prepotent response being that
�response for which immediate reinforcement (positive or negative) is available or has
been previously associated with that response� (p.67). The second process in behavioral
inhibition is the �stopping of an ongoing response, which thereby permits a delay in the
decision to respond� (p. 67). The third process is �the protection of this period of delay
and the self-directed responses that occur within it from disruption by competing events
and responses (interference control)� (p. 67). Essentially, behavior inhibition is the
suppression of an immediate or automatic response that creates a critical time delay and
sets the stage for subsequent executive functions.
Barkley�s (1997) model stresses four additional executive functions, or
neuropsychological abilities, which are crucial for effective goal-directed behavior, and
which are attributed to frontal lobe functioning: working memory, self-regulation of
affect/motivation/arousal, internalization of speech, and reconstitution. Through the
operation of these abilities one is able to evaluate and direct behavior using internal
representations of rules, plans, goals, time, and intentions, thus allowing for self-directed
8
action and goal-directed persistence. Barkley (1997) suggests that the combination of
behavioral inhibition and the four executive functions lead to these seven skills:
inhibiting task-irrelevant responses, executing goal-directed responses, execution of
novel/complex motor sequences, goal-directed persistence, sensitivity to response
feedback, task re-engagement following disruption, and control of behavior by internally
represented information (p. 73).
Barkley�s (1997) theory presumes �that the essential impairment in ADHD is a
deficit involving response inhibition� (p. 67). The primary deficit in behavioral inhibition
leads to secondary impairments in the operation of the four other executive functions. As
a consequence, the behavior of individuals with ADHD is controlled to a greater extent
by the immediate surroundings and context than is the behavior of healthy controls for the
latter group, behavior is more a function of internal representations of goals and plans.
This investigation will focus on the associations between participants� performances on
tests of attention, response inhibition and tests of frontal lobe functioning in those with
and without a diagnosis of ADHD. The measures of frontal lobe functioning used will tax
two of the four executive functions that Barkley�s model emphasizes: working memory
and reconstitution.
Working Memory
Working memory allows for the storage of goals and the complex plans and rules
which have been created to secure a goal. It retains a past response in mind while creating
the opportunity to evaluate the consequences of the response and modify a later response
in accordance to what has been learned (Barkley, 1997). This is especially important in
9
linking actions and consequences that are separated by significant lengths of time. Poor
functioning of working memory should result in poor planning ability and result in
behaviors that are controlled more so by the immediate environment, thus creating the
possibility for perseverative response styles.
Reconstitution
Reconstitution consists of two parts; analysis and synthesis. Analysis refers to the
ability to break a series of events or messages into its component parts. Synthesis refers
to the manipulation of these components parts in order to construct new messages and
responses. Reconstitution allows for the production and understanding of human
language and hence the behavioral plans that are controlled by that language. The process
of reconstitution is most visible in verbal fluency and in verbal discourse as it allows one
to rapidly break down a message and determine its meaning and then construct a verbal
response. Barkley points out that deficiencies in this skill should be evident in peer
communications and �in problem-solving tasks requiring complex and novel motor
sequences or goal-directed behavioral creativity� (p.82).
Attention
As previously mentioned, a crucial hypothesis of Barkley�s (1997) model is that
deficient behavioral inhibition is a primary symptom of ADHD. Although the DSM-IV
suggests that a problem in attention is a primary symptom of this disorder, Barkley
believes that it is truly a secondary symptom of the disorder, which exists only as a
consequence of the primary deficit. As supporting evidence, he points out that research on
ADHD has not been able to consistently identify a deficit in attention in children with
10
ADHD (Schachar, R.J., Tannock, R., & Logan, G.D., 1993, Schachar, R.J., Tannock, R.,
Marriott, M., & Logan, G., 1995, van der Meere, J., & Sergeant, J.1988a, 1988b). He
proposes that what has been identified as inattention by teachers and parents is really a
lack of task or goal-oriented persistence, which directly results from poor inhibition and
its effects on executive functioning (Barkley, 1997). Thus, inattention is a product of poor
interference control that creates a propensity towards limited persistence in task
completion. Barkley (1997) suggests that ADHD children should show what appears to
be inattention only on tasks which are �self-regulated and goal directed.� These are tasks
in which no immediate rewards are available, the motivation for completing these tasks
are self-directed and the executive functions of planning and sequencing of complex
behavioral patterns is required. Sustained attention, which is contingency-shaped (i.e.,
determined by the immediate demands of the situation), should be unaffected in ADHD,
since no true deficit in attention has been consistently found (Barkley, 1997). On the other
hand, Barkley�s (1997) theory suggests that measures of attention and response inhibition
should be significantly correlated.
Frontal Lobe Measures
Neuropsychological measures which test the ability to reason abstractly, to sequence
events logically and temporally, switch cognitive sets, and to behave spontaneously are
often termed �frontal lobe� or executive measures. These tasks are purported to generally
assess executive functions, in part, because patients with frontal lobe lesions cannot do
them well (Lezak, 1985). Examples of frontal lobe measures include: the Benton

11
Controlled Oral Word Association test (COWAT) and the Wisconsin Card Sorting Test
(WCST).
The following section will detail the two frontal lobe measures to be used in this
investigation; the COWAT, and the WCST. Each measure will be introduced with a short
description of the task, as well as the particular function the task is believed to assess.
Focal brain injury, lesion and imaging studies will be presented as evidence supporting
each measures link to frontal lobe functioning. Test reliability, when available, will be
presented to further support the usefulness of these measures for assessment purposes.
Benton Controlled Oral-Word Association Test (COWAT)
The COWAT is a test of verbal fluency which requires the participant to recite, in 60
seconds, all the words they can recall which begin with a particular letter (Milner, 1964).
This task is completed three times with new letters being provided on each occasion. The
letters are of progressively increasing associative difficulty as measured by the relative
frequency of words in standard English dictionaries that begin with that letter. Several
versions of the test exist, one of which uses the letters F, A, and S, one with C, F and L
and one with P, R, and W.
Milner (1964) and Perret (1974) have found that left frontal lobe lesion patients show
decreased ability to list words on the COWAT. Benton (1968) showed that participants
with bilateral frontal lesions did not differ from those with left frontal lesions, suggesting
a greater decrement in performance did not result from larger bilateral lesions. These
results highlight the importance of the left frontal lobe in COWAT task performance.
Notably, Ramier and Hecain (1970) found that right, non-frontal, lesions also produce a
12
decrement in COWAT performance, however, those with right frontal lesions showed an
ever-greater decrement. They suggested that the verbal fluency task may be comprised of
two factors. The first factor is a verbal factor mostly dependent on the left hemisphere;
the second factor related to spontaneity, which has been relegated to the frontal lobes
bilaterally. DesRosier and Kavanagh (1987) reported good alternate form reliability for
the COWAT CFL and PRW forms (r=.91, p<.001) and sufficient stability (CFL form
r=.91, p<.001, and PRW form r=.86,p<.001).
Wisconsin Card Sorting Test (WCST)
The Wisconsin Card Sorting Test is a measure of cognitive flexibility, problem-
solving, concept formation (Heaton, 1981) and working memory (Spaulding, Garbin &
Dras, 1989; Barkley, 1997). In the current study the Spaulding version of the Wisconsin
Card Sorting Test was computer-administered (Spaulding, Garbin, & Dras, 1989). This
test requires the participant to match response cards to four stimulus cards based upon a
categorizing principle known only to the examiner. The first stimulus card displays a red
triangle, the second, two green stars, the third, three yellow crosses and the fourth, four
blue circles. Cards may be sorted according to color, number, or geometric shape. The
participant is first required to sort by color. After each attempt the participant is informed
whether he/she has matched correctly and this choice then disappears from the screen.
This disappearance of the card creates a demand for the participant to hold in working
memory the previous response in order to properly modify or continue their sorting
strategy. After the participant has correctly matched 5 cards the sorting criteria switches
to shape without warning. When the participant has successfully sorted 5 cards the sorting
13
principle again changes without warning, this time to number. This procedure starts again
after the participant has successfully matched 5 cards by number. The test is discontinued
when the participant has completed 6 categories or has used 64 cards. Three dependent
variables commonly used to identify brain dysfunction are the number of categories
completed, perseverative responses, and perseverative errors. The number of categories
completed refers to the number of sorting strategies (color, number, shape) which were
properly identified on five successive presentations. Perseverative response is defined as a
response that would have been correct using the previous strategy. Perseverative errors
are the perseverative responses which are also errors (not all perseverative responses are
errors as some may be ambiguous responses, that is, responses which may match on more
than one strategy).
Several studies have indicated that patients with frontal lobe lesions show more
impaired performance on the WCST than patients with lesions in non-frontal areas
(Bornstein, 1986, Milner, 1963 and 1964, Robinson, Heaton, Lehman, & Stilson, 1980).
Recently this conclusion has been questioned (see Mountain and Snow, 1993). Axelrod et
al., (1996) reported that although the WCST may be useful in detecting brain damage, its
sensitivity to frontal lobe damage is limited. Nonetheless, the authors suggest that
performance on the WCST depends upon a large neural circuit, of which the frontal lobe
is one component of the loop.
Evidence for this hypothesis is found in a wealth of imaging studies which supports
the notion that the WCST does tax functions of the prefrontal cortex. Studies using
various brain imaging techniques have shown that in healthy participants performing the
14
WCST, the dorsolateral prefrontal cortex shows physiological activation significantly
above baseline (Berman et al.,1995, Berman, Zec, and Weinberger, 1986, Weinberger,
Berman, and Zec, 1986, Marceno, Coppola, Daniel, Zigun, and Weinberger, 1993, Rubin
et al., 1991, Rezaiet al.,1993).
Test-retest reliability estimates on the WCST show minimal values, as Lezak (1995)
reports this is most likely due to the learning effect of the test and a suitable way of
determining reliability of the WCST may not be available.
Tests of response inhibition
Tasks which require the participant to inhibit or discontinue a prepotent or dominant
response are considered tests of response inhibition. The well-known Stroop test, which
was first made famous in J.R. Stroop�s 1935 dissertation on attention and interference, is
a good example. More recently designed tests include computer-driven tasks such as the
Continuous Performance Test and the Stop-Signal task.
The Stroop Color-Word Association Task
The Stroop test is intended to measure the ability of an individual to inhibit a
prepotent response and shift his/her perceptual set in order to conform to changing task
demands. Participants are asked to read three lists. The first list contains names of colors
written in black ink. On the second list participants are asked to identify the color ink that
each set of four X�s is printed in. On the third list participants are asked to state the ink
color (blue, green, red, yellow) that color words are printed in and the color does not
correspond to the color name (e.g., the word �green� is printed in red ink). The most
common dependent variables obtained from the Stroop are the interference score and the
15
Stroop effect. The interference score is found by subtracting the number of ink words
read from the number of color words read. The Stroop effect is quantified by the number
of errors committed when reading the color word list. Spreen and Strauss (1991) reported
test-retest reliability estimates of .90, .83, and .91 for the three lists of the test.
The Stop-Signal Task
Quay (1997) reported that Logan�s stop-signal task is the �best test of �pure�
disinhibition, that is not compounded by reward seeking� (p.8). Since the task does not
provide immediate feedback or reward the participant�s attention is not shaped by the
immediate environment but must instead be self-directed. The stop-signal task, which is
computer-administered requires the participant to complete two tasks at the same time.
The first task is a go task in which the subject must discriminate between an X and an O
and make an appropriate key stroke indicating which letter is being displayed. The second
task is a stop task that occurs on 25% of the go-task trials. This task is indicated by a tone
presented after the presentation of the letter. The tone is a signal to the participant to
inhibit the prepotent response and make no key strokes on that trial. Since the tone is
presented only after the letter (or go-task) the participant must stop an operation (striking
the correct key) already in process. The participant�s ability to inhibit the response is then
determined statistically by a race between the go task and the stop task. Logan et al.
(1984) likened this task to the check swing of baseball. As the pitch is delivered the batter
identifies the pitch as having a good location to hit. The batter decides to swing at the ball
and the motor commands are sent; the go-task. As the ball travels however the batter
decides the ball is no longer in a good location. He decides not to swing and the
16
command to inhibit or stop the swing is sent; the stop-task. In order for the batter to check
his swing the inhibitory process must catch the go process. Thus the success of the
inhibitory process is determined by the go-task reaction time or the latency of the
response to the go signal and the stop-signal reaction time or the latency of the response
to the stop signal. From this model it follows that deficient inhibition of the prepotent
response can be a product of responding to quickly to the go signal or too slowly to the
stop signal.
Logan�s stop signal task uses a tracking procedure which varies the delay between the
go signal and the stop signal. The stop-signal delay is changed after each trial. If the
participant was able to inhibit the prepotent response on a trial the delay is lengthened
50msec on the next trial. If the participant was unable to inhibit the response the delay is
shortened 50 msec. The go reaction time, the stop-signal reaction time (SSRT) and the
stop-signal delay determine the race. Over numerous trials this procedure converges on a
mean delay in which the success rate for inhibition is nearly 50% indicating that at that
delay the stop process and the go process finish at the same time, therefore the mean
delay must represent the average point in time at which the stop task is completed. The
mean delay ties the race and the winner is now a product of random variation. Since
participants are able to stop the prepotent response on 50% of the trials at the mean delay,
the go reaction time must be equal to the stop-signal delay and the stop-signal reaction
time. The task allows a recording of both the mean go reaction time and the stop-signal
delay, subtracting the two produces the SSRT. The longer the SSRT the slower the
inhibitory process (Logan, 1994).
17
A key distinction to be made in determining impulsivity as measured by the stop-
signal task is to determine whether the inability to inhibit a response is caused by an
overly quick go task process (indicated by a short go reaction time) or an overly slow stop
task process (i.e. slow inhibitory processing, indicated by a long SSRT). Logan, Schachar
and Tannock (1997) completed a stop-signal task study with 136 undergraduate students
who�s impulsivity level was rated by the impulsivity subscale of the Eysenck Personality
Inventory. The study showed that relative to low impulsive participants, high impulsive
participants showed significantly longer SSRTs. This was the only significant difference
between the groups. It suggests that the inability to inhibit responding amongst the high
impulsivity group is a factor of poor inhibitory control not excessively quick prepotent
responses. Also, in a meta-analysis (Oosterlaan, Logan & Sergeant, 1988) ADHD
participants were found to have longer SSRTs when compared to controls.
Continuous Performance Task
The Continuous Performance Test (CPT) is a computer-administered task that is
widely used as a measure of attentional sensitivity and sustained attention (Cornblatt &
Kelip, 1994). It is an experimenter-paced task that asks participants to attend to a
sequence of visually presented stimuli and respond with a key stroke each time a
previously identified target stimulus appears. The CPT measures two types of errors:
omission errors (failing to respond to the target stimulus) and commission errors (or
responding in the absence of the target stimulus). Omission errors are believed to be the
results of lapses in concentration or attention while commission errors are believed to
reflect an inability to inhibit responding, (i.e., impulsivity). These variables then measure
18
the two primary symptoms of ADHD (impulsivity and inattention). The natural log beta
value can be considered a measure of the participant�s response bias of either over-
responding in order to maximize hits while also increasing the error rate or under-
responding and in order to minimize errors while sacrificing hits (Cornblatt & Kelip,
1994). The CPT d prime value also provides an excellent measure of overall attentional
sensitivity, it combines hit and false alarm rates to assess ability to discriminate signal
from noise (Cornblatt & Kelip, 1994).
Empirical Studies of the Cognitive and Behavioral Aspects of ADHD
Hyperactivity/Impulsivity
The scientific support of excessive impulsivity and hyperactivity in ADHD has been
well researched and documented (Barkley, 1997). The most common method for
measuring these symptoms has been parent and teacher ratings of children�s behaviors.
Some common examples of ratings scales used to assess children for ADHD include: the
Child Behavior Checklist (Achenbach & Edelbrock, 1986) and the Conner�s Rating Scale
(Conners, 1997). By correlating these ratings with other measures of hyperactivity and
impulsivity that can be objectively rated (physical activity) the validity of these rating
scales may be secured. Studies have shown that those children who received high ratings
of hyperactivity or impulsivity on the rating scales in fact showed higher levels of activity
(Barkley, 1997). Teicher, Ito, et al. (1996) showed that boys who were diagnosed with
ADHD based on the Schedule for Affective Disorders and Schizophrenia for School-Age
Children-Epidemiologic Version kept their head and elbow still 66% to 67% less than
healthy control children when completing the CPT. They also reported that the ADHD
19
boys moved more than twice as often and nearly three times farther than controls. This
pattern extended to movement of the trunk as the ADHD boys kept their trunks still 74%
less than did the normal children. ADHD children have also been shown to talk more than
other children (Barkley, Cunningham, & Karlsson, 1983). Finally, Barkley and Ullman
(1975) reported that boys referred to a psychological service for evaluations of
hyperactivity, and who had been rated by their parents as more active than most children
showed greater ankle and wrist activity in a 15-minute free play session than normal
children.
Frontal lobe functioning
In the following sections evidence will be presented which support the notion that
individuals with ADHD show poorer performance than normals on frontal lobe measures.
Although a significant amount of research has been examined children with symptoms of
ADHD and frontal lobe functioning, considerably less work has been completed with
adolescence and adults. The following sections will therefore be dominated by research
that has been conducted with children.
Benton-Controlled Oral Word Association Test. Grodzinsky and Diamond (1992)
showed that boys with ADHD, aged 6 to 11, performed significantly poorer on the FAS
version of the COWAT than healthy control children. Felton, Wood, Brown, Campbell,
& Harter (1987) reported similar results for children 8-12 years. However, Fischer,
Barkley, Edelbrock and Smallish (1990) did not find a significant difference between 12-
20 year olds with and without ADHD.
20
Wisconsin Card Sorting Test. The WCST has been one of the most widely used tests
for comparing the frontal lobe functioning of ADHD individuals with that of healthy
controls and other clinical groups. Perseverative responding on the WCST may be
reflective of deficient working memory (Barkley, 1997). Perseverative errors reflect a
failure to adjust performance after receiving feedback that the strategy used was incorrect.
Barkley (1997) suggests that the individual is unable to properly modify his/her response
due to the inability to hold the feedback information in mind, which would normally lead
to reassessment of the strategy being employed. Barkley, Grodzinsky and Dupaul (1992)
completed a review study of twenty-two studies of neuropsychological functioning in
individuals with ADHD. Their review lists 13 studies that included the WCST. Of these
13 studies, eight found significant deficits in children with ADHD relative to control
children when using perseverative responses, perseverative errors and categories achieved
as the dependent variables. The authors suggest that some of the inconsistency in these
findings may be due to methodological limitations. However, they also point out that of
the five studies which found no deficits, three included adolescents, whereas none of the
affirmative studies included adolescents. They suggest that the WCST may not be
sensitive enough to detect deficient frontal lobe functioning in older individuals due to
frontal lobe maturation as one grows older. However, Seidman, Biederman, Faraone,
Weber, and Ouellette (1997) completed a large study of individuals from 9 to 22 years
old. In their study, which included 118 participants with ADHD and 99 controls, the
mean age for all participants was 14.8 years for the ADHD group mean age was 14.5 and
the controls mean age was 15.3. The authors reported significant impairment on the
21
WCST for the individuals with ADHD relative to controls. They further broke down the
participant population and reported that for the high-school and college-age participants
this deficiency still held. The authors reported that the lack of a significant Group X Age
interaction supported the notion that, although all the participants tend to obtain better
performance with age, the participants with ADHD continue to show poorer task
performance over time relative to the controls.
Tests of Response Inhibition in ADHD
The following sections will present empirical support which suggests that individuals
with ADHD show deficient levels of response inhibition as compared to controls. As with
the evidence presented on frontal lobe functioning in ADHD, these sections will be
dominated by research conducted with children, given that less research on adults with
exists.
Stroop Color-Word Association Test. Boucugnani and Jones (1989) showed that
children with ADHD had significantly lower scores on the Stroop test than did normal
children. Lavoie and Charlebois (1994) studied the ability to discriminate between
controls, attention-deficit children and boys labeled as disruptive. Their results showed
that attention-deficit children had a significantly greater Stroop effect than the disruptive
boys or the controls. Siedman, Biederman, Faraone, Weber & Ouellette (1997) reported
that among high school and college-age participants those with ADHD showed
significantly lower performance on the Stroop color and color-word scores than did their
age-matched controls.
22
The Stop-Signal Task. In 1998, Oosterlaan, Logan, and Sergeant published a meta-
analysis of eight studies investigating performance on the Stop-Signal task amongst
various groups of children. The authors reported that, relative to controls, the ADHD
group showed poor response inhibition, which was associated with a slow inhibitory
process. The meta-analysis also showed that this deficient inhibition was not unique to
ADHD when compared to other psychiatric groups. Performance on the stop-signal task
was unable to discriminate between children with ADHD, children with Conduct
Disorder, or children with both. However, children with anxiety disorders did not show a
similar deficit in inhibition.
Continuous Performance Test. Although the CPT was originally developed to identify
brain-damaged individuals, it has become a widely used instrument for assessing children
with attentional deficits (Barkley, 1990). In 1996, Losier, McGrath, and Klein completed
a meta-analysis of 26 studies that investigated CPT performance of children with and
without ADHD. Their analysis revealed that children with ADHD committed
significantly more omission errors than normals, approximately twice as many. Their
analysis of commission errors showed a similar pattern in which children with ADHD
produced significantly more errors than normals; specifically that controls committed
60% fewer commission errors than the children with ADHD did. A 1998 study by
Epstein, Conners, Sitarenios, and Erhardt found that adults with ADHD symptoms
committed significantly more omission and commission errors than did a group of
healthy controls. They also reported that the participants with ADHD symptomatology,
23
showed poorer d prime scores and concluded that the CPT did appear to provide
moderate clinical utility in predicting group status.
Studies of Adults with ADHD Investigating Psychiatric and Cognitive Functioning
An investigation of the psychiatric and cognitive aspects of adults with symptoms of
ADHD was done by Roy-Byrne, et al. (1997). In this study adults were diagnosed with
ADHD based on DSM-IV criteria and a semi-structured interview. The results indicated
that adults with probable or possible ADHD exhibited poorer performance on an
attentional task (the continuous performance test) and the reading section of the Wide-
Range Achievement Test-Revised. Participants with ADHD symptoms also had a higher
prevalence of childhood diagnosed learning disabilities and higher scores on the Wender
Utah Rating Scale (WURS; Ward, Wender & Reimherr, 1993) compared to adults
without symptoms of ADHD. Epstein, Conners, Erhardt, March, and Swanson (1997)
reported a study of adults with ADHD in which they had participants perform a
chronometric visual-spatial attention task. The results indicated that adults with
symptoms of ADHD showed significantly worse attentional performances for left visual
field (right hemisphere) targets. Additional studies have continued to find cognitive
deficits in adults with ADHD symptoms compared to controls. Gansler et al. (1988)
found that adults with ADHD performed more poorly on the Halstead-Reitan Trail
Making Test and a visual continuous performance test than did controls. Also Seidman,
Biederman, Weber, Hatch and Faraone (1988) reported that, compared to controls, adults
with ADHD performed significantly worse on measures of vigilance, semantic encoding
and written arithmetic. Riordan et al., (1999) found that adults with ADHD showed
24
significantly worse performance on measures of verbal memory, motor and processing
speed, visual scanning and auditory and visual distractibility compared to healthy
controls.
An additional concern in the adult diagnosis of ADHD involves the complications
created by the high level of psychiatric comorbidity displayed by these individuals. The
overlap of symptoms between ADHD and disorders such as depression, anxiety,
substance abuse, and borderline and antisocial personality disorder makes it difficult to
tease out if symptoms such as restlessness, impulsiveness, and concentration difficulties
are due to ADHD or these other disorders. Spencer, Biederman, Wilens, and Faraone
(1998) reported that of adults with ADHD, substantial numbers also exhibited symptoms
of substance abuse (27 � 46%), antisocial personality disorder (12-27%), and criteria for
anxiety disorders (50%). The authors reported that their literature review indicated
approximately 60% of adults with ADHD showed at least one comorbid disorder. An
earlier study by Biederman and colleagues (1993) indicated an even greater number, 77%
of adults with ADHD exhibited at least one comorbid psychiatric disorder. Notably, Roy-
Byrne et al. (1997) reported that differences in cognitive functioning were found between
the ADHD and non-ADHD groups despite comparable rates of additional
psychopathology in each group.
Somewhat more conservative findings were discussed in two studies by Manuzza,
Klein, Bessler, Malloy, and LaPadula (1993; 1998). In their 1993 study, the authors
compared various rates of psychiatric illness between 91 Caucasian male adults (average
age 25) who had childhood diagnoses of hyperkinetic reaction (DSM-II diagnosis
25
essentially replaced by the ADHD diagnosis) and a control group. This result showed that
the probands had significantly higher rates of antisocial personality disorder (18% versus
2%) and drug abuse (16% versus 4%) than the comparison group. Their 1998 study
compared 85 probands (mean age 24), who also received childhood diagnoses of
hyperkinetic reaction to a control group. This study supported their earlier findings, and
showed significantly higher rates of antisocial personality disorder (12% versus 3%) as
well as nonalcoholic substance abuse (12% versus 4%) amongst the probands. In sum,
symptoms of psychopathology, other than ADHD symptoms, need to be accounted for
when studying the cognitive performance of those with and without a diagnosis of
ADHD.
Neuroimaging
Empirical support for the existence of deficient frontal lobe functioning in ADHD is
found in a wealth of neuroimaging studies though a number of these has studied children
as opposed to adults. A regional cerebral blood flow study by Lou, Henriksen, and Bruhn
(1984) examined 11 children, six and a half to fifteen years old, who exhibited ADHD
symptoms. When compared to controls, the children with ADHD exhibited
hypoperfusion of the frontal lobes while at rest. A second study by Lou, Henriksen,
Bruhn, Borner, and Nielsen (1989) studied an additional 19 children also at rest and
found similar results. However, the generalizability of these studies appears limited by the
number of patients and the confounding factor that many of the patients exhibited other
neurological deficits.
26
In a landmark PET study by Zametkin, et al. (1993), the authors reported that global
brain glucose metabolism when completing an auditory Continuous Performance Test
was not significantly different between normal adolescents and adolescents with ADHD,
however, an area in the left anterior frontal lobe did show significantly reduced
metabolism among the ADHD participants compared to controls. They also noted that
metabolism in that region was inversely correlated with symptom severity (r=-.56 to -.67,
p<.001-.009). This study supported an earlier study by Zametkin, et al. (1990) which
investigated adults who displayed ADHD symptoms. Fifty control adults (mean age of
36.3 + 11.7) and 25 adults with ADHD (mean age 37.4 + 6.9) were used in the study. The
authors reported that the adults with ADHD completing an auditory attention task showed
significantly reduced global and regional brain glucose metabolism compared to controls.
They noted that the largest reductions appeared in the premotor cortex and the superior
frontal cortex. In sum, the results of imaging studies are generally consistent with
research on the cognitive aspects of ADHD.
Medication
Psychostimulants are the most common medication prescribed to treat ADHD. Barkley
(1990) reports that more children are medicated for ADHD than for any other childhood
disorder; between 1% and 2% of the school-age population. The medication of choice is
Ritalin (methylphenidate), however Cylert (pemoline) and Dexedrine
(dextroamphetamine) are also frequently prescribed. Barkley (1990) concludes that
patients treated with stimulant medications showed an average improvement rate between
73% and 77% with improvement being determined by subjective ratings of behavior by
27
parents and teachers. Barkley�s estimate is supported by Findling and Dogin (1998) who
reported that a 70% therapeutic success rate is generally accepted. He notes the
importance of observing that 23% to 27% of those treated did not show change due to the
medications. Studies on the cognitive effects of stimulant medication have found
enhanced performance on vigilance, impulse control, reaction time, short-term memory,
verbal retrieval, and simple and complex learning paradigms (Rapport & Kelly, 1991;
Rapport, Dupaul, & Smith, 1985; Swanson, 1989). What has not been shown thus far is
whether the social and academic problems associated with ADHD also improved with
medication (NIH Consensus Conference, 1998).
Assessing ADHD in Adulthood
Since the focus of this investigation was adults with ADHD, the ability to accurately
measure adult ADHD symptomatology was of great importance. This study used the
Wender Utah Rating Scale, and a semi-structured interview for ADHD symptoms to
classify participants into groups.
Utah Criteria for Adult ADHD
The Utah Criteria was established to enhance diagnostic accuracy of Adult ADHD.
Ward, Wender and Reimherr (1993) reported the criteria:
1) a childhood history of attention deficit hyperactivity with
both attentional deficits and motor hyperactivity, together
with at least one of the following characteristics: behavior
problems in school, impulsivity, overexcitability, and
temper outbursts, and 2) an adult history of persistent
28
attentional problems and motor hyperactivity together with
two of the following five symptoms: affective lability, hot
temper, stress intolerance, disorganization, and impulsivity.
In order to aid in the retrospective diagnosis of childhood ADHD, the authors
presented an initial validation of the Wender Utah Rating Scale (WURS), a 61-item scale
for adults to rate their childhood behavior. In their study the authors reported that a cutoff
score of 46 was able to correctly identify 86% of adult patients with ADHD, 99% of
controls, and 81% of adults patients with depression. The authors also correlated WURS
scores with a 10-item Parents� Rating Scale. They reported significant Pearson correlation
coefficients for both the control participants, r=0.49 (p<0.0005, df=98) and for ADHD
participants, r=0.41 (p<0.0005, df=65). The authors argue that despite the moderate
magnitude of the correlations, the degree of correlation is more impressive in light that
they were derived using two different instruments completed by different individuals
reporting on childhood behavior from approximately 25 years earlier.
Roy-Byrne, et al. (1997) reported that of 143 adults who presented for an ADHD
evaluation, the WURS was the most discriminating psychometric measure in their battery
which included the CPT, and the reading section from the Wide Range Achievement
Test-Revised. They noted however that although the WURS appeared sensitive to
ADHD, the cutoff score of 46 provided by Ward, Wender, and Reimherr (1993) did not
prove in their study to be specific to ADHD. In the latter study, this criteria was only able
to identify 60.9% of the non-ADHD participants, with diagnosis being established via
29
DSM-IV criteria and a structured interview. Stein et al., (1995) reported a high degree of
internal consistency and temporal consistency (4-week interval) for the WURS.
Summary
Barkley�s (1997) theory creates a wealth of questions for empirical study. One of the
most basic assumptions of his theory is the relationship he proposes between behavioral
inhibition and frontal lobe or executive functioning. First, individuals with ADHD should
display deficits in inhibition. If, as Barkley suggests, behavioral inhibition sets the stage
for additional executive functions, then those individuals with poor inhibition should also
show poor executive functioning. However, the exact nature of the connection between
inhibition and executive functioning is unknown. Therefore, a reasonable hypothesis at
this point is that the patterns of correlations between executive and inhibition measures
will vary between healthy individuals, and those individuals who display symptomatology
of ADHD. The specific hypotheses tested in this study were as follows.
Hypotheses
1. Participants in the ADHD group would show poorer inhibition, compared to controls;
specifically higher Stop Signal reaction time (SSRT) scores.
2. The measures of inhibition will be better predictors of ADHD symptoms, compared
to the other cognitive tests.
3. The pattern of cognitive correlations will differ between the ADHD group and the
non-ADHD group.
30
Method
Participants
Participants, aged 18-56, were solicited through Dallas/Fort Worth newspaper
advertisements and postings on the University of North Texas campus. The advertisement
read:
Research study for adults with attention-deficit disorder. Do
you have trouble sustaining your attention, staying focused,
or are you easily distracted? Do you often act on the spur of
the moment or without thinking? Do you have trouble
organizing your activities? Do you do things slowly to
insure they are done correctly? If you are between the ages
of 18 and 55 and you�ve answered yes to two or more of
these questions you may be eligible to participate in a
research study on adults with Attention-Deficit
Hyperactivity Disorder (ADHD). For more information
please call the Neuropsychology Lab at the University of
North Texas (940) 565-XXXX.
All participants were administered a brief phone screen (see Appendix B) to ensure
they were appropriate for the study.
All individuals who answered the advertisement and did not meet exclusion criteria
(listed below) were invited to the clinic to complete a battery of measures. Students
31
recruited from the UNT Psychology department were offered extra credit for their
participation in the study.
Apparatus
A Dell 466/MX computer with a 13-inch monitor was used to administer several
cognitive tasks. Participants were asked to use their dominant hand when responding on
these tasks. Handedness was verified via a handedness questionnaire. Participants were
seated with hands resting comfortably approximately two inches from the edge of the
table. The monitor was placed 16 inches from the edge of the table.
Measures
The measures used fell into four categories: (1) attention, (2) behavioral inhibition, (3)
frontal lobe/executive functioning, and (4) symptom-based. The measures of attention
used were: (a) the Continuous Performance Test-Identical Pairs Version (CPT-IP;
Cornblatt, 1988) and (b) the Wechsler Memory Scale-Third Edition (WMS-III) subtests
for the Working Memory Index, which included the Letter-Number Sequencing subtest
and the Spatial Span subtests (WAIS III WMS III Technical Manual, 1997). The
inhibition measures included: (a) the Continuous Performance Test � Identical Pairs
Version (CPT-IP; Cornblatt, 1988) (b) the Stop-Signal task SSRT (Logan, 1994) and (c)
the Stroop Color-Word test (Macleod, 1991). The frontal lobe/executive function
measures included: (a) the Benton Controlled Oral Word Association test (Benton, 1968),
and (b) the Spaulding Wisconsin Card Sorting Test (Spaulding, Barbin, & Dras, 1989)..
Symptom based measures included: (a) the Wender Utah Rating Scale (Ward,
Wender, & Reimherr, 1993) (Appendix B), (b) the Center for Epidemiological Studies
32
Depression Scale (CES-D) (Radloff, 1977), (Appendix B) (c) the Barratt Impulsiveness
Scale (BIS-11) (Patton, Stanford, & Barratt, 1998), (d) the State-Trait Anxiety Inventory
(STAI) Form Y, (e) a structured interview for ADHD symptoms, (Andrea Bergman, New
York High Risk Project, personal communication, November 12, 1998) (Appendix B),
and (g) a modified version of the Dartmouth Assessment of Lifestyle Inventory (DALI),
(Rosenberg et al., 1998). Additionally, the Wide Range chievement Test-Revised
(WRAT-R) reading section and an 8-item measure of handedness (Peters & Servos, 1989)
were administered.
The following paragraphs describe the measures that have not been previously
discussed.
Letter-Number Sequencing. This WMS-III subtest requires the participant to
sequentially order numbers and letters that are orally presented. The numbers and letters
must be held in memory so the participant can reorder first the numbers sequentially and
then the letters alphabetically. The WAIS-III, WMS-III technical manual reports an
average reliability coefficient of .82 across 13 age groups ranging from 16-years-old to
89-years-old.
Spatial Span. The WMS-III Spatial Span subtest is composed of two parts; Spatial
Span Forward and Spatial Span Backward. In Spatial Span Forward the examiner points
to a series of blocks in a specific order and the participant is to reproduce the same series
of blocks in the same order as the examiner, a task likely to test focused attention (WAIS-
III WMS-III Technical Manual, 1997, p.204). Spatial Span Backward requires
reproducing the series of blocks in the opposite order that they were presented and more
33
likely reflects working memory (WAIS-III WMS-III Technical Manual, 1997, p.204). The
technical manual reports an average reliability coefficient for this subtest of .79.
Center for Epidemiological Studies Depression Scale. The CES-D is a 20-item self-
report symptom rating scale that assesses for depressed mood. Each item is rated by
participants based on four choices: a) rarely or none of the time (Less than 1 day), b)
some or little of the time (1-2 days) c) occasionally or a moderate amount of time (3-4
days) and d) most or all of the time (5-7 days). Radloff (1977) reported high internal
consistency across three different samples with alpha coefficients near .85. Weissman,
Sholomskas, Pottenger, Prusoff and Locke (1977) reported significant correlations
between the CES-D and the Symptom Checklist 90 , the Raskin Depression Scale, and
the Hamilton Rating Scale across five psychiatric groups (acutely depressed, recovered
depressed, drug or alcohol dependence, and schizophrenia). The highest correlations were
with the SCL-90, ranging from .72 (acutely depressed) to .87 (alcohol dependent).
Correlations with the Hamilton rating scale ranged from .49 (acutely depressed) to .85
(schizophrenia) across the five groups and correlations with Raskin Depression scale
ranged from .28 (acutely depressed) to .79 (schizophrenia).
Barratt Impulsiveness Scale - 11. The BIS-11 is a 30-item self-report symptom rating
that measures impulsiveness. The items are ranked on a scale of 1 to 4: (4) rarely/never,
(3) occasionally, (2) often, and (1) almost always/always. A factor analytic study found
that the 30 items could be summarized by three factors with no item overlap among
scales. The first factor, which is composed of 12 items, was named Non-planning
Impulsiveness and was described in terms of self-control, in which low impulsivity was
34
labeled as �planning and thinking carefully.� This factor was also described in terms of
cognitive complexity with high complexity of low impulsivity described with the phrase
�enjoys challenging mental tasks� (Patton, Stanford, and Barratt, 1995, p.770). The
second was termed Motor Impulsiveness (consisted of 10 items) high impulsiveness was
described in terms of motor impulsiveness or �acting on the spur of the moment.� Low
impulsiveness may be described in terms of perseverance, or �a consistent life style�
(Patton, et al., 1995, p. 770). The third, consisting of 8 items, was termed Attentional
Impulsiveness and was described in terms of attention with low impulsivity described as
�focusing on the task at hand.� High impulsivity was described in terms of cognitive
instability, such as �thought insertions and racing thoughts� (Patton, et al., 1995, p.770).
Internal consistency coefficients (Cronbach�s alpha) for the BIS-11 total score were
within acceptable limits for the four groups tested (range .79-.83); Baylor University
undergraduates, substance-abuse patients, general psychiatric patients, and prison
inmates. The total score between-group differences were in the expected direction with
Baylor undergraduates being less impulsive than both patient groups. Among the Baylor
undergraduates the factor scores all correlated significantly with one another (Pearson�s
product-moment correlation coefficients ranged from .46 to .53). The prison inmates,
who were all male, had significantly higher scores than all three other groups of males.
No within-group sex differences were found.
State-Trait Anxiety Inventory: Form Y. The STAI is a 40-item symptom rating scale
measuring anxiety. This scale requires the participant to choose from four possible
ratings: (a) almost never, (b) sometimes, (c) often, and (d) almost always. The measure is
35
composed of two scales; twenty items assess state anxiety and twenty assess trait anxiety.
The trait anxiety scale has been shown to correlate well with the Institute for Personality
and Ability Testing (IPAT) Anxiety Scale and the Taylor Manifest Anxiety Scale. The
significant correlations have been shown across both healthy individuals and
neuropsychiatric patients with Pearson correlations ranging from .73 to .85 (Spielberger,
1993). Spielberger (1993) also reported that the trait anxiety scale was significantly
elevated relative to normals in seven of eight neuropsychiatric groups and the measure
differentiated between general medical and surgical patients with and without psychiatric
complications. The validity of the state anxiety scale has been exhibited by the
identification of significantly higher state anxiety scores of college students under exam
conditions relative to non-exam conditions (Spielberger, 1993). Speilberger (1993) has
also reported Strong internal consistency with overall median alpha coefficients for the
state anxiety scale equal to .92, and .90 for the trait anxiety scale.
Structured Interview for ADD-H Symptoms. This structured interview covers three
major symptom domains of ADHD. It investigates attentional problems, hyperactivity,
and impulsivity, and includes a list of general questions regarding school history,
interpersonal relationships, financial and legal difficulties, and individual or family
history of ADHD. This interview is currently being used in other research projects and
appears capable of discriminating between ADHD and non-ADHD individuals. (Andrea
Bergman, New York High Risk Project, personal communication, November 12, 1998).
Wide Range Achievement Test-Revised Edition - Reading Section. The WRAT-R-
Reading section is a 42- item word recognition test that has two forms. It has recently
36
been found to be an effective discriminator between ADHD and non-ADHD adults (Roy-
Byrne et al., 1997).
Dartmouth Assessment of Lifestyle Inventory. The DALI is an 18-item interview and
scale that focuses on screening for alcohol, cannabis, and cocaine use disorders. It is
designed to be a brief screen that takes only minutes to administer. Results of a 1998
study by Rosenberg et al. showed that the DALI was able to identify 85% of 199
individuals who were diagnosed with alcohol use disorder using DSM-IIIR criteria. For
the purposes of the current study the DALI will be supplemented with a series of
questions pertaining to the use of other illegal substances.
Procedure
Participants who answered the newspaper advertisement received a short screening
phone interview to determine if they met the requirements for inclusion in the study (See
Appendix B). To be included in the study individuals must have been between the ages of
18 and 55. Exclusion criteria included: history of significant head injury, epilepsy,
encephalitis, or other neurological disorders, as well as any vision, hearing, or physical
handicaps which would significantly hinder their performance on the computer-
administered tasks. Individuals who were diagnosed with an Axis I disorder in the
previous three months were not going to be allowed to participate in this study, however
no participants met this criteria. Only one individual did not meet criteria for inclusion
due to a head injury which resulted in a loss of consciousness greater than ten minutes.
The rest of the sample which reported no significant impairments in physical or
37
neurological functioning were invited to make an appointment to complete a battery of
tests administered in the Neuropsychology Lab at the University of North Texas.
Upon arrival all individuals were asked to read and sign a letter of informed consent.
Next, the participants were interviewed using the Structured Interview for ADHD
Symptoms. This was followed by administration of the DALI, WRAT-R Reading section,
WMS-III Letter-Number Sequencing, WMS-III Spatial Span, Stroop Test, COWAT, the
8-item handedness Questionnaire, and the Finger Tapping Test. At this point all
participants were offered an opportunity to take a short break before continuing with the
computerized measures of the battery. The computerized measures were administered in
the following order: Spaulding WCST, Stop-Signal Task, and finally the CPT. Upon
completion of the computerized measures, the participants were administered the WURS,
BIS-11, CES-D, and the STAI. All participants received a debriefing, which included
some education on ADHD and the aims of the current research project. All participants
were mailed a three-page synopsis of their results and a list of referrals for ADHD
treatment and information.
Results
There were 45 participants who took part in the study (31 female, 14 male). The
sample consisted of 39 Caucasian individuals, 4 African-American individuals, and two
Vietnamese-American individuals. 13 of these individuals (28.8% of the sample)
identified themselves as students from the University of North Texas, 32 of the
individuals (72.2% of the sample) were recruited through the newspaper announcements.
The mean age for this sample was 35 years of age (SD = 11.8, Range = 18-56). Mean
38
years of education was 15, (SD = 2.7, Range = 11-26). For the majority of participants,
the WRAT grade equivalent score exceeded the 12th grade level, a second indication of
the well-educated sample. Results from the handedness questionnaire indicated 42 of the
individuals were right-handed, two were left-handed, and one showed no hand preference.
Levels of reported substance abuse were rather low as no participant reported current
consumption of alcohol or other drugs which interfered with social or occupational
functioning. Demographic and symptom data are presented in Table 1.
Based on zero-order correlations and internal consistency estimates, two cognitive
composites were constructed: (1) a verbal attentional composite, and (2) a nonverbal
attentional composite. The verbal attentional composite score was computed as the sum
of the Letter-Number Sequencing Scaled Score plus the hit ratio for the CPT numbers
subtest multiplied by 10 (standardized alpha = .57). The nonverbal attentional composite
was derived from the sum of the Spatial Span Scaled Score plus the hit ratio for the CPT
shapes subtest multiplied by 10 (standardized alpha = .56).
Group Classifications
For the purposes of this study participants were diagnosed as either ADHD or Non-
ADHD by three separate methods. This approach was taken because of
the inherent difficulty of diagnosing ADHD in adulthood (Roy-Byrne et al., 1997), but
also to explore some alternative methods which might guide future research. The primary
method in diagnosing ADHD relied on DSM-IV criteria. Participant responses to those
interview questions, which directly assessed DSM-IV criteria, were evaluated in terms of
whether they would or would not meet diagnostic criteria. Significant responses for all
39
items were tallied to determine whether the individual met the required number of criteria
(6 out of 9 symptoms which assess inattention, or 6 out of 9 symptoms which assess
hyperactivity-impulsivity) to receive a diagnosis of ADHD. The DSM-IV age of onset
criteria for ADHD symptoms was not required to receive a positive diagnosis. Barkley
and Biederman (1997) noted finding no support for continuing to use the current age-of-
onset criterion of 7 years of age and suggested the age-of-onset criterion should either be
abandoned all together or significantly broadened. This diagnostic method resulted in 19
participants who met criteria for ADHD and 26 who did not. Of the thirteen students,
three were diagnosed with ADHD based on this method of diagnosis.
The second method for attempting to determine whether ADHD was present or not,
was to rely on previous research using the Wender Utah Rating Scale (Ward, Wender,
and Reimherr, 1993). That study reported that twenty-five items (out of the total 61) were
particularly good in discriminating between those adults with and without ADHD
(diagnosis was based on a structured DSM-IV based interview). Based on this research a
cut score of 46 was used for determining group membership. Using this empirical
approach to classification, 23 participants were considered to represent the ADHD group
and 22 participants the Non-ADHD group. 6 of the 13 students were diagnosed with
ADHD via this diagnostic method.
The third method employed to determine group membership involved an empirically
derived interview cut score. As each item of the ADHD interview was scored on a scale
of 1 to 5, the items could easily be summed to determine an overall interview score. This
score was interpreted as an indication of the severity of ADHD symptomatology, the
40
higher the score the more severe the symptomatology. An empirically derived cut score
was then used to split the number of participants between the two groups (22 in the
ADHD group, 23 in the non- ADHD group). Specifically, those individuals who received
a score of 53 and higher were assigned to the ADHD group, those who scored below 53
were assigned to the non-ADHD group. Only 1 of the 13 students reached this criterion
score and was placed in the ADHD group.
In examining the concordance rates between these diagnostic methods it was noted
Method 1 (DSM-IV diagnosis) and Method 2 (WURS diagnosis) agreed on 46.6% of the
cases (21out of 45 cases). Method 2 and Method 3 (interview cut score) agreed on 62.2%
of the cases (28 out of 45 cases). Not surprisingly, Method 1 and Method 3 showed the
greatest concordance, agreeing on 80% of the cases (36 out of 45 cases).
For each method of diagnosing ADHD, t-test analysis showed no significant
differences in participant age between the diagnosed group and the non-diagnosed group
(Method 1 (t(43)= -1.316, p>.05), Method 2 (t(43)=.356, p>.05), Method 3 (t(43)=1.517,
p>.05); See Tables 2-4 for means and standard deviations). Chi-Square analysis for each
of the three methods revealed no significant differences in gender proportions between
the diagnosed and non-diagnosed groups (Method 1 (Χ2 = 1.552, p>.05), Method 2 (Χ2 =
.010, u>.05), Method 3 (Χ2 = .296, p>.05). See Tables 2-4 for gender proportions).
Notably, the groups did differ in education for Method 2 and Method 3 diagnosis (t(45)=-
2.935, p<.01, t(45)= -2.215, p<.05).
41
Group Comparisons of Symptom Variables
Once participant group membership was determined, group comparisons were
completed for the symptom variables. A one-way multivariate analysis of variance
(MANOVA) was run to determine the specific relationships between the diagnosis of
ADHD (as determined by DSM-IV criteria, Method 1) and the following symptom
variables: STAI Trait score, STAI State score, CES-D Total score, BIS�Attentional score,
BIS-Motor score, BIS-Non Planning score. The results did indicate a significant
difference, F (6,38) = 3.468, p < .01. Follow up univariate ANOVAs revealed that those
who were diagnosed with ADHD had significantly higher BIS-Attentional scores, F
(1,43) =10.173, p < .01. No significant differences were found between the groups on any
of the other symptom variables.
A second MANOVA was completed with the same variables, however this time group
status was determined by the WURS (Method 2). The results were very similar to the
above analysis. Again a significant difference was indicated, F (6,38) = 4.184, p > .01.
The follow up univariate ANOVAs revealed that those who were diagnosed ADHD had
obtained a significantly higher BIS Non-planning score, F (1,43) =6.682, p >.05 and BIS
Motor score, F (1,43) =11.344, p < .01. No significant differences were found between
the groups on any of the other symptom variables.
Finally a third MANOVA was completed this time the diagnosis determined by the
interview cut score (Method 3). A significant difference was again found, F (6,38) =
2.808, p <.05. As before the only measure which produced significant differences when
investigated by univariate ANOVAs were the BIS measures, BIS-Attentional score, F
42
(1,43) = 6.603, p <.05, and BIS-Motor score F (1,43) = 7.676, p <.01. The differences
were again in the expected direction with the ADHD group obtaining higher scores.
Group analysis of each of the diagnostic methods was also completed using
MANCOVA�s in which years of education were used as a covariate. The results of these
analyses produced largely similar results. In terms of method 1 the results did indicate a
significant difference, F (6,37) = 3.380, p < .01. Follow up univariate ANCOVAs
revealed that those who were diagnosed ADHD had significantly higher BIS-Attentional
scores, F (1,42) =9.613.173, p < .01. In terms of method 2 again a significant difference
was indicated, F (6,38) = 3.457, p < .01. The follow up univariate ANCOVAs revealed
that those who were diagnosed ADHD had obtained a significantly higher BIS Motor
score, F (1,42) =8.849, p < .01, while the Non-planning score approached significance, F
(1,42) =3.564, p =.066. A significant difference also existed for method 3, F (6,37) =
2.651, p <.05. Univariate ANCOVAs again indicated significant differences for the, BIS-
Attentional score, F (1,42) = 5.661, p <.05, and BIS-Motor score, F (1,42) = 6.320, p
<.05 with the ADHD group obtaining higher scores.
Group Comparisons of Cognitive Variables
Once investigation of the symptom variables was completed, the analysis focused
upon determining whether group differences existed among the cognitive variables. A
multivariate analysis of variance (MANOVA) was run to determine the specific
relationships between the diagnosis of ADHD (as determined by DSM-IV criteria,
Method 1) and the following cognitive variables: COWAT adjusted total score,
perseverative errors on the WCST, the Stop-Signal reaction time score (SSRT), and the
43
previously defined verbal attention and nonverbal attention composites. The results
indicated a statistical difference just short of conventional levels of significance, F (5,39)
= 2.413, p = .054. Follow up univariate ANOVAs revealed that the ADHD group had a
significantly higher COWAT adjusted total mean score than the non-ADHD group, F
(1,43) =5.582, p < .05. No significant differences were found between the groups on any
of the other variables.
Given that significant differences in education did exist between the groups, the same
analysis as above was re-run, using years of education as a covariate and substituting the
COWAT total score rather than the COWAT adjusted score which accounts for
educational level. The results indicated a main effect for group, F (5,38) = 3.152, p < .05.
As above, the ADHD group had a significantly higher COWAT total mean score than the
non-ADHD group, F (1,42) = 7.307, p <.01. A non-significant trend was noted for the
verbal attentional composite, F (1,42) = 3.594, p = .065, with the ADHD group showing a
slightly higher score (better performance) than the non-ADHD group. No other
significant differences were found between the groups.
When utilizing the WURS score (Method 2) to determine group membership, years of
education was again used as a covariate. A one-way multivariate analysis of co-variance
(MANCOVA) was run to determine the specific relationships between the diagnosis of
ADHD (as determined by the WURS twenty-five item score, Method 2) and the same
cognitive variables: COWAT total score, perseverative errors on the WCST, the SSRT,
and the verbal attention and nonverbal attention composites. The analysis revealed a
significant difference for group, F (5,38) = 2.556, p < .05. Follow up univariate
44
ANCOVAs revealed that those who were diagnosed ADHD had significantly higher
Stop-Signal reaction times (SSRT) than those not diagnosed, F (1,42) =12.20, p < .01 and
a significantly lower nonverbal attentional composite score, F (1,42) = 5.580, p <.05. No
other significant differences were found between the groups.
Finally, using Method 3 to determine group status, an identical MANCOVA as above
was run. The results indicated a significant main effect for group, F (5,38) = 3.803, p
<.01. Follow up univariate ANCOVAs revealed that the ADHD group had a significantly
higher SSRT mean than the Non-ADHD group, F (1,42) =4.887, p <.05. The ADHD
group was also found to commit significantly more WCST perseverative errors, F (1,42)
= 4.117, p <.05 and have a significant higher COWAT total score, F (1,42) 4.613, p <.05.
No other significant differences were found between the groups.
Three additional MANCOVAs (one for each method of diagnosis) were run to
investigate the relationship between group membership and the Stroop interference score,
the CPT numbers subtest commission errors, and the CPT shapes subtest commission
errors. None of these analyses produced significant results.
Regression Investigations of ADHD Symptomatology
The next set of analyses were designed to assess how well the variance in ADHD
symptomatology could be predicted by the symptom and cognitive variables. To do this
multiple regression equations were created. Many of the variables were significantly
correlated however the majority were not so highly correlated that multicollinearity was
thought to be a problem. The greatest correlations were found between the CES Total
score and the STAI-Trait score (r=.712, p<.001) and the STAI-State score (r =.661,
45
p<.001). The only other correlations which eclipsed a magnitude of .5 were the SSRT
average score with the verbal attentional composite (r = .504, p < .001), the SSRT
average score with the nonverbal attentional composite (r = .504, p < .001) and the verbal
attentional composite and the nonverbal attentional composite (r = .501, p < .001).
The first regression equation used the interview total score as the criterion variable.
The following predictor variables were entered in a stepwise fashion: participant age,
years of education, CES-D total score, STAI State score, STAI Trait score, verbal
attention composite, nonverbal attention composite, WCST perseverative errors,
COWAT adjusted score and the SSRT average score. Results of the regression indicated
that three variables, the COWAT adjusted score, years of education, and the SSRT
average score contributed significantly to the regression. The COWAT adjusted score
variable (standardized beta = .359) achieved significance, F (1,43) = 6.344, p<.05, most
strongly, accounting for 10.8% of the variance (all variance estimates reported are
adjusted R Squares). Following the COWAT variable, the participant�s level of education
(standardized beta = -.309) was added to the model, F (1,42) = 4.815, p <05, accounting
for an additional 7.3% of the variance. Finally the addition of the SSRT variable
(standardized beta = .339) was found to add significantly to the model, F (1,41) = 6.233,
p <.05, accounting for an additional 9.1% of the variance. The three variable model
accounted for 27.2% of the variance.
The next multiple regression analysis was completed using WURS 25 score as the
criterion variable. The same predictor variables as before were again entered in a stepwise
fashion. Results of the regression indicated that only two variables, years of education
46
(standardized beta = -.358), and the SSRT average score (standardized beta = .364)
contributed significantly to the regression. Years of education achieved significance, F
(1,43) = 6.3437, p<.05, most strongly, accounting for 12.8% of the variance. The SSRT
average also added significantly to the model, F (1,42) = 7.380, p < .01, accounting for an
additional 11.7% of the variance. The two variable model accounted for 22.5% of the
variance in the WURS scores.
Finally, in an effort to see how well the independent variables could predict additional
symptoms of ADHD, the BIS total score was used as the criterion variable in additional
multiple regressions. The following predictor variables were entered in a stepwise
fashion: participant age, years of education, CES-D total score, STAI State score, STAI
Trait score, verbal attention composite, nonverbal attention composite, WCST
perseverative errors, COWAT adjusted score and the SSRT average score. Results of the
regression indicated that four variables, the STAI State score (standardized beta = .426),
the SSRT average score (standardized beta = .309), years of education (standardized beta
= -.304), and the COWAT adjusted score (standardized beta = .296) contributed
significantly to the regression. The STAI State score, F (1,43) = 9.529, p<.01, accounted
for 16.2% of the variance. Following this, the participant�s SSRT average score was
added to the model, F (1,42) = 5.290, p < .05, accounting for an additional 7.6% of the
variance. Next the participants level of education was found to add significantly to the
model, F (1,41) = 5.765, p < .05, accounting for an additional 8.3% of the variance in the
BIS total score. Finally the addition of the COWAT adjusted score was found to add
significantly to the model, F (1,40) = 5.270, p <.05, accounting for an additional 6.4% of
47
the variance. The four variable model accounted for 38.0% of the variance. No other
variables were found to add significantly to the model.
Symptom and Cognitive Variable Correlations
Finally, the correlations among the symptom and cognitive variables were examined.
Table 5 illustrates the symptom and cognitive variable correlations for the entire sample.
Tables 6-7 represent one-tailed Pearson correlations for each diagnostic group as
determined by method 1. Among the non-ADHD group (Table 6), the cognitive variables,
which showed the greatest number of significant correlations with the symptom variables,
concerned the number of perseverative errors and the COWAT adjusted score.
Perseverative errors exhibited significant positive correlations with both the State and
Trait scales of the STAI, as well as the CES-D total score and the WURS 25 score. The
COWAT showed significant negative correlations with the CES-D total score, the BIS-
Total, Attention, and Non-planning scores and the WURS 25 score. Of the symptom
variables, the WURS 25 score exhibited the greatest number of correlations. The WURS-
25 score exhibited significant correlations with perseverative errors, COWAT adjusted
score, and the SSRT average score and approached a significant correlation with the
verbal composite (p=058).
With respect to the ADHD group (Table 7) neither the verbal attentional composite
nor the nonverbal attention composite significantly correlated with any of the symptom
variables. As can be seen in the tables, the non-ADHD group showed a greater number of
cognitive-symptom correlations as well as a difference in the pattern of correlations.
48
Cognitive Variable Intercorrelations
A more striking set of findings appears among the cognitive variable intercorrelations.
Table 8 provides the cognitive variable intercorrelations for the full sample. When
examining the correlations among groups diagnosed via Method 1 diagnostic groups, the
non-ADHD group (Table 9) exhibited significant results for all ten correlations. However,
amongst the ADHD group only three significant correlations were found. As in the non-
ADHD group, the ADHD group did exhibit SSRT average score correlations of similar
direction and magnitude with both the verbal attention composite and the nonverbal
attentional composite. The third significant correlation involved the two attention
composites.
In order to determine whether the sizes of the correlations were significantly different,
Fisher�s R to Z transformations were completed and z-tests were conducted to compare
the Fisher�s Z scores. Of the 10 comparisons, 2 significant differences were found. The
correlation for the COWAT and verbal
composite was found to be significantly larger in the non-ADHD group than in the
ADHD group (z = 2.384, p<.05), this was also true for the COWAT-WCST correlation
(z=2.425, p<.05). Four other differences came close to significance;
the WCST-Verbal composite correlations, the COWAT-Nonverbal composite
correlations, and the SSRT correlations with both the WCST and the COWAT (p values
for these four ranging from .057 to .16), for these latter correlation comparions, the non-
ADHD group had larger correlations, compared to the ADHD group.
49
Next, the covariance matrices were examined to further support the notion that these
observed differences in correlations represented significant differences in the pattern of
correlation relationships between the two groups. This was done by determining the
Box�s M test of Equality of Covariance Matrices, which tests for the equality of the
variance/covariance matrices of the dependent variables among groups. In terms of the
case of the five cognitive variables used in this study, the 10 covariances are tested for
equality across groups. As hypothesized, this significant difference was found (Box�s M
= 30.210, p < .05).
Discussion
The results of this investigation showed mixed levels of support for the expected
findings. However, before discussing the specific findings, it is important to highlight that
throughout each method of diagnosis, the ADHD group and the non-ADHD group were
largely similar in that there were no significant differences in age, gender, or symptom
levels of depression and anxiety. The non-ADHD group did show a significantly higher
level of education, which may not be unexpected considering the detrimental effect that
ADHD symptomatology can have upon academic performance. Despite this difference,
the groups� similarities appeared well-suited for investigating group differences among
the cognitive variables.
An important area of note when interpreting the results of this investigation relates to
the method of diagnosis. The reliability and validity of adult ADHD diagnosis has been
an area of concern throughout the literature and the relatively new investigation in ADHD
as an adult disorder (Spencer, Biederman, Wilens, & Faraone, 1998, Biederman et al.,
50
1993, Roy-Byrne et al., 1997). In the current study, the ability to achieve a valid diagnosis
and determine whether participants either did or did not meet criteria for ADHD proved
to be a significant challenge. The clarity and validity of childhood recollections in order
to obtain an age of symptom onset also proved difficult; attempts to gather collateral
ratings of childhood behavior produced only minimal data. Considering these difficulties
the three previously noted methods for diagnosis were utilized for determining group
membership.
The analyses did result in significant findings for some of the expected differences,
while other expectations were not confirmed. Results of the MANCOVA analyses did
illustrate several significant group differences in the expected direction for the primary
measure of response inhibition (Stop-Signal Task). Both the ANCOVA analysis for
Method 2 diagnosis and Method 3 diagnosis produced significant findings in which the
ADHD group exhibited significantly longer SSRTs, which suggests greater difficulty in
inhibiting a response.
Other differences were found less reliably. A significant difference for WCST
perseverative errors, with the ADHD group committing the expected increase in errors
compared to the non-ADHD group was found for Method 3 diagnosis, but not for
Methods 1 or 2. Also the nonverbal attentional composite was found to be significantly
lower for the ADHD group than the non-ADHD group, but only when the second method
of diagnosis was used.
Lastly, a surprising finding was discovered concerning the COWAT. Counter to
expectations, the COWAT total score was found to be significantly higher for the ADHD
51
group than the non-ADHD group, when utilizing Method 1 and Method 3 diagnosis.
Using Method 2 diagnosis, the COWAT total score was found to be lower for the ADHD
group than the non-ADHD group, however this finding was not significant F (1,42) =
.558, p = .459.
One possibility for the differences in the pattern of findings, given different means of
diagnosing participants, may be found by examining the sample of participants. All
participants, whether students or outside community members, responded to an
announcement which listed some ADHD symptomatology and encouraged those who
may be experiencing these symptoms to participate in a research study. The groups were
created from those individuals who responded to the announcement, met inclusion criteria
and chose to participate in the study. It seems reasonable to suggest that perhaps these
groups were in many ways similar and nearly all the participants were experiencing some
level of attentional symptoms, but possibly for different reasons (e.g. depression, ADHD,
substance abuse, etc�). Also, the overall unexpectedly high COWAT results may have
been related to the high level of education in this sample.
Hypothesis #1
The first hypothesis of this study stated that the group of individuals who were
diagnosed with ADHD would show poorer inhibition, as measured by the cognitive
variables, than the non-ADHD group. This hypothesis was supported by the significant
ANCOVA results indicating that, for diagnosis Methods 2 and 3, the SSRT was
significantly greater for the ADHD group than the non-ADHD group. As previously
noted, Quay (1997) suggested that the Stop-Signal Task is the �best test of �pure�

52
disinhibition, that is not compounded by reward seeking� (p. 8). Despite positive findings
in previous studies in the current study, neither the CPT commission errors, nor the
Stroop variables were able to provide additional support for this hypothesis.
Further support for the validity of the SSRT finding appears when examining the
findings of the regression analyses. The SSRT average score was found to add
significantly to each regression equation in which the criterion variable was felt to include
some measure of disinhibition (interview total score, WURS 25 score, and the BIS total
score). Considering this finding, it does not seem unreasonable to suggest that the SSRT
findings are reliable and provide good support for hypothesis #1.
Hypothesis #2
The second hypothesis stated that the cognitive measures of inhibition would be better
predictors of ADHD symptoms than the other cognitive tests. Again the results suggest a
moderate amount of support for this hypothesis. To examine this hypothesis, three
regression equations were completed. Among the cognitive variables entered across all
three equations, only two of these variables were found to add significantly to any of the
models, the SSRT average score and the COWAT total score. In the equations which
used the interview total score and the BIS total score as the criterion variables, both of
these cognitive variables added significantly to the model. In the case of the interview
total score the COWAT accounted for 10.8% of the variance while the SSRT, after
inclusion of the years of education variable, accounted for an additional 9.1% of the
variance. The equation which utilized the BIS total score as the criterion variable showed
that after the STAI State score was entered, the SSRT score accounted for 7.6% of the
53
variance, while the COWAT score accounted for an additional 6.4%. For the regression
in which the WURS 25 score was used as the criterion variable, the SSRT accounted for
11.7% of the variance after the inclusion of years of education, whereas the COWAT did
not contribute significantly to the model.
The hypothesis does appear to be supported with respect to the WURS 25 score and the
BIS total score in that the SSRT contributed more to the model than any other cognitive
variable. In the case of the interview total score, the hypothesis is not supported as the
COWAT accounts for more variance than does the SSRT.
The previous note that among this sample using method 3 diagnoses the COWAT
total score was significantly higher for the ADHD group compared to the non-ADHD
group further complicates this finding. These findings are inconsistent with much of the
published literature (Grodzinsky and Diamond, 1992, Felton, Wood, Brown, Campbell,
and Harter, 1987, Fischer, Barkley, Edelbrock and Smallish, 1990). This is an unexpected
finding that eludes easy explanation. A possible and concerning explanation regards a
possible confound between verbal fluency and interview ratings. It appears possible that
those individuals who performed better on the COWAT, a purported reflection of
stronger verbal fluency, received a higher interview total score by virtue of enhanced
verbal fluency. That is, their responses to interview questions may have provided more
colorful or expanded examples of symptoms, which resulted in elevated scores in some
domains. Those with somewhat lowered verbal fluency may have provided more
abbreviated responses which resulted in lower scores and may not have been
representative of the true severity of their symptoms. If this were true, some individuals
54
may be incorrectly classified as a result of their verbal fluency rather than their ADHD
symptomatology. A possibility that suggests an additional difficulty in relying upon
interview data for diagnostic purposes. In fact, in terms of the full sample, the COWAT
adjusted score was significantly correlated with the interview total score (r =.304, p<.05),
while the WURS25 score and the COWAT were not significantly correlated (r=-.057,
p=.355).
Hypothesis #3
The third hypothesis predicted that the pattern of correlations between the cognitive
variables would differ between the groups. The results of Fisher R-Z transformations for
Method 1 diagnosis provided evidence that, for at least two of the cognitive variable
inter-correlations, the groups had significantly different correlation sizes; while four
others appeared to approach significance. The third hypothesis was also supported by a
significant Box�s M tests for Method 1 diagnosis. The latter results are illustrated by
Table 9 in which all 10 of the correlations were significant among the non-ADHD group,
while only three were significant among the ADHD group (Method 1 diagnosis).
As noted previously, no directional hypothesis were made regarding these
relationships, however it is interesting to note that the cognitive measures appeared to be
less strongly related among the diagnosed group. One possible interpretation may be that
among those with significant ADHD symptomatology there may be a disruption in how
various cognitive abilities work together. Another possible interpretation may be that
among those with ADHD there is greater variability in the concomitant cognitive tasks
55
rather than just a deficiency in these tasks. This is clearly an area in need of further
investigation.
Non-significant Results
An important area to consider in these results appears to be the lack of significant
findings. The results seem to illustrate the relative inability of several of the cognitive
variables to discriminate between the groups. As several of the variables were chosen for
this investigation due to previous research findings (CPT, WCST, COWAT) and others
for theoretical or intuitive reasons (Letter-Number Sequencing, Spatial Span) several
questions remain as to why these measures did not produce the expected findings. The
lack of group differences may be partly explained by the previous note regarding the
make-up of this sample. The inability of these measures to add to the regression equations
suggests they could not explain variance above and beyond the other entered variables,
not that the variables are unrelated. It is possible the power of these cognitive variables to
provide significant group differences or add to the regression models may have been
limited by the effects the symptom variables (anxiety and depression) may have had upon
these cognitive variables. Indeed the cognitive � symptom variable correlations were
significant among the non-ADHD participants. Another possible reason for the lack of
significant findings is pointed to by the advantages of the one variable that did produce
reliable findings, the SSRT. When comparing the SSRT to the other cognitive measures
several important differences appear.
In terms of the attentional measures, previously identified as the Spatial Span subtest,
the Letter-Number Sequencing subtest, and the CPT, the SSRT administration time is
56
considerably longer. In both the Spatial-Span subtest and the Letter-Number sequencing
subtest the participant is essentially required to pay attention for the amount of time
required to present the sequence, they then are granted a reprieve from attending in order
to attempt the sequence reproduction. The attentional focus required may truly be broken
into several rather short time periods rather then any extended attentional requirements.
Although the CPT does a somewhat better job by requiring strict visual attention for
nearly two-and-a-half minutes, this time period may also be somewhat short in order to
detect the type of attentional difficulties these adults may be experiencing. It is important
to note that despite the lack of findings in this study, both a 1998 study by Epstein,
Conners, Sitarenios and Erhardt, and a 1998 study by Gansler et al were able to
demonstrate that adults with ADHD committed significantly more omission errors than
healthy controls. Perhaps the sampling method used in this study hampered the ability to
detect such differences. On the other hand, there were results which found poorer
attention in the current ADHD group compared to the non-ADHD group.
In terms of the inhibition measures previously identified as the CPT and the Stroop
Color-Word Test, the Stop-Signal retains its time of administration advantage, thus
allowing more time and opportunity for impulsive responding. A possibly more important
advantage of the Stop-Signal may be found in the method of measuring inhibition. For
both the CPT and the Stroop measure, impulsive responding is an either-or event, it did
happen or it did not happen. The mechanism of the Stop-Signal works to achieve a
commission error on 50% of the responses. Since each participant will complete roughly
the same number of commission errors, this value is no longer useful. Instead, a more
57
sensitive measure is required; the Stop-Signal Reaction time. Pages 19-22 illustrate the
mechanics of the Stop-Signal task and explains why the SSRT may be considered a timed
measure of the inhibitory process. What is measured as yes or no by the Stroop and the
CPT is measured in milliseconds by the Stop-Signal. It seems that this method is likely a
more sensitive measure of cognitive processing and hence more likely to produce
significant findings. Perhaps this is the crucial difference, the CPT and the Stroop are not
sensitive enough to provide a meaningful measure of inhibition in these adults. Again, the
results in this study did not replicate previous findings published by Epstein, Conners,
Sitarenios, and Erhardt (1998) and Gansler et al., (1998) which reported ADHD adults
produced significantly more commission errors than normal adults did. Although both of
these samples appear to be of a similar mean age to the sample in this study it is unclear
how closely these samples matched my own in terms of education, and depressive and
anxious symptoms; perhaps these variables account for the differences in significant
results.
The frontal lobe/executive measures, the WCST and the COWAT may be suffering a
fate similar to the CPT and the Stroop. That is, they are simply not sensitive enough
measures to provide reliable differences. Research related to the performance of ADHD
individuals upon the WCST has been somewhat inconsistent. As previously noted, a 1992
review study by Barkley, Grodinsky and Dupaul noted 13 studies that investigated WCST
performance among ADHD individuals. Of these 13 studies, 8 reported significant
findings while 5 others did not. The authors noted that none of the affirmative studies
included adolescents or adults and suggested that the WCST may not be sensitive to
58
deficient frontal lobe functioning in these individuals whose frontal lobes have matured
with age. Results from Moffitt and Silva (1988) and Fischer, Barkley, Edelbrock, and
Smallish appear to support this interpretation. However this interpretation may be refuted
by the findings of Seidman, Biederman, Faraone, Weber, and Ouellete (1997) that were
able to demonstrate significant deficits among adolescent and adult ADHD participants
relative to controls. The results of this study may have also been compromised by the use
of a modified and possibly easier Spaulding WCST, as described in the introduction.
Research relevant to the COWAT shows a similar pattern of less reliable findings in
older participants. Of the three articles noted previously, the two which tested children
between the ages of 6 and 12 (Grodzinsky and Diamond, 1992, Felton, Wood, Brown,
Campbell, and Harter, 1987) found significantly poorer performance among ADHD
children while the study which tested 12-20 year-olds did not find a similar deficit for the
ADHD participants. My finding that the ADHD individuals performed more highly than
the non-ADHD individuals does not appear to have been reported previously, but may
perhaps be explained by the previous noted confound between verbal fluency and
interview ratings.
Support for Barkley�s Model
The body of this report presented Barkley�s Model of Self-Regulation in which he
proposes behavioral inhibition as the critical variable which produces the symptoms of
ADHD. Examining the most consistent results of this investigation, it appears that I have
found support for Barkley�s model. Behavioral inhibition as measured by the SSRT
59
proved to be the most reliable cognitive finding both in the group analyses and in
accounting for the symptoms of ADHD via multiple regression.
Barkley noted that previous research on Childhood ADHD has been unable to
consistently document an attentional deficit (Schachar, R.J., Tannock, R., & Logan, G.D.,
1993, Schacher, R.J., Tannock, R., Marriot, M., & Logan, G., 1995, Van der Meere, J., &
Sergeant, J., 1988a, 1988b.); a notion that was generally supported in this study of adult
ADHD. However, Barkley�s model also suggests that poor inhibition will lead to
difficulties in working memory and reconstitution, skills which are purported to be
measured by the Letter-Number Sequencing subtest, the Spatial Span subtest, the WCST,
and the COWAT. Support for Barkley�s model appears in Table 8 which shows the SSRT
to be significantly negatively correlated with the attentional composites and COWAT,
while significantly positively correlated with the WCST perseverative errors. Most
impressive is that the SSRT is significantly correlated with attention in both the full
sample, as well as in each separate sample. Taken together, the results follow the exact
pattern that Barkley�s model suggests.
Limitations of the Current Study
The limitations of this study need to be mentioned. First, the relatively small
number of participants limited the power of the statistical analyses. An additional
limitation of this study was the lack of collateral report of both current and childhood
symptoms of ADHD. An interview, which may have been conducted with a member of
the participant�s close friends or family, may have helped to produce a somewhat clearer
or more accurate symptom picture and thus a more valid and reliable diagnosis. While the
60
groups did exhibit similar symptoms of anxiety and depression, these comorbid
conditions may have affected the symptom constellations. A sample, which further
excluded those individuals who exhibited tendencies towards other psychopathology, may
have been more effective in identifying the basic processes associated with ADHD.
However it is likely that such a sample would have been very difficult to obtain and not
representative of the majority of ADHD sufferers. The use of a problem-identified sample
more closely recreates the job that clinicians are asked to do when attempting to diagnose
ADHD in clinical populations.
Future Directions
There appears a wealth of future directions for research in the field of ADHD. One
important future investigation may be the replication of this study among a childhood
population. The advantage of such a study would be the relatively more established
diagnosis of childhood ADHD as well as the more consistent findings of deficits on
executive functions tasks. Should a childhood study produce similar findings in regard to
the SSRT, while also producing significant findings in regards to the other cognitive
measures, Barkley�s theory may be more strongly supported. An additional study, which
included a larger number of participants, may have the advantage of separating the
ADHD subgroups thus investigating Barkley�s theory of inhibition as the primary deficit
at the subgroup level. Some have suggested that the predominantly inattentive subtype
and the combined or predominantly hyperactive subtype are really representative of
separate cognitive subtypes (Gansler et al., 1998). Perhaps a validation of this type of
hypothesis could be generated from a direct comparison between these two groups on the
61
Stop-Signal task. While inhibition may still be identified as the primary deficit, it may
prove to have varying effects on the attentional and executive functions of the different
subgroups. This result would point towards more than one pathway for disinhibition to
disrupt executive and attentional functioning and create the symptoms of ADHD. Further
analysis of the pattern of correlations between the cognitive variables may help us to
better understand the effects of disinhibition on various cognitive and executive tasks.
Expanding this analysis into the pattern of correlations between the
cognitive and symptom variables may also prove enlightening.
Clinical Implications
The results of this study and Barkley�s model places a newfound importance on
inhibitory capacity rather than attentional dysfunction as the primary deficit in ADHD.
This shifting of focus in the research of ADHD would also be beneficial in the treatment
of ADHD. Treatment programs which are designed to help increase an individual�s
inhibitory capacity and lessen the occurrence and frequency of impulsive responding may
prove more successful in alleviating the symptoms of ADHD than previous programs
whose focus was attention difficulties. Re-educating parents, teachers, clients, and
clinicians to conceptualize ADHD in terms of poor response inhibition may lead to
greater tolerance, more varied and effective interventions, and eventually greater
treatment success in various settings. Drug efficacy may be more accurately or properly
established by measuring a drug�s effect on impulsivity, thus treating the disorder�s
primary deficit rather than the symptoms of that deficit. This new focus on poor response
inhibition may also prove helpful in examining and treating the comorbid disorders

62
associated with ADHD, especially Antisocial Personality Disorder and substance abuse
disorders.

63
APPENDIX A
TABLES
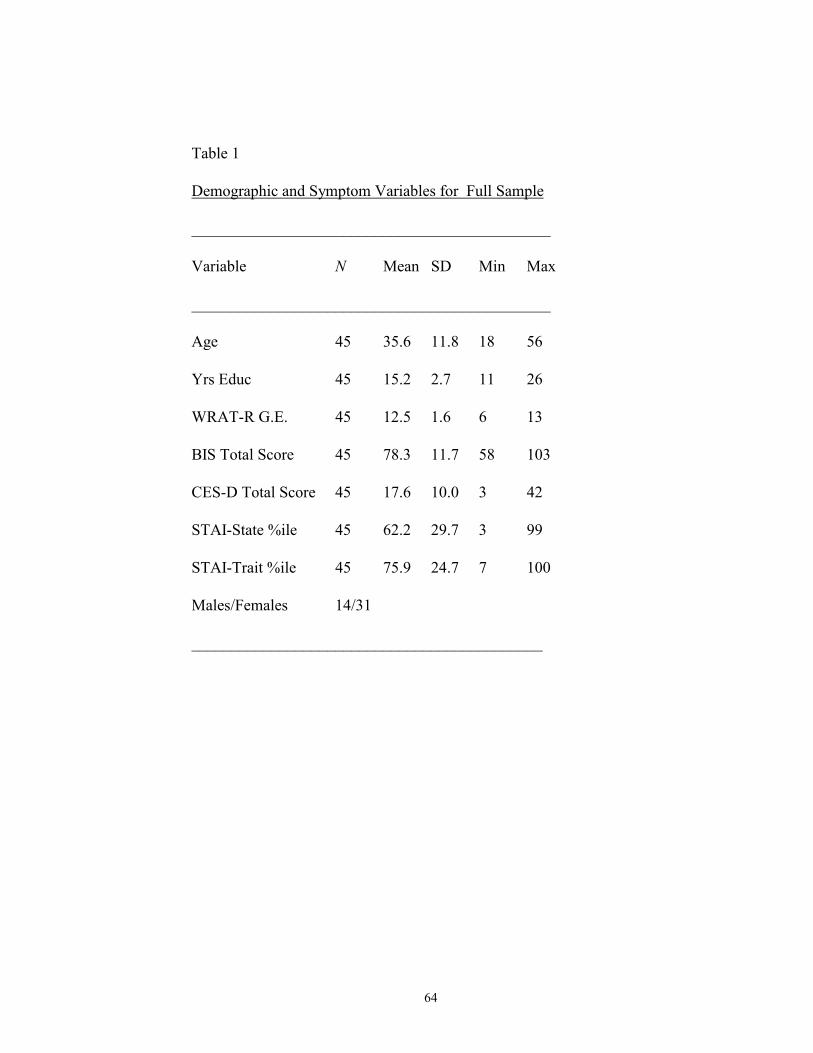
64
Table 1
Demographic and Symptom Variables for Full Sample
_____________________________________________
Variable N Mean SD Min Max
_____________________________________________
Age 45 35.6 11.8 18 56
Yrs Educ 45 15.2 2.7 11 26
WRAT-R G.E. 45 12.5 1.6 6 13
BIS Total Score 45 78.3 11.7 58 103
CES-D Total Score 45 17.6 10.0 3 42
STAI-State %ile 45 62.2 29.7 3 99
STAI-Trait %ile 45 75.9 24.7 7 100
Males/Females 14/31
____________________________________________
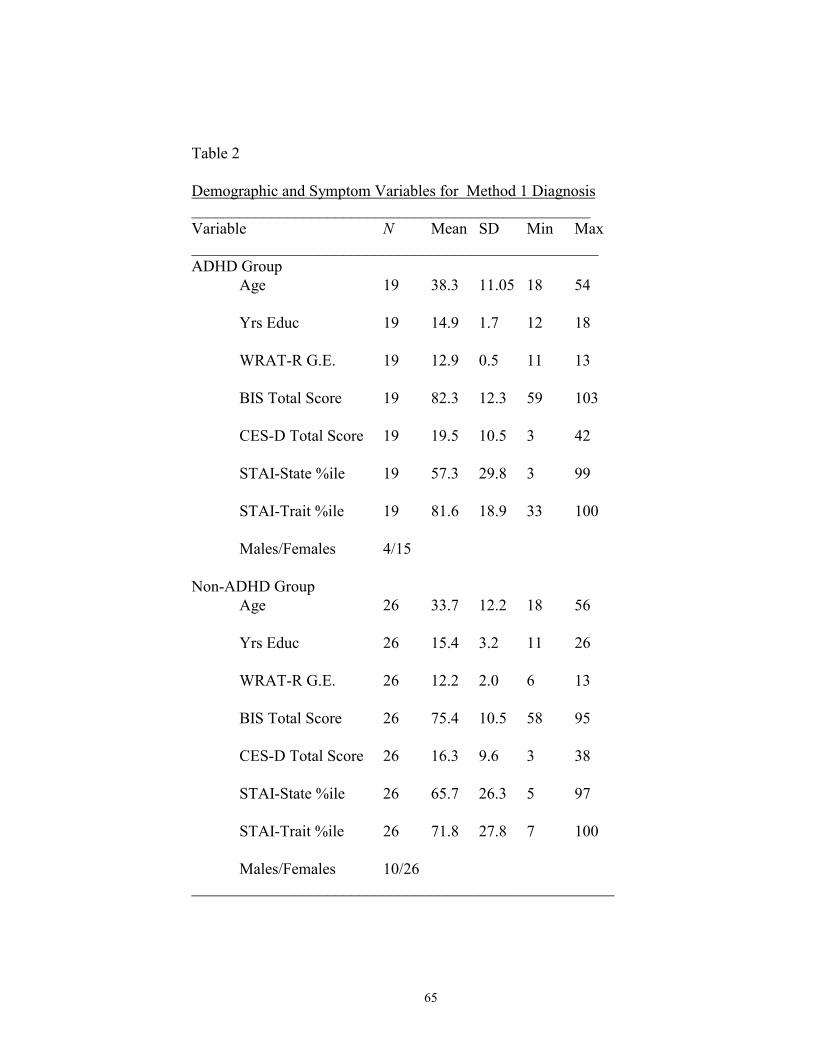
65
Table 2
Demographic and Symptom Variables for Method 1 Diagnosis__________________________________________________Variable N Mean SD Min Max___________________________________________________ADHD Group
Age 19 38.3 11.05 18 54
Yrs Educ 19 14.9 1.7 12 18
WRAT-R G.E. 19 12.9 0.5 11 13
BIS Total Score 19 82.3 12.3 59 103
CES-D Total Score 19 19.5 10.5 3 42
STAI-State %ile 19 57.3 29.8 3 99
STAI-Trait %ile 19 81.6 18.9 33 100
Males/Females 4/15
Non-ADHD GroupAge 26 33.7 12.2 18 56
Yrs Educ 26 15.4 3.2 11 26
WRAT-R G.E. 26 12.2 2.0 6 13
BIS Total Score 26 75.4 10.5 58 95
CES-D Total Score 26 16.3 9.6 3 38
STAI-State %ile 26 65.7 26.3 5 97
STAI-Trait %ile 26 71.8 27.8 7 100
Males/Females 10/26_____________________________________________________

66
Table 3
Demographic and Symptom Variables for Method 2 Diagnosis___________________________________________________Variable N Mean SD Min Max___________________________________________________ADHD Group
Age 23 35 11.1 18 56
Yrs Educ 23 14.2 2.1 11 20
WRAT-R G.E. 23 12.3 1.8 6 13
BIS Total Score 23 83.1 11.3 58 102
CES-D Total Score 23 19.7 10.9 3 42
STAI-State %ile 23 67.1 29.5 3 98
STAI-Trait %ile 23 76.0 22.8 33 100
Males/Females 7/16
Non-ADHD GroupAge 22 36.3 12.8 18 54
Yrs Educ 22 16.3 2.8 12 26
WRAT-R G.E. 22 12.6 1.3 7 13
BIS Total Score 22 73.2 9.9 59 103
CES-D Total Score 22 15.5 8.7 3 36
STAI-State %ile 22 57.0 29.7 5 99
STAI-Trait %ile 22 75.8 27.1 7 100
Males/Females 7/15___________________________________________________
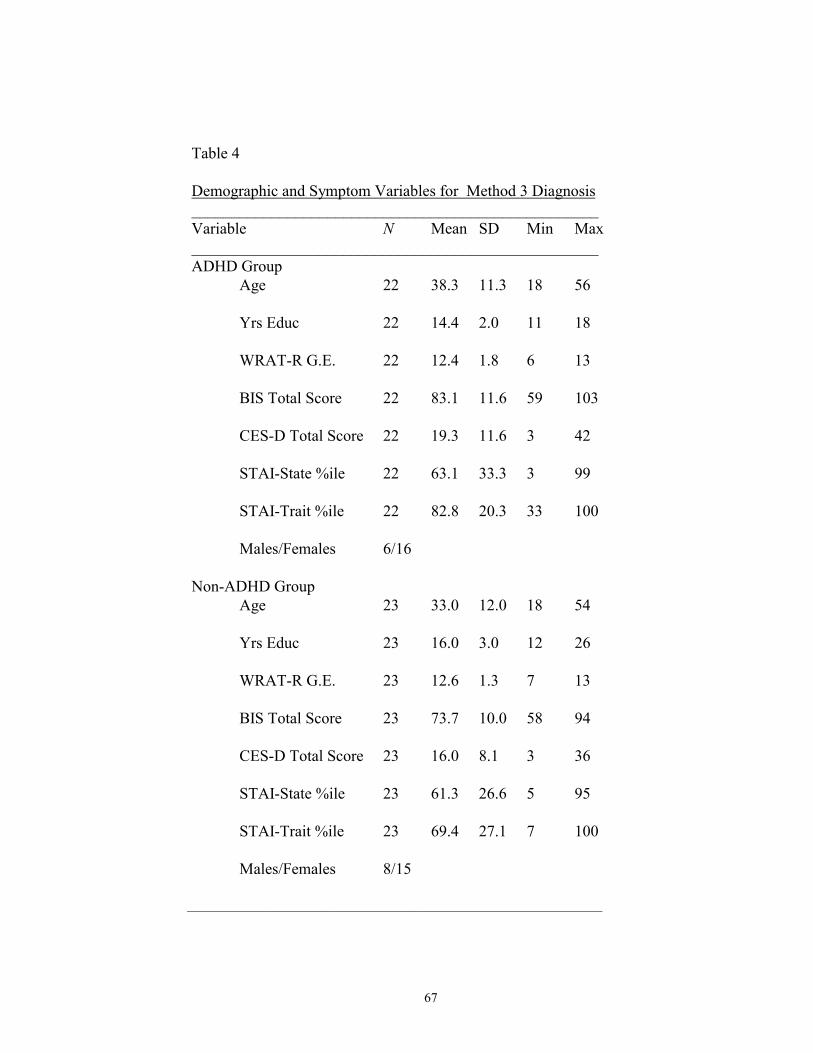
67
Table 4
Demographic and Symptom Variables for Method 3 Diagnosis___________________________________________________Variable N Mean SD Min Max___________________________________________________ADHD Group
Age 22 38.3 11.3 18 56
Yrs Educ 22 14.4 2.0 11 18
WRAT-R G.E. 22 12.4 1.8 6 13
BIS Total Score 22 83.1 11.6 59 103
CES-D Total Score 22 19.3 11.6 3 42
STAI-State %ile 22 63.1 33.3 3 99
STAI-Trait %ile 22 82.8 20.3 33 100
Males/Females 6/16
Non-ADHD GroupAge 23 33.0 12.0 18 54
Yrs Educ 23 16.0 3.0 12 26
WRAT-R G.E. 23 12.6 1.3 7 13
BIS Total Score 23 73.7 10.0 58 94
CES-D Total Score 23 16.0 8.1 3 36
STAI-State %ile 23 61.3 26.6 5 95
STAI-Trait %ile 23 69.4 27.1 7 100
Males/Females 8/15
______________________________________________________________
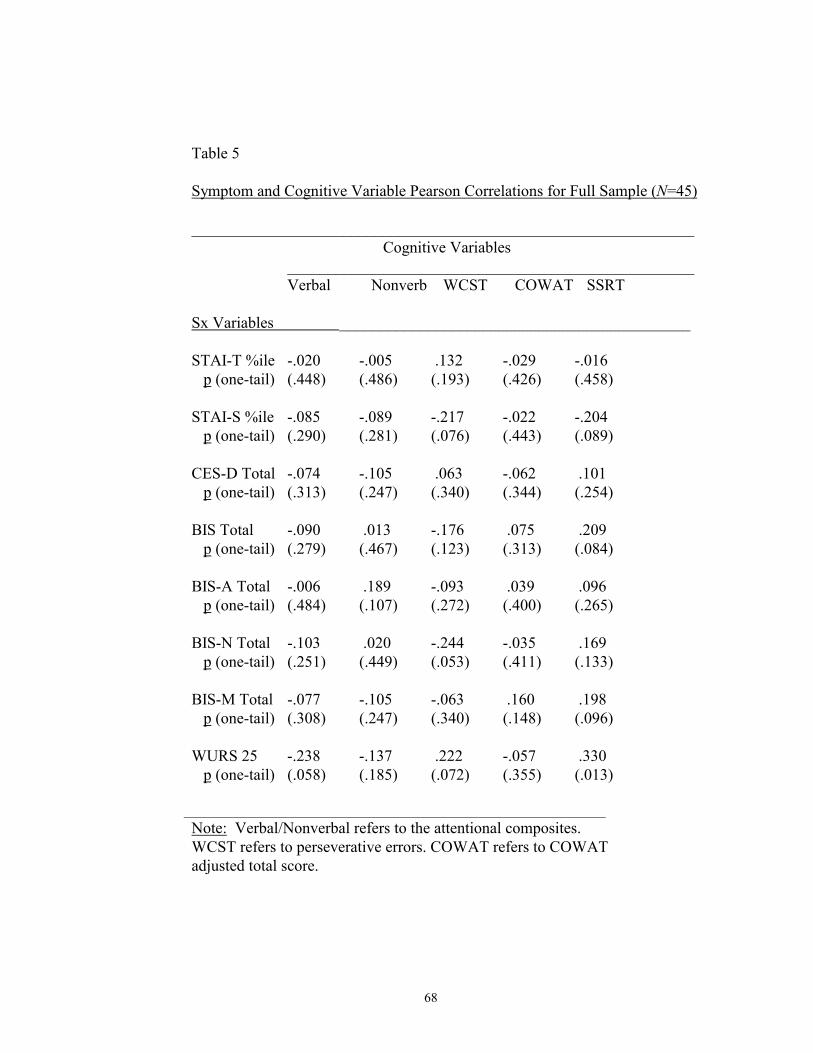
68
Table 5
Symptom and Cognitive Variable Pearson Correlations for Full Sample (N=45)
_______________________________________________________________Cognitive Variables
___________________________________________________Verbal Nonverb WCST COWAT SSRT
Sx Variables ____________________________________________
STAI-T %ile -.020 -.005 .132 -.029 -.016 p (one-tail) (.448) (.486) (.193) (.426) (.458)
STAI-S %ile -.085 -.089 -.217 -.022 -.204 p (one-tail) (.290) (.281) (.076) (.443) (.089)
CES-D Total -.074 -.105 .063 -.062 .101 p (one-tail) (.313) (.247) (.340) (.344) (.254)
BIS Total -.090 .013 -.176 .075 .209 p (one-tail) (.279) (.467) (.123) (.313) (.084)
BIS-A Total -.006 .189 -.093 .039 .096 p (one-tail) (.484) (.107) (.272) (.400) (.265)
BIS-N Total -.103 .020 -.244 -.035 .169 p (one-tail) (.251) (.449) (.053) (.411) (.133)
BIS-M Total -.077 -.105 -.063 .160 .198 p (one-tail) (.308) (.247) (.340) (.148) (.096)
WURS 25 -.238 -.137 .222 -.057 .330 p (one-tail) (.058) (.185) (.072) (.355) (.013)
_______________________________________________________________
Note: Verbal/Nonverbal refers to the attentional composites.WCST refers to perseverative errors. COWAT refers to COWATadjusted total score.
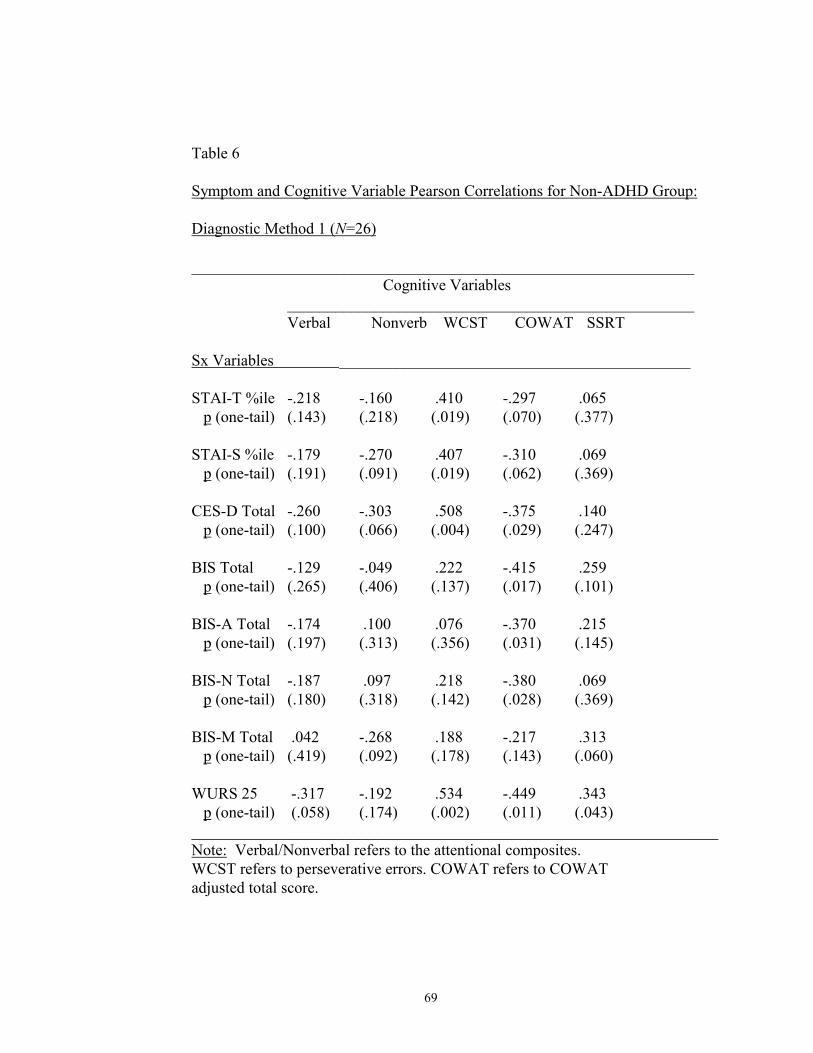
69
Table 6
Symptom and Cognitive Variable Pearson Correlations for Non-ADHD Group:
Diagnostic Method 1 (N=26)
_______________________________________________________________Cognitive Variables
___________________________________________________Verbal Nonverb WCST COWAT SSRT
Sx Variables ____________________________________________
STAI-T %ile -.218 -.160 .410 -.297 .065 p (one-tail) (.143) (.218) (.019) (.070) (.377)
STAI-S %ile -.179 -.270 .407 -.310 .069 p (one-tail) (.191) (.091) (.019) (.062) (.369)
CES-D Total -.260 -.303 .508 -.375 .140 p (one-tail) (.100) (.066) (.004) (.029) (.247)
BIS Total -.129 -.049 .222 -.415 .259 p (one-tail) (.265) (.406) (.137) (.017) (.101)
BIS-A Total -.174 .100 .076 -.370 .215 p (one-tail) (.197) (.313) (.356) (.031) (.145)
BIS-N Total -.187 .097 .218 -.380 .069 p (one-tail) (.180) (.318) (.142) (.028) (.369)
BIS-M Total .042 -.268 .188 -.217 .313 p (one-tail) (.419) (.092) (.178) (.143) (.060)
WURS 25 -.317 -.192 .534 -.449 .343 p (one-tail) (.058) (.174) (.002) (.011) (.043)__________________________________________________________________Note: Verbal/Nonverbal refers to the attentional composites.WCST refers to perseverative errors. COWAT refers to COWATadjusted total score.
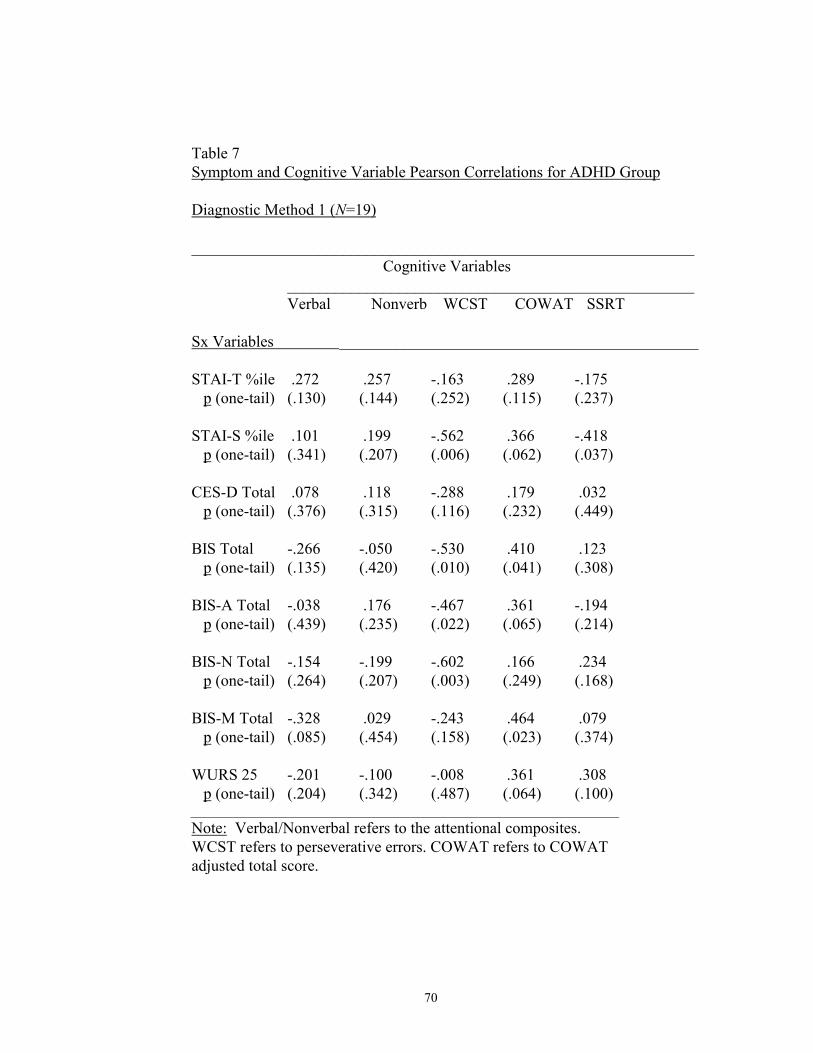
70
Table 7Symptom and Cognitive Variable Pearson Correlations for ADHD Group
Diagnostic Method 1 (N=19)
_______________________________________________________________Cognitive Variables
___________________________________________________Verbal Nonverb WCST COWAT SSRT
Sx Variables _____________________________________________
STAI-T %ile .272 .257 -.163 .289 -.175 p (one-tail) (.130) (.144) (.252) (.115) (.237)
STAI-S %ile .101 .199 -.562 .366 -.418 p (one-tail) (.341) (.207) (.006) (.062) (.037)
CES-D Total .078 .118 -.288 .179 .032 p (one-tail) (.376) (.315) (.116) (.232) (.449)
BIS Total -.266 -.050 -.530 .410 .123 p (one-tail) (.135) (.420) (.010) (.041) (.308)
BIS-A Total -.038 .176 -.467 .361 -.194 p (one-tail) (.439) (.235) (.022) (.065) (.214)
BIS-N Total -.154 -.199 -.602 .166 .234 p (one-tail) (.264) (.207) (.003) (.249) (.168)
BIS-M Total -.328 .029 -.243 .464 .079 p (one-tail) (.085) (.454) (.158) (.023) (.374)
WURS 25 -.201 -.100 -.008 .361 .308 p (one-tail) (.204) (.342) (.487) (.064) (.100)
________________________________________________________________
Note: Verbal/Nonverbal refers to the attentional composites.WCST refers to perseverative errors. COWAT refers to COWATadjusted total score.
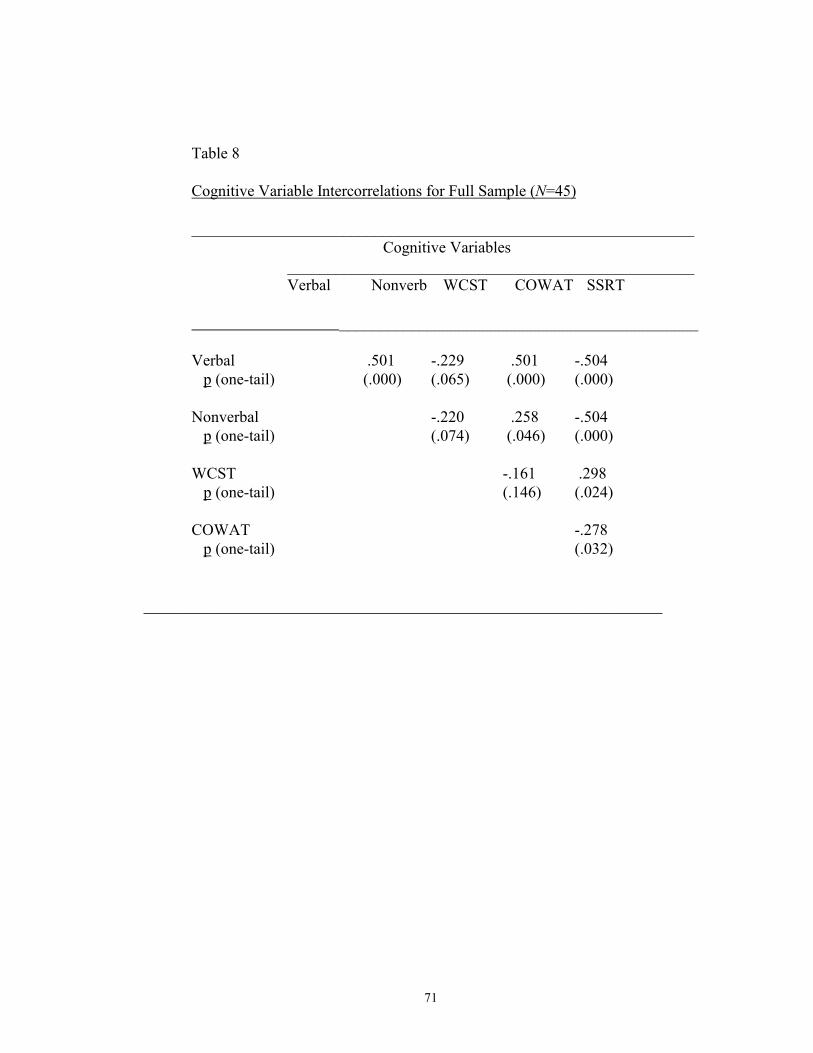
71
Table 8
Cognitive Variable Intercorrelations for Full Sample (N=45)
_______________________________________________________________Cognitive Variables
___________________________________________________Verbal Nonverb WCST COWAT SSRT
_____________________________________________
Verbal .501 -.229 .501 -.504 p (one-tail) (.000) (.065) (.000) (.000)
Nonverbal -.220 .258 -.504 p (one-tail) (.074) (.046) (.000)
WCST -.161 .298 p (one-tail) (.146) (.024)
COWAT -.278 p (one-tail) (.032)
_________________________________________________________________
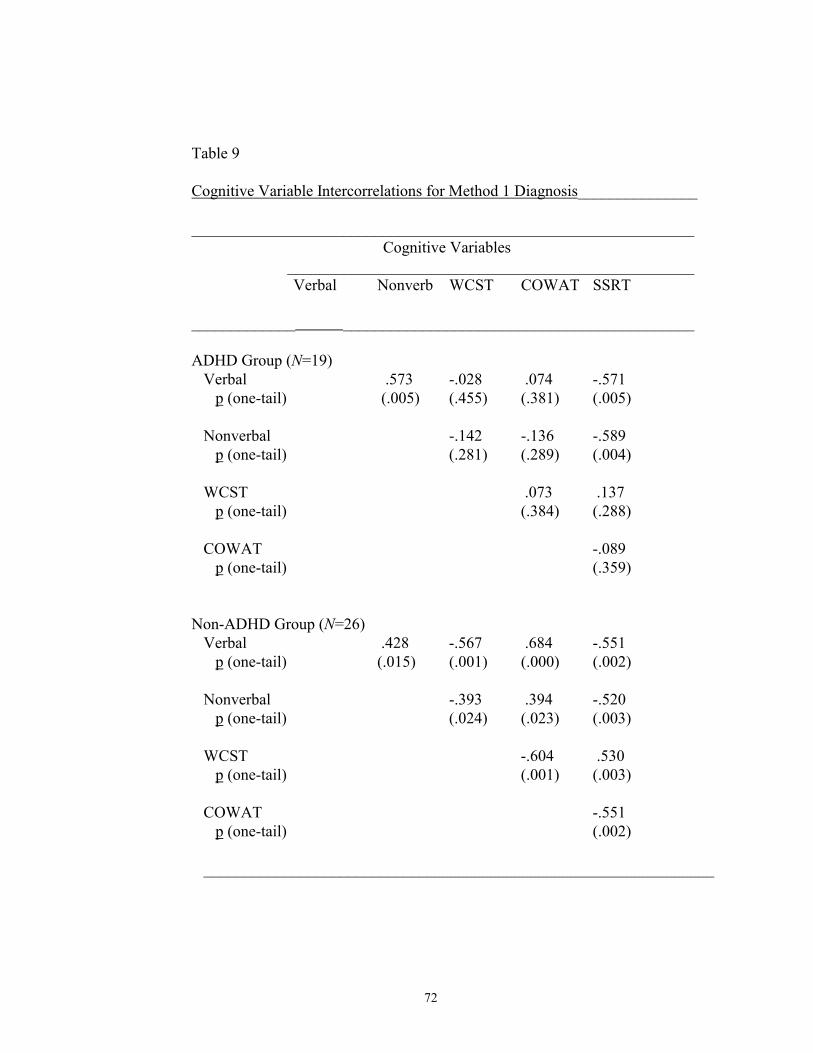
72
Table 9
Cognitive Variable Intercorrelations for Method 1 Diagnosis_______________
_______________________________________________________________Cognitive Variables
___________________________________________________Verbal Nonverb WCST COWAT SSRT
_____________ ____________________________________________
ADHD Group (N=19) Verbal .573 -.028 .074 -.571 p (one-tail) (.005) (.455) (.381) (.005)
Nonverbal -.142 -.136 -.589 p (one-tail) (.281) (.289) (.004)
WCST .073 .137 p (one-tail) (.384) (.288)
COWAT -.089 p (one-tail) (.359)
Non-ADHD Group (N=26) Verbal .428 -.567 .684 -.551 p (one-tail) (.015) (.001) (.000) (.002)
Nonverbal -.393 .394 -.520 p (one-tail) (.024) (.023) (.003)
WCST -.604 .530 p (one-tail) (.001) (.003)
COWAT -.551 p (one-tail) (.002)
________________________________________________________________

73
APPENDIX B
FORMS AND MEASURES
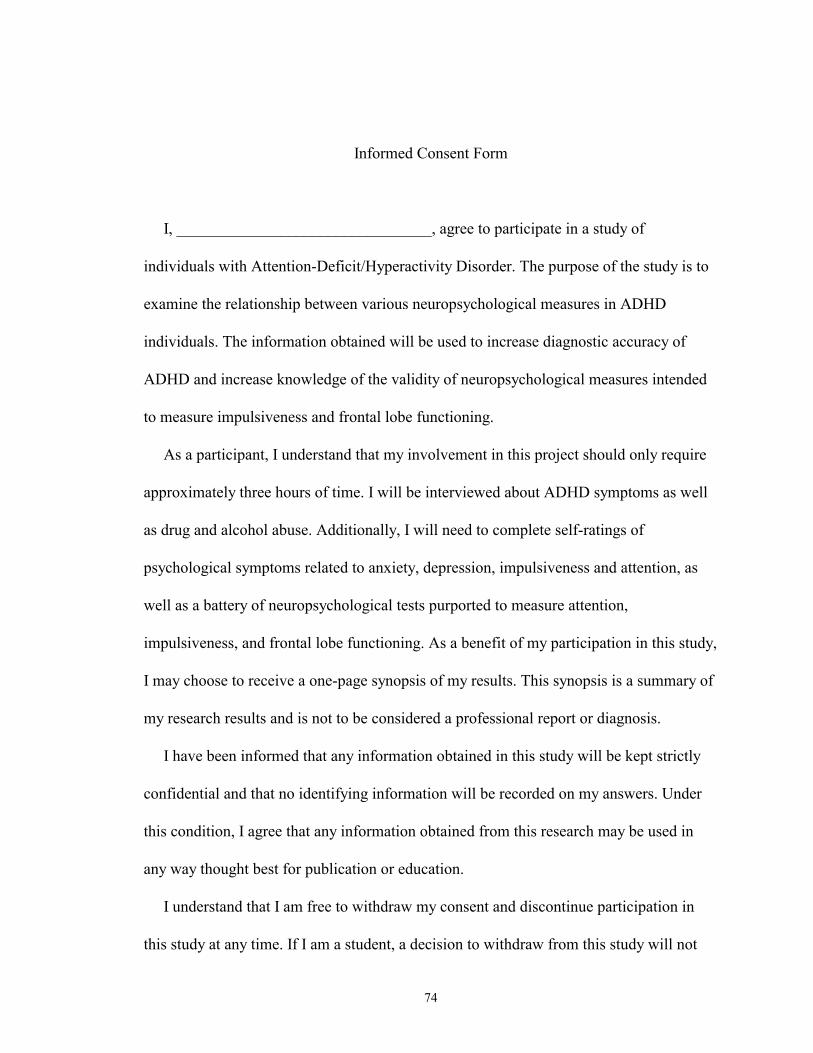
74
Informed Consent Form
I, ________________________________, agree to participate in a study of
individuals with Attention-Deficit/Hyperactivity Disorder. The purpose of the study is to
examine the relationship between various neuropsychological measures in ADHD
individuals. The information obtained will be used to increase diagnostic accuracy of
ADHD and increase knowledge of the validity of neuropsychological measures intended
to measure impulsiveness and frontal lobe functioning.
As a participant, I understand that my involvement in this project should only require
approximately three hours of time. I will be interviewed about ADHD symptoms as well
as drug and alcohol abuse. Additionally, I will need to complete self-ratings of
psychological symptoms related to anxiety, depression, impulsiveness and attention, as
well as a battery of neuropsychological tests purported to measure attention,
impulsiveness, and frontal lobe functioning. As a benefit of my participation in this study,
I may choose to receive a one-page synopsis of my results. This synopsis is a summary of
my research results and is not to be considered a professional report or diagnosis.
I have been informed that any information obtained in this study will be kept strictly
confidential and that no identifying information will be recorded on my answers. Under
this condition, I agree that any information obtained from this research may be used in
any way thought best for publication or education.
I understand that I am free to withdraw my consent and discontinue participation in
this study at any time. If I am a student, a decision to withdraw from this study will not

75
affect my status in the class. If I have any questions or problems that arise in connection
with my participation in this study, I should contact Dr. Craig Neumann, the program
director at (940) 565-3788.
_____________________________________
Signature Date
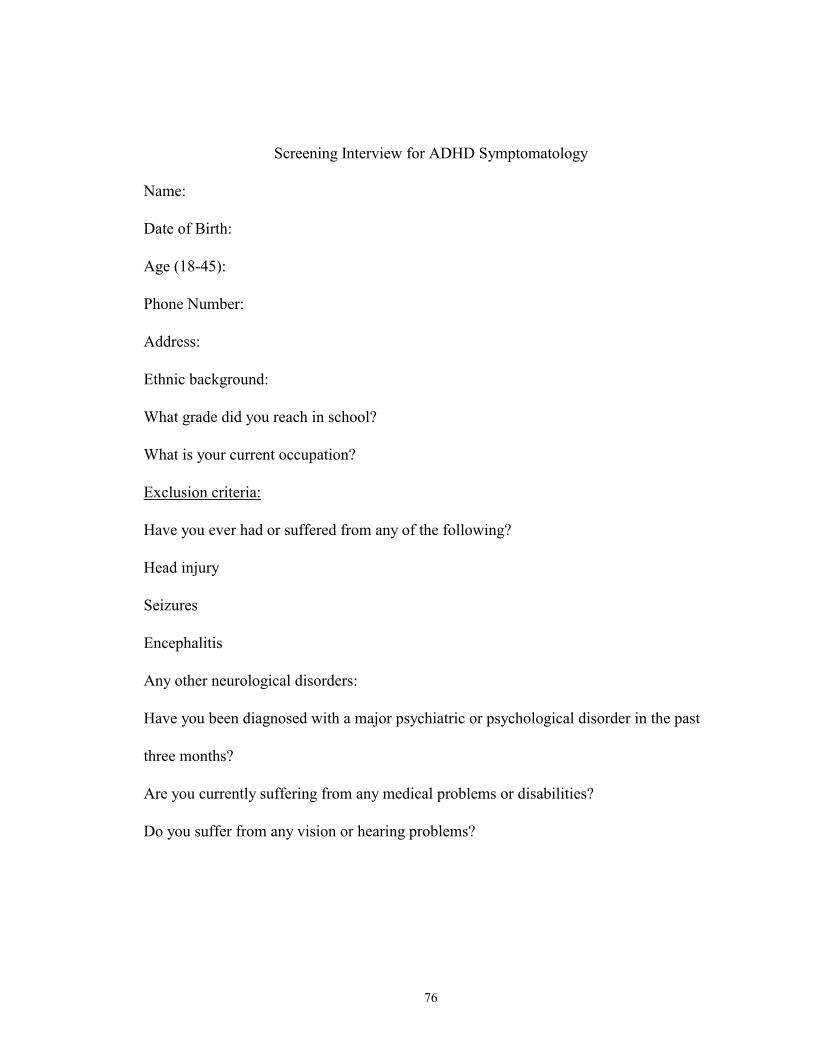
76
Screening Interview for ADHD Symptomatology
Name:
Date of Birth:
Age (18-45):
Phone Number:
Address:
Ethnic background:
What grade did you reach in school?
What is your current occupation?
Exclusion criteria:
Have you ever had or suffered from any of the following?
Head injury
Seizures
Encephalitis
Any other neurological disorders:
Have you been diagnosed with a major psychiatric or psychological disorder in the past
three months?
Are you currently suffering from any medical problems or disabilities?
Do you suffer from any vision or hearing problems?
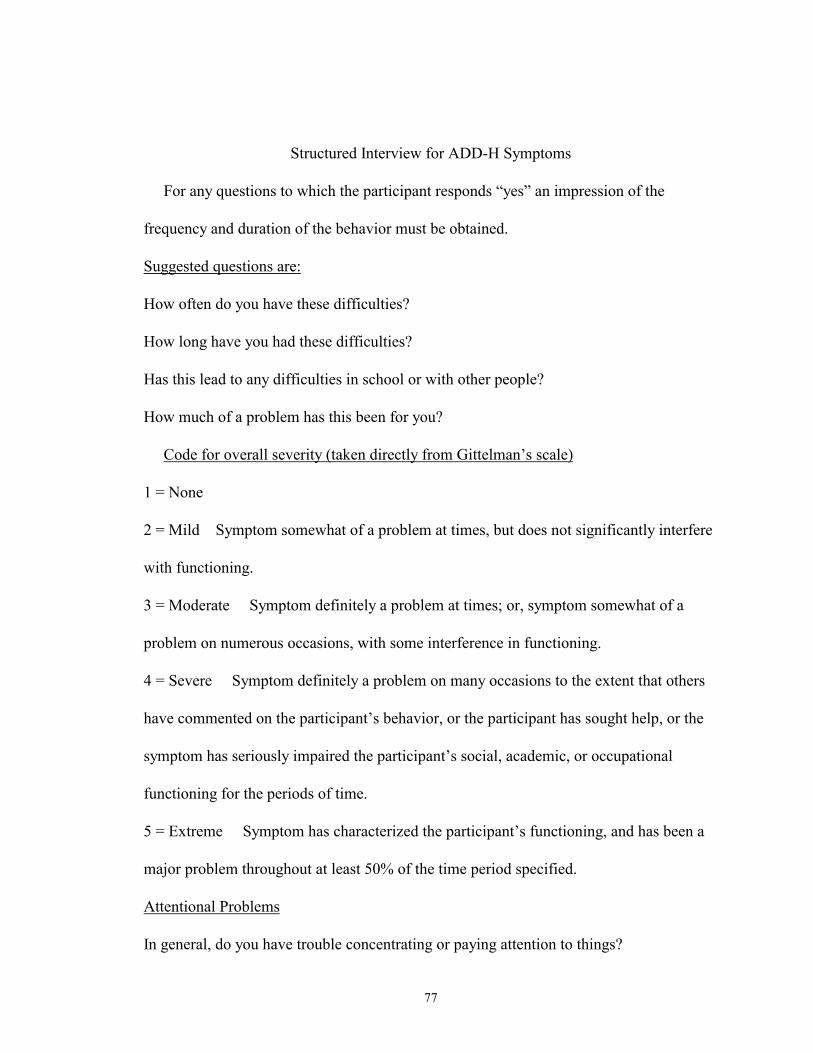
77
Structured Interview for ADD-H Symptoms
For any questions to which the participant responds �yes� an impression of the
frequency and duration of the behavior must be obtained.
Suggested questions are:
How often do you have these difficulties?
How long have you had these difficulties?
Has this lead to any difficulties in school or with other people?
How much of a problem has this been for you?
Code for overall severity (taken directly from Gittelman�s scale)
1 = None
2 = Mild Symptom somewhat of a problem at times, but does not significantly interfere
with functioning.
3 = Moderate Symptom definitely a problem at times; or, symptom somewhat of a
problem on numerous occasions, with some interference in functioning.
4 = Severe Symptom definitely a problem on many occasions to the extent that others
have commented on the participant�s behavior, or the participant has sought help, or the
symptom has seriously impaired the participant�s social, academic, or occupational
functioning for the periods of time.
5 = Extreme Symptom has characterized the participant�s functioning, and has been a
major problem throughout at least 50% of the time period specified.
Attentional Problems
In general, do you have trouble concentrating or paying attention to things?
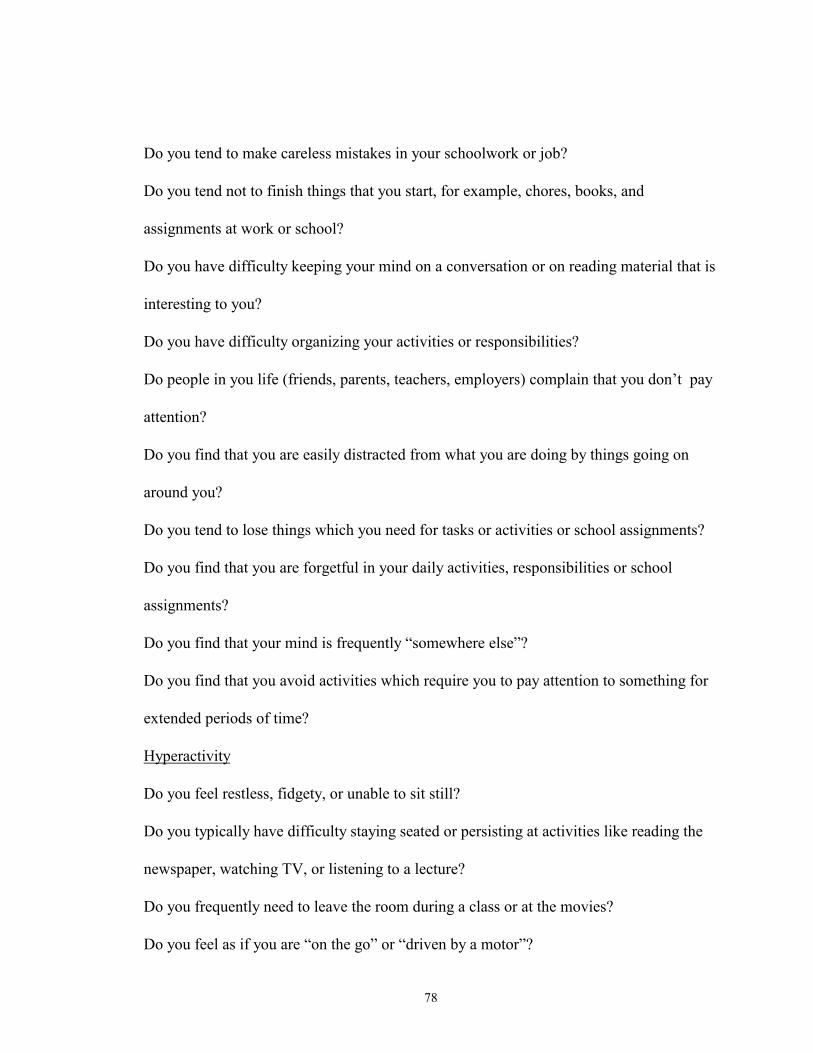
78
Do you tend to make careless mistakes in your schoolwork or job?
Do you tend not to finish things that you start, for example, chores, books, and
assignments at work or school?
Do you have difficulty keeping your mind on a conversation or on reading material that is
interesting to you?
Do you have difficulty organizing your activities or responsibilities?
Do people in you life (friends, parents, teachers, employers) complain that you don�t pay
attention?
Do you find that you are easily distracted from what you are doing by things going on
around you?
Do you tend to lose things which you need for tasks or activities or school assignments?
Do you find that you are forgetful in your daily activities, responsibilities or school
assignments?
Do you find that your mind is frequently �somewhere else�?
Do you find that you avoid activities which require you to pay attention to something for
extended periods of time?
Hyperactivity
Do you feel restless, fidgety, or unable to sit still?
Do you typically have difficulty staying seated or persisting at activities like reading the
newspaper, watching TV, or listening to a lecture?
Do you frequently need to leave the room during a class or at the movies?
Do you feel as if you are �on the go� or �driven by a motor�?
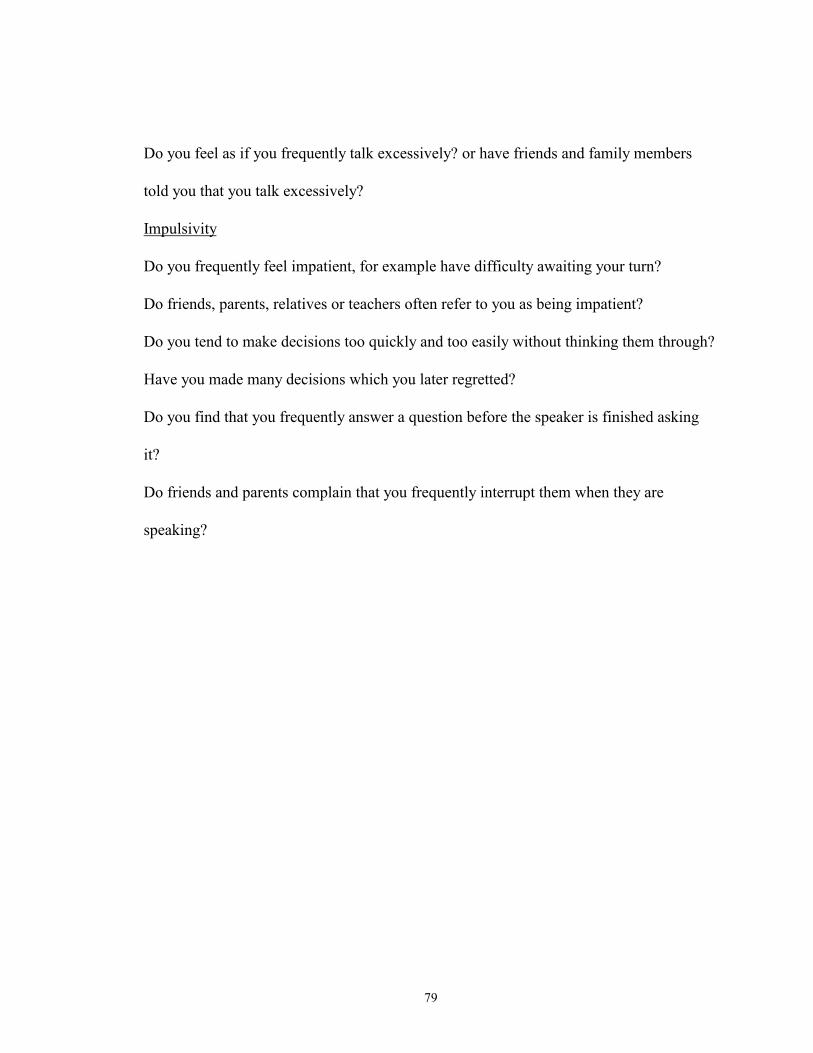
79
Do you feel as if you frequently talk excessively? or have friends and family members
told you that you talk excessively?
Impulsivity
Do you frequently feel impatient, for example have difficulty awaiting your turn?
Do friends, parents, relatives or teachers often refer to you as being impatient?
Do you tend to make decisions too quickly and too easily without thinking them through?
Have you made many decisions which you later regretted?
Do you find that you frequently answer a question before the speaker is finished asking
it?
Do friends and parents complain that you frequently interrupt them when they are
speaking?

80
Wender Utah Rating Scale
The 61 items are ranked at one of the five following severity levels: Not at all or very
slightly, Mildly, Moderately, Quite a bit, Very much.
As a child I was (or had):
1. Active, restless, always on the go
2. Afraid of things
3. Concentration problems, easily distracted
4. Anxious, worrying
5. Nervous, fidgety
6. Inattentive, daydreaming
7. Hot- or short-tempered, low boiling point
8. Shy, sensitive
9. Temper outbursts, tantrums
10. Trouble with stick-to-it-tiveness, not following through, failing to finish things started
11. Stubborn, strong willed
12. Sad or blue, depressed, unhappy
13. Incautious, dare-devilish, involved in pranks
14. Not getting a kick out of things, dissatisfied with life
15. Disobedient with parents, rebellious, sassy
16. Low opinion of myself
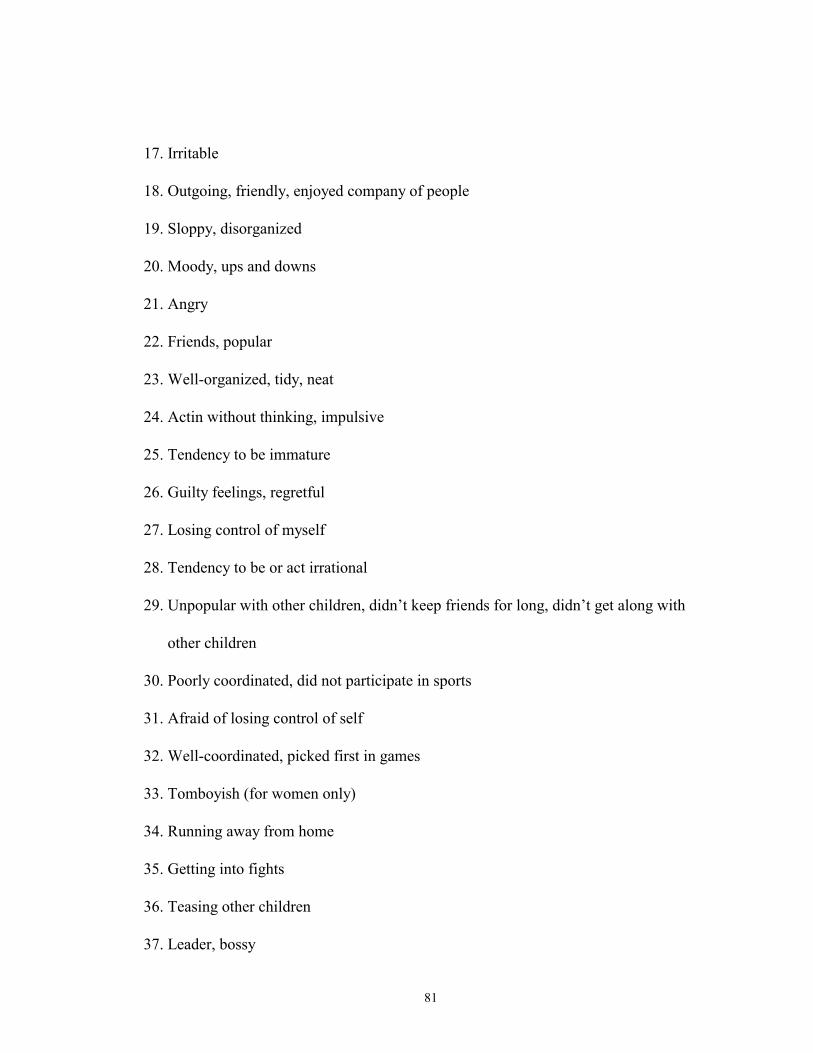
81
17. Irritable
18. Outgoing, friendly, enjoyed company of people
19. Sloppy, disorganized
20. Moody, ups and downs
21. Angry
22. Friends, popular
23. Well-organized, tidy, neat
24. Actin without thinking, impulsive
25. Tendency to be immature
26. Guilty feelings, regretful
27. Losing control of myself
28. Tendency to be or act irrational
29. Unpopular with other children, didn�t keep friends for long, didn�t get along with
other children
30. Poorly coordinated, did not participate in sports
31. Afraid of losing control of self
32. Well-coordinated, picked first in games
33. Tomboyish (for women only)
34. Running away from home
35. Getting into fights
36. Teasing other children
37. Leader, bossy

82
38. Difficulty getting awake
39. Follower, led around too much
40. Trouble seeing things from someone else�s point of view
41. Trouble with authorities, trouble with school, visits to principal�s office
42. Trouble with police, booked, or convicted
Medical problems as a child:
43. Headaches
44. Stomachaches
45. Constipation
46. Diarrhea
47. Food allergies
48. Other allergies
49. Bedwetting
As a child in school, I was (or had):
50. Overall a good student, fast
51. Overall a poor student, slow learner
52. Slow in learning to read
53. Slow reader
54. Trouble reversing letters
55. Problems with spelling
56. Trouble with mathematics or numbers
57. Bad handwriting
83
58. Able to read pretty well but never really enjoyed reading
59. Not achieving up to potential
60. Repeating grades (which grades?___________)
61. Suspended or expelled (which grades?__________)
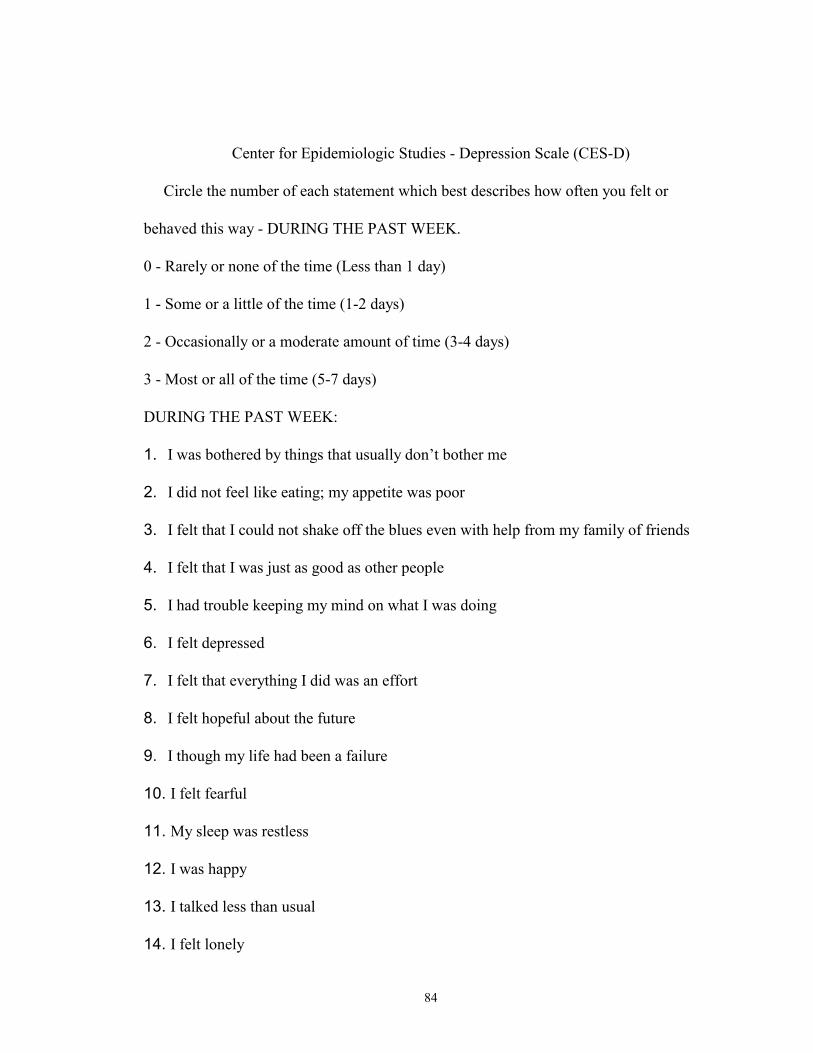
84
Center for Epidemiologic Studies - Depression Scale (CES-D)
Circle the number of each statement which best describes how often you felt or
behaved this way - DURING THE PAST WEEK.
0 - Rarely or none of the time (Less than 1 day)
1 - Some or a little of the time (1-2 days)
2 - Occasionally or a moderate amount of time (3-4 days)
3 - Most or all of the time (5-7 days)
DURING THE PAST WEEK:
1. I was bothered by things that usually don�t bother me
2. I did not feel like eating; my appetite was poor
3. I felt that I could not shake off the blues even with help from my family of friends
4. I felt that I was just as good as other people
5. I had trouble keeping my mind on what I was doing
6. I felt depressed
7. I felt that everything I did was an effort
8. I felt hopeful about the future
9. I though my life had been a failure
10. I felt fearful
11. My sleep was restless
12. I was happy
13. I talked less than usual
14. I felt lonely

85
15. People were unfriendly
16. I enjoyed life
17. I had crying spells
18. I felt sad
19. I felt that people disliked me
20. I could not get �going�
86
References
Achenbach, TM & Edelbrock, CS (1986). Child behavior checklist and youth self-
report. Burlington, VT: Author
American Psychiatric Association. (1994). Diagnostic and statistical manual of mental
disorders (4th ed.). Washington, DC: Author.
Axelrod, B.N., Goldman, RS, Heaton, R.K., Curtiss, G., Thompson, L.L., Chelune,
G.J., Kay, G.G. (1996). Discriminabiliity of the Wisconsin Card Sorting Test using the
standardization sample. Journal of Clinical and Experimental Neuropsychology, 18, 338-
342.
Barkley, R.A. (1990). Attention-Deficit Hyperactivity Disorder: A Handbook for
Diagnosis and Treatment. New York, NY: The Guilford Press.
Barkley, R.A. (1997). Behavioral inhibition, sustained attention, and executive
functions: Constructing a unifying theory of ADHD. Psychological Bulletin, 121, 65-94.
Barkley, R.A. & Biederman, J. (1997). Toward a Broader Definition of the Age-of-
Onset Criterion for Attention-Deficit Hyperactivity Disorder. Journal of the American
Academy of Child and Adolescent Psychiatry, 36, 1204-1210.
Barkley, R., Cunningham, C., & Karlsson, J. (1983). The speech of hyperactive
children and their mothers: Comparison with normal children and stimulant drug effects.
Journal of Learning Disabilities, 16, 105-110.
87
Barkley, R.A., DuPaul, G.J., & McMurray, M.B. (1990) Comprehensive evaluation of
attention deficit disorder with and without hyperactivity as defined by research criteria.
Journal of Consulting and Clinical Psychology,58, 775-789.
Barkley, R.A., Grodzinsky, G. & DuPaul, G.J. (1992). Frontal lobe functions in
attention deficit disorder with and without hyperactivity: A review and research report.
Journal of Abnormal Child Psychology, 58, 775-789.
Barkley, R.A., Murphy, K., & Kwasnik, D. (1996). Psychological Adjustment and
Adaptive Impairment in Young Adults with ADHD. Journal of Attention Disorders, 1,
41-54.
Barkley, R.A., & Ullman, D.G. (1975). A comparison of objective measures of
activity and distractibility in hyperactive and nonhyperactive children. Journal of
Abnormal Child Psychology, 3, 213-214.
Bench, C.J., Frith, C.D., Grasby, P.M., Friston, K.J., Paulesu, E., Frackowiak, R.S., &
Dolant, R.J. (1993). Investigations of the functional anatomy of attention using the Stroop
test. Neuropsychologia, 31, 907-922.
Benton, A.L. (1968). Differential behavioral effects in frontal lobe disease.
Neuropsychologia, 6, 53-60.
Berman, K.F., Ostrem, J.L., Randolph, C., Gold, J., Goldberg, T.E., Coppola, R.,
Carson, R.E., Herscovitch, P., & Weinberger, D.R. (1995). Physiological activation of a
cortical network during performance of the Wisconsin Card Sorting Test: A Positron
Emission Tomography Study. Neuropsychologia, 33, 1027-1046.
88
Berman, K.F., Zec, R.F., & Weinberger, D.R. (1986). Physiological dysfunction of
dorsolateral prefrontal cortex in schizophrenia: II Role of neuroleptic treatment, attention,
and mental effort. Archives of General Psychiatry,43, 126-135.
Biederman, J., Faraone, S.V,, Spencer, T., Wilens, T.E., Norman, D., Lapey, K.A.,
Mick E., Lehman, B., & Doyle, A. (1993) Patterns of psychiatric comorbidity, cognition,
and psychosocial functioning in adults with attention deficit hyperactivity disorder.
American Journal of Psychiatry, 150, 1792-1798.
Borland, B.L. & Heckman H.K. (1976). Hyperactive boys and their brothers: a 25-year
follow-up study. Archives of General Psychiatry,33, 669-675.
Bornstein, R.A. (1986) Contributions of various neuropsychological measures to
detection of frontal lobe impairment. International Journal of Clinical Neuropsychology,
8, 18-22.
Boucugnani, L.L. & Jones, R.W. (1989). Behaviors analogous to frontal lobe
dysfunction in children with Attention-Deficit Hyperactivity Disorder. Archives of
Clinical Neuropsychology,4, 161-173.
Conners, C.K. (1997). Conners Rating Scales-Revised. North Tonawanda, NY: Multi-
Health Systems
Cornblatt, B.A. & Kelip, J.G. (1994). Impaired attention, genetics, and the
pathophysiology of schizophrenia. Schizophrenia Bulletin, 20, 31-46.
DesRosier, G. & Kavanagh, D. (1987). Cognitive assessment in closed head injury.
Stability, validity and parallel forms for two neuropsychological measures of recovery.
International Journal of Clinical Neuropsychology,9, 162-173.
89
Diagnosis and Treatment of Attention Deficit Hyperactivity Disorder. NIH Consensus
Statement 1998 Nov 16-18; 16 (2): In press
Epstein, J.N., Conners, C.K., Erhardt, D., March, J.S. & Swanson, J.M. (1997).
Asymmetrical hemispheric control of visual-spatial attention in adults with attention
deficit hyperactivity disorder. Neuropsychology,11, 467-473.
Epstein, J.N., Conners, C.K., Sitarenios, G., & Erhardt, D. (1998). Continuous
Performance Test results of Adults with Attention Deficit Hyperactivity Disorder. The
Clinical Neuopsychologist, 12, 155-168.
Felton, R.H., Wood, F.B., Brown, I.S., Campbell, S.K., & Harter, M.R. (1987).
Separate verbal memory and naming deficits in attention deficit disorder and reading
disability. Brain and Language, 31, 171-184.
Findling, R.L. & Dogin, J.W. (1998). Psychopharmacology of ADHD: Children and
Adolescents. Journal of Clinical Psychiatry, 59, Suppl 7, 42-49.
Fischer, M., Barkley, R.A., Edelbrock, C.S., & Smallish, L. (1990). The adolescent
outcome of hyperactive children diagnosed by research criteria II. Academic, attention,
and neuropsychological status. Journal of Consulting and Clinical Psychology, 58, 580-
588.
Findling, R.L.& Dogin, J.W. (1998). Psychopharmacology of ADHD: Children and
Adolescents. Journal of Clinical Psychiatry, 59(Suppl. 7), 42-49.
Gansler, D.A., Fucetola, R., Krengel, M., Stetson, S., Zimering, R., & Makery, M.S.
(1998). Are there cognitive subtypes in adult attention deficit/hyperactivity disorder? The
Journal of Nervous and Mental Disease, 186, 776-781.
90
Gorenstein, E.E., Mammato, C.A., & Sandy J.M. (1989). Performance of Inattentive-
Overactive Children on Selected Measure of Prefrontal-Type Function. Journal of
Clinical Psychology, 45, 619-631.
Grodzinsky, G., & Diamond, R. (1992.) Frontal lobe functioning in boys with
attention-deficit hyperactivity disorder. Developmental Neuropsychology, 8, 427-445.
Halperin, J.M., Wolfe, L.E, Pascualvaca, D.M ,Newcorn, J.H., Healey, J.M., O�Brien,
J.D., Morganstein, A., & Young, J.G. (1988). Differential assessment of attention and
impulsivity in children. Journal of the American Academy of Child and Adolescent
Psychiatry, 27, 326-329.
Hansen, C., Weiss, D., & Last C.G. (1999). ADHD boys in young adulthood:
Psychosocial adjustment. Journal of the American Academy of Child and Adolescent
Psychiatry, 38, 165-171.
Hart, E.L., Lahey, B.B., Loeber, R., Applegate, B., & Frick, P.J. (1995).
Developmental changes in attention-deficit hyperactivity disorder in boys: A four-year
longitudinal study. Journal of Abnormal Child Psychology, 23, 729-750.
Heaton, R.K. (1981). A manual for the Wisconsin Card Sorting Test. Odessa, FL:
Psychological Assessment Resources.
Kolb, B., & Whishaw, I.Q. (1990). Fundamentals of human neuropsychology. Third
Edition. New York: W.H. Freeman and Company
Lassiter, K.S., D�Amato, R.C., Raggio, D.J., Whitten, J.C.M., & Bardos, A.N. (1994).
The construct specificity of the continuous performance test: Does inattention relate to
behavior and achievement? Developmental Neuropsychology,10, 179-188.
91
Lavoie, M.E. & Charlebois, P. (1994). The discriminant validity of the Stroop color
and word test: Toward a cost-effective strategy to distinguish subgroups of disruptive
preadolescents. Psychology in the Schools, 31, 98-107.
Levin, H.S., Mendelsohn, D., Lilly, M.A., Fletcher, J.M., Culhane, K.A., Chapman,
S.B., Harward, H., Kusnerik, L. Bruce, D., and Eisenberg, H.M. (1994). Tower of London
performance in relation to magnetic resonance imaging following closed head injury in
children. Neuropsychology, 8, 171-179.
Lezak, M. (1983). Neuropsychological Assessment. New York: Oxford University
Press.
Lezak, M. (1995). Neuropsychological Assessment. (3rd ed.). New York: Oxford
University Press.
Logan, G.D. (1994). On the ability to inhibit though and action: A users� guide to the
stop signal paradigm. In D. Dagenback & TH Carr (Eds.), Inhibitory process in attention,
memory, and language (pp.189-239), San Diego: Academic Press
Logan, G.D., Cowan, W.B., Davis, K.A. (1984) On the ability of inhibiting simple and
choice reaction time responses: A model and a method. Journal of Experiment
Psychology Human Perception and Performance, 10, 276-291.
Logan, G.D., Schachar, R.J., & Tannock, R. (1997) Impulsivity and Inhibitory
Control. Psychological Science,8, 60-64.
Losier, B.J., McGrath, P.J., & Klein, R.M. (1996). Error patterns on the continuous
performance test in non-medicated and medicated samples of children with and without
92
ADHD: A meta-analytic review. Journal of Child Psychology, Psychiatry and Allied
Disciplines,8, 971-987.
Lou, H.C., Henriksen, L., Bruhn, P. (1984). Focal cerebral hypoperfusion in children
with dysphasia and/or attention deficit disorder. Archives of Neurology,41, 825-829.
Lou, H.C., Henriksen, L., Bruhn, P., Borner, H., Nielsen, J.B. (1989). Striatal
dysfunction in attention deficit and hyperkinetic disorder. Archives of Neurology,46, 48-
52.
Luk, S. (1985). Direct observation studies of hyperactive behaviors. Journal of the
American Academy of Child and Adolescent Psychiatry, 24, 338-344.
Macleod, C.M. (1991). Half a century of research on the Stroop Effect: An integrative
review. Psychological Bulletin, 109, 163-203.
Mannuzza, S., Klein, R.G., Bessler, A., Malloy, P. & LaPadula, M. (1993). Adult
outcome of hyperactive boys: educational achievement, occupational rank, and
psychiatric status. Archives of General Psychiatry, 50,565-576.
Mannuzza, S., Klein, R.G., Bessler, A., Malloy, P. & LaPadula, M. (1998). Adult
psychiatric status of hyperactive boys grown up. American Journal of Psychiatry, 155,
493-498.
Marenco, S., Coppola, R., Daniel, D.G., Zigun, J.R., & Weinberger, D.R. (1993)
Regional cerebral blood flow during the Wisconsin Card Sorting Test in normal
participants studied by Xenon-133 dynamic SPECT: comparison of absolute values,
percent distribution values, and covariance analysis. Psychiatric Research, 50, 177-192.
Martin, G.N. (1998), Human Neuropsychology Europe:Prentice Hall
93
Mattes, J.A. (1980). The role of frontal lobe dysfunction in childhood hyperkinesis.
Comprehensive Psychiatry, 21, 358-369.
Milner, B. (1963). Effect of different brain lesions on card sorting. Archives of
Neurology, 9, 100-110.
Milner, B. (1964). Some effects of frontal lobotomy in man. In J.M. Warren & G.
Aker (Ed.), The Frontal Granular Cortex and Behavior 9pp.313-334. New York:
McGraw-Hill.
Mountain, M.A., & Snow, W.G. (1993). Wisconsin Card Sorting Test as a measure of
frontal pathology: A review. Clinical Neuropsychologist, 7, 108-118.
Oosterlaan, J., Logan, G.D., & Sergeant, J.A. (1988). Response inhibition in AD/HD,
CD, Comorbid AD/HD+CD, anxious, and control children: A meta-analysis of studies
with the stop task. Journal of Child Psychology and Psychiatry, 39, 411-425.
Patton, J.H., Stanford, M.S., & Barratt, E.S. (1995). Factor structure of the Barratt
Impulsiveness Scale, Journal of Clinical Psychology, 51, 768-774.
Perret, E. (1974). The left frontal lobe of man and the suppression of habitual
responses in verbal categorical behaviour. Neuropsychologia, 12, 323-330.
Peters, M. & Servos, P. (1989) Performance of subgroups of left-handers and right-
handers. Canadian Journal of Psychology, 43, 341-358.
Quay, H.C. (1988). ADD and the BIS: The relevance of the neuropsychological theory
of Jeffrey A. Gray. In L.M. Bloomingdale (Ed.), Attention deficit disorder. Criteria,
Cognition, intervention (pp.117-125.) Oxford, England: Pergamon Press
94
Quay, H.C. (1997). Inhibition and Attention Deficit Hyperactivity Disorder. Journal of
Abnormal Child Psychology,25, 7-13.
Radloff, L.S. (1977). The CES-D Scale: A self-report depression scale for research in
the general population. Applied Psychological Measurement,1, 385-401.
Rapport, M.D., Dupaul, G.J., & Smith N.F. (1985). Rate-dependency and
hyperactivity: Methylphenidate effects on operant responding. Pharmacology,
Biochemistry, and Behavior,23, 77-83.
Rapport, M.D., & Kelly, K.L. (1991). Psychostimulant effects on learning and
cognitive function: Findings and implications for children with attention-deficit
hyperactivity disorder. Clinical Psychology Review, 11, 61-92.
Rezai, K. Andreasen, N.C., Alliger, R., Cohen, G., Swayze, V., O�Leary, D.S. (1993).
The neuropsychology of the prefrontal cortex. (Archives of Neurology, 50, 636-642.
Robinson, A.L., Heaton, R.K., Lehman, R.A.W., & Stilson, D.W. (1980) The utility of
the Wisconsin Card Sorting Test in detecting and localizing in frontal lobe lesions.
Journal of Consulting and Clinical Psychology,48, 605-614.
Rosenberg, S.D., Drake, R.E., Wolford, G.L., Mueser, K.T., Oxman, T.E., Vidaver,
R.M., Carrieri, K.L., & Luckoor, R. (1998) Dartmouth Assessment of Lifestyle
Instrument (DALI): A substance use disorder screen for people with severe mental illness.
American Journal of Psychiatry, 155, 232-238.
Ross, R.G., Hommer, D., Breiger, D., Varley, C., & Radant, A. (1994) Eye movement
task related to frontal lobe functioning in children with Attention Deficit Disorder.
Journal of the American Academy of Child and Adolescent Psychiatry, 33, 869-874.
95
Roy-Byrne, P., Scheele, L., Brinkley, J., Ward, N., Wiatrak, C., Russo, J., Towne, B.,
& Varley, C. (1997). Adult-attention deficit hyperactivity disorder: Assessment
guidelines based on clinical presentation to a specialty clinic. Comprehensive Psychiatry,
38, 133-140.
Rubin, P., Holm, S., Friberg, L., Videbech, P., Anderson, H.S., Bendsen, B.B.,
Stromso, N., Larsen, J.K., Lassen, N.A., & Hemmingsen. R. (1991). Alterated modulation
of prefrontal and subcortical brain activity in novel diagnosed schizophrenia and
schizophreniform disorder: A regional cerebral blood flow study. Archives of General
Psychiatry, 48, 987-995.
Schachar, R. J., Tannock, R., & Logan, G. (1993). Inhibitory control, impulsiveness,
and attention deficit hyperactivity disorder. Clinical Psychology Review,13, 721-739.
Schachar, R. J., Tannock, R., Marriot, M., & Logan, G. (1995). Deficient inhibitory
control in attention deficit hyperactivity disorder. Journal of Abnormal Child Psychology,
23, 411-438.
Seidman, L.J., Biederman, J., Faraone, S.V., Weber, W. & Ouellette, C. (1997).
Toward defining a neuropsychology of Attention Deficit-Hyperactivity Disorder:
Performance of Children and Adolescents from a large clinically referred sample. Journal
of Consulting and Clinical Psychology,65, 150-160.
Seidman, L.J., Biederman, J., Weber, W., Hatch, M., & Faraone, S.V. (1988).
Neuropsychological function in adults with attention-deficit hyperactivity disorder.
Biological Psychiatry, 44, 260-268.
96
Spaulding, W., Garbin, C.P., & Dras, S.R. (1989). Cognitive abnormalities in
schizophrenic patients and schizotypal college students. Journal of Nervous and Mental
Diseases, 177, 717-728.
Spencer, T., Biederman, J., Wilens, T.E., & Faraone, S.V. (1998). Adults with
attention-deficit/hyperactivity disorder: A controversial diagnosis. Journal of Clinical
Psychiatry, 59, (Suppl. 7) 59-68.
Speilberger, C.D. (1993) Manual for the State-Trait Anxiety Inventory: (Form Y)
(�Self-evaluation Questionnaire�). Palo Alto, CA: Consulting Psychologists Press, Inc.
Spreen, O. & Strauss, E. (1991). A compendium of neuropsychological tests. New
York: Oxford University Press.
Stein, M.A., Sandoval, R., Szumowski, E., Roizen, N., Reinecke, M.A., Blondis, T.A.,
and Zanvel, K. (1995). Psychometric characteristics of the Wender Utah Rating Scale:
Reliability and factor structure for men and women. Psychopharmacology Bulletin, 31,
425-433.
Swanson, J.M. (1989). Paired-associate learning in the assessment of ADD-H
children. In L.M. Bloomingdale & J. Swanson (Eds.) Attention deficit disorder: Current
concepts and emerging trends in attentional and behavioural disorders of childhood (pp.
87-123). New York: Pergamon Press
Teicher, M.H., Ito, Y., Glod, C.A., & Barber, R. (1996) Objective measurement of
hyperactivity and attentional problems in ADHD. Journal of the American Academy of
Child and Adolescent Psychiatry,35, 334-342.
97
Van der Meere, J., & Sergeant, J. (1988b). Focused attention in pervasively
hyperactive children. Journal of Abnormal Child Psychology,16, 627-640.
Van der Meere, J., & Sergeant, J. (1998a). Controlled processing and vigilance in
hyperactivity: Time will tell. Journal of Abnormal Child Psychology, 16, 641-656.
Ward, M.F., Wender, P.H., & Reimherr, F.W. (1993) The Wender Utah Rating Scale:
An aid in the retrospective diagnosis of childhood attention deficit hyperactivity disorder.
American Journal of Psychiatry, 150, 885-890.
WAIS-III WMS-III Technical Manual. (1997). San Antonio, TX: The Psychological
Corporation: Harcourt Brace and Company.
Weinberger, D.R., Berman, K.F., and Zec, R.F. (1986). Physiological dysfunction of
dorsolateral prefrontal cortex in schizophrenia: I. Regional cerebral blood flow (rCBF)
evidence. Archives of General Psychiatry, 43, 114-125.
Weissman, M.W., Scholomoskas, D., Pottenger, M., Prusoff, B.A. & Locke, B.Z.
(1977). Assessing depressive symptoms in five psychiatric populations: A validation
study. American Journal of Epidemiology, 106, 203-214.
White, H.L., Moffitt, T.E., Caspi, A., Bartusch, D.J., Needles, D.J. & Stouthamer-
Loever, M. (1994). Measuring Impulsivity and Examining Its Relationship to
Delinquency. Journal of Abnormal Psychology, 103, (192-205).
Zametkin, A.J., Liebenauer, L.L., Fitzgerald, G.A., King, A.C., Minkunas, D.V.,
Herscovitch, P., Yamada, E.M., & Cohen, R.M. (1993). Brain metabolism in teenagers
with attention-deficit hyperactivity disorder. Archives of General Psychiatry, 50, 333-340.

98
Zametkin, A.J., Nordahl, T.E., Gross, M., King, A.C., Semple, W.E., Rumsey, J.,
Hamburger, S., Cohen, R.M. (1990). Cerebral glucose metabolism in adults with
hyperactivity of childhood onset. The New England Journal of Medicine, 323, 1361-
1366.