performance of aea 80 ah battery under geo profile · 3 aea geo life testing gsfc zaea initiated...
TRANSCRIPT
Performance of AEA 80 Ah Battery Under GEO Profile
N. Russel, D. Curzon, and K. Ng(AEA Technology)L. Lee and G. Rao
(NASA/GSFC)
GSFC
https://ntrs.nasa.gov/search.jsp?R=20080015790 2018-11-03T07:13:46+00:00Z

2
GSFCContents• AEA Geosynchronous Earth Orbit (GEO) Life Testing• AEA/Goddard Space Flight Center (GSFC) 20 Ah Battery• AEA/GSFC 80 Ah Battery• Solar Dynamic Observatory (SDO) Life Test
– Real-Time Profile and Setup
• Test Results• Correlation
– AEA Fade Tool– Long Term Projection
• Conclusions
3
GSFCAEA GEO Life Testing
AEA initiated cycling and calendar life tests over 6 years ago
Accelerated GEO cycling tests with no solstice period
GSFC directed a real-time life test at battery level at AEABattery design based on an existing module previously qualified for GSFC

4
GSFCAEA/GSFC 20 Ah Battery• Assembled using 128 individual SONY 18650 1.5
Ah cells • Arranged in a S-P system topology• 16 parallel strings each containing 8 cells in series• 8 cells in series string provide battery voltage (20 to
33.6 V)• Battery provides 20 Ah capacity when discharged at
10 A to 24 V at 20ºC • Six thermistors for temperature telemetry• Three multi-pin connectors (Power, Flight
Telemetry and Ground Telemetry)

5
GSFCAEA/GSFC 80 Ah Battery• 40 Ah Test module assembled using
four of the standard 8 x 8 battery blocks
• Battery block uses qualified design from 20 Ah units
•Each block contains 64 cells•Total of 256 cells per test module

6
GSFCSDO Life Test: Overview
• Real time GEO life testing including solstice and eclipse seasons
• Capacity measurements performed only at the start of each eclipse season– Before first eclipse season each year both AEA* and
GSFC** capacity measurements performed– Before second eclipse season each year an extra AEA
capacity measurement is performed
* C/10 charge to 33.6V and C/10 discharge to 20.0V**C/10 charge to 33.6V clamp with a taper current to C/100 and C/2 discharge to 24.0V

7
GSFCSDO Life Test: Overview – cont’d
• Eclipse Regime– Charge at 4A to 33.35V clamp with a taper to 0.1 A, followed by
0.1A constant current until end of the charge period– Maximum State-of-Charge (SOC) 98% day 1 and day 42– Minimum SOC 28% days 21-23– Discharge current 48A
• Solstice Regime– 140 days– Voltage clamp at 32.3V (72% SOC)– Fully charged before prior to commencement of eclipse season

8
GSFCSDO Life Test: Real-Time Profile
0102030405060708090
100
0 50 100 150 200 250 300 350 400Day
Dis
char
ge D
urat
ion
(min
)
Eclipse 1 Eclipse 2Solstice 1 Solstice 2
AEA and GSFC Capacity
Measurement
AEA Capacity Measurement Only
AEA and GSFC Capacity
Measurement
Eclipse 3

9
GSFCSDO Life Test Setup
+ve connectors
-ve connectors
Parallel connection of harnesses

10
GSFCTest Results• AEA Standard Capacity Measurement (SCM) (C/10 charge and discharge) =
91.41 Ah• CGSFC (C/10 charge & taper to C/100, C/2 discharge) = 83.02 Ah• CTOTAL = 97.76 Ah
GSFC 80Ah SDO GEO Lifetest Battery
-100
-80
-60
-40
-20
0
20
40
60
80
100
0 5 10 15 20 25 30 35Time in hours
CU
RR
EN
T (A
) & C
APA
CIT
Y (A
h)
15
20
25
30
35
40
VO
LT
AG
E (V
)
Cap. [Ah] Current [A] Voltage [V]
AEA CapacityCharge 91.47Ah
Discharge 91.41Ah
GSFC CapacityCharge 94.95Ah
Discharge 83.02Ah
11
GSFCTest Results: Voltage
Completed to date nominal three seasons
Note rising voltage towards end of charge−True taper charge to very low current not possible with test equipment used
−Min current without a specific ‘rest’ mode is 0.1 A
−Therefore battery charged to 33.35 V then held at 0.1 A current for remaining duration
−33.35 V calculated to ensure battery remains below 33.6 V at end of charge for worst case (minimum discharge)

12
GSFCTest Results: Voltage First Eclipse Season Profile
25
26
27
28
29
30
31
32
33
34
35
0 2 4 6 8 10 12 14 16 18 20 22 24 26 28 30 32 34 36 38 40 42 44
Time (Day)
Vol
tage
(V
)
0
10
20
30
40
50
60
70
80
90
100
Dis
char
ge D
urat
ion
(min
)
Voltage [V] Discharge Duration

13
GSFCTest Results: VoltageProfiles for Maximum Depth-of-Discharge (DOD), 72%, for the Three
SeasonsFirst Eclipse (72 min)
27
28
29
30
31
32
33
34
20.0 20.1 20.2 20.3 20.4 20.5 20.6 20.7 20.8 20.9 21.0
Time (Day)
Vol
tage
(V
)
Second Eclipse (72 min)
27
28
29
30
31
32
33
34
20.0 20.1 20.2 20.3 20.4 20.5 20.6 20.7 20.8 20.9 21.0
Time (Day)
Vol
tage
(V
)
Third Eclipse (72 min)
27
28
29
30
31
32
33
34
20.0 20.1 20.2 20.3 20.4 20.5 20.6 20.7 20.8 20.9 21.0
Time (Day)
Vol
tage
(V
)

14
GSFCTest Results: Current• Logged current shows four stages per orbit:• Main constant current charge at 4 A• Taper region when voltage clamped at 33.35 V• Limiting 0.1 A current for remaining duration of
charge• 48 A discharge current results in a peak of 57.6 Ah
(equivalent to 72% DOD of CGSFC)

15
GSFCTest Results: CurrentProfile for the Eclipse Season
-60
-50
-40
-30
-20
-10
0
10
20
0 2 4 6 8 10 12 14 16 18 20 22 24 26 28 30 32 34 36 38 40 42 44
Time (Day)
Cur
rent
(A
)
0
10
20
30
40
50
60
70
80
Dis
char
ge D
urat
ion
(min
)
Current [A] Discharge Duration

16
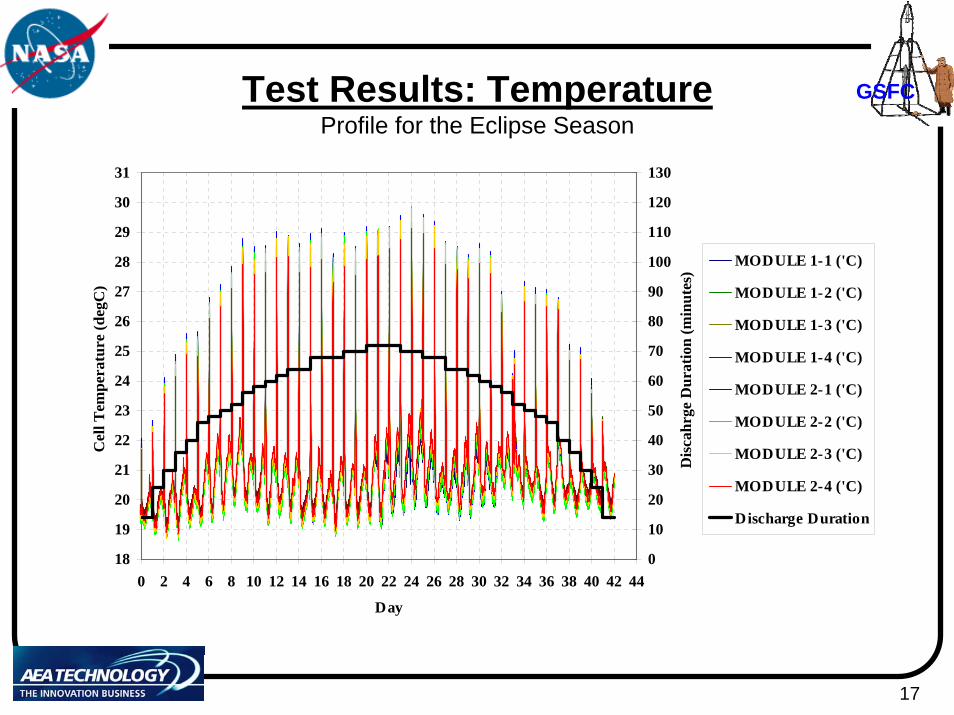
GSFCTest Results: Temperature• 1 thermistor at the centre of each block
– represents maximum cell temperature• On following plot ‘spike’ temperature rises during the discharge
periods– Peak cell temperature approx 30°C
• Variation in temperature during charge follows repeating pattern:– Initially endothermic (temp falls below interface (I/F)) – Then exothermic (temperature rises 1 to 2°C)– Then cells cool back towards I/F temperature near end of charge
when current tapers and dissipation reduces– Small variation in I/F temperature due to thermal control limits
17
GSFCTest Results: TemperatureProfile for the Eclipse Season
18
19
20
21
22
23
24
25
26
27
28
29
30
31
0 2 4 6 8 10 12 14 16 18 20 22 24 26 28 30 32 34 36 38 40 42 44
Day
Cel
l Tem
pera
ture
(deg
C)
0
10
20
30
40
50
60
70
80
90
100
110
120
130
Dis
cahr
ge D
urat
ion
(min
utes
)
MODULE 1-1 ('C)
MODULE 1-2 ('C)
MODULE 1-3 ('C)
MODULE 1-4 ('C)
MODULE 2-1 ('C)
MODULE 2-2 ('C)
MODULE 2-3 ('C)
MODULE 2-4 ('C)
Discharge Duration

18
GSFCTest Results: Solstice GSFC GEO Battery Voltage and Charge Current 2nd solstice
15.00
20.00
25.00
30.00
35.00
40.00
23/02/2004 14/03/2004 03/04/2004 23/04/2004 13/05/2004 02/06/2004 22/06/2004 12/07/2004 01/08/2004
DATE
VO
LT
AG
E (V
)
0
1
2
3
4
5
6
7
8
9
10
11
CH
AR
GE
CU
RR
EN
T (m
A)
Battery Volltage (V) Battery Current (mA)

19
GSFCCorrelation: AEA Fade Tool
• AEA life test program has accumulated over 40 million cell hours including 6 years calendar life
• Intended to simulate Low Earth Orbit (LEO), Geosynchronous (GEO), Medium Earth Orbit (MEO), Geosynchronous Transfer Orbit (GTO), Interplanetary and Planetary Lander scenarios
• This data, combined with understanding of cell level chemical processes has been incorporated into AEA fade tool

20
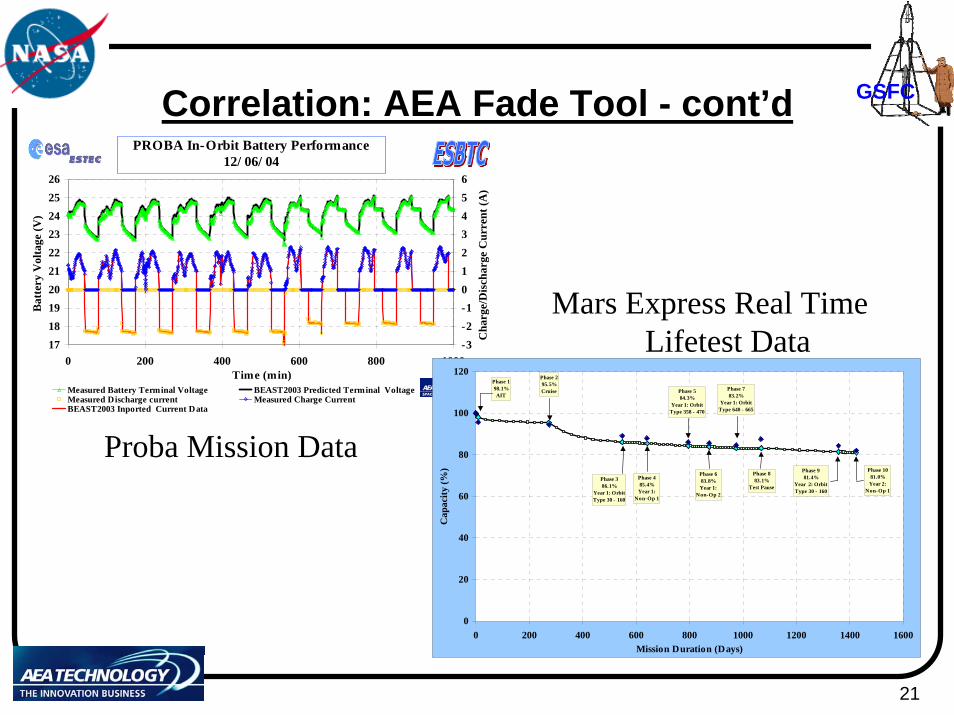
GSFCCorrelation: AEA Fade Tool - cont’d
• Simple Excel based user interface• Each phase defined by temperature, duration, number of
cycles, DOD, state of charge
21
GSFCCorrelation: AEA Fade Tool - cont’d
17181920212223242526
0 200 400 600 800 1000Time (min)
Bat
tery
Vol
tage
(V)
-3-2-10123456
Cha
rge/
Dis
char
ge C
urre
nt (A
)
Measured Battery Terminal Voltage BEAST2003 Predicted Terminal VoltageMeasured Discharge current Measured Charge CurrentBEAST2003 Inported Current Data
PROBA In-Orbit Battery Performance 12/ 06/ 04
Phase 1081.0%Year 2:
Non-Op 1
Phase 981.4%
Year 2: Orbit Type 30 - 160
Phase 883.1%
Test Pause
Phase 783.2%
Year 1: Orbit Type 640 - 665
Phase 683.8%Year 1:
Non-Op 2
Phase 584.3%
Year 1: Orbit Type 358 - 470
Phase 485.4%Year 1:
Non-Op 1
Phase 386.1%
Year 1: Orbit Type 30 - 160
Phase 295.5%Cruise
Phase 198.1%AIT
0
20
40
60
80
100
120
0 200 400 600 800 1000 1200 1400 1600Mission Duration (Days)
Cap
acity
(%)
Proba Mission Data
Mars Express Real Time Lifetest Data

22
GSFC
End of Eclipse Season 1
95.0%Start of Eclipse
Season 292.8%
Start of Eclipse Season 2
89.0%
0
20
40
60
80
100
120
0 50 100 150 200 250 300 350 400Mission Duration (Days)
Cap
acity
(%)
Fade Tool Predictions
Correlation: AEA Fade Tool - cont’d
End of Eclipse Season 1
95.0%Start of Eclipse
Season 292.8%
Start of Eclipse Season 2
89.0%
0
20
40
60
80
100
120
0 50 100 150 200 250 300 350 400Mission Duration (Days)
Cap
acity
(%)
Start of Eclipse Season 2
96%
Start of Eclipse Season 2
93%
Start of Eclipse Season 1
102%Actual Data
Fade Tool Predictions

23
GSFCCorrelation: Long Term Prediction
0 500 1000 1500 2000 2500 3000 3500
Mission Duration (Days)
Cap
acity
(%)
10 Year MissionXX% Capacity
Remaining
5 Year MissionXX% Capacity
Remaining

24
GSFCConclusions
• To date completed three SDO real-time eclipse seasons
• Sony 18650HC has a low rate of capacity fade under GEO cycling regime
• Real time test results correlate with accelerated GEO lifetest data and AEA capacity fade prediction tool
• This data, together with other AEA test data, justify the SDO Project decision to baseline Lithium-Ion chemistry for the spacecraft battery.

25
GSFCAcknowledgements