performance of crushed-stone base coursesonlinepubs.trb.org/onlinepubs/trr/1984/954/954-010.pdf ·...
TRANSCRIPT

78
Performance of Crushed-Stone Base Courses
RICHARD D. BARKSDALE
ABSTRACT
Twelve full-scale, instrumented pavement sections were tested to failure in a spec i al laboratory facility under closely controlled environmental conditions. Seven of the pavement sections were loaded to more than 1 million repetitions and five of these sections to more than 2 million repetitions. A 6.5-kip (29-kN) uniform circular loading was applied to the surface and syst ema tically moved to prevent a punching failure. ~avements tested consisted of five conventional sections having crushed-stone bases, -five full-depth asphalt-concrete sections, and two inverted sections. The inverted sections consisted of a crushedstone base sandwiched between a lower cement-stabilized layer and an upper asphaltconcrete layer. Conventional sections were tested with two thicknesses of base and three base gradations. The crushed-stone base sections were found to give excellent performance when covered with asphalt cone rete 3. 5 in. ( 89 mm) thick. Good performance of the engineered crushed-stone base is attributed to (a) a uniform, high degree of density (100 percent of AASHTO T-180), (b) use of a well-graded crushed stone with 1- to 2-in. (25- to 50-mm) top she that has only 4 to 5 percent passing the No. 200 sieve, (c) practically no segregation, and (d) a relatively thin asphalt-concrete surfacing.
The rising cost of petroleum products dictates the use of more materials that are low energy intensive and relatively inexpensive such as unstabilized crushed stone. There is therefore an important need to formally study the performance of granular bases in large-scale test sections taking advantage of recent advances in materials technology and modern instrumentation.
In this study the use of crushed-stone base is evaluated as an alternative to the deep strength asphalt-concrete construction now used by the Georgia Department of Transportation (GDOT) in flexible pavements. Twelve large-scale pavement sections were tested to determine whether engineered crushed stone can be successfully used to replace at least a portion of asphalt concrete in the base course. A summary of the full-depth asphalt-concrete, crusheds tone-base, and inverted sections tested is given in Table 1.
The inverted sections tested are not described in any detail: these results will be described in a subsequent paper. With the exception of test sections 3 and 4, between 0.15 and 4.4 million repetitions were applied to each section (Table 1). All tests were conducted in an enclosed constant-tempera ture environment at 78 to 80°F (25. 6 to 26. 7°C) over a period of 2 to 4 months.
TEST FACILITY
The pit in which the tests were performed was 8 ft (2.4 m) wide, 12 ft (3.7 m) long, and 5 ft (1.5 m) deep (Figure 1). To study a maximum number of base variables a different structural section was constructed at each end of the pit to give two tests for each complete filling of the pit. Emphasis was placed during construction of the test sections on achieving uniform material properties and meeting GDOT material specifications.
An air-over-oil cyclic loading system was developed to apply 6.5 to 7.5 kips (29.4 to 33.~ kN) to the pavement in 0 .17 sec to simulate a slowly moving, heavy wheel loading. About 70 to 90 load pulses per minule were transmitted to the pavement surface through a water-filled circular rubber bladder. The diameter of the 6. 5-kip load applied to the surface was 9.1 in. (231 mm). The resulting peak pressure was about 100 psi ( 689 kN/m') , uniformly distributed over the pavement surface. Loading was conducted 5 to 6 days a week, 24 hr a day.
Cyclic Loading System
In the hybr i d air-over-oil pneumatic loading system, oil was sandwiched between a small [ 4 in. (102 mm) in diameter) free-floating aluminum piston on the top and a large [12 in. (305 mm) in diameter) aluminum piston on the bottom. Air pressure applied to the top of the small piston was transmitted -undiminished to the large lower piston, giving a large force that was applied to ·the loading bladder resti;;g .c.r. L;,., vavement surface . A push rod transmits this force from the lower piston to the loading bladder. To develop the repeated loading, air was cyclically applied to the top of the upper cylinder by using a solenoid valve system a.nd an electronic timer.
The bladder essentially consisted of a thin steel ring covered with a r ubbeT diaphragm on the top and bottom. A constant seating loading was maintained between load applications to prevent a shock l oading.
To prevent a localized punching failure from occurring during the test, the repeated loading was applied at a primary load position and six secondary positions located symmetrically around the edge of the primary pcsitibn (Figure 2) . In all tests load was applied in the ratio of five repetitions at the primary position to each repetition applied at any individual secondary position. The basic pattern was to apply 100,000 repetitions at the primary position and 20,000 repetitions to each secondary position: this number, however, was reduced in the early phases of most tests; in a few tests 9reater numbers of load repetitions were applied in the later phases of testing (1) •
The pavement was subjected to a cyclic loading of 6. 5 kips up to 2 x 10 6 repetitions. To decrease the time required to cause the failur e of strong pavement sections, the loading was increased to 7. 5 kips after 2 x 10 6 tepetitions. In sections 11 and 12 the load was maintained at 6. 5 kips throughout the test. I n this series, however, 200,000 load rep-

Barksdale 79
TABLE 1 Construction and Performance Summary of Pavement Sections Tested
Asphalt- Crushed-Concrete Stone Repetitions
Section Thickness Thickness to Failure Number (in .) (in.) (000,000s) Failure Mode8 Comments
3 .5 12.0 3 .0 Fatigue and rutting Tested to 2.4 million repetitions ; 3.5 failure extrapolated
2 3.5 8.0 1.0 Rutting 3 9.0 None 0.010 Rutting (I i_n.) Bad asphalt: asphalt-concrete 4 6.5 None 0 .010 Rutting (I in .) content, 5.9 percent; flow, 15.4;
stability, 1,870 lb; 'YD = 145 .I pcf
9.0 None 0 .13 Rutting Rutting failure primarily in asphalt concrete
6 6.5 None 0.44 Rutting 7 7.0 None 0.15 Rutting Direct comparison of crushed-8 3.5 8.0 0.55 Rutting stone and full-depth sections 9 3.5 8.0b 2.4 Fatigue Dp = 0 .28 in. at 2.9 million repe-
titians 10 3.5 8.0° 2.9 Fatigue Dp = 0.34 in . at 2.9 million repe-
tirions II 3,5 8.0 3.6 Fatigue and rutting 6.0· n, soil cement subbased 12 3.5 8.0 4.4 Fatigu e and rutting 6.0-in. cement-stabilized stone
sub base•
Note: 1 in . = 25 mm. I lb= 0.45 k11 . 1pcf=16 kg/m3 . I psi = 6.89 kN/m 2. 3 A fatigu e failure is defined as class 2 cracking; a rutting failure js defined as a 0.5-in . (12-mm) rut depth, bcoarse-gTadation base. CFine-gn.dr. tlo o base, d28-day unconOned compressive strength of 214 psi . C28-day unconfined compressive strength of 1,146 psi.
FIGURE 1 General view of pit test facility including load frame, air-over-oil loading system, and loading bladder.
etitions were applied at the primary load position in the latter stages of testing: use of this pattern of loading greatly increased the number of repetitions that could be applied during a given 24-hr day.
Reaction Frame
A reaction frame extended horizontally across the pit in the long direction about 3 ft (0.9 m) a bove the surface of the pavement (Figure 1). The l oadi ng system wa s at t ac he d to t he load f.r ame by me an s o f a horizontally o rient ed th r ust plate 1 i n. (2 5 mm) thic k a nd 26 x 33 i n. ( 660 x 838 mm ) in size . Rap id positioning by hand of the loading system at seven fixed load locations on the thrust plate was achieved by using seven sets of bolt holes to support the l oad system. Movement of the load cylinde r from one fixed load posi tion to another was eas ily accomplished by a special carriage that hung from
1 = PRIMARY LOAD POSITION
2 - 7 K SECONDARY LOAD POSITIONS 1 in . .. 25 mm
FIG URE 2 Load positions used in test section loading.
IN. DIA. LOADED AREA
the reaction beams. The carriage rolled along the reaction beam on four wheels and temporarily supported the load cylinder during movement.
Instrumentation
The test sections were extensively instrumented to define the response of the pavement system. Typical-
80
ly 19 to 24 Bison-type strain sensors were installed to measure both resilient and permanent deformations throughout the pavement section (Figure 3). Small diaphragm-type pressure cells were used to measure ver tical stress on the subgrade. Resilient surface deflections were measured by using linear var iable differential transducers (LVDTs). Pe rmanent deformations of the pavement surface were measured from a string line by us ing a metal scale . All instrumentation was carefully calibrated. A detailed description of the instrumentation is given elsewhere (]J.
LOAD POSITION 6
l PRIMARY l LOAD 1 IN. DIA. ·- _::_s~:l°.:__f STRAIN SENSOR ~
k :~·¥1mt>a :tt~t·:::y~\~;:;~:lililt:::IJIBl=·:;:} , 0, ~ o • · . · o ; 9 • "o •o• ,• •. ~ 0 "; 0• ... . ".o -. 7 •;•• c:i .•t 411 1 ,
,,0 : • ~ 10. Cl 0 • Q .. 0 •• 2 L ,• : • •• ' • 0 • ~ ~ • • 4 • ·, •• G • • • : •
0• 6 : •• 0
• G "' oO• • • Oo • •• 1• • • • e< .. 0° o .1J 00: • lO. • , ;.;.; : •,'• CRUSHED STONE , ~ 00 o~ : • • •o • .. - f • • o . .. . ..... v 'o •oo 0 t t L) : ~"1 O • G O'"' : ... • : • : 1 : t • 1 /., • : • : : : : : ' 0 o. 5 : 0 o •
. • 0 • . .. • • 0 . , 20 • 0 0 • ' • • • • • • • 0 0 0 • 0 • 0
~~· ;. ~·32 41r "·'if 33 ·~_: .. :..:-34 ~;,.;,.: / --' //; = I ti/ = ///=!!!
12 2 IN. DIA. 1,
STRAIN SENSOR - -r~ STRAIN SENSOR ._:3/ PAIR NUMBER - -14
~ 41N. DIA. -15 STRAIN SENSOR
l
FIGURE 3 Bison strain sensor layout used in section 8, crushed·stone base.
TEST-SECTION CONSTRUCTION AND MATERIAL PROPERTIES
All test sections were constructed by using the same standardized procedures found to give consistent, reproducible results. After being tested to failure, each section was completely removed from the pit and new sections were constructed from the bottom of the subgrade up. Only the silty-sand subgrade soil was reusedi after each test the subgrade soil was removed from the pit, stored, remixed, and then placed and recompacted in the pit.
Subgra,de
The micaceous silty-sand subgrade was uniformly blended in a small Barber-Green pugmill in small batches. Before blending, the material was weighed, and the water content of each batch was determined by using a Speedy moisture meter. During mixing, the watei: required to bring the moisture content to optimum was added. The soil subgrade was placed in approximately 2-in . (51-mm) lifts and compacted with
Transportation Research Record 954
f ive to seven passes of a Jay-12 vibrating base compactor. A w~r.ker compactor was aloo oometimes used. A spring- loaded static penetrometer helped in controlling the densi ty of each soil lifti the actual density was determined by using a thin-wall drivetube sample. The subgrade of all sections had a uniform dynamic cone penetration resistance equivalent to a standard penetration test value of seven to eight blows per foot (23 to 26 blows per meter).
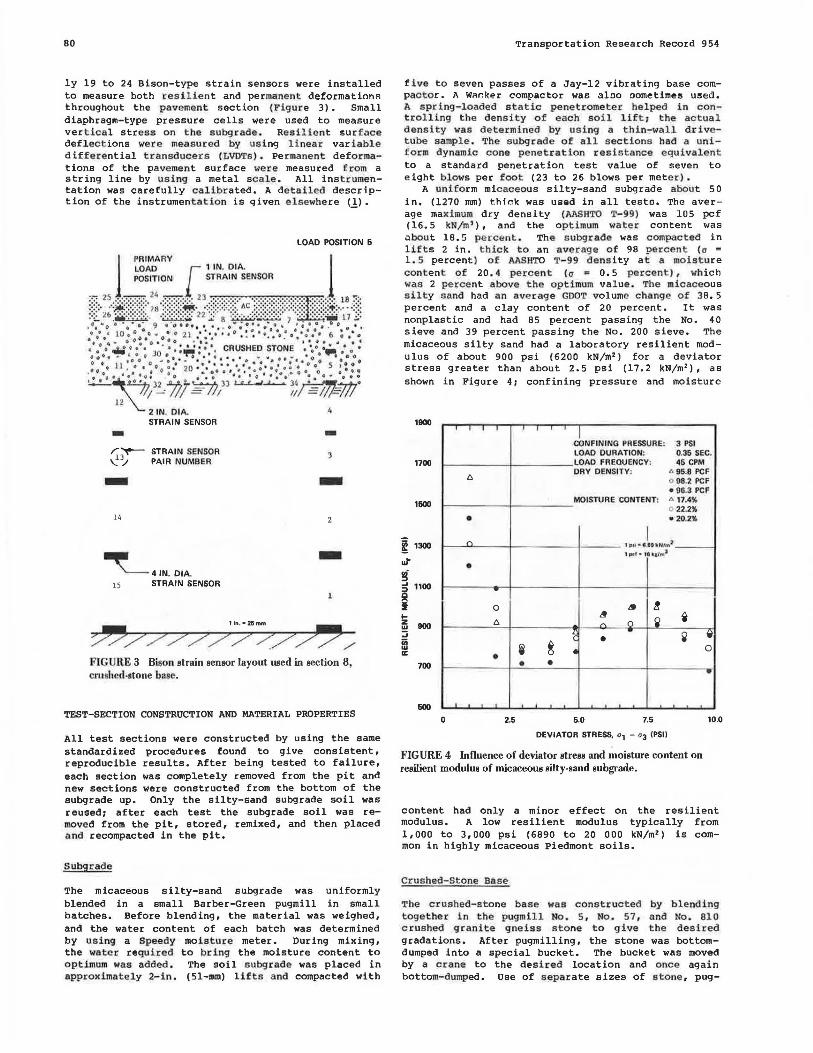
A u1<iform micaceous silty-sand subgrade about 50 in. (1270 mm) thick was used in all testo. The average maximum dry density (AASFITO T-99) was 105 pcf ( 16. 5 kN/m,), and the optimum water content was ubout 18. 5 percent . The subgrade was com12acted in lift s 2 in. thick to an averag·e of 98 pe rcent (a = 1. 5 percent) o f AASHTO T-99 density at a moisture content of 20. 4 percent (a = o. 5 percent), which was 2 percent above the optimum value. The micaceous silty sand had an average GDOT volume change of 38.5 percent and a clay content of 20 percent. It was nonplastic and had 85 percent passing the No. 40 sieve and 39 percent passing the No. 200 sieve. The micaceous silty sand had a laboratory resilient modulus of about 900 psi (6200 kN/m2) for a deviator stress greater than about 2.5 psi (17.2 kN/m2), as shown in Figure 4 i confining pressure and moisture
1900 I I I
CONFINING PRESSURE: 3 PSI LOAD DURATION: 0.35 SEC .
1700 LOAD FREQUENCY: 46 CPM
t:J. ORV DENSITY: " 95.8 PCF
o 98.2 PCF • 96.3 PCF
1600 MOISTURE CONTENT: " 17.4%
Q 22.2%
• • 20.2%
~ 1300 ~
I 1 p_d • $ ,19 t..Nltrl l pef • ,_, ... ,ft!,
w~ • ~ ... 1100 :I -~ i !z 900 w ::; iii IC
0 a .! ~
It i t:J. - ('\
~ - ~ ~ • i ~ • 0
• 700 • • -500
0 2.5 5.0 7.5 10.0
DEVIATOR STRESS. 01 - 03 (PSI)
FIGURE 4 Influence of deviator stress and moisture content on reeilient modulue of rnicaceoue eilty ·sand suhgrade.
content had only a minor effect on the resilient modulus. A low resilient modulus typically from 1, ODO to 3, ODO psi (6890 to 20 ODO kN/m2 ) is common in highly micaceous Piedmont soils.
Crushed-Stone Base
The crushed-stone base was constructed by blending together in the pugmill No. 5, No. 57, and No. 810 crushed granite gneiss stone to give the desired gradations. After pugmilling, the stone was bottomdumped into a special bucket. The bucket was moved by a crane to the desired location and once again bottom-dumped. Use of separate sizes of stone, pug-

Barksdale
milling, and bottom-Oumping resulted in a uniform, homogeneous blend having a minimum amount of segregation after placement.
The sand-replacement method was used to determine the density of test sections 1 and 2. This method caused excessive disturbance of the crushed-stone base. The density of all subsequent unstabilized g ranular bases was t herefore determined by a GDOT inspector by using a nuclear densi ty gage . The average density o f all sections (except 11 and 12) was 100 percent of AASHTO T-180; little vadation was observed between sections. The unstabilized crusheds tone bases used in the inverted sections ( 11 and 12) were constructed over a rigid cement-stabilized layer. As a result, the density obtained in the crushed stone in these bases was greater than that in the other granular base sections, 105 percent of AASHTO T-180.
Stone gradations used are given in Table 2. The resilient r esponse of the s ta"ndard-gradation stone base is given in Figure 5 and the plastic response in Figure 6.
Asphalt Concrete
Either a GDOT B or a GDOT modified-B binder was used for the full thickness of the asphalt-concrete layer. The asphalt concrete was transported from the plant to the test facility in an enclosed, heavily insulated plywood box. At the time of delivery to the test facility, the temperature of the asphalt was between 290 and 300°F (143 to 149°C). The asphalt concrete was quickly weighed out, placed in the pit, leveled, and compacted by using a small two-wheel vibrating maintenance roller. The asphalt concrete was placed in lifts about 1. 75 in. (44.4 mm) thick and rolled in each direction. A light prime coat of RC-70 was sprayed on the surface of the stone before the asphalt concrete was placed.
The mix designs and extraction test results are shown in Table 3. The stone used was a granite gneiss (obtained from two different quarries) that had the following typical gradation as defined by the extraction tests: 97 to 100 percent passing the 1-in. (25-mm) sieve, 62 to 85 percent passing the 3/8-in. (9.5-mm) sieve, 48 to 60 percent passing the No. 4 (4. 75-mm) sieve, and 4 to 8 percent passing the No. 200 (75-µm) sieve.
TEST SECTION FINDINGS
General Comparison
Table 1 gives a general summary of the performance of the sections tested in this study. Sections 3 and 4 failed prematurely by cutting because of a high asphalt content. Both rutting and fa tigue failures occurred in the tests. Sections l, 11, and 12 failed in a combined fatigue and rutting mode. (Section 1
81
was tested to 2.4 million load repetitions; failure would have occurred at about 3 million to 3.5 million repetitions.) Sections 2 through 8 failed in rutting, and sections 9 and 10 fail ed in fatigue.
A fatigue failure was defined as the initiation of class 2 cracking. Only fine hairline cracks, which were hard to see, developed in sections considered to have undergone a fatigue failure. Numerous instances of the healing of these cracks were observed throughout the study when the load was placed over t hem.
A r utting failure was de.fined as an average rut depth of 0. 5 i n. (12 mm) measured from a fixed string line ; rutting occurring during the first 1,000 repetit i ons was not included. Of significance is t he finding that the sections surviving more than 2 million repetitions failed in fatigue or wer e close to a fatigue failure . In contrast, sections having r~latively short lives failed in rutting . Thus , these test results ace a good illustration o f the importance of preventing excessive rutting in all layers.
The relatively early failure of the full-depth sections (sections 5-7) in rutting compared with the crushed-stone base sections (sections 1, 2, and 8-10) appears to be caused by (a) application of the heavy l oading in a reasonably concentrated pattern, (b) important contributions of rutting from the weak subgrade beneath the relatively thin, full-depth as-
100,000
• .. ) .. <" •
~ :.,.....""" •
,; (ij ~ w -' <(
10,000 u "' <:J 0 -'
w .,; => BASE COURSE: STANDARD -' => GRADATION 0 0 ~
RESILIENT RESPONSE AT 10,000 REPETITIONS ._
z w
E, = 4154 a00"55
:::; ' = 0.74 (ij w er 1ptt • 689kN/m2
1,000 I I I I 4 10 100
SUM OF PRINCIPAL STRESSES, ao - LOG SCALE (PSIJ
FIGURE 5 Influence of stress state on resilient modulus of crushed-stone base material, standard gradation.
200
TABLE 2 Crushed-Stone Base-Course Gradations and AASHTO T-180 Maximum Dry Densities
Cumulat ive Percent Passing by Sieve Size
Base l l / 2 in . 1 in" 3/4 in . 3/ 8 in. No"4 No.8 No . JO No" 50 No , 60 No . 100
Standard• 100 98 83 61 43 31 13 Fine3 100 99 92 64 44 31 II Coarse3 98 83 69 40 31 29 10 2-in. Fuller curve 98 82 69 39 31 29 12
Note: 1 in. == 25 mm . 1pcf = 16 kg/m3
.
8The standard-gradation base was used in sectio ns 1, 2, 8, 11, and 12; the fine-graded base in section 10; and the co arse-graded base jn sectfon 9. bAASHTO T -180 m aximum dr y density .
')'max b
No. 200 (pcf)
4 137"0 4 139.S 4 141.S 4

82
phalt concrete (the subgrade was located closer to the surface than the crushed-stone section and a'Ppai;ently as a result made a larger contribution to rutting) , and (c) slightly higher asphalt content of the f ull- depth s ections than t hat of the crushedstone base sections (Table 3).
Permanent Deformation
In each test section, the pavement surface beneath the center of the primary load position underwent a continual up-and-down movement of perma nent deformation (Figure 7). The surface undetwent petmanent downward movement when the load was in the primary load position and upward movement when the load was in a secondary position. This cyclic movement was caused by important lateral shear flow of material in all layers back and forth beneath the loaded regions. Net movement of the center (primary load position) was qradually downward a s shown in Figure 7.
The distribution of permanent defocmation in a full-depth and a crushed-stone base section is compared in Figure 8 after 300, 000 load applications. In the asphalt-concrete layers of both sections the permanent deformation was approximately equally distributed between the top and bottom halves of the asphalt-concrete layer. In the full-depth asphaltconcrete section, 67 percent of the total pecmanent deformation occurred in the asphalt-concrete and 33 percent in the subgrade, In the crushed-stone section, 55 percent of the permanent deformation occurred in the asphalt-concrete surfacing, which was
50
40
~ ~
c JO
c ~ "' IC ... "' IC 20 Cl ... .. ;; "' Cl
10
0.2 0.4 0.6
Transportation Research Record 954
3. 5 in. (89 mm) thicki 10 percent in the ctushed 1' ~nne ; and 35 percenL l.11 the subgrade . At equal depths more permanent rutting appeared to occur in the upper part of the subgrade beneath the fulldepth asphalt-concrete section than i n the crushed stone section.
Going f ram a 1-2-in. (305-mm) crushed-stone base to an 8-in. (203-mm) crushed-stone base resulted in an increase in percentage of total rutting in the subgrade from 20 to 39 percent . At the same time, the percenlagt! of rutting in the asphalt surfacing dropped from 59 to 34 percent; rutting in the stone base only increased from 21 to 27 percent of the total. aoth this comparison and the previous one indicate that rutting can be relatively small in a properly designed and constructed crushed-stone base under conditions in which water is not a problem in the base . As illustrated in Figure 9, for the crushed-stone bases studied , typical1y 60 to 70 percent of the rutting occun: ing in the stone base developed in the upper half of the base. Finally, little difference in rutting was observed within the base between the sections having the coarse- and f i ne-qradation stone bases (sections 9 and 10) as shown in Figure 9. The gradation of both these sections below ·the No. 40 sieve was, however, essentially the same; only 4 . 2 to 4. 4 percent passed the No. 200 sieve (Table 2) • More total rutting did develop in the fine-gradation base section (section 10) than in the coarse base sect.ion. The di£ference, however, was primarily caused by rutting in the subgrade .
0.8
o3 = 10 PSI
o3 = 3 PSI
STANDARD CRUSHED STONE BASE AT 100,000 REPETITIONS
• o3 = 10 PSI
o3 = 5 PSI
• o3 = 3 PSI
100% T-180 DENSITY
1PSI '" 689 kN/m 2
1.0 1.2 1.4 1.6
AXIAL PLASTIC STRAIN, < p (PERCENT)
FIGURE 6 Influence of deviator stress and confining pressure on plastic strain in standard· gradation crushed-stone base.
Resilient Response
Resilient strains were measured by using Bison strain coil pairs (Figure 3). Hence the resilient strains given are the average strain occurring between the two coils and not a peak (maximum) value that occurs at a point; the difference, however, between the two values should be relatively small.
The typical variation of resilient strain response with number of load repetitions is given in Figure 10 for section 10; as indicated, the strains
typically decreased after 10,000 to 100,000 repetitions. They then underwent an important increase after about l million load applications, which indicated reduction in the structural integrity of the pavement.
Comparison of Theory and Observed Response
A comparison of calculated and typical measured resilient response is given in Table 4. The response

Barksdale 83
TABLE 3 Fifty-Blow Marshall Mix Designs for Test Sections: AC-20 Asphalt Cement
50-Blow Marshall Mix Design• Constructed
Optimum Asphalt Asphalt Concrete Flow Stability Air Voids "( Concrete "(
Section (%) (0.0 1 in.) (lb) (%) (pcf) (%) (pcf)
1,2 4.9 9.6 2,500 4.5 146.0 4.61 143.7 3,4 4 .9 9.6 2,500 4 .5 146 .0 5.9 145.1 5,6 5.2 10.6 2,150 4.5 145.5 5.44b 145.3 7,8 5.2 10.6 2,150 4.5 145 .5 4.92c 145.0 9,10 5.0 JO.I 2,950 5.0 148.0 4.90 148 .0 I 1,1 2 5.2 9.0 2,300 4.0 146.0 99.2c
Note: 1 jn. = 25 mm. 1lb = 0.-ts kg. 1pcf::;16 kg/m3
. BResiHent modulus of 70,000 p1I, 95°F. sections 7 and 8; bending stiffness of 380,000 psi, B0°F, sections 1 and 2; both tests on rehi!:nte1d .rtSphalt concre te. bsc-t tloo :5i hud a motm.Jred ns1~haJt con1c:nt of s. 71 1a:irctnl 11nd tiC!lton 6, 5.17 percent; i cclion 7 had 5.60 percent nnd tee .. tion 8 hmd 4.'23 percent; the :r.ccuaJ diffuonce in asph . lt <oni::rek ro rHont was probably less because each pair of secHons W.1118
constructed at the same time. CPercent maximum from nuclear-density tests .
1.50.---------------------------------..---------------..,.----------------.1"""--.. 1in.•25mm
1.25
1.0
SECTION 8
CENTERLINE DEFORMATION PRIMARY LOAD POSITION 3.5 IN. AC/8 IN. STONE BASE
LOAD REPETITIONS, N
FIGURE 7 Variation of centerline deformation with number of load repetitions, section 8.
was calculated by assuming the layers to be isotropic, Linear-elastic, homogeneous, and semiinfinite in horizontal extent (2). Linear-elastic theory of this type is usually us;d in mechanistic design methods. Because pavements are neither linear elastic nor isotropic, a good match of all measured variables should not be expected.
The laboratory-measured resilient moduli were adjusted to give an approximate best overall fit of the observed strain, d.eflection, and stress response of the pavem~nt systems. For a reasonably good overall fit of the observed response, the resilient moduli of the subgrade, crushed-stone base, and surfacing were taken to be about 2,800 psi (19.3 MN/m'), 15,000 psi (103 MN/m•), and 4 to 8 x los psi (2756 to 5512 MN/m'l, respectively.
The moduli values used generally give deflections that are somewhat larger than those measured but give a reasonably good prediction of the tensile strain measured in the bottom of the asphalt-concrete surfacing.
The theoretical vertical stress on the subgrade is considerably smaller than the measured values. Some overmeasurement of vertical stress may certainly have occurred in the investigation. The pressure
cells, however, were calibrated in the same subgrade soil, and the effect of dynamic loading was found by calibration to be small. ~herefore it is felt that the existing stresses were indeed greater than those predicted by theory. The finding (Table 4) that the measured verti cal strains on the subgrade for the full-depth and stone base sections were about 50 percent greater than predicted also tends to indicate larger subgrade stresses.
The resilient modulus used to characterize the subgr ade was about' three times the value indicated by the repeated-load triaxial tests. Disturbance and remolding effects and the short time for which the laboratory test specimens are subjected to a 3 may partially account for this important difference. Previous work with the micaceous silty sands of the Piedmont have indicated similar problems with laboratory-evaluated moduli (_1).
Fatigue Behavior
Crushed-stone base sections 9 through 12 failed in fatigue or a combined fatigue-rutting failure. The fatigue relationship obtained from these data points

84 Transportation Research Record 954
PERMANENT DEFORMATION (IN.)
SECTION 8 0 0.4 0.8 1.2 SECTION 7 0
56% ~.AC.~: i2J!.
0 kEfi 32% .a..• ..,. 48% ~--
CRUSH EC 75%
AC ; 67" STONE 68%
10% />. -- ~ •• 4. ,. 11 \!=-.!lll
10 A ,,. 25% (N ~ 311,000) -
iii w :c u
I> ~I,?
~~ L I I 64%
FULL DEPTH
! 21%
(N = 308,000)
w 20 - 33% u < LL a: 35% ---:::> Cl) 36% 3: 0 30 _, w m
~ ... w Q
40
79% w ~· Q
< < a: a:
~ li a: a: a w w > >
~§ <- <- ~§ _, § _, §
0.: z . z . ..... -.-
It !I e1 ....... :c ... "' .......
:!; • i. i I :!; I
"'~ "'~ "'~ ill!!> 11n.•2&mm
60
FIGURE 8 Comparison of distribution of permanent deformation in full-depth section 7 and cru.shed-stone section 8.
PERMANENT DEFORMATION (IN.)
SECTION 9 0 0.2 0.4 0.6 SECTION 10 0
221' 64%
CRUSHE 11% STONE
10 (Coanel 38%
( //S/// //IS///
m. l . 60% 60%
20 ! . ! .... .. , 40%
JO
40
1- --·1
50%
w. 0 <
I a: a: w 0 >- m _, § :5 § :::>
I Cl)
!::~ < . bg :c . .... .... .......
i II ~II 1 in, • 25mm "'~ "'~
50 ..... ~ ........ ~~...i.~--''--~.a....~ .... ~-'-~--'~~.a....~ .... ~...r..~--1~~~.a....--1
FJC.llRE 9 Comparison of dietcihution of porman.enl deformation in coami· and fine· gradation crushed-stone base pnvemculs sections 9 and IO.
for 79°F (26.1°C), Nf = O.OOlOBct· 2·695, was found where Nf is the number of repetitions to cause fatigue failure and c t is the tensile strain in the bottom of the asphalt-concrete layer. This fatigue relationship is for a temper atu re of 79°F, fine hairline cracking, and the assumption that each load app1ication caused the same amount of damage. The relatively concentrated pattern of loaCI ing is felt to be more severe than would normally occur for a highway pa vement.
The observed fatigue curve, corrected to 70°F (21.1°C), is located above the fatigue curves summarized by Rauhut and Kennedy (_~), as shown in Fig-
ure ll. The - high fatigue cui:ve is probably partly caused by use of a thin bituminous surfacing a nd a high-guality crushed- stone base. The points f a ll between the curves developed by Barksdale (5) for a 3-in. and 9.8-in. thickness of asphalt-conc~te surfacing.
Influence of Crushed-Stone Base Thickness
Increasing the thickness of the crushed-stone base from 8 in. to 12 in. increased the life of the pavement by a factor of almost 3 (compare sections l and

1.4 3.5 IN. AC 8.0 IN. STONE FINE GRADATION
z 1.2
' ~ ... 1.0 I
0
8 ~ ..
0 0.8 z <(
.!' z· 0.6 « IC t; t- 0.4 z w ::; ;;; w IC 0.2
1in . •25mm 0
0 100 1,000 10,000 100,000 1,000,000
LAND REPETITIONS, N
FIGURE 10 Variation of resilient strain with load repetitions, section 10.
10,000,000
TABLE 4 Comparison of Measured and Theoretical Stresses, Strains, and Deflections by Using Final Material Parameters
Tangential Strain at
85
Vertical Stress on Bottom of Asphalt Surface Displacement Vertical Su bgrade Strain Subgrade (psi) Concrete (µe) (mils)
Typical Typical Typical Pavement Design Measured Theoretical Measured Theoretical Measured Theoretical
Full-depth (9-in.) asphalt concrete 8.7 2.5 308 280 14 17 Asphalt concrete (3 .5 in.) on 8-in.
crushed-<>tone base 6.8-11.2 4.0 270-390 352 23 29 Asphalt concrete (3.5 in.) on 8.7-in. crushed-<>tone base on 5.8-in. cement-treated crusher run 3.5 2.1 272 262 17 15
Asphalt concrete (3.7 in.) on 8.9-in. crushed-<>tone base on 6.0-in. cement-treated subgrade 3.2 2.5 324 276 26 19
I RAUHUT MEAN RELATIONSHIP
I I 1111 -.......... ',.,/_ II II II
~ f::::: .... ~ r ,__ ONTARIO SURFACE MIX, 20% CRACKING
w .... ;;; i5 t-
~
r-- ;::: ~ --
/ --- ~
. L CHEVRON BEAM TESTS ~ .::""- -.... \ -i- .. ::::-.
(SHIFT FACTOR = 3) v --I I 1111111 I I ~ FINN-AASHO ROAD TEST MIX ... ... (10% CRACKING)
I I I 111111 I I I 1 1 I Ill I I 1 1
I I II 1111 1 I I I 11 - PAVEMENT TEMPERATURE • 70°F
10 103
I I 1 111 111 I I I I 11111 1a5
LOAD REPETITIONS N
~ G.T. STUDY - 79°F
l G.T. .I. • CORRECTED TO
~14~ 70°F ...._ Sect. 9, 10, 11, 12
ii!!! ~;- t:::...... .... -
1in.•26 mm ~ t°F • lt°C + 0 .156) • :lJ
I I 11
(µe)
Typical Measured
1,380
2,030
340
390
FIGURE 11 Comparison of observed fatigue performance with relationships summarized by Rauhut and Kennedy (4).
Theoretical
852
1,450
463
649

86
2, Table 1). The AASHO Road Test results also indicated a similar significant beneficial effect of a small increase in base-course thickness (6), As the base thickness becomes greater, however, the beneficial effect of increasing thickness p robably decreases, as indicated by an analytical study Ill.
Influence of Crushed-Stone Base Gradation
Excellent performanr.P was obtained from tho granu lar - base pavements that had both the coarse gradation (section 9) and the fine gradation (section 10). Both these sections failed in fatigue rather than in rutting at a higher number of repetitions than two other 9-in. crushed-stone base pavements (sect i ons 2 and 9). The fatigue life of the finegradation base section was about 20 percent greater than the fatigue life of the coarse base section. On the other hand, rutting in the fine-gradation base section was 21 percent greate.r than in the section having a coarsely graded granular base section. These differences are reasonably minor considering the possible variation.
The somewhat limited test results indicate for the relatively narrow range of gradations tested that gradation has a reasonably minor influence on performance provided the section is compacted to 100 percent of AASH'.l'O T-190 density and little segregation is allowed to occur. All three crushed-stone base gradations, however, had a top size of 1 to 2 in. (25 to 51 mm), 40 to 44 percent passing the No. 4 sieve, and 4 to 5 percent fines.
Influence of Asphalt Content
Permanent deformation in the B and modif ied-B binder mixes was found to increase dramatically as the asphalt content increased, as shown in Figure 12, which is based on the permanent deformation occurring in the upper 3.5 in. (89 mm) of both full-depth
~ z 0
~ ::;: a: ~ c..i w <i. 0 u.. I- 0 z . ~~ <in ::;: ..; a: 0..
~~ w > ~ .... w a:
8
NOTE:
G.T. PIT STUDY FOR TOP 3.5 IN. OF A.C.
5
ASPHALT CONTENT (PERCENT)
FIGURE 12 Approximate relative rutting in asphalt concrete as function of asphalt content: B and modified-B binder.
0
6
Transportation Research Record 954
and crushed-stone base se·ctions at 10, 000 load repe tition&. BP.<"'i!11RP the permanent daformationa in moot sections were small at 10,000 repetitions, Figure 12 indicates general trends of the influence of asphalt content on rutting.
The results of these full-scale laboratory studies indicate that the SO-blow Marshall mix design method gives approximately the correct asphalt content. Use of greater asphalt content to increase fatigue life, which is sometimes advocated, does not appear to he justified for heavily lo;:idcd sections based on these findings. For heavy traffic and warm summer temperatures, the optimum asphalt content may e ven be slightly less than the Marshall value.
Permanent Subgrade Deformation
The same resilient micaceous silty-sand subgrade was used beneath all test sections. As previously discussed, the subgrade was removed and recompacted at the same density and moisture content for each test. Figure 13 shows that an increase in base thickness causes a decrease in permanent subgrade deformation. As the base thickness increases, however, the rate at which the deformation decreases becomes less.
A 9-kip (40-kN) dual-wheel load would cause about 1.4 times more rutting than that shown in Figure 13 . This extrapolation is based on theory and the plastic strain response obtained from repeated-load triaxial tests. Finally, these studies indicated that the f ull-depth asphalt-concrete sections were no more effective in reducing subgraae rutting per inch of base than the unstabilized crushed-stone base.
Base-course Coefficients
The full-scale laboratory tests show that excellent performance can be obtained by using relatively thin asphalt-concrete surfacings and properly constructed crushed-stone bases . The crushed-stone base sections outperformed the full-depth sections in every test series. A hi9her ;lsphalt content i~ th~ ftAl'l-depth sections probably accounted for most of the poor performance of the full-depth sections.
Based on the observed fatigue and strain response of the pavement, one application of the 6 . 5-kip circular load used in this study is approximately equivalent to O. 59 applications of a 9-kip dualwheel load. Now assume an AASHTO Lnterim Guide (7,8) layer coefficient a1 o f 0.44 for the 3.5-in . asphiltconcrete surfacing and a soil support value of 3.5 (which is greater than would be generally used in Georgia for Piedmont soils). A regiona l factor of 0, 5 assumes that no environmental effects occurred during the study . For this conservative set of assumptions, the average calculated AASHTO Interim Guide crushed-stone base-course coefficien t a 2 is 0.19 . Based on the cesults of this study and observed field response (]:), a base-course coefficient of 0 .18 was recommended for total pavement thicknesses less than 15 in. (381 mm) l this is slightly less than the maximum structural thickness used in th is study . The engineered crushed-stone base should be compacted to at least 100 percent AASllTO T-190 density and have a gradation approximately similar to that of the stone used in this study. Also, segregation should be minimized during construction and adequate drainage provided.
CONCLUSIONS
The test results show that engineered crushed-stone base sections having relatively thin asphalt-con-

Barksdale 87
0.6 ---------"T""------------....---------------. LEGEND
• CRUSHED STONE IN = 3 X 1051
0.4 SECT. NO. FULL-DEPTH IN = 3 X 1051
~ 7 0 • CRUSHED STONE IN = 2 X 1061 w
'" CRUSHED STONE (N = 3 X 1061 ~ llC 3.5 IN. THICK AC SURFACING g i 0.3
!: MICACEOUS SILTY
z SAND SUBGRADE
0
~ 0.2 :IE llC 0
' ... w Q ... z w
0.1 z ~-c( :IE 1
~ llC ....... w 6600 LB. WHEEL LOAD ... .... 1 in .. 2smm l 1 lb .. 0.45 kg
0 0 4 8 12 16
BASE THICKNESS (INCHES)
FIGURE 13 Effect of base thickness and number of load repetitions on suhgrade rutting: crushedstone base and full-depth asphalt-concrete test results.
crete surfacings can successfully withstand large numbers of heavy loadings. Full-scale field tests such as those at Lake Wales, Florida; Stockbridge, Georgia; and in North Carolina support this finding (j, ,j!, 10) • The resul. ts of thi s study s how t-ha t rutt ing in a properly const ructed crushed-stone base can be less than that in either the asphalt-concrete surfacing or a silty-sand subgrade at a temperature of 79°Fi at higher temperatures even greater amounts of rutting would occur in the asphalt concrete.
The good performance of the engineered crushedstone base is attributed to (a) a uniform, high degree of density (100 percent of AASHTO T-180), (b) use on a well-graded crushed stone with 1- to 2-in. top size that has only 4 to 5 percent passing the No. 200 sieve, (c) practically no segregation, and (d) a relatively thin asphalt-concrete surfacing.
ACKNOWLEDGMENT
This project was sponsored by GDOT and FHWA. Specific ackno wl edgment is given to W.T. Stapler, GDOT state ma t e rials engineer, and to Wouter Gul d e n and Danny Brown for their assistance. Special acknowledgment is given to Alan Todres for designing the testing system and genera l assistance . Ken Thomas and Andy Fitzsimmons made many valuable contribut i ons . Support was also given by Rug h Gauntt, Mr. As htiana, Ben Laughlin, and Scott Da v i dson. Vicki Clopton carefully typed the manuscript. The asphalt c oncr e t e was s upplied by APAC Geo r g ia , I nc. Acknowledgment is also gi ve n to E.J. Barenberg o f the Univer sity of Illinois f or pr oviding t.he pugmill.
REFERENCES
1. R.D. Barksdale and H.A. Todres. A Study of Factors Affecting Crushed Stone Base Course Performance. GDOT Project 7603. Georgia Institute of Technology, Atlanta, March 1983, 169 pp.
2. D.A. Dasianchuk. Fatigue Considerations in the Design of Asphalt Concrete Pavements. Ph.D . thesis. University of California, Berkeley, 1966.
3.
4.
s.
6.
7.
8.
9.
10.
R.D. Barksdale, S. Intraprasart, and R. L. Crisp. Settlements of Footing s on a Saprolite Soil. P roc., 5th Pan Amer ican Confe r e nce on Soil Mechani c s a nd Found a t i ons , Bue nos Ai res, Argentina , 1975. J.B. Rauh u t and T.W. Kennedy. Characterizing Fatigue Life of Asphalt Concrete Pavement. In Transportation Research Record 888, TRB, National Research Council, Washington, D.c., 1982, pp. 47-56. R.D. Barksdale. Repeated Load Test Evaluation of Base Course Materials. GDOT Project 7002. Georgia Institute of Technology, Atlanta, 1972. TRB Special Report 73: The MSHO Road Test. TRB, National Research Council, Washington, D.C., 1962. AASHTO Interim Guide for Design of Pavement Structures, Chap. 3, rev. MSHTO, Washington, D.C., 1981. Technical Considerations and Recommendations of the National Crushed Stone Association for Revision of the MSHTO Interim Guide for Design of Pavement Structures. National Crushed Stone Association, Washington, D.C., June 1983, 29 pp. C.F. Potts, B.E. Ruth, and L.L. Smith. Performance of Sand-Asphalt and Limerock Pavements in Florida. In Transportation Research Record 741, TRB, National Research Council, Washington, D.C., 1980, pp. 22-34. B.D. Barnes and W.G. Mullen. Evaluation of Base Courses for Flexible Pavements. School of Civil Engineering, State University, Raleigh, 1979.
Final report. North Carolina
The contents of this paper refle9t the views of the au t hor , who is responsible for the f ac ts a nd the ac cura c y o f t he data p r esented . The conten ts do no t necessar i ly ref lect t he offic i a l v i e w or polic ies o f the stat e o f Geo rgia o r t he Federal Highway Admin i stration. This paper does not constitute a standard, specification, or regulation.
Publication of this paper sponsored by Committee on Strength and Deformation Characteristics of Pavement Sections.