performance of laser fluorescence devices and visual examination
TRANSCRIPT
Performance of laser fluorescencedevices and visual examination for thedetection of occlusal caries in permanentmolars
Peter RechmannDaniel CharlandBeate M. T. RechmannJohn D. B. Featherstone
Downloaded From: https://www.spiedigitallibrary.org/journals/Journal-of-Biomedical-Optics on 25 Sep 2021Terms of Use: https://www.spiedigitallibrary.org/terms-of-use
Performance of laser fluorescence devices and visualexamination for the detection of occlusal cariesin permanent molars
Peter Rechmann,a Daniel Charland,b Beate M. T. Rechmann,a and John D. B. FeatherstoneaaUniversity of California at San Francisco, School of Dentistry, Department of Preventive and Restorative Dental Sciences,San Francisco, California 94143bUniversity of California at San Francisco, Division of Pediatric Dentistry, School of Dentistry, San Francisco, California 94143
Abstract. The aim of this study was to evaluate the diagnostic capabilities of a laser fluorescence tool DIAGNOdent(KaVo, Biberach, Germany) and two light-emitting diode fluorescence tools—Spectra Caries Detection Aid (AIRTECHNIQUES, Melville, NY), and SOPROLIFE light-induced fluorescence evaluator in daylight and blue flores-cence mode (SOPRO, ACTEON Group, La Ciotat, France)—in comparison to the caries detection and assessmentsystem (ICDAS-II) in detection of caries lesions. In 100 subjects (age 23.4� 10.6 years), 433 posterior permanentunrestored teeth were examined. On the occlusal surfaces, up to 1066 data points for each assessment methodwere available for statistical evaluation, including 1034 ICDAS scores (intra-examiner kappa ¼ 0.884). For theSOPROLIFE tool, a new caries-scoring system was developed. Per assessment tool each average score forone given ICDAS code was significantly different from the one for another ICDAS code. Normalized data linearregression revealed that both SOPROLIFE assessment tools allowed for best caries score discrimination followedby DIAGNOdent and Spectra Caries Detection Aid. The area under the receiver operating characteristics curvecalculations showed the same grading sequence when cutoff point ICDAS codes 0-1-2 were grouped together.Sensitivity and specificity values at the same cutoff were calculated (DIAGNOdent 87/66, Spectra Caries DetectionAid 93/37, SOPROLIFE 93/63, SOPROLIFE blue fluorescence 95/55.) © 2012 Society of Photo-Optical Instrumentation Engineers
(SPIE). [DOI: 10.1117/1.JBO.17.3.036006]
Keywords: caries detection; in vivo; precavitated lesions; fluorescence; ICDAS II; DIAGNOdent; Spectra Caries Detection Aid;SOPROLIFE daylight and blue florescence.
Paper 11667 received Nov. 12, 2011; revised manuscript received Dec. 29, 2011; accepted for publication Dec. 29, 2011; publishedonline Mar. 22, 2012.
1 IntroductionCurrent commonly used caries detection methods in the UnitedStates include visual inspection, tactile use of the explorer, andradiographs. Studies in Europe have shown that the explorer isonly correct less than 50% of the time.1 Radiographs are goodfor interproximal caries, but ineffective in detecting occlusalcaries before it is well into the dentin due to the amount ofsound tissue attenuating the beam.2 By the time an occlusalcaries lesion is detectable radiographically, it is too large tobe remineralized. If carious lesions are detected early enough,intervention methods, such as fluoride application, sealants,preventive resin restorations, laser treatment, and antibacterialtherapy, can be applied to reverse the caries process.2
To successfully applyCariesManagement byRiskAssessment(CAMBRA)3–9 the correct diagnosis of the demineralizationstatus (caries level) of the tooth is required. In its early stage, cariesdetection and diagnosis remain difficult.
Visual inspection can be subjective based on clinician experi-ence and training. Standardized visual inspection systemsshould be adopted to avoid inconsistencies amongst diagnosesfrom different dentists. The International Caries Detection andAssessment System (ICDAS) provides a standardized method oflesion detection and assessment, leading to caries diagnosis.10
Longitudinal monitoring of lesions has been difficult dueto the lack of appropriate diagnostic techniques, i.e., techniqueswith high sensitivity and specificity that accurately reflect theslow lesion progression. The aim is to arrest or reverse thedisease process and to intervene before operative restorativedentistry is needed.
All methods for detection and quantification of dentalcaries require certain conditions: they have to meet all safetyregulations; detect early shallow lesions; differentiate betweenshallow and deep lesions; give a low proportion of false positivereadings; present data in a quantitative form so that activity canbe monitored; be precise so that measurements can be repeatedby several operators; be cost-effective and user-friendly.
There are several novel early caries detection methods ofwhich some are commercially available. Fiber-optic transillumi-nation (FOTI) is a technique that uses light transmission throughthe tooth11–13 and has been available on the market for more than40 years. A recently marketed method based upon the sameprinciples as FOTI is the digitized DIFOTI method. The imagescan be stored for later retrieval and comparative examination.Only limited research has so far been performed.14–16
Fluorescence is a property of some manmade and naturalmaterials that absorb energy at certain wavelengths and emitlight at longer wavelengths. Several caries detection methodsengage fluorescence. When a caries lesion in enamel and dentin
Address all correspondence to: Peter Rechmann, University of California, Schoolof Dentistry, 707 Parnassus Avenue, San Francisco, California 94143. Tel: +415514 3225; Fax: 415 476 0858; E-mail: [email protected]. 0091-3286/2012/$25.00 © 2012 SPIE
Journal of Biomedical Optics 17(3), 036006 (March 2012)
Journal of Biomedical Optics 036006-1 March 2012 • Vol. 17(3)
Downloaded From: https://www.spiedigitallibrary.org/journals/Journal-of-Biomedical-Optics on 25 Sep 2021Terms of Use: https://www.spiedigitallibrary.org/terms-of-use
is illuminated with, for instance, red laser light (655 nm),organic molecules that have penetrated porous regions of thetooth, especially metabolites from oral bacteria, will create aninfrared (IR) fluorescence. The enamel is essentially transparentto red light. The IR fluorescence is believed to originate fromporphyrins and related compounds from oral bacteria.17–20
In case of the DIAGNOdent tool (KaVo) the emitted light ischanneled through the handpiece to a detector and presented tothe operator as a digital number. A higher number indicatesmore fluorescence and by inference a more extensive lesionbelow the surface. The system has shown good performanceand reproducibility for detection and quantification of occlusaland smooth surface carious lesions in in vitro studies,17,21,22 butwith somewhat more contradictory results in vivo, both in theprimary and permanent dentition.23–29 It has also been triedfor longitudinal monitoring of the caries process and for asses-sing the outcome of preventive interventions.30
The phenomenon of tooth auto fluorescence has long sincebeen suggested to be useful as a tool for the detection of dentalcaries.31 An increased porosity due to a subsurface enamellesion, occupied by water, scatters the light either as it entersthe tooth or as the fluorescence is emitted, resulting in a lossof its natural fluorescence. Consequently the demineralizedarea appears opaque. The strong light scattering in the lesionleads to shorter light path than in sound enamel, and thefluorescence becomes weaker. The quantitative light-inducedfluorescence (QLF) method that recently came on the market(Inspektor™ Pro) in several countries can readily detect lesionsto a depth of approximately 500 μm on smooth and occlusalenamel surfaces. The QLF method has been tested in severalin vitro,32–34 in situ,35 and in vivo36–41 studies for smooth surfacecaries lesions. The possibility of adapting the QLF method forocclusal caries diagnosis is under investigation.42
The Spectra Caries Detection Aid system aids in the detectionof caries using fluorescence technology light-emitting diodes(LED) projecting high-energy light onto the tooth surface caus-ing cariogenic bacteria to fluoresce red and healthy enamel green.
The SOPROLIFE system is thought to combine the advan-tages of a visual inspection method (high specificity) with ahigh-magnification oral camera and a laser fluorescence device(high reproducibility and discrimination). This technique isbased on the light-induced fluorescence evaluator, diagnosticand treatment (LIFE DT) concept.43,44
The electronic caries measurement (ECM) technique iscentered on the theory that sound dental hard tissue, especiallythe enamel, shows high electrical resistance or impedance. Demi-neralized enamel becomes porous, and the pores fill with saliva,water, microorganisms, etc. The more demineralized the tissue,the lower the resistance becomes. Site-specific measurementshave been evaluated in a number of in vitro studies45–48 andin vivo studies.49,50 Surface-specific electrical conductance mea-surements have been investigated under in vitro conditions,51
which showed moderate sensitivity and specificity.Optical coherence tomography (OCT) is a nonionizing
imaging technique that can produce cross-section images ofbiologic tissues such as ocular, intravascular, gastrointestinal,epidermal, soft oral tissues, and teeth.52–56 OCT can producetwo- or three-dimensional images of demineralized regions indental enamel. When a tooth with a carious lesion is illuminatedwith infrared light at 1310 nm, OCT technology can producea quantitative image of the subsurface lesion to the fulldepth of the enamel.57,58 Polarized sensitive OCT (PS-OCT)
can be correlated with the degree of demineralization and lesionseverity.57,59 A potential utility for the system is monitoringin vivo caries lesion changes.
Up to now all available caries diagnostic tools have limita-tions due to low sensitivity, specificity, or usefulness. The aimof the study presented here was to evaluate the diagnostic cap-abilities of three successfully marketed caries lesion detectiontools—a laser fluorescence tool (DIAGNOdent) and twoLED fluorescence tools (Spectra Caries Detection Aid systemand SOPROLIFE daylight and blue florescence tool)—in com-parison to the ICDAS II system in detection of caries lesions.
2 Materials and Methods
2.1 Study Inclusion and Exclusion Criteria
Approval for the study was obtained from the Committee onHuman Research at UCSF (IRB approval number: 10-01869). Prior to enrollment of each subject into the study, anindependent dental examiner, not otherwise involved in thestudy, conducted a clinical examination to assess caries statusand to determine an appropriate treatment plan (treatment deci-sions will not be reported in this paper). An intraoral exam,review of intraoral radiographs, medical history, and definitivedental history were also completed.
Inclusion criteria to be eligible for the study were a subjectage of 13 years and older, having no occlusal restorations andfissure sealants on at least one molar or bicuspid, and having atleast one untreated molar or bicuspid surface presenting anICDAS II score zero to five (one tooth with ICDAS II scoresix was included).
Subjects had to be healthy and willing to sign the “Author-ization for Release of Personal Health Information and Use ofPersonally Unidentified Study Data for Research” form. Therewere no gender restrictions.
Subjects were excluded from the study if they were sufferingfrom systemic diseases, had a significant past or medical historywith conditions that may affect oral health (i.e., diabetes, HIV,heart conditions that require antibiotic prophylaxis), or weretaking medications that may affect the oral flora (e.g., antibioticuse in the past three months).
Subjects who met the selection criteria were asked to provideverbal/written assent/consent themselves and/or their parent/guardian.
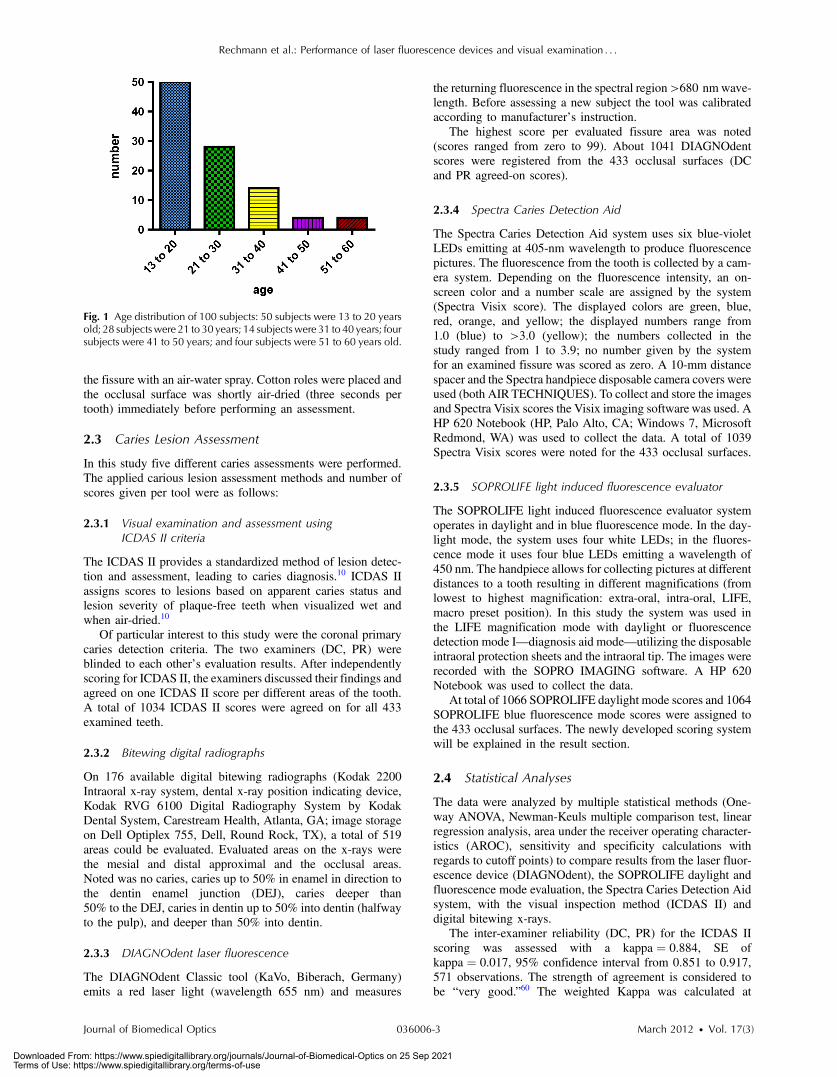
One hundred subjects were recruited for the study, com-prising 58 females and 42 males with an average age of23.4 � 10.6 years, ranging from 13.0 to 58.3 years. Fiftypercent of the subjects were aged 13 to 20, 28% were 21 to30, and 22% were 31 to 60 years old. Figure 1 demonstratesthe age distribution.
In the 100 enrolled subjects, 433 posterior teeth were exam-ined, including 90 bicuspids and 343 molars. On each tooth, if ascore could be given up to five fissure areas were separatelyevaluated per tooth, comprising the mesial, central, and distalparts of the fissure as well as lingual and buccal fissure areas.
2.2 Tooth Cleaning
Before evaluating the occlusal surfaces, the 433 teeth werecleaned with a sodium-bicarbonate powder-cleaning tool (AirMax air-polisher with ProphyPen; SATELEC, ACTEONGroup, Merignac, France) for five to 10 sec per tooth andthen carefully rinsed to remove the powder remnants from
Rechmann et al.: Performance of laser fluorescence devices and visual examination : : :
Journal of Biomedical Optics 036006-2 March 2012 • Vol. 17(3)
Downloaded From: https://www.spiedigitallibrary.org/journals/Journal-of-Biomedical-Optics on 25 Sep 2021Terms of Use: https://www.spiedigitallibrary.org/terms-of-use
the fissure with an air-water spray. Cotton roles were placed andthe occlusal surface was shortly air-dried (three seconds pertooth) immediately before performing an assessment.
2.3 Caries Lesion Assessment
In this study five different caries assessments were performed.The applied carious lesion assessment methods and number ofscores given per tool were as follows:
2.3.1 Visual examination and assessment usingICDAS II criteria
The ICDAS II provides a standardized method of lesion detec-tion and assessment, leading to caries diagnosis.10 ICDAS IIassigns scores to lesions based on apparent caries status andlesion severity of plaque-free teeth when visualized wet andwhen air-dried.10
Of particular interest to this study were the coronal primarycaries detection criteria. The two examiners (DC, PR) wereblinded to each other’s evaluation results. After independentlyscoring for ICDAS II, the examiners discussed their findings andagreed on one ICDAS II score per different areas of the tooth.A total of 1034 ICDAS II scores were agreed on for all 433examined teeth.
2.3.2 Bitewing digital radiographs
On 176 available digital bitewing radiographs (Kodak 2200Intraoral x-ray system, dental x-ray position indicating device,Kodak RVG 6100 Digital Radiography System by KodakDental System, Carestream Health, Atlanta, GA; image storageon Dell Optiplex 755, Dell, Round Rock, TX), a total of 519areas could be evaluated. Evaluated areas on the x-rays werethe mesial and distal approximal and the occlusal areas.Noted was no caries, caries up to 50% in enamel in direction tothe dentin enamel junction (DEJ), caries deeper than50% to the DEJ, caries in dentin up to 50% into dentin (halfwayto the pulp), and deeper than 50% into dentin.
2.3.3 DIAGNOdent laser fluorescence
The DIAGNOdent Classic tool (KaVo, Biberach, Germany)emits a red laser light (wavelength 655 nm) and measures
the returning fluorescence in the spectral region>680 nmwave-length. Before assessing a new subject the tool was calibratedaccording to manufacturer’s instruction.
The highest score per evaluated fissure area was noted(scores ranged from zero to 99). About 1041 DIAGNOdentscores were registered from the 433 occlusal surfaces (DCand PR agreed-on scores).
2.3.4 Spectra Caries Detection Aid
The Spectra Caries Detection Aid system uses six blue-violetLEDs emitting at 405-nm wavelength to produce fluorescencepictures. The fluorescence from the tooth is collected by a cam-era system. Depending on the fluorescence intensity, an on-screen color and a number scale are assigned by the system(Spectra Visix score). The displayed colors are green, blue,red, orange, and yellow; the displayed numbers range from1.0 (blue) to >3.0 (yellow); the numbers collected in thestudy ranged from 1 to 3.9; no number given by the systemfor an examined fissure was scored as zero. A 10-mm distancespacer and the Spectra handpiece disposable camera covers wereused (both AIRTECHNIQUES). To collect and store the imagesand Spectra Visix scores the Visix imaging software was used. AHP 620 Notebook (HP, Palo Alto, CA; Windows 7, MicrosoftRedmond, WA) was used to collect the data. A total of 1039Spectra Visix scores were noted for the 433 occlusal surfaces.
2.3.5 SOPROLIFE light induced fluorescence evaluator
The SOPROLIFE light induced fluorescence evaluator systemoperates in daylight and in blue fluorescence mode. In the day-light mode, the system uses four white LEDs; in the fluores-cence mode it uses four blue LEDs emitting a wavelength of450 nm. The handpiece allows for collecting pictures at differentdistances to a tooth resulting in different magnifications (fromlowest to highest magnification: extra-oral, intra-oral, LIFE,macro preset position). In this study the system was used inthe LIFE magnification mode with daylight or fluorescencedetection mode I—diagnosis aid mode—utilizing the disposableintraoral protection sheets and the intraoral tip. The images wererecorded with the SOPRO IMAGING software. A HP 620Notebook was used to collect the data.
At total of 1066 SOPROLIFE daylight mode scores and 1064SOPROLIFE blue fluorescence mode scores were assigned tothe 433 occlusal surfaces. The newly developed scoring systemwill be explained in the result section.
2.4 Statistical Analyses
The data were analyzed by multiple statistical methods (One-way ANOVA, Newman-Keuls multiple comparison test, linearregression analysis, area under the receiver operating character-istics (AROC), sensitivity and specificity calculations withregards to cutoff points) to compare results from the laser fluor-escence device (DIAGNOdent), the SOPROLIFE daylight andfluorescence mode evaluation, the Spectra Caries Detection Aidsystem, with the visual inspection method (ICDAS II) anddigital bitewing x-rays.
The inter-examiner reliability (DC, PR) for the ICDAS IIscoring was assessed with a kappa ¼ 0.884, SE ofkappa ¼ 0.017, 95% confidence interval from 0.851 to 0.917,571 observations. The strength of agreement is considered tobe “very good.”60 The weighted Kappa was calculated at
Fig. 1 Age distribution of 100 subjects: 50 subjects were 13 to 20 yearsold; 28 subjectswere 21 to 30 years; 14 subjectswere 31 to 40 years; foursubjects were 41 to 50 years; and four subjects were 51 to 60 years old.
Rechmann et al.: Performance of laser fluorescence devices and visual examination : : :
Journal of Biomedical Optics 036006-3 March 2012 • Vol. 17(3)
Downloaded From: https://www.spiedigitallibrary.org/journals/Journal-of-Biomedical-Optics on 25 Sep 2021Terms of Use: https://www.spiedigitallibrary.org/terms-of-use
kappa ¼ 0.905 using linear weighting. Assessed this way, thestrength of agreement is considered to be “very good.”60
3 ResultsAll results from caries assessment tool will first be presentedseparately. Then the relationship between ICDAS II scoresand all findings will be described in terms of average scoreof the tool per ICDAS II code, followed by linear regressionfits. Last, area under the receiver operating characteristics curvesfor overall sensitivity of each detection tool and sensitivity andspecificity calculations will be presented.
3.1 Evaluated Scores
3.1.1 ICDAS II scores distribution
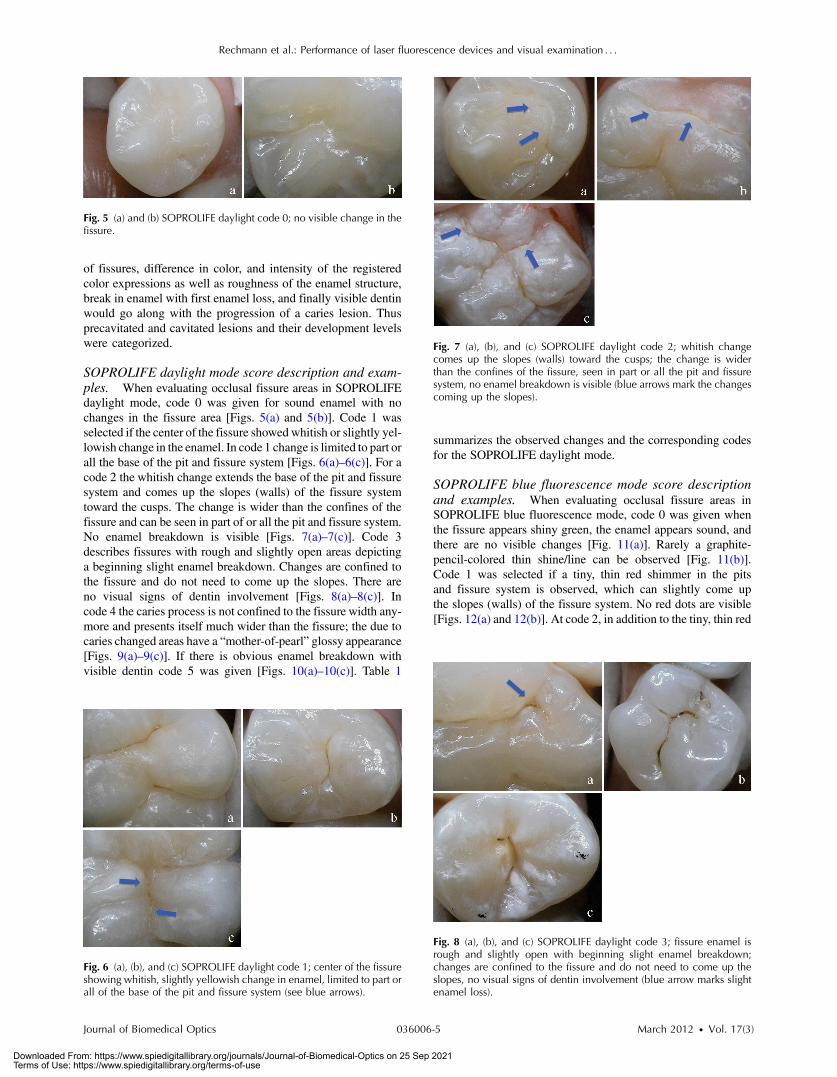
On the occlusal surfaces of the 433 evaluated teeth, 110 areas inpits and fissures were scored as sound (code 0). ICDAS II code 1was given for 450 spots and code 2 for 314 lesions, presenting atotal of 764 precavitated lesions. Early cavitation with firstvisual enamel breakdown—ICDAS code 3—was diagnosedin 107 cases, more progressed carious lesions with code 4 aswell as code 5 were each noted 26 times. (One lesion scoredwith an ICDAS II code 6 was included into the code 5 groupwhen averages were performed; when not, it was left separately[see figure axis].) Figure 2 shows the distribution of ICDASII score.
3.1.2 Digital bitewing radiographs
On 176 available bitewings, 519 areas were evaluated; 491 ofthose 519 evaluated areas showed no radiographically detectablecaries. Twelve lesions located in the approximal areas in enamelextended less than 50% to the DEJ, one lesion extended furtherthan 50% to the DEJ. Three lesions reached 50% into dentin(two approximal, two occlusal), and 12 reached deeper than50% into dentin halfway to the pulp (three approximal lesions,nine occlusal areas).
3.1.3 DIAGNOdent laser fluorescence
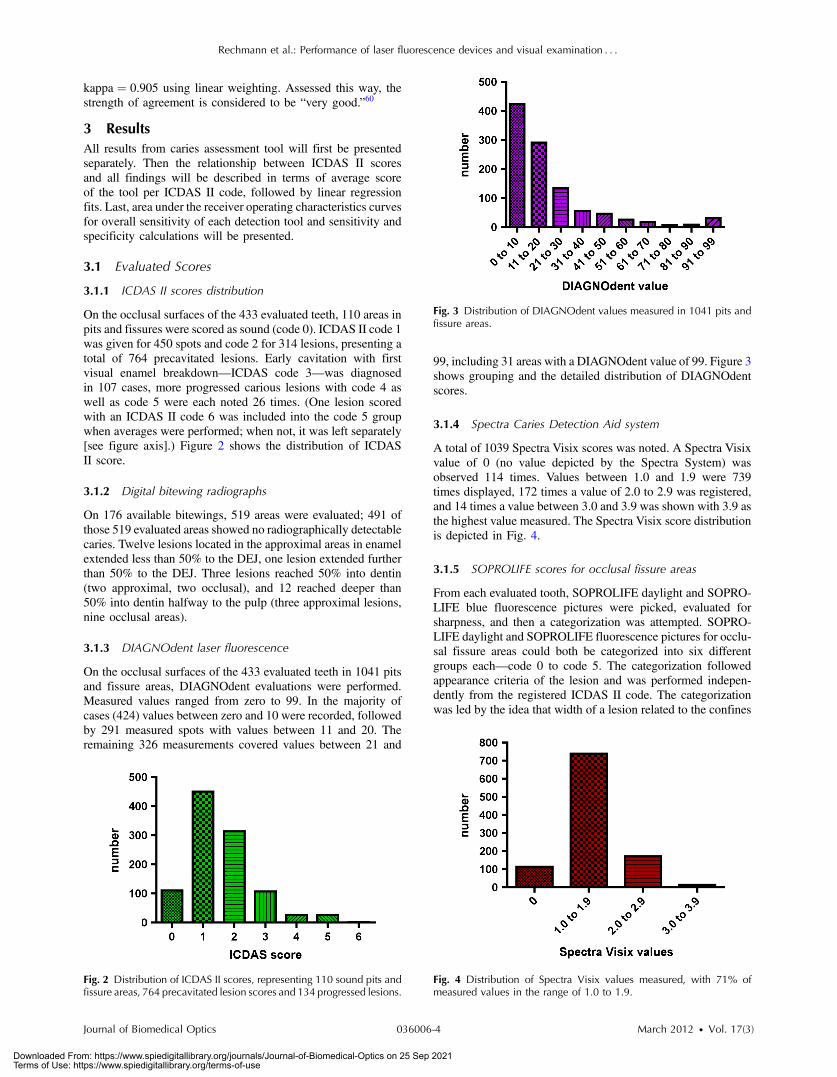
On the occlusal surfaces of the 433 evaluated teeth in 1041 pitsand fissure areas, DIAGNOdent evaluations were performed.Measured values ranged from zero to 99. In the majority ofcases (424) values between zero and 10 were recorded, followedby 291 measured spots with values between 11 and 20. Theremaining 326 measurements covered values between 21 and
99, including 31 areas with a DIAGNOdent value of 99. Figure 3shows grouping and the detailed distribution of DIAGNOdentscores.
3.1.4 Spectra Caries Detection Aid system
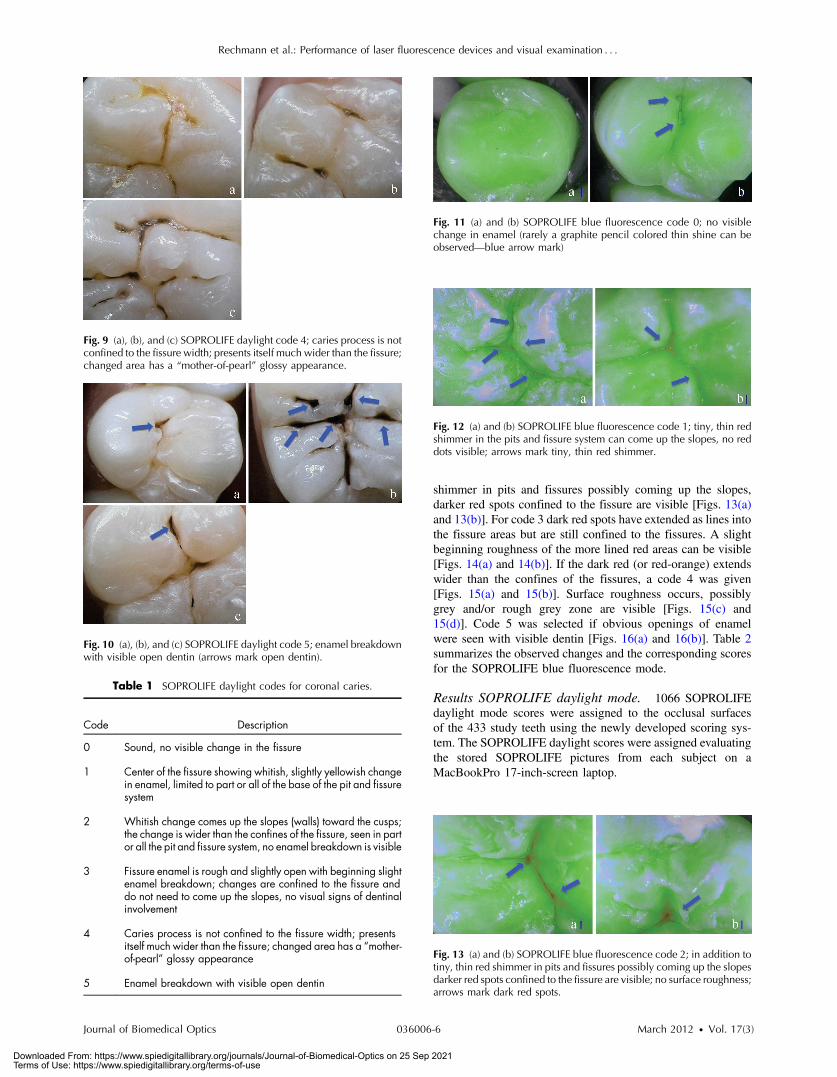
A total of 1039 Spectra Visix scores was noted. A Spectra Visixvalue of 0 (no value depicted by the Spectra System) wasobserved 114 times. Values between 1.0 and 1.9 were 739times displayed, 172 times a value of 2.0 to 2.9 was registered,and 14 times a value between 3.0 and 3.9 was shown with 3.9 asthe highest value measured. The Spectra Visix score distributionis depicted in Fig. 4.
3.1.5 SOPROLIFE scores for occlusal fissure areas
From each evaluated tooth, SOPROLIFE daylight and SOPRO-LIFE blue fluorescence pictures were picked, evaluated forsharpness, and then a categorization was attempted. SOPRO-LIFE daylight and SOPROLIFE fluorescence pictures for occlu-sal fissure areas could both be categorized into six differentgroups each—code 0 to code 5. The categorization followedappearance criteria of the lesion and was performed indepen-dently from the registered ICDAS II code. The categorizationwas led by the idea that width of a lesion related to the confines
Fig. 2 Distribution of ICDAS II scores, representing 110 sound pits andfissure areas, 764 precavitated lesion scores and 134 progressed lesions.
Fig. 3 Distribution of DIAGNOdent values measured in 1041 pits andfissure areas.
Fig. 4 Distribution of Spectra Visix values measured, with 71% ofmeasured values in the range of 1.0 to 1.9.
Rechmann et al.: Performance of laser fluorescence devices and visual examination : : :
Journal of Biomedical Optics 036006-4 March 2012 • Vol. 17(3)
Downloaded From: https://www.spiedigitallibrary.org/journals/Journal-of-Biomedical-Optics on 25 Sep 2021Terms of Use: https://www.spiedigitallibrary.org/terms-of-use
of fissures, difference in color, and intensity of the registeredcolor expressions as well as roughness of the enamel structure,break in enamel with first enamel loss, and finally visible dentinwould go along with the progression of a caries lesion. Thusprecavitated and cavitated lesions and their development levelswere categorized.
SOPROLIFE daylight mode score description and exam-ples. When evaluating occlusal fissure areas in SOPROLIFEdaylight mode, code 0 was given for sound enamel with nochanges in the fissure area [Figs. 5(a) and 5(b)]. Code 1 wasselected if the center of the fissure showedwhitish or slightly yel-lowish change in the enamel. In code 1 change is limited to part orall the base of the pit and fissure system [Figs. 6(a)–6(c)]. For acode 2 the whitish change extends the base of the pit and fissuresystem and comes up the slopes (walls) of the fissure systemtoward the cusps. The change is wider than the confines of thefissure and can be seen in part of or all the pit and fissure system.No enamel breakdown is visible [Figs. 7(a)–7(c)]. Code 3describes fissures with rough and slightly open areas depictinga beginning slight enamel breakdown. Changes are confined tothe fissure and do not need to come up the slopes. There areno visual signs of dentin involvement [Figs. 8(a)–8(c)]. Incode 4 the caries process is not confined to the fissure width any-more and presents itself much wider than the fissure; the due tocaries changed areas have a “mother-of-pearl” glossy appearance[Figs. 9(a)–9(c)]. If there is obvious enamel breakdown withvisible dentin code 5 was given [Figs. 10(a)–10(c)]. Table 1
summarizes the observed changes and the corresponding codesfor the SOPROLIFE daylight mode.
SOPROLIFE blue fluorescence mode score descriptionand examples. When evaluating occlusal fissure areas inSOPROLIFE blue fluorescence mode, code 0 was given whenthe fissure appears shiny green, the enamel appears sound, andthere are no visible changes [Fig. 11(a)]. Rarely a graphite-pencil-colored thin shine/line can be observed [Fig. 11(b)].Code 1 was selected if a tiny, thin red shimmer in the pitsand fissure system is observed, which can slightly come upthe slopes (walls) of the fissure system. No red dots are visible[Figs. 12(a) and 12(b)]. At code 2, in addition to the tiny, thin red
Fig. 5 (a) and (b) SOPROLIFE daylight code 0; no visible change in thefissure.
Fig. 6 (a), (b), and (c) SOPROLIFE daylight code 1; center of the fissureshowing whitish, slightly yellowish change in enamel, limited to part orall of the base of the pit and fissure system (see blue arrows).
Fig. 7 (a), (b), and (c) SOPROLIFE daylight code 2; whitish changecomes up the slopes (walls) toward the cusps; the change is widerthan the confines of the fissure, seen in part or all the pit and fissuresystem, no enamel breakdown is visible (blue arrows mark the changescoming up the slopes).
Fig. 8 (a), (b), and (c) SOPROLIFE daylight code 3; fissure enamel isrough and slightly open with beginning slight enamel breakdown;changes are confined to the fissure and do not need to come up theslopes, no visual signs of dentin involvement (blue arrow marks slightenamel loss).
Rechmann et al.: Performance of laser fluorescence devices and visual examination : : :
Journal of Biomedical Optics 036006-5 March 2012 • Vol. 17(3)
Downloaded From: https://www.spiedigitallibrary.org/journals/Journal-of-Biomedical-Optics on 25 Sep 2021Terms of Use: https://www.spiedigitallibrary.org/terms-of-use
shimmer in pits and fissures possibly coming up the slopes,darker red spots confined to the fissure are visible [Figs. 13(a)and 13(b)]. For code 3 dark red spots have extended as lines intothe fissure areas but are still confined to the fissures. A slightbeginning roughness of the more lined red areas can be visible[Figs. 14(a) and 14(b)]. If the dark red (or red-orange) extendswider than the confines of the fissures, a code 4 was given[Figs. 15(a) and 15(b)]. Surface roughness occurs, possiblygrey and/or rough grey zone are visible [Figs. 15(c) and15(d)]. Code 5 was selected if obvious openings of enamelwere seen with visible dentin [Figs. 16(a) and 16(b)]. Table 2summarizes the observed changes and the corresponding scoresfor the SOPROLIFE blue fluorescence mode.
Results SOPROLIFE daylight mode. 1066 SOPROLIFEdaylight mode scores were assigned to the occlusal surfacesof the 433 study teeth using the newly developed scoring sys-tem. The SOPROLIFE daylight scores were assigned evaluatingthe stored SOPROLIFE pictures from each subject on aMacBookPro 17-inch-screen laptop.
Fig. 10 (a), (b), and (c) SOPROLIFE daylight code 5; enamel breakdownwith visible open dentin (arrows mark open dentin).
Table 1 SOPROLIFE daylight codes for coronal caries.
Code Description
0 Sound, no visible change in the fissure
1 Center of the fissure showing whitish, slightly yellowish changein enamel, limited to part or all of the base of the pit and fissuresystem
2 Whitish change comes up the slopes (walls) toward the cusps;the change is wider than the confines of the fissure, seen in partor all the pit and fissure system, no enamel breakdown is visible
3 Fissure enamel is rough and slightly open with beginning slightenamel breakdown; changes are confined to the fissure anddo not need to come up the slopes, no visual signs of dentinalinvolvement
4 Caries process is not confined to the fissure width; presentsitself much wider than the fissure; changed area has a “mother-of-pearl” glossy appearance
5 Enamel breakdown with visible open dentin
Fig. 11 (a) and (b) SOPROLIFE blue fluorescence code 0; no visiblechange in enamel (rarely a graphite pencil colored thin shine can beobserved—blue arrow mark)
Fig. 9 (a), (b), and (c) SOPROLIFE daylight code 4; caries process is notconfined to the fissure width; presents itself much wider than the fissure;changed area has a “mother-of-pearl” glossy appearance.
Fig. 12 (a) and (b) SOPROLIFE blue fluorescence code 1; tiny, thin redshimmer in the pits and fissure system can come up the slopes, no reddots visible; arrows mark tiny, thin red shimmer.
Fig. 13 (a) and (b) SOPROLIFE blue fluorescence code 2; in addition totiny, thin red shimmer in pits and fissures possibly coming up the slopesdarker red spots confined to the fissure are visible; no surface roughness;arrows mark dark red spots.
Rechmann et al.: Performance of laser fluorescence devices and visual examination : : :
Journal of Biomedical Optics 036006-6 March 2012 • Vol. 17(3)
Downloaded From: https://www.spiedigitallibrary.org/journals/Journal-of-Biomedical-Optics on 25 Sep 2021Terms of Use: https://www.spiedigitallibrary.org/terms-of-use
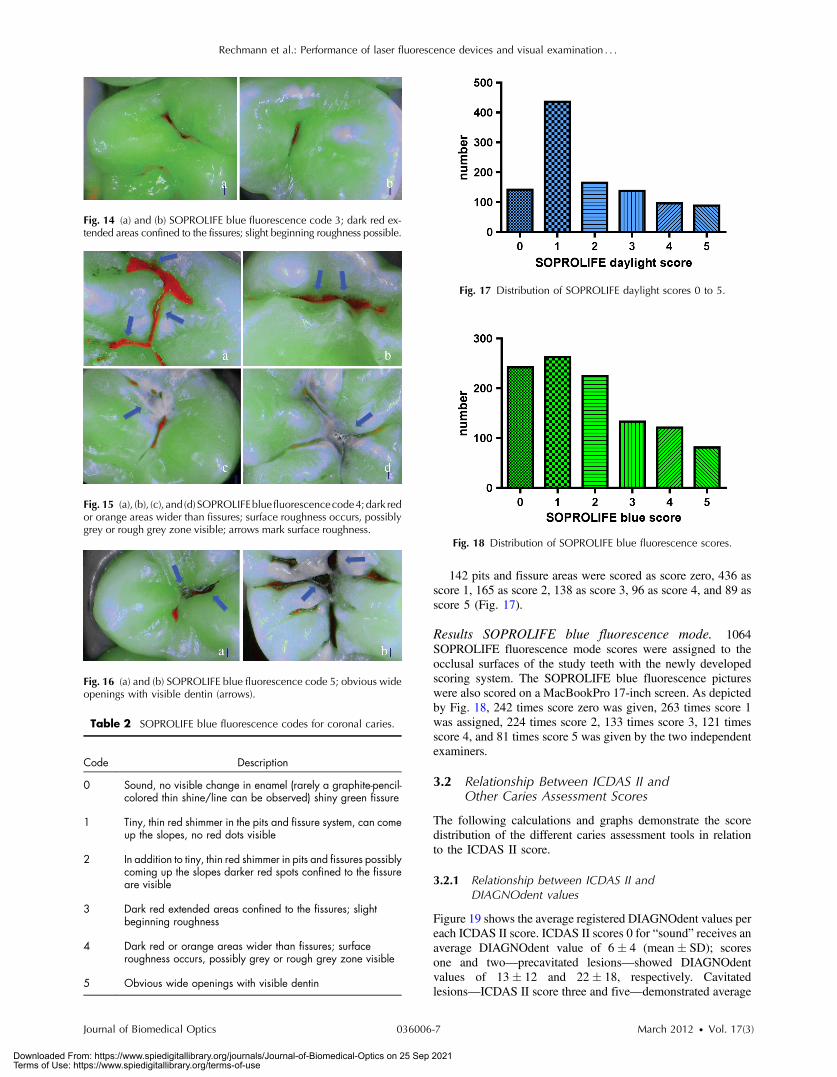
142 pits and fissure areas were scored as score zero, 436 asscore 1, 165 as score 2, 138 as score 3, 96 as score 4, and 89 asscore 5 (Fig. 17).
Results SOPROLIFE blue fluorescence mode. 1064SOPROLIFE fluorescence mode scores were assigned to theocclusal surfaces of the study teeth with the newly developedscoring system. The SOPROLIFE blue fluorescence pictureswere also scored on a MacBookPro 17-inch screen. As depictedby Fig. 18, 242 times score zero was given, 263 times score 1was assigned, 224 times score 2, 133 times score 3, 121 timesscore 4, and 81 times score 5 was given by the two independentexaminers.
3.2 Relationship Between ICDAS II andOther Caries Assessment Scores
The following calculations and graphs demonstrate the scoredistribution of the different caries assessment tools in relationto the ICDAS II score.
3.2.1 Relationship between ICDAS II andDIAGNOdent values
Figure 19 shows the average registered DIAGNOdent values pereach ICDAS II score. ICDAS II scores 0 for “sound” receives anaverage DIAGNOdent value of 6� 4 (mean� SD); scoresone and two—precavitated lesions—showed DIAGNOdentvalues of 13� 12 and 22� 18, respectively. Cavitatedlesions—ICDAS II score three and five—demonstrated average
Fig. 14 (a) and (b) SOPROLIFE blue fluorescence code 3; dark red ex-tended areas confined to the fissures; slight beginning roughness possible.
Fig. 15 (a), (b), (c), and (d) SOPROLIFEblue fluorescencecode4;dark redor orange areas wider than fissures; surface roughness occurs, possiblygrey or rough grey zone visible; arrows mark surface roughness.
Fig. 16 (a) and (b) SOPROLIFE blue fluorescence code 5; obvious wideopenings with visible dentin (arrows).
Table 2 SOPROLIFE blue fluorescence codes for coronal caries.
Code Description
0 Sound, no visible change in enamel (rarely a graphite-pencil-colored thin shine/line can be observed) shiny green fissure
1 Tiny, thin red shimmer in the pits and fissure system, can comeup the slopes, no red dots visible
2 In addition to tiny, thin red shimmer in pits and fissures possiblycoming up the slopes darker red spots confined to the fissureare visible
3 Dark red extended areas confined to the fissures; slightbeginning roughness
4 Dark red or orange areas wider than fissures; surfaceroughness occurs, possibly grey or rough grey zone visible
5 Obvious wide openings with visible dentin
Fig. 17 Distribution of SOPROLIFE daylight scores 0 to 5.
Fig. 18 Distribution of SOPROLIFE blue fluorescence scores.
Rechmann et al.: Performance of laser fluorescence devices and visual examination : : :
Journal of Biomedical Optics 036006-7 March 2012 • Vol. 17(3)
Downloaded From: https://www.spiedigitallibrary.org/journals/Journal-of-Biomedical-Optics on 25 Sep 2021Terms of Use: https://www.spiedigitallibrary.org/terms-of-use

DIAGNOdent values of 41� 25 and 77� 29, respectively.ICDAS II code 4 shows with 43� 32, a similar averagevalue as code 3.
The one-way ANOVA test with Newman-Keuls MultipleComparison Test revealed that all average DIAGNOdent valuesfor ICDAS II 0, 1, 2, 3, and 5 were statistically significant dif-ferent from each other with a P value of P ¼< 0.001. Only theaverage DIAGNOdent values comparing ICDAS II score 3 to 4were not statistically significant different.
3.2.2 ICDAS II and Caries Detection Aid systemSpectra Visix values
Figure 20 demonstrates the distribution of the average SpectraVisix values per ICDAS II score. ICDAS II score 0 shows anaverage Spectra Visix value of 0.7� 0.7 (mean� SD).ICDAS II score 1 and 2 demonstrate average Spectra Visixvalues of 1.3� 0.6 and 1.6� 0.5, respectively. Occlusal sur-faces with an ICDAS II score 4 show average values of2.0� 0.6, and ICDAS II score 5 pits and fissures demonstratea Spectra Visix value of 2.6� 0.6.
Spectra Visix average values are significantly different fromeach other for ICDAS II score 0, 1, 3, and 5 with P < 0.001, andfor score 2 and 4 with P < 0.05. Spectra Visix scores for ICDASII score 3 do not statistically significant differ from those givenfor ICDAS II score 4.
3.2.3 Relationship between ICDAS II and SOPROLIFEdaylight scores
Figure 21 demonstrates the different ICDAS II scores and thecorresponding distribution of the assigned SOPROLIFE day-light scores.
For surfaces, which were scored with ICDAS IIcode 0—“sound”—a SOPROLIFE daylight average score of0.47� 0.6 (mean� standard deviation) was given. For precavi-tated lesions—ICDAS II code 1 and 2—a SOPROLIFE daylightaverage score of 1.4� 1.1 and 2.1� 1.2, respectively, was given.
More severe caries lesions (cavitated) received significanthigher scores. An ICDAS II score 3—first visible breakdown ofenamel—received a 3.5� 1.3 SOPROLIFE daylight score anda carious lesion with visible dentin exposure was scored withan average 4.9� 0.4 SOPROLIFE daylight score. The one-wayANOVA test with Newman-Keuls multiple comparison testrevealed that all mean SOPROLIFE daylight scores for ICDAS0, 1, 2, 3, and 5 were statistically significant different from eachother with a P value of P < 0.001. The average SOPROLIFE day-light score for ICDAS II score 4 (3.9� 1.4) was not significantlydifferent from the average for ICDAS score 3 but still significantlydifferent from the average given for ICDAS II score 5 (P < 0.01).
3.2.4 Relationship between ICDAS II and SOPROLIFEblue fluorescence scores
Figure 22 demonstrates the different ICDAS II scores and thecorresponding distribution of the assigned SOPROLIFE bluefluorescence scores. The distribution patterns are very close
Fig. 19 Distribution of average DIAGNOdent values per ICDAS IIscore, (mean� SD).
Fig. 20 Distribution of average Spectra Visix per ICDAS II score,(mean� SD).
Fig. 21 Distribution of average SOPROLIFE daylight scores per ICDAS IIscore, (mean� SD).
Fig. 22 Distribution of average SOPROLIFE blue fluorescence scoresper ICDAS II score, (mean� SD).
Rechmann et al.: Performance of laser fluorescence devices and visual examination : : :
Journal of Biomedical Optics 036006-8 March 2012 • Vol. 17(3)
Downloaded From: https://www.spiedigitallibrary.org/journals/Journal-of-Biomedical-Optics on 25 Sep 2021Terms of Use: https://www.spiedigitallibrary.org/terms-of-use

to the above-described patterns for the average SOPROLIFEdaylight scores. The average SOPROLIFE blue fluorescencescores differed minimally or not at all from the SOPROLIFEdaylight average scores for the different ICDAS II score groups.
An ICDAS II score 0 received an average SOPROLIFE bluefluorescence score of 0.35� 0.5 (mean� standard deviation)—slightly lower than the SOPROLIFE daylight score (lower by0.13). For precavitated lesions—ICDAS II score 1 and 2—theSOPROLIFE blue fluorescence scores of 1.5� 1.2 and2.0� 1.4, respectively, were given. The average SOPROLIFEblue fluorescence score for ICDAS II score 3 lesions was3.6� 1.1. Caries lesions with visible dentin exposure (ICDASII score 5) were scored with an average 4.8� 0.5 score.Again, the one-way ANOVA test with Newman-Keuls MultipleComparison Test revealed that all mean SOPROLIFE bluefluorescence scores for ICDAS 0, 1, 2, 3, and 5 werestatistically significant different from each other with a valueof P < 0.001.
Similar to the SOPROLIFE daylight scores the averageSOPROLIFE blue fluorescence score for ICDAS II score 4(3.8� 1.4) was not significantly different from the averagefor ICDAS score 3 but still significantly different from theaverage given for ICDAS II score 5 (P < 0.01).
3.3 Linear Regression Fits for Caries AssessmentTools in Relation to ICDAS II Scores
To evaluate for each assessment method the discriminationbetween two different scores of a system, regression curveswere calculated for each caries assessment tool.
The following graph (Fig. 23) combines the linear regressionfit for all four assessment tools—DIAGNOdent, SOPROLIFEdaylight and blue fluorescence, and Spectra Caries DetectionAid—in relation to the ICDAS scores in one plot. In order toproduce this overview, data had to be normalized to achievea y-axis value range between 0 and 5 (DIAGNOdent valueswere adjusted with a factor of 0.04x; the other values werenot adjusted).
The slopes of the regression lines for all tools are signifi-cantly nonzero (SOPROLIFE daylight P < 0.0001 and bluefluorescence P ¼ 0.0002, DIAGNOdent P ¼ 0.0022, SpectraCaries Detection Aid P ¼ 0.0010). The slopes of the regressionlines are the highest/steepest for both SOPROLIFE assessmentmethods, followed by DIAGNOdent and Spectra Caries Detec-tion Aid. The slopes of the regression lines are 0.8809 forSOPROLIFE daylight (�0.04984) and SOPROLIFE blue
fluorescence (�0.06866), 0.6600 (�0.09479) for DIAGNO-dent, and 0.3357 (�0.03849) for Spectra Caries Detection Aid.
The goodness of fit for SOPROLIFE daylight wasr2 ¼ 0.9874, for SOPROLIFE blue fluorescence 0.9763, forDIAGNOdent 0.9238 and for Spectra Visix 0.9501.
3.4 Area Under the Receiver OperatingCharacteristics Curves
To quantify the overall ability of the different applied cariesdetection tools to discriminate between those individuals withthe disease and those without the disease, we have looked atdifferent ICDAS scores and grouping of ICDAS scores to eval-uate the area under the receiver operating characteristics curves(AROC) for DIAGNOdent, SOPROLIFE blue fluorescence, andSpectra Caries Detection Aid.
In the past, caries lesions have typically only been defined as“cavity,” thus our basic approach was to sum all ICDAS valuescorresponding to no or precavitated lesions together as“healthy” and compare them to the remaining “disease” scores.Thus in the following calculations the values for the differentdetection tools related to the ICDAS II codes 0, 1, and 2 areplaced into one group to represent healthy conditions. Valuesdefined by ICDAS code 3 (first visible enamel breakdown)and higher will be grouped together to represent carious lesions.
In a second approach, values derived only from ICDAS IIcode 0 locations were compared to all other values. Further-more, values originated from ICDAS II scores 0 and 1 weresummed together in one group as healthy. None of those addi-tional approaches delivered superior results over placing valuesfrom ICDAS code 0, 1, and 2 locations into one group. Thus wewill only present ROC curves for values originated from sum-ming ICDAS II score 0, 1, and 2 together in one group (ICDAS0-1-2).
The area under the ROC curvewas interpreted by using the fol-lowing classification:61 0.60 to 0.75 ¼ fair; 0.75 to 0.90 ¼ good;0.90 to 0.97 ¼ very good; and 0.97 to 1.00 ¼ excellent.
The highest area under the ROC curve value, thus the highestoverall ability to discriminate between “carious” and “noncar-ious,” is achieved for the SOPROLIFE blue fluorescence toolwith AROC ¼ 0.8854� 0.01400 (SE), and a 95% confidenceinterval of 0.8580 to 0.9128 and a P value <0.0001(Fig. 24). This is followed by the SOPROLIFE daylight assess-ment with an area under the curve value of 0.8779� 0.01505.
Fig. 23 Linear regression fit for SOPROLIFE daylight and blue fluores-cence, DIAGNOdent and Spectra Visix values in respect to ICDAS IIscores, all data are normalized.
Fig. 24 AROC curve for SOPROLIFE blue fluorescence is0.8854� 0.01400 (SE), 0.8580 to 0.9128 (95% confidence interval)with a P value <0.0001.
Rechmann et al.: Performance of laser fluorescence devices and visual examination : : :
Journal of Biomedical Optics 036006-9 March 2012 • Vol. 17(3)
Downloaded From: https://www.spiedigitallibrary.org/journals/Journal-of-Biomedical-Optics on 25 Sep 2021Terms of Use: https://www.spiedigitallibrary.org/terms-of-use

For the DIAGNOdent tool, the area under the ROCcurve was slightly smaller with 0.8700� 0.01410 (Fig. 25).The Spectra Visix receives the smallest area under the ROCcurve with 0.8186� 0.01939 (Fig. 26). Table 3 shows addition-ally confidence intervals and P values for all diagnosticmethods.
Using the grouping of ICDAS II code 0-1-2 as “healthy”results in the highest area under the ROC value for the allfour diagnostic methods. All methods received an area underthe curve value, which is regarded as a “good” overall sensitivityof the diagnostic method.61
3.5 Sensitivity and Specificity of Caries AssessmentTools at Different ICDAS Cutoff Points
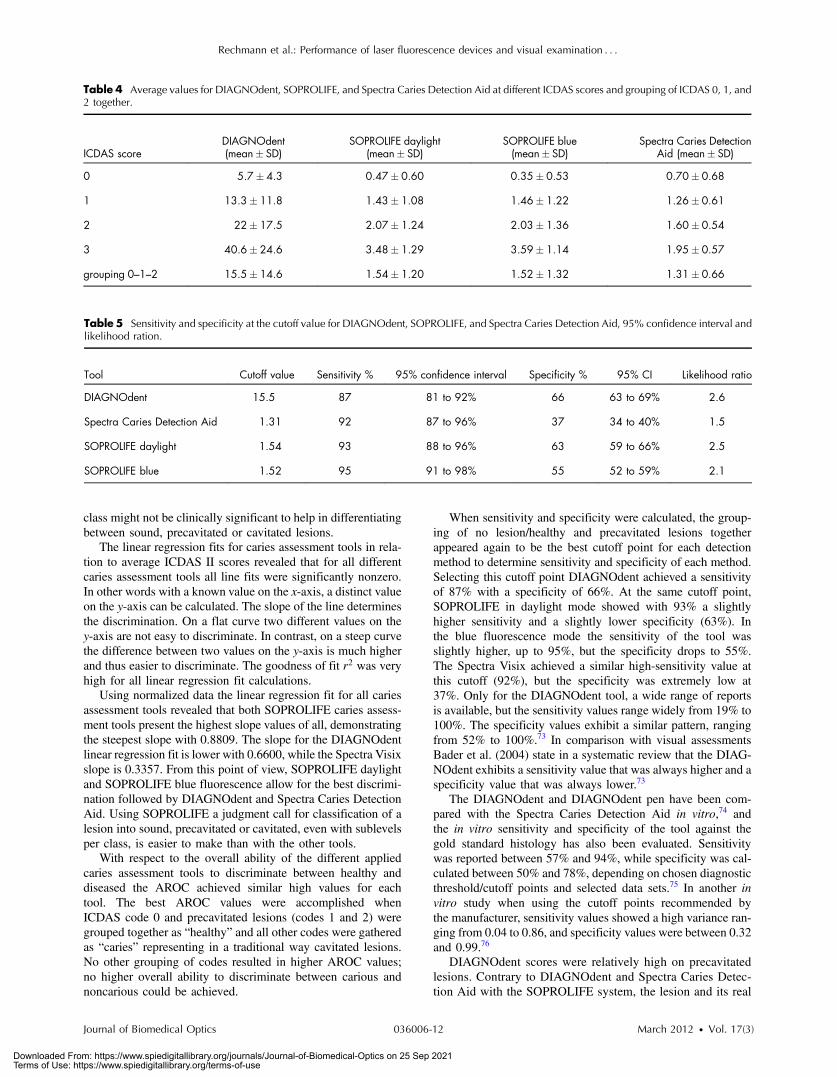
In a next step, sensitivity and specificity of all four cariesdetection systems were calculated. As cutoff point, thecorresponding value for ICDAS grouping of score 0, 1, and 2together as healthy and noncavitated lesions was chosen(Figs. 27–29). Table 4 shows in addition to the average scores(mean� standard deviation) for each diagnostic method forthe grouping of code 1, 2, and 3 together as overview the averagevalues for ICDAS code 1, 2, and 3, separately. If the value forgrouping ICDAS code 0, 1, and 2 is chosen as cutoff point forthe sensitivity calculation, the average value for DIAGNOdentis 15.5 with a corresponding sensitivity of 87% and a specificityof 66%. With the same ICDAS cutoff, Spectra Caries DetectionAid at its corresponding cutoff value of 1.3 achieves a sensitivityof 92%, but the specificity is only 37%. SOPROLIFE in daylightmodewith an equivalent cutoff value of 1.54 presents a sensitivityof 93% and specificity of 63%, while SOPROLIFE blue fluores-cence with cutoff value of 1.52 shows a sensitivity of 95%, butthe specificity is down to 55%. Table 5 summarizes the specifictool cutoff values for grouping ICDAS0with 1 and2 as “healthy,”the sensitivity and specificity at this cutoff, confidence intervals,and likelihood ratio.
4 DiscussionOver the years diverse caries detection systems have been used,all of them using different definitions and description terms;consequently communication across different dental fields hasbeen difficult. The visual method known as the InternationalCaries Detection and Assessment System II (ICDAS II) hasbeen developed with the purpose of bridging the gap of com-munication between fields of dental epidemiology, clinical car-ies research, and clinical caries management.10
ICDAS criteria are based on enamel properties of translu-cency and microporosity. With numerous demineralizationevents, the microporosity of enamel subsurface increases,which leads to changes in its refractive index. The first signof carious alteration is a change in translucency and light refrac-tion of the enamel surface. If demineralization is allowed to con-tinue, the enamel microporosity increases, which then leads tofurther decrease in the refractive index of enamel.62
Ekstrand et al.46,63,64 validated ICDAS by demonstrating anassociation between the severity of caries lesions (as describedby ICDAS codes) and the lesions’ histological depth. Otherauthors have confirmed a close relationship between ICDASscoring, and the histological depth of the caries lesion especiallyin precavitated but also in slightly cavitated stages.65,66 These
Fig. 25 AROC curve for the DIAGNOdent is 0.8700 (SE), 0.8423 to0.8976 (95% confidence interval), with a P value <0.0001.
Fig. 26 AROC curve for Spectra Visix is 0.8186� 0.01939 (SE), 0.7806to 0.8566 (95% confidence interval) with a P value <0.0001.
Table 3 Area under the ROC curve for SOPROLIFE, DIAGNOdent, and Spectra Caries Detection Aid.
Area under ROC curve value (SE) 95% confidence interval P value
SOPROLIFE blue fluorescence 0.8854� 0.01400 0.8580 to 0.9128 P < 0.0001
SOPROLIFE daylight 0.8779� 0.01505 0.8484 to 0.9074 P < 0.0001
DIAGNOdent 0.8700� 0.01410 0.8423 to 0.8976 P < 0.0001
Spectra Caries Detection Aid 0.8186� 0.01939 0.7806 to 0.8566 P < 0.0001
Rechmann et al.: Performance of laser fluorescence devices and visual examination : : :
Journal of Biomedical Optics 036006-10 March 2012 • Vol. 17(3)
Downloaded From: https://www.spiedigitallibrary.org/journals/Journal-of-Biomedical-Optics on 25 Sep 2021Terms of Use: https://www.spiedigitallibrary.org/terms-of-use

studies again endorsed a relationship between the visualtopography at surface level and the histological lesion depth.
ICDAS II code and relation to histological lesion depth hasbeen reported as: code 1, lesion depth in pits/fissures was 90% inthe outer enamel with only 10% into dentin; code 2, lesion depthwas 50% into the inner enamel and 50% into the outer 1∕3 den-tin; code 3, lesion depth was 77% in dentin; code 4, lesion depthwas 88% into dentin; code 5, lesion depth was 100% in dentin.63
Due to the validated relationship between ICDAS codes andthe histological depth of a carious lesion, ICDAS II was used as“gold standard” in the present study. ICDAS II ratings were
compared to four other caries assessment tools, includingDIAGNOdent, SOPROLIFE daylight and blue fluorescence,and Spectra Caries Detection Aid. Digital bitewings are not dis-cussed further here since they only showed occlusal lesions innine cases, therefore not detecting occlusal lesions in the bulk ofthe teeth examined and were only successful in detectingapproximal lesions.
In this study 433 posterior teeth in 100 subjects were exam-ined and up to 1066 data points for each assessment methodwere available for statistical evaluation. Using 1066 SOPRO-LIFE daylight and 1064 blue fluorescence areas of interestled to the development of a new SOPROLIFE daylight andblue fluorescence scoring system with six distinct codes foreach detection mode. Developing those codes enabled us tocompare the diagnostic abilities of the SOPROLIFE systemwith ICDAS II as well as the other caries assessment tools.
Examining the relationship between the ICDAS II scores andthe scores derived from the different assessment tools revealedthat for each ICDAS II code, each diagnostic tool provides adistinct average score. Per assessment tool each averagescore for one given ICDAS II code was significantly differentfrom the one for another ICDAS II code. Interestingly, forall tools there was a difference in average values for ICDAS IIcode 3 versus code 4 with the average for code 4 higher, but thatdifference was not statistically significant. One explanationcould be that only 25 lesions were scored with ICDAS IIcode 4.
DIAGNOdent as a spot fluorescence measurement tool hasbeen previously discussed for its clinical validity.23–29 The dis-cussion about an appropriate cutoff point to determine an opera-tive intervention (filling) is ongoing.67–71 The companyrecommends a cutoff point between 15 and 30 depending oncaries risk. Eakle et al. recommended as cutoff point a DIAG-NOdent value of 25 to 30.72 If an ICDAS code 3—first visua-lized breakdown of enamel—is considered as reason for anoperative intervention, according to our study the equivalentDIAGNOdent value is located around 40, while for code 2 itis around 22.
ICDAS II code 0—“sound”—accumulated a very lowSOPROLIFE daylight average score of 0.47� 0.6
(mean� standard deviation). Noncavitated lesions (ICDAS IIcode 1 and 2, respectively) provided significantly higherSOPROLIFE daylight scores of 1.4� 1.1 and 2.1� 1.2, respec-tively. More severe, already slightly cavitated caries lesions withfirst visible enamel breakdown (ICDAS II code 3) received sig-nificant higher scores with 3.5� 1.3, and when even dentin wasvisibly exposed (ICDAS II code 5) the SOPROLIFE daylightclimbed to a 4.9� 0.4 score. For SOPROLIFE blue fluores-cence the distribution pattern as well as the values for averagescores were similar and close to the SOPROLIFE daylightassessments.
The absolute value differences between those average scoresare high enough to allow the conclusion that the differencebetween each code is not only statistically but clinically signifi-cant. Thus the new SOPROLIFE daylight and blue fluorescencecodes can serve as a distinct classification for sound, precavi-tated and cavitated caries lesions allowing the prediction ofthe histological depth of caries lesions.
Last, when comparing average Spectra Visix values for eachICDAS II code, the differences in values for each ICDAS II codeare statistically significant, but the absolute value differences arerelatively small. Those small differences in value for each lesion
Fig. 27 Sensitivity and specificity of the DIAGNOdent; cutoff point atthe grouping of ICDAS code 0, 1, and 2 together.
Fig. 28 Sensitivity and specificity of the SOPROLIFE blue fluorescence;cutoff point at the grouping of ICDAS code 0, 1, and 2 together.
Fig. 29 Sensitivity and specificity of the Spectra Caries Detection Aid;cutoff point at grouping of ICDAS code 0, 1, and 2 together.
Rechmann et al.: Performance of laser fluorescence devices and visual examination : : :
Journal of Biomedical Optics 036006-11 March 2012 • Vol. 17(3)
Downloaded From: https://www.spiedigitallibrary.org/journals/Journal-of-Biomedical-Optics on 25 Sep 2021Terms of Use: https://www.spiedigitallibrary.org/terms-of-use
class might not be clinically significant to help in differentiatingbetween sound, precavitated or cavitated lesions.
The linear regression fits for caries assessment tools in rela-tion to average ICDAS II scores revealed that for all differentcaries assessment tools all line fits were significantly nonzero.In other words with a known value on the x-axis, a distinct valueon the y-axis can be calculated. The slope of the line determinesthe discrimination. On a flat curve two different values on they-axis are not easy to discriminate. In contrast, on a steep curvethe difference between two values on the y-axis is much higherand thus easier to discriminate. The goodness of fit r2 was veryhigh for all linear regression fit calculations.
Using normalized data the linear regression fit for all cariesassessment tools revealed that both SOPROLIFE caries assess-ment tools present the highest slope values of all, demonstratingthe steepest slope with 0.8809. The slope for the DIAGNOdentlinear regression fit is lower with 0.6600, while the Spectra Visixslope is 0.3357. From this point of view, SOPROLIFE daylightand SOPROLIFE blue fluorescence allow for the best discrimi-nation followed by DIAGNOdent and Spectra Caries DetectionAid. Using SOPROLIFE a judgment call for classification of alesion into sound, precavitated or cavitated, even with sublevelsper class, is easier to make than with the other tools.
With respect to the overall ability of the different appliedcaries assessment tools to discriminate between healthy anddiseased the AROC achieved similar high values for eachtool. The best AROC values were accomplished whenICDAS code 0 and precavitated lesions (codes 1 and 2) weregrouped together as “healthy” and all other codes were gatheredas “caries” representing in a traditional way cavitated lesions.No other grouping of codes resulted in higher AROC values;no higher overall ability to discriminate between carious andnoncarious could be achieved.
When sensitivity and specificity were calculated, the group-ing of no lesion/healthy and precavitated lesions togetherappeared again to be the best cutoff point for each detectionmethod to determine sensitivity and specificity of each method.Selecting this cutoff point DIAGNOdent achieved a sensitivityof 87% with a specificity of 66%. At the same cutoff point,SOPROLIFE in daylight mode showed with 93% a slightlyhigher sensitivity and a slightly lower specificity (63%). Inthe blue fluorescence mode the sensitivity of the tool wasslightly higher, up to 95%, but the specificity drops to 55%.The Spectra Visix achieved a similar high-sensitivity value atthis cutoff (92%), but the specificity was extremely low at37%. Only for the DIAGNOdent tool, a wide range of reportsis available, but the sensitivity values range widely from 19% to100%. The specificity values exhibit a similar pattern, rangingfrom 52% to 100%.73 In comparison with visual assessmentsBader et al. (2004) state in a systematic review that the DIAG-NOdent exhibits a sensitivity value that was always higher and aspecificity value that was always lower.73
The DIAGNOdent and DIAGNOdent pen have been com-pared with the Spectra Caries Detection Aid in vitro,74 andthe in vitro sensitivity and specificity of the tool against thegold standard histology has also been evaluated. Sensitivitywas reported between 57% and 94%, while specificity was cal-culated between 50% and 78%, depending on chosen diagnosticthreshold/cutoff points and selected data sets.75 In another invitro study when using the cutoff points recommended bythe manufacturer, sensitivity values showed a high variance ran-ging from 0.04 to 0.86, and specificity values were between 0.32and 0.99.76
DIAGNOdent scores were relatively high on precavitatedlesions. Contrary to DIAGNOdent and Spectra Caries Detec-tion Aid with the SOPROLIFE system, the lesion and its real
Table 5 Sensitivity and specificity at the cutoff value for DIAGNOdent, SOPROLIFE, and Spectra Caries Detection Aid, 95% confidence interval andlikelihood ration.
Tool Cutoff value Sensitivity % 95% confidence interval Specificity % 95% CI Likelihood ratio
DIAGNOdent 15.5 87 81 to 92% 66 63 to 69% 2.6
Spectra Caries Detection Aid 1.31 92 87 to 96% 37 34 to 40% 1.5
SOPROLIFE daylight 1.54 93 88 to 96% 63 59 to 66% 2.5
SOPROLIFE blue 1.52 95 91 to 98% 55 52 to 59% 2.1
Table 4 Average values for DIAGNOdent, SOPROLIFE, and Spectra Caries Detection Aid at different ICDAS scores and grouping of ICDAS 0, 1, and2 together.
ICDAS scoreDIAGNOdent(mean� SD)
SOPROLIFE daylight(mean� SD)
SOPROLIFE blue(mean� SD)
Spectra Caries DetectionAid (mean� SD)
0 5.7� 4.3 0.47� 0.60 0.35� 0.53 0.70� 0.68
1 13.3� 11.8 1.43� 1.08 1.46� 1.22 1.26� 0.61
2 22� 17.5 2.07� 1.24 2.03� 1.36 1.60� 0.54
3 40.6� 24.6 3.48� 1.29 3.59� 1.14 1.95� 0.57
grouping 0–1–2 15.5� 14.6 1.54� 1.20 1.52� 1.32 1.31� 0.66
Rechmann et al.: Performance of laser fluorescence devices and visual examination : : :
Journal of Biomedical Optics 036006-12 March 2012 • Vol. 17(3)
Downloaded From: https://www.spiedigitallibrary.org/journals/Journal-of-Biomedical-Optics on 25 Sep 2021Terms of Use: https://www.spiedigitallibrary.org/terms-of-use

topography can be seen in a magnified enlarged view. Thelesion extension in terms of confinement of the lesion to thefissure, extending from the base of the fissure up the slopesetc., as well as the physical surface topography with roughnessand with first enamel loss or even open dentin, can clearly beseen. This helps in scoring a lesion in daylight mode. Addingthe blue fluorescence an additional prediction can be madefrom the “color scheme,” especially intensity and spread ofthe fluorescence color, which are reflected in the newSOPROLIFE blue fluorescence score. We assume from ourobservations in this study that the fluorescence signal andexpression are most probably triggered and modified bybacteria and bacteria byproducts. The blue light transmitsthrough healthy enamel and evokes a green fluorescence ofthe dentin core. The green fluorescence light coming backfrom the dentin core then leads to a red fluorescence frombacteria and bacterial byproducts like porphyrins. The predic-tion of lesion depth and stage is guided by scoring detailslike tiny shiny red fluorescence, red dots confined to the fis-sure, dark red fluorescence confined to the fissure, intense redwider than the fissure confinement possibly including greyareas wider than the fissure, and additional roughness. Bothevaluation modes allow the definition of the lesion width aswell as an assumption of the histological lesion depth.
The additional observation with the SOPROLIFE cameramight also prevent unnecessary operative interventions basedon high fluorescence scores due to the better visibility. Thefluorescence camera system allows picturing where the fluores-cence signal comes from and, especially, what the reason for anunexpected high fluorescence value might be. Due to that “vis-ibility” of the lesion, the interpretation of a higher fluorescenceanswers is easier. The observation capacity of the SOPROLIFEsystem should guide the clinician toward a more preventive andminimally invasive treatment strategy with monitoring lesionprogression or remineralization over time and not tempt him/her to overtreat a lesion.77
5 ConclusionAll fluorescence tools were able to differentiate between distinctICDAS II scores. For all tools the AROC depicting the overallcapability to discriminate between healthy and diseased achievedsimilar high values with the SOPROLIFE tool in daylight as wellas blue fluorescence mode having the highest values. Further-more, the linear regression fits for the caries assessment toolsin relation to ICDAS II codes revealed that both SOPROLIFEassessment tools with the highest slope values allow for thebest caries lesion discrimination followed by DIAGNOdent.Spectra Caries Detection Aid demonstrates a relatively flatcurve with low discrimination ability. At a cutoff point groupinghealthy teeth and precavitated lesions together, DIAGNOdentshows a sensitivity of 87% and specificity of 66%, followedby SOPROLIFE daylight with sensitivity to specificity 93% to63%, SOPROLIFE blue fluorescence with 95% to 55%, andSpectra Caries Detection Aid with 92% to 37%. Engagingthose fluorescence tools, specifically those with observationalcapacity should guide clinicians toward a more preventive andminimally invasive treatment strategy and will allow monitoringlesions for success of prevention measures over time.
AcknowledgmentThis work was supported by ACTEON, France.
References1. A. Lussi, “Validity of diagnostic and treatment decisions of fissure
caries,” Caries Res. 25(4), 296–303 (1991).2. J. D. Featherstone, “Caries detection and prevention with laser energy,”
Dent. Clin. North Am. 44(4), 955–969, ix (2000).3. D. A. Young, J. D. Featherstone, and J. R. Roth, “Curing the silent
epidemic: caries management in the 21st century and beyond,”J. Calif. Dent. Assoc. 35(10), 681–685 (2007).
4. D. A. Young et al., “Caries management by risk assessment: implemen-tation guidelines,” J. Calif. Dent. Assoc. 35(11), 799–805 (2007).
5. L. Jenson et al., “Clinical protocols for caries management by riskassessment,” J. Calif. Dent. Assoc. 35(10), 714–723 (2007).
6. S. Domejean-Orliaguet, S. A. Gansky, and J. D. Featherstone, “Cariesrisk assessment in an educational environment,” J. Dent. Educ. 70(12),1346–1354 (2006).
7. J. D. B. Featherstone et al., “Chlorehexidine and fluoride therapyreduces caries risk,” J. Dent. Res. 84A (2005).
8. C. I. Hoover et al., “Effect of a caries management regimen on cario-genic bacterial population,” J. Dent. Res. 83A (2004).
9. J. D. Featherstone, “The caries balance: the basis for caries managementby risk assessment,” Oral Health Prev. Dent. 2, Suppl 1, 259–264(2004).
10. ICDAS and Foundation, “International Caries Detection & AssessmentSystem,” http://www.icdas.org.
11. C. M. Mitropoulos, “The use of fibre-optic transillumination in thediagnosis of posterior approximal caries in clinical trials,” CariesRes. 19(4), 379–384 (1985).
12. C. Deery et al., “Prevalence of dental caries in Latvian 11- to 15-year-old children and the enhanced diagnostic yield of temporary toothseparation, FOTI and electronic caries measurement,” Caries Res.34(1), 2–7 (2000).
13. D. F. Cortes, R. P. Ellwood, and K. R. Ekstrand, “An in vitro comparisonof a combined FOTI/visual examination of occlusal caries with othercaries diagnostic methods and the effect of stain on their diagnosticperformance,” Caries Res. 37(1), 8–16 (2003).
14. D. A. Young and J. D. Featherstone, “Digital imaging fiber-optic trans-illumination, F-speed radiographic film and depth of approximallesions,” J. Am. Dent. Assoc. 136(12), 1682–1687 (2005).
15. J. Vaarkamp et al.“Quantitative diagnosis of small approximal carieslesions utilizing wavelength-dependent fiber-optic transillumination,”J. Dent. Res. 76(4), 875–882 (1997).
16. A. Schneiderman et al.“Assessment of dental caries with DigitalImaging Fiber-Optic TransIllumination (DIFOTI): in vitro study,”Caries Res. 31(2), 103–110 (1997).
17. A. Lussi et al., “Performance and reproducibility of a laser fluorescencesystem for detection of occlusal caries in vitro,” Caries Res. 33(4),261–266 (1999).
18. A. Lussi, R. Hibst, and R. Paulus, “DIAGNOdent: an opticalmethod for caries detection,” J. Dent. Res. 83C, C80–83 (2004).
19. E. H. Verdonschot and M. H. van der Veen, “Lasers in dentistry 2.Diagnosis of dental caries with lasers,” Ned Tijdschr Tandheelkd109(4), 122–126 (2002).
20. K. Konig, G. Flemming, and R. Hibst, “Laser-induced autofluorescencespectroscopy of dental caries,” Cell Mol. Biol. (Noisy-le-grand)44(8), 1293–1300 (1998).
21. X. Q. Shi, U. Welander, and M. B. Angmar, “Occlusal caries detectionwith KaVo DIAGNOdent and radiography: an in vitro comparison,”Caries Res. 34(2), 151–158 (2000).
22. X. Q. Shi, S. Tranaeus, and B. Angmar-Mansson, “Validation of DIAG-NOdent for quantification of smooth-surface caries: an in vitro study,”Acta Odontol. Scand. 59(2), 74–78 (2001).
23. R. O. Rocha et al., “In vivo effectiveness of laser fluorescencecompared to visual inspection and radiography for the detection ofocclusal caries in primary teeth,” Caries Res. 37(6), 437–441(2003).
24. A. Astvaldsdottir, W. P. Holbrook, and S. Tranaeus, “Consistency ofDIAGNOdent instruments for clinical assessment of fissure caries,”Acta Odontol. Scand. 62(4), 193–198 (2004).
25. S. Tranaeus et al., “In vivo validity and reliability of IR fluorescencemeasurements for caries detection and quantification,” Swed. Dent. J.28(4), 173–182 (2004).
Rechmann et al.: Performance of laser fluorescence devices and visual examination : : :
Journal of Biomedical Optics 036006-13 March 2012 • Vol. 17(3)
Downloaded From: https://www.spiedigitallibrary.org/journals/Journal-of-Biomedical-Optics on 25 Sep 2021Terms of Use: https://www.spiedigitallibrary.org/terms-of-use
26. M. Bamzahim, A. Aljehani, and X. Q. Shi, “Clinical performance ofDIAGNOdent in the detection of secondary carious lesions,” ActaOdontol. Scand. 63(1), 26–30 (2005).
27. V. Angnes et al., “Clinical effectiveness of laser fluorescence, visualinspection and radiography in the detection of occlusal caries,” CariesRes. 39(6), 490–495 (2005).
28. A. Reis et al., “Performance of methods of occlusal caries detectionin permanent teeth under clinical and laboratory conditions,” J. Dent.34(2), 89–96 (2006).
29. S. Akarsu and H. Koprulu, “In vivo comparison of the efficacy ofDIAGNOdent by visual inspection and radiographic diagnostictechniques in the diagnosis of occlusal caries,” J. Clin. Dent. 17(3),53–58 (2006).
30. M. J. Altenburger et al., “The evaluation of fluorescence changesafter application of casein phosphopeptides (CPP) and amorphous cal-cium phosphate (ACP) on early carious lesions,” Am. J. Dent. 23(4),188–192 (2010).
31. H. C. Benedict, “A note on the fluorescence of teeth in ultraviolet rays,”Science 67(1739), 442 (1928).
32. U. Hafstrom-Bjorkman et al., “Comparison of laser fluorescence andlongitudinal microradiography for quantitative assessment of in vitroenamel caries,” Caries Res. 26(4), 241–247 (1992).
33. Z. Emami et al., “Mineral loss in incipient caries lesions quantified withlaser fluorescence and longitudinal microradiography. A methodologicstudy,” Acta Odontol. Scand. 54(1), 8–13 (1996).
34. S. al-Khateeb et al., “Quantification of formation and remineralizationof artificial enamel lesions with a new portable fluorescence device,”Adv. Dent. Res. 11(4), 502–506 (1997).
35. S. al-Khateeb et al., “Laser fluorescence quantification of remineralisa-tion in situ of incipient enamel lesions: influence of fluoride supple-ments,” Caries Res. 31(2), 132–140 (1997).
36. E. de Josselin de Jong et al., “A new method for in vivo quantificationof changes in initial enamel caries with laser fluorescence,” Caries Res.29(1), 2–7 (1995).
37. S. Al-Khateeb et al., “A longitudinal laser fluorescence study of whitespot lesions in orthodontic patients,” Am. J. Orthod. Dentofacial.Orthop. 113(6), 595–602 (1998).
38. S. Tranaeus et al., “Application of quantitative light-induced fluores-cence to monitor incipient lesions in caries-active children. A compara-tive study of remineralisation by fluoride varnish and professionalcleaning,” Eur. J. Oral Sci. 109(2), 71–75 (2001).
39. S. Tranaeus et al., “In vivo repeatability and reproducibility of the quan-titative light-induced fluorescence method,” Caries Res. 36(1), 3–9(2002).
40. I. A. Pretty and R. P. Ellwood, “Comparison of paired visual assessmentand software analyses of changes in caries status over six months fromfluorescence images,” Caries Res. 41(2), 115–120 (2007).
41. W. Yin et al., “Reliability of quantitative laser fluorescence analysisof smooth surface lesions adjacent to the gingival tissues,” CariesRes. 41(3), 186–189 (2007).
42. A. G. Ferreira Zandona et al., “An in vitro comparison betweenlaser fluorescence and visual examination for detection of deminerali-zation in occlusal pits and fissures,” Caries Res. 32(3), 210–218(1998).
43. E. Terrer et al., “A new concept in restorative dentistry: light-inducedfluorescence evaluator for diagnosis and treatment. Part 1: Diagnosisand treatment of initial occlusal caries,” J. Cont. Dent. Pract.10(6), E086–094 (2009).
44. E. Terrer et al., “A new concept in restorative dentistry: LIFEDT-light-induced fluorescence evaluator for diagnosis and treatment: part 2—treatment of dentinal caries,” J. Cont. Dent. Pract. 11(1), E095–102(2010).
45. G. E. White, A. Tsamtsouris, and D. L. Williams, “Early detectionof occlusal caries by measuring the electrical resistance of thetooth,” J. Dent. Res. 57(2), 195–200 (1978).
46. K. R. Ekstrand, D. N. Ricketts, and E. A. Kidd, “Reproducibility andaccuracy of three methods for assessment of demineralization depthof the occlusal surface: an in vitro examination,” Caries Res. 31(3),224–231 (1997).
47. D. N. Ricketts et al., “Histological validation of electrical resistancemeasurements in the diagnosis of occlusal caries,” Caries Res. 30(2),148–155 (1996).
48. J. Kuhnisch, “An in vitro comparison between two methods of electricalresistance measurement for occlusal caries detection,” Caries Res.40(2), 104–111 (2006).
49. W. P. Rock and E. A. Kidd, “The electronic detection of demineralisa-tion in occlusal fissures,” Br. Dent. J. 164(8), 243–247 (1988).
50. E. H. Verdonschot et al., “Performance of some diagnostic systemsin examinations for small occlusal carious lesions,” Caries Res. 26(1),59–64 (1992).
51. M. C. Huysmans et al., “Surface-specific electrical occlusal caries diag-nosis: reproducibility, correlation with histological lesion depth, andtooth type dependence,” Caries Res. 32(5), 330–336 (1998).
52. D. Huang et al., “Optical coherence tomography,” Science 254(5035),1178–1181 (1991).
53. A. F. Fercher et al., “In vivo optical coherence tomography,” Am. J.Ophthalmol. 116(1), 113–114 (1993).
54. G. J. Tearney et al., “In vivo endoscopic optical biopsy with opticalcoherence tomography,” Science 276(5321), 2037–2039 (1997).
55. B. W. Colston, Jr. et al., “Imaging of hard- and soft-tissue structure inthe oral cavity by optical coherence tomography,” Appl. Opt. 37(16),3582–3585 (1998).
56. J. G. Fujimoto et al., “High-resolution in vivo intra-arterial imaging withoptical coherence tomography,” Heart 82(2), 128–133 (1999).
57. D. Fried et al., “Imaging caries lesions and lesion progression withpolarization sensitive optical coherence tomography,” J. Biomed.Opt. 7(4), 618–627 (2002).
58. R. S. Jones et al., “Imaging artificial caries on the occlusal surfaces withpolarization-sensitive optical coherence tomography,” Caries Res.40(2), 81–89 (2006).
59. R. S. Jones et al., “Remineralization of in vitro dental caries assessedwith polarization-sensitive optical coherence tomography,” J. Biomed.Opt. 11(1), 014016-1–014016-9 (2006).
60. GraphPad, “Quantify Agreement with Kappa: Assess how well twoobservers classify subjects into groups,” Q. A. w. Kappa, QuickCalcsOnline Calculators for Scientists, GraphPad Software Incorporated(2011), http://www.graphpad.com/quickcalcs/kappa1.cfm.
61. J. A. Swets, “Measuring the accuracy of diagnostic systems,” Science240(4857), 1285–1293 (1988).
62. Rationale and Evidence for the International Caries Detection andAssessment System (ICDAS II) International Caries Detection andAssessment System (ICDAS) Coordinating Committee (September2005).
63. K. R. Ekstrand et al., “Relationship between external and histologic fea-tures of progressive stages of caries in the occlusal fossa,” Caries Res.29(4), 243–250 (1995).
64. S. Tranaeus et al., “In vivo validity and reliability of IR fluorescencemeasurements for caries detection and quantification,” Swed. Dent. J.28(4), 173–182 (2004).
65. F. M. Mendes et al., “Performance of DIAGNOdent for detection andquantification of smooth-surface caries in primary teeth,” J. Dent. 33(1),79–845 (2005).
66. A. Astvaldsdottir, W. P. Holbrook, and S. Tranaeus, “Consistency ofDIAGNOdent instruments for clinical assessment of fissure caries,”Acta Odontol. Scand. 62(4), 193–198 (2004).
67. A. Jablonski-Momeni et al., “Performance of laser fluorescence at toothsurface and histological section,” Lasers Med. Sci. 26(2), 171–178(2011).
68. A. Goel, “Comparison of validity of DIAGNOdent with conventionalmethods for detection of occlusal caries in primary molars using thehistological gold standard: an in vivo study,” J. Indian Soc. Pedod.Prev. Dent. 27(4), 227–234 (2009).
69. W. Zhang, C. McGrath, and E. C. Lo, “A comparison of root cariesdiagnosis based on visual-tactile criteria and DIAGNOdent in vivo,”J. Dent. 37(7), 509–513 (2009).
70. K. C. Huth et al., “Clinical performance of a new laser fluorescencedevice for detection of occlusal caries lesions in permanent molars,”J. Dent. 36(12), 1033–1040 (2008).
71. V. Anttonen, L. Seppa, and H. Hausen, “Clinical study of the use of thelaser fluorescence device DIAGNOdent for detection of occlusal cariesin children,” Caries Res. 37(1), 17–23 (2003).
72. S. Eakle et al., “Clinical Evaluation of the DIAGNOdent Device,” inEarly Detection of Dental Caries III Indiana. Conference 2003G. Stookey, ed., Indiana University Press, Indiana (2005).
Rechmann et al.: Performance of laser fluorescence devices and visual examination : : :
Journal of Biomedical Optics 036006-14 March 2012 • Vol. 17(3)
Downloaded From: https://www.spiedigitallibrary.org/journals/Journal-of-Biomedical-Optics on 25 Sep 2021Terms of Use: https://www.spiedigitallibrary.org/terms-of-use

73. J. D. Bader and D. A. Shugars, “A systematic review of the performanceof a laser fluorescence device for detecting caries,” J. Am. Dent. Assoc.135(10), 1413–1426 (2004).
74. M. S. De Benedetto et al., “Comparing the reliability of a new fluor-escence camera with conventional laser fluorescence devices in detect-ing caries lesions in occlusal and smooth surfaces of primary teeth,”Lasers Med. Sci. 26(2), 157–162 (2011).
75. A. Jablonski-Momeni et al., “Impact of measuring multiple orsingle occlusal lesions on estimates of diagnostic accuracy using
fluorescence methods,” Lasers Med. Sci. 27(2), 343–352(2011).
76. A. Jablonski-Momeni et al., “Performance of a fluorescence camera fordetection of occlusal caries in vitro,” Odontology/the Society of theNippon Dental University 99(1), 55–61 (2011).
77. A. C. Pereira et al., “Validity of caries detection on occlusalsurfaces and treatment decisions based on results from multiplecaries-detection methods,” Eur. J. Oral Sci. 117(1), 51–57(2009).
Rechmann et al.: Performance of laser fluorescence devices and visual examination : : :
Journal of Biomedical Optics 036006-15 March 2012 • Vol. 17(3)
Downloaded From: https://www.spiedigitallibrary.org/journals/Journal-of-Biomedical-Optics on 25 Sep 2021Terms of Use: https://www.spiedigitallibrary.org/terms-of-use