performance of prestressed concrete cylinder by …
TRANSCRIPT
PERFORMANCE OF PRESTRESSED CONCRETE CYLINDER
PIPE (PCCP) IN WATER APPLICATIONS
by
RAHUL MANDA
Presented to the Faculty of the Graduate School of
The University of Texas at Arlington in Partial Fulfillment
of the Requirements
for the Degree of
MASTER OF SCIENCE IN CIVIL ENGINEERING
THE UNIVERSITY OF TEXAS AT ARLINGTON
December 2012

Copyright © by Rahul Manda 2012
All Rights Reserved

iii
ACKNOWLEDGMENTS
I would like to express my gratitude to my adviser, Dr. Mohammad Najafi, for his
support and thoughtful suggestions throughout this research study. This thesis would not
have been possible without his guidance and mentoring.
I would like to express my sincere appreciation to all those who responded to the
survey questionnaires and provided feedback. I understand that their time was valuable,
and I could not have accomplished this work without their input.
I would also like to thank Dr. Melanie Sattler and Dr. Mostafa Ghandehari, who
served as committee members for this thesis. I would also like to thank my friends for
encouraging me and keeping me in good cheer. I especially want to acknowledge the
contribution of my peers, for their support and encouragement, which enabled me to
complete this work. Finally and surely most importantly, I want to thank my parents and
family, for their never-ending love and support.
November 26, 2012

iv
DISCLAIMER
All pipe materials have advantages and limitations, and can deteriorate over time.
Many project specific factors, operations and maintenance procedures of a specific
utility, pipe manufacturing process, and site and soil conditions around the pipe affect the
pipe performance. Since there is no national database of pipe inventory and performance
in the U.S., and given the large number of utilities, it is difficult to gather data necessary
for a comprehensive understanding of pipeline performance. Past literature do not
consider all the factors affecting pipes, and, and the survey conducted as part of this
thesis received limited responses. Therefore, this thesis cannot be used as basis for
selection or rejection of any specific pipe material, and/or to make any design decisions
on a project, which is responsibility of design professionals.
v
ABSTRACT
PERFORMANCE OF PRESTRESSED CONCRETE CYLINDER
PIPE (PCCP) IN WATER APPLICATIONS
Rahul Manda, M.S.
The University of Texas at Arlington, 2012
Supervising Professor: Mohammad Najafi
The analysis of water pipes field data is of great importance as it has a significant
impact on society and the environment. These failures also have an overall impact on the
financial burden of the water utilities.
This thesis consists of a detailed literature review on the previous studies
conducted on prestressed concrete cylinder pipe (PCCP) performance. Moreover, a
detailed national-level survey was conducted by the Center for Underground
Infrastructure Research and Education (CUIRE) at UT Arlington to gather and analyze
additional field performance data for large diameter pressure pipe including prestressed
concrete cylinder pipe. Specifically, this thesis evaluates the field performance of PCCP,
which is one of the most conventional and extensively used large diameter (24 in. and
larger) rigid pipes in the U.S. water pipeline industry. This thesis explores different

vi
failure parameters, such as pipe age, diameter, manufacturing process, type of joints and
performance effectiveness of PCCP.
vii
TABLE OF CONTENTS
ACKNOWLEGEMENTS.................................................................................................. iii
DISCLAIMER……………………………………………………………………………iv
ABSTRACT…………………………………………………………………………........v
LIST OF ILLUSTRATIONS... .............................................................................. ………xi
LIST OF TABLES .......................................................................................................... xiii
Chapter Page
1. INTRODUCTION AND BACKGROUND .................................................... 1
1.1 History of Pipelines............................................................................... 1
1.1.1 Rigid Pipe.................................................................................. 2
1.1.2 Flexible Pipe ............................................................................. 2
1.1.3 Semi-Rigid Pipe ........................................................................ 3
1.2 Timeline of Prestressed Concrete Cylinder Pipe (PCCP) ............ 4
1.3 Types of PCCP ............................................................................. 5
1.3.1 Lined Cylinder Prestressed
Concrete Cylinder Pipe (LC-PCCP) ....................................... 6
1.3.2 Embedded Cylinder-Prestressed
Concrete Cylinder Pipe (EC-PCCP) ....................................... 7
1.4 PCCP Manufacturing Process ..................................................... 9
1.4.1 Fabrication of Steel Cylinder .................................................. 10
viii
1.4.2 Joint Rings .............................................................................. 11
1.4.3 Hydrostatic Test for Cylinder Assembly ................................ 15
1.4.4 Test of Concrete Cylinder ....................................................... 16
1.4.5 Concrete Cure ......................................................................... 16
1.4.6 Wrap Prestressing Wire .......................................................... 17
1.4.7 Apply Mortar Coating ............................................................. 18
1.5 Advantages and Limitations of PCCP ................................................ 18
1.6 Objectives ........................................................................................... 19
1.7 Methodology ....................................................................................... 19
1.8 Thesis Organization ............................................................................ 20
1.9 Expected Outcome .............................................................................. 20
1.10 Chapter Summary ............................................................................. 20
2. LITERATURE REVIEW……………………………………………………..21
2.1 Introduction ......................................................................................... 21
2.2 Failure Causes ..................................................................................... 21
2.2.1 Failure due to Corrosive Environment .................................... 21
2.2.2 Rupture Failure due to Wire Breaks ....................................... 24
2.2.3 Defective Manufacturing Materials
and/or Manufacturing Methods ............................................. 25
2.2.4 Failure Due to Improper Design ............................................. 26
2.2.5 Failure Due to Construction Damage ..................................... 26
2.3 Consequences of Pipeline Failures ..................................................... 26
2.4 Chapter Summary ............................................................................... 28
ix
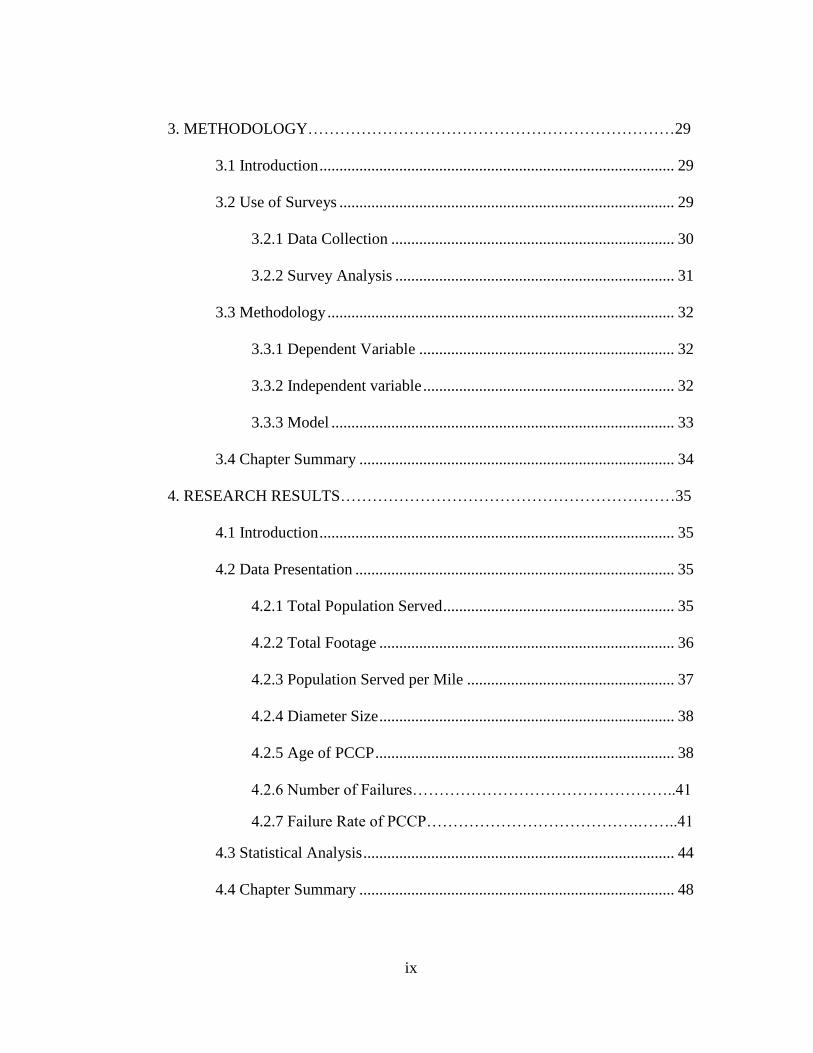
3. METHODOLOGY……………………………………………………………29
3.1 Introduction ......................................................................................... 29
3.2 Use of Surveys .................................................................................... 29
3.2.1 Data Collection ....................................................................... 30
3.2.2 Survey Analysis ...................................................................... 31
3.3 Methodology ....................................................................................... 32
3.3.1 Dependent Variable ................................................................ 32
3.3.2 Independent variable ............................................................... 32
3.3.3 Model ...................................................................................... 33
3.4 Chapter Summary ............................................................................... 34
4. RESEARCH RESULTS………………………………………………………35
4.1 Introduction ......................................................................................... 35
4.2 Data Presentation ................................................................................ 35
4.2.1 Total Population Served .......................................................... 35
4.2.2 Total Footage .......................................................................... 36
4.2.3 Population Served per Mile .................................................... 37
4.2.4 Diameter Size .......................................................................... 38
4.2.5 Age of PCCP ........................................................................... 38
4.2.6 Number of Failures…………………………………………..41
4.2.7 Failure Rate of PCCP………………………………….……..41
4.3 Statistical Analysis .............................................................................. 44
4.4 Chapter Summary ............................................................................... 48
x
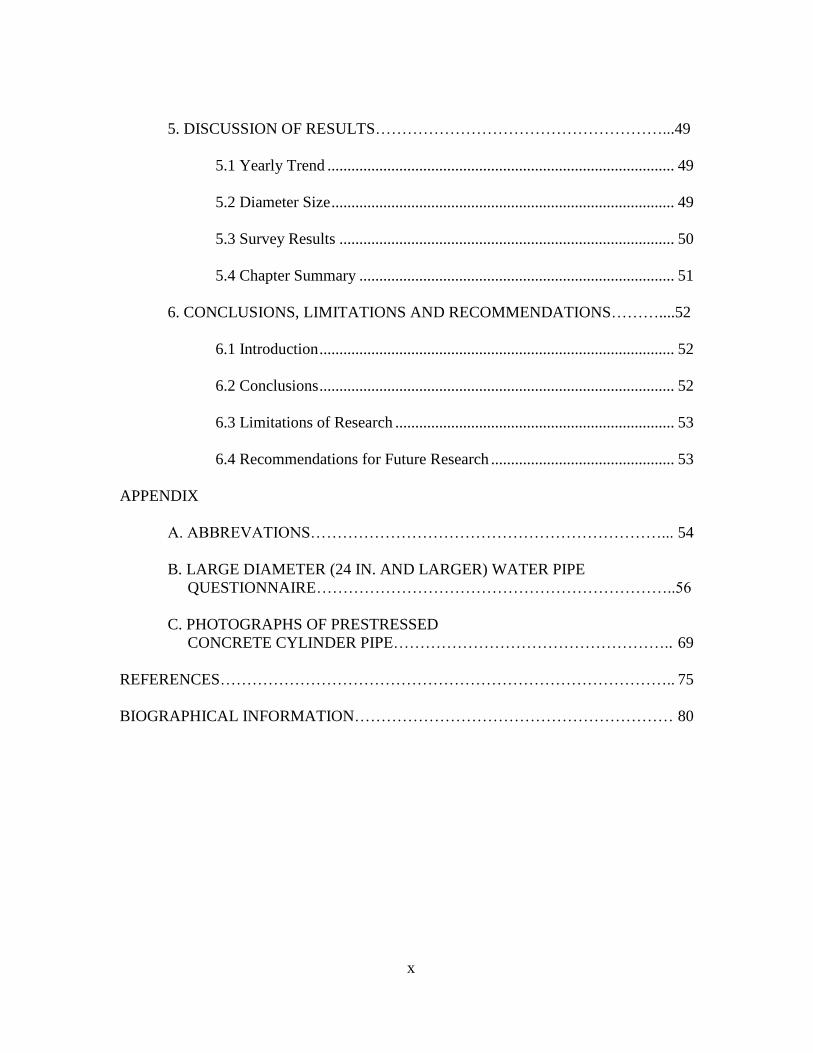
5. DISCUSSION OF RESULTS………………………………………………...49
5.1 Yearly Trend ....................................................................................... 49
5.2 Diameter Size ...................................................................................... 49
5.3 Survey Results .................................................................................... 50
5.4 Chapter Summary ............................................................................... 51
6. CONCLUSIONS, LIMITATIONS AND RECOMMENDATIONS………....52
6.1 Introduction ......................................................................................... 52
6.2 Conclusions ......................................................................................... 52
6.3 Limitations of Research ...................................................................... 53
6.4 Recommendations for Future Research .............................................. 53
APPENDIX
A. ABBREVATIONS…………………………………………………………... 54
B. LARGE DIAMETER (24 IN. AND LARGER) WATER PIPE
QUESTIONNAIRE…………………………………………………………..56
C. PHOTOGRAPHS OF PRESTRESSED
CONCRETE CYLINDER PIPE…………………………………………….. 69
REFERENCES………………………………………………………………………….. 75
BIOGRAPHICAL INFORMATION…………………………………………………… 80

xi
LIST OF ILLUSTRATIONS
Figure Page
1.1 Trench Load Comparisons for
(a) rigid (Marston Load) and (b) flexible pipe ............................................................. 3
1.2 Classification of PCCP as per Diameter Size ............................................................... 6
1.3 Cross-sectional View of Detailed Geometry of LC-PCCP Wall .................................. 7
1.4 Cross-sectional View of EC-PCCP .............................................................................. .8
1.5 Manufacturing Process of PCCP ................................................................................ 10
1.6 Joints in PCCP
(a) bell ring joint (b) spigot ring joint ......................................................................... 13
1.7 Assembly of Joints and O-ring Gasket for
(a) LC-PCCP (b) EC-PCCP……………………………………………….…………14
2.1 Causes of Corrosion in PCCP due to
(a) water transmission mains and (b) water distribution mains… ........... ……….…23
2.2 PCCP Rupture Failure due to Wire
Break in 36-in. Diameter Size Pipe............................................................................. 25
3.1 Geographical Locations of Water Utilities ................................................................. 31
4.1 Population of all Water Utilities ................................................................................. 36
4.2 Footage of 24 in. and Larger Pipe in Water Utilities. ................................................. 37
4.3 PCCP in Water Utilities by Footage ........................................................................... 38
4.4 Age of PCCP in Water Utilities by
(a) footage and (b) percentage in inventory ................................................................ 40
4.5 Numbers of Failure by the Water Utilities. ................................................................. 41

xii
4.6 Failure Rates per 100 Miles by Water Utility ............................................................. 43
4.7 Failure Rate (Measured in Percentage) by Diameter Range. ...................................... 45
xiii
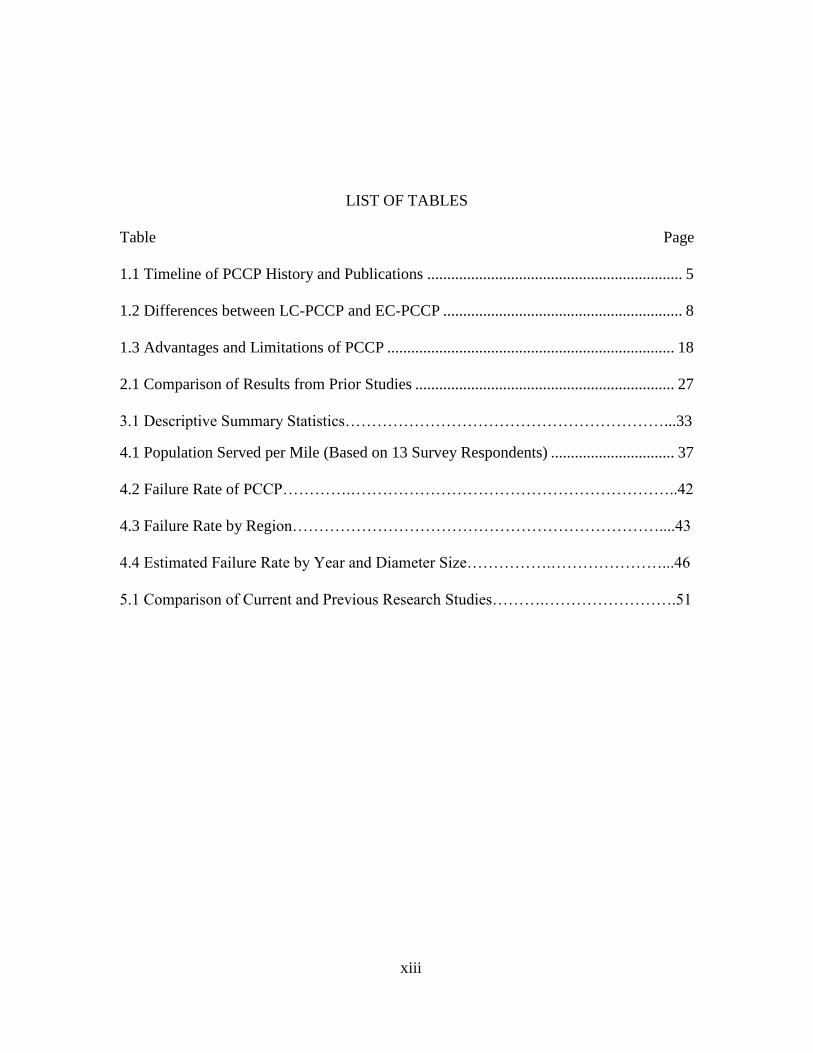
LIST OF TABLES
Table Page
1.1 Timeline of PCCP History and Publications ................................................................ 5
1.2 Differences between LC-PCCP and EC-PCCP ............................................................ 8
1.3 Advantages and Limitations of PCCP ........................................................................ 18
2.1 Comparison of Results from Prior Studies ................................................................. 27
3.1 Descriptive Summary Statistics……………………………………………………...33
4.1 Population Served per Mile (Based on 13 Survey Respondents) ............................... 37
4.2 Failure Rate of PCCP………….……………………………………………………..42
4.3 Failure Rate by Region……………………………………………………………....43
4.4 Estimated Failure Rate by Year and Diameter Size…………….…………………...46
5.1 Comparison of Current and Previous Research Studies……….…………………….51

1
CHAPTER 1
INTRODUCTION AND BACKGROUND
1.1 History of Pipelines
Pipelines are assets of water utilities. Because they are underground, millions of
miles of pipeline infrastructure are generally overlooked until there is a need for repair or
replacement. Every single pipe has a history, such as, when it was installed, what its fail
date was, and what caused its failure. There are thousands of public water utilities and
only a few private water utilities, which serve safe drinking water.
According to the American Water Works Association (AWWA), a significant
amount of water pipeline network is buried underground and is at the end of its useful
life. This pipeline network will definitely require a large number of replacement pipes
and/or repairs in the near future, which will cost billions of dollars (AWWA,1 2010).
Water pipe ruptures cause 7 billion gallons of water to be lost in the US daily, which
means that water utilities need to exceed their current annual budgets by at least $11
billion annually to keep up with the repair and replacement costs (ASCE, 2009). The
costs of these pipe breakages have a significant impact on water utility’s annual budget.
These costs may be in the form of social, environmental, and replacement costs (Piratla
and Ariaratnam, 2011; Higgins, 2010). To combat these issues, water utilities are looking
1 http://www.awwa.org/files/GovtPublicAffairs/GADocuments/BuriedNoLongerCompleteFinal.pdf
2
for effective and sound solutions including statistical models that presents or predict
future numbers of failure in pipeline based on historical data.
Based on the behavior of the pipelines with surrounding soils, pipes can be
divided in three types: 1) rigid, 2) flexible and, 3) semi rigid.
1.1.1 Rigid Pipe
The Marston’s load theory states that the load or the weight of the central column
of soil above the buried pipe is modified by the pipe type, side soil column and, external
prism along the central column. The external prism is more compressible than the pipe
because of its inbuilt rigidity. The pipes take the load of central column plus the load due
to shearing stresses and friction forces due to the differential settlement between external
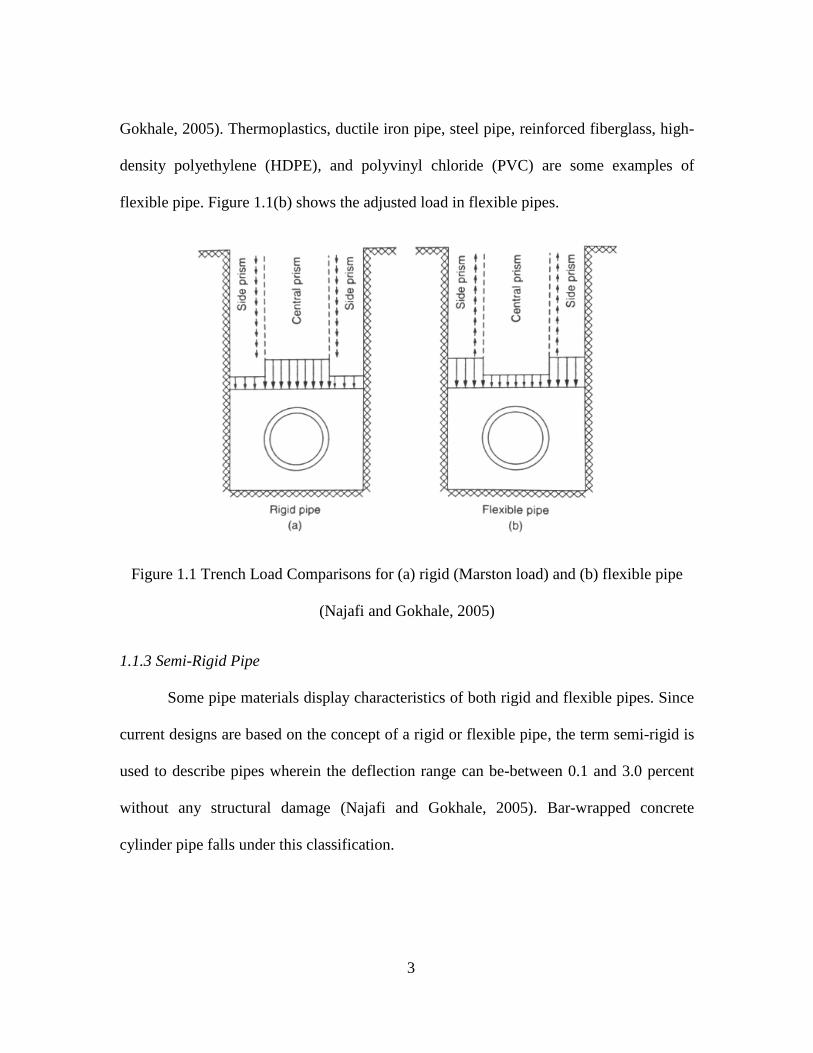
and central prism. Pipes behaving in this manner are called rigid pipes (Najafi and
Gokhale, 2005), which include reinforced concrete non-cylinder pipe, PCCP, reinforced
cement concrete (RCC) pipe, polymer concrete, vitrified clay, cast iron, and asbestos
cement pipes. Figure 1.1(a) shows the adjusted load on a rigid pipe.
1.1.2 Flexible Pipe
Flexible pipe is capable of allowable vertical deflection without structural
damage. The central soil column is above the pipe is allowed to settle in relation to the
side soil column or external prisms. The actual load on pipe is less than the load of
central prism (weight of soil above the pipe) found in rigid pipes described above due to
shearing stresses and friction forces by differential settlements between external and
central prisms. Pipes that behave in this manner are called flexible pipes (Najafi and
3
Gokhale, 2005). Thermoplastics, ductile iron pipe, steel pipe, reinforced fiberglass, high-
density polyethylene (HDPE), and polyvinyl chloride (PVC) are some examples of
flexible pipe. Figure 1.1(b) shows the adjusted load in flexible pipes.
Figure 1.1 Trench Load Comparisons for (a) rigid (Marston load) and (b) flexible pipe
(Najafi and Gokhale, 2005)
1.1.3 Semi-Rigid Pipe
Some pipe materials display characteristics of both rigid and flexible pipes. Since
current designs are based on the concept of a rigid or flexible pipe, the term semi-rigid is
used to describe pipes wherein the deflection range can be-between 0.1 and 3.0 percent
without any structural damage (Najafi and Gokhale, 2005). Bar-wrapped concrete
cylinder pipe falls under this classification.
4
1.2 Timeline of Prestressed Concrete Cylinder Pipe (PCCP)
PCCP is one of the rigid pipe types that are extensively used for water and
wastewater transmission in the US and around the world. The first prestressed concrete
cylinder pipe (PCCP) was manufactured and installed in 1942 in the United States
(AWWA RF Study, 1995). The first tentative edition of PCCP (C301) was developed in
1949 by the American Water Works Association (AWWA), which introduced the first
permanent edition/standard of PCCP in 1952. The first edition of AWWA Manual M9,
published in 1979 provided guidelines establishing the minimum requirements for PCCP
design. In year 2007, the latest edition of AWWA C301 was published. AWWA C301
standard describes the manufacture of circumferentially prestressed concrete pressure
pipe with a steel cylinder and wire reinforcement (AWWA, 2007) and manual M9 is a
comprehensive operations manual for water service explains the use of concrete pressure
pipe. The manual provides all the supplemental information engineers and designers need
to optimize field performance of concrete pressure pipelines (AWWA, 2008). AWWA
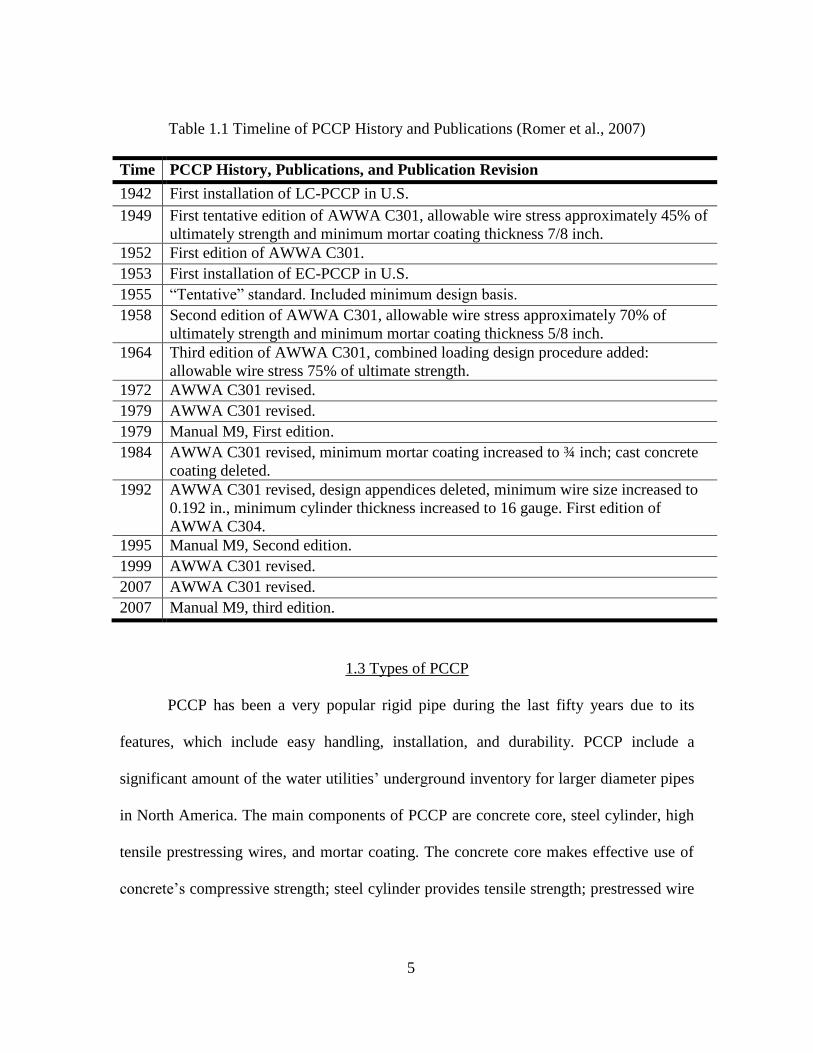
PCCP history, publications and publication revisions are summarized in Table 1.1.
5
Table 1.1 Timeline of PCCP History and Publications (Romer et al., 2007)
Time PCCP History, Publications, and Publication Revision
1942 First installation of LC-PCCP in U.S.
1949 First tentative edition of AWWA C301, allowable wire stress approximately 45% of
ultimately strength and minimum mortar coating thickness 7/8 inch.
1952 First edition of AWWA C301.
1953 First installation of EC-PCCP in U.S.
1955 “Tentative” standard. Included minimum design basis.
1958 Second edition of AWWA C301, allowable wire stress approximately 70% of
ultimately strength and minimum mortar coating thickness 5/8 inch.
1964 Third edition of AWWA C301, combined loading design procedure added:
allowable wire stress 75% of ultimate strength.
1972 AWWA C301 revised.
1979 AWWA C301 revised.
1979 Manual M9, First edition.
1984 AWWA C301 revised, minimum mortar coating increased to ¾ inch; cast concrete
coating deleted.
1992 AWWA C301 revised, design appendices deleted, minimum wire size increased to
0.192 in., minimum cylinder thickness increased to 16 gauge. First edition of
AWWA C304.
1995 Manual M9, Second edition.
1999 AWWA C301 revised.
2007 AWWA C301 revised.
2007 Manual M9, third edition.
1.3 Types of PCCP
PCCP has been a very popular rigid pipe during the last fifty years due to its
features, which include easy handling, installation, and durability. PCCP include a
significant amount of the water utilities’ underground inventory for larger diameter pipes
in North America. The main components of PCCP are concrete core, steel cylinder, high
tensile prestressing wires, and mortar coating. The concrete core makes effective use of
concrete’s compressive strength; steel cylinder provides tensile strength; prestressed wire
6
gives compressive strength, and mortar coating provides weatherization protection
against corrosion.
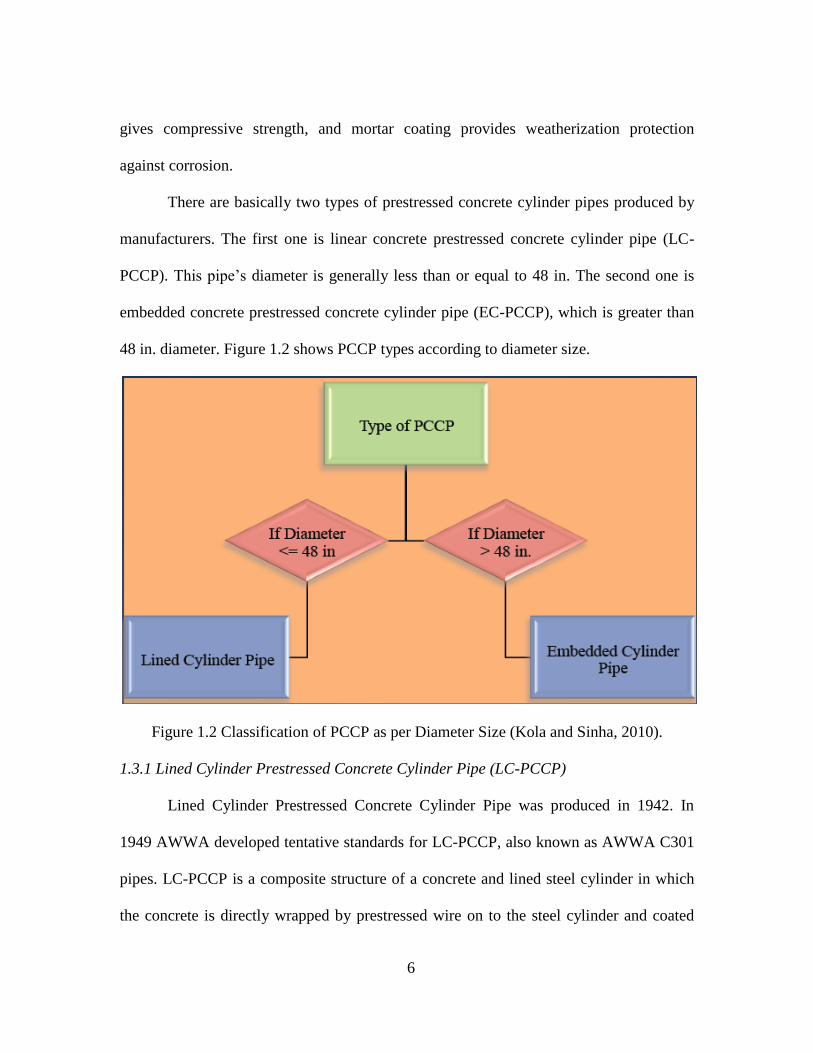
There are basically two types of prestressed concrete cylinder pipes produced by
manufacturers. The first one is linear concrete prestressed concrete cylinder pipe (LC-
PCCP). This pipe’s diameter is generally less than or equal to 48 in. The second one is
embedded concrete prestressed concrete cylinder pipe (EC-PCCP), which is greater than
48 in. diameter. Figure 1.2 shows PCCP types according to diameter size.
Figure 1.2 Classification of PCCP as per Diameter Size (Kola and Sinha, 2010).
1.3.1 Lined Cylinder Prestressed Concrete Cylinder Pipe (LC-PCCP)
Lined Cylinder Prestressed Concrete Cylinder Pipe was produced in 1942. In
1949 AWWA developed tentative standards for LC-PCCP, also known as AWWA C301
pipes. LC-PCCP is a composite structure of a concrete and lined steel cylinder in which
the concrete is directly wrapped by prestressed wire on to the steel cylinder and coated
7
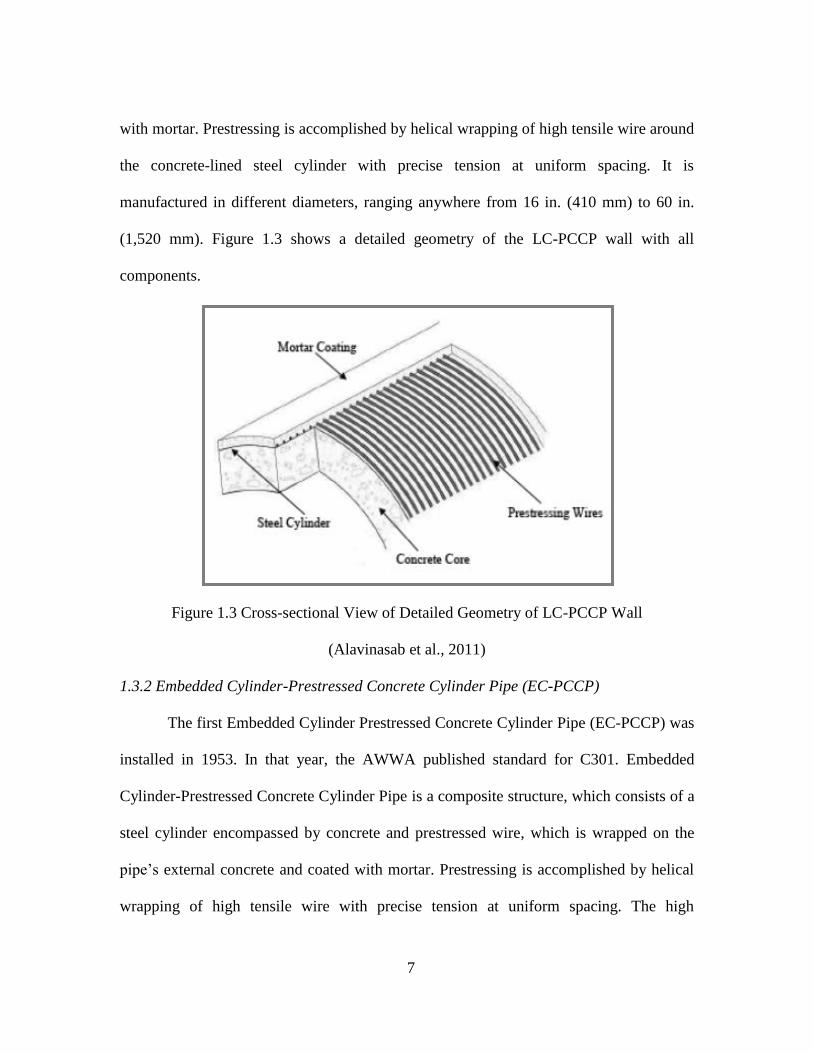
with mortar. Prestressing is accomplished by helical wrapping of high tensile wire around
the concrete-lined steel cylinder with precise tension at uniform spacing. It is
manufactured in different diameters, ranging anywhere from 16 in. (410 mm) to 60 in.
(1,520 mm). Figure 1.3 shows a detailed geometry of the LC-PCCP wall with all
components.
Figure 1.3 Cross-sectional View of Detailed Geometry of LC-PCCP Wall
(Alavinasab et al., 2011)
1.3.2 Embedded Cylinder-Prestressed Concrete Cylinder Pipe (EC-PCCP)
The first Embedded Cylinder Prestressed Concrete Cylinder Pipe (EC-PCCP) was
installed in 1953. In that year, the AWWA published standard for C301. Embedded
Cylinder-Prestressed Concrete Cylinder Pipe is a composite structure, which consists of a
steel cylinder encompassed by concrete and prestressed wire, which is wrapped on the
pipe’s external concrete and coated with mortar. Prestressing is accomplished by helical
wrapping of high tensile wire with precise tension at uniform spacing. The high

8
compressive strength of concrete and steel’s high tensile strength gives a combined form
of elasticity. It is mostly manufactured in larger diameters or 48 in. (1,220 mm) and
larger. Figure 1.4 shows all the component of the EC-PCCP.
Figure 1.4 Cross-sectional View of EC-PCCP (Zarghamee, 2001)
Table 1.2 summarizes the differences between lined cylinders and embedded
cylinders of PCCP as per the diameter size, type of construction or design, and
prestressing wire.
Table 1.2 Differences between LC-PCCP and EC-PCCP (Romer et al., 2007)
Parameter LC-PCCP EC-PCCP
Diameter range 16 through 60 in. 30 through 256 in.
Design Steel cylinder lined with in
a cast concrete core
Steel cylinder embedded in
a concrete core
Prestressing wire Wrapped over steel cylinder Wrapped over concrete core
9
1.4 PCCP Manufacturing Process
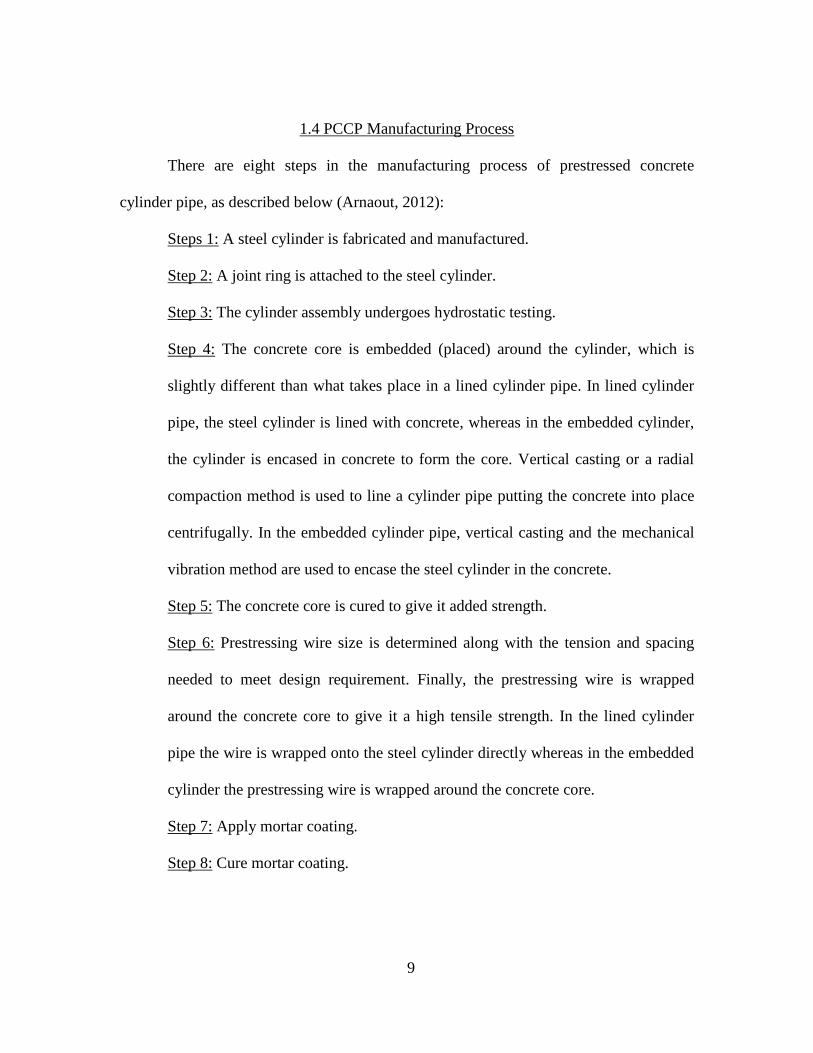
There are eight steps in the manufacturing process of prestressed concrete
cylinder pipe, as described below (Arnaout, 2012):
Steps 1: A steel cylinder is fabricated and manufactured.
Step 2: A joint ring is attached to the steel cylinder.
Step 3: The cylinder assembly undergoes hydrostatic testing.
Step 4: The concrete core is embedded (placed) around the cylinder, which is
slightly different than what takes place in a lined cylinder pipe. In lined cylinder
pipe, the steel cylinder is lined with concrete, whereas in the embedded cylinder,
the cylinder is encased in concrete to form the core. Vertical casting or a radial
compaction method is used to line a cylinder pipe putting the concrete into place
centrifugally. In the embedded cylinder pipe, vertical casting and the mechanical
vibration method are used to encase the steel cylinder in the concrete.
Step 5: The concrete core is cured to give it added strength.
Step 6: Prestressing wire size is determined along with the tension and spacing
needed to meet design requirement. Finally, the prestressing wire is wrapped
around the concrete core to give it a high tensile strength. In the lined cylinder
pipe the wire is wrapped onto the steel cylinder directly whereas in the embedded
cylinder the prestressing wire is wrapped around the concrete core.
Step 7: Apply mortar coating.
Step 8: Cure mortar coating.

10
Figure 1.5 Manufacturing Process of PCCP (Arnaout, 2012)
Figure 1.5 shows the stepwise manufacturing process of prestressed concrete
cylinder pipe. Each step of the manufacturing processes is explained in detail below.
1.4.1 Fabrication of Steel Cylinder
In the fabrication process of steel cylinder, a required material is cut, rolled and
welded into a specified length, size and thickness by welding and shaping. After
acquiring the desired shape and size of steel cylinder, the joints are welded to the pipe for
testing. Butt welding or offset lap welding is used to wrap the prestressing wire on to the
cylinder. Hydrostatic testing is also performed on this steel cylinder assembly to produce
watertight pressure pipe. The test can be done in two ways, horizontally or vertically.
When using a horizontal method, the hydrostatic test is conducted on pipe which has a
thickness of 10-gauge (0.1345-in. or 3.42-mm) or less. The required pressure on the pipe
needs to produce a minimum stress of 20,000 psi (138 MPa), but it cannot be greater than
25,000 psi (172 MPa). In the vertical hydrostatic test, the minimum required stress is
Steel Cylinder Fabrication
Attach Joint Rings
Hydrostatic Test of Cylinder Assembly
Place Concrete Core
Cure Concrete Core
Wrap Prestressing Wire
Apply Mortar Coating
Cure Mortar Coating
11
25,000 psi (172 MPa) at the lower end of the pipe. At every stage of these tests, all welds
should be inspected and marked. If there is any leakage, the joint must be rewelded at the
leakage point. The final product should be a watertight steel cylinder pipe with joint ring
attached (AWWA C301, 2007).
1.4.2 Joint Rings
Water pipeline is an assembly of pipes, which transport drinking water to homes
from water treatment plants, and the distance which translates to the length of the
pipeline is measured in footage or miles. Since there is a limitation on manufacturing a
single long pipe in meters or miles, only a single pipeline by joining two or more pipes
together to transport water is possible.
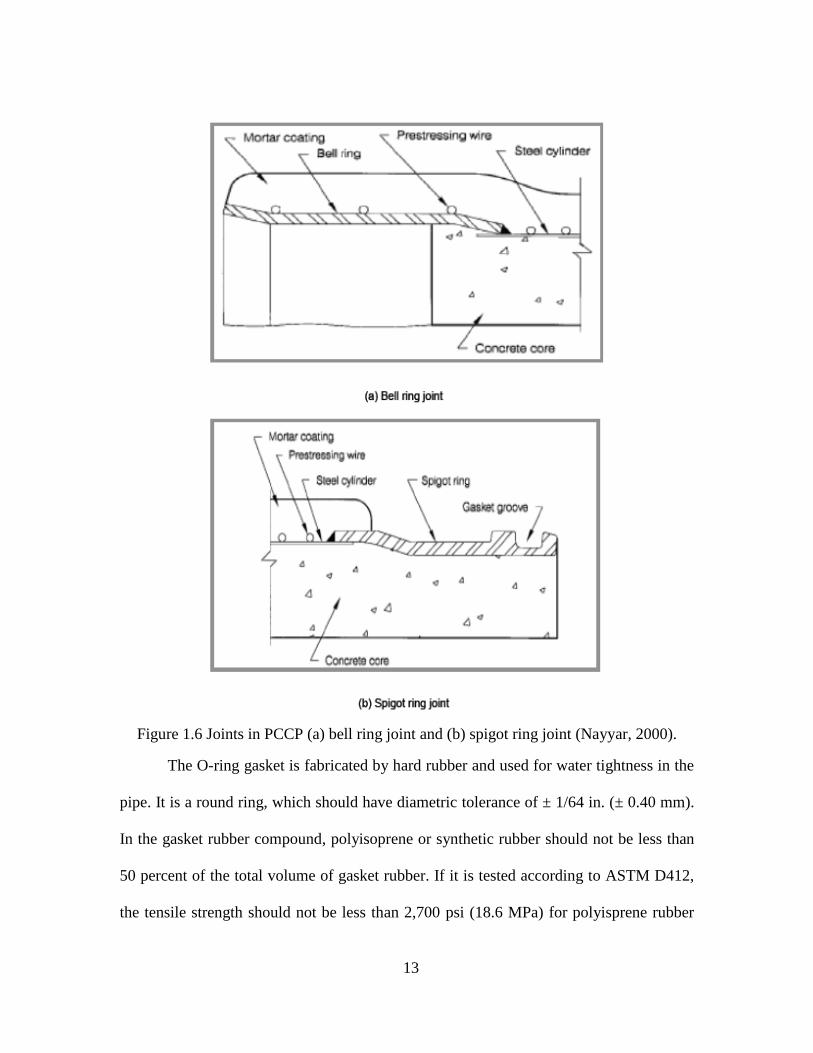
The joint ring assembly used to join the pipes is made up of a steel bell ring, steel
spigot ring and rubber O-ring gasket. The steel bell-and-spigot joint rings are welded to
the end of the steel cylinder by butt-welding and the O-ring gasket is placed in between
these two rings to make watertight seal. The welding should be smooth and flush to
adjacent surface of gasket. During the pipe installation, the steel bell-and-spigot joint
rings should be self-centering. A corrosion protection coating is applied to the exposed
portion of steel at the joint rings, and Portland cement grout is also poured into the gap in
between the steel bell-and spigot rings for additional corrosion protection. Figure 1.6 (a)
and (b) is a cross-section of steel bell ring and steel spigot ring respectively. The steel
spigot ring is projected to the end part of PCCP and the steel bell ring is joined at the
receiving part of PCCP joints. As shown in Figure 1.7 (b) to groove the O-ring gasket in
between the steel bell-and-spigot ring, a gasket groove portion is built in the spigot ring.
12
The joint rings should be pressed beyond their elastic limits before welded. The
gap between the inside diameter of the steel bell ring and steel spigot ring should not be
more than 3/16 in. or 4.8 mm if using a gasket, which has a diameter of 21/32 in. (16.7
mm) or less. The maximum out-of-roundness or the gap between those two rings for the
pipe of 48 in. or 1,200 mm should not exceed 0.7 percent of the average of the maximum
and minimum diameter of steel spigot ring and steel bell ring respectively or 3/16 in (4.8
mm), whichever is higher. In case of 48 in. or larger pipe, the out-of-roundness should
not exceed 0.5 in. (12.7 mm) or 0.5 percent of the average of the maximum and minimum
diameter of steel spigot ring and steel bell ring respectively, whichever is less. The
thickness of bell rings should be 3/16 in. (4.8 mm) and ¼ in. (6.4 mm) for pipes with a
diameter of 36 in. (910 mm) or smaller and pipes that have a diameter of 36 in. (910 mm)
or larger respectively.
13
Figure 1.6 Joints in PCCP (a) bell ring joint and (b) spigot ring joint (Nayyar, 2000).
The O-ring gasket is fabricated by hard rubber and used for water tightness in the
pipe. It is a round ring, which should have diametric tolerance of ± 1/64 in. (± 0.40 mm).
In the gasket rubber compound, polyisoprene or synthetic rubber should not be less than
50 percent of the total volume of gasket rubber. If it is tested according to ASTM D412,
the tensile strength should not be less than 2,700 psi (18.6 MPa) for polyisprene rubber

14
gasket and 2,000 psi (13.8 MPa) for synthetic rubber. The minimum density range for the
gasket should 0.95 to 1.45 (mg/m3) and ± 0.05 variations is allowed when it is tested
according to ASTM D297. Figures 1.7 (a) and (b) show cross-sectional views of lined
cylinder prestressed concrete pipe (LC-PCCP) and embedded cylinder prestressed
concrete pipe (EC-PCCP) for the steel bell and spigot joints, respectively. The illustration
clearly show how the gasket is grooved in between steel bell-and spigot rings for water
tightness and the cement grout is grouted in place between those two rings for corrosion
protection (AWWA C301 Standards, 2007).
(a)
(b)
Figure 1.7 Assembly of Joints and O-ring Gasket for (a) LC-PCCP and
(b) EC-PCCP (Nayyar, 2000).
15
1.4.3 Hydrostatic Test for Cylinder Assembly
Cement, fine aggregate, coarse aggregate, water and admixtures are the main
components of concrete. There are basically three methods to place concrete in the pipe
core: 1) centrifugal method, 2) vertical casting method, 3) radial compaction method. The
minimum requirement of cement in the concrete is 560 lb (254 kg) for each cubic yard
(0.76 m3). If there is not a specified requirement by purchaser, the cement can be replaced
with pozzolanic materials up to 20 percent of cement weight and up to 10 percent with
silica fume. To achieve a high strength of concrete, the water-cement ratio in the concrete
should be maintained and it should not exceed 0.5 for concrete placed by centrifugal
method, or 0.45 for concrete placed by vertical casting and radial compaction method.
The water-soluble chloride ion (cl-) should not exceed 0.06 percent of the weight of
cement. The mixing of material and placing of concrete requires special attention. The
aggregates should not be in frozen state at the time of mixing.
When concrete is pouring or placing, the temperature should not be below 400 F
(40 C). While placing the concrete by vertical casting method or radial compacted method
the temperature of the mix at the time of concrete placing should not be higher than 900
F
(320 C) and 100
0 F (38
0 C) for centrifugally cast cores unless its specified in “HOT
Weather Concrete" by the American Concrete Institute (ACI) Committee 305 (Romer et
al., 2008).
16
1.4.4 Test of Concrete Cylinder
The testing of concrete cylinder is required to test the compressive strength of
pipe concrete. The required minimum compressive strength of concrete core at the time
of prestressing should be 3,000 psi (20.7 MPa) and 4,500 psi (31.0 MPa) at 28 days for
vertical cast method. The required minimum compressive strength of concrete core at the
time of prestressing should be 4,000 psi (27.6 MPa) and 6,000 psi (41.4 MPa) at 28 days
for the centrifugal and radial compaction method (AWWA C301 standards, 2007).
1.4.5 Concrete Cure
Curing is a process of maintaining satisfactory moisture content at a certain
temperature for a certain time period after placing and finishing the concrete to obtain
desired properties or strength. Curing is very important for concrete and cannot
overemphasize. Portland cement has some chemical properties and when it mixes with
water a chemical reaction take place called “hydration.” To overcome hydration effect,
the curing of concrete is required (Siddique et al., 2007). According to ANSI/AWWA
C301-07, curing of the concrete core should be done by an accelerated method, by water
curing, and by the combination curing method.
In the accelerated curing method the concrete core should be kept in the curing
facility or should be covered in a suitable enclosure to maintain appropriate air movement
and steam. To maintain a moist environment for curing of the concrete core, the relative
humidity should not be less than 85 percent. The temperature in the enclosure should not
be less than 400 F (4
0 C) after placing the concrete. After placing the concrete the
temperature in the enclosure for the next four hours should not exceed 950 F (35
0C). The
17
temperature range in the enclosure should be maintained between 900 F (32
0C) and 125
0
F (520C) for at least 12 hours following the four-hour concrete placement procedure.
Water curing should start after the concrete gains sufficient strength to prevent damage to
its exposed concrete surface. The form should not be moved for at least 12 hours after
placing concrete. The curing of a concrete core can be done by combining both an
accelerated curing method and a water curing method (AWWA C301 Standards, 2007).
1.4.6 Wrap Prestressing Wire
The prestressing wire is wrapped around the concrete core in the helical form with
uniform spacing and specified tension; however, in the pipe ends, the wire is applied in a
circumferential manner at half of design tension. During wrapping of prestressing wire,
the initial compression induced in the concrete core should be below 55 percent of the
concrete core’s compressive strength. Before wrapping the prestressing wire to the
concrete core, the voids of 3/8 in. (10 mm) or larger in diameter and offsets larger than
1/8 in. (3 mm) on the exterior surface of the concrete core should be repaired. The
prestressing wire should be rust free and capable of enduring minimum ultimate tensile
strength. The tension in prestressing wire should be constantly measured during the
wrapping process. The mean tension, which is applied for minimum required stress in the
wire, should not fluctuate by 10 percent. For multiple layers of circumferential
prestressing wire reinforcing, each layer should be coated with cement mortar (AWWA
C301 standards, 2007).
18
1.4.7 Apply Mortar Coating
Mortar coating is the outermost layer of prestressed concrete cylinder pipes. After
wrapping prestressed wire on the concrete core, the minimum mortar coating thickness of
¾ in. (19 mm) should cover the prestressing wire. At the start of mortar coating the
temperature of wrapped core should not be lower than 35 0F (2
0C). The batching portion
of mortar consists of one portion of Portland cement and three portions of fine aggregate,
by weight. The minimum contained moisture should be greater than 7 percent of total dry
weight of mix (AWWA C301 Standards, 2007).
1.5 Advantages and Limitations of PCCP
PCCP is very thick when compared to other pipe materials, which in turn
increases its resistivity to physical damage. The installation of the pipe is easy and
economical. This pipe has a wide variety of diameter ranges from 16 to 256 in. Despite
these advantages, this pipe has certain limitations. This pipe is heavy, which makes the
handling difficult and an extra coating is required to protect the pipe from corrosion.
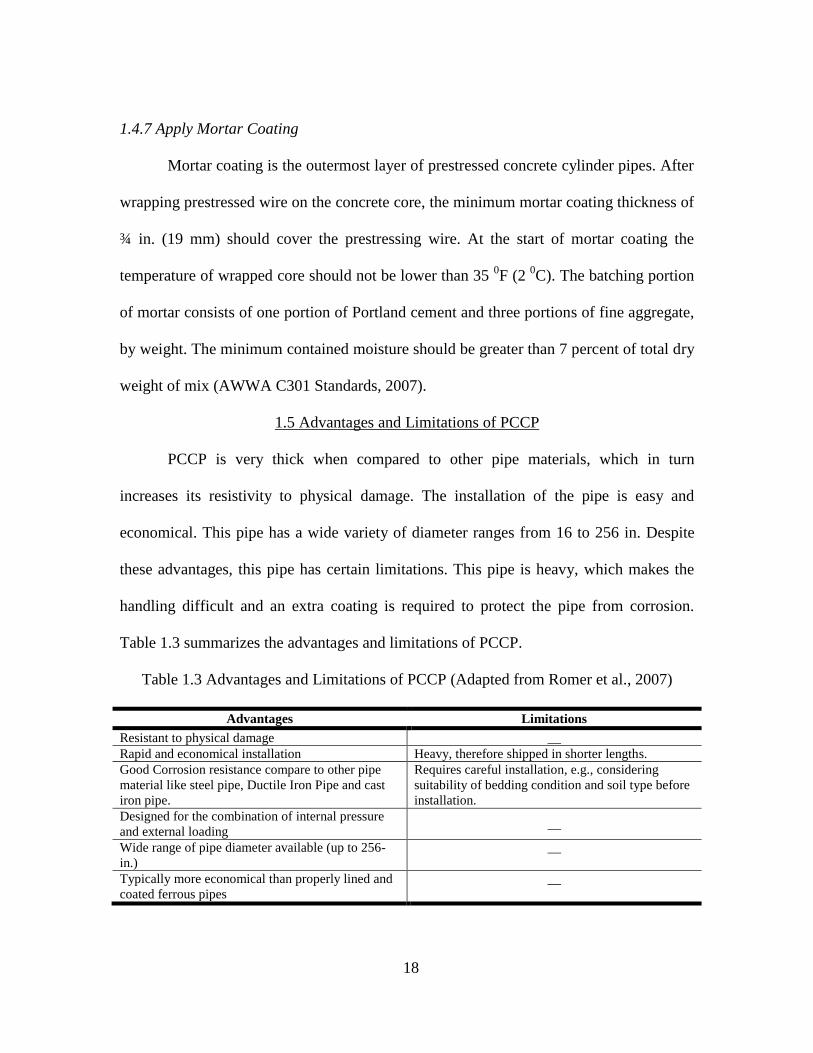
Table 1.3 summarizes the advantages and limitations of PCCP.
Table 1.3 Advantages and Limitations of PCCP (Adapted from Romer et al., 2007)
Advantages Limitations
Resistant to physical damage __
Rapid and economical installation Heavy, therefore shipped in shorter lengths.
Good Corrosion resistance compare to other pipe
material like steel pipe, Ductile Iron Pipe and cast
iron pipe.
Requires careful installation, e.g., considering
suitability of bedding condition and soil type before
installation.
Designed for the combination of internal pressure
and external loading __
Wide range of pipe diameter available (up to 256-
in.)
__
Typically more economical than properly lined and
coated ferrous pipes
__
19
1.6 Objectives
The objectives of this thesis are:
1. Using literature search, analyze the field performance of large diameter (24 in.
and more) Prestressed Concrete Cylinder Pipe (PCCP) in water transmission
applications.
2. Conduct and Analyze survey data to understand causes and modes of PCCP
failures.
1.7 Methodology
The methodology of this thesis is summarized below:
1. Conduct a thorough literature search.
2. Collect the field performance data of PCCP from selected water utilities in the
United States by a survey. A survey was conducted by Center for Underground
Infrastructure Research and Education (CUIRE) at UT, Arlington. Thirteen water
utilities have responded to this survey. The survey contained 13 questions on the
area served by water utilities, total footage of PCCP according to the diameter,
total length of inventory, and various causes and modes of failures.
3. Compile the data obtained from all the survey responses and carefully review in
order to analyze and determine the field performance of PCCP according to age
and location.
4. Study the failure patterns.
20
5. Conduct a statistical analysis on the field performance of PCCP pipe according to
the pipe type, size of the diameters, and age.
1.8 Thesis Organization
The organization of this study is as follows. Chapter 1 presents a brief history of
PCCP along with the PCCP manufacturing process. In the second chapter, literature on
the topic is reviewed. The third chapter discusses methodology used for data gathering
and analyzing the data. Chapter 4 discuses results as well as statistical analysis of survey
data. The chapter builds a statistical model of pipe failure rates. Chapter 5 discusses the
results as presented in the previous chapter. The final chapter offers a summary of
conclusions and recommendations for future research.
1.9 Expected Outcome
This study will evaluate the use of 24 in. and larger diameter PCCP pipes in water
distribution utilities in the U.S. for survey respondents. Failure rate of PCCP pipes per
hundred miles, types of failures, footage, age, and failure comparison between diameters
ranges, reported by water utilities, will be reported.
1.10 Chapter Summary
This chapter gave a brief history of pipeline infrastructure and types followed by
the introduction of PCCP which is used extensively as the water and wastewater pipeline
in the US and around the world. It also presented the types of PCCP, timeline, and a step-
by-step analysis of the PCCP manufacturing process. It also reviewed the objectives and
methodology of this research.
21
CHAPTER 2
LITERATURE REVIEW
2.1 Introduction
This chapter consists of findings from previous research on PCCP performance
and provides better knowledge of causes of pipe failures, which could be due to internal
as well as external damage. This chapter covers causes of failures, consequences of
pipeline failures, and the failure patterns of PCCP.
2.2 Failure Causes
Causes of the pipe failures can be internal as well as external cracks. The possible
reasons of failure are due to deterioration and internal corrosion (Ojdrovic et al., 2011).
Other internal problems are decay due to the quality of material, construction methods,
and operational parameters, while external factors could be related to environmental
conditions (Marshall and Fisk, 2010); wire breaks (Bell, 2010) etc. This thesis discusses
the most common causes of PCCP failure, which adversely affect the service life of
PCCP; five of these reasons are discussed below:
2.2.1 Failure due to Corrosive Environment
External corrosion is a well-known reason for pipe failures in the water pipelines
Rostum, 2000; Folkman, 2012). The basic reason behind corrosion is metal’s
electrochemical process, which precedes the degradation of material. Properties of the

22
surrounding environment, e.g., acidic soil, sour gas created during oil production,
accidents involving natural gas transmission, etc. Uncontrolled corrosion means less
service life of pipe and higher cost. If proper corrosion control technology is used in
water pipelines a significant operations and maintenance savings can be made (Romer
and Bell, 2004).
A 2001 study by Romer and Bell broadly characterizes failures in five categories,
listed below:
1) Corrosive soil condition is the most common cause of external corrosion. More
than 2,000 ppm sulfates concentrated and 350 ppm chloride concentrated in soil can be
damaging for cement mortar coating or concrete pipe. Industrial wastewater and mine
tailings contain acidic minerals that make surrounding soil high in acidic properties,
which react with cement mortar and corrode it.
2) Dissimilar metals include copper service lines directly connected to the
unprotected metallic lines, i.e., two pipelines connected without electrical isolation.
3) Coating damage includes cement-mortar coatings damaged by physical
handling, omission of coating at joints prior to back fill, disbandment of coatings by
misapplication of cathodic protection and inappropriate repairs of coatings.
4) Secondary effects include biochemical or bacterial action, hydrogen
embrittlement of prestressing wire, metallic coating, and stress or crevice corrosion.
5) Stray current is a common cause of external pipe corrosion. It happens when
the buried pipeline reacts like an anode and the ground or another structure behaves like a
cathode causing the current to flow from pipe to ground or another structure, resulting in
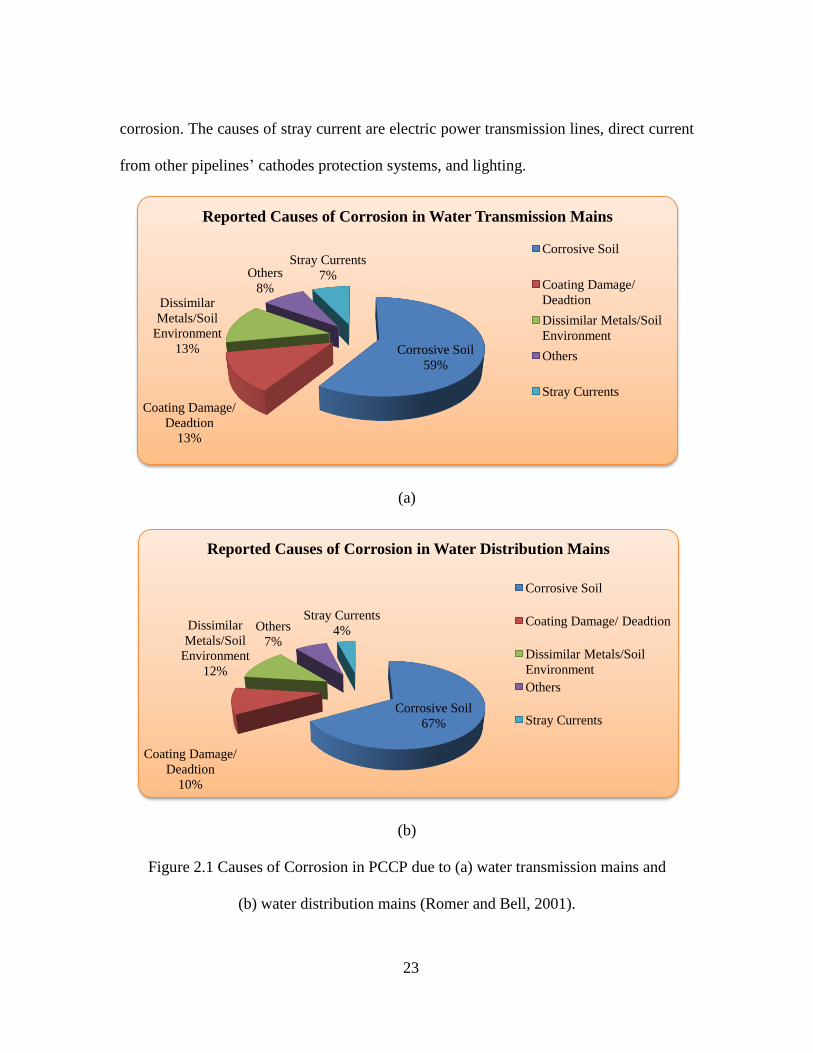
23
corrosion. The causes of stray current are electric power transmission lines, direct current
from other pipelines’ cathodes protection systems, and lighting.
(a)
(b)
Figure 2.1 Causes of Corrosion in PCCP due to (a) water transmission mains and
(b) water distribution mains (Romer and Bell, 2001).
Corrosive Soil
59%
Coating Damage/
Deadtion
13%
Dissimilar
Metals/Soil
Environment
13%
Others
8%
Stray Currents
7%
Reported Causes of Corrosion in Water Transmission Mains
Corrosive Soil
Coating Damage/
Deadtion
Dissimilar Metals/Soil
Environment
Others
Stray Currents
Corrosive Soil
67%
Coating Damage/
Deadtion
10%
Dissimilar
Metals/Soil
Environment
12%
Others
7%
Stray Currents
4%
Reported Causes of Corrosion in Water Distribution Mains
Corrosive Soil
Coating Damage/ Deadtion
Dissimilar Metals/Soil
Environment
Others
Stray Currents
24
Figure 2.1 shows (a) corrosion from transmission mains, and (b) reported causes
of corrosion from distribution mains. In Figure 2.1 (a) a maximum 59% of corrosion
during water transmission is due to the corrosive soil and the minimum corrosion
percentage is due to stray currents, while in Figure 2.1 (b) the causes of corrosion in
distribution mains are due to the corrosive soil (67%), which is 8% higher than what is
found in transmission mains.
2.2.2 Failure due to Wire Breaks
Failure depends on a number of factors including broken wire, location of broken
wire, original pipe design, and maximum pressure likely to occur in the future
(Zarghamee and Ojdrovic, 2001; Zarghamee et al., 2011; Parks et al., 2001). Overloading
of the highly stressed and longitudinally cracked prestressing wire can be a cause of most
common types of rupture (Uyeda et al., 1994; Bell and Paulson, 2010).
As per Margevicius and Haddad, prestressed concrete cylinder pipe fails because
of the failure in prestressed reinforcing wires. Defective prestressing wire, carbonation of
the concrete core, incomplete encasement of the prestressing wire with Portland cement
slurry and mortar coating are may be some primary reasons for wire breaks (Margevicius
and Haddad, 2002; Holley and Rittenhouse, 2008). Figure 2.2 shows wire breakage in 36-
in. and larger PCCP diameters due to corrosion of prestressing wire.
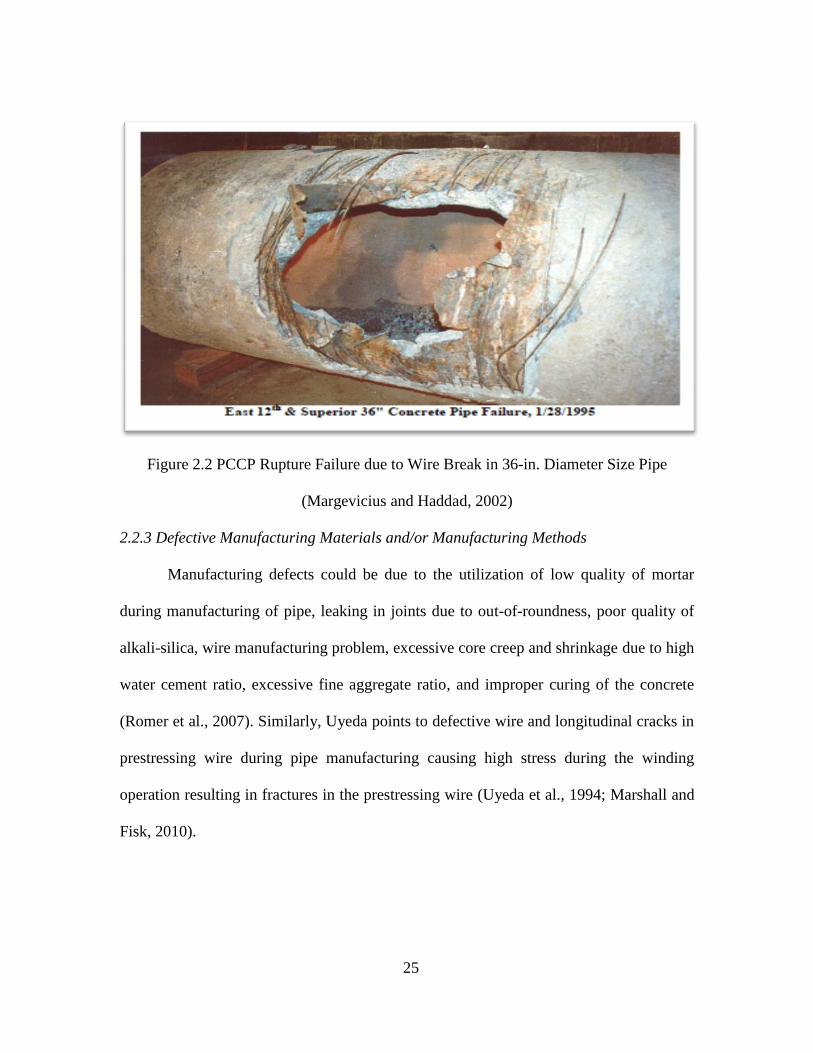
25
Figure 2.2 PCCP Rupture Failure due to Wire Break in 36-in. Diameter Size Pipe
(Margevicius and Haddad, 2002)
2.2.3 Defective Manufacturing Materials and/or Manufacturing Methods
Manufacturing defects could be due to the utilization of low quality of mortar
during manufacturing of pipe, leaking in joints due to out-of-roundness, poor quality of
alkali-silica, wire manufacturing problem, excessive core creep and shrinkage due to high
water cement ratio, excessive fine aggregate ratio, and improper curing of the concrete
(Romer et al., 2007). Similarly, Uyeda points to defective wire and longitudinal cracks in
prestressing wire during pipe manufacturing causing high stress during the winding
operation resulting in fractures in the prestressing wire (Uyeda et al., 1994; Marshall and
Fisk, 2010).
26
2.2.4 Failure Due to Improper Design
Design of PCCP is a very complex procedure, and the owner/engineer should
review it prior to its implementation. Improper design can lead to pipe failures and
ruptures. Pipe failure can be caused by inadequate joint restraints and dissimilarity in
bedding stiffness that can lead to differential settlement and circumferential cracks
Coating cracks due to excessive operational pressure and operational surge pressure, and
cracking of the core and coating can all occur during the pipe load (Romer et al., 2007).
2.2.5 Failure Due to Construction Damage
As noted by Romer, failure by construction damage includes third party damage,
settlement of soil or structure, wrong pipe class, wrong wire size, structural distress, and
others (Romer et al., 2007).
Third party damage is an accidental damage during construction of pipeline from
other workers’ construction or mechanical equipment. PCCP is designed for specific
location and suitable bedding condition. If a wrong pipe class is used at an unsuitable
condition, the pipe strength will reduce and may be result in pipe failure. Damages and
defects in PCCP may be due to wire breaks and cracks (Alavinasab et al., 2011).
2.3 Consequences of Pipeline Failures
Prestressed concrete cylinder pipes are manufactured in large diameters to
transport thousands of gallons of water from sources such as water reservoirs, lakes, and
rivers to water treatment plants. Every day, thousands of gallons of water are lost due to
water pipeline failures in the United States. Failure of PCCP is measured in pipe

27
breakage due to ruptures as well as leaks, deterioration, structural weakness, and loss of
service.
The American Water Work Association defines failure of PCCP as:
“Failure was indicated as requiring action after installation to correct a pipe
deficiency – repair, replacement, or both repair and replacement of the affected units”
and “The term failure is synonymous with repair and replacement rate.”
The existing literature shows a variety of factors that can affect PCCP failure
patterns. As said previously, different types of failures in pipes can lead to rupture or
other problems, which can affect water pipeline performance underground. These failures
vary widely from modest to substantial as shown in the data research conducted in earlier
studies. Some of the causes of failures are summarized in Table 2.1.
Table 2.1 Comparison of Results from Prior Studies
Study Date Conclusion
Marshall and Flak 2010 PCCP fails by the poor quality of material,
construction damage, operational parameter and
environmental condition
Bell et al. 2010 PCCP fails due to wire breakage
Romer and Bell 2004 PCCP Fails due to corrosive environment
Zarghamee and Oidrovic 2001 Rupture failure in PCCP due to wire breaks
Margevicius and Haddad 2002 Rupture failure in PCCP due to defective
prestressing wire
Romer et al. 2007 PCCP failure due to defective manufacturing
materials, methods and improper design
Uyeda et al. 1994 Longitudinal cracks in PCCP during prestressing

28
2.4 Chapter Summary
This chapter examined the existing literature on failure of PCCP pipes. The pipeline
failure can have a significant impact on the society and environment. Various causes of
PCCP failures were discussed. This chapter presented a comparative analysis of prior
studies.
29
CHAPTER 3
METHODOLOGY
This chapter discusses the methodology to analyze the performance of Prestressed
Concrete Cylinder Pipe (PCCP) in water transmission and presents survey data to analyze
the failure rate of PCCP pipe.
3.1 Introduction
This research is divided into two parts. The first part begins with a data
representation of survey responses. The second part presents the statistical analysis of the
performance data by diameter and years. The methodology is explained further in this
chapter.
3.2 Use of Surveys
A survey was created to identify the cause of failure of large diameter pipelines
including prestressed concrete cylinder pipe in water transmission. This study was
conducted at UT Arlington. Survey data was synthesized by the Center for Underground
Infrastructure Research and Education (CUIRE). The survey was designed in an effective
way to get maximum information or data on large diameter pipelines including PCCP
pipe failure. The process followed in completion of the survey is shown below:
Set goals and objectives of survey
Create questionnaire – what to ask
Disperse the survey to water utilities
30
Collect responses
Analyze the survey responses
The email method was used in dispersing the survey and some telephone
interviews were followed. The survey sample is included in Appendix B.
3.2.1 Data Collection
Various methods of data collection were adopted including personal interviews,
telephone interviews, and email surveys to collect the data from various water utilities.
There were some multiple-choice questions, and essay questions.
3.2.1.1 Personal Interviews
Some of the survey questions were asked from the representatives of water
utilities in the Underground Construction Technology (UCT) 2012 conference in San
Antonio, Texas, and ASCE Pipelines Conference 2012 in Miami Beach, Florida. Good
responses from personal interviews were received. The personal interview approach
helped to comprehend the questions clearly and create new ideas.
3.2.1.2 Telephone Interviews
Telephone interviews with some water utilities personnel were conducted. It was
also used in to gather data that was unclear or not provided in the responses.
3.2.1.3 Email Surveys
An email surveys is a convenient method. It is the fastest and most economical of
all methods utilized. The responder can reply whenever it’s convenient to them and send
their response back momentarily. In this study the emailing method was utilized the most.

31
For the convenience of responders, the survey was sent in two formats, Microsoft Word
and PDF.
3.2.2 Survey Analysis
The original survey was sent to more than 300 water utilities and 13 utilities
responded to the PCCP part. Figure 3.1 presents the geographical location of those water
utilities that responded back. Some questions were partially answered and to fill the gap,
some respondents sent their pipe reports in Excel spreadsheet. Those utilities that
populated their survey partially or sent Excel sheets were later contacted via telephone or
email to get more information.
Figure 3.1 Geographical Locations of Water Utilities
32
3.3 Methodology
This part of research introduces statistical analysis for the year of pipe
installation, diameter ranges, and the types of failures observed.
3.3.1 Dependent Variable
The dependent variable, FailureRatedt, is constructed by dividing the number of
failures across each diameter category (Failuresd) to total number of failures in a year
(TotalFaliurest).
3.3.2 Independent variable
Independent variables include:
(1) Three dummy variables: A dummy variable is a variable that takes on the
values of 1 and 0 in the regression model, for diameter category (Diameter) - (A)
between 24 in. and 36 in., (B) between 42 in. and 48 in., and (C) 54 in. and larger.
Diameter range of 24 in. and 36 in. is used as the base case or the comparative case.
(2). Another variable used in the model is the dummy variable for year (Time) that
represents the time period from 1971 to 2011 with the base case of 1971.
Table 3.1 below provides the definition and descriptive statistics for the variables
collected in the survey and used in the analysis:

33
Table 3.1 Descriptive Summary Statistics
Variables Definition Mean Std. Deviation Min Max
Failuresd Failures across each Diameter Category 1.83 1.12 1 6
TotalFaliurest Total Number of Failures in a Year 3.82 2.64 1 9
Diameterd Dummies for Diameter Range (3)
Between 24 in. and 36 in. (Base Case) 0 0
Between 42 in. and 48 in. 0 1
54 in. and larger 0 1
Timet Year Dummies
1971 (Base Case) 0 0
1972 – 2011 0 1
Number of Observations = 92
3.3.3 Model
A categorical regression model is presented. This model quantifies the data by
assigning numerical values to the categories, resulting in an optimal linear regression
equation.
The model presents the failure rate as a function of explanatory variables, years
and diameter categories. The complete model has the following form:
FailureRatedt = α + βdDiameterd + βtTimet + εrrordt
And, FailureRatedt = Failuresd / TotalFaliurest
Where, FailureRate is a ratio of number of Failures across each diameter category
by total number of failures in that year. Diameter represents dummy variable for the
diameter categories- between 24 in. and 36 in., between 42 in. and 48 in., and 54 in. and
larger, and Time denotes dummies for year from 1971 to 2011.
34
3.4 Chapter Summary
This chapter introduced the research methodology. This chapter further explained
the research process of data presentation. Also, statistical model used to analyze the
survey data was discussed.
35
CHAPTER 4
RESEARCH RESULTS
4.1 Introduction
This chapter presents the results and statistical analysis of the failure data. Results
are separated into two groups: 1) data representation of the failure data, and 2) statistical
model of failure rate by diameter size over multiple years.
4.2 Data Presentation
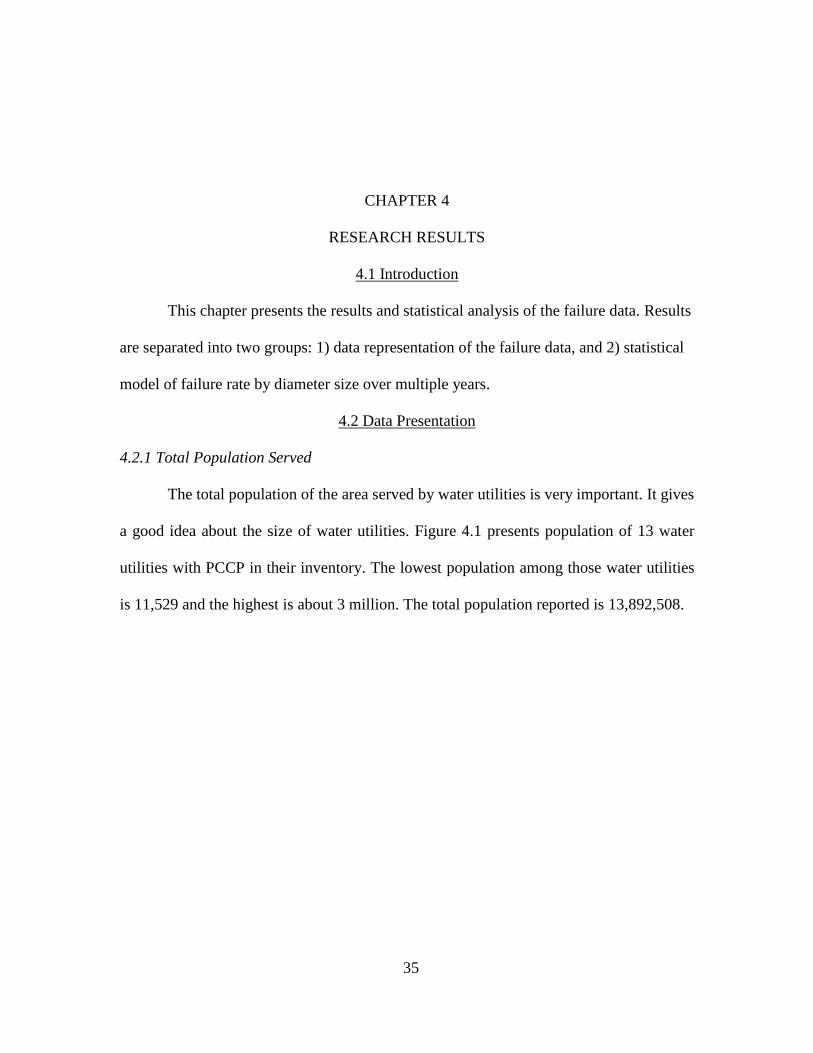
4.2.1 Total Population Served
The total population of the area served by water utilities is very important. It gives
a good idea about the size of water utilities. Figure 4.1 presents population of 13 water
utilities with PCCP in their inventory. The lowest population among those water utilities
is 11,529 and the highest is about 3 million. The total population reported is 13,892,508.
36
Figure 4.1 Population of all Water Utilities
4.2.2 Total Footage
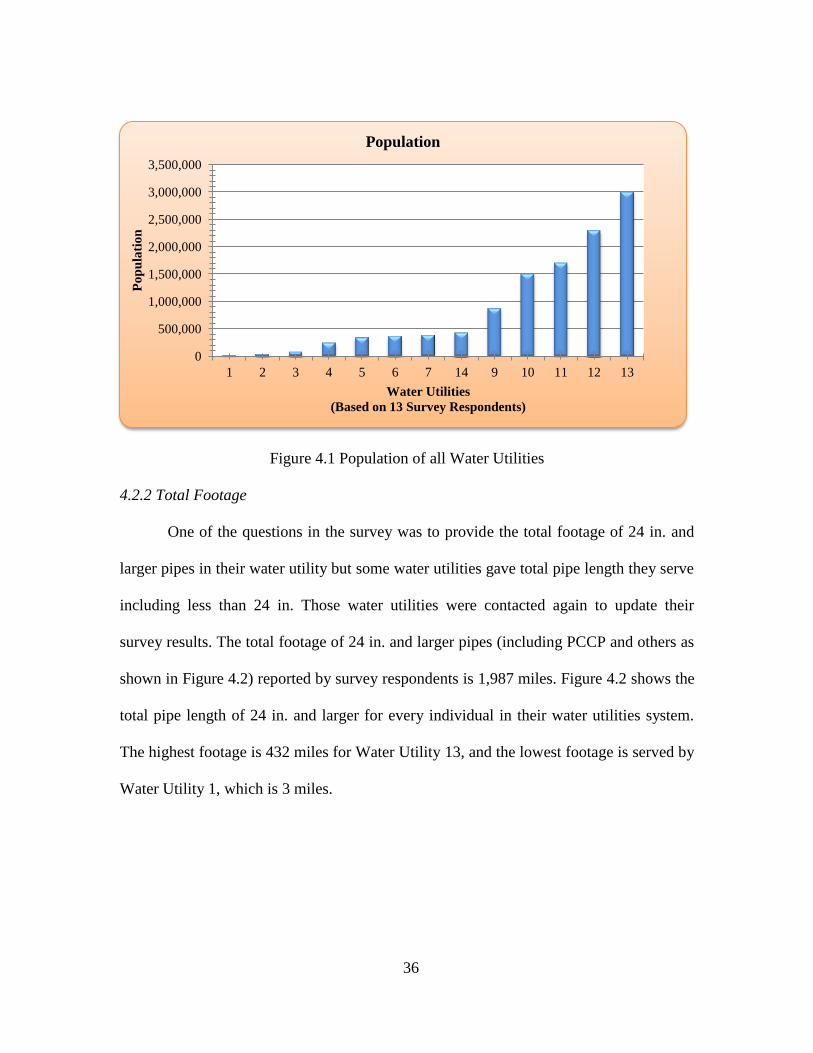
One of the questions in the survey was to provide the total footage of 24 in. and
larger pipes in their water utility but some water utilities gave total pipe length they serve
including less than 24 in. Those water utilities were contacted again to update their
survey results. The total footage of 24 in. and larger pipes (including PCCP and others as
shown in Figure 4.2) reported by survey respondents is 1,987 miles. Figure 4.2 shows the
total pipe length of 24 in. and larger for every individual in their water utilities system.
The highest footage is 432 miles for Water Utility 13, and the lowest footage is served by
Water Utility 1, which is 3 miles.
0
500,000
1,000,000
1,500,000
2,000,000
2,500,000
3,000,000
3,500,000
1 2 3 4 5 6 7 14 9 10 11 12 13
Po
pu
lati
on
Water Utilities
(Based on 13 Survey Respondents)
Population

37
Figure 4.2 Footage of 24 in. and Larger Pipe in Water Utilities.
4.2.3 Population Served per Mile
Population served per mile is a ratio of total population served by a utility to total
footage (miles) of 24 in. and larger pipes of that water utility. Table 4.1 shows population
served per mile.
Table 4.1 Population Served per Mile (Based on 13 Survey Respondents)
Survey
Respondents
Population
Served
Footage
(miles)
Population
Served per
mile
Survey
Respondents
Population
Served
Footage
(miles)
Population
Served per
mile
1 11,529 3 3,792 8 420,000 159 2,633
2 34,400 49 694 9 867,599 120 7,182
3 78,000 22 3,482 10 1,500,000 410 3,651
4 240,000 54 4,444 11 1,700,000 187 9,091
5 340,758 100 3,381 12 2,300,000 331 6,936
6 365,438 85 4,299 13 3,000,000 432 6,944
7 380,000 30 12,667 Total 11,237,724 1,986.5 69,196
0.0
50.0
100.0
150.0
200.0
250.0
300.0
350.0
400.0
450.0
500.0
1 2 3 4 5 6 7 8 9 10 11 12 13
Fo
ota
ge
(mil
es)
Water Utilities
(Based on 13 Survey Respondents)
Footage (miles)
38
4.2.4 Diameter Size
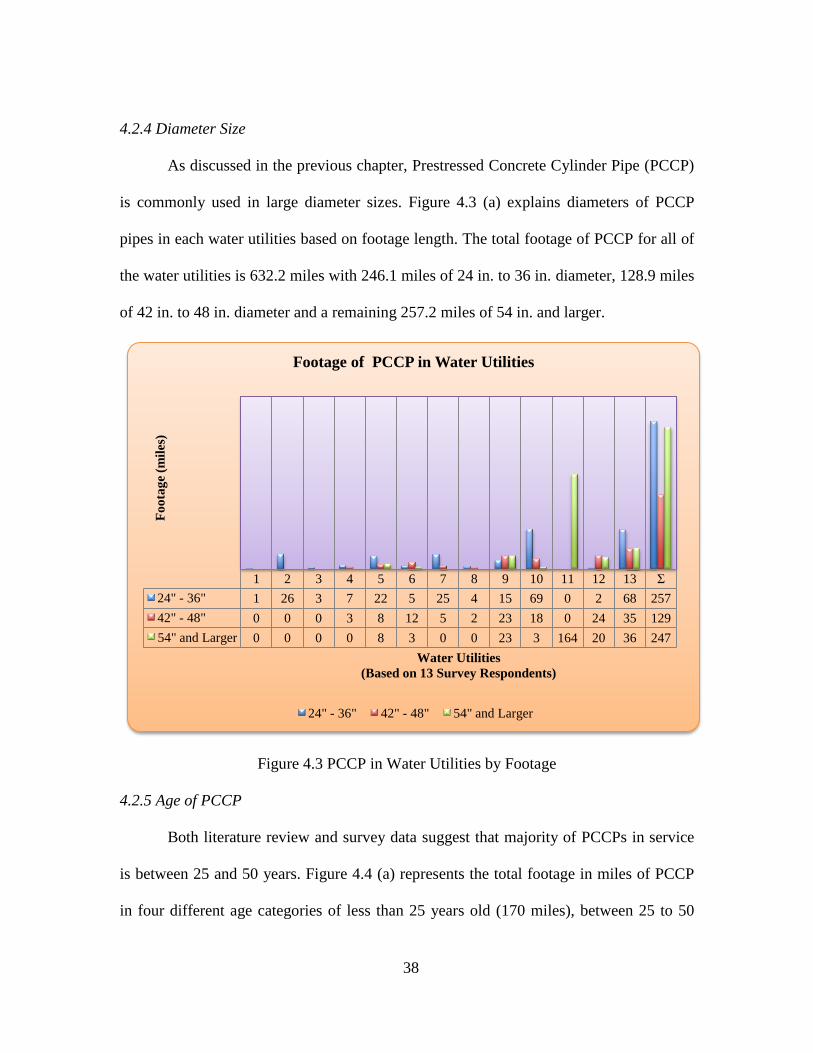
As discussed in the previous chapter, Prestressed Concrete Cylinder Pipe (PCCP)
is commonly used in large diameter sizes. Figure 4.3 (a) explains diameters of PCCP
pipes in each water utilities based on footage length. The total footage of PCCP for all of
the water utilities is 632.2 miles with 246.1 miles of 24 in. to 36 in. diameter, 128.9 miles
of 42 in. to 48 in. diameter and a remaining 257.2 miles of 54 in. and larger.
Figure 4.3 PCCP in Water Utilities by Footage
4.2.5 Age of PCCP
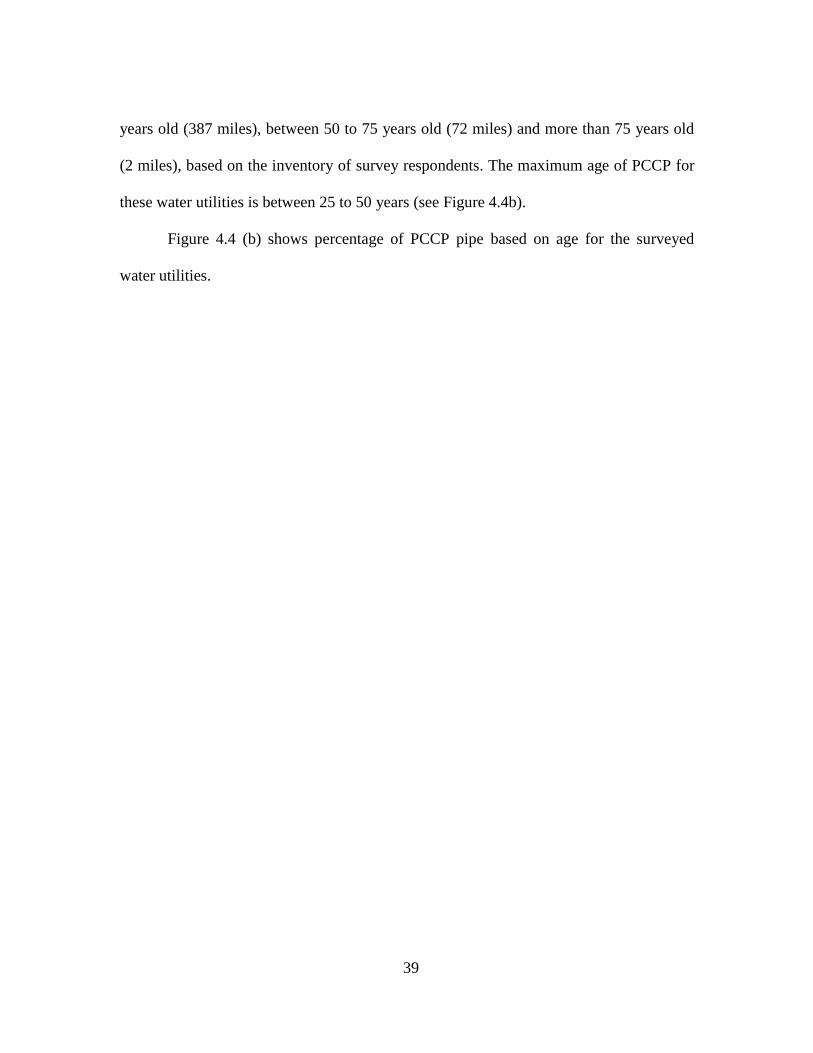
Both literature review and survey data suggest that majority of PCCPs in service
is between 25 and 50 years. Figure 4.4 (a) represents the total footage in miles of PCCP
in four different age categories of less than 25 years old (170 miles), between 25 to 50
1 2 3 4 5 6 7 8 9 10 11 12 13 Σ
24" - 36" 1 26 3 7 22 5 25 4 15 69 0 2 68 257
42" - 48" 0 0 0 3 8 12 5 2 23 18 0 24 35 129
54" and Larger 0 0 0 0 8 3 0 0 23 3 164 20 36 247
Fo
ota
ge
(mil
es)
Water Utilities
(Based on 13 Survey Respondents)
Footage of PCCP in Water Utilities
24" - 36" 42" - 48" 54" and Larger
39
years old (387 miles), between 50 to 75 years old (72 miles) and more than 75 years old
(2 miles), based on the inventory of survey respondents. The maximum age of PCCP for
these water utilities is between 25 to 50 years (see Figure 4.4b).
Figure 4.4 (b) shows percentage of PCCP pipe based on age for the surveyed
water utilities.
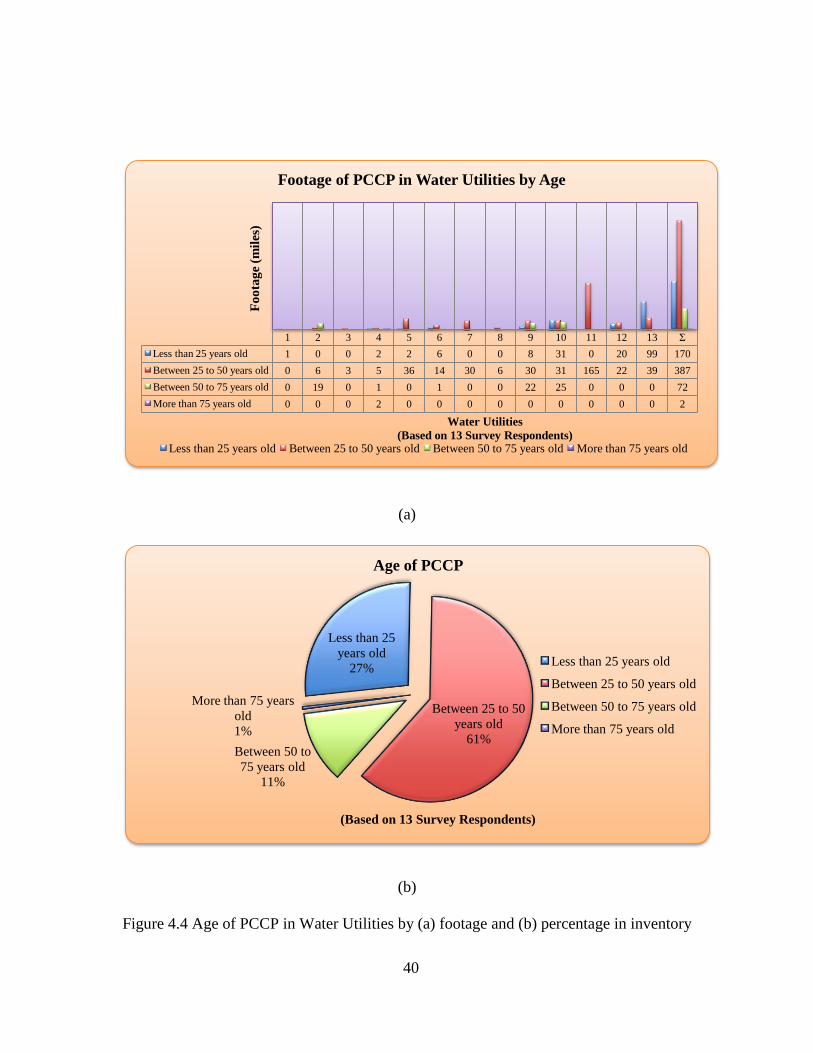
40
(a)
(b)
Figure 4.4 Age of PCCP in Water Utilities by (a) footage and (b) percentage in inventory
1 2 3 4 5 6 7 8 9 10 11 12 13 Σ
Less than 25 years old 1 0 0 2 2 6 0 0 8 31 0 20 99 170
Between 25 to 50 years old 0 6 3 5 36 14 30 6 30 31 165 22 39 387
Between 50 to 75 years old 0 19 0 1 0 1 0 0 22 25 0 0 0 72
More than 75 years old 0 0 0 2 0 0 0 0 0 0 0 0 0 2
Fo
ota
ge
(mil
es)
Water Utilities
(Based on 13 Survey Respondents)
Footage of PCCP in Water Utilities by Age
Less than 25 years old Between 25 to 50 years old Between 50 to 75 years old More than 75 years old
Less than 25
years old
27%
Between 25 to 50
years old
61% Between 50 to
75 years old
11%
More than 75 years
old
1%
Age of PCCP
Less than 25 years old
Between 25 to 50 years old
Between 50 to 75 years old
More than 75 years old
(Based on 13 Survey Respondents)
41
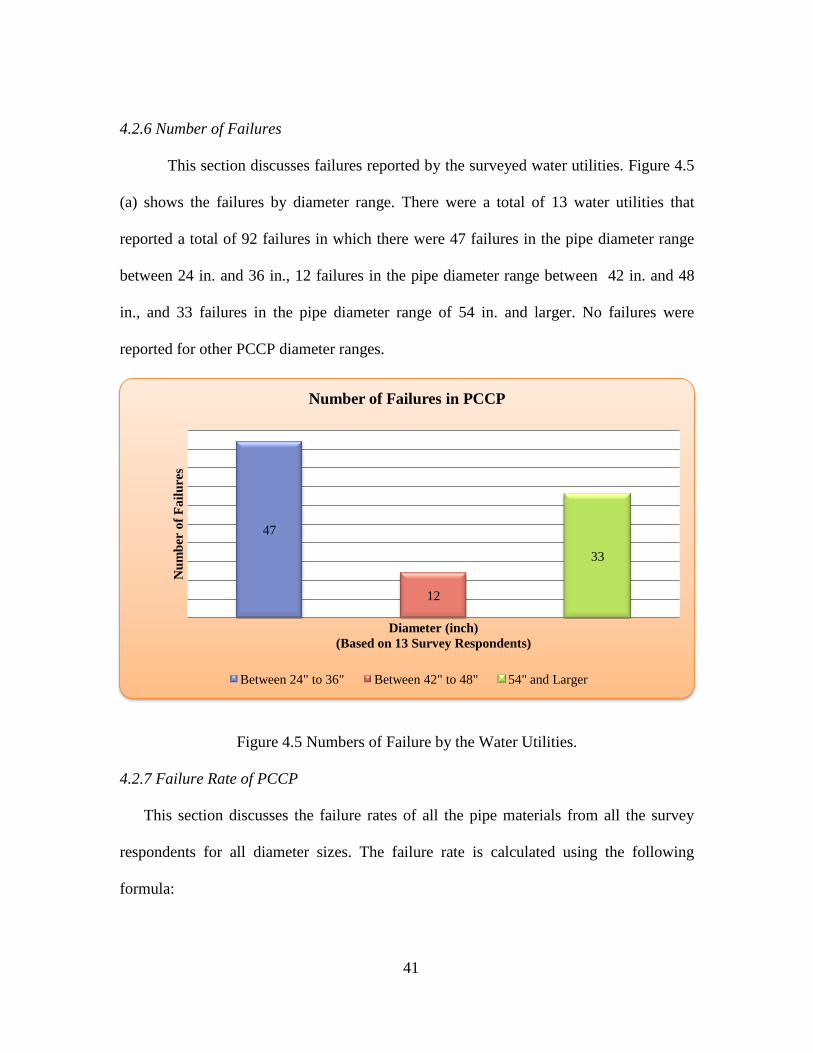
4.2.6 Number of Failures
This section discusses failures reported by the surveyed water utilities. Figure 4.5
(a) shows the failures by diameter range. There were a total of 13 water utilities that
reported a total of 92 failures in which there were 47 failures in the pipe diameter range
between 24 in. and 36 in., 12 failures in the pipe diameter range between 42 in. and 48
in., and 33 failures in the pipe diameter range of 54 in. and larger. No failures were
reported for other PCCP diameter ranges.
Figure 4.5 Numbers of Failure by the Water Utilities.
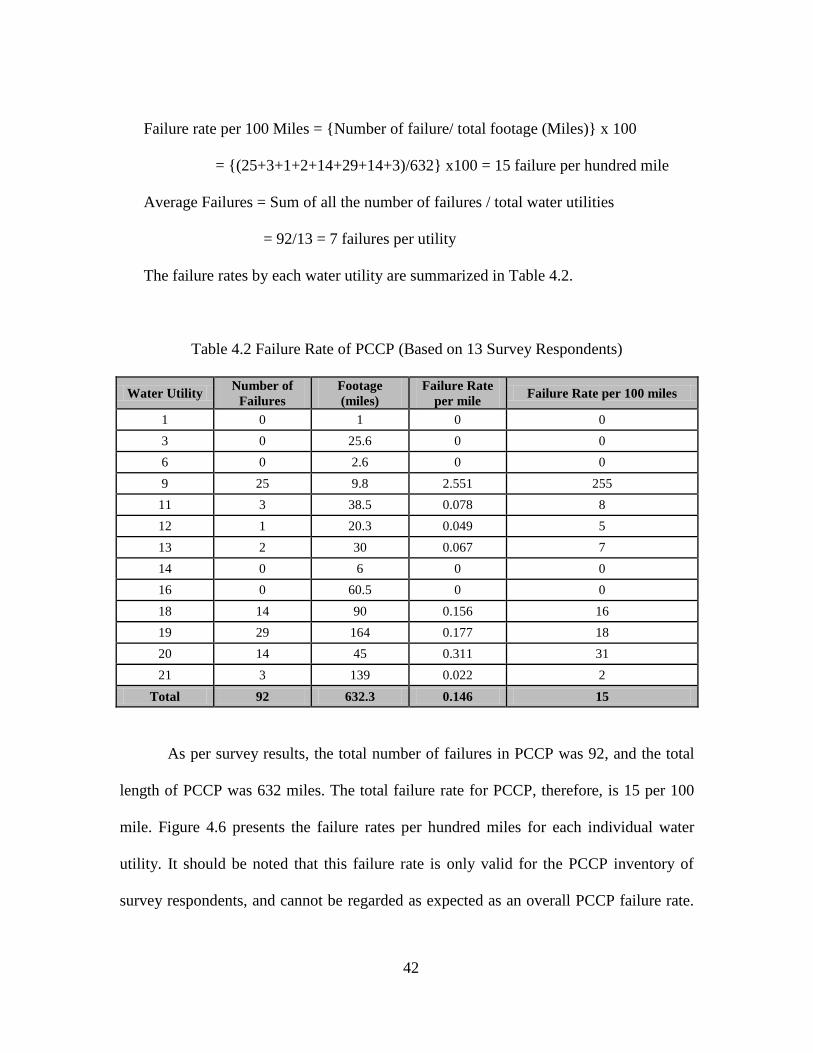
4.2.7 Failure Rate of PCCP
This section discusses the failure rates of all the pipe materials from all the survey
respondents for all diameter sizes. The failure rate is calculated using the following
formula:
47
12
33
Nu
mb
er o
f F
ail
ure
s
Diameter (inch)
(Based on 13 Survey Respondents)
Number of Failures in PCCP
Between 24" to 36" Between 42" to 48" 54" and Larger
42
Failure rate per 100 Miles = {Number of failure/ total footage (Miles)} x 100
= {(25+3+1+2+14+29+14+3)/632} x100 = 15 failure per hundred mile
Average Failures = Sum of all the number of failures / total water utilities
= 92/13 = 7 failures per utility
The failure rates by each water utility are summarized in Table 4.2.
Table 4.2 Failure Rate of PCCP (Based on 13 Survey Respondents)
Water Utility Number of
Failures
Footage
(miles)
Failure Rate
per mile Failure Rate per 100 miles
1 0 1 0 0
3 0 25.6 0 0
6 0 2.6 0 0
9 25 9.8 2.551 255
11 3 38.5 0.078 8
12 1 20.3 0.049 5
13 2 30 0.067 7
14 0 6 0 0
16 0 60.5 0 0
18 14 90 0.156 16
19 29 164 0.177 18
20 14 45 0.311 31
21 3 139 0.022 2
Total 92 632.3 0.146 15
As per survey results, the total number of failures in PCCP was 92, and the total
length of PCCP was 632 miles. The total failure rate for PCCP, therefore, is 15 per 100
mile. Figure 4.6 presents the failure rates per hundred miles for each individual water
utility. It should be noted that this failure rate is only valid for the PCCP inventory of
survey respondents, and cannot be regarded as expected as an overall PCCP failure rate.
43
For example, Romer et al (2008) reported a failure rate of 2.65 per 100 miles per year for
embedded cylinder PCCP and 25.4 per 100 miles per year for lined cylinder PCCP.
Figure 4.6 Failure Rates per 100 Miles Reported by Survey Respondents
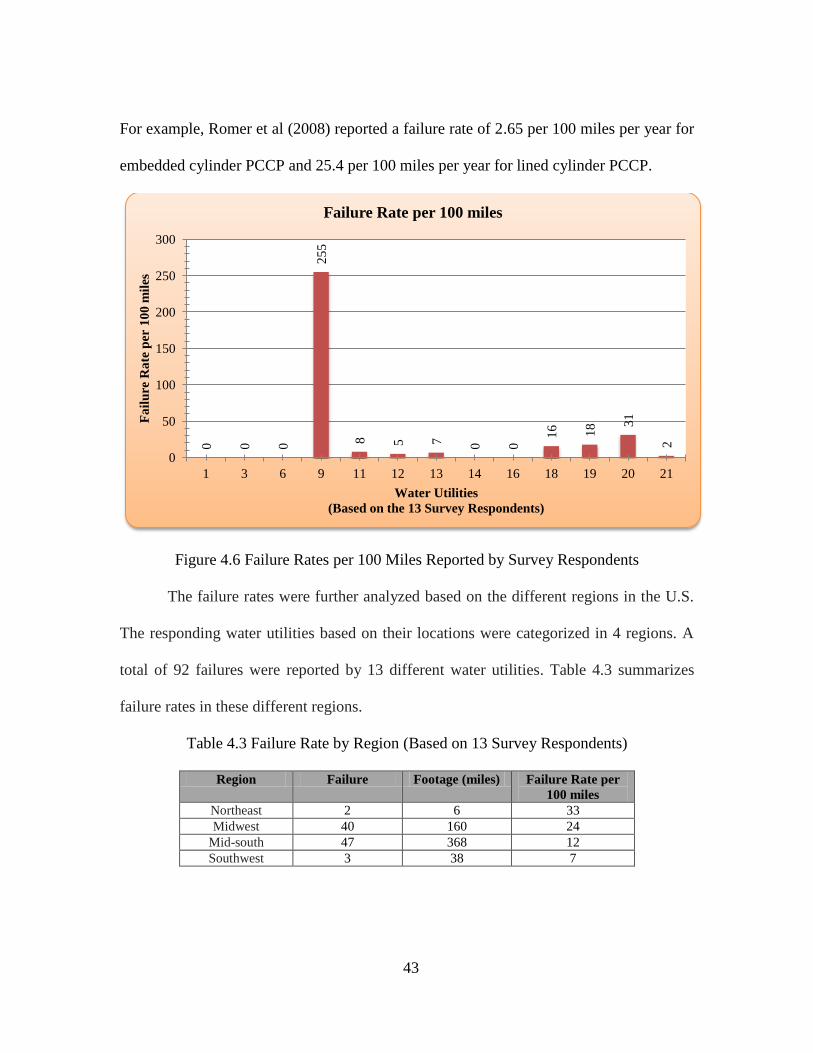
The failure rates were further analyzed based on the different regions in the U.S.
The responding water utilities based on their locations were categorized in 4 regions. A
total of 92 failures were reported by 13 different water utilities. Table 4.3 summarizes
failure rates in these different regions.
Table 4.3 Failure Rate by Region (Based on 13 Survey Respondents)
Region Failure Footage (miles) Failure Rate per
100 miles
Northeast 2 6 33
Midwest 40 160 24
Mid-south 47 368 12
Southwest 3 38 7
0
0
0
25
5
8
5 7
0
0 1
6
18
31
2
0
50
100
150
200
250
300
1 3 6 9 11 12 13 14 16 18 19 20 21
Fa
ilu
re R
ate
per
10
0 m
iles
Water Utilities
(Based on the 13 Survey Respondents)
Failure Rate per 100 miles

44
4.3 Statistical Analysis
To analyze the performance of PCCP, this analysis covers the failure rate across
various diameter ranges over multiple years from 1971 to 2011. The literature offers little
guidance to answer this question and whether these changes vary by type of diameter or
by year. Failure rate, a continuous dependent variable, is hypothesized to be a function of
categorical independent variables including years and diameter size. This thesis presents
the failure rate by dividing total failures in each diameter range by total failures in that
year. For the diameter size, the pipe diameters were classified in three categories as
follows:
Category 1: between 24 in. and 36 in.
Category 2: between 42 in. and 48 in.
Category 3: 54 in. and larger.
Figure 4.7 summarizes the rate of failure, by diameter size over the time spans
designated in the study. Failure rate was calculated by dividing the number of failures
across each diameter category by total number of failures in a year. For example, in the
year 1982, the failure rate for the diameter range 24 in. to 36 in. was calculated to be
80%. It was calculated by dividing 4 failures that occurred in that year for that diameter
divided by the total failures (5) in that year. The failure rate calculated from the sample
data was graphed against the years, from 1971 to 2011, for all diameter ranges. By
graphing calculated failure rate against each year, notable high points were in the years
1982 and 2010 for the diameter range between 24 in. and 36 in., which may suggest that
this range continues to experience a higher failure rate. For the diameter range, 42 in. to
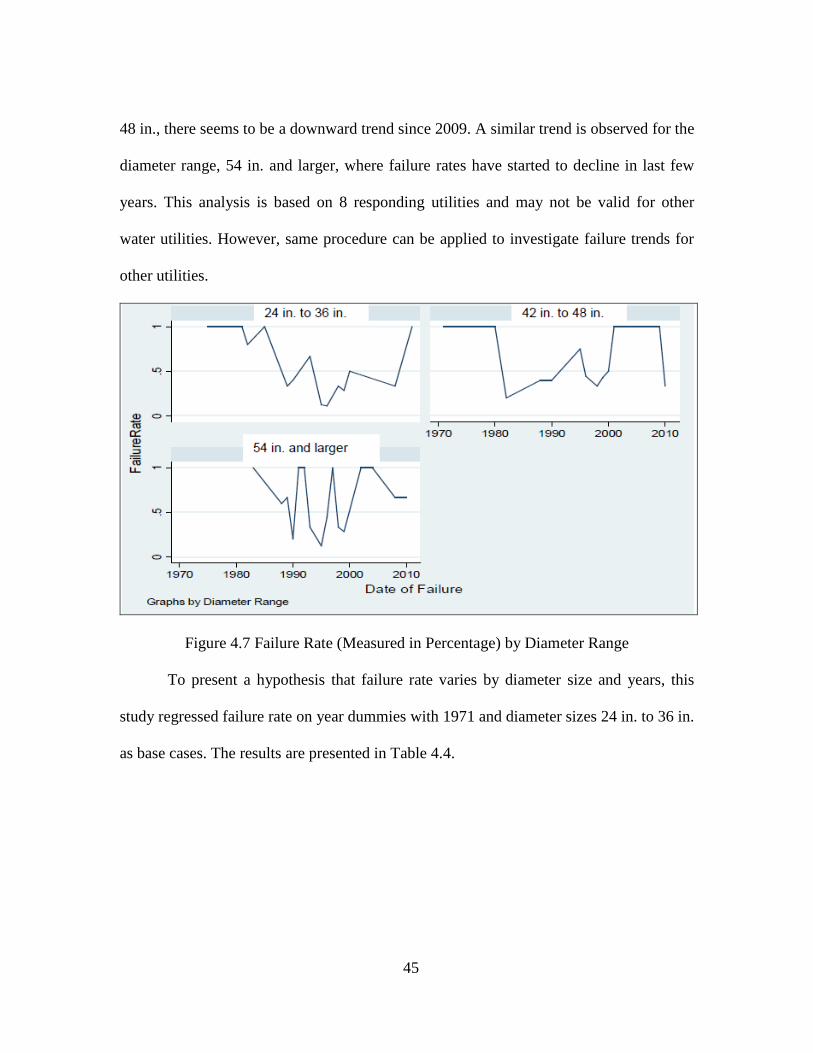
45
48 in., there seems to be a downward trend since 2009. A similar trend is observed for the
diameter range, 54 in. and larger, where failure rates have started to decline in last few
years. This analysis is based on 8 responding utilities and may not be valid for other
water utilities. However, same procedure can be applied to investigate failure trends for
other utilities.
Figure 4.7 Failure Rate (Measured in Percentage) by Diameter Range
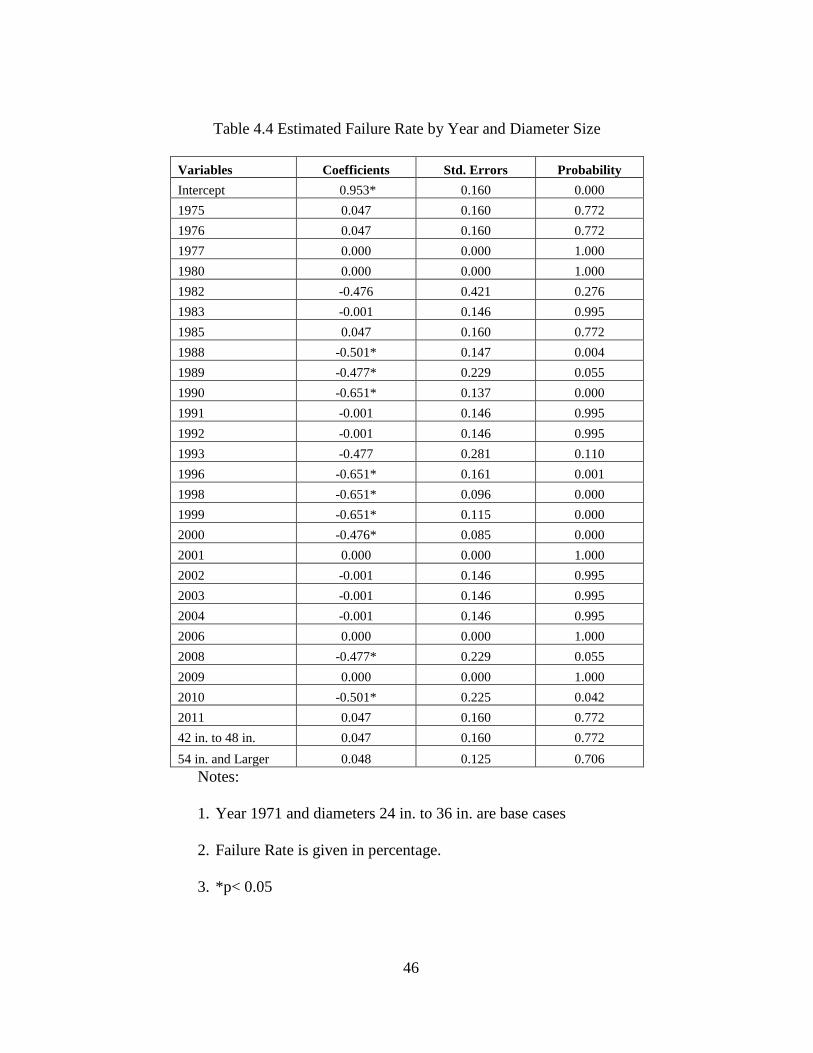
To present a hypothesis that failure rate varies by diameter size and years, this
study regressed failure rate on year dummies with 1971 and diameter sizes 24 in. to 36 in.
as base cases. The results are presented in Table 4.4.
46
Table 4.4 Estimated Failure Rate by Year and Diameter Size
Variables Coefficients Std. Errors Probability
Intercept 0.953* 0.160 0.000
1975 0.047 0.160 0.772
1976 0.047 0.160 0.772
1977 0.000 0.000 1.000
1980 0.000 0.000 1.000
1982 -0.476 0.421 0.276
1983 -0.001 0.146 0.995
1985 0.047 0.160 0.772
1988 -0.501* 0.147 0.004
1989 -0.477* 0.229 0.055
1990 -0.651* 0.137 0.000
1991 -0.001 0.146 0.995
1992 -0.001 0.146 0.995
1993 -0.477 0.281 0.110
1996 -0.651* 0.161 0.001
1998 -0.651* 0.096 0.000
1999 -0.651* 0.115 0.000
2000 -0.476* 0.085 0.000
2001 0.000 0.000 1.000
2002 -0.001 0.146 0.995
2003 -0.001 0.146 0.995
2004 -0.001 0.146 0.995
2006 0.000 0.000 1.000
2008 -0.477* 0.229 0.055
2009 0.000 0.000 1.000
2010 -0.501* 0.225 0.042
2011 0.047 0.160 0.772
42 in. to 48 in. 0.047 0.160 0.772
54 in. and Larger 0.048 0.125 0.706
Notes:
1. Year 1971 and diameters 24 in. to 36 in. are base cases
2. Failure Rate is given in percentage.
3. *p< 0.05
47
The overall model is statistically significant as indicated by the statistically
significant intercept (α = 0.953). Table 4.4 illustrates failure rates for various diameter
ranges and years. It uses the year 1971 and the diameter range between 24 in. to 36 in. as
base cases. For example, the coefficient for the year 1988 is significant as indicated by
the p-value of less than 0.05 (p< 0.05) which implies that with 95% confidence level, and
the failure rate for the year 1988 is about 50% less than the base case of 1971. For other
coefficients where the p-value is greater than 0.05(p>0.05) no statistically significant
linear dependence was detected between dependent (failure rate) and independent
variables.
The greatest coefficient is for the base case, year 1971, which implies the failure
rate, was highest in that year. Since 1988, there is a downward trend in the failure rate
and a significant reduction in the failure rate compared to the base case of 1971. It may
be due to the improvements introduced as a result of AWWA standards in early 1980s.
These improvements included amendments made to the PCCP AWWA C301 Standards
such as increasing the minimum diameter range of prestressing wire from 0.125 in. to
0.192 in., increasing the improving the wire testing requirements including the
introduction of hydrogen embrittlement susceptibility testing and improving the mortar
coating absorption as well as testing for mortar coating. In 1955, for the prestressing wire
which fails due to hydrogen embrittlement sensitivity (environmental deterioration),
AWWA mandated hydrogen embrittlement qualification testing as part of the AWWA
Standards, and allowed only the class II and class III wires in the manufacturing process
of PCCP.
48
No identifiable differences were found between the two diameter ranges, 42 in. to
48 in. and 54 in. and larger in regards to the failure rate. The coefficients for these
diameter ranges are insignificant (P- value >0.05). The base case diameter range of 24 in.
to 36 in. seems to have the highest failure rate when compared to other ranges, which
could be due to operational damage, external corrosion, prestressed wire breakage,
embrittlement, and joint failure. Another reason for the failure rate to be high in this
range could be attributed to the fact that this diameter range is most commonly utilized.
4.4 Chapter Summary
This chapter presented the failure rate results based on the survey data from 13
water utilities for PCCP pipes. The analysis for survey respondents suggests that failure
rates have started to come down in recent years.
In terms of the diameter range variability, 42 in. to 48 in. and 54 in. and larger,
have achieved lower failure rates compared to the diameter range 24 in. to 36 in. The
results of the analysis support the hypothesis that there are variations in failure rate by
diameter size and by years. All results are limited to 13 survey respondents, and may not
represent overall PCCP performance.
49
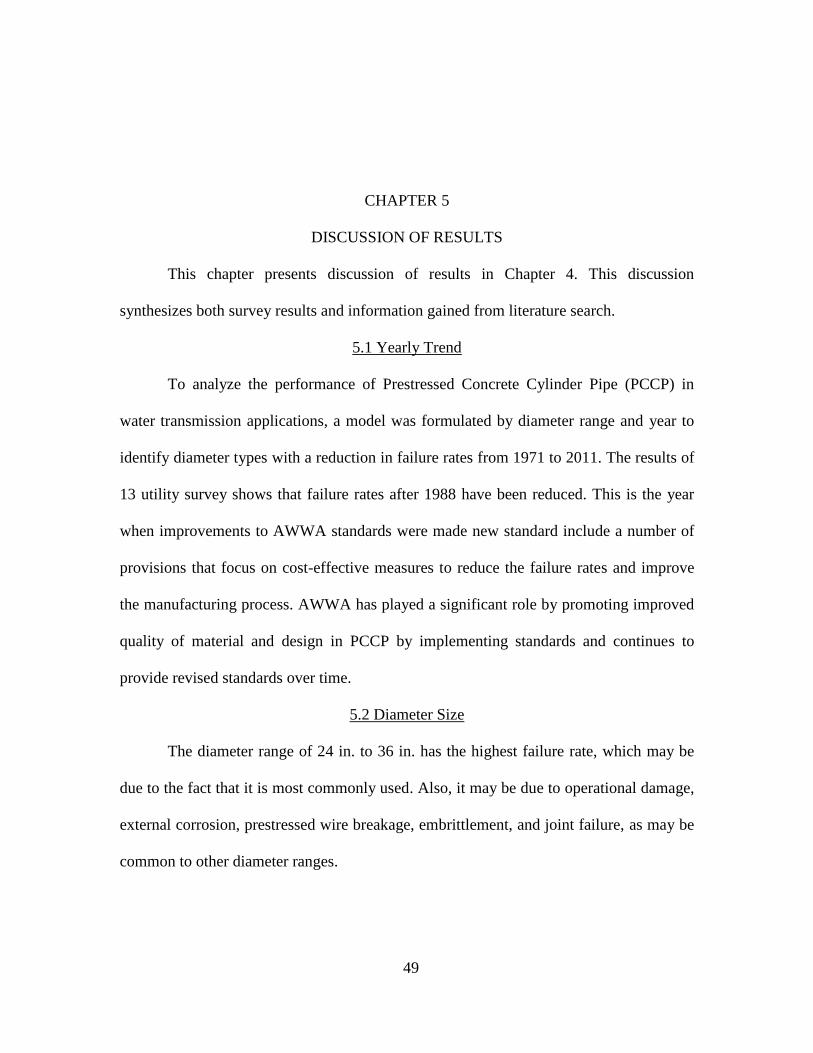
CHAPTER 5
DISCUSSION OF RESULTS
This chapter presents discussion of results in Chapter 4. This discussion
synthesizes both survey results and information gained from literature search.
5.1 Yearly Trend
To analyze the performance of Prestressed Concrete Cylinder Pipe (PCCP) in
water transmission applications, a model was formulated by diameter range and year to
identify diameter types with a reduction in failure rates from 1971 to 2011. The results of
13 utility survey shows that failure rates after 1988 have been reduced. This is the year
when improvements to AWWA standards were made new standard include a number of
provisions that focus on cost-effective measures to reduce the failure rates and improve
the manufacturing process. AWWA has played a significant role by promoting improved
quality of material and design in PCCP by implementing standards and continues to
provide revised standards over time.
5.2 Diameter Size
The diameter range of 24 in. to 36 in. has the highest failure rate, which may be
due to the fact that it is most commonly used. Also, it may be due to operational damage,
external corrosion, prestressed wire breakage, embrittlement, and joint failure, as may be
common to other diameter ranges.
50
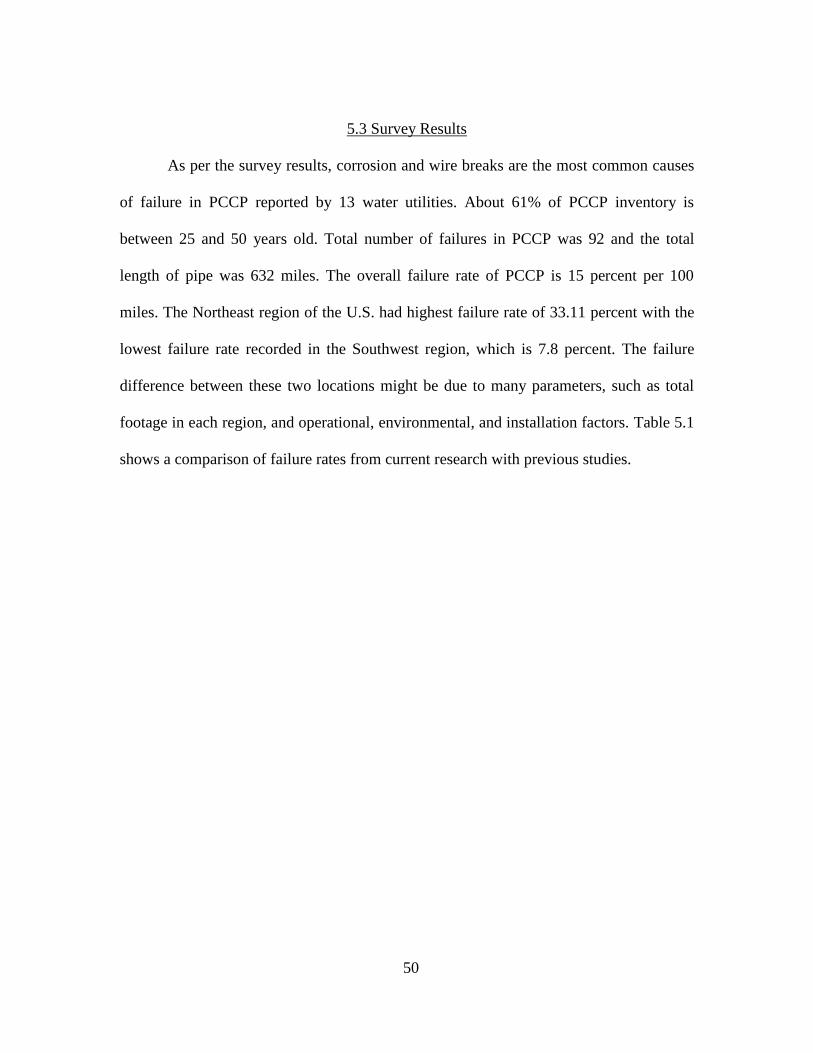
5.3 Survey Results
As per the survey results, corrosion and wire breaks are the most common causes
of failure in PCCP reported by 13 water utilities. About 61% of PCCP inventory is
between 25 and 50 years old. Total number of failures in PCCP was 92 and the total
length of pipe was 632 miles. The overall failure rate of PCCP is 15 percent per 100
miles. The Northeast region of the U.S. had highest failure rate of 33.11 percent with the
lowest failure rate recorded in the Southwest region, which is 7.8 percent. The failure
difference between these two locations might be due to many parameters, such as total
footage in each region, and operational, environmental, and installation factors. Table 5.1
shows a comparison of failure rates from current research with previous studies.
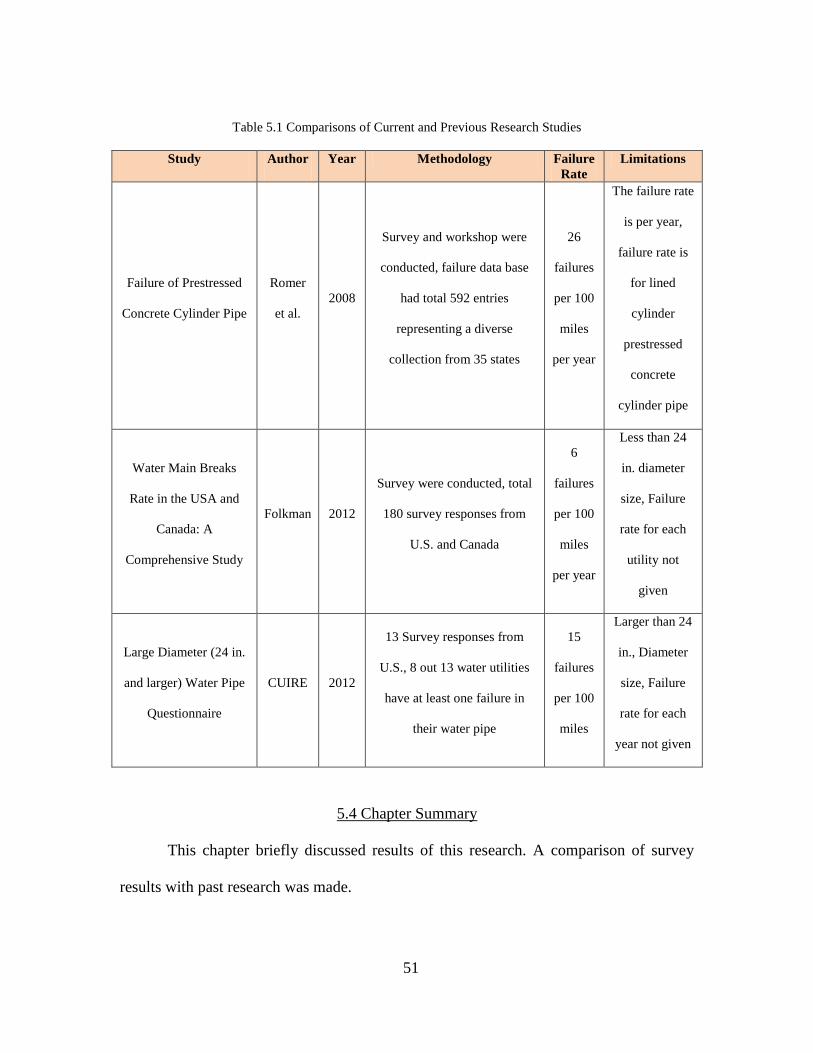
51
Table 5.1 Comparisons of Current and Previous Research Studies
Study Author Year Methodology Failure
Rate
Limitations
Failure of Prestressed
Concrete Cylinder Pipe
Romer
et al.
2008
Survey and workshop were
conducted, failure data base
had total 592 entries
representing a diverse
collection from 35 states
26
failures
per 100
miles
per year
The failure rate
is per year,
failure rate is
for lined
cylinder
prestressed
concrete
cylinder pipe
Water Main Breaks
Rate in the USA and
Canada: A
Comprehensive Study
Folkman 2012
Survey were conducted, total
180 survey responses from
U.S. and Canada
6
failures
per 100
miles
per year
Less than 24
in. diameter
size, Failure
rate for each
utility not
given
Large Diameter (24 in.
and larger) Water Pipe
Questionnaire
CUIRE 2012
13 Survey responses from
U.S., 8 out 13 water utilities
have at least one failure in
their water pipe
15
failures
per 100
miles
Larger than 24
in., Diameter
size, Failure
rate for each
year not given
5.4 Chapter Summary
This chapter briefly discussed results of this research. A comparison of survey
results with past research was made.
52
CHAPTER 6
CONCLUSIONS, LIMITATIONS AND RECOMMENDATIONS
FOR FUTURE RESEARCH
6.1 Introduction
This chapter summarizes conclusions of this thesis. It also recommends some
topics for future research.
6.2 Conclusions
The following conclusions can be derived from this thesis based on 13 survey
respondents.
1. The total footage of PCCP from all survey respondents is 632 miles and the
overall failure rate for PCCP is 15 percent per 100 miles.
2. The most common cause of failure reported in PCCP is external corrosion,
prestressing wire breaks, joint failure and age of pipe.
3. The most used diameter range of PCCP is between 24 in. and 36 in., which is
about 41% of total PCCP inventory.
4. The total population served by survey respondent water utilities is 13,892,502.
5. About 61% of PCCP inventory is between 25 and 50 year old.
6. Based on 13 survey respondents, the overall failure rate of PCCP are 15 per 100
miles.
53
7. Based on 13 survey respondents, which have at least one failure, the overall
failure rate of North East region is the highest and west region is the lowest.
6.3 Limitations of Research
1. This thesis results are based on 13 survey respondents, for 24 in. and larger, so
data availability was limited to only those survey respondents.
2. Parameters such as soil conditions, depth of installation, internal loads (operating
and surge pressure), external loads (traffic and soil), class of prestressing wire,
temperature changes, bedding conditions and so on can influence failure rate, but
are not considered in this research.
6.4 Recommendations for Future Research
The following is a list of recommendations to expand this study:
1. Develop a database of U.S. water pipe inventory.
2. Involve a larger sample size for the research can improve the quality results.
3. A regional survey of water utilities to compare environmental and operational
factors can be helpful.
4. A compressive of comparison different pipe materials (costs, ease of installation,
carbon footprint, maintenance requirements, and so on) will be an important topic
to investigate.
54
APPENDIX A
ABBREVIATIONS
55
ACI – American Concrete Institute
ANSI - American National Standards Institute
ASCE - American Society of Civil Engineers
AWWA - American Water Works Association
BWP - Bar-wrapped Steel-cylinder Concrete Pipe
CIP - Cast Iron Pipe
CUIRE - Center for Underground Infrastructure Research and Education
DIP - Ductile Iron Pipe
EC-PCCP - Embedded Cylinder Prestressed Concrete Cylinder Pipe
GRP - Glass Reinforced Pipe
HDPE – High Density Polyethylene
LC-PCCP - Lined Cylinder Prestressed Concrete Cylinder Pipe
NRC - National Research Council of Canada
PCCP - Prestressed Concrete Cylinder Pipe
PE - Polyethylene Pipe
PVC – Polyvinyl Chloride
RCC - Reinforced Cement Concrete
UCT- Underground Construction Technology
56
APPENDIX B
LARGE DIAMETER (24 IN. AND LARGER)
WATER PIPE QUESTIONNAIRE
57
THE UNIVERSITY OF TEXAS AT ARLINGTON
Center for Underground Infrastructure Research and Education (CUIRE)
Phone: 817- 272- 0507 Fax: 817- 272- 2630
E-mail: [email protected]
www.cuire.org
LARGE DIAMETER (24 IN. AND LARGER)
WATER PIPE QUESTIONNAIRE
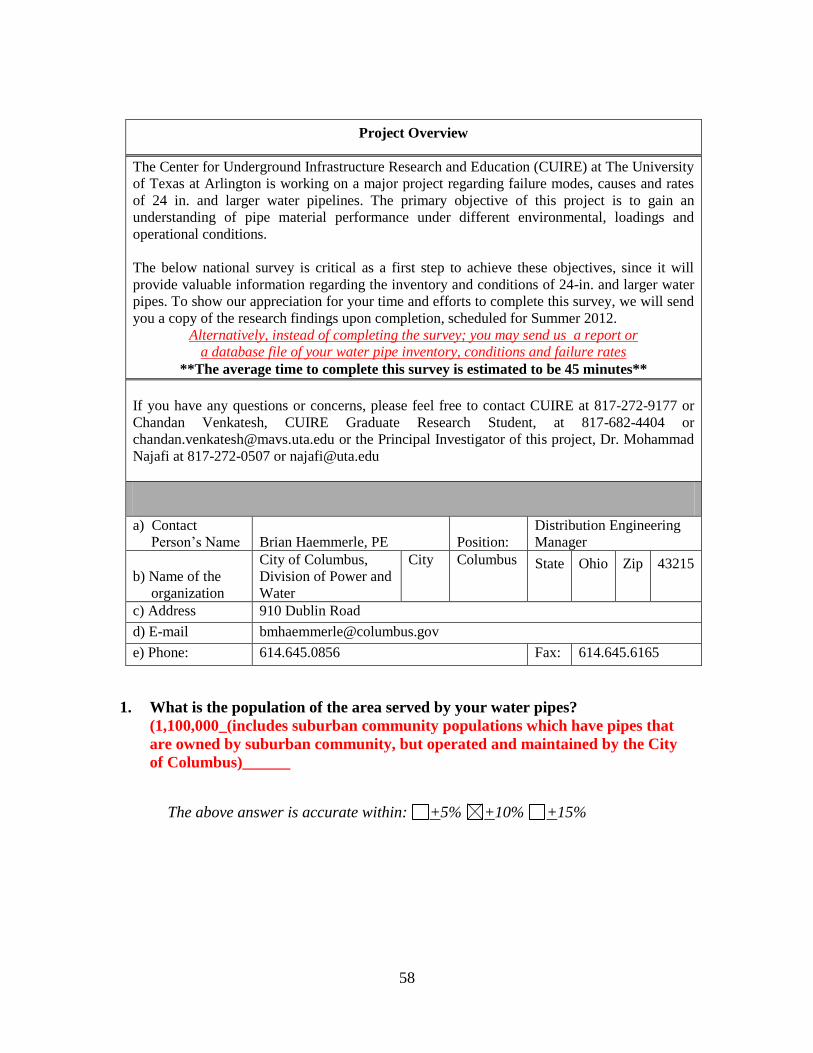
58
Project Overview
The Center for Underground Infrastructure Research and Education (CUIRE) at The University
of Texas at Arlington is working on a major project regarding failure modes, causes and rates
of 24 in. and larger water pipelines. The primary objective of this project is to gain an
understanding of pipe material performance under different environmental, loadings and
operational conditions.
The below national survey is critical as a first step to achieve these objectives, since it will
provide valuable information regarding the inventory and conditions of 24-in. and larger water
pipes. To show our appreciation for your time and efforts to complete this survey, we will send
you a copy of the research findings upon completion, scheduled for Summer 2012.
Alternatively, instead of completing the survey; you may send us a report or
a database file of your water pipe inventory, conditions and failure rates
**The average time to complete this survey is estimated to be 45 minutes**
If you have any questions or concerns, please feel free to contact CUIRE at 817-272-9177 or
Chandan Venkatesh, CUIRE Graduate Research Student, at 817-682-4404 or
[email protected] or the Principal Investigator of this project, Dr. Mohammad
Najafi at 817-272-0507 or [email protected]
a) Contact
Person’s Name
Brian Haemmerle, PE
Position:
Distribution Engineering
Manager
b) Name of the
organization
City of Columbus,
Division of Power and
Water
City Columbus State Ohio Zip 43215
c) Address 910 Dublin Road
d) E-mail [email protected]
e) Phone: 614.645.0856 Fax: 614.645.6165
1. What is the population of the area served by your water pipes?
(1,100,000_(includes suburban community populations which have pipes that
are owned by suburban community, but operated and maintained by the City
of Columbus)______
The above answer is accurate within: +5% +10% +15%

59
2. What is the total length of your water pipelines? ______ft or _3,615_mi.
The above answer is accurate within: +5% +10% +15%
3. Please provide us the footage of the water system. (24 in. and larger).
The below answer is accurate within: +5% +10% +15%
Type of Pipe
% Total Inventory
Less than 25
years old
Between 25
to 50 years
old
Between 50
to 75 years
old
More than
75 years old
PCCP* 0.69 2.43 0.38 0
Steel* 0 0 0 0
PVC* 0 0 0 0
HDPE* 0 0 0 0
DIP* 1.08 0.51 0 0
CIP* 0 0.003 0.08 0.57
Bar-wrapped* 0 0.03 0.26 0
Asbestos Cement* 0 0 0 0
Other (Please Specify):
UNKNOWN 0.01 0.06 0.01 0.03
Type of Pipe
Footage (mile)
24” – 36” 42” – 48” 54” and
larger
PCCP* 81.6 43.7 1.4
Steel* 0 0 0
PVC* 0 0 0
HDPE* 0 0 0
DIP* 52.8 2.5 0
CIP* 23.6 0.1 0
Bar-wrapped* 5.8 4.4 0.4
Asbestos Cement* 0 0 0
Other (Please Specify):
UNKNOWN 4.0 0.2 0
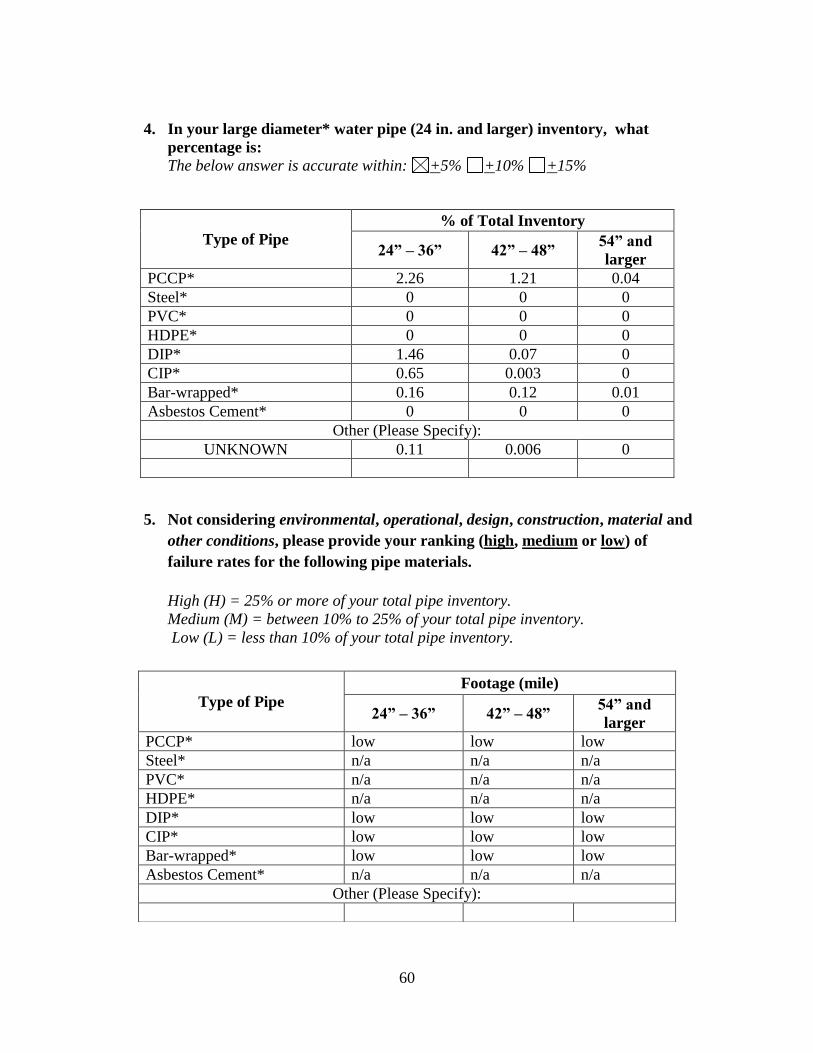
60
4. In your large diameter* water pipe (24 in. and larger) inventory, what
percentage is:
The below answer is accurate within: +5% +10% +15%
5. Not considering environmental, operational, design, construction, material and
other conditions, please provide your ranking (high, medium or low) of
failure rates for the following pipe materials.
High (H) = 25% or more of your total pipe inventory.
Medium (M) = between 10% to 25% of your total pipe inventory.
Low (L) = less than 10% of your total pipe inventory.
Type of Pipe
% of Total Inventory
24” – 36” 42” – 48” 54” and
larger
PCCP* 2.26 1.21 0.04
Steel* 0 0 0
PVC* 0 0 0
HDPE* 0 0 0
DIP* 1.46 0.07 0
CIP* 0.65 0.003 0
Bar-wrapped* 0.16 0.12 0.01
Asbestos Cement* 0 0 0
Other (Please Specify):
UNKNOWN 0.11 0.006 0
Type of Pipe
Footage (mile)
24” – 36” 42” – 48” 54” and
larger
PCCP* low low low
Steel* n/a n/a n/a
PVC* n/a n/a n/a
HDPE* n/a n/a n/a
DIP* low low low
CIP* low low low
Bar-wrapped* low low low
Asbestos Cement* n/a n/a n/a
Other (Please Specify):
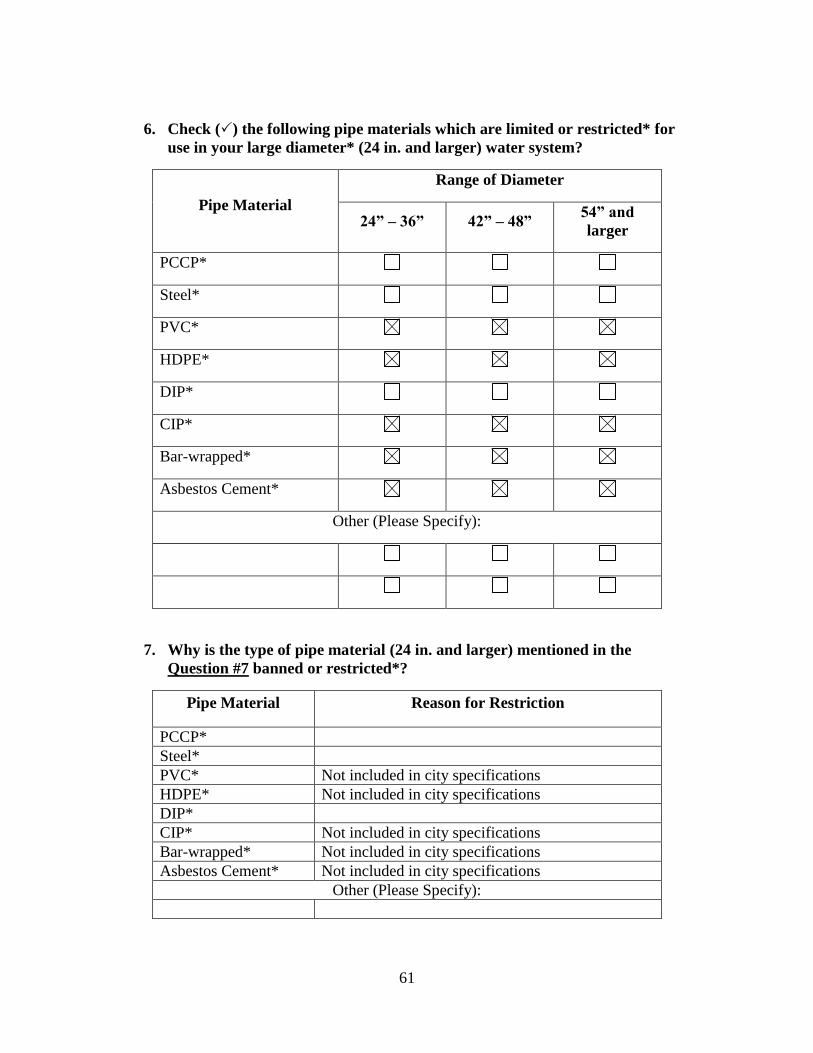
61
6. Check () the following pipe materials which are limited or restricted* for
use in your large diameter* (24 in. and larger) water system?
Pipe Material
Range of Diameter
24” – 36” 42” – 48” 54” and
larger
PCCP*
Steel*
PVC*
HDPE*
DIP*
CIP*
Bar-wrapped*
Asbestos Cement*
Other (Please Specify):
7. Why is the type of pipe material (24 in. and larger) mentioned in the
Question #7 banned or restricted*?
Pipe Material Reason for Restriction
PCCP*
Steel*
PVC*
Not included in city specifications
HDPE*
Not included in city specifications
DIP*
CIP*
Not included in city specifications
Bar-wrapped*
Not included in city specifications
Asbestos Cement*
Not included in city specifications
Other (Please Specify):

62
8. Please provide information for past water pipe failures (24 in. and larger).
Pipe ID* Pipe
Type
Pipe
Diameter
*
Location Date of
Failure
Cathodic
Protectio
n* (Y/N)
Soil
Condition
s*
SEE ATTACHED
SPREADSHEET
Note: The majority of large diameter pipe do not have cathodic protection. Soil
conditions were not documented during those failures and therefore that
information was not available.
9. For the pipe ID’s* mentioned in Question 9, please provide causes of failure,
modes of failure, type of joint, type of coating and type of water for pipe
failure.
Pipe ID* Cause of
Failure
Mode of
Failure
Type of
Joint*
Type of
Coating*
Type of
Water
(treated or
untreated)
SEE ATTACHED
SPREADSHEET
10. In Question #9, is there any causes for pipe failures other than Age of the
Pipe*?
Yes No
If Yes, please proceed to Question #12. If No, please proceed to Question #13.
11. Rank the following causes of failure for each of the pipe materials according
to their frequency of occurrence.
Please rank with #1 being the highest frequency of occurrence
Note: The majority of failure modes were not documented during the repairs, so no
data was readily available for this question.
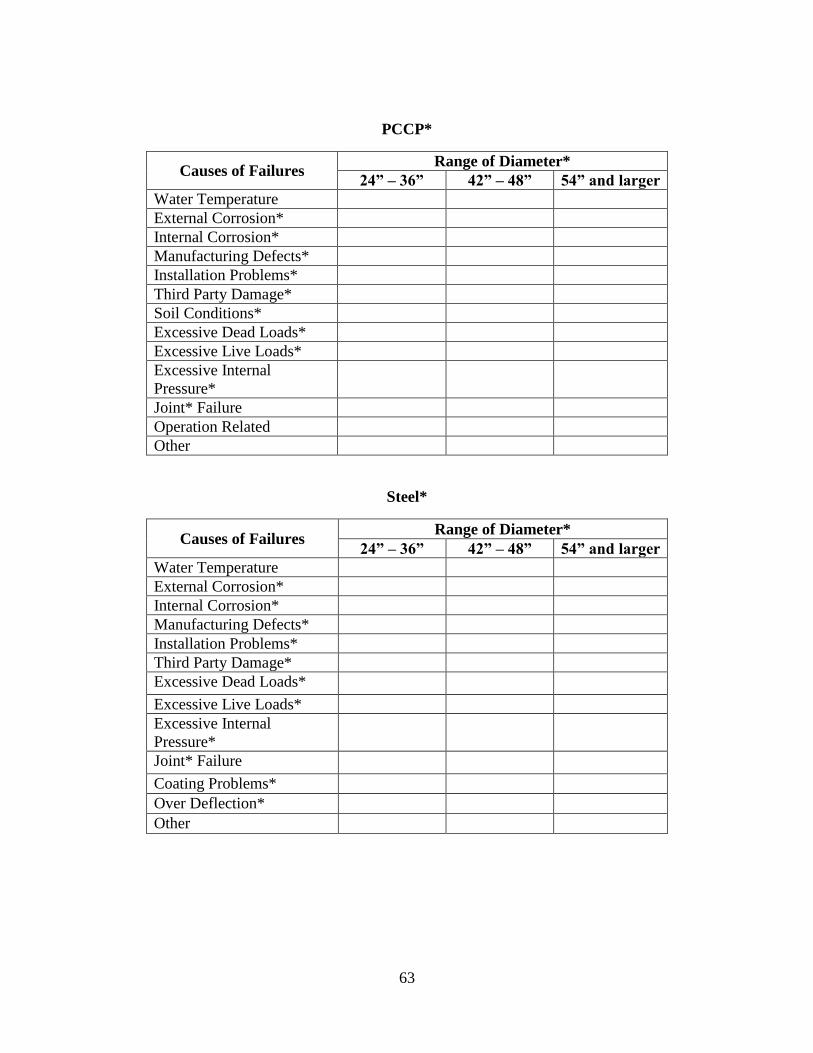
63
PCCP*
Causes of Failures Range of Diameter*
24” – 36” 42” – 48” 54” and larger
Water Temperature
External Corrosion*
Internal Corrosion*
Manufacturing Defects*
Installation Problems*
Third Party Damage*
Soil Conditions*
Excessive Dead Loads*
Excessive Live Loads*
Excessive Internal
Pressure*
Joint* Failure
Operation Related
Other
Steel*
Causes of Failures Range of Diameter*
24” – 36” 42” – 48” 54” and larger
Water Temperature
External Corrosion*
Internal Corrosion*
Manufacturing Defects*
Installation Problems*
Third Party Damage*
Excessive Dead Loads*
Excessive Live Loads*
Excessive Internal
Pressure*
Joint* Failure
Coating Problems*
Over Deflection*
Other
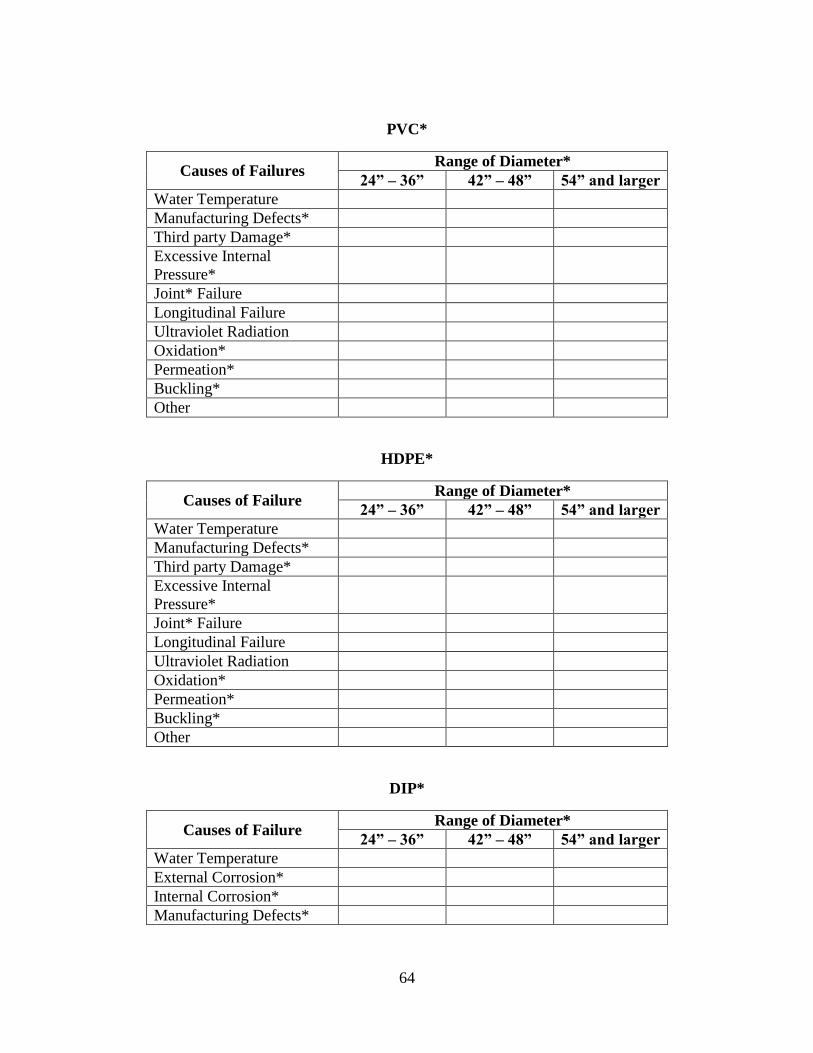
64
PVC*
Causes of Failures Range of Diameter*
24” – 36” 42” – 48” 54” and larger
Water Temperature
Manufacturing Defects*
Third party Damage*
Excessive Internal
Pressure*
Joint* Failure
Longitudinal Failure
Ultraviolet Radiation
Oxidation*
Permeation*
Buckling*
Other
HDPE*
Causes of Failure Range of Diameter*
24” – 36” 42” – 48” 54” and larger
Water Temperature
Manufacturing Defects*
Third party Damage*
Excessive Internal
Pressure*
Joint* Failure
Longitudinal Failure
Ultraviolet Radiation
Oxidation*
Permeation*
Buckling*
Other
DIP*
Causes of Failure Range of Diameter*
24” – 36” 42” – 48” 54” and larger
Water Temperature
External Corrosion*
Internal Corrosion*
Manufacturing Defects*
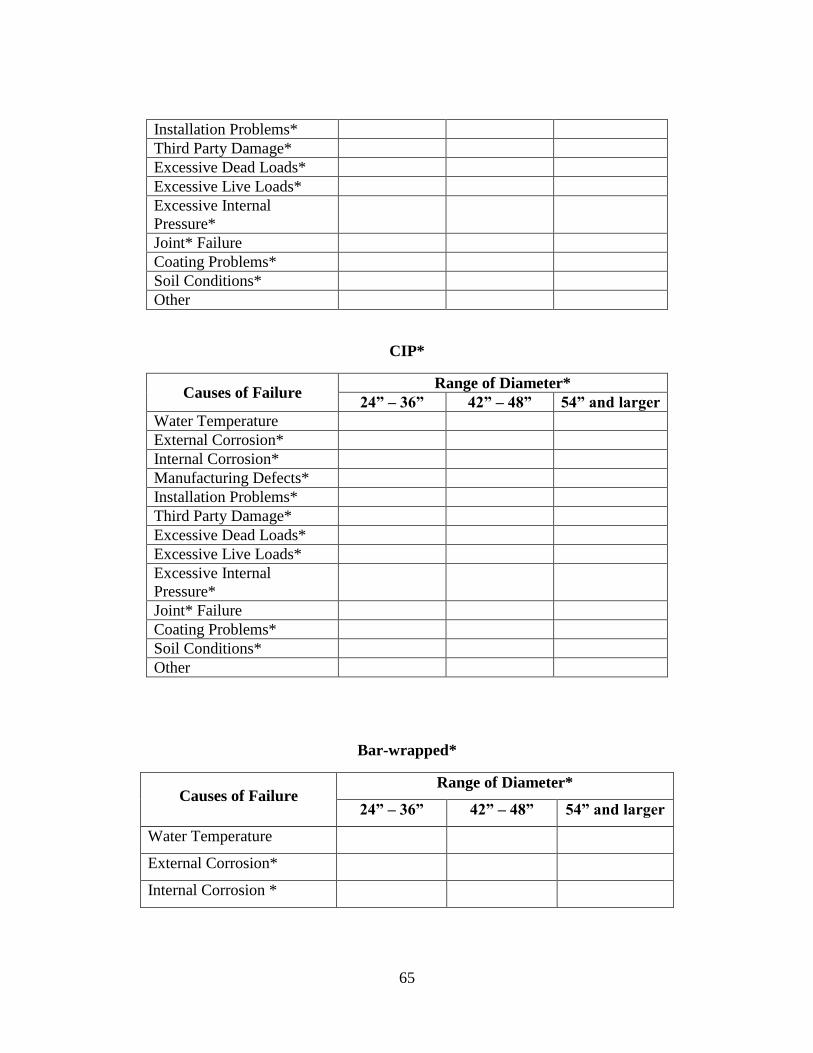
65
Installation Problems*
Third Party Damage*
Excessive Dead Loads*
Excessive Live Loads*
Excessive Internal
Pressure*
Joint* Failure
Coating Problems*
Soil Conditions*
Other
CIP*
Causes of Failure Range of Diameter*
24” – 36” 42” – 48” 54” and larger
Water Temperature
External Corrosion*
Internal Corrosion*
Manufacturing Defects*
Installation Problems*
Third Party Damage*
Excessive Dead Loads*
Excessive Live Loads*
Excessive Internal
Pressure*
Joint* Failure
Coating Problems*
Soil Conditions*
Other
Bar-wrapped*
Causes of Failure Range of Diameter*
24” – 36” 42” – 48” 54” and larger
Water Temperature
External Corrosion*
Internal Corrosion *

66
Manufacturing Defects*
Installation Problems*
Third Party Damage*
Soil Conditions*
Excessive Dead Loads*
Excessive Live Loads*
Excessive Internal
Pressure*
Joint* Failure
Coating Problems*
Other
12. Please provide any comments/suggestions, or feel free to send us any case
study or pipeline failure report.
_______________________________________________________________________
Once again, thank you very much for your time. We will get back with you with the
survey results in Summer 2012.
If you have any questions or concerns, please feel free to contact Rahul Manda, CUIRE
Graduate Research Student, at 817-682-4404 or [email protected] or the
Principal Investigator of this project, Dr. Mohammad Najafi at 817-272-0507 or
Dr. Mohammad Najafi, P.E., F. ASCE
CUIRE Director
Editor-in-Chief, ASCE Journal of Pipeline Systems
Department of Civil Engineering—The University of Texas at Arlington
Arlington, TX 76019-0308
CUIRE Office: 817-272-9177; Fax: 817-272-2630
Email: [email protected], Website:www.cuire.org
Definitions
Age of the Pipe: The number of years the pipe has been installed.
Asbestos Cement Pipe: A concrete pipe made of mixture of Portland cement &
asbestos fiber.
Bar Wrapped: Bar-Wrapped Cylinder Concrete Pipe combines the strength of
steel with the corrosion resistance and durability of concrete. It is comprised of a
welded steel cylinder that serves as a watertight membrane and works together
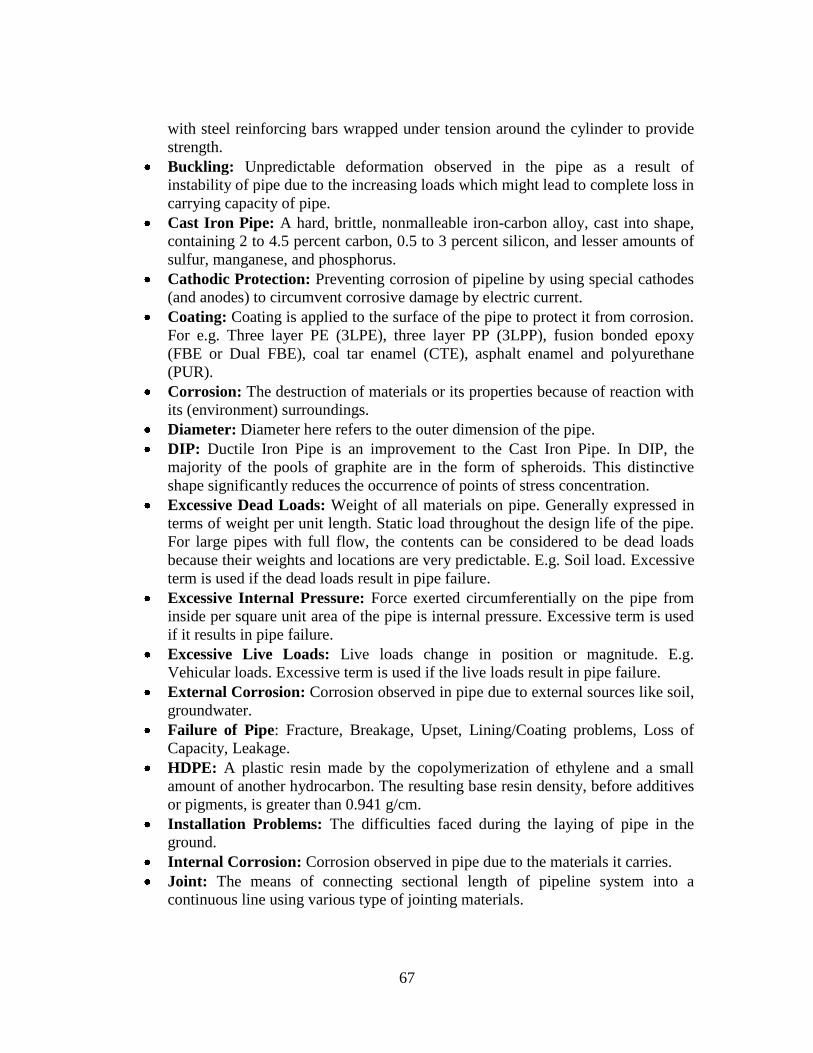
67
with steel reinforcing bars wrapped under tension around the cylinder to provide
strength.
Buckling: Unpredictable deformation observed in the pipe as a result of
instability of pipe due to the increasing loads which might lead to complete loss in
carrying capacity of pipe.
Cast Iron Pipe: A hard, brittle, nonmalleable iron-carbon alloy, cast into shape,
containing 2 to 4.5 percent carbon, 0.5 to 3 percent silicon, and lesser amounts of
sulfur, manganese, and phosphorus.
Cathodic Protection: Preventing corrosion of pipeline by using special cathodes
(and anodes) to circumvent corrosive damage by electric current.
Coating: Coating is applied to the surface of the pipe to protect it from corrosion.
For e.g. Three layer PE (3LPE), three layer PP (3LPP), fusion bonded epoxy
(FBE or Dual FBE), coal tar enamel (CTE), asphalt enamel and polyurethane
(PUR).
Corrosion: The destruction of materials or its properties because of reaction with
its (environment) surroundings.
Diameter: Diameter here refers to the outer dimension of the pipe.
DIP: Ductile Iron Pipe is an improvement to the Cast Iron Pipe. In DIP, the
majority of the pools of graphite are in the form of spheroids. This distinctive
shape significantly reduces the occurrence of points of stress concentration.
Excessive Dead Loads: Weight of all materials on pipe. Generally expressed in
terms of weight per unit length. Static load throughout the design life of the pipe.
For large pipes with full flow, the contents can be considered to be dead loads
because their weights and locations are very predictable. E.g. Soil load. Excessive
term is used if the dead loads result in pipe failure.
Excessive Internal Pressure: Force exerted circumferentially on the pipe from
inside per square unit area of the pipe is internal pressure. Excessive term is used
if it results in pipe failure.
Excessive Live Loads: Live loads change in position or magnitude. E.g.
Vehicular loads. Excessive term is used if the live loads result in pipe failure.
External Corrosion: Corrosion observed in pipe due to external sources like soil,
groundwater.
Failure of Pipe: Fracture, Breakage, Upset, Lining/Coating problems, Loss of
Capacity, Leakage.
HDPE: A plastic resin made by the copolymerization of ethylene and a small
amount of another hydrocarbon. The resulting base resin density, before additives
or pigments, is greater than 0.941 g/cm.
Installation Problems: The difficulties faced during the laying of pipe in the
ground.
Internal Corrosion: Corrosion observed in pipe due to the materials it carries.
Joint: The means of connecting sectional length of pipeline system into a
continuous line using various type of jointing materials.

68
Manufacturing Defects: An error or flaw in a pipe, introduced during the
manufacturing rather than the design phase.
Over Deflection: Deflection is the vertical or horizontal curvature or combination
of both observed in pipe. Over deflection is defined as the deflection at which the
pipe fails.
Oxidation: The erosion damage observed in the pipe due to its surrounding
environment.
PCCP: Pre-stressed Concrete Cylinder Pipe (PCCP) consists of a concrete core, a
thin steel cylinder, high tensile pre-stressing wires and a mortar coating.
Permeation: Permeation of piping materials and non-metallic joints can be
defined as the passage of contaminants external to the pipe, through porous, non-
metallic materials, into the drinking water. The problem of permeation is
generally limited to plastic, non-metallic materials.
Pipe ID: Unique identity of pipe.
Population: The whole number of people or inhabitants in a region or country.
PVC: A polyvinyl chloride (PVC) is made from a plastic and vinyl combination
material. The pipes are durable, hard to damage, and long lasting.
Repair: Fixing a section of pipeline to make the pipeline back in working
condition without increasing the design life.
Replacement: The act of installing a new pipeline in the place of old pipeline or
renewing the pipeline with new design life.
Restricted: The pipe material could not be used due to certain difficulties.
Steel Pipe: Steel pipe is a material made from an alloy of iron and carbon.
Third Party Damage: Damage caused by someone other than pipeline operator
and owner.

69
APPENDIX C
PHOTOGRAPHS OF PRESTRESSED
CONCRETE CYLINDER PIPE
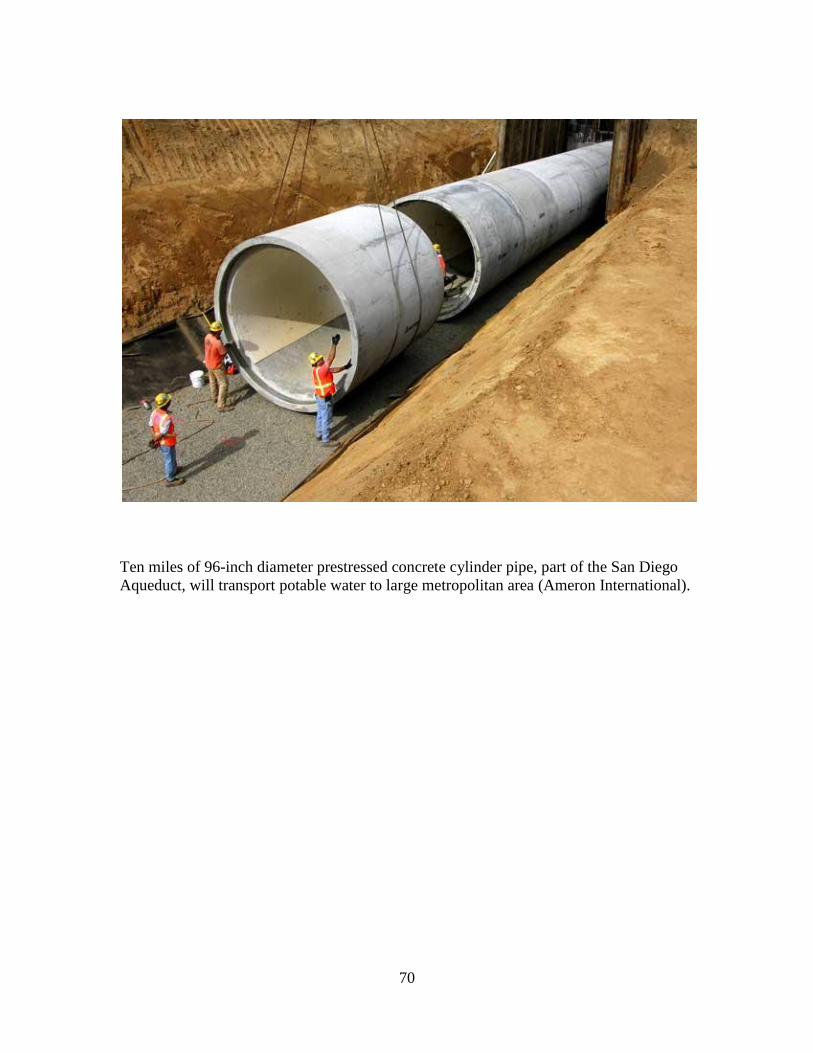
70
Ten miles of 96-inch diameter prestressed concrete cylinder pipe, part of the San Diego
Aqueduct, will transport potable water to large metropolitan area (Ameron International).
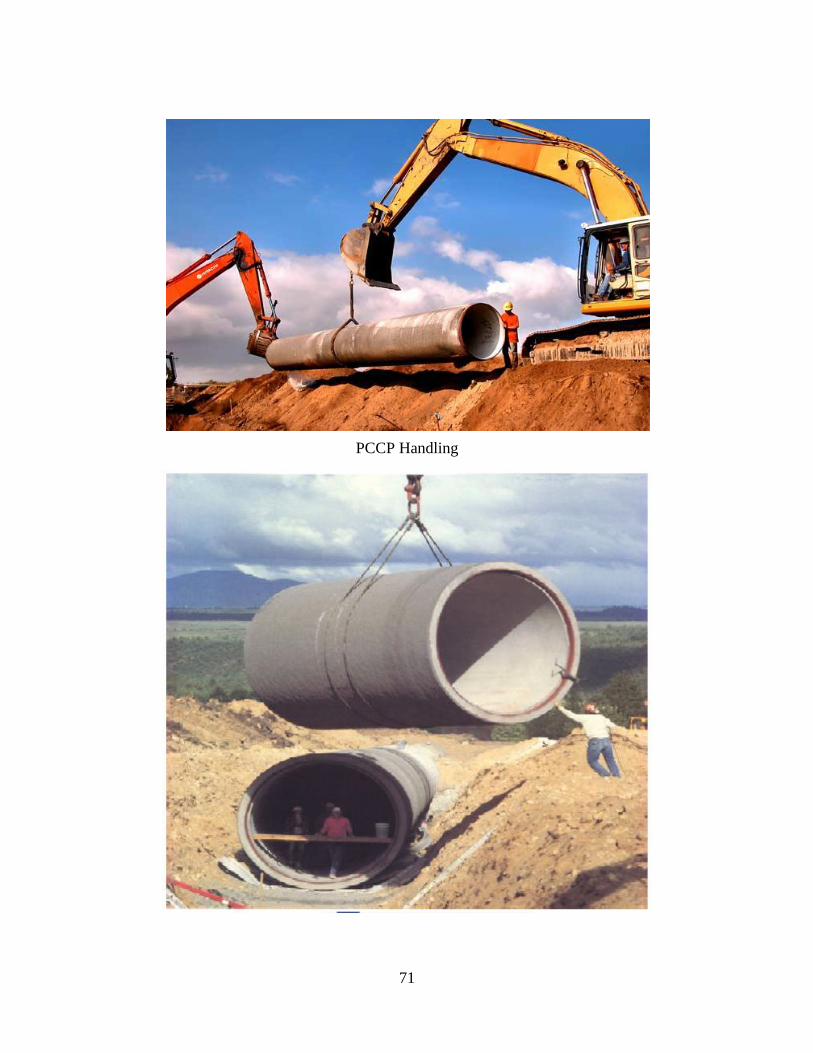
71
PCCP Handling
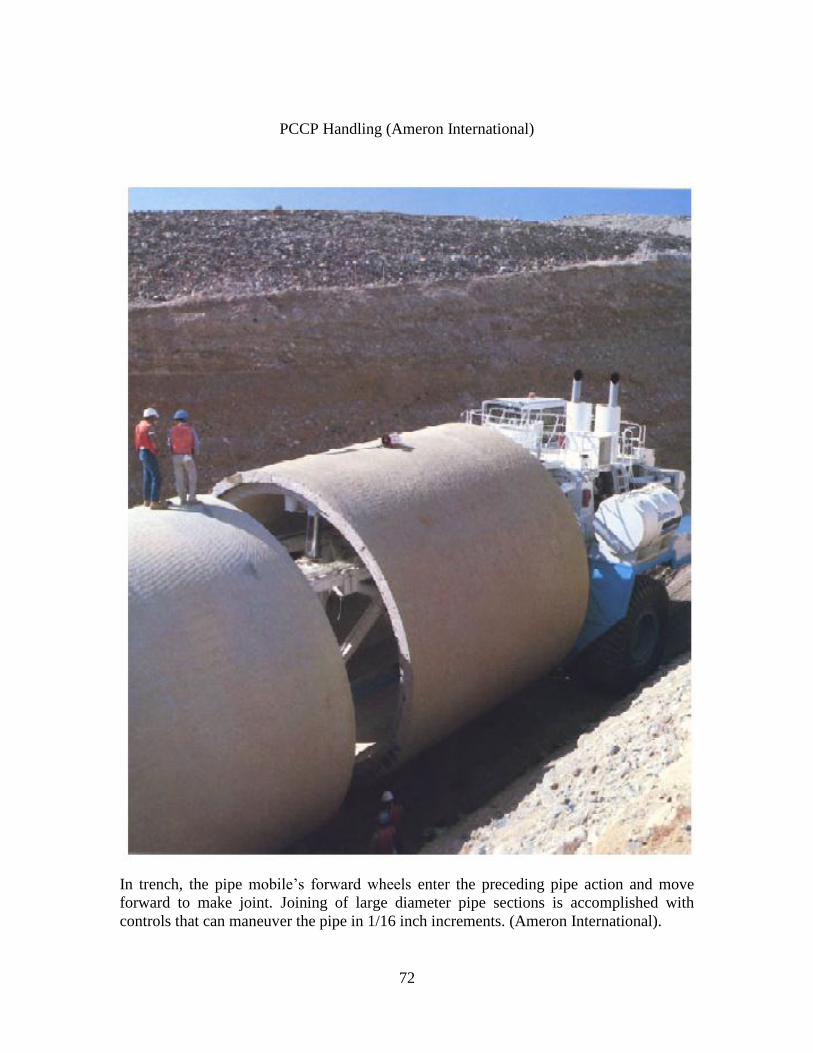
72
PCCP Handling (Ameron International)
In trench, the pipe mobile’s forward wheels enter the preceding pipe action and move
forward to make joint. Joining of large diameter pipe sections is accomplished with
controls that can maneuver the pipe in 1/16 inch increments. (Ameron International).
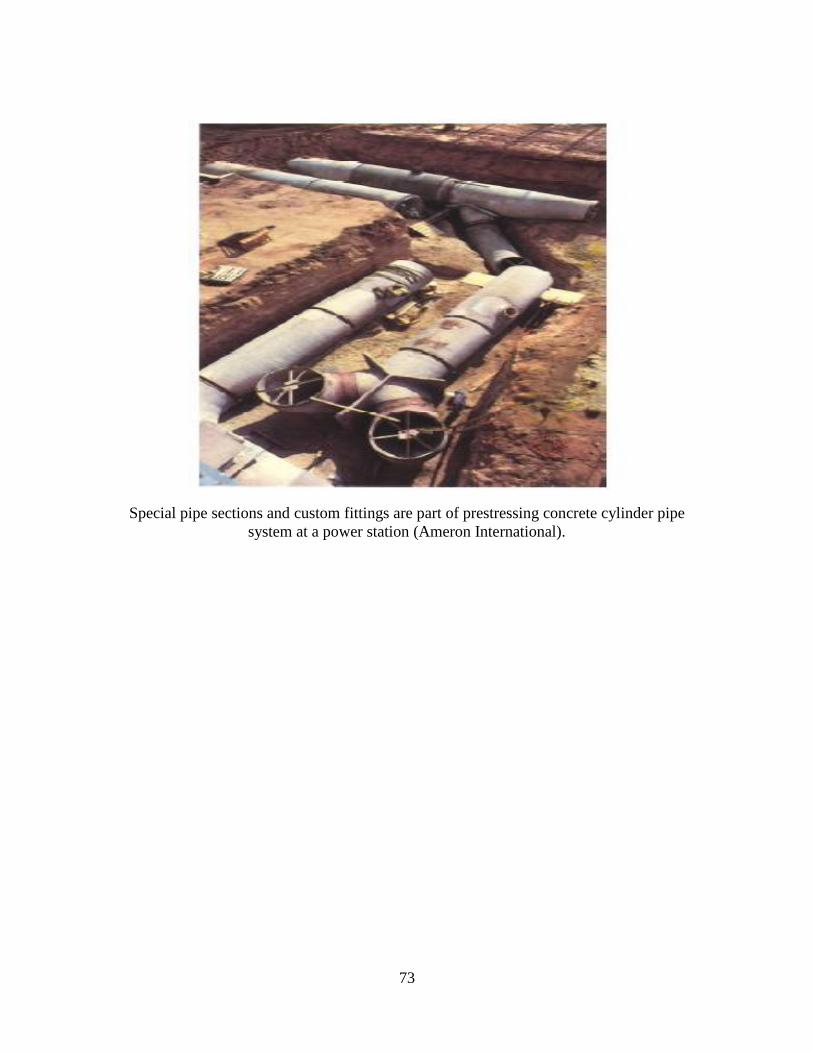
73
Special pipe sections and custom fittings are part of prestressing concrete cylinder pipe
system at a power station (Ameron International).
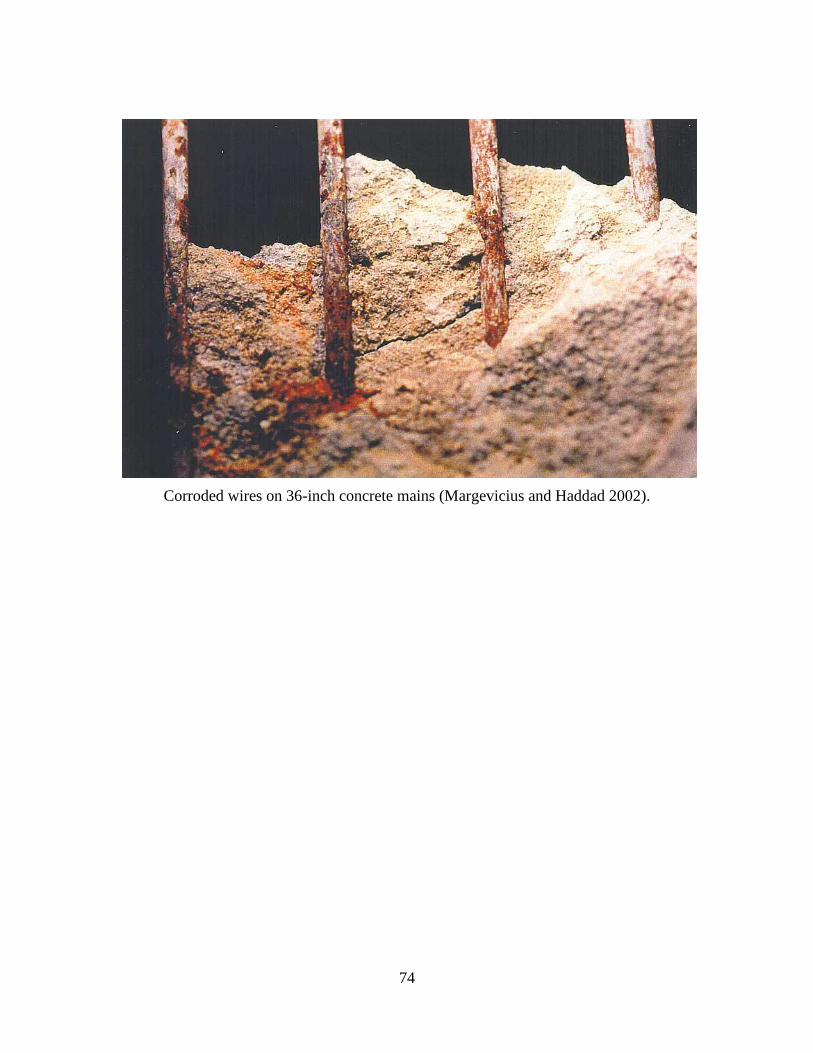
74
Corroded wires on 36-inch concrete mains (Margevicius and Haddad 2002).
75
REFERENCES
Alavinasab, A., Jha, R., Ahmadi, G. (2011). “Damage Identification Based on Modal
Analysis of Prestressed Concrete Pipes,” Pipelines: A Sound Conduit for Sharing
Solutions, 12-23, American Society of Civil Engineers (ASCE), Reston, VA.
American Concrete Pressure Pipe Association (2011). “What is Concrete Pressure Pipe?”
http://acppa.org/what-is-cpp, accessed by September 6, 1986.
American Society of Civil Engineers (2009). “Report Card for America’s Infrastructure,”
Fact Sheet, Water and Environment, Drinking Water, 2009 Grade D-,
http://www.infrastructurereportcard.org/fact-sheet/drinking-water, accessed Nov.
1, 2012.
AWWA (2010). “Buried No Longer: Confronting America’s Water Infrastructure
Challenge’’, report developed by the American Water Works Association under
the direction of its Water Utility Council, through Stratus Consulting in Boulder,
CO.http://www.awwa.org/files/GovtPublicAffairs/GADocuments/BuriedNoLong
erCompleteFinal.pdf
AWWA C301-07 (2007), “Prestressed Concrete Cylinder Pipe, Steel Cylinder Pipe.”
American Water Works Association, Denver, CO.
76
AWWA (2007). “ Distribution System Inventory, Integrity and Water Quality.” Total
Coliform Rule Issue Paper prepared for the EPA Office of Water and Office of
Ground Water and Drinking Water Standards and Risk Management Division,
Washington DC., 24.
http://www.epa.gov/ogwdw/disinfection/tcr/pdfs/issuepaper_tcr_ds-inventory.pdf,
accessed September 4, 2012.
Arnaout, S. A. (2012). Pressure Pipe: Condition Assessment, Rehabilitation and Asset
Management. Hanson Pressure Pipe, Irving, TX.
ASTM D75, Standard Practice for Sampling Aggregates, West Conshohocken, PA.
AWWA, R.F. (1995). Performance of Prestressed Concrete pipe. American Water
Works Association, Denver, CO.
Bell, G. E. C., and Paulson, P. (2010). “Measurement and Analysis of PCCP Wire
Breaks, Slipsand Delaminations.” Pipelines 2010, 1016-1024, American Society
of Civil Engineers (ASCE), Reston, VA.
Bardet, J. P., Bellantyne, D., Bell, G. E. C., Donnellan, A., Foster, S., Fu, T. S., List, J.,
Little, R. G., Rourke, T. D. O., Palmer, M. C. (2010). “Expert Review of Water
Systems Pipeline Breaks in the City of Los Angeles During Summer 2009.” USC
Center on Megacities, Los Angeles, CA.
Folkman, S. (2012). “Water Main Breaks Rates in the U.S. and Canada: A
Comprehensive Study.” Utah State University Buried Structures Laboratory,
Logan, UT.
77
Holley, M., Rittenhouse, S. (2008). “Corrosion of Prestressing Wire in Prestressed
Concrete Cylinder Pipe.”
http://www.puretechltd.com/pdf/technical_papers/1999/PTL_Technical_Paper_
20080212160209.pdf, Accessed by August 16, 2012.
Higgins, M. S. (2010). “Large-Diameter Mains Estimate and Extended Service Life.”
American Water Works Association, Denver, CO.
Kola, R., and Sinha, S. K. (2010). “Predictability and Preventability indices for PCCP
Water Mains.” Pipelines 2010, 1016-1024, American Society of Civil Engineers
(ASCE), Reston, VA.
Marshall, J., and Fisk, P. S. (2010). “Prestressed Concrete Cylinder Pipe Decay.”
American Society of Civil Engineers (ASCE), Reston, VA.
Margevicius, A., and Haddad, P. (2002). “Catastrophic Failures of Cleveland’s Large
Diameter Water Mains.” Pipelines 2002, 1-48, American Society of Civil
Engineers (ASCE), Reston, VA.
Najafi, M. and Gokhale, S. (2005). Trenchless Technology: Pipeline and Utility Design,
Construction and Renewal. McGraw-Hill, New York.
Nayyar, M. L. (2000). “Piping Handbook,” Seventh Edition, McGraw-Hill, New York.
Ojdrovic, R. P., Nardini, P. D., Zarghamee, M. S. (2011). “Verification of PCCP Failure
Margin and Risk Curves.” A Sound Conduit for Sharing Solutions, Pipelines
2011, 1413-1423, American Society of Civil Engineers (ASCE), Reston, VA.
78
Piratla, K. R. and Ariaratnam, S. T. (2011). “Critical Analysis of Water Distribution
Pipelines.” Journal of Pipeline Systems Engineering and Practice, 2(3), 91-101,
American Society of Civil Engineers (ASCE), Reston, VA.
Romer, A. E., Bell, G. E. C., Ellison, R. D. (2007). “Failure of Prestressed Concrete
Cylinder Pipe.” Pipelines: Advance and Experiences with Trenchless pipeline
Projects, 1-17, American Society of Civil Engineers (ASCE), Reston, VA.
Romer, A. E., Ellison, D., Bell, G. E. C., Clark, B. (2008). “Failure of Prestressed
Concrete Cylinder Pipe.” American Water Work Association, Denver, CO and
Environmental Protection Agency, Washington D.C.
Romer, A. E., and Bell, G. E. C. (2001). “Causes of External Corrosion on Buried Water
Mains.” Pipeline, 1-9 American Society of Civil Engineers (ASCE), Reston, VA.
Rostum, J. (2000). “Statistical Modeling of Pipe Failures in Water Works,” thesis,
presented to Norwegian University of Science and Technology, at Norwegian, in
partial fulfillment of the requirements for the degree of Doctor of Engineer.
Siddique, Z. Q., Hossain, M., Parcells, W. H. (2007). “Effect of Curing on Roughness
Development of Concrete Pavements.” Journal of Materials in Civil Enginerring,
19(7), 575-582, American Society of Civil Engineers (ASCE), Reston, VA.
Zarghamee, M. S., Eggers, D. W., Ojdrovic, R. P., Valentine, D. P. (2004). “Discussion
of Thrust Restraint Design of Concrete Pressure Pipe.” Journal of Structural
Engineering, 130 (1), 95-107, American Society of Civil Engineers (ASCE),
Reston, VA.
79
Zarghamee, M. S., and Ojdrovic, R. P. (2001). “Risk Assessment and Repair Priority of
PCCP with Broken Wires.” Pipeline, 1-8, American Society of Civil Engineers
(ASCE), Reston, VA.
Zarghamee, M. S., Ojdrovic, R. P., Nardini, P. D. (2011). ”Best Practices Manual for
Prestressed Concrete Pipe Condition Assessment: What Works? What Doesn’t?
What’s Next?” Water Research Foundation, 1-5, Denver, CO.
Zarghamme, M. S., Fok, S. K., Sikiotis, E. S. (1990). “Limit States Design of Prestressed
Concrete Cylinder Pipe, Part II: Procedure,” Journal of Structural Engineering,
116:8:2105-2126, American Society of Civil Engineers (ASCE), Reston, VA.
.
80
BIOGRAPHICAL INFORMATION
Rahul Manda was born in Bikaner, India, on September 6, 1986, the son of Ram
Gopal Manda and Laxmi Manda. He graduated in 2010 from University of Pune with a
bachelor’s degree in civil engineering. He has held several positions in different student
organizations at the University of Texas at Arlington including vice president of the
Texas Society of Professional Engineers (TSPE) Student Chapter. He also received a
graduate student civil engineering scholarship for academic year 2011-12 awarded by the
University of Texas at Arlington and a CUIRE scholarship for the Spring 2012 semester
awarded by the Center for Underground Infrastructure Research and Education (CUIRE).