performance of r.c. beams with different openings ... extensive experimental program was performed...
TRANSCRIPT

International Journal Of Advancement In Engineering Technology, Management and
Applied Science (IJAETMAS)
ISSN: 2349-3224 || www.ijaetmas.com || Volume 05 - Issue 02 || February-2018 || PP. 01-26
www.ijaetmas.com Page 1
Performance of R.C. Beams with Different Openings
Schemes and Strengthening Methods
Alaa M. Morsy1, Amr M. Barima
2
1Ass.Prof. College of Engineering & Technology, Arab Academy for Science, Technology and Maritime Transport, +(20 3) 5622366
2 B.Sc. MSc student. College of Engineering & Technology, Arab Academy-y for Science, Technology and Maritime Transport,
Abstract
An extensive experimental program was performed to investigate the behavior of R.C.
beams with opening either strengthened orun- strengthened. A total of 24 specimens
were tested on two series to study the effect of openings on the behavior of RC beams
according to the opening shape, aspect ratio and orientation having same area of the
opening in shear and flexural zones, also study the effect of the different
strengthening methods for the openings on the behavior of RC beams either using
internal strengthening such as internal steel reinforcement, internally embedded fiber
reinforced bars, and near surface mounted using FRP laminate or using external
strengthening such as externally bonded FRP laminates and steel box. All specimens
tested under three points loading, the effective span of beams was 1500 mm, also all
specimens designed to govern failure in flexure before shear. Based on the
experimental evidence, in the 1st series circular openings showed the least reduction in
the beam’s load capacity when compared to rectangular and square openings
regarding all the openings shapes have the same area.The 2nd
series showed the effect
of strengthening the openings on the behavior of beams, the use of CFRP externally
bonded improves both beam’s strength and ductility but to different extents than any
different method of strengthening.
Keywords:Opening, Shear, Flexural, Strengthening, FRP, NSM, ductility.
1. Introduction
Reinforced concrete structures sometimes face modification during their service life,
making web openings in reinforced concrete R.C. beams is frequently required to
accommodate essential services such as air conditioning conduits, water supply,
electricity, and heating ducts.The transverse openings in beams are a source of
potential weakness. The creation of such openings in existing RC beams produces
discontinuity in the normal flow of stresses which would reduce the beam shear
capacity and stiffness and leading to early cracking of concrete1.
Many researchers study the effect of drilling an opening through the beam web and
the deterioration found in the shear capacity which depend on the position of the
opening either passes through the path between the load and support which increase
the reduction of the beam load capacity or in other position2-5
.

International Journal Of Advancement In Engineering Technology, Management and
Applied Science (IJAETMAS)
ISSN: 2349-3224 || www.ijaetmas.com || Volume 05 - Issue 02 || February-2018 || PP. 01-26
www.ijaetmas.com Page 2
Similarly the effect of drilling open at the flexural zone in the entire span or an
opening in each half-span continuous rectangular RC beams with a large rectangular
opening indicated that the collapse load decreases and the deformations increase as
the opening is located at a higher moment region of the beam. The cracking and
collapse loads decreased and the vierendeel action became more pronounced with
increasing opening dimensions. Also they have developed a method for calculating
the deflections of RC beams with a large rectangular opening by assuming that a
contraflexure point forms at mid-length of each chord in vierendeel mechanism.This
method considers a beam with opening as a non- prismatic one,where sections with
opening have reduced shear and flexural rigidities5-9
.
In order to prevent this reduction of shear and flexural capacity special reinforcement
enclosing the opening should be provided in the form of external or internal
reinforcement. Internal reinforcements are steel bars provided along the opening with
the main reinforcementprior casting, or by embedding internally reinforcing bars
inside the structure which known by internally embedded reinforcement (I.E.R.) 10
The effectiveness of externally bonded CFRP composite system to increase the shear
capacity of solid RC beams (i.e., without web openings) has been reported in the
literature by many researchers 11-14
. FRP composite materials are an excellent option
for external reinforcement because of their superior properties as high specific
stiffness and specific strength, ease of installation, possibility of application without
disturbing the existing functionality of the structure, non-corrosive and nonmagnetic
nature of the materials along with its resistance to chemicals.It has been widely shown
that to increase the shear capacity and ductility of RC beams with web openings, it is
necessary to increase the amount of the internal web reinforcement around the
openings. External reinforcements are applied externally around opening in the form
of jacketing of steel plates or composite materials like glass fiber or carbon fiber
reinforced polymer called GFRP or CFRP.FRP composite materials can be used in
strengthening by either externally bonding the laminates or the sheets with an
adhesive material, or by internally by making groves near the surface which is known
by near surface mounted technique15-21
.
2. Research Scope and Objective
The comprehensive experimental investigation was divided into two main parts; first
part was undertaken to study the behavior of R.C. beams with openings with different
shapes, aspect ratio and orientation in different locations for flexural and shear zone
failure, the main objective of this part is two examine the effect of those parameters
on the load capacity, crack pattern and deflection of those beams and the optimum
shape, size and orientation in the case of making opening in the beam in flexural or
shear zone.
In addition the second part of this investigation to study the different techniques of
strengthening were used to strengthen the square openings in flexure and shear zones
using two main techniques; first method was internally before casting concrete like
adding extra steel reinforcement around the opening or after casting like internally
embedded reinforcement (I.E.R.) either using steel or FRP, near surface mounted

International Journal Of Advancement In Engineering Technology, Management and
Applied Science (IJAETMAS)
ISSN: 2349-3224 || www.ijaetmas.com || Volume 05 - Issue 02 || February-2018 || PP. 01-26
www.ijaetmas.com Page 3
(N.S.M.), and FRP laminate, second method was externally using external bonding
FRP sheets.Finally, the research could recommend which method of strengthening is
optimum in case of flexural and shear.
3. Experimental Program
3.1 Materials and Concrete Mix Proportions
The concrete used in these tests had a strength of 40 MPa based on testing 100 mm
cubes, the beams were cured for 28 days. The steel bars used for the flexure
reinforcement had nominal yield strength of 360 MPa, modulus of elasticity 200 MPa
and tensile strength 520 MPa while the bars used for Stirrups had nominal yield
strength of 240 MPa. The materials used during strengthening process, Sika Carbodur
rods with diameter 12 mm used for internally imbedded reinforcement method for
strengthening, the rods tensile strength is 2800 MPa, modulus of elasticity 155 GPa
and ultimate strain 1.8%. WhileCFRPlaminates with thickness 1.2 mm, Elasticity
modules 165 GPa, and 2800 MPa tensile strength were used as near surface mounted
technique with Sikadur -30LP epoxy adhesive was used as bonding agent.
3.2 Description of beams
The specimens were divided into two groups with total of 24 half scale beams, of total
length 1700 mm and effective span 1500 mm, the cross section area width 120 mm
and height 300 mm ; the first series study effect of openings in beams in different
zones. In the first series the opening shape, and orientation was the main parameter,
square, rectangular and circular openings were studied. The area of the openings was
the constant in all the shapes-of about 144mm2, the square opening was 120 X 120
mm, the rectangular openings were 98 X 147 mm with aspect ratio 1.5 and 85 X 170
mm with aspect ratio 2.0while the circular opening had 135 mm diameter. The
rectangular openings with aspect ratio 2.0 studied the orientation of the opening
whether the opening was horizontal or vertical, as well as the square “rhombus”.
The second series which study the effect of strengthening,all openings were square
shape with different techniques in different failure zones, Fig. (1) shows the drilling
of hole along the beam height around the opening vertically for embedding the FRP
reinforcement, while Fig. (2) shows the groove which has been cut for embedding the
FRP laminate above and below the opening.
Fig. ( 1 ) Drilling I.E. R technique Fig. (2)Embedding N.S.M technique
International Journal Of Advancement In Engineering Technology, Management and
Applied Science (IJAETMAS)
ISSN: 2349-3224 || www.ijaetmas.com || Volume 05 - Issue 02 || February-2018 || PP. 01-26
www.ijaetmas.com Page 4
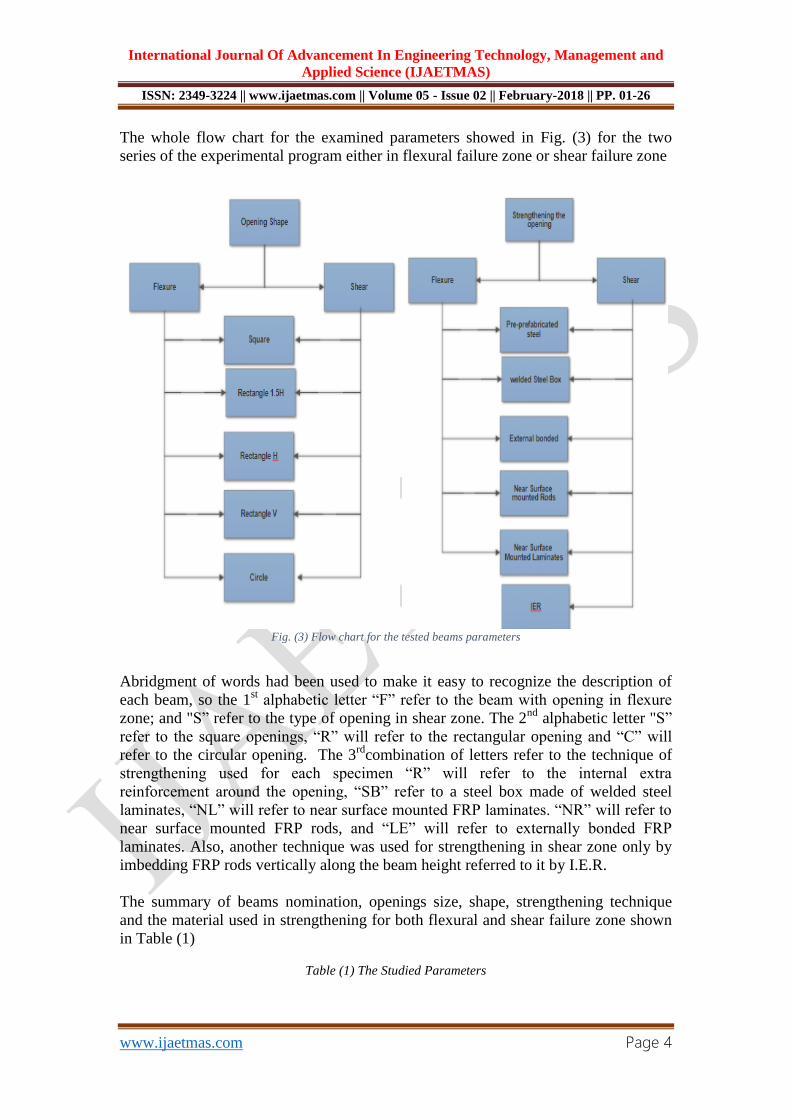
The whole flow chart for the examined parameters showed in Fig. (3) for the two
series of the experimental program either in flexural failure zone or shear failure zone
Fig. (3) Flow chart for the tested beams parameters
Abridgment of words had been used to make it easy to recognize the description of
each beam, so the 1st alphabetic letter “F” refer to the beam with opening in flexure
zone; and "S” refer to the type of opening in shear zone. The 2nd
alphabetic letter "S”
refer to the square openings, “R” will refer to the rectangular opening and “C” will
refer to the circular opening. The 3rd
combination of letters refer to the technique of
strengthening used for each specimen “R” will refer to the internal extra
reinforcement around the opening, “SB” refer to a steel box made of welded steel
laminates, “NL” will refer to near surface mounted FRP laminates. “NR” will refer to
near surface mounted FRP rods, and “LE” will refer to externally bonded FRP
laminates. Also, another technique was used for strengthening in shear zone only by
imbedding FRP rods vertically along the beam height referred to it by I.E.R.
The summary of beams nomination, openings size, shape, strengthening technique
and the material used in strengthening for both flexural and shear failure zone shown
in Table (1)
Table (1) The Studied Parameters

International Journal Of Advancement In Engineering Technology, Management and
Applied Science (IJAETMAS)
ISSN: 2349-3224 || www.ijaetmas.com || Volume 05 - Issue 02 || February-2018 || PP. 01-26
www.ijaetmas.com Page 5
No. Col Code
Opening
Size (mm)
Strengthing
Tecnique
Strengthing
Material
Dimmensions of
Strengthing
Material (mm)
1 U
n-
stre
ng
hn
ed
Control None None None None
2 F-S 120 X 120 None None None
3 F-R-
1.5H 98X147 None None None
4 F-R-2V 85X170 None None None
5 F-R-2H 85X170 None None None
6 F-S-45º
120X120 None None None
7 F-C R67.5 None None None
8 S-S 120 X 120 None None None
9 S-R-
1.5H 98X147 None None None
10 S-R-2V 85X170 None None None
11 S-R-2H 85X170 None None None
12 S-S-45º 120X120 None None None
13 S-C R67.5 None None None
14
Str
eng
then
ed
F-R 120 X 120 Internal Steel Rods
during casting Steel rods 12 mm bars
15 F-L-N 120 X 120 Near Surface
Mounted Lamintes CFRP Lamintes 24 mm width
16 F-L-E 120 X 120 Exteral Lamintes CFRP Lamintes 48 mm width
17 F-L-Steel 120 X 120 Steel Box inside the
opening Steel Lamintes 8 mm Lamintes
18 F-R-N 120 X 120 Near Surface
Mounted Rods CFRP Rods 12 mm bars
19 S-R 120 X 120 Internal Steel Rods
during casting Steel Rods 12 mm bars
20 S-LSteel 120 X 120 Steel Box inside the
opening Steel Lamintes 8 mm Lamintes
21 S-L-N 120 X 120 Near Surface
Mounted Lamintes CFRP Lamintes 24 mm width
22 S-R-N 120 X 120 Near Surface
Mounted Rods CFRP Rods 12 mm bars
23 S-R-IER 120 X 120 Internally embedded
reinforcement CFRP Rods 12 mm bars
24 S-LE 120 X 120 External Lamintes CFRP Lamintes 48 mm width

International Journal Of Advancement In Engineering Technology, Management and
Applied Science (IJAETMAS)
ISSN: 2349-3224 || www.ijaetmas.com || Volume 05 - Issue 02 || February-2018 || PP. 01-26
www.ijaetmas.com Page 6
3.3 Test Setup and preparations
Before casting the specimens, strain gauges were installed to measure the strain in
both longitudinal bars and stirrups. The strain gauges were applied at the mid span of
the beam on the longitudinal reinforcement and in the shear zone on the stirrups. Also,
another strain gauge was applied to the FRP laminate or rods in the strengthened
beams. A total of 24 beams were tested under 3 points loading. A deflection control
mode was performed throughout the experimental program. The spacing between
stirrups was 75 mm with 8 mm diameter and the lower and upper reinforcement as 2
bars of 12 mm diameter this configuration governs the failure to occur in flexural
zone. Fig. (4) shows the beam test setup and the steel reinforcement configuration.
Fig. (4) The beam test setup and the steel reinforcement configuration
4. Test Results and Analysis
4.1 Crack pattern & Mode of failure
Most of the failure modes of all beams divided mainly into two failure modes,1st
failure mode represents the un-strengthened beams failure where the opening was
made in the web of the beam and no strengthening was implemented, the failure mode
of the beam changed to brittle shear failure as shown in Fig. 5 and Fig. 6. In these
beams, large diagonal cracks formed near the corner of the opening and extended to
the point of the applied load and to the support, bringing about an abrupt failure. The
beam with square opening tended to have a lower capacity than that with circular
opening even though the failure mechanism was the same as shown in Figs 6 and 8
for flexure zone and Figs 9 and 10 for shear zone. This behavior is due to the
formation of early diagonal cracks around the corner of the opening due to the stress
concentration.
The 2nd
failure moderepresent the strengthened beams, beamsF-L-N and S-L-N which
strengthened in flexural and shear using FRP laminate as near surface mounted, crack
pattern was similar to the control beam, however in beam S-L-N more diagonal cracks
appeared in the un-strengthened zone. Beams -L-E and S-L-E experienced a failure
due to the de-bonding of laminates from the concrete cover leading to a brittle failure.
This presence of FRP laminates tend to interrupt the natural path of crack
propagation, thus once the bond between the FRP and concrete fails it cause a sudden
change in the flow of the energy and the crack path to the weak zone leading to a
sudden and brittle failure. Here below detailed explanation of the failure mode and
crack pattern of all tested beams

International Journal Of Advancement In Engineering Technology, Management and
Applied Science (IJAETMAS)
ISSN: 2349-3224 || www.ijaetmas.com || Volume 05 - Issue 02 || February-2018 || PP. 01-26
www.ijaetmas.com Page 7
Control Beam
The first crack was observed at load of 3.0ton in the flexure zone. No sign of action
was observed in the shear zone till load of 7.0tonaccording to the steel configuration
designed prior to casting to govern the failure in flexural zone. (i.e., the flexural
capacity was designed to exceed the shear capacity of the tested beams. At load of
9.0ton a crack was noticed in the compression zone, the failure happened at a load of
11.0ton in flexure zone followed by failure in compression. As shown in Fig. 5.
Fig. (5) Control beam
The two main failure modes for strengthened and un-strengthened beams have been
explained in the following session either for flexural orshear zone failure
Failure mode 1 (A) flexural zonefailure“un- strengthened beams with opening”
Beam F-S
Beam F-S is a control beam with asquare opening in the flexure zone with no
strengthening, the first crack was in flexure zone at load of 3.0tonat the bottom of the
opening, the cracks kept spreading and forming new cracks till the load of 9.0ton, at
load of 9.2 ton a severe complete failure in the concrete cover accompanied with
crushing of compression zone and this failure may be called flexural compression
failure followed by spalling of side part of concrete cover, showing a 16% reduction
in the load capacity compared with the control beamas shown in Fig. 6.
Fig. (6) Crack pattern for beam F-S
Beam F-R-2V
Beam F-R-2V is a control beam with avertical rectangular opening with aspect ratio 2
in the flexure zone with no strengthening. The cracks were observed at load 4.0 ton,
new cracks were observed in the compression zone at load 7.0ton, the failure
happened in the compression zone followed by failure in flexure zone at load 9.0ton
International Journal Of Advancement In Engineering Technology, Management and
Applied Science (IJAETMAS)
ISSN: 2349-3224 || www.ijaetmas.com || Volume 05 - Issue 02 || February-2018 || PP. 01-26
www.ijaetmas.com Page 8
showing a 16% reduction in the load capacity compared with the control beam, as
shown in Fig. 7.
Fig. (7) Crack pattern for beam F-R-2V
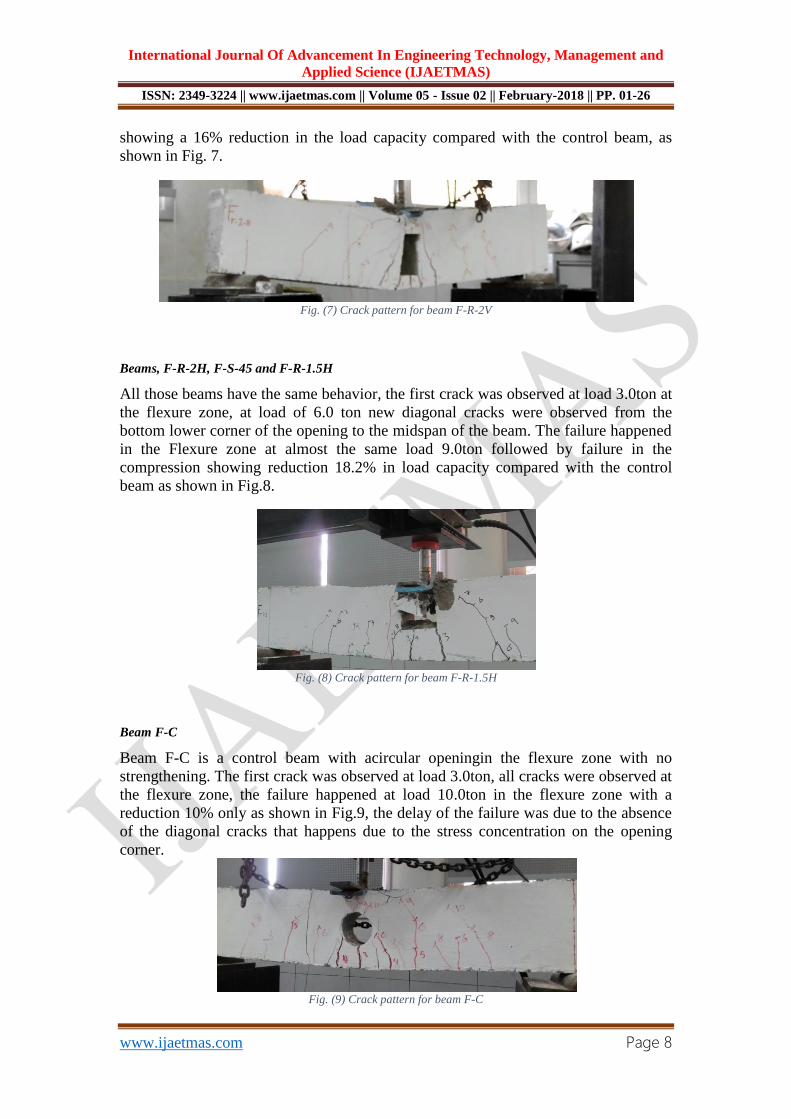
Beams, F-R-2H, F-S-45 and F-R-1.5H
All those beams have the same behavior, the first crack was observed at load 3.0ton at
the flexure zone, at load of 6.0 ton new diagonal cracks were observed from the
bottom lower corner of the opening to the midspan of the beam. The failure happened
in the Flexure zone at almost the same load 9.0ton followed by failure in the
compression showing reduction 18.2% in load capacity compared with the control
beam as shown in Fig.8.
Beam F-C
Beam F-C is a control beam with acircular openingin the flexure zone with no
strengthening. The first crack was observed at load 3.0ton, all cracks were observed at
the flexure zone, the failure happened at load 10.0ton in the flexure zone with a
reduction 10% only as shown in Fig.9, the delay of the failure was due to the absence
of the diagonal cracks that happens due to the stress concentration on the opening
corner.
Fig. (9) Crack pattern for beam F-C
Fig. (8) Crack pattern for beam F-R-1.5H
International Journal Of Advancement In Engineering Technology, Management and
Applied Science (IJAETMAS)
ISSN: 2349-3224 || www.ijaetmas.com || Volume 05 - Issue 02 || February-2018 || PP. 01-26
www.ijaetmas.com Page 9
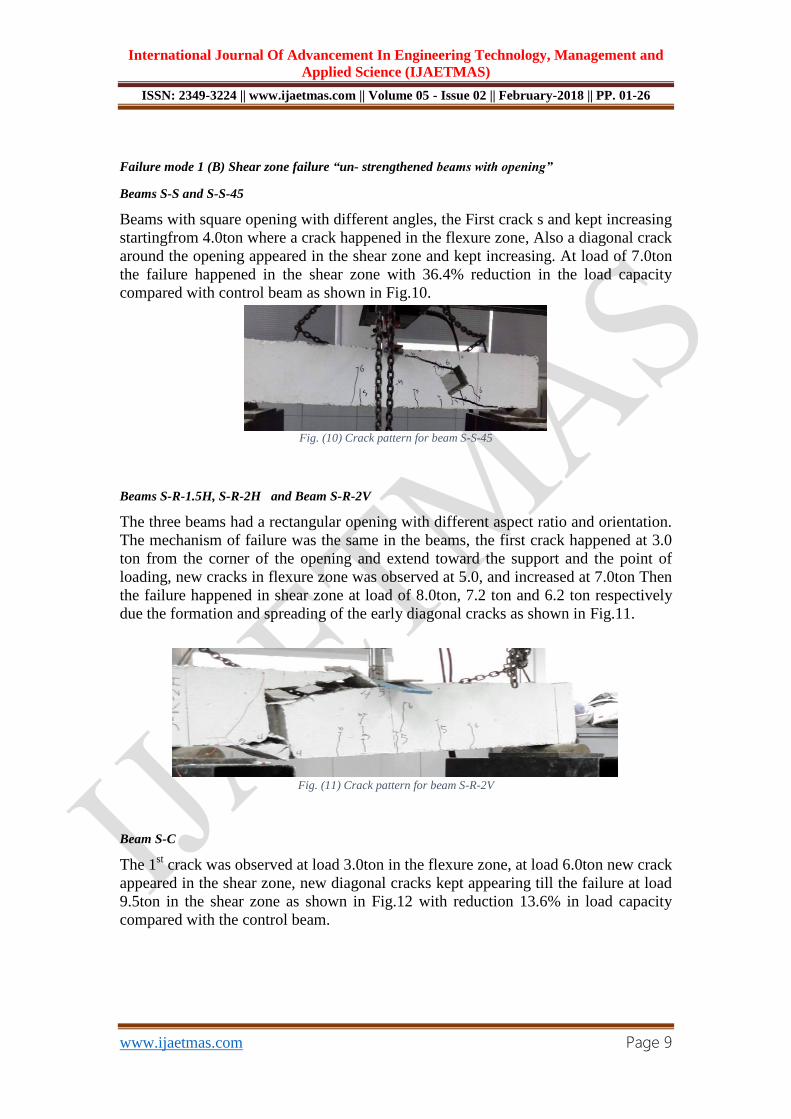
Failure mode 1 (B) Shear zone failure “un- strengthened beams with opening”
Beams S-S and S-S-45
Beams with square opening with different angles, the First crack s and kept increasing
startingfrom 4.0ton where a crack happened in the flexure zone, Also a diagonal crack
around the opening appeared in the shear zone and kept increasing. At load of 7.0ton
the failure happened in the shear zone with 36.4% reduction in the load capacity
compared with control beam as shown in Fig.10.
Beams S-R-1.5H, S-R-2H and Beam S-R-2V
The three beams had a rectangular opening with different aspect ratio and orientation.
The mechanism of failure was the same in the beams, the first crack happened at 3.0
ton from the corner of the opening and extend toward the support and the point of
loading, new cracks in flexure zone was observed at 5.0, and increased at 7.0ton Then
the failure happened in shear zone at load of 8.0ton, 7.2 ton and 6.2 ton respectively
due the formation and spreading of the early diagonal cracks as shown in Fig.11.
Beam S-C
The 1st crack was observed at load 3.0ton in the flexure zone, at load 6.0ton new crack
appeared in the shear zone, new diagonal cracks kept appearing till the failure at load
9.5ton in the shear zone as shown in Fig.12 with reduction 13.6% in load capacity
compared with the control beam.
Fig. (10) Crack pattern for beam S-S-45
Fig. (11) Crack pattern for beam S-R-2V

International Journal Of Advancement In Engineering Technology, Management and
Applied Science (IJAETMAS)
ISSN: 2349-3224 || www.ijaetmas.com || Volume 05 - Issue 02 || February-2018 || PP. 01-26
www.ijaetmas.com Page 10
Fig. (12) crack pattern for beam S-C
Failure mode 2 “Strengthened beams” in flexural and shear zone
Beam F-R, Beam S-R
Both beams have strengthened using internal square steel reinforcement around the
opening prior casting. The first crack was observed at load of 4.0ton, at load 7.0ton
crack appeared in the shear zone of beam S-R in the un-strengthened part. The failure
of the beams was in Flexure zone with load of 9.2 ton showing enhancement in the
load capacity by 8.23% and 31.42% for flexure zone and shear zone compared by
beams F-S and S-S respectively,several diagonal cracks were observed extremely
before the failure of the beam. In spite of the reduction in load capacity due to
opening in shear zone was much higher than flexural zone; the effect of strengthening
in the shear zone shows more efficiency than flexural zone, as shown in Fig. 13 and
14. Reinforcing the beam internally around the opening showed a success in
enhancing the performance of the beam, however it may not be able to use this
technique if the opening was made after casting the beam, so other techniques should
be used in case of strengthening only.
Fig. (13) Crack pattern for Beam S-R Fig. (14) Crack pattern for beam F-R
Beam S-L-Steel
This beam strengthened by embedding a square steel box of thickness 8 mm. The
firstcrack appeared in the flexure zone at load 4 ton, also at 4 ton diagonal crack
appeared in the shear zone around the opening, new diagonal cracks appeared at load
5 and 6 ton around the opening, and increased at load 7 ton. The failure happened in
the shear zone at load 8.5tondue to the diagonal cracks damaging the welding of the
steel boxas shown in Fig.15 showing a 21.4% enhancement in the load capacity
compared with beam S-S.Using a steel box didn’t show a successful result in
strengthening the opening in the shear zone, because the shear force tends to break the
welding of the steel plates forming the box so it becomes ineffective.

International Journal Of Advancement In Engineering Technology, Management and
Applied Science (IJAETMAS)
ISSN: 2349-3224 || www.ijaetmas.com || Volume 05 - Issue 02 || February-2018 || PP. 01-26
www.ijaetmas.com Page 11
Fig. (15) crack pattern for beam S-L-Steel
Beam F-L-N
The first crack appeared at load 3 ton in the flexure zone, the diagonal crack started to
appear at load 5 ton around the opening at increased at load 7 ton.At load 5 ton
Flexure-shear cracks appeared and increased at load 7. At load 9 ton a new crack
appeared in the flexure zone and compression zone followed by Failure at load 9.3 ton
showing 15.4% enhancement in load capacity compared with beam F-S, the failure
happened due to the de-bonding of the FRP laminates from the grove as shown in
Fig.13.Separation of FRP laminates from the groove was noticed in failure, but there
was no deboning in the bond between the RC and FRP which shows that the epoxy
bonding the RC and FRP was stronger than the bond between the concrete itself.As
shown in Fig.16.
Fig. (16) Crack pattern for beam F-L-N
Beam S-L-N
The first crack was observed at load of 3.0ton in the flexure zone, and kept increasing
at load of 4.0 and 6.0ton, at load of 7.0ton new crack appeared in the flexure zone and
kept increasing till 10.0ton toward the loading point. The first crack in the shear zone
appeared at load 8 ton showing the strengthening made a great improvement to
prevent the failure in the shear zone.The failure happened at load 10.1 ton in flexure
zone and no deboning in the FRP was observed as shown in Fig.17. Showing the
highest enhancement in load capacity compared with beam S-S with 44.2%.
Fig. (17) Crack pattern for beam S-L-N
International Journal Of Advancement In Engineering Technology, Management and
Applied Science (IJAETMAS)
ISSN: 2349-3224 || www.ijaetmas.com || Volume 05 - Issue 02 || February-2018 || PP. 01-26
www.ijaetmas.com Page 12
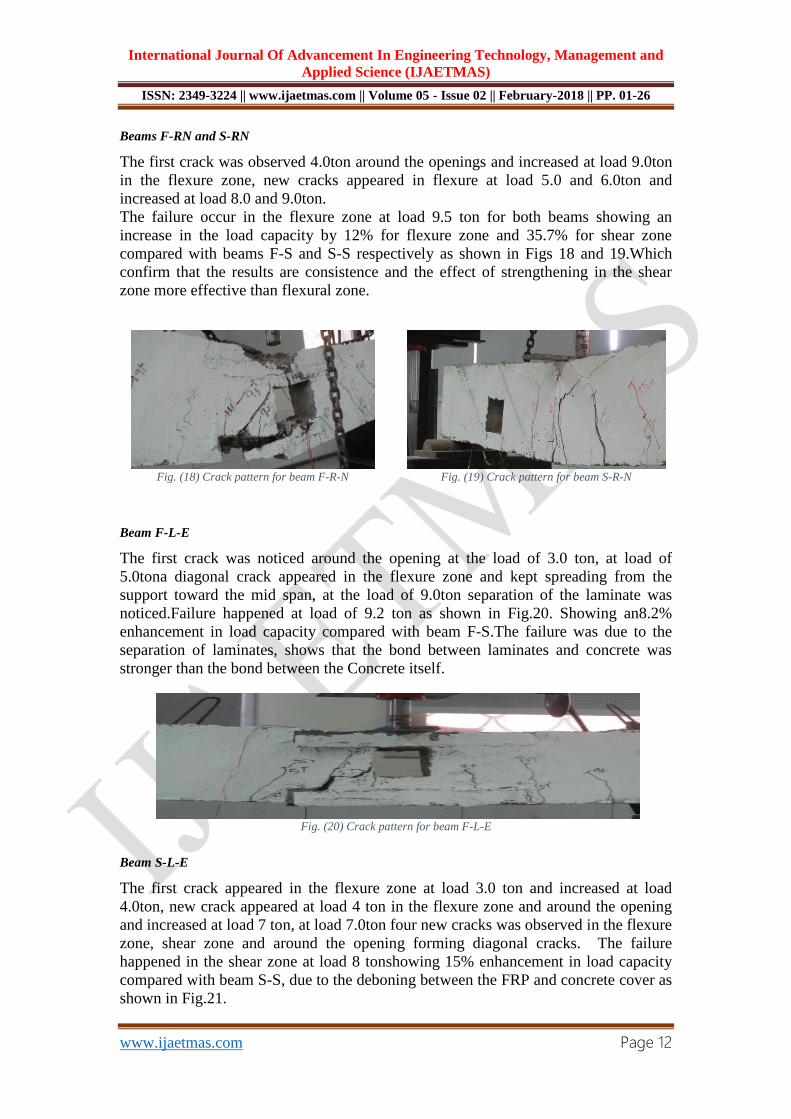
Beams F-RN and S-RN
The first crack was observed 4.0ton around the openings and increased at load 9.0ton
in the flexure zone, new cracks appeared in flexure at load 5.0 and 6.0ton and
increased at load 8.0 and 9.0ton.
The failure occur in the flexure zone at load 9.5 ton for both beams showing an
increase in the load capacity by 12% for flexure zone and 35.7% for shear zone
compared with beams F-S and S-S respectively as shown in Figs 18 and 19.Which
confirm that the results are consistence and the effect of strengthening in the shear
zone more effective than flexural zone.
Fig. (18) Crack pattern for beam F-R-N Fig. (19) Crack pattern for beam S-R-N
Beam F-L-E
The first crack was noticed around the opening at the load of 3.0 ton, at load of
5.0tona diagonal crack appeared in the flexure zone and kept spreading from the
support toward the mid span, at the load of 9.0ton separation of the laminate was
noticed.Failure happened at load of 9.2 ton as shown in Fig.20. Showing an8.2%
enhancement in load capacity compared with beam F-S.The failure was due to the
separation of laminates, shows that the bond between laminates and concrete was
stronger than the bond between the Concrete itself.
Fig. (20) Crack pattern for beam F-L-E
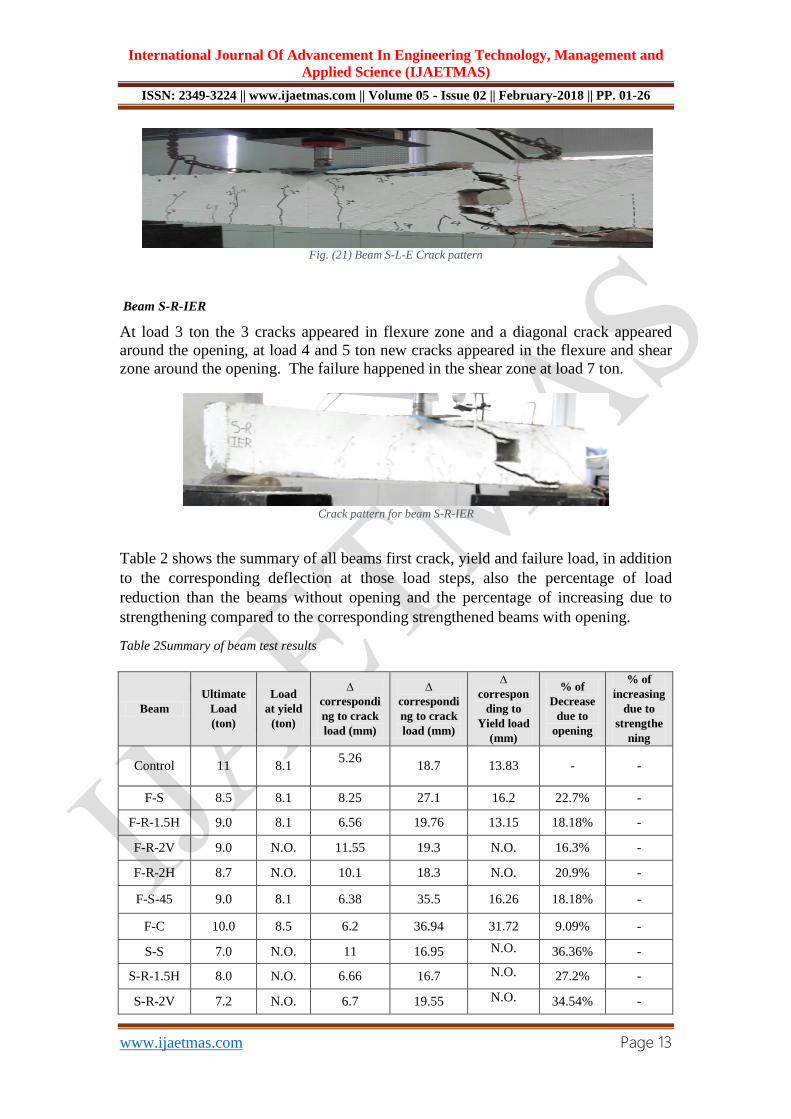
Beam S-L-E
The first crack appeared in the flexure zone at load 3.0 ton and increased at load
4.0ton, new crack appeared at load 4 ton in the flexure zone and around the opening
and increased at load 7 ton, at load 7.0ton four new cracks was observed in the flexure
zone, shear zone and around the opening forming diagonal cracks. The failure
happened in the shear zone at load 8 tonshowing 15% enhancement in load capacity
compared with beam S-S, due to the deboning between the FRP and concrete cover as
shown in Fig.21.
International Journal Of Advancement In Engineering Technology, Management and
Applied Science (IJAETMAS)
ISSN: 2349-3224 || www.ijaetmas.com || Volume 05 - Issue 02 || February-2018 || PP. 01-26
www.ijaetmas.com Page 13
Fig. (21) Beam S-L-E Crack pattern
Beam S-R-IER
At load 3 ton the 3 cracks appeared in flexure zone and a diagonal crack appeared
around the opening, at load 4 and 5 ton new cracks appeared in the flexure and shear
zone around the opening. The failure happened in the shear zone at load 7 ton.
Crack pattern for beam S-R-IER
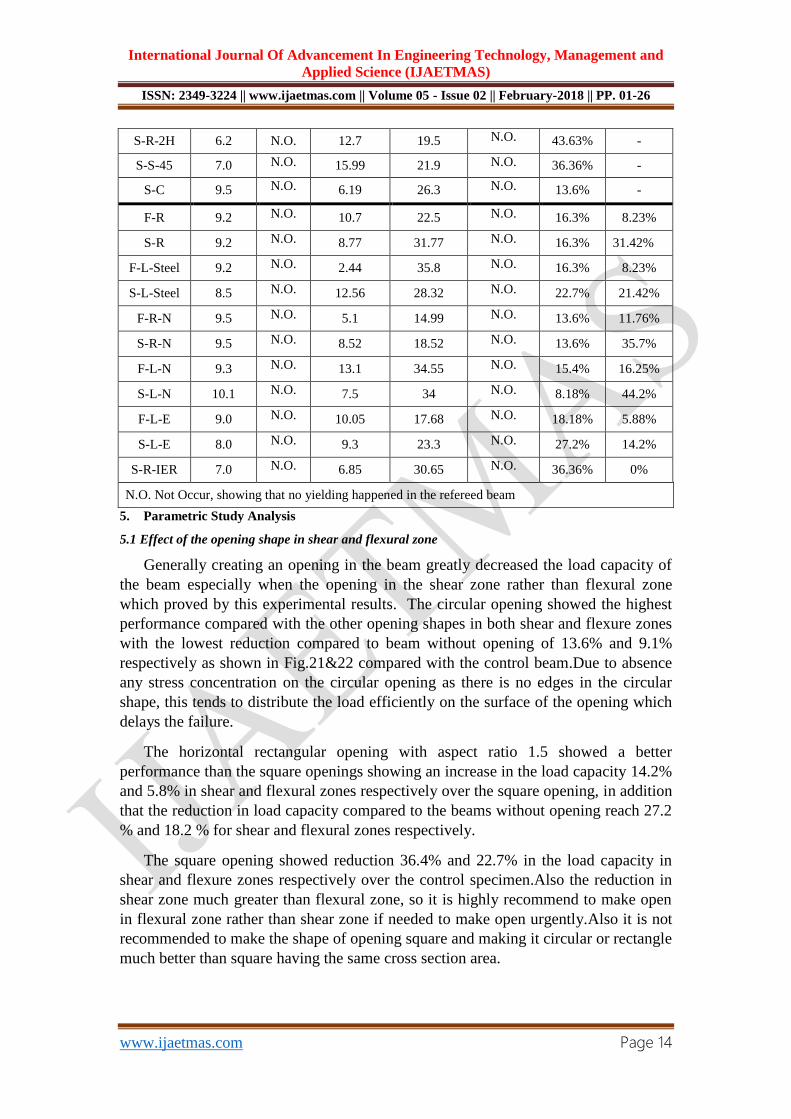
Table 2 shows the summary of all beams first crack, yield and failure load, in addition
to the corresponding deflection at those load steps, also the percentage of load
reduction than the beams without opening and the percentage of increasing due to
strengthening compared to the corresponding strengthened beams with opening.
Table 2Summary of beam test results
Beam
Ultimate
Load
(ton)
Load
at yield
(ton)
∆
correspondi
ng to crack
load (mm)
∆
correspondi
ng to crack
load (mm)
∆
correspon
ding to
Yield load
(mm)
% of
Decrease
due to
opening
% of
increasing
due to
strengthe
ning
Control 11 8.1 5.26
18.7 13.83 - -
F-S 8.5 8.1 8.25 27.1 16.2 22.7% -
F-R-1.5H 9.0 8.1 6.56 19.76 13.15 18.18% -
F-R-2V 9.0 N.O. 11.55 19.3 N.O. 16.3% -
F-R-2H 8.7 N.O. 10.1 18.3 N.O. 20.9% -
F-S-45 9.0 8.1 6.38 35.5 16.26 18.18% -
F-C 10.0 8.5 6.2 36.94 31.72 9.09% -
S-S 7.0 N.O. 11 16.95 N.O. 36.36% -
S-R-1.5H 8.0 N.O. 6.66 16.7 N.O. 27.2% -
S-R-2V 7.2 N.O. 6.7 19.55 N.O. 34.54% -
International Journal Of Advancement In Engineering Technology, Management and
Applied Science (IJAETMAS)
ISSN: 2349-3224 || www.ijaetmas.com || Volume 05 - Issue 02 || February-2018 || PP. 01-26
www.ijaetmas.com Page 14
S-R-2H 6.2 N.O. 12.7 19.5 N.O. 43.63% -
S-S-45 7.0 N.O. 15.99 21.9 N.O. 36.36% -
S-C 9.5 N.O. 6.19 26.3 N.O. 13.6% -
F-R 9.2 N.O. 10.7 22.5 N.O. 16.3% 8.23%
S-R 9.2 N.O. 8.77 31.77 N.O. 16.3% 31.42%
F-L-Steel 9.2 N.O. 2.44 35.8 N.O. 16.3% 8.23%
S-L-Steel 8.5 N.O. 12.56 28.32 N.O. 22.7% 21.42%
F-R-N 9.5 N.O. 5.1 14.99 N.O. 13.6% 11.76%
S-R-N 9.5 N.O. 8.52 18.52 N.O. 13.6% 35.7%
F-L-N 9.3 N.O. 13.1 34.55 N.O. 15.4% 16.25%
S-L-N 10.1 N.O. 7.5 34 N.O. 8.18% 44.2%
F-L-E 9.0 N.O. 10.05 17.68 N.O. 18.18% 5.88%
S-L-E 8.0 N.O. 9.3 23.3 N.O. 27.2% 14.2%
S-R-IER 7.0 N.O. 6.85 30.65 N.O. 36.36% 0%
N.O. Not Occur, showing that no yielding happened in the refereed beam
5. Parametric Study Analysis
5.1 Effect of the opening shape in shear and flexural zone
Generally creating an opening in the beam greatly decreased the load capacity of
the beam especially when the opening in the shear zone rather than flexural zone
which proved by this experimental results. The circular opening showed the highest
performance compared with the other opening shapes in both shear and flexure zones
with the lowest reduction compared to beam without opening of 13.6% and 9.1%
respectively as shown in Fig.21&22 compared with the control beam.Due to absence
any stress concentration on the circular opening as there is no edges in the circular
shape, this tends to distribute the load efficiently on the surface of the opening which
delays the failure.
The horizontal rectangular opening with aspect ratio 1.5 showed a better
performance than the square openings showing an increase in the load capacity 14.2%
and 5.8% in shear and flexural zones respectively over the square opening, in addition
that the reduction in load capacity compared to the beams without opening reach 27.2
% and 18.2 % for shear and flexural zones respectively.
The square opening showed reduction 36.4% and 22.7% in the load capacity in
shear and flexure zones respectively over the control specimen.Also the reduction in
shear zone much greater than flexural zone, so it is highly recommend to make open
in flexural zone rather than shear zone if needed to make open urgently.Also it is not
recommended to make the shape of opening square and making it circular or rectangle
much better than square having the same cross section area.

International Journal Of Advancement In Engineering Technology, Management and
Applied Science (IJAETMAS)
ISSN: 2349-3224 || www.ijaetmas.com || Volume 05 - Issue 02 || February-2018 || PP. 01-26
www.ijaetmas.com Page 15
Fig. (21) Load Capacity for beams with opening in
flexure zone Fig. (22) Capacity for beams with opening in shear
zone
5.2 Effect of orientation of the opening in shear and flexural zone
Overall changing the orientation of square opening either 90o or 45
o “Rhombus” did
not make any significant change either in shear and flexural zone as shown in fig. (23)
and (24), on the other hand changing the orientation of the rectangular opening with
aspect ratio 2.0 from vertical to horizontal could make effect as the vertical opening
have lower reduction in the load capacity over the control beam in both shear and
flexural zone, and the increase in the ultimate capacity in case of vertical opening
over horizontal opening reach 16% in shear zone and 5% in flexural zone.
Accordingly, it is recommended to make the rectangular opening in vertical position
rather than horizontal
Fig. (23) Load capacity with openings in shear zone Fig. (24) Load capacity with openings in the flexure zone
5.3 Effect of Aspect ratio of the opening in shear and flexural zone
By keeping the area of the opening a constant, we could change the aspect ratio of the
square opening to give two more different horizontal rectangular shapes with aspect
ratio 1.5 and 2.0, as shown in Fig.25&26 changing the aspect ratio in flexure zone
showed a slight decrease between aspect ratio 1.5 and 2.0. On the other hand the
change in aspect ratio has more influence in shear zone opening between rectangular
shapes with aspect ratio 1.5 and 2.0 with 27.2% reduction only for aspect ratio 1.5
compared to 43.6% for aspect ratio 2.0
0
2
4
6
8
10
12
Control F-S F-R-1.5H F-C
Lo
ad “
to
n”
0
2
4
6
8
10
12
Control S-S S-R-1.5H S-C
Lo
ad “
to
n”
0
2
4
6
8
10
12
Control F-S F-R-2V F-R-2H F-S-45
Lo
ad “
to
n”
0
2
4
6
8
10
12
Control S-S S-R-2V S-R-2H S-S4-5
Lo
ad “
to
n”

International Journal Of Advancement In Engineering Technology, Management and
Applied Science (IJAETMAS)
ISSN: 2349-3224 || www.ijaetmas.com || Volume 05 - Issue 02 || February-2018 || PP. 01-26
www.ijaetmas.com Page 16
Fig. (25) load capacity for beams with opening in
flexure zone Fig. (26) load capacity for beams with opening in shear
zone
5.4 Effect of External methods of strengthening in shear and flexural zone
5.4.1 Effect of external FRP laminates
Figs27 and 28shows the capacity of beams strengthened with externally bonded
laminates, it shows that externally bonded laminates enhanced the load capacity of
beams with openings with 8.2% for the opening in flexure zone and 14% for the
opening in shear zone. For Beam S-L-E despite strengthening the beam the
mechanism of failure didn’t change compared with Beam S-S which didn’t have any
strengthening, showing that the EB strengthening technique was not very effective in
the shear zone.
Fig. (27) load capacity for beams strengthened with FRP
laminates in flexure zone
Fig. (28) load capacity for beams strengthened with
FRP laminates in shear zone
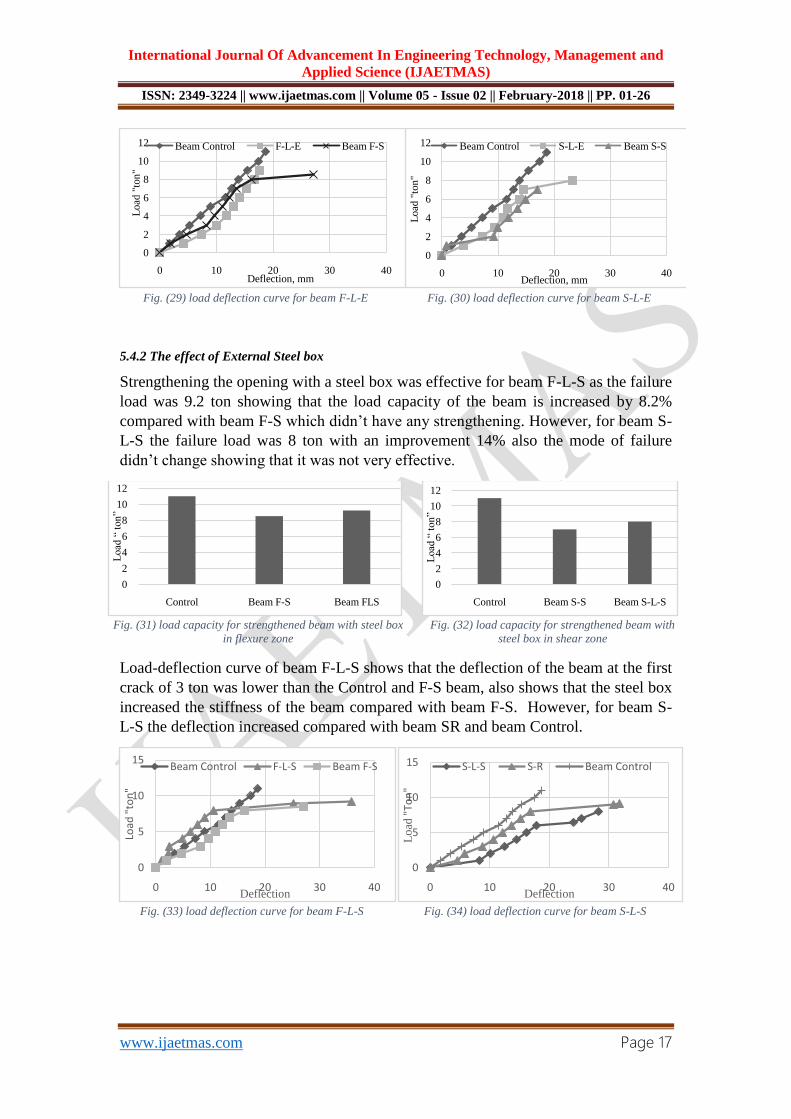
The load deflection curvesof beam F-L-E and S-L-E shown in Fig 29 and 30shows
that the FRP laminates increased the stiffness of the beams compared with beams F-S
and S-S, beam F-S is tougher than beam F-L-E showing that the failure happened due
to the early diagonal cracks in beam F-S, Also the laminates delayed the failure but
caused a brittle failure because of the laminates de-bonding.
0
2
4
6
8
10
12
Control S-S S-R-1.5H S-R-2H
Lo
ad “
to
n”
0
2
4
6
8
10
12
Control F-S F-R-1.5H F-R-2H
Lo
ad “
to
n”
0
2
4
6
8
10
12
Control Beam F-S Beam F-L-E
Lo
ad “
to
n”
0
2
4
6
8
10
12
Control Beam S-S Beam S-L-E
Lo
ad “
to
n”
International Journal Of Advancement In Engineering Technology, Management and
Applied Science (IJAETMAS)
ISSN: 2349-3224 || www.ijaetmas.com || Volume 05 - Issue 02 || February-2018 || PP. 01-26
www.ijaetmas.com Page 17
Fig. (29) load deflection curve for beam F-L-E Fig. (30) load deflection curve for beam S-L-E
5.4.2 The effect of External Steel box
Strengthening the opening with a steel box was effective for beam F-L-S as the failure
load was 9.2 ton showing that the load capacity of the beam is increased by 8.2%
compared with beam F-S which didn’t have any strengthening. However, for beam S-
L-S the failure load was 8 ton with an improvement 14% also the mode of failure
didn’t change showing that it was not very effective.
Fig. (31) load capacity for strengthened beam with steel box
in flexure zone Fig. (32) load capacity for strengthened beam with
steel box in shear zone
Load-deflection curve of beam F-L-S shows that the deflection of the beam at the first
crack of 3 ton was lower than the Control and F-S beam, also shows that the steel box
increased the stiffness of the beam compared with beam F-S. However, for beam S-
L-S the deflection increased compared with beam SR and beam Control.
Fig. (33) load deflection curve for beam F-L-S Fig. (34) load deflection curve for beam S-L-S
0
2
4
6
8
10
12
0 10 20 30 40
Load
"to
n"
Deflection, mm
Beam Control F-L-E Beam F-S
0
2
4
6
8
10
12
0 10 20 30 40
Load
"to
n"
Deflection, mm
Beam Control S-L-E Beam S-S
0
2
4
6
8
10
12
Control Beam F-S Beam FLS
Load
“ t
on
”
0
2
4
6
8
10
12
Control Beam S-S Beam S-L-S
Load
“ t
on
”
0
5
10
15
0 10 20 30 40
Load
"to
n"
Deflection
Beam Control F-L-S Beam F-S
0
5
10
15
0 10 20 30 40
Lo
ad"T
on
"
Deflection
S-L-S S-R Beam Control
International Journal Of Advancement In Engineering Technology, Management and
Applied Science (IJAETMAS)
ISSN: 2349-3224 || www.ijaetmas.com || Volume 05 - Issue 02 || February-2018 || PP. 01-26
www.ijaetmas.com Page 18
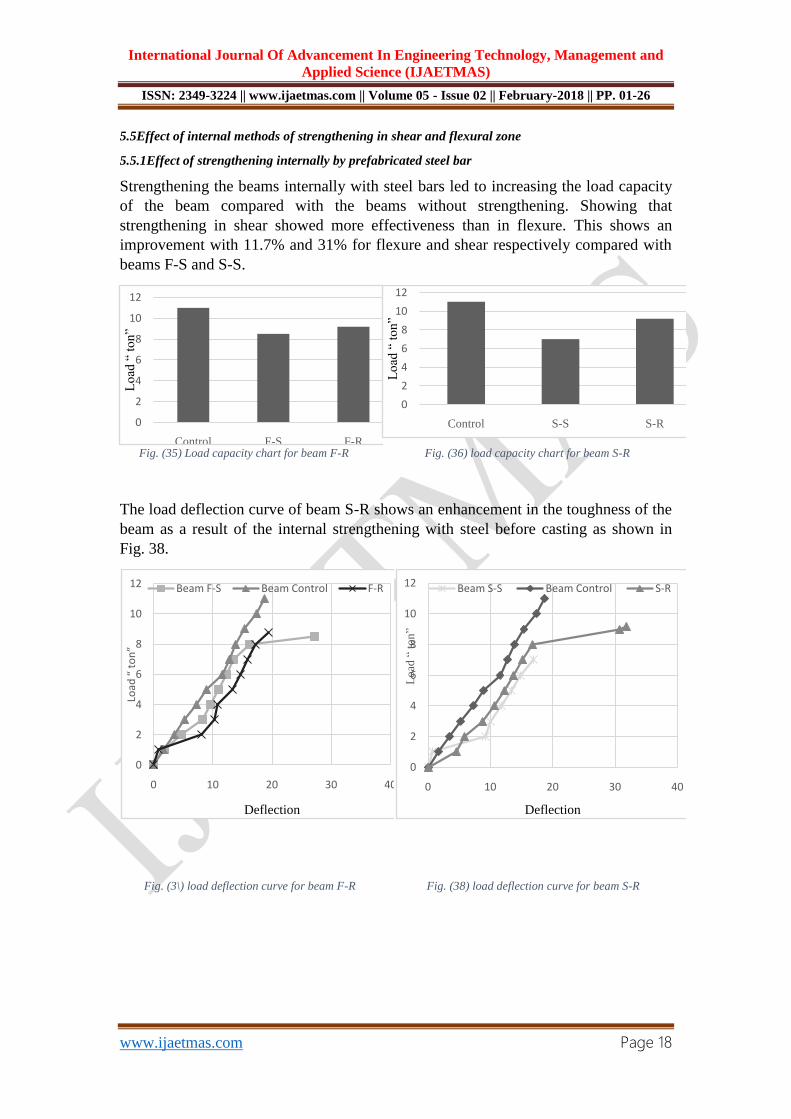
5.5Effect of internal methods of strengthening in shear and flexural zone
5.5.1Effect of strengthening internally by prefabricated steel bar
Strengthening the beams internally with steel bars led to increasing the load capacity
of the beam compared with the beams without strengthening. Showing that
strengthening in shear showed more effectiveness than in flexure. This shows an
improvement with 11.7% and 31% for flexure and shear respectively compared with
beams F-S and S-S.
Fig. (35) Load capacity chart for beam F-R Fig. (36) load capacity chart for beam S-R
The load deflection curve of beam S-R shows an enhancement in the toughness of the
beam as a result of the internal strengthening with steel before casting as shown in
Fig. 38.
Fig. (3\) load deflection curve for beam F-R Fig. (38) load deflection curve for beam S-R
0
2
4
6
8
10
12
Control F-S F-R
Lo
ad “
to
n”
0
2
4
6
8
10
12
Control S-S S-R
Lo
ad “
to
n”
0
2
4
6
8
10
12
0 10 20 30 40
Load
“ to
n”
Deflection
Beam F-S Beam Control F-R
0
2
4
6
8
10
12
0 10 20 30 40
Lo
ad“
ton
”
Deflection
Beam S-S Beam Control S-R
International Journal Of Advancement In Engineering Technology, Management and
Applied Science (IJAETMAS)
ISSN: 2349-3224 || www.ijaetmas.com || Volume 05 - Issue 02 || February-2018 || PP. 01-26
www.ijaetmas.com Page 19
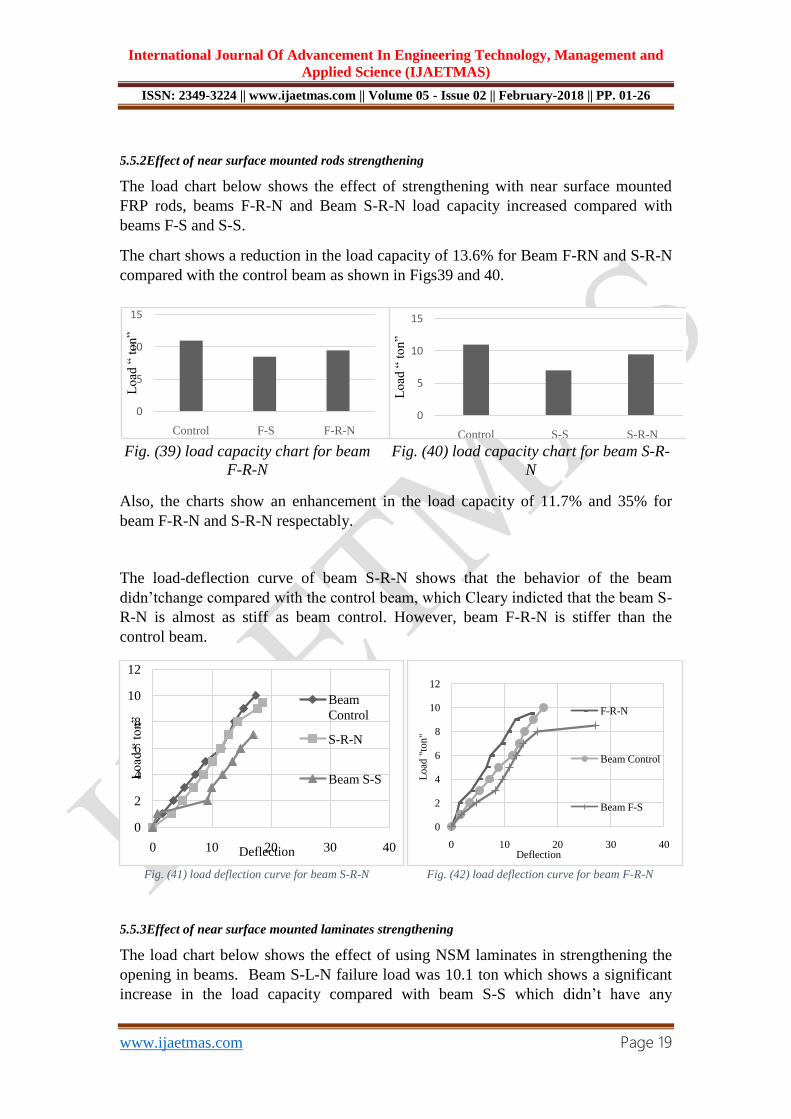
5.5.2Effect of near surface mounted rods strengthening
The load chart below shows the effect of strengthening with near surface mounted
FRP rods, beams F-R-N and Beam S-R-N load capacity increased compared with
beams F-S and S-S.
The chart shows a reduction in the load capacity of 13.6% for Beam F-RN and S-R-N
compared with the control beam as shown in Figs39 and 40.
Also, the charts show an enhancement in the load capacity of 11.7% and 35% for
beam F-R-N and S-R-N respectably.
The load-deflection curve of beam S-R-N shows that the behavior of the beam
didn’tchange compared with the control beam, which Cleary indicted that the beam S-
R-N is almost as stiff as beam control. However, beam F-R-N is stiffer than the
control beam.
5.5.3Effect of near surface mounted laminates strengthening
The load chart below shows the effect of using NSM laminates in strengthening the
opening in beams. Beam S-L-N failure load was 10.1 ton which shows a significant
increase in the load capacity compared with beam S-S which didn’t have any
Fig. (39) load capacity chart for beam
F-R-N
Fig. (40) load capacity chart for beam S-R-
N
Fig. (41) load deflection curve for beam S-R-N Fig. (42) load deflection curve for beam F-R-N
0
5
10
15
Control F-S F-R-N
Lo
ad “
to
n”
0
5
10
15
Control S-S S-R-N
Lo
ad “
to
n”
0
2
4
6
8
10
12
0 10 20 30 40
Lo
ad “
to
n”
Deflection
Beam
Control
S-R-N
Beam S-S
0
2
4
6
8
10
12
0 10 20 30 40
Load
"to
n"
Deflection
F-R-N
Beam Control
Beam F-S

International Journal Of Advancement In Engineering Technology, Management and
Applied Science (IJAETMAS)
ISSN: 2349-3224 || www.ijaetmas.com || Volume 05 - Issue 02 || February-2018 || PP. 01-26
www.ijaetmas.com Page 20
strengthening. Also beam F-L-N failure load was 9.3 ton which shows the effect of
FRP in strengthening the beam compared with Beam F-S which didn’t have any
strengthening.
Fig. (43) load capacity for beam F-L-N Fig. (44) load capacity for beam S-L-N
According to the load-deflection curve above, the stiffness of beam S-L-N increased
due to strengthening the beam with FRP laminates compared with beam S-S.Also the
toughness of both beams F-L-N and S-L-N enhanced as a result of installing the FRP
laminates.
Fig. (45) load deflection curve for beam F-L-N Fig. (46) load deflection curve for beam S-L-N
5.5.4Effect of I.E.R strengthening
Using internally embedded FRP to strengthen the opening in shear zone didn’t show
any noticeable effect, as shown in Fig. (47), showing a conflict with results of the
experimental program conducted by Morsy et (2011) using this technique in
strengthening R.C. beams in shear without opening [10]
, the discrepancy in the results
may be because opening, or using a driller to make the grooves weakened the beam
0
5
10
15
Control F-S F-L-N
Lo
ad “
to
n”
0
5
10
15
Control S-S S-L-N
Lo
ad “
to
n”
0
2
4
6
8
10
12
0 10 20 30 40
Load
"to
n"
Deflection
F-L-N Beam Control Beam F-S
0
2
4
6
8
10
12
0 10 20 30 40
Load
“ t
on
”
Deflection
Beam Control S-L-N Beam S-S

International Journal Of Advancement In Engineering Technology, Management and
Applied Science (IJAETMAS)
ISSN: 2349-3224 || www.ijaetmas.com || Volume 05 - Issue 02 || February-2018 || PP. 01-26
www.ijaetmas.com Page 21
moreover the weakness caused by the opening. Moreover, the stirrups were used by
the minimum spacing which decreased the contact with FRP rods.
Fig. (47) load capacity for beam SR-IER
5.6Difference between strengthening methods in flexure and shear
The data shown in the previous sections shows the results of strengthening the
openings in beams with different techniques, each technique tend to change the
behavior and load capacity of the beam with different way whether the opening was in
flexure or shear zone. Strengthening the openings internally with extra steel
reinforcement around the square opening shown in beams F-R and S-R showed an
enhancement in the beam capacity compared with beams F-S and S-S which didn’t
have any strengthening with 8.23% and 31.42% respectively, which shows that both
gave a good enhancement in the load capacity.
Strengthening the openings with a steel laminates was shown above in beam F-L-
Steel and S- L-Steel, this strengthening technique showed an enhancement in beam F-
L-Steel load capacity compared with Beam F-S which didn’t have any strengthening
with 8.23%. However, for beam S-L-Steel the enhancement was 21.42% which is
considered low compared with the other strengthening techniques in shear zone. Also,
it is confirming the previous conclusion that the effect of strengthening in the shear
zone more effective than flexural zone.
Strengthening the beam with NSM rods in beams F-R-N and S-R-N, showed an
enhancement in the beam load capacity, for flexure zone the beam load capacity
increased by 11.76% showing the highest regaining in the load capacity compared
with the other strengthening methods in flexure zone. Also for the shear zone beam S-
R-N showed a significant enhancement in the load capacity with 35.7%.
Strengthening the beams with NSM laminates in beam F-L-N and S-L-N, showed an
enhancement in the load capacity, for flexure zone the beam load capacity increased
by 8.23% which is in average compared with the other techniques used in
strengthening the openings in flexure zone. On the other hand, BeamS-L-N load
capacity enhanced by 44.2% showing it’s the highest load capacity compared with all
the beams which have opening in shear zone.
6. Strain behavior
0
2
4
6
8
10
12
Beam Control Beam S-S Beam S-R-IER
Lo
ad “
to
n”

International Journal Of Advancement In Engineering Technology, Management and
Applied Science (IJAETMAS)
ISSN: 2349-3224 || www.ijaetmas.com || Volume 05 - Issue 02 || February-2018 || PP. 01-26
www.ijaetmas.com Page 22
The strain behavior of beams was monitoring for all beams also for the strengthened
beams, the strain behavior of the strengthening material was tracked as well, strain 1
points to the strain gauge attached to horizontal steel reinforcement and strain 2 points
to the strain gauge attached to the strengthening material. The strain curves show that
using FRP composites increased the stiffness of the beams which shows the effect of
using FRP in strengthening the beams.
For the un-strengthened beams the strain curve show that the behavior of the beams
didn’t change, however the toughness of the beams with openings significantly
decreased.
Fig. (48) Strain curve for beam F-R-N Fig. (49) Strain curve for beam S-L-N
Fig. (50) Strain curve for flexure zone unstrengthened
beams Fig. (51) strain curve for beam S-R-N
7. Deflection ductility index
Using the load– deflection relationship it could be calculated the deflection ductility
index. which based on deflection computation at mid-span of beam, the toughness of
the beams was computed as an indication of ductility, Then a ratio between the
ductility of beamsto the ductility of control beam was computed, another ratio of the
ductility of the strengthened beams to the ductility of each strengthened beam with the
same opening zone and shape.
Generally, a high ductility index indicates that a structural member is capable of
undergoing large deformations prior to failure. The following table shows the
efficiency of strengthening the openings in beam with different techniques on the term
of ductility.22
The data shows an improvement in the ductility of all strengthened
beams compared with the beams without strengthening expect for beam F-R-N which
had a brittle failure after the breaking of FRP rods.
0
10
20
0 0.002 0.004 0.006 0.008 0.01
Lo
a"to
n"
F-R-N Strain 2F-R-N Strain 1Beam Control
0
5
10
15
0 0.00005 0.0001 0.00015 0.0002 0.00025 0.0003
Load
"to
n"
S-L-N strain 1 S-L-N strain 2
Beam Control
0
0 0.002 0.004 0.006 0.008 0.01
Lo
ad “
to
n”
Control F-R-2V F-R-2H
F-S-45 F-C F-R-1.5H
0
20
0 0.0001 0.0002 0.0003
Lo
ad “
to
n”
S-R-N strain 1 Beam Control
S-R-N strain 2

International Journal Of Advancement In Engineering Technology, Management and
Applied Science (IJAETMAS)
ISSN: 2349-3224 || www.ijaetmas.com || Volume 05 - Issue 02 || February-2018 || PP. 01-26
www.ijaetmas.com Page 23
Also, the table shows that strengthening the beam internally with steel enhanced the
ductility of the beam showing the same behavior as the control beam. For the beams
strengthened externally with FRP laminates beam F-L-N shows a significant increase
in the ductility of the beam compared with control beam. Also beam S-L-N showed
the same ductility index as the control beam as well as beam F-L-E.
In terms of ductility strengthening the beam internally with steel reinforcement
improved the ductility when compared to un-strengthened beams and shows the same
ductility index as the control beam; also strengthening externally NSM laminates
enhance the ductility of beams, also the data shows that the openings in flexure and
shear zone significantly decreases the ductility of beams, however the circular
openings showed an enhancement in the beam’s ductility.
Table 3ductility index table
Beam Ductility
Ductility of beam /
ductility of control
beam
Ductility of beam /
ductility of un-
strengthened beam
Control 106.87 1 -
F-S 80.175 0.75 -
S-S 68.525 0.64 -
F-R 105.315 0.99 1.31
S-R 109.209 1.02 1.59
F-L-Steel 62.88 0.59 0.78
S-L-Steel 120.34 1.13 1.76
F-R-N 58.242 0.54 0.73
S-R-N 90.24 0.84 1.32
F-L-N 142.54 1.33 1.78
S-L-N 108.23 1.01 1.58
F-L-E 103.17 0.97 1.29
S-L-E 83.1 0.78 1.21
S-R-IER 51.52 0.48 0.75
F-R-1.5H 74.84 0.70 N.A.
F-R-2V 102.108 0.96 N.A.
F-R-2H 94.136 0.88 N.A.
F-S-45 85.395 0.80 N.A.
F-C 160.08 1.50 N.A.
S-R-1.5H 71.12 0.67 N.A.
S-R-2V 52.615 0.49 N.A.
S-R-2H 76.05 0.71 N.A.
S-S-45 89.32 0.84 N.A.
S-C 108.97 1.02 N.A.
8. Conclusion
This research provides information about the behavior on the strengthened beams
with openings in shear and flexure zones with different techniques. Experimental

International Journal Of Advancement In Engineering Technology, Management and
Applied Science (IJAETMAS)
ISSN: 2349-3224 || www.ijaetmas.com || Volume 05 - Issue 02 || February-2018 || PP. 01-26
www.ijaetmas.com Page 24
results show the effectiveness of each strengthening technique, based on the results
discussed in the paper, the following main conclusion can be drawn:
Generally creating an opening in the beam greatly decreased the load capacity
of the beam specially when the opening in the shear zone rather than flexural
zone, so it is recommended to execute the open in the flexural zone when it is
urgent to make open.
Changing the orientation of square opening either 90o or 45o “Rhombus” did
not make any significant change either in shear and flexural zone; moreover, it
is recommended to make the rectangular opening in vertical position rather
than horizontal.
The circular opening showed the highest performance compared with the other
opening shapes in both shear and flexure zones followed by the horizontal
rectangular opening with aspect ratio 1.5 and the lowest performance was the
square openings
In spite of the reduction in load capacity due to opening in shear zone much
higher than flexural zone, the effect of strengthening in the shear zone more
effective than flexural zone.
Circular opening is the best shape of opening that showed the least reduction
in ultimate load.
The aspect ratio and orientation of the opening can affect the load capacity of
the beam.
When using the same area of laminates and rods in strengthening the opening
in flexure and shear zones, the laminates sustain a better result with higher
load capacity in shear zone however in flexure zone the FRP rods showed a
better result.
Using a steel box in strengthening the opening in flexure zone is feasible
however it’s not effective in the shear zone, as the shear force tend to break
the welding bonding between the steel plates.
Using externally bonded laminates in flexure and shear was as good as N.S.M.
rods in terms of load but in terms of deflection beams with E.B. laminates had
higher defection.
IER technique is not feasible in strengthening the opening in shear zone
Further researchesare needed to study the effect of IER method and the effect
of the parameter like adding epoxy inside the grooves or changing the amount
of reinforcement stirrups used as well as the spacing between the IER.
Strengthening the beam internally with steel reinforcement improves the
ductility of the beam to show the same limit of control beam.
Enhancing the ductility of the beams with opening using FRP composites is
feasible.
Strengthening the opening in beam with NSM mounted technique in flexure
zone can improve the ductility of beam to 33% compared with the control
International Journal Of Advancement In Engineering Technology, Management and
Applied Science (IJAETMAS)
ISSN: 2349-3224 || www.ijaetmas.com || Volume 05 - Issue 02 || February-2018 || PP. 01-26
www.ijaetmas.com Page 25
beam and 78% compared with the un-strengthened beam with opening in the
same zone.
9. Reference
1. Tamer El-Maaddawy and Bilal El-Arises, “Behavior of Concrete Beams with Short Shear Span
and Web Opening Strengthened in Shear with CFRP Composites” Journal of Composites for
construction, ACE, January/ February 2012, pp47/59.
2. Mansur, M. (1998). “Effect of openings on the behavior and strength of R/C beams in shear.”
Cem. Concr. Compos., 20(6), 477–486.
3. Mansur, M., Tan, K., and Wei,W. (1999). “Effects of creating an opening in existing beam.” ACI
Struct. J., 96(6), 899–906.
4. Ashour, A., and Rishi, G. (2000). “Tests of reinforced concrete continuous deep beams with web
openings.” ACI Struct. J., 97(3), 418–426.
5. Tan, K., Mansur, M., and Wei, W. (2001). “Design of reinforced concrete beams with circular
openings.” ACI Struct. J., 98(3), 407–415.
6. Bengi Aykac, Ilker Kalkan, Sabahattin Aykac, Yusuf Emre Egriboz “ Flexural behavior of RC
beams with regular square or circular web Openings” Engineering Structure, 56, 2013, pp2165-
2174
7. Mansur M A, Lee Y F, Tan K H, Lee S L “Tests on RC continuous beams with openings”. J Struct
Eng ASCE 1991; 117:1593–606
8. Al-Sheikh S. A.” Flexural Behavior of R.C. Beams with opening. Concrete research letters, 5(2),
812-824.
9. Tan KH, Mansur MA. Design procedure for reinforced concrete beams with large web openings.
ACI Struct J 1996;93:404–11.
10. Morsy, N. Elashkar, & K. Helmy (2011). A Comparative Study for Shear Strengthening
Techniques of Reinforced Concrete Beams Using FRP. Fourth international conference 4th
International Conference on Concrete Repair 26th-28th September, 2011, Dresden, Germany
11. Morsy, A., & Mahmoud, E. T. (2013). Bonding techniques for flexural strengthening of R.C.
beams using CFRP laminates. Ain Shams Engineering Journal, 4(3), 369-374.
12. Carolin, A., and Taljsten, B. (2005). “Experimental study of strengthening for increased shear
bearing capacity.” J. Compos. Constr., 9(6), 488–496.
13. Chaallal, O., Shahawy, M., and Hassan, M. (2002). “Performance of reinforced concrete T-girders
strengthened in shear with carbon fiber-reinforced polymer fabric.” ACI Struct. J., 99(3), 335–343
14. Khalifa, A., and Nanni, A. (2002). “Rehabilitation of rectangular simply supported RC beams with
shear deficiencies using CFRP composites.” Constr. Build. Mater., 16(3), 135–146.
15. H A Abdalla, A M Torkey, H A Haggag, and A F Abu-Amira, “Design Against Cracking at
Openings in Reinforced Concrete Beams Strengthened with Composite Sheets”.” Composite
Structures, Vol 60, 2003, pp 7–204.
16. Martinola, G., Meda, A., Plizzari, G. A., & Rinaldi, Z. (2010). Strengthening and repair of RC
beams with fiber reinforced concrete. Cement and Concrete Composites, 32(9), 731-739
17. Pimanmas, A. (2010). Strengthening R/C beams with opening by externally installed FRP rods:
Behavior and analysis. Composite Structures, 92(8), 1957-1976.
18. A., A., Naganathan, S., K., N., Fayyadh, M. M., & Jamali, S. (2016). Repair Effectiveness of
Damaged RC Beams with Web Opening Using CFRP and Steel Plates. Jordan Journal of Civil
Engineering, 10(2), 163-183.
19. Laura De Lorenzis, Antonio Nanni (2001) , Shear Strengthening of Reinforced Concrete Beams
with Near-Surface Mounted Fiber-Reinforced Polymer Rods. Structural journal.

International Journal Of Advancement In Engineering Technology, Management and
Applied Science (IJAETMAS)
ISSN: 2349-3224 || www.ijaetmas.com || Volume 05 - Issue 02 || February-2018 || PP. 01-26
www.ijaetmas.com Page 26
20. Barros, J., & Dias, S. (2006). Near surface mounted CFRP laminates for shear strengthening of
concrete beams. Cement and Concrete Composites, 28(3), 276-292
21. Sunder, S., Babu, N., & Paulose, D. (2016). Experimental Study on Strengthening of Openings in
R.C Beams using BFRP Fabric. International Journal of Innovative Research in Science,
Engineering and Technology, 5(8), 14849-14855.
22. J.A Apeh , O.G Okoli (2016) , Evaluation of Ductility Index of Concrete Beams Reinforced with
Rebars Milled from Scrap metals. Concrete Research Letters, 7(2), 56-68.