performance of traditional cooperatives: the portuguese ...ageconsearch.umn.edu/bitstream/99100/2/07...
TRANSCRIPT

143
Performance of Traditional Cooperatives: the Portuguese Douro Wine Cooperativesa
João Rebelo*, José Caldas* and Scott C. Matulich**
Economía Agraria y Recursos Naturales. ISSN: 1578-0732. Vol. 10, 2. (2010). pp. 143-158
SUMMARY: Globalization is challenging the very core of cooperative governance and ownership deci-sion, especially in Southern European countries, like Portugal, where a large number of producers are or-ganized in traditional and Mediterranean-style agricultural cooperatives. This paper analyses the effectsof governance and control variables related with size over two alternative indicators of performance: rev-enues transferred to members/patrons and capital structure. The results suggest that these cooperativeshave difficulties being sustainable in the more competitive global wine markets, if they follow, essen-tially, a practice of maximum patronage refund, reducing their capacity to improve leverage and to fi-nance more profitable, but risky, long run investments.
KEYWORDS: Econometric model, economic analysis, traditional cooperatives, wine sector.
JEL classification : Q13, D22, L25.
Performance de las Cooperativas Tradicionales: Las Cooperativas Portuguesas de Viño del Duero
RESUMEN: La globalización está poniendo en cuestión la esencia de la gobernanza cooperativa y su es-tructura societaria, sobre todo en los países del Sur de Europa, como Portugal, donde muchos productoresestán organizados en cooperativas agrícolas tradicionales y de estilo mediterráneo. Este trabajo analizalos efectos de las variables de gobierno y control relacionados con el tamaño sobre dos indicadores decomportamiento alternativos: los ingresos transferidos a los miembros/socios y la estructura del capital.Los resultados sugieren que estas cooperativas atraviesan dificultades para mantenerse sostenibles en unmercado de vino global y más competitivo si siguen, en esencia, una política de máximo retorno al socio,reduciendo su capacidad para de mejorar la estructura de su deuda y capacidad para financiar inversionesmás rentables, aunque con mayor riesgo, a largo plazo.
PALABRAS CLAVE: Análisis económica, cooperativas tradicionales, modelo econométrico, sector viti-vinícola.
Clasificación JEL: Q13, D22, L25.
a Acknowledgements: The authors gratefully acknowledge the valuable comments of the editor ofEARN and of three anonymous referees. The usual disclaims applies.
* Department of Economics, Sociology and Management (DESG) and CETRAD – University ofTrás-os-Montes and Alto Douro (UTAD); Av. Almeida Lucena 1, 5000-660 Vila Real, PORTUGAL (con-tact address); Emails: [email protected] (corresponding author); [email protected], phone + 351 259 302200.
** School of Economic Sciences, Washington State University; Pullman, 99164 WA, U.S.A.; Email:[email protected].
07 Joao Rebelo_01 Blandford 27/12/10 11:29 Página 143

1. Introduction
During the past two decades the wine sector has followed the general globaliza-tion trend. International trade increased, direct foreign investment in all facets of theindustry is common, and viticulture is less and less linked to a specific region (ter-roir). Underpinning much of this change are transfers of scientific knowledge, includ-ing “business models”, and the tendencies for the qualitative and quantitative unifor-mity of consumption. Countries of the southern hemisphere, such as Australia, thatpreviously imported European production technology, are now a source of knowledgeand economic engine of change to “Old World” wines. These changes have literallyuprooted the Old World wine industry as it attempts to address persistent excess pro-duction brought on by aggressive production of “New World” wines.
Annual data published by International Organisation of Vine and Wine (OIV,2008) show that in the last two decades there is excess production; world wine con-sumption is 84% of annual production, on average. International trade of wines morethan doubled in the last 20 years. Exports jumped from 13.6% of world wine pro-duction in 1987 to 29.4% in 2007. Global production and export pressures came prin-cipally from the New World producers in Australia, Argentina, Chile and SouthAfrica.
Old World producers have been slow to react. “..., due to the recent trend of global grape and wine oversupply, markets arebeginning to experience deep discounting as wineries look to clear out excessinventory in order to make room for new vintages. To sustain their growth wineproducers will have two alternatives: either go along with the supermarketchains and become global by investing in some of the main wine producingcountries, or develop a niche strategy (through a specific product, and or aspecific service) to differentiate themselves (Remaud and Couderc, 2006:406).”
Increased world wine competition underpins a growing industrial concentration towhich the small-scale viticulture structure in much of the European Union may notbe able to respond. Changes in the wine sector are challenging the very core of gov-ernance and ownership decisions, especially in southern European countries, likePortugal, where large numbers of producers are organized in a few wine cooperatives(WCs). Most of the WCs were founded during the 1950s and 60s in a top-downprocess and in order to address capitalization problems arising from very small scalewine processing, stocking and marketing. These cooperatives are legally organisedfollowing traditional cooperative principles (i.e., open membership, democratic con-trol, restricted residual claim and benefits to members proportional to patronage),with poorly defined property rights and consequential difficulty in assuming riskyinvestments that could add value in the medium and long run.
The Douro Demarcated Region (DDR), where twenty WCs comprise about 45%of the total production and the majority follow the so-called “Mediterranean model”of governance, is characterised by the adoption of traditional cooperative principlesand most of them with non-professional management.
144 João Rebelo, José Caldas and Scott C. Matulich
07 Joao Rebelo_01 Blandford 27/12/10 11:29 Página 144

Like many agricultural cooperatives, the DDR-WCs increasingly face survivalchallenges related to economic and financial issues, all of which are accentuated inthe last decades. Factors such as member equity, capital acquisition and redemptionare well known constraints on growth and sustainability that arise from ill-definedproperty rights in a cooperative environment (Cook and Iliopoulos, 2000). These fac-tors lead cooperatives to a situation where they have to opt between the immediatepatronage refund to patrons or reinforcing equity. Since both objectives are potential-ly consistent with the traditional Mediterranean cooperative model, we examineempirically both alternative objectives in the context of governance structure and ofcontrol variables related to size. The econometric model uses panel data to evaluatetwo competing/alternative indicators of DDR-WCs performance: (a) revenues trans-ferred to members/patrons (share of gross revenue transferred to patrons), and (b)equity/total asset ratio (inverse of leverage). The next section includes a brief litera-ture review of the cooperative organization models. In the remaining sections, theDouro Wine Cooperatives context is presented, followed by the econometric analysisof DDR-WCs performance. Final remarks concerning some ideas on the viability oftraditional cooperatives under increasing pressures from a global and competitiveworld environment conclude the paper.
2. Cooperative organizational models
The economic justification of agricultural cooperatives is found at the level ofmember farms. Independent of the organizational model that they adopt, agricultur-al cooperatives are successful if they provide their members a net economic benefithigher than they can achieve individually or outside of the cooperative. As both mainsuppliers of raw materials and equity, members decide on the cooperative’s retainedearnings, investments, and farmer s output final price. However, since this price isrelated to the retained earnings and because the price of the farm product deliveredby the members represent an important cost to the cooperative firm, the coopera-tive’s profit is not, generally speaking, a useful measure of its performance (Rafat etal., 2009).
In order to cope with the changes in the agribusiness and food industries, cooper-atives are introducing organizational innovations, evolving from the traditional coop-erative to a new typology of cooperative models that assumes a new property rightsstructure of its members and governance.
The traditional cooperatives are companies that work in a single, common market,in which they are exposed to the same conditions as their competitors. These tradi-tional cooperatives face problems similar to investor owned firms (IOF) but the solu-tions need to be quite different because the two business forms pursue different objec-tives. While traditional cooperatives try to maximize the patronage refund, via theprice paid to products supplied by the members, IOF seek to maximize its profits, i e,the returns on capital, given a certain level of risk (Kyriakopoulos, 1997).
The type of ownership, expressed by the structure of property rights and gover-nance, particularly management authority delegated to professional managers and/or
Performance of Traditional Cooperatives: the Portuguese Douro Wine Cooperatives 145
07 Joao Rebelo_01 Blandford 27/12/10 11:29 Página 145

full time directors, is perhaps the best tool to analyze the incentives for the econom-ic agents to create, maintain and improve their assets. Investments in cooperatives areno exception. Drawing from property rights theory, Chaddad and Cook (2004) offera typology of six cooperative models: traditional cooperatives, proportional invest-ment cooperatives, member investor cooperatives, new generation of cooperatives,cooperatives with capital seeking companies and investor share cooperatives, whosemain difference is related to how property rights, in terms of residual claims andresidual rights control, are attributed to economic agents that supply equity to thefirm. These agents can be associated members (simultaneously investors and mainsuppliers of the transformed and commercialized input) or simply investors.
In the traditional cooperative model the ownership rights are restricted to member-patrons, residual return rights are non-transferable, non-appreciable and (partially)redeemable and benefits (surplus) are distributed among members in proportion topatronage (proportionally to the products delivered to the cooperative).
In the proportional cooperative model, property rights are restricted to members,nontransferable, non-appreciable and redeemable, but members are expected to investin the cooperative in proportion to patronage. In member-investor cooperatives’returns to members are distributed in proportion to shareholdings in addition topatronage. In new generation cooperative model, property rights are in the form oftradable and appreciable delivery rights restricted to current member-patrons.
An alternative is to amplify the ownership rights linked to equity capital of non-members, sharing profits and eventually control rights with outside investors who arenot necessarily patrons of the cooperative, and thus may have diverging interestsbetween the two groups. The most radical transformation is the conversion of thecooperative to IOF. A strategy of the unit is to choose not to continue as a user-ownedand controlled organization, with the residual claim and control rights reassignedamong the firm’s stakeholders. Alternatively cooperatives may acquire risk capitalfrom outside investors, i.e. from capital seeking entities or investor shareholders. Inthe first case, investors acquire ownership rights in a separate legal entity or partlyowned by the cooperative, with the outside investor not directly introduced in thesame, but rather in trust companies, strategic alliances, or a publicly held subsidiary.In investor share cooperatives investors receive ownership rights in addition to own-ership rights held by member patrons. In both models the shares are assigned to dif-ferent ownership groups.
The choice of the better organizational model is strictly linked to the performance,whose measurement is the ongoing process toward achieving pre-determined objec-tives (Bourne et al., 2003). In agricultural marketing cooperative, which is a mix ofvertical integration and horizontal coordination, the difficulties start with the conceptof the firm and continue with the definition and alignment of economic objectives.Generally, the dominant viewpoint in the economic literature is to consider agricul-tural cooperative as user-owned and user controlled organization that aims to benefitits member-patrons, coexisting internally as different groups of stakeholders, namelymembers and managers, each one with its own economics objectives, not necessaryaligned.
146 João Rebelo, José Caldas and Scott C. Matulich
07 Joao Rebelo_01 Blandford 27/12/10 11:29 Página 146
Rafat et al. (2009) present an ample review of the theoretical and empirical eco-nomic literature on the performance of agricultural marketing cooperatives. Theyconclude that empirical studies have failed1 to address cooperative objectives as rep-resented by the theoretical literature. Based on an overview of the studies on eco-nomic behavior and on a list of empirical works on the performance of agriculturalmarketing cooperatives presented by those authors, it is clear that the research on thetopic is mainly focused on: (a) implementing the behavior model of cooperative as aprofit-maximizing firm; (b) the use of financial ratios or frontier approach to analyzeperformance; (c) cooperatives located on USA; (d) the dairy sector that has beenintensively studied.
To analyze the influence of different stakeholders’ behavior on performance, thecoalition theory (Staatz, 1983) assumes that agricultural cooperative consists of manygroups, with each one attempting to maximize their individual utility, often at expens-es of others groups. The game of allocating costs and benefits among groups can becooperative or non-cooperative. In a traditional cooperative (Rebelo et al., 2008) it isexpected that members try to maximize the price they receive for the products thatthey deliver, being the performance measured by the financial ratio between patron-age refund and gross revenue.
According to the general formulation of the principal-agent model (Fama andJensen, 1983a and 1983b), if members are not able to monitor and enforce managersbehavior, it is expected that these ones have incentive to maximize their utility insteadof the members’. It is especially true in the case of traditional cooperatives, wheremanagers are compensated on fixed wages, not on profitability, and it is expected thatmangers pursue risk minimizing strategies rather than return to members. In deter-mining the cooperative capital structure (another indicator of performance) managersare expected to show a preference for equity, because high leverage increases thebankruptcy risk of the cooperative. Hence the hypothesis is that when managers withpower effectively influence the capital structure, the cooperative is less leveraged.
The empirical studies that dominate the literature, concerning the financial per-formance of agricultural cooperatives uses financial ratios (Rafat et al., 2009).Otherwise, the interpretation and the expectation of the financial ratio depend on theauthors’ objective and on the definition of each value (Gentzolanis, 1997). Forinstance, in traditional agricultural cooperatives, it is expected they are less leveragedwhen managed by professional managers and/or full time directors, and the patron-age refund decrease when managed by professional and/or full time directors.
Performance of Traditional Cooperatives: the Portuguese Douro Wine Cooperatives 147
1 The lack of empirical application can be explained as a result of difficulty in obtaining relevantdata (if they exist at all), lack of interest on the part of applied economists, or lack of theoretical approa-ches that are well developed for empirical application (Rafat et al., 2009: 457).
07 Joao Rebelo_01 Blandford 27/12/10 11:29 Página 147

3. The Douro Wine Cooperatives2
The Douro Demarcated Region is situated in the northeast part of Portugal, on thesteep hills3 of the Douro Valley and its tributaries. In 1756, this region was demarcat-ed to protect the quality of Douro wines against the competition of other Portuguesewines. This was a pioneering decision at a world level, both in concept and regulat-ing principles of controlled denominations of origin. Despite the geographical, insti-tutional and administrative changes, the DDR constitutes a region with a collectivememory, with a strong tradition of grape farming and socio-economic specific char-acteristics, classified as a world heritage site by UNESCO in 2001.
The DDR comprises an area of 250,000 hectares; vineyards occupy about 18% ofthe land. There are 257,100 inhabitants, with a population density of 46.62 inhabi-tants per km
2. In the last 40 years, the region lost 40% of its population; the remain-
der is aging. In the last five decades, important changes occurred in the supply chain of both
Port and Douro wine. The industry is becoming horizontally/vertically integrated.The formation of wine cooperatives produced significant changes in the supply chain,becoming intermediaries of viticulturists and traders. Until the end of the 80s, andcoinciding with the entrance of Portugal in the EU, these cooperatives were mainlyfocused in the vinification and storage activities, selling almost all of their wine pro-duction in bulk to warehouses and traders. Market liberalization, followed entranceof Portugal into the EU, in 1986. Wine cooperatives began to market wine in bottles,especially Douro table wine.
Port and Douro wines followed a different evolution, especially during the lastthirty years. Firm concentration accelerated in the Port sector (Rebelo and Correia,2008) along with upstream integration of commercial firms who planted new vine-yards and built new vinification centres. These changes led many viticulturists, par-ticularly the small and medium size ones, to concentrate on grape production in thehighly regulated, quota environment of Port production. In the case of the Douro tablewines, entrance into the EU began a phase of downstream vertical integration. Largerviticulturists became producer-bottlers, yielding so-called wine of the quinta (farm).Some of the wines quickly achieved domestic and international reputation. Nichemarketing provided important opportunities for wines that were traditionally less val-ued in DDR. However, most Douro table wines are grown by very small farmers, whoare organized through cooperatives following the traditional cooperative principles.
148 João Rebelo, José Caldas and Scott C. Matulich
2 Data used in this paper was collected both from the annual reports/accounting of cooperatives andfrom three questionnaires to cooperative directors elaborated and conducted by the co-author Rebelo in1990, 1998 and 2007. These questionnaires included sets of quantitative (e.g. socio-economic characteri-zation of members) and qualitative (e.g., what strategy do de DDR-WCs adopt) open and closed ques-tions. The publication Quartenaire Portugal/UCP (2007), in which Rebelo participated, includes in annexa version of this questionnaire.
3 Most of the vineyards are situated in steep hills. By decreasing order of slope, the 45,371 ha of vi-neyards are distributed in the following way: 6,792 ha (>45%), 13,239 ha (30%-45%), 14,349 ha (15%-30%), 9,786 ha (5%-15%) e 1,205 ha (<5%).
07 Joao Rebelo_01 Blandford 27/12/10 11:29 Página 148

In 2007, 19,884 viticulturists were members of the 20 DDR-WCs (both Port andDouro table wine). Average vineyard size was less than one hectare. Moreover, mostof them are part-time viticulturists whose objective is to complement other sources ofincome. They tend to view the cooperative as an organisation to which they can selltheir grapes and not as a firm in which they are the owners. This behaviour generateshigh transactions costs, problems in equity acquisition and redemption, and difficul-ties in developing clear entrepreneurial strategies that are responsive to changing mar-kets.
The number of DDR-WCs decreased from 22 to 20 during the last 20 years. Thesecooperatives vinify 56% of Douro wine, 37% of Port wine and, consequently, 46% ofboth types of wines. Many of the cooperatives produce both Port and table wines.
A reduction in the Port wine production-quota has contributed the relatively pooreconomic performance of the cooperatives over the past few years. Graph 1 showsthat Port wine grapes traditionally enjoy a three-fold premium above Douro tablewine grapes, so that the reduction in quota is particularly painful to the DDR-WCsmembers. Additional economic pressure is coming from a sharp drop in all winegrape prices that is largely attributable to the worldwide wine surplus. Both factorshave contributed to members leaving DDR-WCs in recent years, some of them withthe typical free-rider behaviour.
Performance of Traditional Cooperatives: the Portuguese Douro Wine Cooperatives 149
The distribution of land is shown in Table 1. The 45,160 ha of DDR vineyards aredistributed among the 39,506 viticulturists, for an average farm size of just 1.14ha/farm. Note that roughly 35% of the DDR vineyards are owned by just 810 viticul-turists, each with more than 8 ha of vines. The average farm size for this group isaround 19.7 ha. Most of these farms belong to producers-bottlers and traders of Portwine. In contrast, small and medium size viticulturists are mostly members of DDR-WCs.
TABLE 1
Number of Farmers and Farm Size in DDR
Area Number Viticulturists % Ha Size %
Until 0,5 ha 23,743 60.1 4,221 9.3
From 0,5 ha to 2 ha 11,162 28.3 11,260 25.0
From 2 ha to 5 ha 3,134 7.9 9,649 21.4
From 5 ha to 8 ha 657 1.7 4,074 9.0
From 8 ha to 10 ha 201 0.5 1,802 4.0
More than 10 ha 609 1.5 14,154 31.3
Total 39,506 100.0 45,160 100.0
Source: Quaternaire Portugal / UCP (2007).
07 Joao Rebelo_01 Blandford 27/12/10 11:29 Página 149

The multiproduct structure of DDR-WCs is reflected not only in their composi-tion but also in the change in asset structure experienced over the past few years(Graph 2). Inventory grew at the expense of other assets, for more than a decade. Inthe last data year, 2006, the value of the Total Assets, around 218 million euro, wasallocated 30.6% to Fixed Assets, 46.4% to Inventory and 23% to Other Assets. Theabsolute value of inventories no doubt reflects seasonality of the data3 but the changein relative share is not seasonally influenced, which may reflect difficulties in sellingDouro wines in a more competitive market. Total equity peaked at 30.1% in 1998,slowly decreasing thereafter.
The sales and gross revenue of DDR-WCs peaked in 2001 (100.3 and 119.2 mil-lion euro, respectively), decreasing in the following years, reaching in 2006 a valueof 74.5 and 76.8 million euro, respectively. Roughly half of the sales and gross rev-enue belonged to the three largest Port-dominated WCs.
Not surprisingly, the value of Subsidiary and Raw Materials has been decreasingsince 2002 (Graph 3). In 2006, they dropped to 57 million euro or 74.3% of Gross
150 João Rebelo, José Caldas and Scott C. Matulich
2 The large proportion of Inventory in Total Assets may be explained by the fact that accounting va-lues are computed in December 31, before most of Port wine harvested is sold, reflecting a certain seaso-nality. From the analysis of the Debt, the corresponding seasonality is reflected in the value of the debts tomembers and bank loans.
GRAPH 1
Average Prices per Kilogram Paid for Grapes from Douro and Port Wines,1987-2006
Years
Douro Wine Port Wine
Source: Own elaboration.
1,60
1,40
1,20
1,00
0,80
0,60
0,40
0,20
0,00
Eu
ros
1987 1989 1991 1993 1995 1997 1999 2001 2003 2005
07 Joao Rebelo_01 Blandford 27/12/10 11:29 Página 150

Performance of Traditional Cooperatives: the Portuguese Douro Wine Cooperatives 151
Revenue. The high proportion of Raw Materials to Goss Revenue indicates that, over-all, the DDR-WCs are generating little value added production. This inference is con-sistent with the fact that most of the wines, especially the greater value Port wines,are sold in bulk.
Labour Costs have been increasing in recent years, peaking in 2006 at 5.6 millioneuro (7.3% of Gross Revenue). A similar relation exists with Other Costs that reached6.5 million euro in 2006 (8.5% of Gross Revenue).
GRAPH 2
Relative trend of Total Assets Structure and Equity, 1987-2006
Years
Fixed assets Inventory Equity Other assets
Source: Own elaboration.
70%
60%
50%
40%
30%
20%
10%
0%1987 1989 1991 1993 1995 1997 1999 2001 2003 2005
GRAPH 3
Relative Weight of Costs and Net Profit in the Gross Revenue, 1987-2006
Years
Raw MaterialsInterest Expenses
Labour CostsDepreciation Costs
Other CostsNet Profit
Source: Own elaboration.
1,00
0,80
0,60
0,40
0,20
0,00
-0,20
1987 1989 1991 1993 1995 1997 1999 2001 2003 2005
07 Joao Rebelo_01 Blandford 27/12/10 11:29 Página 151

Each of the above financial and economic indicators point to the same conclusion:economic viability of the industry is at risk. In the context of a global economy, achange in cooperative property rights and governance structure must be forthcoming orbankruptcy of DDR-WCs seems imminent and consistent with global industry trends.
The 2007 questionnaire to cooperative directors revealed several socio-economicfactors that portend additional difficulties for DDR-WCs governance and survival.
Member education. Most (69.2%) attended only primary school; 11.6% do notknow how to read and write. Only 12.9% completed the obligatory level of school-ing; only 4.7% completed the high-school; and only 1.7% completed a universityor similar degree. This education level suggests a member profile that tends to berisk adverse.Member age. The largest percentage (48.3%) of the members is 40 to 60 yearsand 38.9% are more than 60 years old. Only 13% of cooperative members areunder 40 years old. This age profile orients members toward a very short run per-spective. Member involvement in cooperative decision making. 90% of cooperativedirectors agreed (30% strongly agreed) that members behave in their narrow self-interest, performing like private sellers of grapes when they sell their grapes to thecooperative. Similarly, 90% of the directors believed that members favour shortrun returns over long run growth. Full-time or part-time management. Most of the DDR-WCs directors (64%)only work part time. In addition to the directors, 50% of DDR-WCs have a fulltime manager/administrator. Both full time directors’ and managers’ returnsdepend on a fixed wage unrelated to their performance. Accordingly, one wouldexpect the hired managers and full time directors to pursue risk minimising strate-gies of reinforcing equity rather than return to members.In summary, the socio-economic characteristics of DDR-WCs members show, on
the one hand, an inability of individual viticulturists to vertically integrate. They sim-ply are too small to do so. On the other hand, their age and education profile seemsto leave them incapable of making collective growth decisions that require long-runinvestment and risk taking, at the expense of short-run returns from grape sales to thecooperative. Most DDR-WCs appear to be hopelessly trapped in a risk averse, tradi-tional cooperative model, with minimal professional governance to address the chal-lenges of a global wine economy. If DDR-WCs are to survive in a competitive worldwine market, a change in cooperative model may be essential. Although, based onpanel data model, the econometric analysis provided in the next section may clarifythe influence of governance and size on two alternative indicators of performance.
4. Econometric Analysis of DDR-WCs Performance
Each of the socio-economic factors discussed above helps to define an economet-ric specification of DDR-WCs behaviour and performance within alternative objec-tives of a cooperative. If the cooperative objective is to maximize the short run finan-cial benefits of the members (Sexton and Iskow, 1988), the patronage refund rate (PP),
152 João Rebelo, José Caldas and Scott C. Matulich
07 Joao Rebelo_01 Blandford 27/12/10 11:29 Página 152
measured as patronage refund (PR) divided by gross revenue (R), is an appropriate per-formance indicator. On the other hand, the equity/total asset ratio (EA) may be a moreappropriate performance indicator in the presence of professional management. A pro-fessional manager this will change to manager should prefer a capital structure thatfavors equity accumulation over debt because highly leveraged cooperatives risk bank-ruptcy (Murray, 1983).
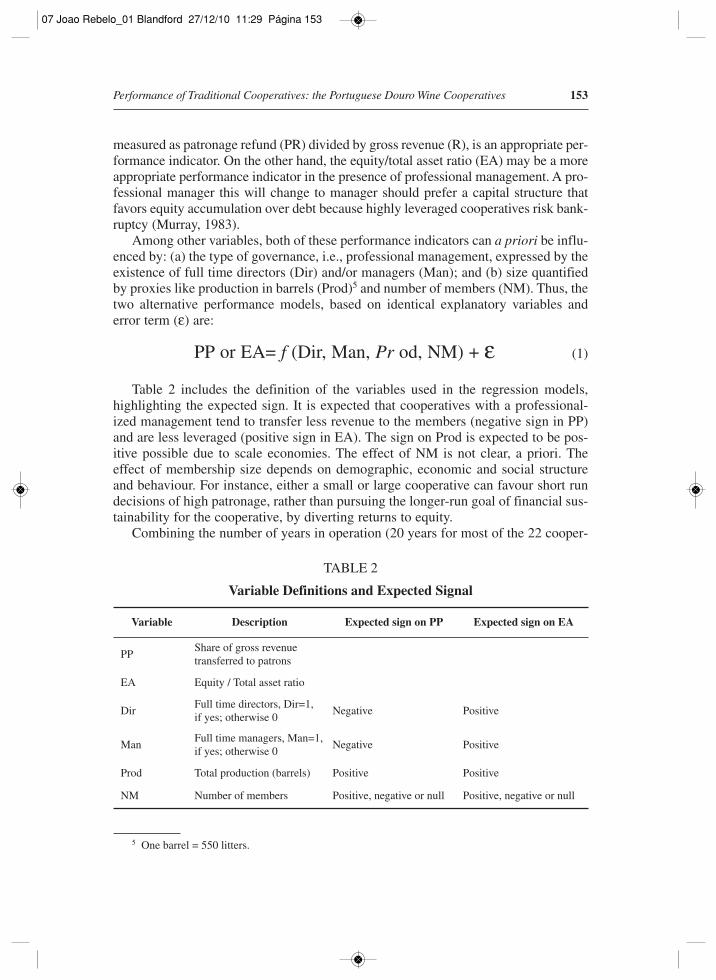
Among other variables, both of these performance indicators can a priori be influ-enced by: (a) the type of governance, i.e., professional management, expressed by theexistence of full time directors (Dir) and/or managers (Man); and (b) size quantifiedby proxies like production in barrels (Prod)5 and number of members (NM). Thus, thetwo alternative performance models, based on identical explanatory variables anderror term (ε) are:
PP or EA= f (Dir, Man, Pr od, NM) + ε (1)
Table 2 includes the definition of the variables used in the regression models,highlighting the expected sign. It is expected that cooperatives with a professional-ized management tend to transfer less revenue to the members (negative sign in PP)and are less leveraged (positive sign in EA). The sign on Prod is expected to be pos-itive possible due to scale economies. The effect of NM is not clear, a priori. Theeffect of membership size depends on demographic, economic and social structureand behaviour. For instance, either a small or large cooperative can favour short rundecisions of high patronage, rather than pursuing the longer-run goal of financial sus-tainability for the cooperative, by diverting returns to equity.
Combining the number of years in operation (20 years for most of the 22 cooper-
Performance of Traditional Cooperatives: the Portuguese Douro Wine Cooperatives 153
5 One barrel = 550 litters.
TABLE 2
Variable Definitions and Expected Signal
Variable Description Expected sign on PP Expected sign on EA
PP Share of gross revenuetransferred to patrons
EA Equity / Total asset ratio
DirFull time directors, Dir=1, if yes; otherwise 0
Negative Positive
ManFull time managers, Man=1,if yes; otherwise 0
Negative Positive
Prod Total production (barrels) Positive Positive
NM Number of members Positive, negative or null Positive, negative or null
07 Joao Rebelo_01 Blandford 27/12/10 11:29 Página 153

atives), is obtained an unbalanced panel corresponding to 430 observations. Table 3presents the descriptive statistics that correspond to total observations. The valuesclearly show heterogeneous performance and different structures of governance andsize. On average, patronage accounts for 82% of the annual gross revenue generatedby DDR-WCs, with a high concentration (coefficient of variation 14.6%) around themean. The capital structure observed is 25%, however the coefficient of variation(56%) indicates a relatively high dispersion and amplitude. Throughout the observedperiod, 13 cooperatives have a professionalized management (full time director andor manager): 8 have only full time directors; 11 have only a manager; and 6 have both.
The total production (an average of 4,953 barrels and coefficient variation of94.4%) and the number of members (mean of 615 and coefficient of variation of62.3%) indicates heterogeneous sizes.
154 João Rebelo, José Caldas and Scott C. Matulich
6 Ignoring serial correlation (and/or heteroskedasticity) when it is present results in consistent butinefficient estimates of the regression coefficients and biased standard errors.
TABLE 3
Descriptive Statistics of the Variables
Variable Mean StandardDeviation Minimum Maximum
PP = Share of gross revenue transferred to patrons
0.82 0.12 0.03 1.39
EA = Equity/Total asset ratio 0.25 0.14 -0.69 0.74
Dir = Full time director 0.35 0.48 0.00 1.00
Man = Full time managers 0.37 0.49 0.00 1.00
Prod = Total production (barrels) 4,953 4,675 232 33,495
NM = Number of members 615 383 150 2,072
Considering the benefits from using panel data (Baltagi, 2009; Greene, 2003), bothlinear regression models are estimated applying this approach. The econometric pro-cedure started with the estimation of the random effects and fixed effects models.Three statistical tests were conducted: (1) a Hausman test was conducted to test thehypothesis that the random effects are uncorrelated with the other regressors, (2) aWald test was conducted to determine the existence of panel heteroskedasticity and (3)a Woolridge test for first order serial correlation in panel data models was conducted.
From the application of the Hausman test, the hypothesis that the individualeffects are uncorrelated with the other regressors in the model is rejected, i.e., the ran-dom effects models are not the best choice, because the estimators become biased andinconsistent. Additionally, the Wooldridge test allows the acceptance of the nullhypothesis of inexistence of first order serial correlation6 and the Wald test indicatesthat the inexistence of groupwise heterocskedasticity cannot be rejected.
07 Joao Rebelo_01 Blandford 27/12/10 11:29 Página 154
Performance of Traditional Cooperatives: the Portuguese Douro Wine Cooperatives 155
7 Within the fixed effects models the computation of Likelihood Ratio tests suggest the use of oneway fixed group effects for cooperatives.
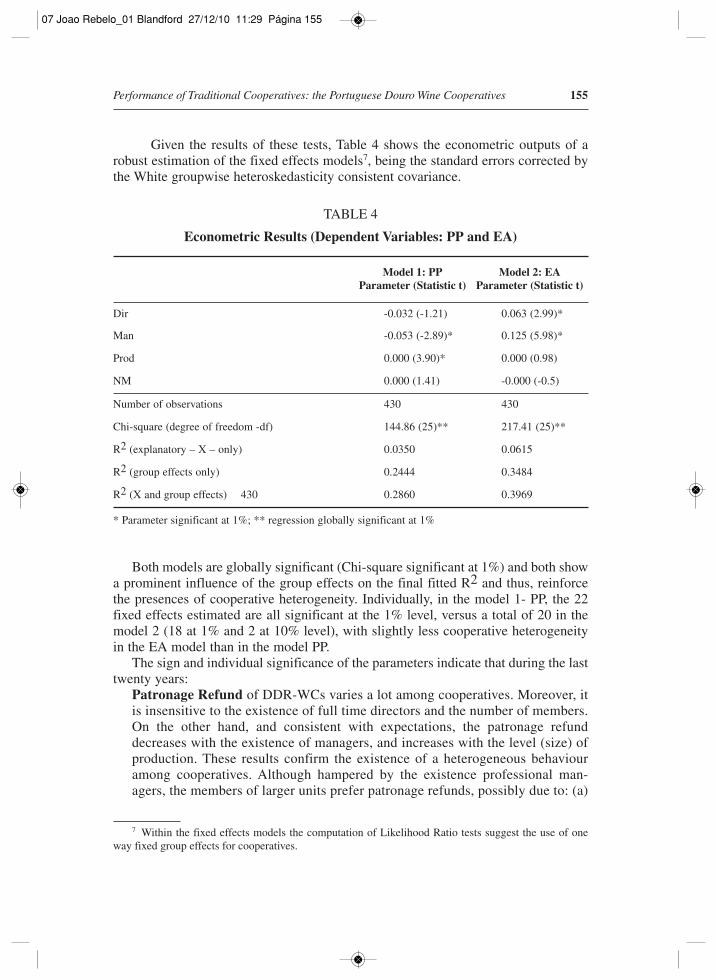
Given the results of these tests, Table 4 shows the econometric outputs of arobust estimation of the fixed effects models7, being the standard errors corrected bythe White groupwise heteroskedasticity consistent covariance.
TABLE 4
Econometric Results (Dependent Variables: PP and EA)
* Parameter significant at 1%; ** regression globally significant at 1%
Model 1: PPParameter (Statistic t)
Model 2: EAParameter (Statistic t)
Dir -0.032 (-1.21) 0.063 (2.99)*
Man -0.053 (-2.89)* 0.125 (5.98)*
Prod 0.000 (3.90)* 0.000 (0.98)
NM 0.000 (1.41) -0.000 (-0.5)
Number of observations 430 430
Chi-square (degree of freedom -df) 144.86 (25)** 217.41 (25)**
R2 (explanatory – X – only) 0.0350 0.0615
R2 (group effects only) 0.2444 0.3484
R2 (X and group effects) 430 0.2860 0.3969
Both models are globally significant (Chi-square significant at 1%) and both showa prominent influence of the group effects on the final fitted R2 and thus, reinforcethe presences of cooperative heterogeneity. Individually, in the model 1- PP, the 22fixed effects estimated are all significant at the 1% level, versus a total of 20 in themodel 2 (18 at 1% and 2 at 10% level), with slightly less cooperative heterogeneityin the EA model than in the model PP.
The sign and individual significance of the parameters indicate that during the lasttwenty years:
Patronage Refund of DDR-WCs varies a lot among cooperatives. Moreover, itis insensitive to the existence of full time directors and the number of members.On the other hand, and consistent with expectations, the patronage refunddecreases with the existence of managers, and increases with the level (size) ofproduction. These results confirm the existence of a heterogeneous behaviouramong cooperatives. Although hampered by the existence professional man-agers, the members of larger units prefer patronage refunds, possibly due to: (a)
07 Joao Rebelo_01 Blandford 27/12/10 11:29 Página 155

ill-defined property rights in the cooperative; (b) one-person, one-vote decisionmaking or (c) stronger economic dependence on the viticulture. The patronagerefund model leaves unanswered the question as to how long WCs can continuethe Mediterranean-style cooperative behavior before succumbing to increasedcompetition from the globalized wine industry.Equity/Total Asset Ratio is insensitive to size, whether measured by total pro-duction or number of members. Both the existence of full time directors and man-agers is able to influence positively cooperative capital structure, as indicated bythe significance and the positive coefficient of the respective variables. The DDR-WCs with professional management followed a strategy of equity reinforcementto finance their assets, appearing to be more competitive in the long-run and ableto assume long run risk investments.Summing up, the empirical results support the theoretical framework. The gover-
nance structure has opposite effects on the indicators of performance. When full-timedirectors and managers have bargaining power, cooperatives transfer less revenue tomembers and try to decrease leverage.
5. Final Remarks
Like many agricultural cooperatives, the DDR-WCs increasingly face survivalchallenges related to financial issues that are linked to acquiring and redeeming mem-ber equity capital, which can be a constraint on growth and sustainability. Increasedglobal competition accentuates these challenges.
This paper attempted to garner insight into the question of cooperative sustain-ability by examining the effects of professional managers and full time directors. Theanalysis is based on the assumption that DDR-WCs follow the traditional cooperativemodel, only some of which have full time directors and/or managers.
Two alternative performance indicators, patronage refund and capital structure,were modelled. The results differ according to performance indicator. If the DDR-WCs attempt to apply a short-run strategy of maximizing the revenues transferred topatrons/members, the cooperative should not be managed by professional managersand will increase the size, benefiting of possible scale economies. If, however, theobjective is to follow a long run strategy of improving the leverage, the cooperativeshould be run by a professional management. These results reinforce the belief thatcooperatives structured differently have different and conflicting stakeholder inter-ests. Cooperatives with non-professional management tend to maximize annual rev-enues from the grape production; cooperatives with professional directors/managersseek to reinforce equity, with a risk minimizing strategy.
The general results of our analysis suggest the cooperative organisation adoptedby DDR-WCs may not be sustainable in the more competitive global wine markets,if they follow a practice of maximum patronage refund, which reduces their capacityto improve leverage and to acquire profitable, but risky, long -run investments withequity. Structural reorganization of the centuries old, atomistic Douro wine industry
156 João Rebelo, José Caldas and Scott C. Matulich
07 Joao Rebelo_01 Blandford 27/12/10 11:29 Página 156

Performance of Traditional Cooperatives: the Portuguese Douro Wine Cooperatives 157
may be essential if adequate investment in new products and international markets areto be fully incorporated in the decision making process8.
References
Baltagi, B.H. (2009). Econometric Analysis of Panel Data. Fourth edition, John Wiley& Sons Ltd, Chichester, UK.
Bourne, M., A. Neely, J. Mills and K. Platts (2003). “Implementing Performancemeasurement Systems: A Literature Review”. International Journal BusinessPerformance Management, 5(1): 1-24.
Chaddad, F. and M. Cook (2004). “Understanding New Cooperative Models: AnOwnership-Control Rights Typology”. Review of Agricultural Economics, 26(3):348-360.
Cook, M. and C, Iliopoulos (2000). “Ill-defined Property Rights in Collective Action:The Case of Agricultural Cooperatives”. In C. Menard (Ed.): Institutions,Contracts and Organizations: Perspectives from New Institutional Economics:335-348. Edwards Elgar, London.
Fama, E. and M.C. Jensen (1983a). “Separation of Ownership and Control”. Journalof Law and Economics, 26(2): 301-327.
Fama, E. and M.C. Jensen (1983b). “Agency Problems and Residual Claims”.Journal of Law and Economics, 26(2): 327-349.
Gentzoglanis, A. (1997). “Economic and Financial Performance of Cooperative andInvestor-Owned Firms: Am Empirical Study”. In J. Nilson and G. Van Dijk (Eds.):Strategies and Structures in the Agro-Food Industries: 171-183. Assen VanGorcum.
Greene, W. (2003). Econometric Analysis. Prentice-Hall, New Jersey, USA.Kyriakopoulos, K. (1997). The Market Orientation of Cooperative Organizations.
University of Nyenrode, Netherlands.Murray, G. (1983). “Management Strategies for corporate control in British agricul-
tural cooperatives”. Agricultural Administration, 14: 51-63 (Part I)*; 81-91 (PartII).
OIV (2008). State of Viticulture World Report. International Organization of Vine andWine, www.oiv.int.
Quaternaire Portugal/UCP (2007). Plano Estratégico para os Vinhos comDenominação de Origem Controlada Douro, Denominação de Origem Porto eIndicação Geográfica Terras Durienses da Região Demarcada do Douro. IVDP,Porto, Portugal.
Rafat, S., A. Lansink, G. Giesen and G. van Dijk (2009). “Performance Measurementof the Agricultural Marketing Cooperatives: The Gap between Theory andPractice”. Review of Agricultural Economics, 31(3): 446-469.
Rebelo, J. and L. Correia (2008). “Port Wine Dynamics: Production, Trade and
8 This conclusion was reiterated by the directors of the DDR-WCs when surveyed in 2007.
07 Joao Rebelo_01 Blandford 27/12/10 11:29 Página 157

Market Structure”. Regional and Sectoral Economic Studies, 8(1): 99-114.Rebelo, J., J. Caldas and S.C. Matulich (2008). “Manager Power, Member Behaviour
and Capital Structure: Portuguese Douro Wine Cooperatives”. AgriculturalEconomics Review, 9(2): 5-13.
Remaud, H. and J. Couderc (2006). “Wine Business Practices: A New Versus OldWine Perspective”. Agribusiness, 22(3): 405-416.
Sexton, R.J. and J. Iskow (1988). Factor Critical to Success or Failure of EmergingAgricultural Cooperatives. Department of Agricultural and Resource Economics,University of California, Davis, Report No 88-3.
Staatz, J. (1983). “The Cooperative as a Coalition: A Game Theoretic Approach”.American Journal of Agricultural Economics, 65(5): 1085-1089.
158 João Rebelo, José Caldas and Scott C. Matulich
07 Joao Rebelo_01 Blandford 27/12/10 11:29 Página 158