performance of various pavement repairs in low …docs.trb.org/prp/13-4208.pdf · 1 performance of...
TRANSCRIPT

Dessouky et al.
1
Performance of Various Pavement Repairs in Low-Volume 1
Roadways over Expansive Soil 2
3 4
Samer H. Dessouky, PE, PhD 5 Assistant Professor, Department of Civil and Environmental Engineering 6
University of Texas at San Antonio 7 One UTSA Circle, San Antonio, TX 78249 8
Voice: (210) 458-7072, Fax: (210) 458-6475 9 [email protected] 10
11 Jeong Ho Oh, PE, PhD 12
Assistant Research Engineer, Texas Transportation Institute 13 Texas A&M University 14
College Station, TX 77843 15 Voice: (979) 862-1586 16
[email protected] 17 18
Mark Bourland, PhD 19 Assistant Professor, Department of Civil Engineering 20
Lamar University 21 Beaumont, TX77710 22
[email protected] 23 24
Mohammed Ilias 25 Graduate student, Department of Civil Engineering 26
North Carolina State University 27 Raleigh-Durham, NC 27607 28
[email protected] 29 30
Sang Ick Lee, PhD 31 Post-Doctoral Research Associate, Texas Transportation Institute 32
Texas A&M University 33 College Station, TX 77843 34
[email protected] 35 36
Daewook Park, PE, PhD 37 Associate Professor, Department of Civil Engineering 38
Kunsan National University 39 Daehak ro 558, Kunsan, Chellabuk-Do, 573-701, South Korea 40
Voice: 82-63-469-4876 41 [email protected] 42
43 44
Transportation Research Board 45 92nd Annual Meeting 46 January 13–17, 2013 47
Washington, D.C. 48
TRB 2013 Annual Meeting Paper revised from original submittal.
Dessouky et al.
2
ABSTRACT 1 2 Expansive soil is considered one of the most common causes of pavement distresses. Depending 3 upon the moisture level, expansive soils will experience changes in volume due to moisture 4 fluctuations from seasonal variations. The objective of this research was to evaluate existing 5 repair projects on selected roadways. Those roadways experienced failures in the form of fatigue 6 and rutting in the wheel path, and longitudinal (faulted) cracking including edge cracking. The 7 causes of those failures were mainly linked to high plasticity expansive soil and narrow 8 pavement. The study involved visual survey, field and laboratory testing, surface condition/ride 9 data and structural design calculations for three project sites. The study concluded, from 3-14 10 years of performance records, that geogrid reinforcement, lime-treated subgrade and cement-11 treated base were found to be effective treatment options for low-volume roadways where high 12 plasticity expansive soil exists. 13 14 15 16 Keywords: Geogrid, Expansive soil, cement-treated base, Lime-treated subgrade, GPR, FWD 17 18 19 20 21 Word Count: 4,600 + 12 FIGURES AND TABLES (250 each) = 7600 22 23 24 25 26 27 28 29 30 31 32 33 34 35 36 37 38 39 40 41
TRB 2013 Annual Meeting Paper revised from original submittal.
Dessouky et al.
3
INTRODUCTION 1 2 High-plasticity expansive soil is considered one of the most common causes of pavement failures 3 (Puppala et al. 2004). Depending upon the moisture level, high-plasticity soils will experience 4 changes in volume due to moisture fluctuations from seasonal variations. During high moisture 5 seasons expansive soil swells underneath pavement structure. Conversely during dry seasons, 6 soil contracts and depends on severity may result in shrinkage cracking. This shrinkage 7 propagates through the pavement structure causing longitudinal, transverse and block cracking 8 and edge failure distresses. Expansive soils located in regions where cool and wet periods 9 followed by hot dry periods are more prone to such distresses. For narrow roadways this type of 10 distress primarily starts from the pavement edge. In addition to the expansion/shrinkage cycles, 11 the lack of lateral support and accumulation of water near the edge and side slope instability are 12 examples of causes that expedite pavement failures. In Texas, the majority of the roadways 13 network is classified as low-volume narrow roads. Those constructed over expansive subgrade 14 experienced frequent maintenance problems. 15 16 Zornberg et al. (2008) grouped the methods used in expansive soils treatments into three 17 categories; Mechanical/chemical stabilization of base and/or soil (e.g., soil lime stabilization and 18 base cement stabilization), geogrid reinforcement and moisture control barriers. The stabilization 19 tends to increase strength and stiffness, reduce swelling, decrease permeability, and moderate 20 suction of the soil (Harris 2008 and Freeman and Little 2002). Geogrid reinforcement tends to 21 increase lateral stiffness of base materials against soil expansion/shrinkage. Vertical barriers are 22 used along the pavement edge to prevent moisture infiltration. 23 24 Studies on lime treatment suggested lime stabilization for subgrade/base materials with a 25 plasticity index (PI) greater than 10 (Little 1995). The main concern with lime treatment is the 26 resulting slow strength gain immediately after application. Due to the necessity of reopening to 27 traffic on the same day, lime treatment may be an option for lightly trafficked FM roads, but is 28 not a good candidate for higher trafficked roads (Sebesta 2002). Using Falling Weight 29 Deflectometer (FWD) and Dynamic Cone Penetrometer (DCP) Harris (2008) suggested that 30 lime-treated soil gains strength after few days of applications. Cement-treated base is one of the 31 most used applications for stabilization. However, the major concern is that it causes 32 block/longitudinal cracking when used over expansive soil, due to a brittle layer formed on a 33 weak subgrade. A laboratory evaluation conducted by Sebesta (2004) and Scullion et al. (2000) 34 suggested that 2-3 percent cement provides adequate strength, durability, and economy for base 35 stabilization. 36 37 The geogrid can also be combined with lime-treatment resulting in an effective method to 38 prevent longitudinal cracking caused by the shrinkage of expansive soil. Chen (2007) proposed a 39 rehabilitation procedure for existing surface treated pavements at high plasticity subgrade areas 40 (PI > 35). In this study geogrid was used over lime- or cement- treated subgrade before the 41
TRB 2013 Annual Meeting Paper revised from original submittal.
Dessouky et al.
4
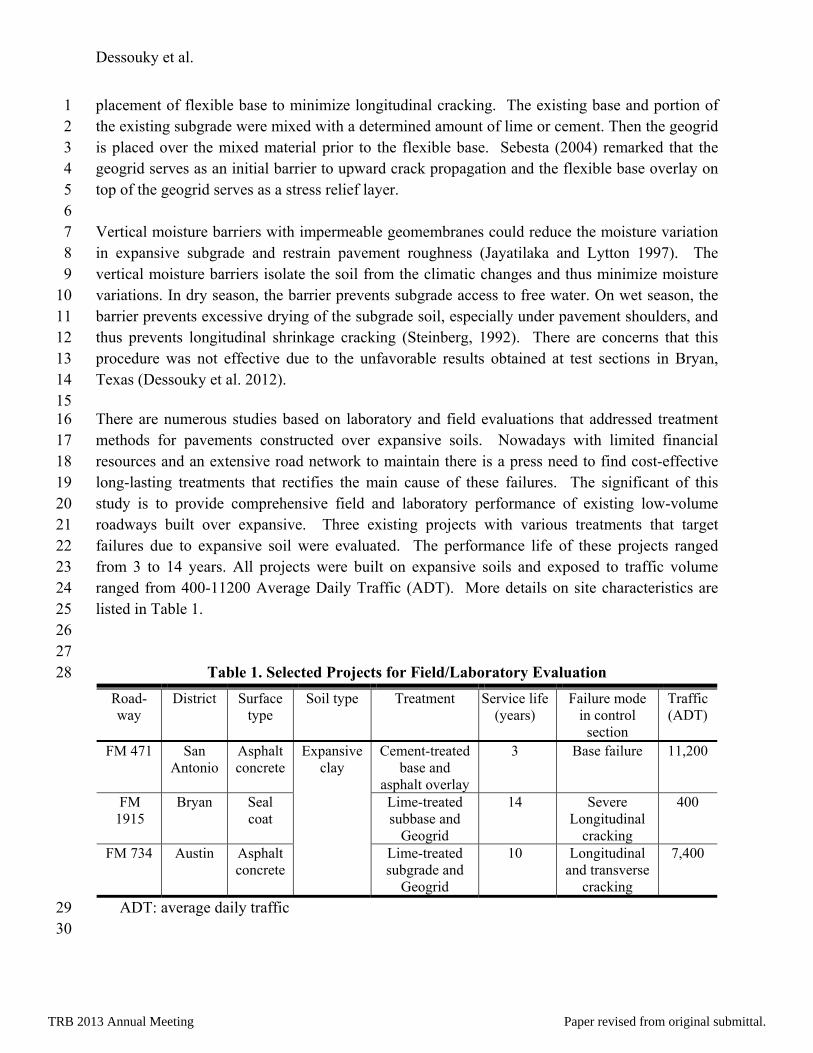
placement of flexible base to minimize longitudinal cracking. The existing base and portion of 1 the existing subgrade were mixed with a determined amount of lime or cement. Then the geogrid 2 is placed over the mixed material prior to the flexible base. Sebesta (2004) remarked that the 3 geogrid serves as an initial barrier to upward crack propagation and the flexible base overlay on 4 top of the geogrid serves as a stress relief layer. 5 6 Vertical moisture barriers with impermeable geomembranes could reduce the moisture variation 7 in expansive subgrade and restrain pavement roughness (Jayatilaka and Lytton 1997). The 8 vertical moisture barriers isolate the soil from the climatic changes and thus minimize moisture 9 variations. In dry season, the barrier prevents subgrade access to free water. On wet season, the 10 barrier prevents excessive drying of the subgrade soil, especially under pavement shoulders, and 11 thus prevents longitudinal shrinkage cracking (Steinberg, 1992). There are concerns that this 12 procedure was not effective due to the unfavorable results obtained at test sections in Bryan, 13 Texas (Dessouky et al. 2012). 14 15 There are numerous studies based on laboratory and field evaluations that addressed treatment 16 methods for pavements constructed over expansive soils. Nowadays with limited financial 17 resources and an extensive road network to maintain there is a press need to find cost-effective 18 long-lasting treatments that rectifies the main cause of these failures. The significant of this 19 study is to provide comprehensive field and laboratory performance of existing low-volume 20 roadways built over expansive. Three existing projects with various treatments that target 21 failures due to expansive soil were evaluated. The performance life of these projects ranged 22 from 3 to 14 years. All projects were built on expansive soils and exposed to traffic volume 23 ranged from 400-11200 Average Daily Traffic (ADT). More details on site characteristics are 24 listed in Table 1. 25 26 27
Table 1. Selected Projects for Field/Laboratory Evaluation 28
Road-way
District Surface type
Soil type Treatment Service life (years)
Failure mode in control
section
Traffic (ADT)
FM 471
San Antonio
Asphalt concrete
Expansive clay
Cement-treated base and
asphalt overlay
3 Base failure 11,200
FM 1915
Bryan Seal coat
Lime-treated subbase and
Geogrid
14 Severe Longitudinal
cracking
400
FM 734 Austin Asphalt concrete
Lime-treated subgrade and
Geogrid
10 Longitudinal and transverse
cracking
7,400
ADT: average daily traffic 29 30
TRB 2013 Annual Meeting Paper revised from original submittal.

Dessouky et al.
5
1 PROJECT SITES AND VISUAL SURVEY 2 3 At each project site, one control section and at least one repaired section were identified. Figure 4 1 describes the structural design of each section. Letter “C” refers to Control section, “R” refers 5 to Reconstruction and “O” refers to Overlay. 6
7 The FM 1915 site is one of the earlier efforts constructed in Bryan District to rehabilitate rural 8 roadways using geogrid reinforcement. All sections in the site have 10 inch lime treated subbase 9 (5 percent lime), granular base layer and a seal coat surface. The FM 471 site consists of three 10 sections, control, reconstruction and overlay. The reconstructed section was built to sustain high 11 ESALs truck loading. Cement treatment was used to stabilize the base layers and two layers of 12 asphalt concrete (AC) were used. The overlay section was constructed to improve ride quality 13 and skid resistance. The base layer was reworked and a new 3 inch AC was applied. The control 14 and overlay sections consist of a two-layer structure while the reconstructed section consists of a 15 three-layer structure including two AC layers (base and surface course layers). FM 734 is a 16 divided two-direction four-lane highway consists of two sections; control (734-C) and geogrid-17 reinforced (734-R). Both sections have lime-treated subgrade to reduce shrinkage cracking. 18 Severe surface cracking is evident in the control section with poor ride quality while the geogrid 19 section has only minor surface cracking. Complete summary of visual survey is shown in Table 20 2. 21 22 23
24 Figure 1. Schematic diagram of the projects structural design 25
26 27 28
High Plasticity Subgrade
2‐4” AC
8.5” base 8“ Cement treated‐base
3” AC
10“ base
471‐C 471‐R 471‐O 1915‐R2 1915‐C 1915‐R1 734‐R 734‐C
6” AC base course
2“ AC5” base 8” base8” base
Seal coat
Lime‐treated Subgrade
10” base
8” AC
10” base
8” AC
Geogrid
AC: Asphalt concrete surface layer
10“ Lime‐treated subbase
TRB 2013 Annual Meeting Paper revised from original submittal.
Dessouky et al.
6
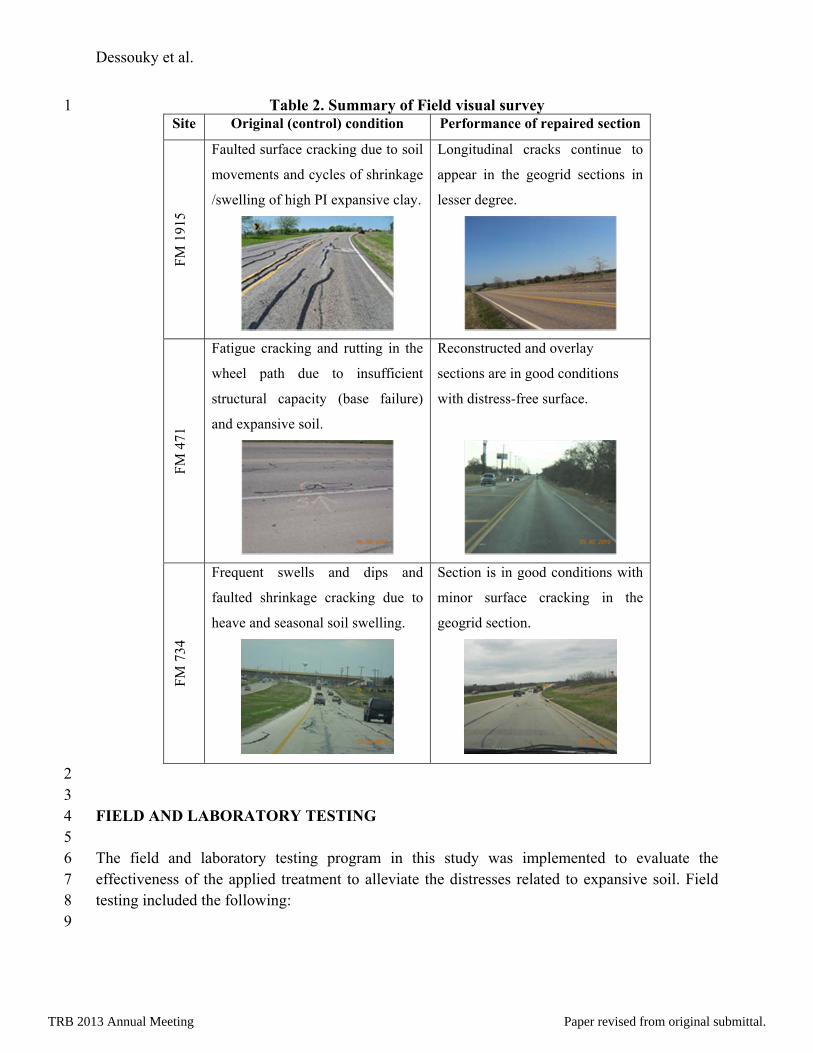
Table 2. Summary of Field visual survey 1 Site Original (control) condition Performance of repaired section
FM
191
5
Faulted surface cracking due to soil
movements and cycles of shrinkage
/swelling of high PI expansive clay.
Longitudinal cracks continue to
appear in the geogrid sections in
lesser degree.
FM
471
Fatigue cracking and rutting in the
wheel path due to insufficient
structural capacity (base failure)
and expansive soil.
Reconstructed and overlay
sections are in good conditions
with distress-free surface.
FM
734
Frequent swells and dips and
faulted shrinkage cracking due to
heave and seasonal soil swelling.
Section is in good conditions with
minor surface cracking in the
geogrid section.
2 3 FIELD AND LABORATORY TESTING 4 5 The field and laboratory testing program in this study was implemented to evaluate the 6 effectiveness of the applied treatment to alleviate the distresses related to expansive soil. Field 7 testing included the following: 8 9
TRB 2013 Annual Meeting Paper revised from original submittal.
Dessouky et al.
7
Ground Penetrating Radar (GPR): A widely used nondestructive test used to determine 1 pavement layers thicknesses. The GPR system estimates the dielectric constant of the layers 2 from measurement of electromagnetic wave speed of the travel time between the layers systems. 3 Identification of delamination in-between layers can also be detected using the PAVECHECK 4 program developed by Liu and Scullion (2009). 5 6 Falling Weight Deflectometer: A non-destructive test used to determine the existing pavement 7 layers moduli. In this process, an impact load is applied from a standard height on the pavement 8 surface. The pavement vertical deformations were measured by a set of seven geophone sensors 9 (W1, W2, … and W7). The MODULUS 6 program was used to analyze the measured deflection 10 basin to determine the layer moduli and assess the pavement condition in terms of surface 11 curvature index (SCI) and base curvature index (BCI). These indices were used to establish layer 12 strength classification criteria as suggested by Michalak and Scullion, (1995). The SCI is 13 determined as the difference of W1 and W2 and the BCI is determined as the difference of W2 14 and W3. The FWD was performed along the travel at data sampling rate of 0.1 mile. 15 16 Base and subgrade materials were sampled close to the edge of the pavement from control and 17 repaired areas. Samples was collected following the FWD testing and bagged for the laboratory 18 testing. The laboratory testing was concurrently performed to characterize the material properties 19 from control and repaired sections at each project site. Comparison of testing data from repaired 20 and observed failures areas were used to investigate the cause of failure. The laboratory testing 21 includes Atterberg limits, shrinkage, sulfate concentration, suction and three-dimensional (3-D) 22 swelling. Gradation and proctor compaction testing were also performed as input parameters for 23 the laboratory tests. 24 25 The shrinkage test was used to determine the linear shrinkage of soil. Soil materials in liquid 26 limit condition were used to form beam samples in shrinkage molds. The mold length is 27
determined before and after oven drying at 110 5C. The shrinkage severity was classified 28 based on the criteria developed by Nelson and Miller (1992). Sulfate concentration test was 29 performed to determine the presence and amount of sulfates and they cause a heaving problem in 30 soils (Chen et al. 2009). A colorimeter was used to measure sulfate concentration in parts per 31 million (ppm). Sulfate content over 3000 ppm can negatively affect pavement integrity and 32 quality. 33 34 Soil suction is an indicator of moisture susceptibility and/or retention capability. The soil-water 35 characteristic curve is used to represent the relationship between moisture content versus soil 36 suction. Higher suction corresponds to lower moisture content level and vice versa. The tube test 37 was used to determine the suction for subgrade and base materials. Base materials were molded 38 at optimum moisture content to maximum density to form 6 inch diameter and 8 inch height 39
specimen. The mold was oven dried at 140F for two days. The mold was wrapped with latex 40
TRB 2013 Annual Meeting Paper revised from original submittal.
Dessouky et al.
8
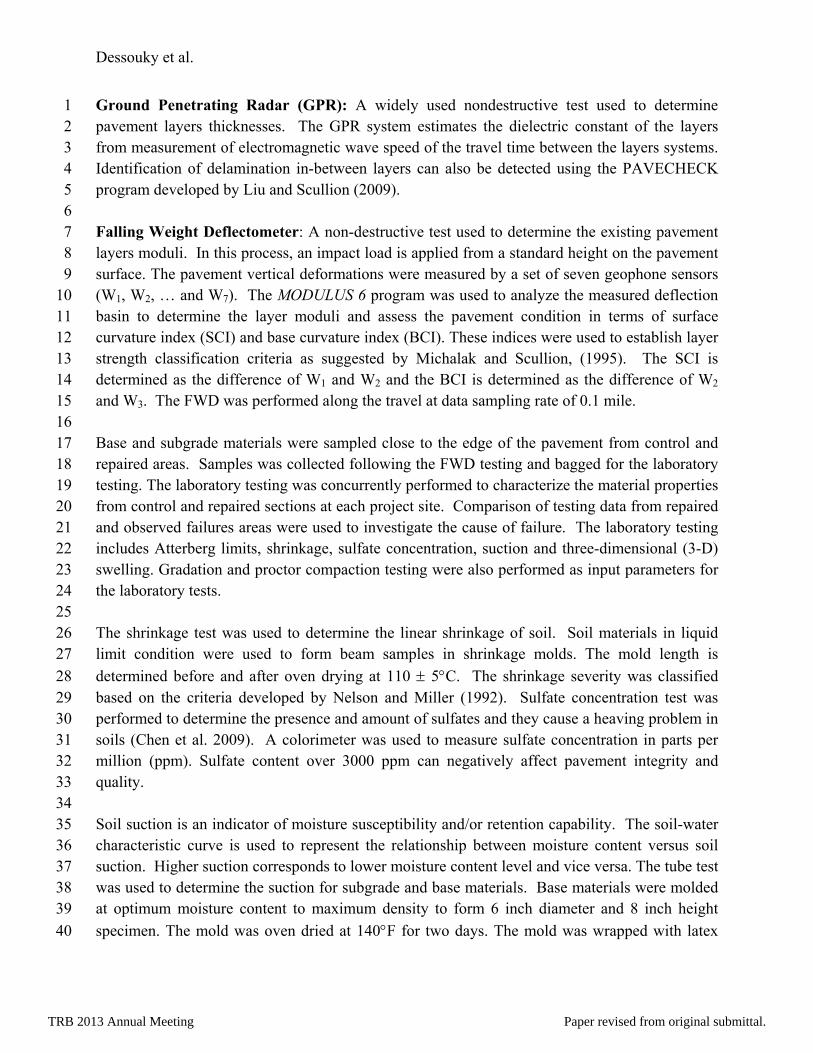
membrane and kept in container on top of fixed-depth water level for 10 days. The dielectric 1 value (DV) was measured using the Adek PercometerTM. The final DV determined as the 2 average readings of the last three days were used to classify the moisture susceptibility of the 3 base materials (Barbu and Scullion 2006). DV with more than 16 is classified as high moisture 4 susceptibility and poor quality base materials. For subgrade soil the water characteristic curve 5 was established using pressure plate extractors that are used in determining the permeability of 6 soil cores in accordance with ASTM D 6836-02. Different soil matric suction levels, difference 7 between the pore-air and pore-water pressures, were applied on subgrade soil specimen. The 8 application of matric suction to the specimen causes the pore-water to drain out. The specimen 9 weight was measured after equilibrium at each applied matric suction level to construct the soil 10 water characteristic curve. 11 12 The 3-D swelling test was conducted on soils to gauge soil potential volume changes due to 13 moisture variation. Molded soil materials were compacted at optimum moisture content to 14 fabricate cylindrical samples with 4 inch diameter and 4.5 inch height. The samples were 15 exposed to a three-day air dry before wetting. The mold dimensions were measured and the 16 monitoring over a period of 30 days (Harris 2008). 17 18 19 FIELD TESTING EVALUATION 20 21 Ground Penetrating Radar 22 23 The GPR images were able to capture the distinct layers structure of each section as shown in 24 Figures 2-4. To verify the quality of the GPR images layers thicknesses were estimated and 25 compared with the coring samples in Figure 1. For example, the AC layers in the FM 471 site 26 were detected with thicknesses of 6-8 and 3-4 inch for the reconstructed and overlay sections, 27 respectively. 28 29 Irregularity in the layers profile may be used as signs of substantial movements in the pavement 30 structures. For instance, the FM 471 control section suggested a heave action due to the wavy 31 signals in the subgrade as shown in Figure 2. However, during the field testing, there was no 32 sign of pavement distresses noticed at the surface. This may be attributed to the thickness of the 33 base layer. The figures also showed an evident of moisture entrapped zone between the AC and 34 cement-treated base in the reconstructed section. However, the presence of the moisture has no 35 damage effect in the pavement system which may be attributed to the thickness of the AC layer 36 and base stabilization. 37 38
39
TRB 2013 Annual Meeting Paper revised from original submittal.

Dessouky et al.
9
1
2
3 Figure 2. GPR processed images of FM 471 4
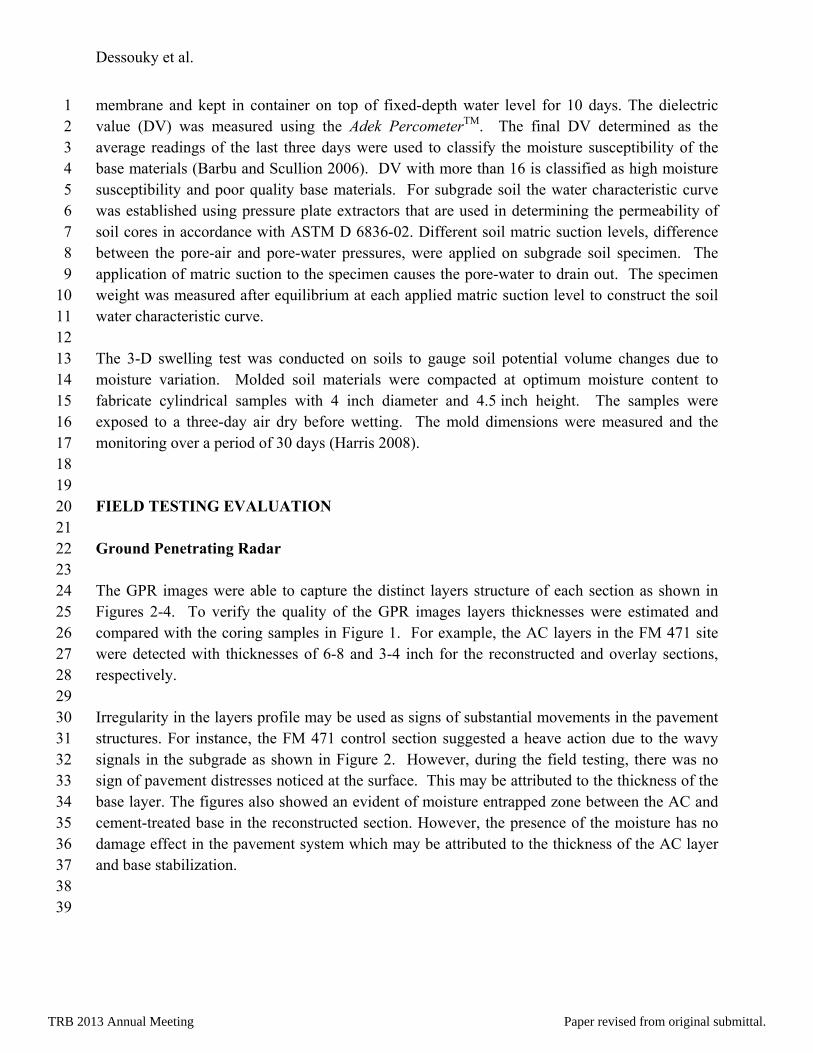
5 6 At the FM 1915 site, the GPR images on sections 1915-R1 and 1915-C showed higher variability 7 due to the soil movements compared to section 1915-R2 (Figure 3). These results are in 8 agreement with the visual survey. For instance, the control section (1915-C) had a total of 47 9 observed distresses with a total longitudinal cracking length of 688ft. The geogrid section, 1915-10 R1, also revealed severe surface condition with 743 ft total length of longitudinal cracking and 11 19 observed distresses. Section 1915-R2 was found to perform the best as indicated by the 12 shortest length of longitudinal cracking of 425ft and 21 observed distresses. 13 14 At FM 734, numerous repaired areas within the control section were captured by GPR images as 15 shown in Figures 4. The control section experienced severe shrinkage cracking due to the 16 frequent movements of subgrade soils. Nevertheless, there were no signs of moisture entrapped 17 between the layers. On other hand, the geogrid section is showing almost cracking-free surface 18 and uniform GPR signals suggesting improved performance as compared to the control section. 19 20 21 22 23 24
Heaving
TRB 2013 Annual Meeting Paper revised from original submittal.
Dessouky et al.
10
1
2
3 Figure 3. GPR processed images of FM 1915 4
5 6
7
8 Figure 4: GPR processed images for reconstruction (above) and control (below) sections of 9
FM 734 10 11 12
1915-R1
1915-C
1915-R2
Pavement movemen
TRB 2013 Annual Meeting Paper revised from original submittal.

Dessouky et al.
11
Falling Weight Deflectometer 1 2 The layers moduli determined for all sections as shown in Table 3, suggested that the 3 reconstructed sections have higher base and subgrade strength compared to their control sections 4 counterparts. The significant increase in base layers strength in each site is due to the geogrid 5 reinforcement in the FM 1915 and FM 734 and the base cement-stabilization in FM 471. These 6 treatments have shown an average base stiffness increase of 48, 36 and 20% for FM 471, 1915 7 and 734, respectively. 8 9 10
Table 3. Summary of layers moduli using FWD analysis 11 Site/section Layer
FM 471 FM 1915 FM 734 471-C 471-R 471-O 1915-R1 1915-C 1915-R2 734-C 734-R
Base Modulus (ksi) 128 728 345 190 147 197 110 145 Subgrade Modulus
(ksi) 23 28 40 13 11 17 15 19
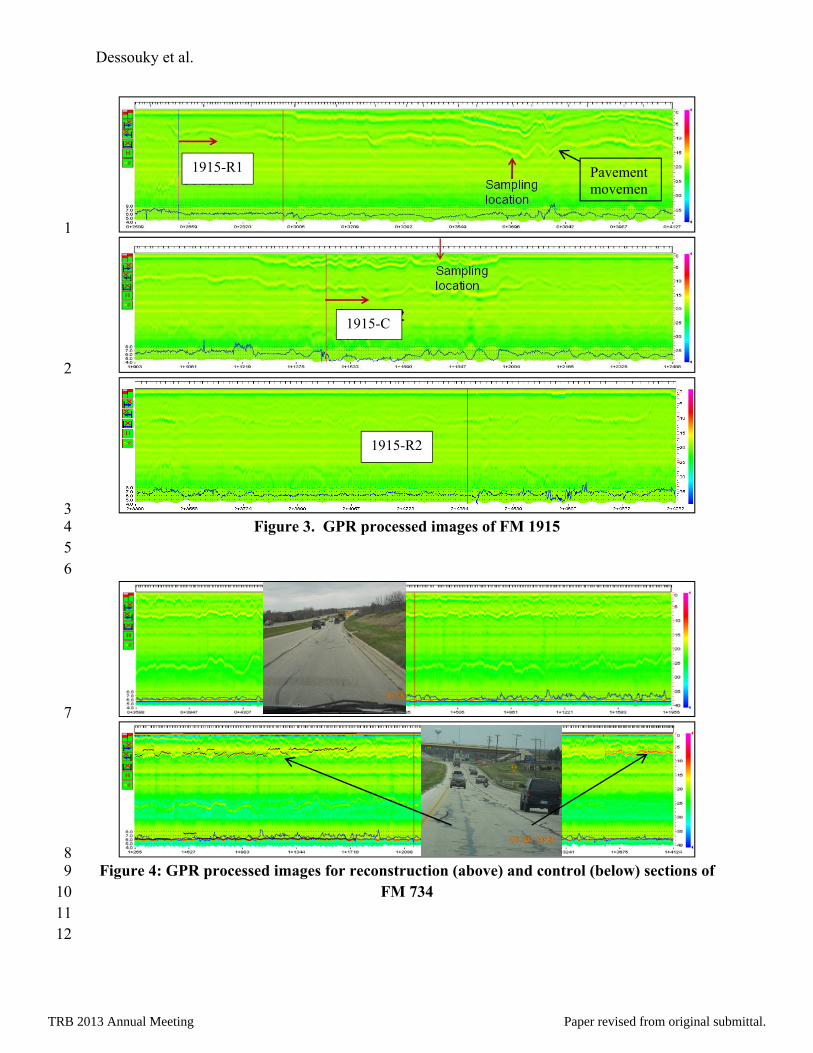
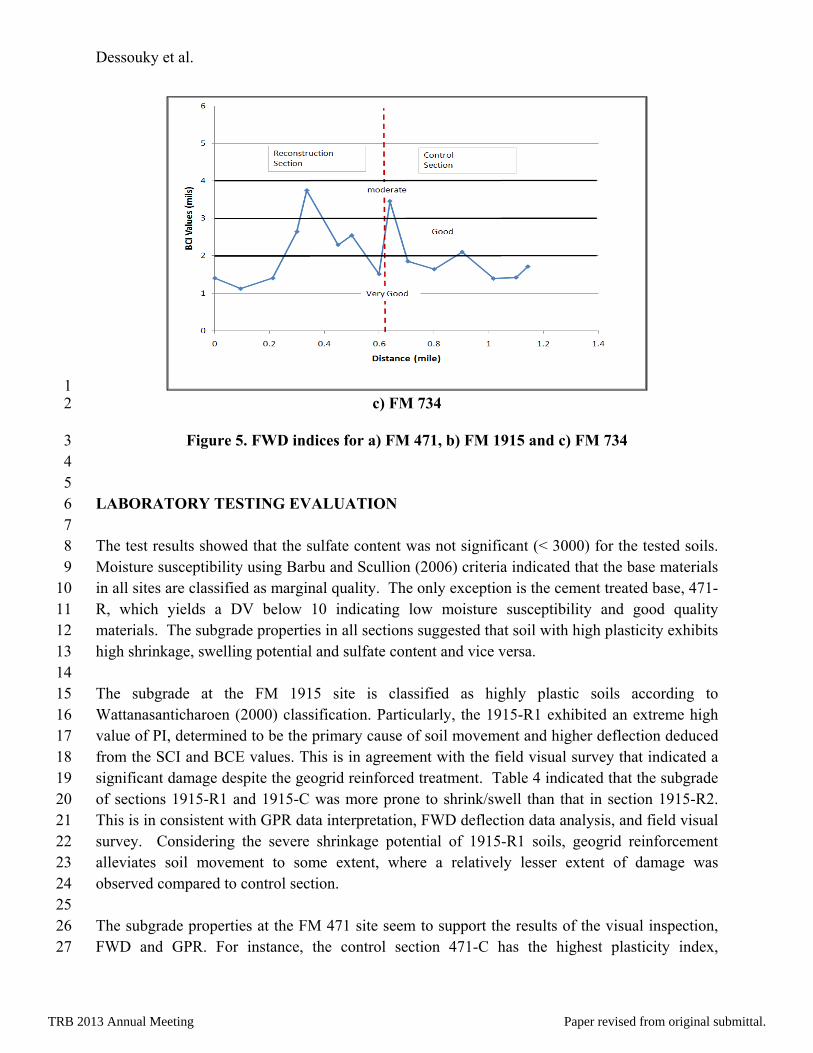
12 13 Michalak and Scullion (1995) suggested that pavement layers condition can be classified based 14 on the AC layer thickness and the difference between particular FWD geophone sensors. For 15 instance, pavement with lower BCI values (in mils) represents high strength AC and granular 16 base layers, respectively, and vice versa. They classified the pavement condition in five-rating 17 criteria; very good, good, moderate, poor and very poor. 18 19 Figure 5 shows the analysis results of FWD indices and the rating criteria for every section in 20 each site. The rating was adjusted in the reconstruction section, 471-R, to reflect the thickness of 21 the AC layer. At the FM 471 site, the indices can clearly distinguish between the three sections. 22 This agrees with the GPR data that identified the distinct zones layer structure. The SCI values 23 suggest that the reconstruction sections exhibit the highest AC layer strength followed by the 24 overlay. Similar trends were also found in the analysis for the BCI (Figure 5a). It is suggested 25 that the cement-treated base has a significant role to improve the base layer strength. Considering 26 the new AC layer and reworked base layer in the overlay section, the BCI values were slightly 27 decreased compared to the control section. Overall, the control and overall sections fall in zones 28 representing moderate to very good condition. 29 30 At the FM 1915 site, analysis of BCI values suggested that all sections were in very good 31 condition. The SCI was discarded in this section due to the nonexistence of AC layer. Another 32 observation was that the geogrid section 1915-R2 showed the least index although it had the 33 lowest base thickness. This could be attributed to the relatively lower plasticity among 34 consecutive sections reflected by the soil PI data in Table 4. As a result of the lower plasticity 35
TRB 2013 Annual Meeting Paper revised from original submittal.

Dessouky et al.
12
the 1915-R2 section may have the least subgrade movements due to moisture changes that affect 1 the stability and strength of the supported base layer. 2 3 In the FM 734 site, the layer moduli from the reconstruction section with geogrid were slightly 4 higher than in the control section. The BCI values suggested that the layers conditions 5 correspond to moderate to good condition (Figure 5c). It is evident in this site that the geogrid 6 reinforcement at the base-subgrade interface along with the subgrade lime-treatment mitigated 7 the longitudinal cracking. 8
9
10 a) FM 471 11
12 b) FM 1915 13
0
2
4
6
8
10
12
0 500 1000 1500 2000 2500 3000 3500 4000 4500 5000
BCI Value (m
ils)
Distance (feet)
1915‐R1 1915‐C 1915‐R2
Very Good
Good
TRB 2013 Annual Meeting Paper revised from original submittal.
Dessouky et al.
13
1 c) FM 734 2
Figure 5. FWD indices for a) FM 471, b) FM 1915 and c) FM 734 3 4 5 LABORATORY TESTING EVALUATION 6 7 The test results showed that the sulfate content was not significant (< 3000) for the tested soils. 8 Moisture susceptibility using Barbu and Scullion (2006) criteria indicated that the base materials 9 in all sites are classified as marginal quality. The only exception is the cement treated base, 471-10 R, which yields a DV below 10 indicating low moisture susceptibility and good quality 11 materials. The subgrade properties in all sections suggested that soil with high plasticity exhibits 12 high shrinkage, swelling potential and sulfate content and vice versa. 13 14 The subgrade at the FM 1915 site is classified as highly plastic soils according to 15 Wattanasanticharoen (2000) classification. Particularly, the 1915-R1 exhibited an extreme high 16 value of PI, determined to be the primary cause of soil movement and higher deflection deduced 17 from the SCI and BCE values. This is in agreement with the field visual survey that indicated a 18 significant damage despite the geogrid reinforced treatment. Table 4 indicated that the subgrade 19 of sections 1915-R1 and 1915-C was more prone to shrink/swell than that in section 1915-R2. 20 This is in consistent with GPR data interpretation, FWD deflection data analysis, and field visual 21 survey. Considering the severe shrinkage potential of 1915-R1 soils, geogrid reinforcement 22 alleviates soil movement to some extent, where a relatively lesser extent of damage was 23 observed compared to control section. 24 25 The subgrade properties at the FM 471 site seem to support the results of the visual inspection, 26 FWD and GPR. For instance, the control section 471-C has the highest plasticity index, 27
TRB 2013 Annual Meeting Paper revised from original submittal.
Dessouky et al.
14
shrinkage strain, sulfate content and swelling potential. These properties attributed to the severe 1 longitudinal and transverse cracking in the pavement surface as determined by the visual survey. 2 Although the sulfate content is insignificant, it is five times higher in the control section 3 compared to the counterpart sections. 4
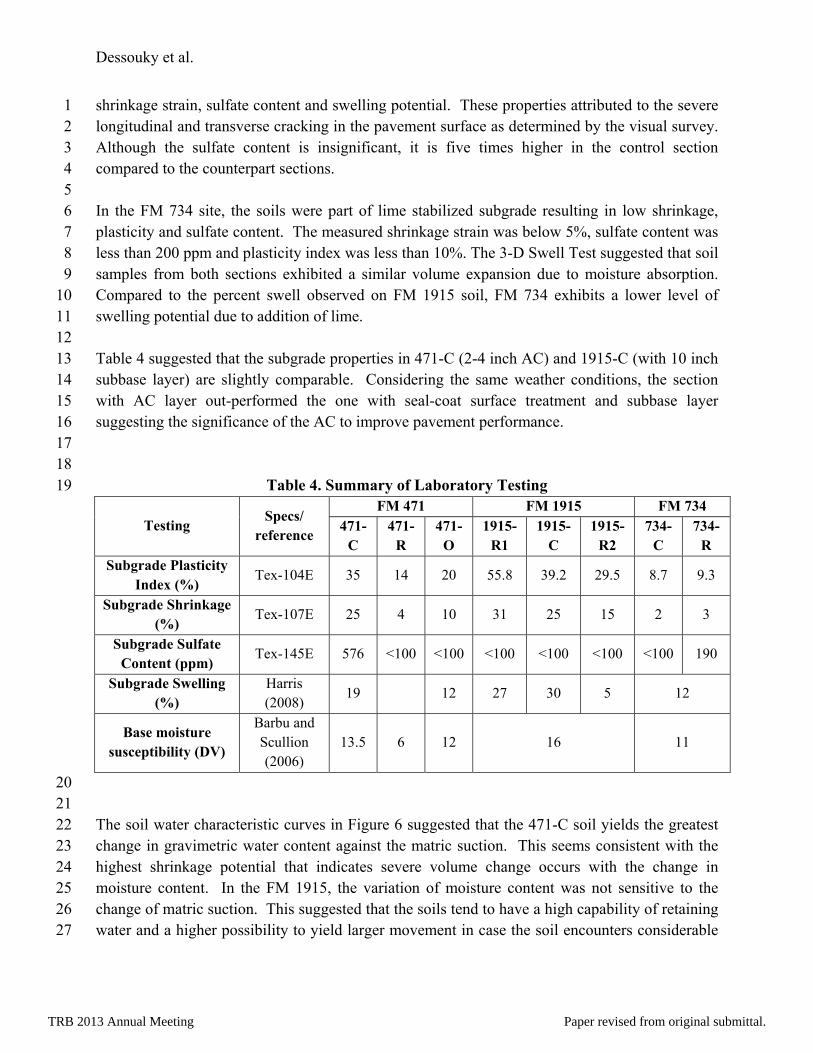
5 In the FM 734 site, the soils were part of lime stabilized subgrade resulting in low shrinkage, 6 plasticity and sulfate content. The measured shrinkage strain was below 5%, sulfate content was 7 less than 200 ppm and plasticity index was less than 10%. The 3-D Swell Test suggested that soil 8 samples from both sections exhibited a similar volume expansion due to moisture absorption. 9 Compared to the percent swell observed on FM 1915 soil, FM 734 exhibits a lower level of 10 swelling potential due to addition of lime. 11 12 Table 4 suggested that the subgrade properties in 471-C (2-4 inch AC) and 1915-C (with 10 inch 13 subbase layer) are slightly comparable. Considering the same weather conditions, the section 14 with AC layer out-performed the one with seal-coat surface treatment and subbase layer 15 suggesting the significance of the AC to improve pavement performance. 16 17 18
Table 4. Summary of Laboratory Testing 19
Testing Specs/
reference
FM 471 FM 1915 FM 734 471-
C 471-
R 471-
O 1915-
R1 1915-
C 1915-
R2 734-
C 734-
R Subgrade Plasticity
Index (%) Tex-104E 35 14 20 55.8 39.2 29.5 8.7 9.3
Subgrade Shrinkage (%)
Tex-107E 25 4 10 31 25 15 2 3
Subgrade Sulfate Content (ppm)
Tex-145E 576 <100 <100 <100 <100 <100 <100 190
Subgrade Swelling (%)
Harris (2008)
19
12 27 30 5 12
Base moisture susceptibility (DV)
Barbu and Scullion (2006)
13.5 6 12 16 11
20 21 The soil water characteristic curves in Figure 6 suggested that the 471-C soil yields the greatest 22 change in gravimetric water content against the matric suction. This seems consistent with the 23 highest shrinkage potential that indicates severe volume change occurs with the change in 24 moisture content. In the FM 1915, the variation of moisture content was not sensitive to the 25 change of matric suction. This suggested that the soils tend to have a high capability of retaining 26 water and a higher possibility to yield larger movement in case the soil encounters considerable 27
TRB 2013 Annual Meeting Paper revised from original submittal.

Dessouky et al.
15
amount of rainfall. In the FM 734, the Pressure Plate Test suggested that the control section soil 1 seems to be more capable of releasing water than the treated section soil. This explains the 2 potential of control section soil to retain water resulting in the heave and dips spots noticed in the 3 visual survey. 4 5 6
7 Figure 6. Soil water characteristic curves of a) FM 471, b) FM 1915 and c) FM734 8
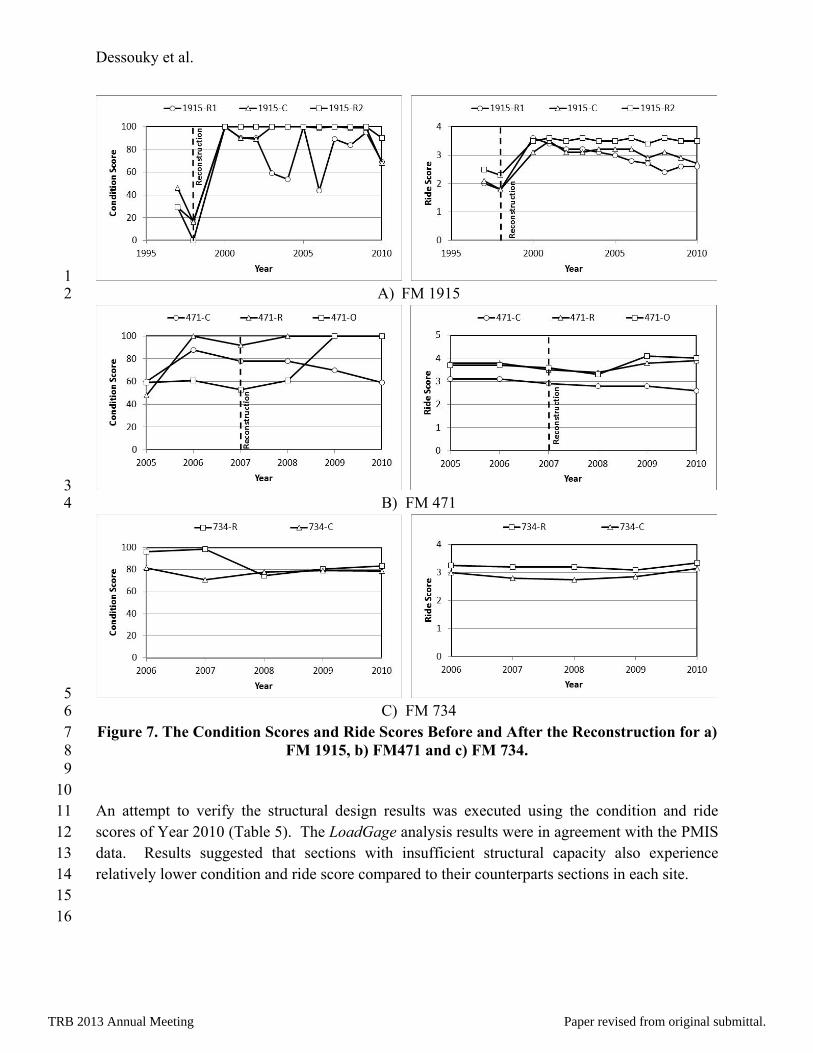
subgrade soil 9 10 11 PERFORMANCE AND STRUCTURAL DESIGN EVALUATION 12 13 Pavement Condition and Ride Quality 14 15 Effectiveness of treatments in pavement surface condition and ride quality was assessed using 16 field performance data. Performance data from the TxDOT pavement management information 17 system (PMIS) database were collected before and after the treatment repair. Pavement 18 evaluation using two rating scores namely; condition score and ride score. The former reflects 19 the pavement distresses types and severity and ranges from zero (completely damaged) to100 20 (undamaged). The latter defines the ride quality of the pavement surface and ranges from zero 21 (rough) to 5 (smooth). Figure 7 suggests that the condition and ride scores significantly 22 increased after the repair was conducted at each site (with the exception of FM 734 in which 23 historical data prior to 2006 were not available). The higher score prior to reconstruction (FM 24 471) is due to application of temporarily surface treatments by TxDOT to preserve the pavement 25 until a major repair is scheduled. According to the TxDOT, the average bid price for cement-26 treated base, lime-treated subgrade, geogrid-reinforced base and asphalt overlay are 2.3, 2.3, 3.17 27 and 2.4 $/square yard, respectively. This estimate is determined for base layers of 6-8 inch and 28 asphalt layer of 1-3 inch. 29 30 One can notice in Figure 7 the effectiveness of the cement-treated base (e.g., 471-R) through a 31 stable condition score for three years after reconstruction. This treatment showed higher scores 32 against the expansive soil conditions and heavy traffic. Geogrid at base-subgrade interface was 33
TRB 2013 Annual Meeting Paper revised from original submittal.

Dessouky et al.
16
also shown an effective treatment against expansive soil. The Geogrid effectiveness is improved 1 when combined with lime-treated subgrade (e.g., 734-R) or lime treated subbase (e.g., 1915-R2). 2 The combination of geogrid and lime treated, however have not shown reliable treatment in areas 3 where severe soil plasticity exist (e.g., 1915-R1). Considering the combined cost of lime and 4 geogrid, this treatment is better used with low to moderate plasticity soil. 5 6 The asphalt overlay repair includes milling an existing asphalt concrete layer and reworking the 7 base layers (if needed) before applying a new asphalt layer. Although this treatment only 8 addressed surface repair, the section showed accepted results within three years after completion 9 (e.g., 471-O). This may be attributed to the structural design of the section that is capable to 10 sustain the traffic loading and movements from the expansive soil. While this treatment is 11 considered one of the less costly repairs particularly if no base rework is needed, it is necessary 12 to continue monitor the performance of this section to have a comprehensive evaluation of the 13 long-term performance. 14 15 16 Structural Design Evaluation 17 18 Effectiveness of treatment options in pavement structural design was assessed using the 19 LoadGage program. Fernando et al. (2007) developed the LoadGage program to improve the 20 current Texas Triaxial design check procedure. The program considered the moisture correction 21 on subgrade strength based on the soil water characteristic curves (SWCC) of predominant soils. 22 The program determines the allowable wheel loads based on the Mohr-Coulomb yield criterion 23 as given in Eq. 1. If the yield function is less than zero, the pavement structure can sustain the 24 specified wheel load otherwise the pavement structure is required to be thicker or the specified 25 load needs to be reduced. 26 27
cossin3
cos33
sinsin3
22
1 cJJIf
(1) 28
29
Where, I1 = first stress invariant, J2 = second deviatoric stress invariant, = friction angle, = 30 Lode angle, and c = cohesion. Given a SWCC, soil type, FWD backcalculated layer moduli and 31 pavement layer thickness, the LoadGage program was executed. For the moisture correction, the 32 field moisture content that corresponds to a value of 3.5 pF matric suction was used, which is 33 typically considered as an equilibrium condition. A 12 kips of average ten heaviest wheel loads 34 daily (ATHWLD) for dual-tire with 14 inch of tire spacing was used throughout the analysis. 35 Table 5 suggested that the three control sections of FM 471 and FM 1915 and one treated section 36 of FM 1915 failed to sustain the specified wheel load for both of the moisture correction 37 scenarios. 38 39
TRB 2013 Annual Meeting Paper revised from original submittal.
Dessouky et al.
17
1 A) FM 1915 2
3 B) FM 471 4
5 C) FM 734 6
Figure 7. The Condition Scores and Ride Scores Before and After the Reconstruction for a) 7 FM 1915, b) FM471 and c) FM 734. 8
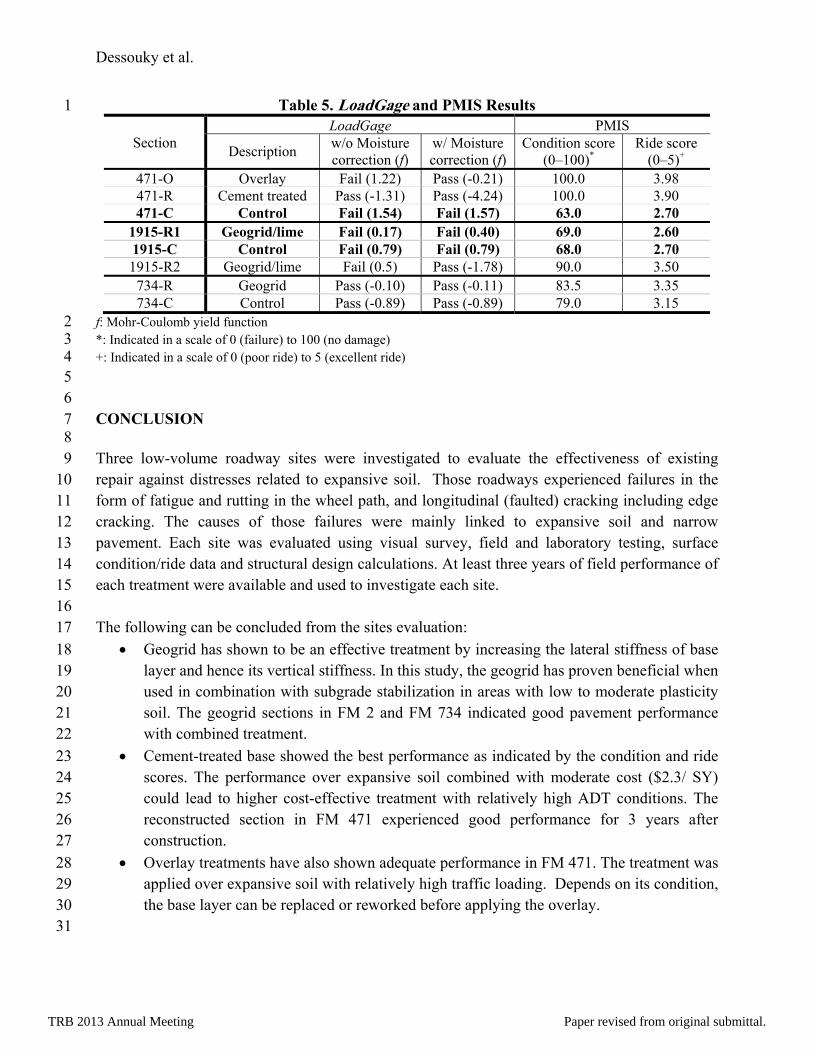
9 10 An attempt to verify the structural design results was executed using the condition and ride 11 scores of Year 2010 (Table 5). The LoadGage analysis results were in agreement with the PMIS 12 data. Results suggested that sections with insufficient structural capacity also experience 13 relatively lower condition and ride score compared to their counterparts sections in each site. 14 15 16
TRB 2013 Annual Meeting Paper revised from original submittal.
Dessouky et al.
18
Table 5. LoadGage and PMIS Results 1
Section LoadGage PMIS
Description w/o Moisture correction (f)
w/ Moisture correction (f)
Condition score (0–100)*
Ride score (0–5)+
471-O Overlay Fail (1.22) Pass (-0.21) 100.0 3.98 471-R Cement treated Pass (-1.31) Pass (-4.24) 100.0 3.90 471-C Control Fail (1.54) Fail (1.57) 63.0 2.70
1915-R1 Geogrid/lime Fail (0.17) Fail (0.40) 69.0 2.60 1915-C Control Fail (0.79) Fail (0.79) 68.0 2.70 1915-R2 Geogrid/lime Fail (0.5) Pass (-1.78) 90.0 3.50
734-R Geogrid Pass (-0.10) Pass (-0.11) 83.5 3.35 734-C Control Pass (-0.89) Pass (-0.89) 79.0 3.15
f: Mohr-Coulomb yield function 2 *: Indicated in a scale of 0 (failure) to 100 (no damage) 3 +: Indicated in a scale of 0 (poor ride) to 5 (excellent ride) 4 5 6 CONCLUSION 7 8 Three low-volume roadway sites were investigated to evaluate the effectiveness of existing 9 repair against distresses related to expansive soil. Those roadways experienced failures in the 10 form of fatigue and rutting in the wheel path, and longitudinal (faulted) cracking including edge 11 cracking. The causes of those failures were mainly linked to expansive soil and narrow 12 pavement. Each site was evaluated using visual survey, field and laboratory testing, surface 13 condition/ride data and structural design calculations. At least three years of field performance of 14 each treatment were available and used to investigate each site. 15 16 The following can be concluded from the sites evaluation: 17
Geogrid has shown to be an effective treatment by increasing the lateral stiffness of base 18 layer and hence its vertical stiffness. In this study, the geogrid has proven beneficial when 19 used in combination with subgrade stabilization in areas with low to moderate plasticity 20 soil. The geogrid sections in FM 2 and FM 734 indicated good pavement performance 21 with combined treatment. 22
Cement-treated base showed the best performance as indicated by the condition and ride 23 scores. The performance over expansive soil combined with moderate cost ($2.3/ SY) 24 could lead to higher cost-effective treatment with relatively high ADT conditions. The 25 reconstructed section in FM 471 experienced good performance for 3 years after 26 construction. 27
Overlay treatments have also shown adequate performance in FM 471. The treatment was 28 applied over expansive soil with relatively high traffic loading. Depends on its condition, 29 the base layer can be replaced or reworked before applying the overlay. 30 31
TRB 2013 Annual Meeting Paper revised from original submittal.
Dessouky et al.
19
The projects examined in this report are examples of how TxDOT might choose to address 1 severe pavement failures on low-volume roadways under certain conditions. These projects do 2 not represent the only options for treatment of these pavement conditions. It is important to 3 mention that this study did not cover all possible treatment options for expansive soil. The 4 effectiveness of the treatments mentioned here was limited to the selected sites including their 5 climatic, soil and traffic conditions. 6 7 8 ACKNOWLEDGEMENTS 9 10 The authors would like to thank the TxDOT office of Research and Research and Innovative for 11 the providing the financial support and technical guidance to complete this study. Special thanks 12 to Drs. Mijia Yang, Tom Freeman and Mien Jao for their contribution to the research study. 13 14 15 REFERENCES 16 17 Barbu, B. G. and Scullion, T. Repeatability and Reproducibility Study for Tube Suction Test. 18 Research Report No. FHWA/TX-06/5-4114-01-1, Texas Transportation Institute, College 19 Station, TX, 2006. 20
Chen, Dar Hao (2007). “Field and Lab Investigations of Prematurely Cracking Pavements”. 21 Journal of Performance of Constructed Facilities, Vol. 21, No. 4,. 22
Chen, D. H., Si, Z., and Saribudak, M. Roadway Heaving Caused by High Organic Matter. 23 Journal of Performance of Constructed Facilities. ASCE, Vol. 23, No. 2, pp. 100–108, 2009. 24
Dessouky S., Yang M., Ilias M., Ho J., Freeman T., Bourland M., and Jao M. (2012) "Pavement 25 Repair Strategies For 2R and Routine Maintenance (RMC) Projects." FHWA/TX-11/0-6589-1, 26 Technical Report for Texas Department of Transportation, University of Texas at San Antonio, 27 TX. 28
Fernando, E. G., Oh, J. H., and Liu, W. LoadGage User’s Guide. Product 0-4519-P3, Texas 29 Transportation Institute, The Texas A&M University System, College Station, TX, 2007. 30
Freeman T. J. and Dallas N. Little (2002) “Maintenance Strategies For Pavements With 31 Chemically Stabilized Layers” FHWA/TX-01/1722-6, Project 0-1772, Texas Transportation 32 Institute, College Station, TX. 33
Harris, P. Evaluation of Stabilization of Sulfate Soils in Texas. Research Report No. FHWA/TX-34 08/5-4240-01-1, Texas Transportation Institute, College Station, TX, 2008. 35
Jayatilaka, R., and R. L. Lytton (1997). Prediction of Expansive Clay Roughness in Pavements 36 with Vertical Moisture Barriers. Research Report FHWA/TX-98/187-28F, Texas Transportation 37 Institute, Texas A&M University, College Station, TX. 38
TRB 2013 Annual Meeting Paper revised from original submittal.

Dessouky et al.
20
Little, D. N. Handbook for Stabilization of Pavement Subgrades and Base Courses with Lime. 1 Kendall Hunt Publishing Company, Dubuque, IA, 1995. 2
Liu, W. and Scullion, T. PAVECHECK: Training Material-Updated User’s Manual Including 3 GPS. Research Report 5-4495-01-P2. Texas Transportation Institute, College Station, TX, 2009. 4
Michalak C. H. and Scullion T. Modulus 5.0: User’s Manual. Report No. TX-96/1987-1, Texas 5 Transportation Institute, College Station, TX, 1995. 6
Nelson, D. J. and Miller, J. D. Expansive Soils: Problems and Practice in Foundation and 7 Pavement Engineering. John Wiley & Sons, New York, NY, 1992. 8
Puppala A. J., N. Intharasombat, S. Qasim (2004) “The Effects of Using Compost as a 9 Preventive Measure to Mitigate Shoulder Cracking: Laboratory and Field Studies” FHWA/TX-10 05/0-4573-2, Project 0-4573, Arlington, Texas 11
Scullion, T., Sebesta, S., Harris, J. P., and Syed, I. A Balanced Approach to Selecting the 12 Optimal Cement Content for Soil-Cement Bases. Report 404611-1, Texas Transportation 13 Institute, College Station, TX, August 2000. 14
Sebesta, S. “Reworking Base”. Presented at 2002 Statewide Maintenance Conference, San 15 Antonio, TX, April 16, 2002. 16
Sebesta S. (2004) “Finalization Of Guidelines For Maintenance Treatments Of Pavement 17 Distress” FHWA/TX-05/0-4395-2, Project 0-4395, Texas Transportation Institute, College 18 Station, TX. 19
Steinberg, M.L. Vertical Moisture Barrier Update. In Transportation Research Record: Journal of 20 the Transportation Research Board, No. 1362, Transportation Research Board of the National 21 Academies, Washington, D.C., 1992, pp. 111-117. 22
Wattanasanticharoen, E. Investigation to Evaluate the Performance of Four Selected Stabilization 23 Methods on Soft Subgrade Soils of Southeast Arlington. M.S. Thesis, The University of Texas at 24 Arlington, Arlington, TX, 2000. 25
Zornberg, J. G., Prozzi, J., Gupta, R., Luo, R., McCartney, J. S., Ferreira, J. Z., and Nogueira, C. 26 Validating Mechanisms in Geosynthetic Reinforced Pavements. Research Report No. 27 FHWA/TX-08/0-4829-1, Project 0-4829, Center for Transportation Research, Austin, TX, 2008. 28
TRB 2013 Annual Meeting Paper revised from original submittal.