performance optimizations for numa-multicore systems
DESCRIPTION
Performance Optimizations for NUMA-Multicore Systems. Zolt án Majó Department of Computer Science ETH Z urich , Switzerland. About me. ETH Zurich: research assistant Research: performance optimizations Assistant: lectures TUCN Student Communications Center: network engineer - PowerPoint PPT PresentationTRANSCRIPT

Performance Optimizationsfor NUMA-Multicore Systems
Zoltán Majó
Department of Computer ScienceETH Zurich, Switzerland
2
About me
ETH Zurich: research assistant Research: performance optimizations Assistant: lectures
TUCN Student Communications Center: network engineer Department of Computer Science: assistant
3
Computing
Unlimited need for performance

4
Performance optimizations
One goal: make programs run fast
Idea: pick good algorithm Reduce number of operations executed Example: sorting

5
Sorting
1 2 3 4 5 6 7 8 9 10 11 120
20
40
60
80
100
120
140
160
180
n^2 n*log(n)
Input size (n)
Execution time [T]
Number of operations

6
Sorting
1 2 3 4 5 6 7 8 9 10 11 120
20
40
60
80
100
120
140
160
180
Polynomial (n^2)
Column1
Input size (n)
Execution time [T]
Number of operationsbubble so
rt

7
Sorting
1 2 3 4 5 6 7 8 9 10 11 120
20
40
60
80
100
120
140
160
180
Polynomial (n^2)
n*log(n)
Input size (n)
Execution time [T]
bubble sort
quicksort
Number of operations

8
Sorting
1 2 3 4 5 6 7 8 9 10 11 120
20
40
60
80
100
120
140
160
180
Polynomial (n^2)
n*log(n)
Input size (n)
Execution time [T]
bubble sort
quicksort
Number of operations
11Xfaster

9
Sorting
We picked good algorithm, work done
Are we really done?
Make sure our algorithm runs fast Operations take time We assumed 1 operation = 1 time unit T

10
Quicksort performance
1 2 3 4 5 6 7 8 9 10 11 120
20
40
60
80
100
120
140
160
180
200
Input size (n)
Execution time [T]
1 op = 1 T

11
Quicksort performance
1 2 3 4 5 6 7 8 9 10 11 120
20
40
60
80
100
120
140
160
180
200
Input size (n)
Execution time [T]
1 op = 1 T1 op = 2 T

12
Quicksort performance
1 2 3 4 5 6 7 8 9 10 11 120
20
40
60
80
100
120
140
160
180
200
Input size (n)
Execution time [T]
1 op = 1 T1 op = 2 T
1 op = 4 T

13
Quicksort performance
1 2 3 4 5 6 7 8 9 10 11 120
20
40
60
80
100
120
140
160
180
200
Input size (n)
Execution time [T]
1 op = 1 T1 op = 2 T
1 op = 4 T
1 op = 8 T

14
Quicksort performance
1 2 3 4 5 6 7 8 9 10 11 120
20
40
60
80
100
120
140
160
180
200
Input size (n)
Execution time [T]
1 op = 1 T1 op = 2 T
1 op = 4 T
1 op = 8 T
bubble sort (
1 op = 1 T)
32%faster

15
Latency of operations
Best algorithm not enough
Operations are executed on hardware
Stage 1:Dispatchoperation
Stage 2:Executeoperation
Stage 3:Retireoperation
CPU

16
Latency of operations
Best algorithm not enough
Operations are executed on hardware
Hardware must be used efficiently
Stage 1:Dispatchoperation
Stage 2:Executeoperation
Stage 3:Retireoperation
CPU

17
Outline
Introduction: performance optimizations
Cache-aware programming
Scheduling on multicore processors
Using run-time feedback
Data locality optimizations on NUMA-multicores
Conclusion
ETH scholarship

18
RAM
Memory accessesCPU
230 cycles access latency

19
RAM
230 cycles access latency
CPU
Memory accesses
Total access latency = ?Total access latency = 16 x 230 cycles = 3680 cycles

20
RAM
230 cycles access latency
CPU
Caching

21
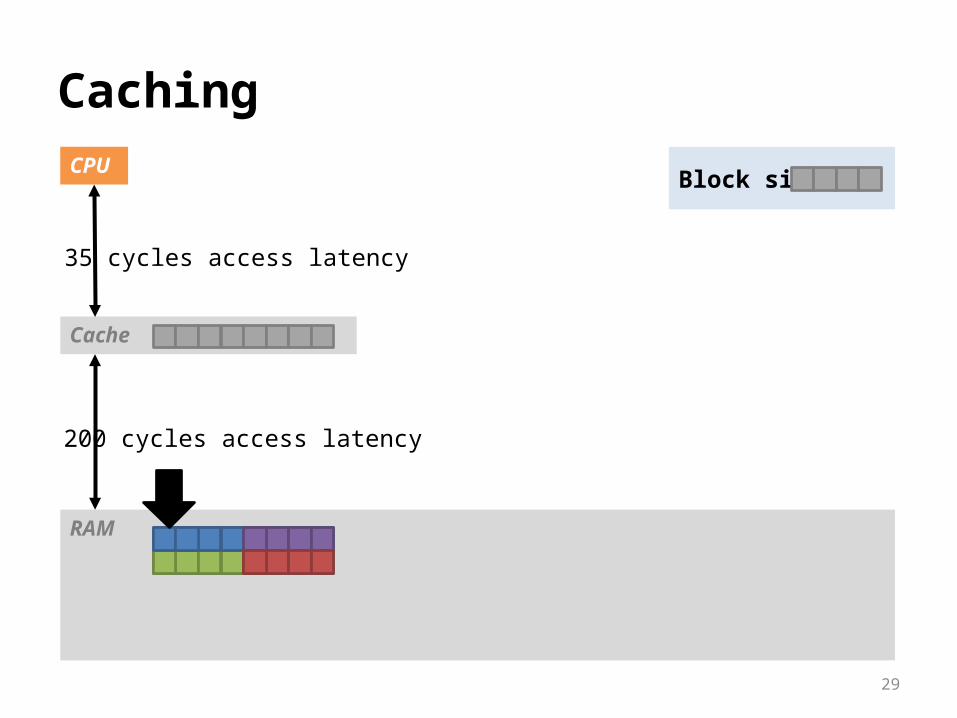
Cache
RAM
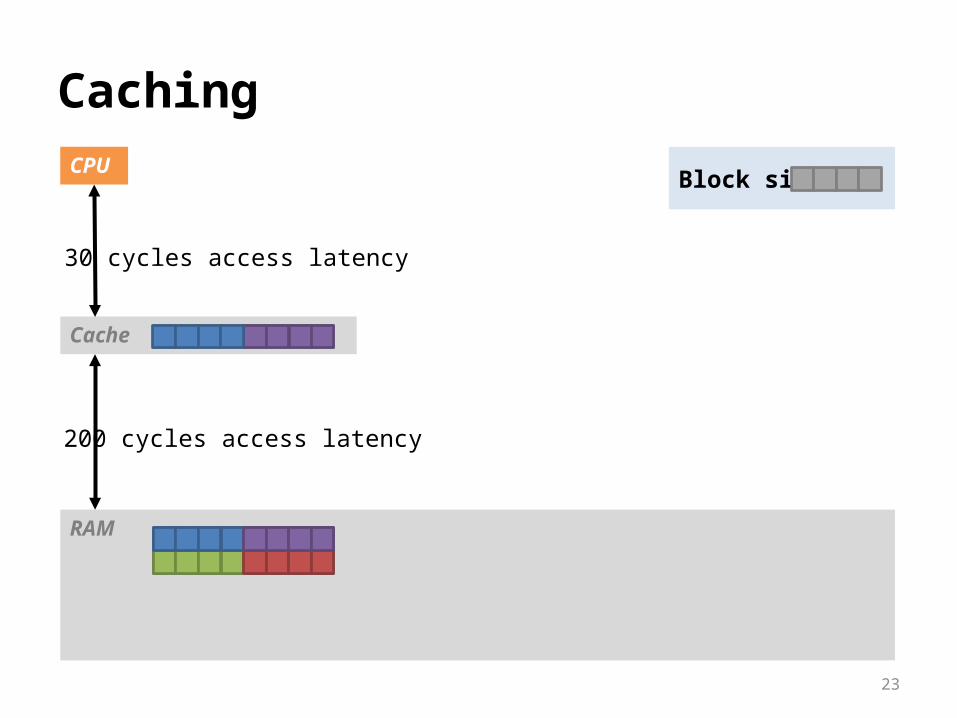
CachingCPU
30 cycles access latency
200 cycles access latency
Block size:

22
RAM
Cache
CachingCPU
30 cycles access latency
200 cycles access latency
Block size:
23
Cache
RAM
CachingCPU
30 cycles access latency
200 cycles access latency
Block size:

24
RAM
Cache
CachingCPU
30 cycles access latency
200 cycles access latency
Block size:

25
Cache
RAM
CachingCPU
30 cycles access latency
200 cycles access latency
Block size:

26
RAM
Cache
Hits and missesCPU
30 cycles access latency
200 cycles access latency
Cache miss: data not in cache = 230 cyclesCache hit: data in cache = 30 cycles
27
RAM
Cache
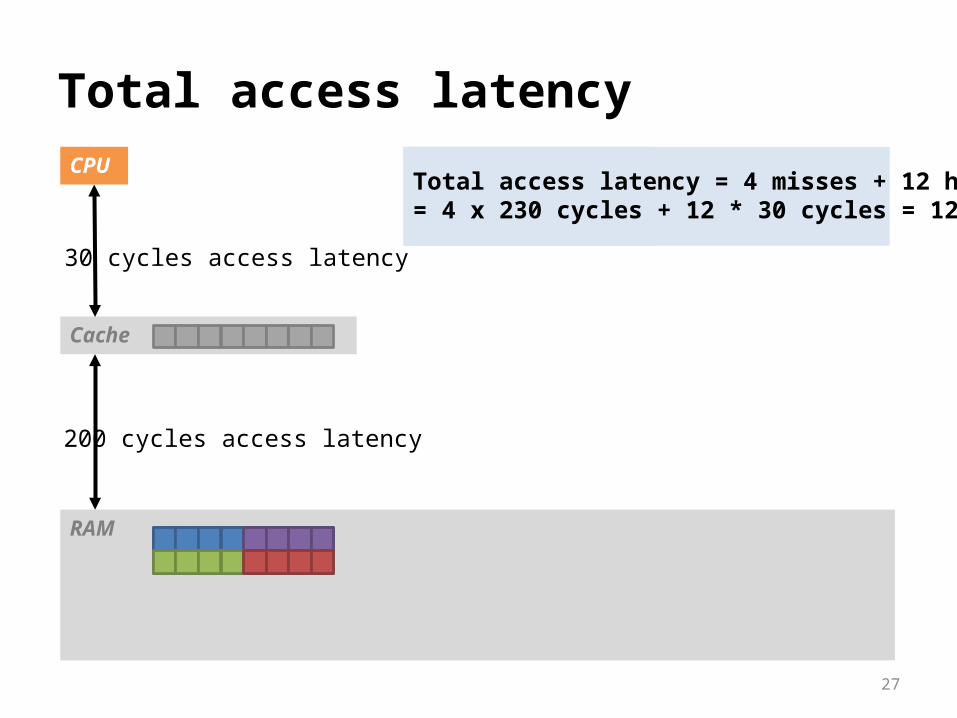
Total access latencyCPU
30 cycles access latency
200 cycles access latency
Total access latency = ?Total access latency = 4 misses + 12 hits= 4 x 230 cycles + 12 * 30 cycles = 1280 cycles
28
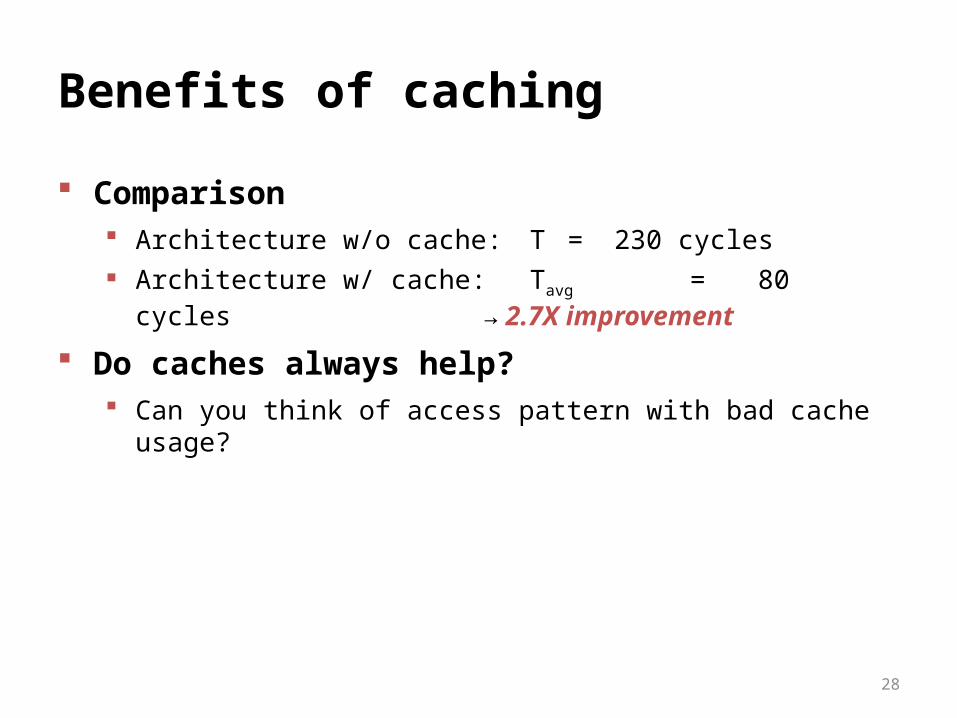
Benefits of caching
Comparison Architecture w/o cache: T = 230 cycles Architecture w/ cache: Tavg = 80 cycles → 2.7X
improvement
Do caches always help? Can you think of access pattern with bad cache usage?
29
RAM
Cache
CachingCPU
35 cycles access latency
200 cycles access latency
Block size:

30
Cache-aware programming
Today’s example: matrix-matrix multiplication (MMM)
Number of operations: n3
Compare naïve and optimized implementation Same number of operations
31
C
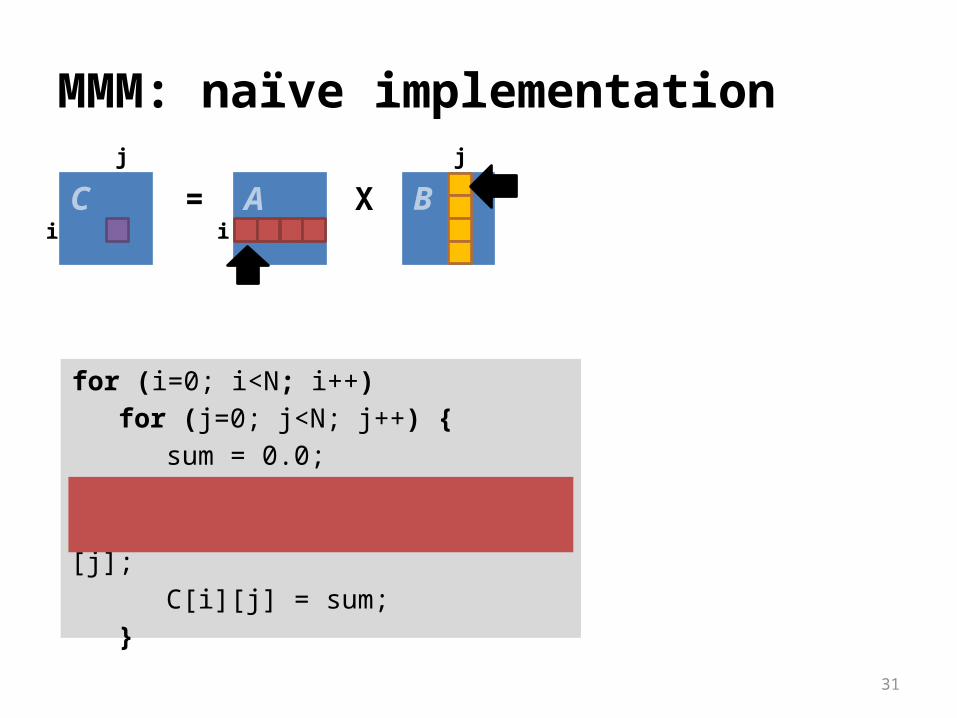
MMM: naïve implementation
for (i=0; i<N; i++)for (j=0; j<N; j++) {
sum = 0.0;for (k=0; k < N; k+
+)sum += A[i]
[k]*B[k][j];C[i][j] = sum;
}
A B= Xj
i i
j

32
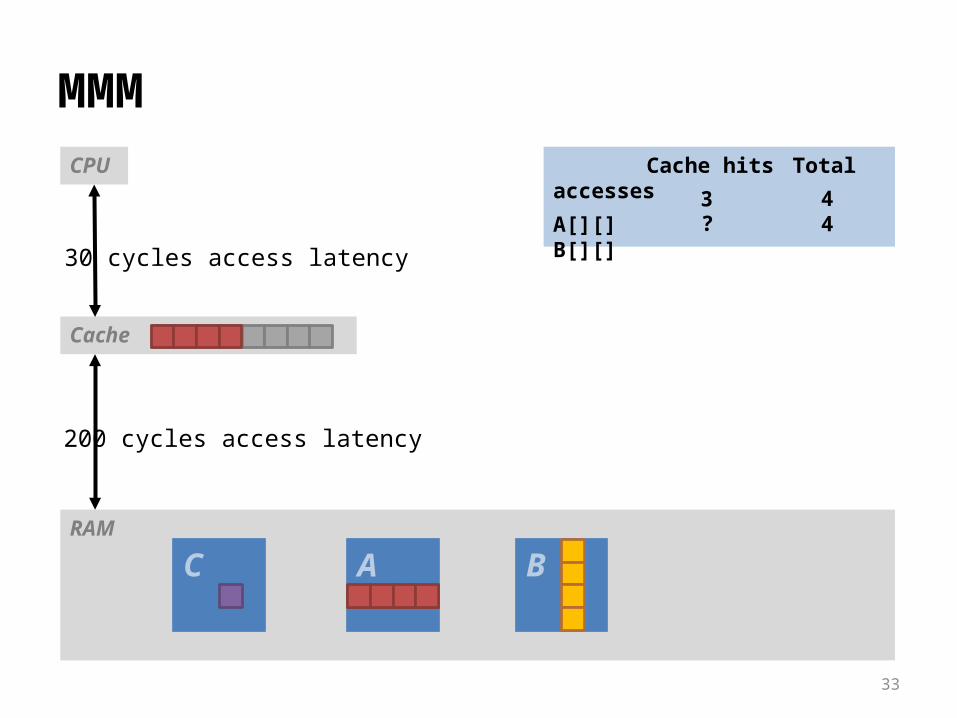
RAM
Cache
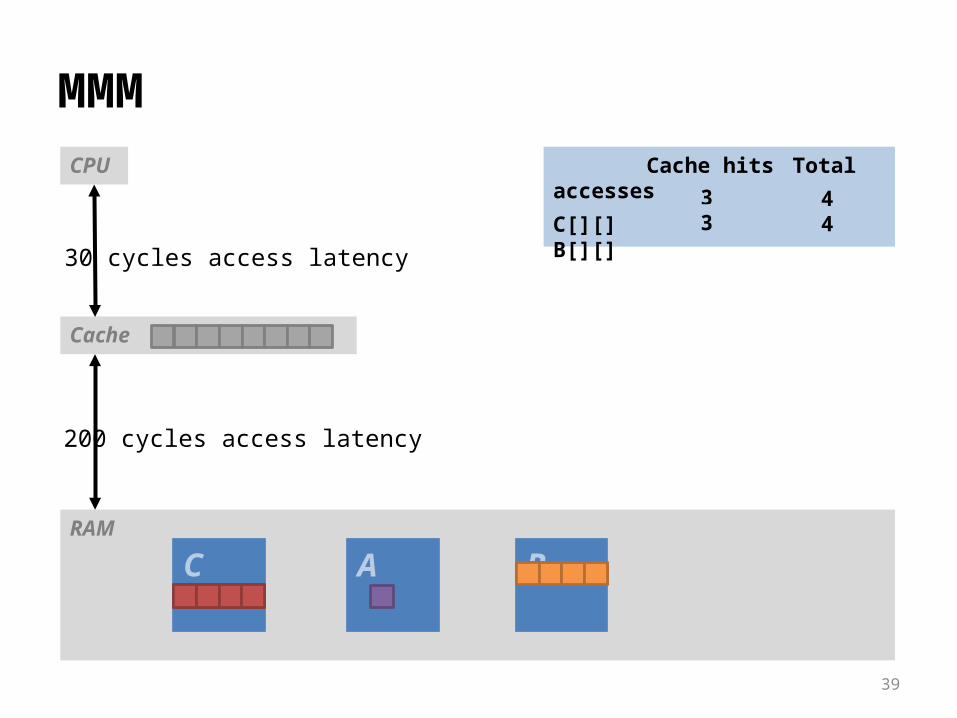
MMMCPU
30 cycles access latency
200 cycles access latency
C A B
Cache hits Total accesses
A[][]B[][]
44
??
33
RAM
A
Cache
MMMCPU
30 cycles access latency
200 cycles access latency
C B
Cache hits Total accesses
A[][]B[][]
44
??3

34
RAM
A
Cache
MMMCPU
30 cycles access latency
200 cycles access latency
C B
Cache hits Total accesses
A[][]B[][]
44
??3

35
RAM
A
Cache
MMMCPU
30 cycles access latency
200 cycles access latency
C B
Cache hits Total accesses
A[][]B[][]
44
??3

36
RAM
BA
Cache
MMMCPU
30 cycles access latency
200 cycles access latency
C
Cache hits Total accesses
A[][]B[][]
44
??30
37
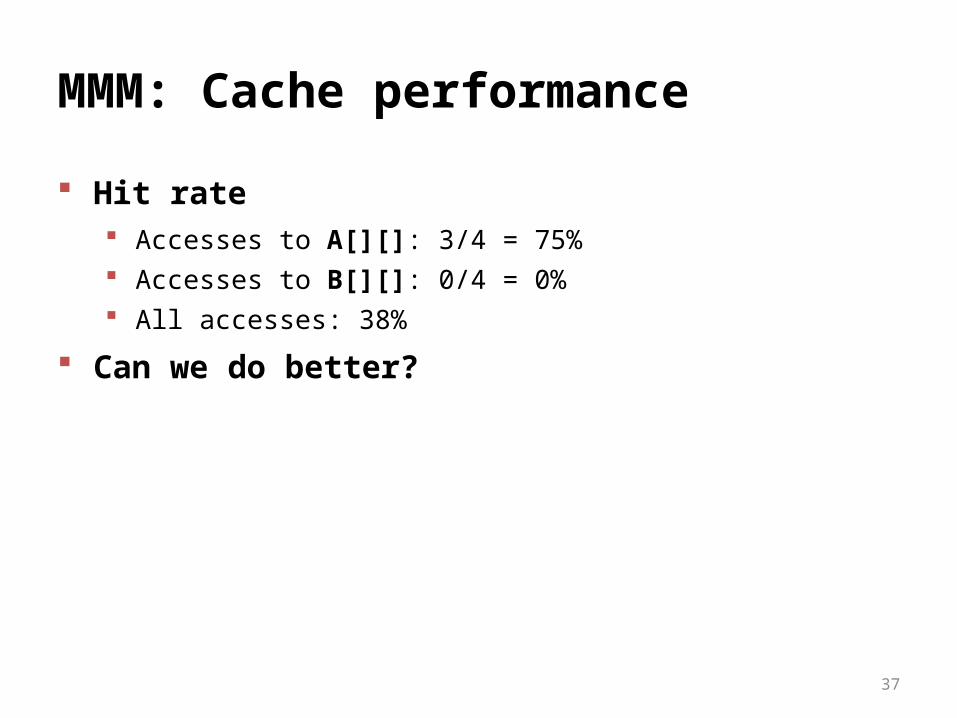
MMM: Cache performance
Hit rate Accesses to A[][]: 3/4 = 75% Accesses to B[][]: 0/4 = 0% All accesses: 38%
Can we do better?

38
Cache-friendly MMM
Cache-unfriendly MMM (ijk) Cache-friendly MMM (ikj)
for (i=0; i<N; i++)for (j=0; j<N; j++) {
sum = 0.0;for (k=0; k <
N; k++)sum +=
A[i][k]*B[k][j];C[i][j] += sum;
}
for (i=0; i<N; i++)for (k=0; k<N; k++) {
r = A[i][k];for (j=0; j <
N; j++)C[i][j]
+= r*B[k][j];}
C A B= Xk
iik
39
RAM
BC A
Cache
MMMCPU
30 cycles access latency
200 cycles access latency
Cache hits Total accesses
C[][]B[][]
44
??33

40
Cache-friendly MMM
Cache-unfriendly MMM (ijk)
A[][]: 3/4 = 75% hit rate
B[][]: 0/4 = 0% hit rate
All accesses: 38% hit rate
Cache-friendly MMM (ikj)
C[][]: 3/4 = 75% hit rate
B[][]: 3/4 = 75% hit rate
All accesses: 75% hit rate
Better performance due to cache-friendliness?

41
512 1024 2048 4096 81920.01
0.1
1
10
100
1000
10000
ijk (cache-unfriendly) ikj (cache-friendly)
Matrix size
Performance of MMMExecution time [s]

42
512 1024 2048 4096 81920.01
0.1
1
10
100
1000
10000
ijk (cache-unfriendly) ikj (cache-friendly)
Matrix size
Performance of MMMExecution time [s]
20X

43
Cache-aware programming
Two versions of MMM: ijk and ikj Same number of operations (~n3) ikj 20X better than ijk
Good performance depends on two aspects Good algorithm Implementation that takes hardware into account
Hardware Many possibilities for inefficiencies We consider only the memory system in this lecture

44
Outline
Introduction: performance optimizations
Cache-aware programming
Scheduling on multicore processors
Using run-time feedback
Data locality optimizations on NUMA-multicores
Conclusions
ETH scholarship

45
CPU
Cache-based architecture
RAM
Bus Controller
L1-C
CacheL2 Cache
Memory Controller
10 cycles access latency
20 cycles access latency
200 cycles access latency

46
Processor package
CPUCore
Multi-core multiprocessor
RAM
Bus Controller
L1-C
CacheL2 Cache
Memory Controller
Core
L1-C
Core
L2 Cache
L1-C
Core
L1-C
Processor package
CPUCore
Bus Controller
L1-C
CacheL2 Cache
Core
L1-C
Core
L2 Cache
L1-C
Core
L1-C
Memory Controller
47
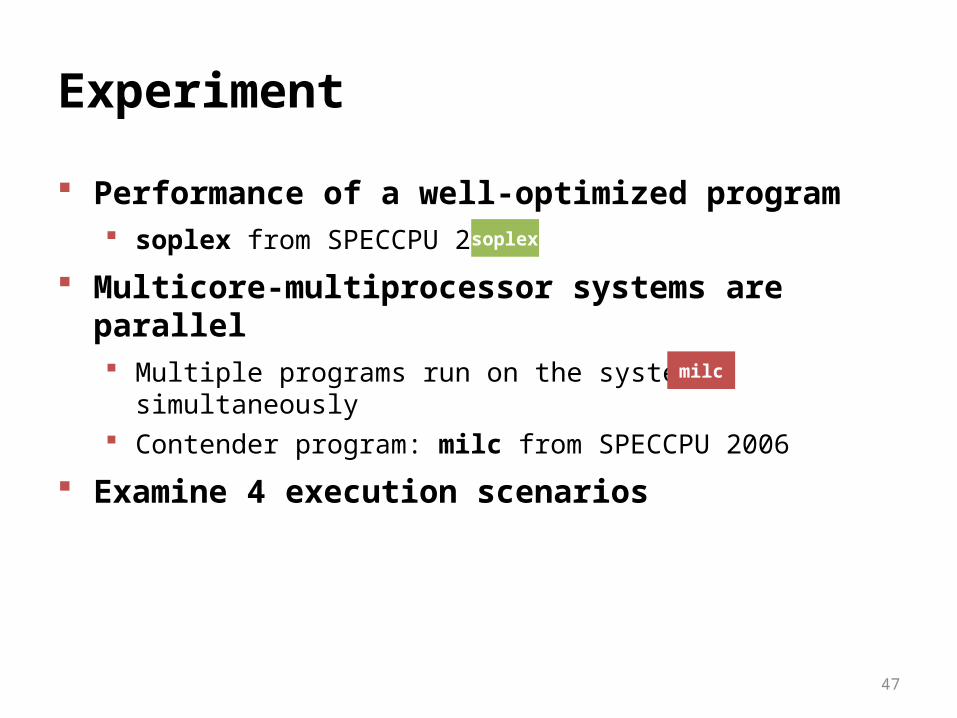
Experiment
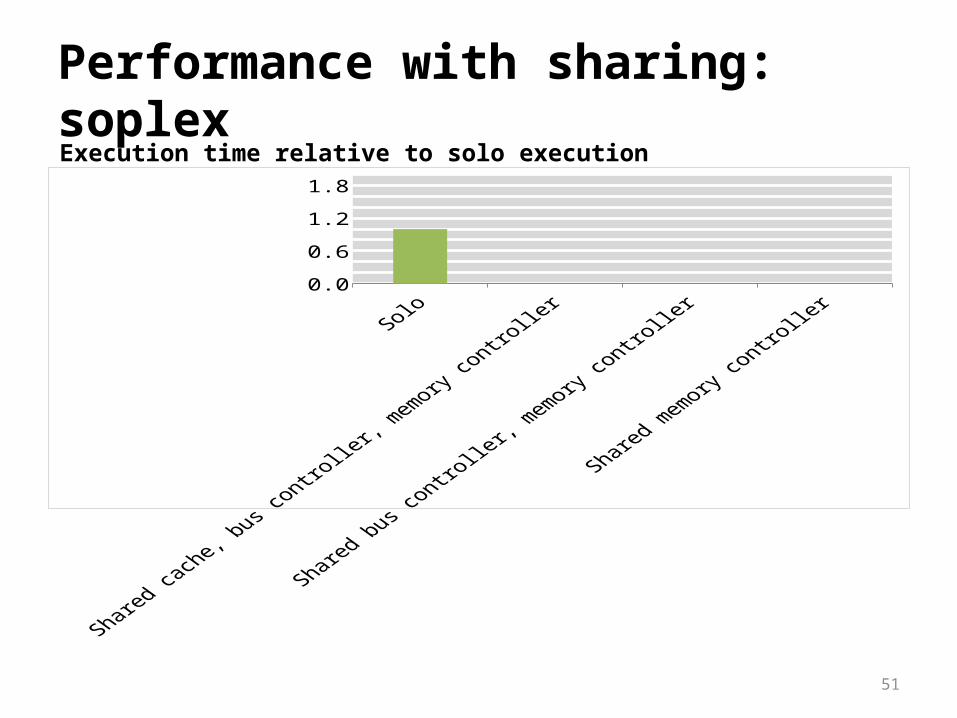
Performance of a well-optimized program soplex from SPECCPU 2006
Multicore-multiprocessor systems are parallel Multiple programs run on the system simultaneously Contender program: milc from SPECCPU 2006
Examine 4 execution scenarios
soplex
milc
48
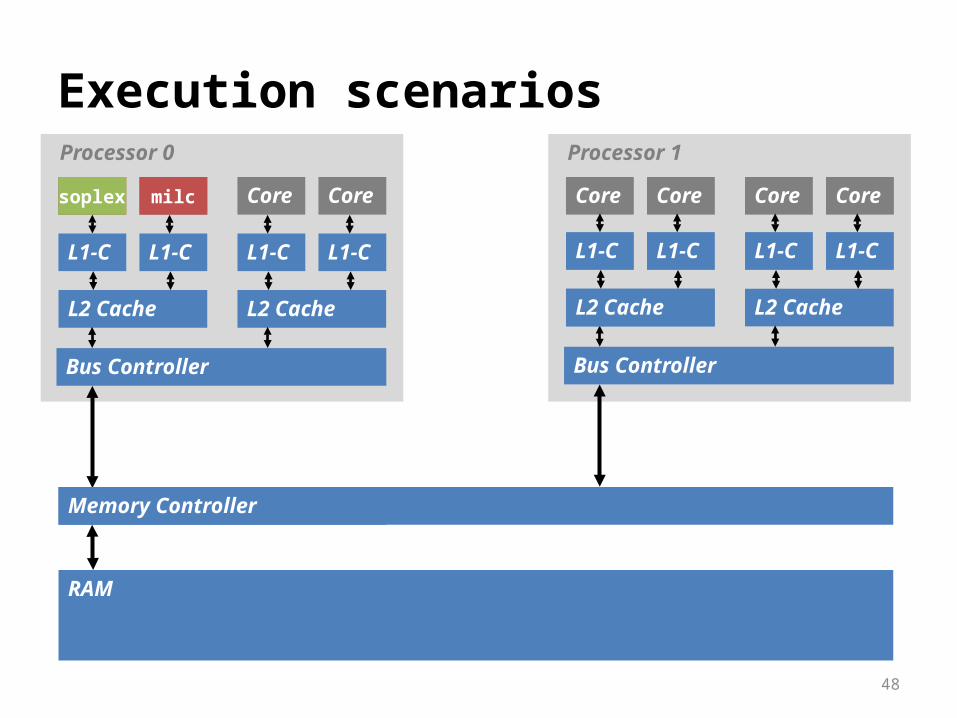
Execution scenariosProcessor 0
L2 Cache
CPUCore
RAM
Bus Controller
L1-C
Memory Controller
Core
L1-C
Core
L2 Cache
L1-C
Core
L1-C
Processor 1
Core
Bus Controller
L1-C
CacheL2 Cache
Core
L1-C
Core
L2 Cache
L1-C
Core
L1-C
Memory Controller
soplex milc

49
Execution scenariosProcessor 0
L2 Cache
CPUCore
RAM
Bus Controller
L1-C
Memory Controller
Core
L1-C
Core
L2 Cache
L1-C
Core
L1-C
Processor 1
Core
Bus Controller
L1-C
CacheL2 Cache
Core
L1-C
Core
L2 Cache
L1-C
Core
L1-C
Memory Controller
soplex milc

50
Performance with sharing: soplex
0.00.40.81.21.62.0
Execution time relative to solo execution
51
Performance with sharing: soplex
0.00.40.81.21.62.0
Execution time relative to solo execution

52
Performance with sharing: soplex
0.00.40.81.21.62.0
Execution time relative to solo execution
53
Resource sharing
Significant slowdowns due to resource sharing
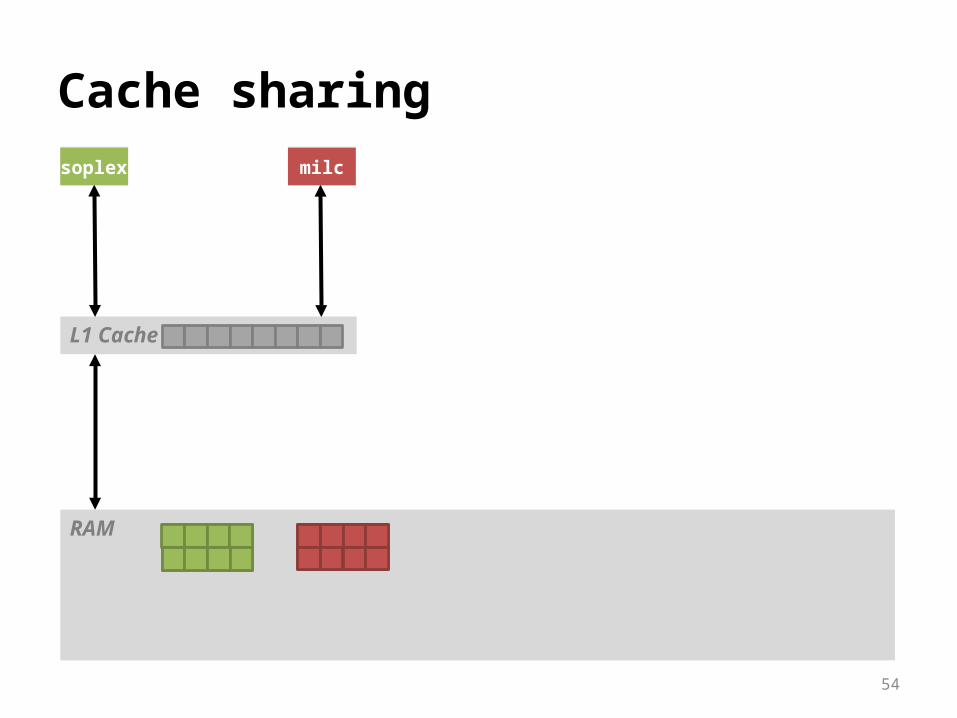
Why is resource sharing so bad?Example: cache sharing
54
RAM
L1 Cache
Cache sharingCore Coresoplex milc

55
RAM
L1 Cache
Cache sharingCore Coresoplex milc

56
Resource sharing
Does resource sharing affect all programs? So far: we considered at the performance of under contention Let us consider a different program:
soplex
namd

57
Performance with sharing
0.00.40.81.21.62.0
soplexnamd
Execution time relative to solo execution

58
Performance with sharing
0.00.40.81.21.62.0
soplexnamd
Execution time relative to solo execution
59
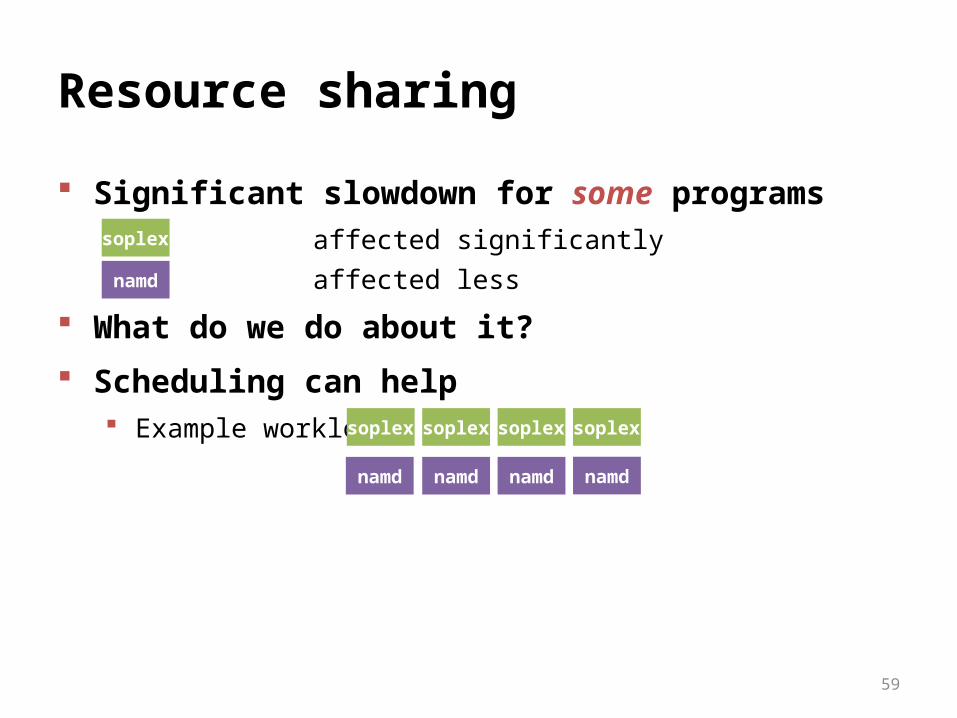
Resource sharing
Significant slowdown for some programs affected significantly affected less
What do we do about it?
Scheduling can help Example workload:
soplex
namd
soplex soplexsoplexsoplex
namd namd namd namd

60
Execution scenariosProcessor 0
L2 Cache
CPUCore
RAM
Bus Controller
L1-C
Memory Controller
Core
L1-C
Core
L2 Cache
L1-C
Core
L1-C
Processor 0
Core
Bus Controller
L1-C
CacheL2 Cache
Core
L1-C
Core
L2 Cache
L1-C
Core
L1-C
Memory Controller
soplex soplex soplex soplex namdnamd namd namd
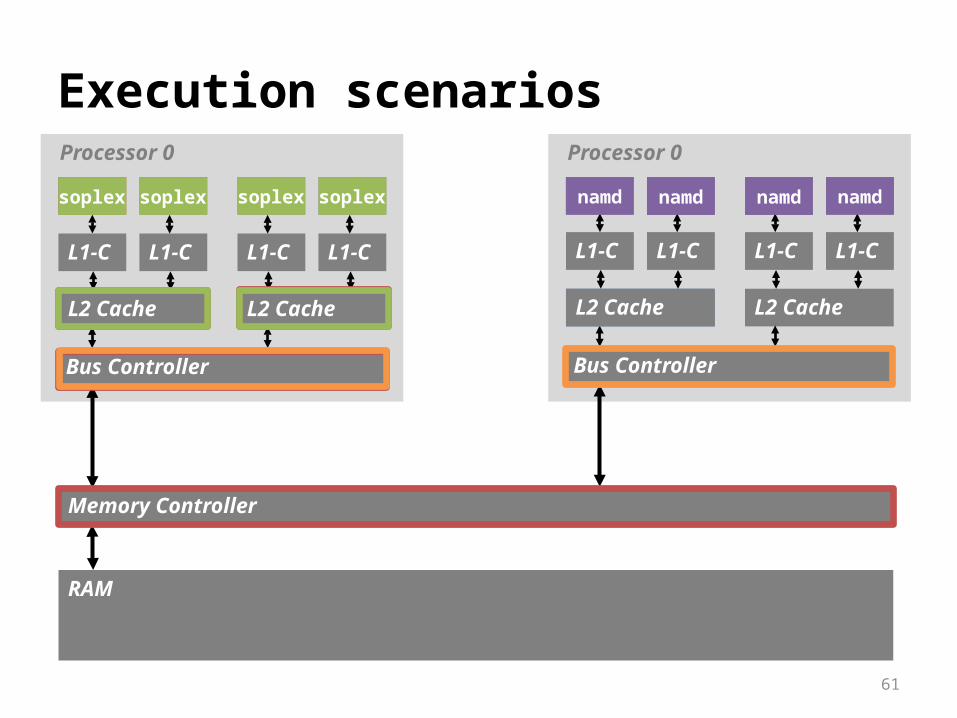
61
Execution scenariosProcessor 0
L2 Cache
CPUCore
RAM
Bus Controller
L1-C
Memory Controller
Core
L1-C
Core
L2 Cache
L1-C
Core
L1-C
Processor 0
Core
Bus Controller
L1-C
CacheL2 Cache
Core
L1-C
Core
L2 Cache
L1-C
Core
L1-C
Memory Controller
soplex soplex namd namdsoplex namdsoplex namd

62
Challenges for a scheduler
Programs have different behaviors
Behavior not known ahead-of-time vs.
Behavior changes over time
soplex namd

63
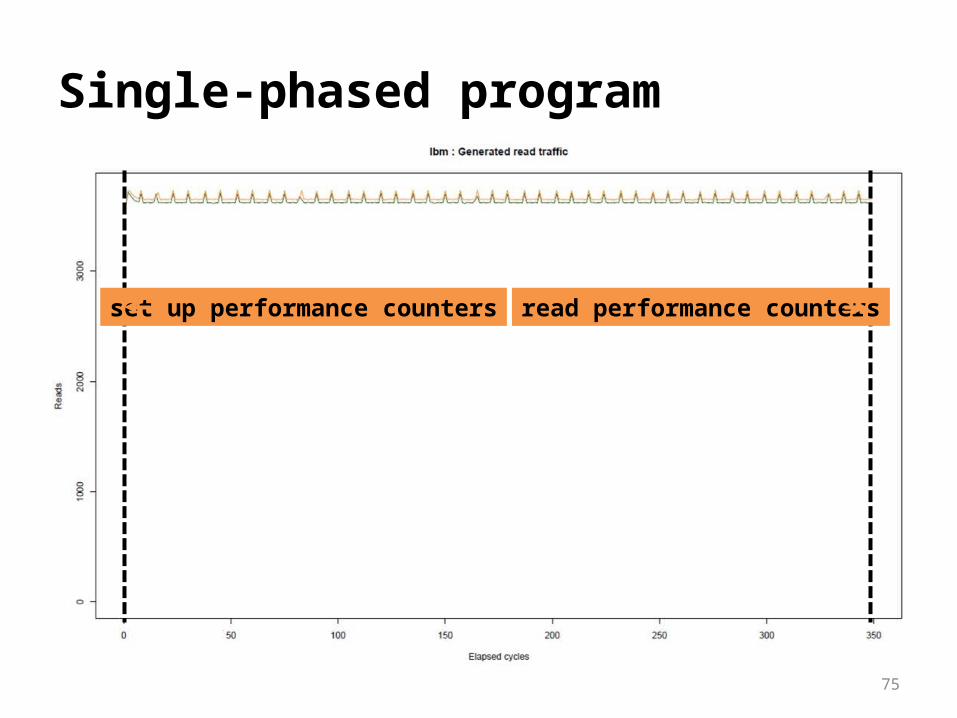
Single-phased program

64
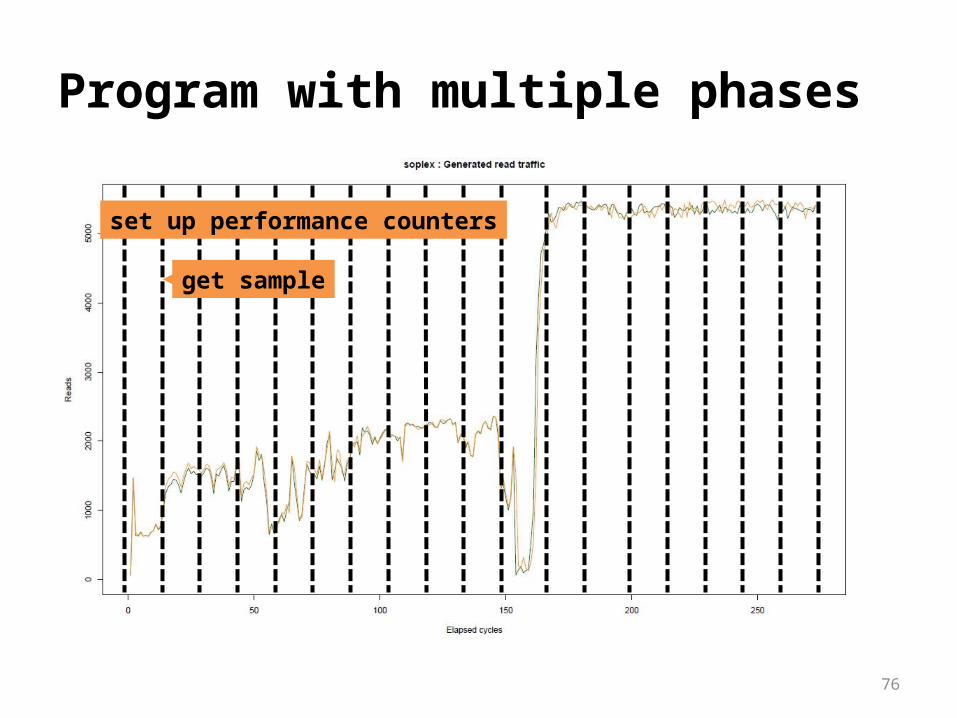
Program with multiple phases

65
Outline
Introduction: performance optimizations
Cache-aware programming
Scheduling on multicore processors
Using run-time feedback
Data locality optimizations on NUMA-multicores
Conclusions
ETH scholarship

66
Hardware performance counters
Special registers Programmable to monitor given hardware event (e.g., cache misses) Low-level information about hardware-software interaction Low overhead due to hardware implementation
In the past: undocumented feature
Since Intel Pentium: publicly available description Debugging tools: Intel VTune, Intel PTU, AMD CodeAnalyst
67
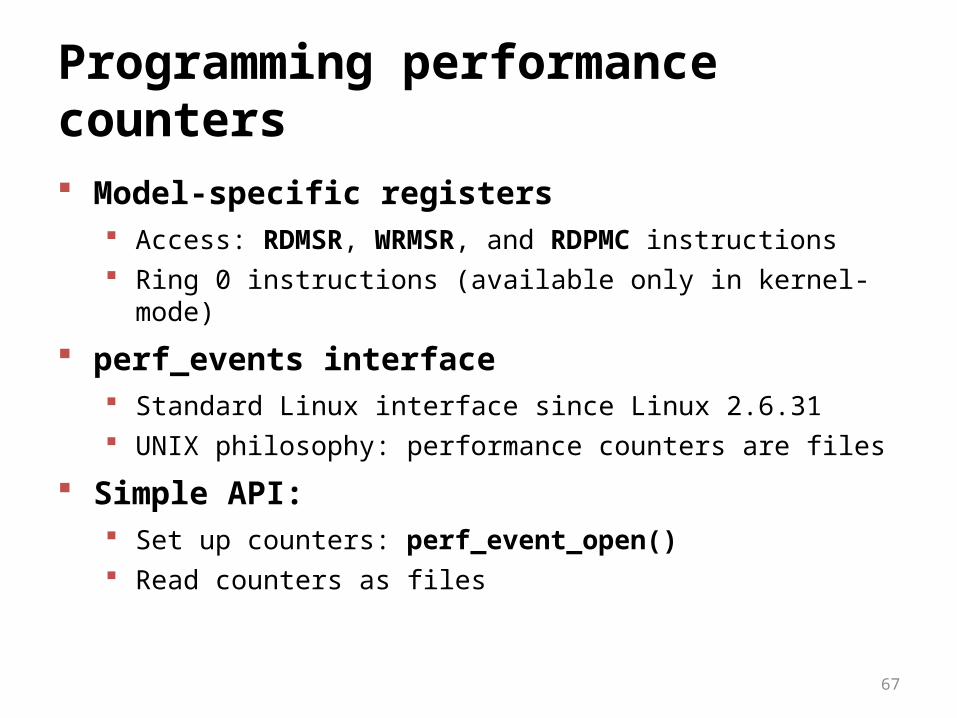
Programming performance counters
Model-specific registers Access: RDMSR, WRMSR, and RDPMC instructions Ring 0 instructions (available only in kernel-mode)
perf_events interface Standard Linux interface since Linux 2.6.31 UNIX philosophy: performance counters are files
Simple API: Set up counters: perf_event_open() Read counters as files

68
int main() {
int pid = fork();
if (pid == 0) {
exit(exec(“./my_program”, NULL));
} else {
int status; uint64_t value;
int fd = perf_event_open(...);
waitpid(pid, &status, NULL);
read(fd, &value, sizeof(uint64_t);
printf(”Cache misses: %”PRIu64”\n”, value);
}
}
Example: monitoring cache misses

69
perf_event_open()
Looks simpleint sys_perf_event_open(
struct perf_event_attr *hw_event_uptr,
pid_t pid,
int cpu,
int group_fd,
unsigned long flags
);
struct perf_event_attr {__u32 type;__u32 size;__u64 config;union {
__u64 sample_period;__u64 sample_freq;
};__u64 sample_type;__u64 read_format;__u64 inherit;__u64 pinned;__u64 exclusive;__u64 exclude_user;__u64 exclude_kernel;__u64 exclude_hv;__u64 exclude_idle;__u64 mmap;
70
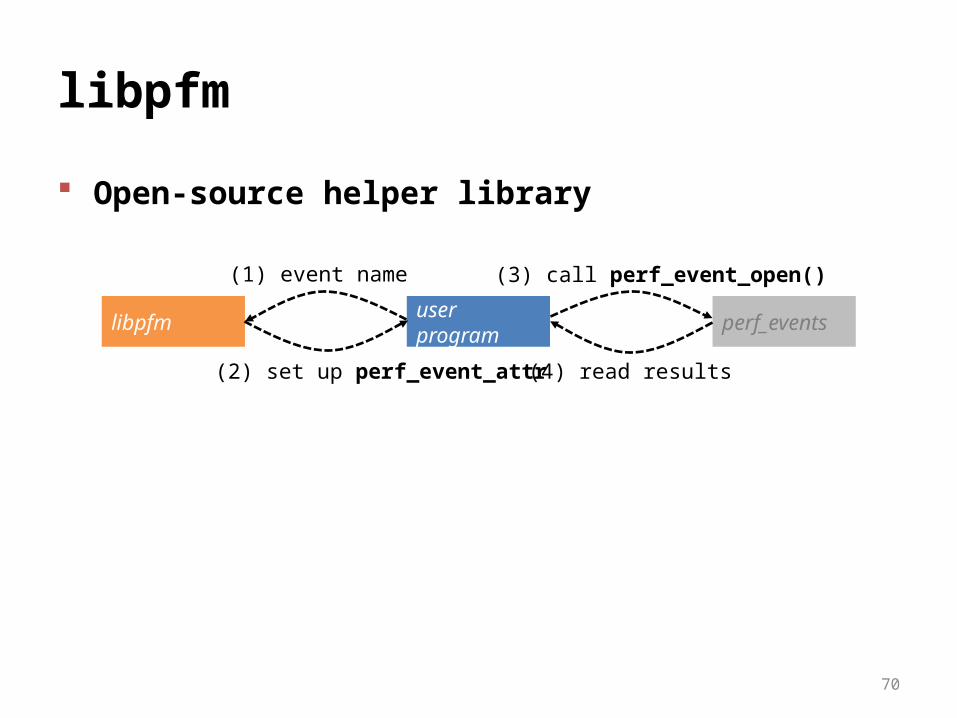
libpfm
Open-source helper library
user programlibpfm perf_events
(1) event name
(2) set up perf_event_attr
(3) call perf_event_open()
(4) read results
71
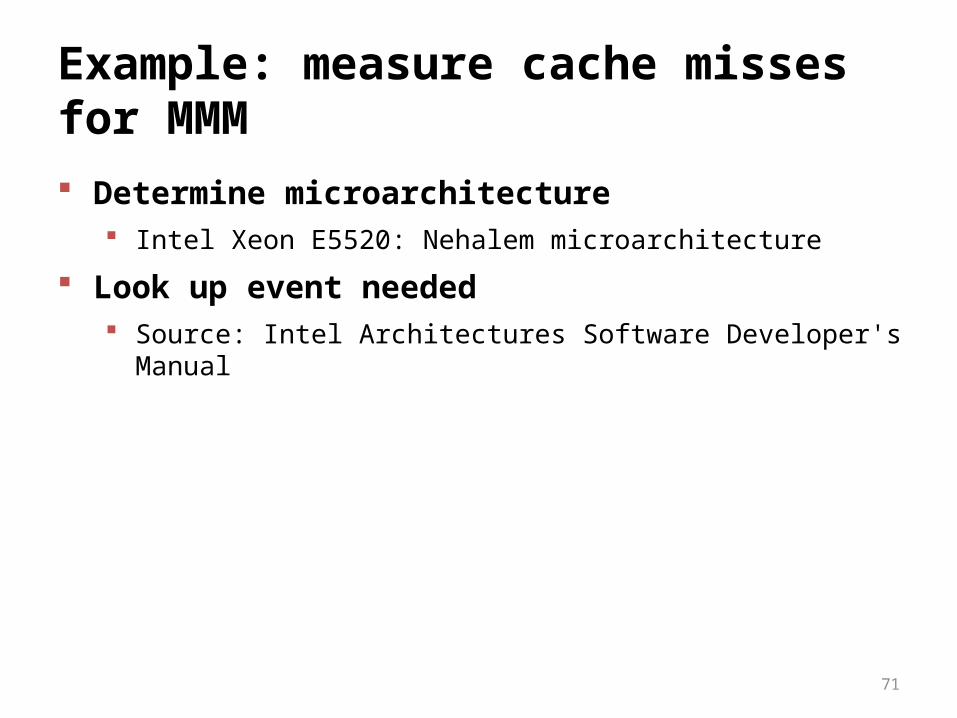
Example: measure cache misses for MMM
Determine microarchitecture Intel Xeon E5520: Nehalem microarchitecture
Look up event needed Source: Intel Architectures Software Developer's Manual

72
Software Developer’s Manual

73
Example: measure cache misses for MMM
Determine microarchitecture Intel Xeon E5520: Nehalem microarchitecture
Look up event needed Source: Intel Architectures Software Developer's Manual Event name: OFFCORE_RESPONSE_0:ANY_REQUEST:ANY_DRAM

74
512 1024 2048 4096 819210000
100000
1000000
10000000
100000000
1000000000
10000000000
100000000000
1000000000000
ijk (cache-unfriendly) ikj (cache-friendly)
Matrix size
MMM cache misses# cache misses x 106
30X
75
Single-phased program
set up performance counters read performance counters
76
Program with multiple phases
set up performance counters
get sample
77
Membus: multicore scheduler
1. Dynamically determine program behavior Measure # of loads/stores that cause memory traffic Hardware performance counters in sampling mode
2. Determine optimal placement based on measurements
78
Evaluation
Workload with 8 processes lbm, soplex, gromacs, hmmer from SPEC CPU 2006 Two instances of each program
Experimental results
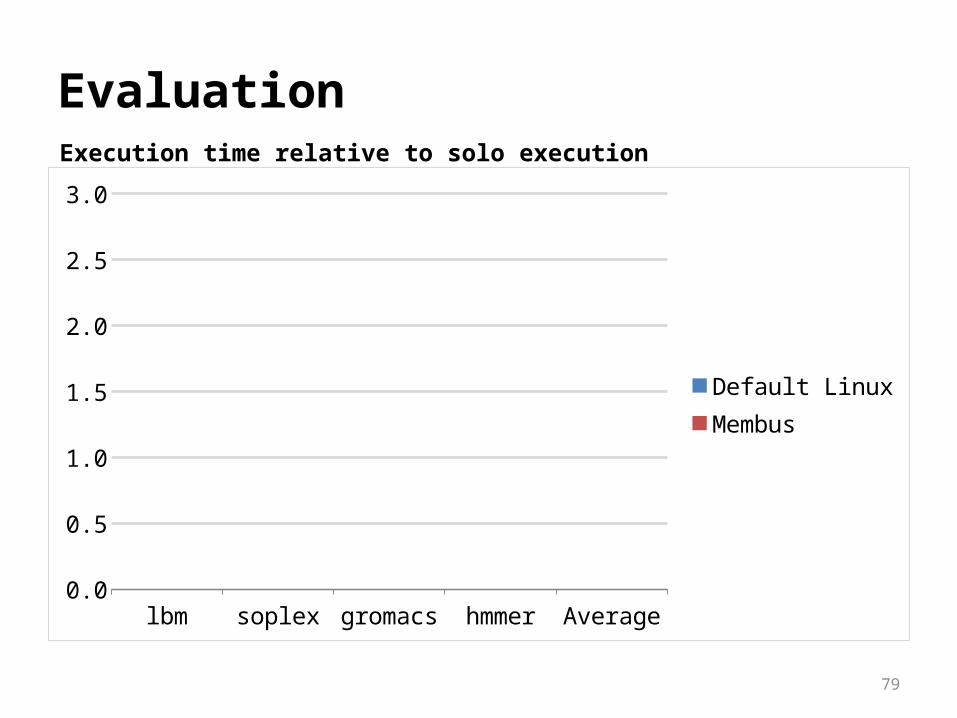
79
Evaluation
lbm soplex gromacs hmmer Average0.0
0.5
1.0
1.5
2.0
2.5
3.0
Default LinuxMembus
Execution time relative to solo execution

80
Evaluation
lbm soplex gromacs hmmer Average0.0
0.5
1.0
1.5
2.0
2.5
3.0
Default LinuxMembus
Execution time relative to solo execution

81
Evaluation
lbm soplex gromacs hmmer Average0.0
0.5
1.0
1.5
2.0
2.5
3.0
Default LinuxMembus
Execution time relative to solo execution
16%
8%

82
Summary: multicore processors
Resource sharing critical for performance
Membus: a scheduler that reduces resource sharing
Question: why wasn’t Membus able to improve more?

83
Memory controller sharingProcessor 0
L2 Cache
CPUCore
RAM
Bus Controller
L1-C
Memory Controller
Core
L1-C
Core
L2 Cache
L1-C
Core
L1-C
Processor 1
Core
Bus Controller
L1-C
CacheL2 Cache
Core
L1-C
Core
L2 Cache
L1-C
Core
L1-C
Memory Controller
soplex soplex namd namdnamd soplexnamd soplex

84
Memory Controller
Non-uniform memory architectureProcessor 0
L2 Cache
CPUCore
RAM
Bus Controller
L1-C
Core
L1-C
Core
L2 Cache
L1-C
Core
L1-C
Processor 1
Bus Controller
L1-C
CacheL2 Cache
Core
L1-C
Core
L2 Cache
L1-C
Core
L1-C
RAM RAM
Core

85
Non-uniform memory architectureProcessor 0
L2 Cache
CPUCore
Memory Ctrl
L1-C
Core
L1-C
Core
L2 Cache
L1-C
Core
L1-C
Processor 1
Core
Memory Ctrl
L1-C
CacheL2 Cache
Core
L1-C
Core
L2 Cache
L1-C
Core
L1-C
RAM RAM
Interconnect Interconnect

86
Outline
Introduction: performance optimizations
Cache-aware programming
Scheduling on multicore processors
Using run-time feedback
Data locality optimizations on NUMA-multicores
Conclusions
ETH scholarship

87
Non-uniform memory architecture
Processor 1
Core 4 Core 5
Core 6 Core 7
IC MC
DRAM
Processor 0
Core 0 Core 1
Core 2 Core 3
MC IC
DRAM

88
Non-uniform memory architecture
Local memory accessesbandwidth: 10.1 GB/slatency: 190 cycles
Processor 1
Core 4 Core 5
Core 6 Core 7
IC MC
DRAM
Processor 0
Core 0 Core 1
Core 2 Core 3
MC IC
DRAM
T
Data
All data based on experimental evaluation of Intel Xeon 5500 (Hackenberg [MICRO ’09], Molka [PACT ‘09])

89
Non-uniform memory architecture
Local memory accessesbandwidth: 10.1 GB/slatency: 190 cycles
Remote memory accessesbandwidth: 6.3 GB/slatency: 310 cycles
Processor 1
Core 4 Core 5
Core 6 Core 7
IC MC
DRAM
Processor 0
Core 0 Core 1
Core 2 Core 3
MC IC
DRAM
T
Data
Key to good performance: data locality
All data based on experimental evaluation of Intel Xeon 5500 (Hackenberg [MICRO ’09], Molka [PACT ‘09])

90
Data locality in multithreaded programs
cg. B lu.C ft.B ep.C bt.B sp.B is.B mg.C0%
10%
20%
30%
40%
50%
60%
NAS Parallel Benchmarks
Remote memory references / total memory references [%]

91
Data locality in multithreaded programs
cg. B lu.C ft.B ep.C bt.B sp.B is.B mg.C0%
10%
20%
30%
40%
50%
60%
NAS Parallel Benchmarks
Remote memory references / total memory references [%]

92
First-touch page placement policy
Processor 1
DRAM
Processor 0
DRAM
T0 T1
P0
R/W

93
First-touch page placement policy
Processor 1
DRAM
Processor 0
DRAM
T0 T1
P1
R/W
P0
94
Automatic page placement
First-touch page placement Often high number of remote accesses
Data address profiling Profile-based page-placement Supported by hardware performance counters many architectures
95
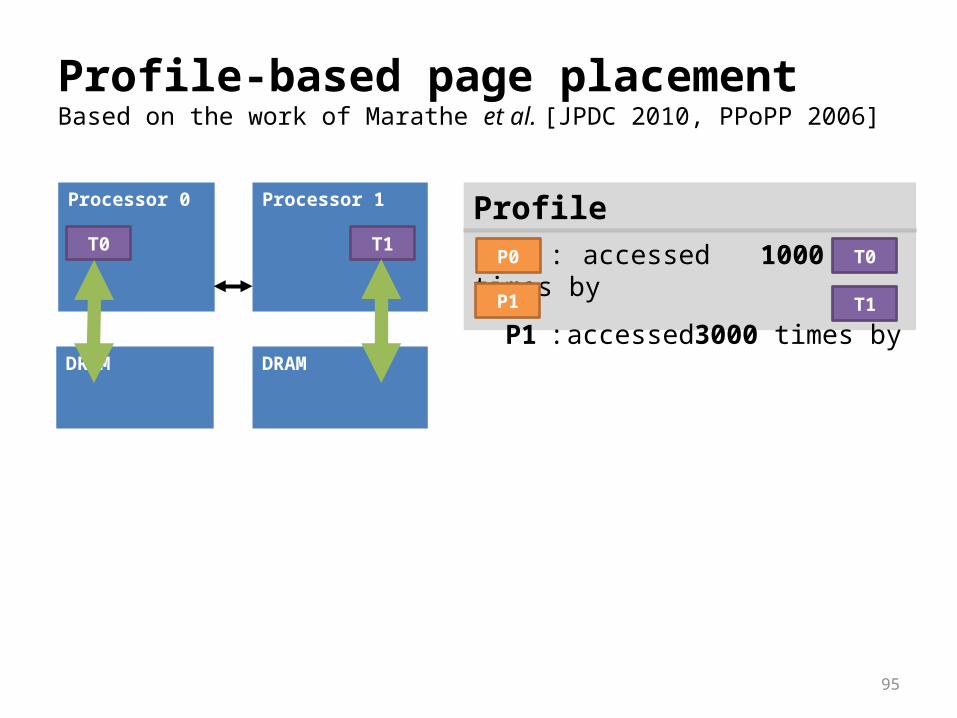
Profile-based page placementBased on the work of Marathe et al. [JPDC 2010, PPoPP 2006]
Processor 1
DRAM
Processor 0
DRAM
T0
Profile P0 : accessed 1000 times by
P1 : accessed3000 times by
T0T1
T1P1
P0

96
Automatic page placement
Compare: first-touch and profile-based page placement Machine: 2-processor 8-core Intel Xeon E5520 Subset of NAS PB: programs with high fraction of remote accesses 8 threads with fixed thread-to-core mapping

97
Profile-based page placement
cg.B lu.C bt.B ft.B sp.B0%
5%
10%
15%
20%
25%Performance improvement over first-touch [%]

98
Profile-based page placement
cg.B lu.C bt.B ft.B sp.B0%
5%
10%
15%
20%
25%Performance improvement over first-touch [%]

99
Profile-based page placement
Performance improvement over first-touch in some cases No performance improvement in many cases
Why?

100
Inter-processor data sharing
Processor 1
DRAM
Processor 0
DRAM
T0
Profile P0 : accessed 1000 times by
P1 : accessed 3000 times by
T0T1
T1
P0 P1
P2 : accessed 4000 times by
accessed 5000 times by
T0
T1
P2
P2: inter-processor shared

101
Inter-processor data sharing
Processor 1
DRAM
Processor 0
DRAM
T0
Profile P0 : accessed 1000 times by
P1 : accessed 3000 times by
T0T1
T1
P0 P1
P2 : accessed 4000 times by
accessed 5000 times by
T0
T1P2
P2: inter-processor shared

102
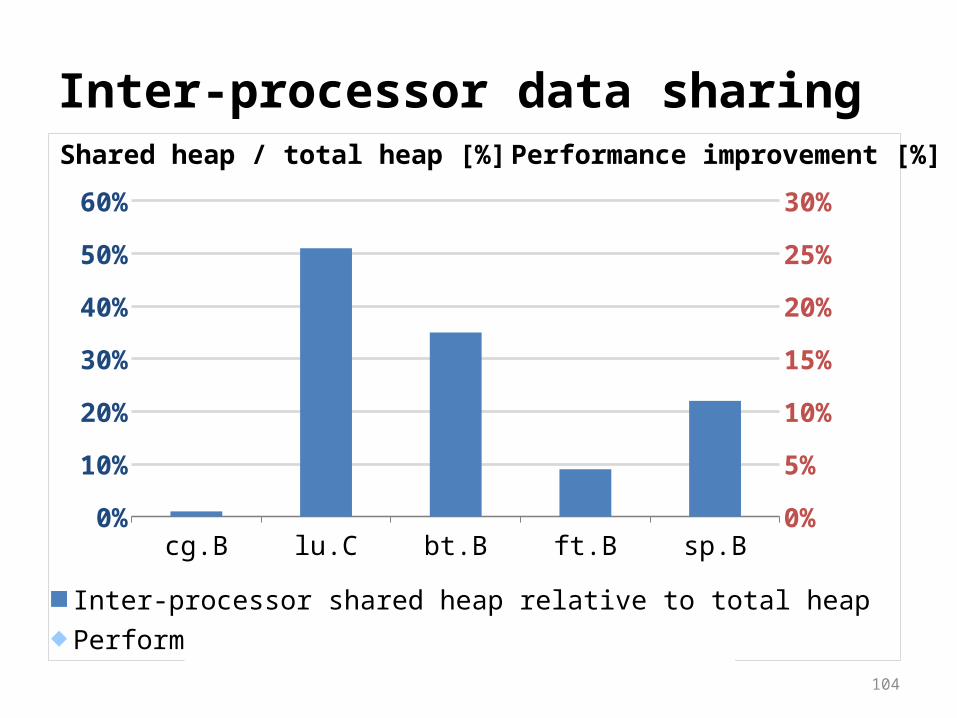
Inter-processor data sharing
cg.B lu.C bt.B ft.B sp.B0%
10%
20%
30%
40%
50%
60%
Inter-processor shared heap relative to total heap
Shared heap / total heap [%]

103
Inter-processor data sharing
cg.B lu.C bt.B ft.B sp.B0%
10%
20%
30%
40%
50%
60%
Inter-processor shared heap relative to total heap
Shared heap / total heap [%]
104
Inter-processor data sharing
cg.B lu.C bt.B ft.B sp.B0%
10%
20%
30%
40%
50%
60%
0%
5%
10%
15%
20%
25%
30%
Inter-processor shared heap relative to total heapPerformance improvement over first-touch
Shared heap / total heap [%] Performance improvement [%]
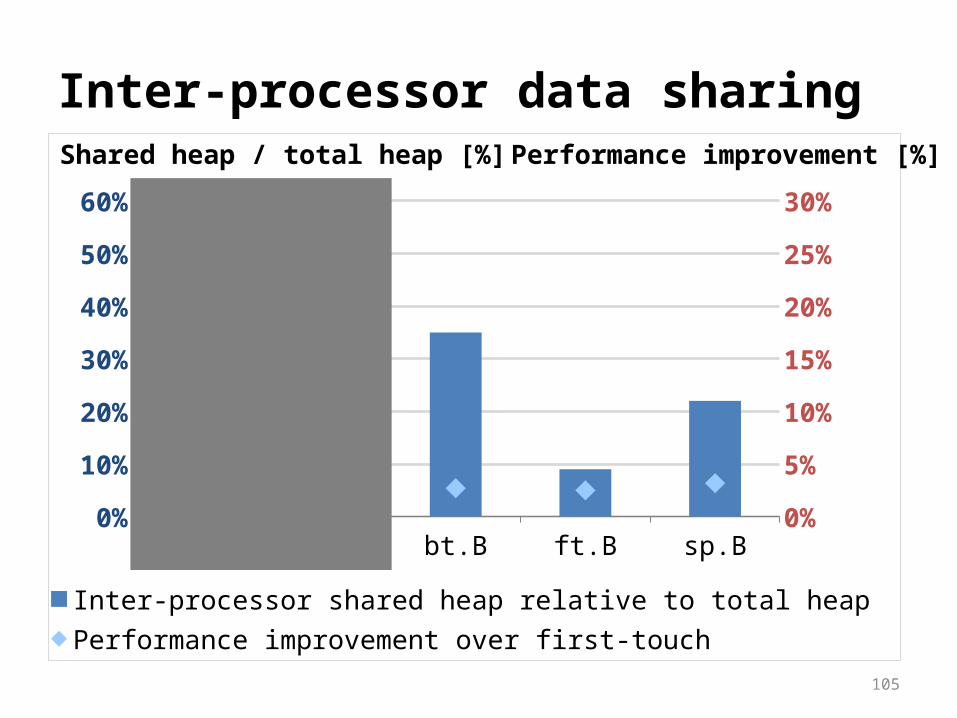
105
Inter-processor data sharing
cg.B lu.C bt.B ft.B sp.B0%
10%
20%
30%
40%
50%
60%
0%
5%
10%
15%
20%
25%
30%
Inter-processor shared heap relative to total heapPerformance improvement over first-touch
Shared heap / total heap [%] Performance improvement [%]
106
Automatic page placement
Profile-based page placement often ineffective Reason: inter-processor data sharing
Inter-processor data sharing is a program property
We propose program transformations No time for details now, see results

107
cg.B lu.C bt.B ft.B sp.B0%
5%
10%
15%
20%
25%
Profile-based allocation Program transformations
EvaluationPerformance improvement over first-touch [%]

108
cg.B lu.C bt.B ft.B sp.B0%
5%
10%
15%
20%
25%
Profile-based allocation Program transformations
EvaluationPerformance improvement over first-touch [%]

109
Conclusions
Performance optimizations Good algorithm + hardware-awareness Example: cache-aware matrix multiplication
Hardware awareness Resource sharing in multicore processors Data placement in non-uniform memory architectures
A lot remains to be done...
...and you can be part of it!

110
ETH scholarship for masters students...
...to work on their master thesisIn the Laboratory of Software Technology
Prof. Thomas R. GrossPhD. Stanford University, MIPS project, supervisor John L.
HennessyCarnegie Mellon: Warp, iWarp, Fx projects
ETH offers to you Monthly scholarship of CHF 1500– 1700 (EUR 1200–1400) Assistance with finding housing Thesis topic

111
Possible Topics
Michael Pradel: Automatic bug finding
Luca Della Toffola: Performance optimizations for Java
Me: Hardware-aware performance optimizations
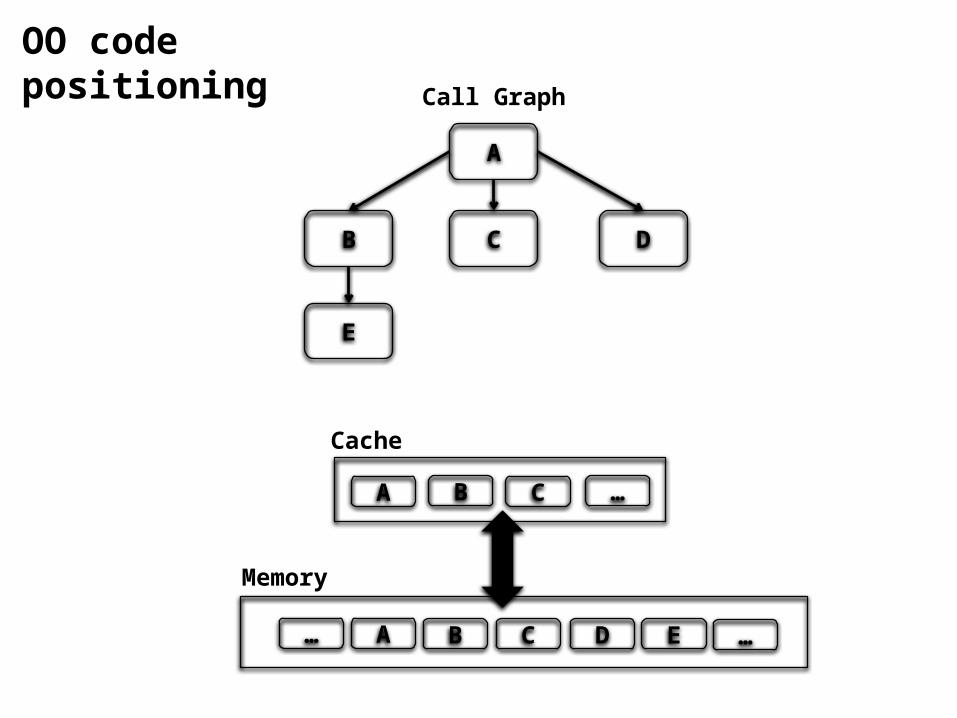
A
B DC
E
Call Graph
A B C D E
A B C
Memory
… …
…
Cache
OO code positioning

A
B DC
E
Call Graph
Profiling Hot Path

A
B DC
E
Call Graph
A B C D E
A B C
Memory
… …
…
Cache
Miss

A
B DC
E
Call Graph
A B CDE
A B E
Memory
… …
…
Cache
Hit
• JVM• No Profiling• Constructors

• Linked list traversal• Looking for the youngest/oldest person
Person
next
name
surname
age
Person
next
name
surname
age
Person
next
name
surname
age
Person
next
name
surname
age
null

Cache
next name agesurname
next name agesurname
next name agesurname
next name agesurname
next name agesurname next name agesurname

Cache
next name agesurname
next name agesurname
next name agesurname
next name agesurname
next name agesurname next name agesurname

Cache
next age next age next age next age
next age next age next age next age
next age next age next age next age
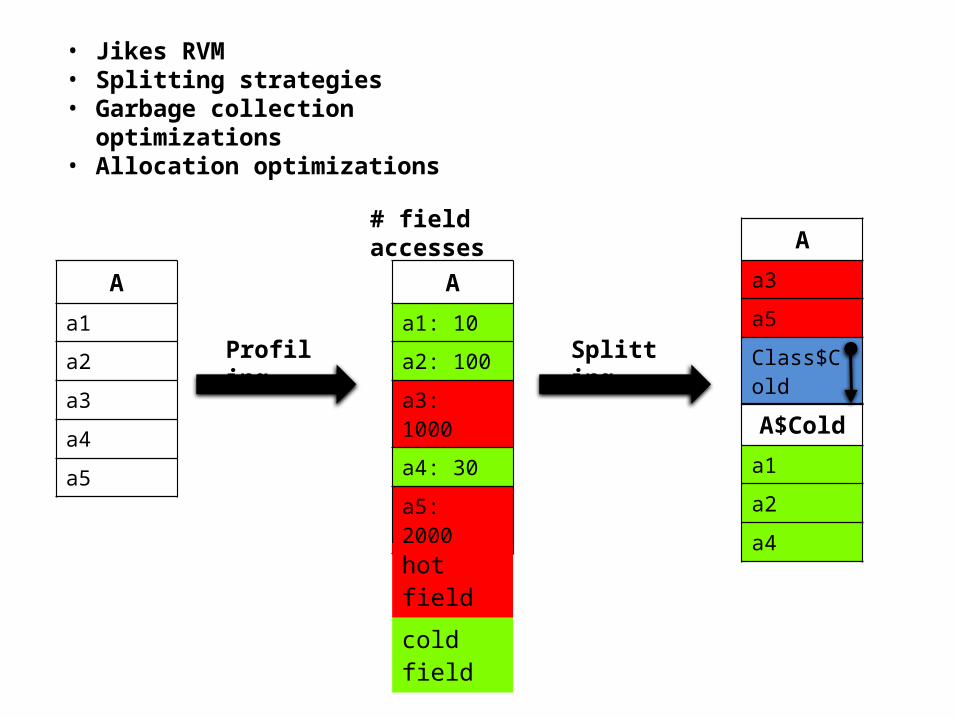
Aa1a2
a3
a4
a5
Aa1: 10a2: 100
a3: 1000
a4: 30
a5: 2000
Aa3a5
Class$Cold
A$Colda1a2
a4
hot field
cold field
Profiling Splitting
# field accesses
• Jikes RVM• Splitting strategies• Garbage collection optimizations• Allocation optimizations

121
If interested and motivated
Apply @ Prof. Rodica Potolea Until August 2012
Come to Zurich Start in February 2013 Work 4-6 months on the thesis
If you have questions Send e-mail to me [email protected] Talk to Prof. Rodica Potolea

122
Thank you for your attention!