performance report quarter 1 of 2008/09 · pdf fileperformance report quarter 1 of 2008/09 ......
TRANSCRIPT

Performance Report Quarter 1 of 2008/09 TABLE OF CONTENTS Page 1. Contents ………………………………………………………………………….. 1 2. Introduction…………….…………………………………………………………. 2 3. Client Records Data……………... ……………………………………………… 2
3a. Type of Service accessed by New Clients 3b. Referral Source of New Clients
4. Performance Indicators …………..……………………………………………… 3 4a. National Indicator Set 4b. Utilisation Short/Long Term Services
5. Outcomes…………………………………………………………………………. 6 5a. Short Term Outcomes Framework 5b. Short Term Outcomes Monitoring 5c. Long Term Outcomes Framework
5d. Long Term Outcomes Monitoring 6. Devon Care & Repair – Home Improvement Agency Service ……………… 13 APPENDIX KEYThe following pages contain all appendices referred to throughout the main body of this report. Please see below for a summary of each appendix. Page Appendix 1.1 - Current Cross-District Services ………………………………… 14 Appendix 1.2 - Countywide Performance Summary …………………………… 15 Appendix 1.3 - Cross-District Performance Summary …………………………. 16 Appendix 1.4 - East Devon Performance Summary …………………………… 17 Appendix 1.5 - Exeter Performance Summary …………………………………. 18 Appendix 1.6 - Mid Devon Performance Summary …………………………….. 19 Appendix 1.7 - North Devon Performance Summary …………………………... 20 Appendix 1.8 - South Hams Performance Summary …………………………… 21 Appendix 1.9 - Teignbridge Performance Summary ……………………………. 22 Appendix 1.10 - Torridge Performance Summary ………………………………. 23 Appendix 1.11 - West Devon Performance Summary ………………………….. 24 Appendix 1.12 - Devon’s Comparator Authorities ………………………………. 25 Appendix 1.13 - Home Improvement Agency (HIA) summary report …………. 26
Melanie Burke 1 08/12/2008 ACS-Management Information Team

2. Introduction Reporting performance and monitoring contracts primarily through performance indicators is no longer an acceptable position. Increasingly, local government authorities and Primary Care Trusts must be able to evidence to central government, department of health, inspection agencies and the public, that the money is being spent strategically and delivered to the public through services that are of high quality and outcome focussed around the client. This performance report aims to provide a high-level performance summary for the Supporting People programme with an outcome focussed approach. 3. Client Records Data The Joint Centre for Scottish Housing Research (JCSHR) collates client level data, submitted by providers, for all new service users joining a Devon SP service. The exception to this is sheltered housing schemes. The analysis shown below compares Devon to our comparator groups and the national average in terms of what types of services our clients have joined and also how the service user has been referred to the service. 3a. Type of Service accessed by New Clients Total number of new clients in April 2007 – June 2007: 589 Total number of new clients in April 2008 – June 2008*: 371 *Please note that not all quarter 1 2008/09 client record forms have been compiled by the Joint Centre for Scottish Housing Research (JSCHR) as forms often arrive late before the cut-off date for processing.
Type of service
Devon Apr 07 - Jun 07
Devon Apr 08 - Jun 08
Trend compared to last year's data
Comparator Authorities England
Floating Support 44% (262) 44% (163) 50% (2677) 41% (14907) Supported Housing 31% (185) 37% (137) 25% (1335) 27% (9717) Women's Refuge 7% (40) 11% (40) 5% (279) 7% (2389) Resettlement Services 7% (43) 6% (22) 3% (157) 3% (1039) Direct Access 6% (33) 2% (6) 10% (564) 17% (6002) Supported Lodgings 2% (12) 1% (3) 1% (55) 1% (197) Foyer 2% (12) 0 2% (118) 2% (561) Outreach Service 0% (2) 0 - 4% (195) 3% (1108) Residential Care Home 0 0 - 0 0% (11) Other* 0 0 - 0% (9) 0% (94)
* Other includes Adult placement and Teenage parent accommodation Compared to April 2007 – June 2007, in the period April 2008 – June 2008, there has been:
• An increase in the percentage of service users joining Supported Housing Services (37% in 2008/09 against 31% in the same period in 2007/08).
• No change in the percentage of service users joining Floating Support Services (44% in both periods)
Melanie Burke 2 08/12/2008 ACS-Management Information Team

3b. Referral Source of New Clients
Source of Referral
Devon Apr 07 - Jun 07
Devon Apr 08 - Jun 08
Trend compared to last year's data
Comparator Authorities England
LA Housing Dept* 36% (210) 25% (94) 27% (1435) 28% (10173)
Self referral 13% (74) 16% (58) 25% (1335) 25% (9025) Voluntary Agency 10% (57) 11% (42) 8% (408) 11% (3814)
Community Mental Health Team
8% (45) 14% (52) 5% (292) 4% (1371)
Social services 8% (48) 5% (17) 7% (357) 8% (2704)
Probation/prison 6% (34) 5% (17) 3% (140) 3% (1247)
Internal transfer 4% (23) 2% (9) 6% (302) 5% (1653) Health service/GP 2% (13) 2% (7) 4% (241) 3% (1178)
Moving from another RSL 1% (7) 3% (11) 2% (87) 1% (320)
Police 1% (7) 4% (15) 3% (172) 2% (855)
Youth Offending Team 0 0% (1) 0% (14) 0% (164)
Other 12% (71) 13% (48) 11% (602) 10% (3489)
Nominated under MoveUK 0 0 - 0% (4) 0% (32)
* LA Housing Dept includes Nominated by local housing authority and LA housing department (referral) Compared to April 2007 – June 2007, in the period April 2008 – June 2008, there has been:
• A decrease in the percentage of service users accepted into services by referral from LA Housing Departments.
• There has been an increase in the percentage of service users accepted into services by Self Referral.
4. Performance Indicators Key performance indicators for short-term and long-term services are now included within the health and wellbeing section of the new National Indicator Set (NIS); a performance framework for local authority partnerships. These indicators mainstream Supporting People activity in the wider health and wellbeing agenda and allow us to benchmark against similar authorities to better manage performance. Alongside this, we capture service level performance through the CLG Supporting People Performance Indicator workbook. This level of detail can be useful both in terms of commissioning services strategically, and contract monitoring on an ongoing basis. Melanie Burke 3 08/12/2008 ACS-Management Information Team

4a. National Indicator Set NI 141: Percentage of vulnerable people achieving independent living Definition: The aim is to measure the extent to which housing related support (Supporting People) helps people move on in a planned way to more independent living (short term, less than 2 years) Status: A data quality issue has been identified in the previous reporting of this indicator that has now been dealt with. However, this suggests that the target of 75% set for 2008/09 set on past performance could now be a little ambitious. Devon’s average of 70.8% out performs the average of its comparator authorities
NI 141 Performance
60
62
64
66
68
70
72
74
76
Qtr 2 2007/08 Qtr 3 2007/08 Qtr 4 2007/08 Qtr 1 2008/09Reporting Quarter
NI 1
41 (%
)
Devon
ComparatorAuthorities*Target
DevonAverage
NI 142: Percentage of vulnerable people who are supported to maintain independent living Definition: To measure the extent to which the housing related support prevents service users from moving into institutional care (long term) Status: Devon’s average of 98.3% is just above the target of 98% set for 2008/09 and the average of its comparator authorities
NI 142 Performance
95.0
95.5
96.0
96.5
97.0
97.5
98.0
98.5
99.0
Qtr 2 2007/08 Qtr 3 2007/08 Qtr 4 2007/08 Qtr 1 2008/09Reporting Quarter
NI 1
42 (%
)
Devon
ComparatorAuthorities*Target
DevonAverage
* Comparator Authorities data relates to Benchmarking figures for Quarter 4 2007/08 Melanie Burke 4 08/12/2008 ACS-Management Information Team

Melanie Burke 5 08/12/2008 ACS-Management Information Team
4b. Utilisation Accommodation Based Service utilisation for accommodation based services is defined as occupancy. This indicator calculates the number of unit weeks or days that a service is occupied as a proportion of the total number of unit weeks or days for which it is available Floating Support Service utilisation for floating support services calculates the number of days that support is utilised by service users (under a support plan) as a percentage of the number of days support is contracted The tables below show a breakdown for short term and long term services of the percentage of services reporting less than 90% and 80% utilisation scores for accommodation based services and floating support services for the last four reporting quarters. Please note reported scores of 0 have been excluded Short Term Services Accommodation Based Services Floating Support Services
(including Outreach)
Reporting Period
Total number of uploaded
PI workbooks
Percentage of services with < 90%
Utilisation PI
Percentage of services with < 80%
Utilisation PI
Total number of uploaded
PI workbooks
Percentage of services with < 90%
Utilisation PI
Percentage of services with < 80%
Utilisation PI Q2 2007/08 57 35% (20) 11% (6) 39 28% (11) 21% (8) Q3 2007/08 60 18% (11) 7% (4) 43 26% (11) 16% (7) Q4 2007/08 60 12% (7) 5% (3) 43 16% (7) 12% (5) Q1 2008/09 60 13% (8) 5% (3) 42 12% (5) 5% (2)
13%(8) of short term accommodation based services at the end of Quarter 1 2008/09 was used on average less than 90% of the total time they were available and 5%(3) provided less than 80%. 12%(5) of short term floating support services (including outreach) at the end of Quarter 1 2008/09 were used on average less than 90% of the total time they were available and 5%(2) of floating support services provided less than 80%. Over the last four reporting quarters utilisation for short term accommodation based and floating support services has steadily improved. Long Term Services Accommodation Based Services Floating Support Services
(including Outreach)
Reporting Period
Total number of uploaded
PI workbooks
Percentage of services with < 90%
Utilisation PI
Percentage of services with < 80%
Utilisation PI
Total number of uploaded
PI workbooks
Percentage of services with < 90%
Utilisation PI
Percentage of services with < 80%
Utilisation PI Q2 2007/08 276 1% (3) 1% (2) 36 19% (7) 14% (5) Q3 2007/08 282 4% (12) 1% (4) 40 25% (10) 20% (8) Q4 2007/08 282 2% (7) 2% (5) 38 21% (8) 16% (6) Q1 2008/09 274 3% (7) 1% (4) 39 15% (6) 10% (4)
Utilisation for long term accommodation based services is good and has remained fairly constant over the last four reporting quarters. 3%(7) of short term accommodation based services at the end of Quarter 1 2008/09 was used on average less than 90% of the total time they were available and 1%(4) provided less than 80%.

5. Outcomes The Outcomes framework is broken down into five high level outcome domains:
• Achieve economic wellbeing • Enjoy and achieve • Be healthy • Stay safe • Make a positive contribution
Please note that an outcome is captured where a support need has been identified in the clients support plan. Therefore not all outcome domains will apply to all clients. 5a. Short Term Outcomes Framework Devon Supporting People has received outcomes data for service users who left an SP funded short term service between May 2007 and June 2008. This data is based on a total of 1113 outcomes forms submitted. Compliance The compliance rate for short term outcome forms submitted against the number of clients who left short term services in Quarter 4 2007/08 was close to 100%. Calculating the exact compliance rate is currently difficult. Action is being taken to improve this for the next report. (Compliance figures are based on Quarter 4 2007/08 to account for the delay between service users departing and outcome forms being submitted.) Demographic Summary
• Gender Of all short term outcome forms submitted in Devon May 2007 - June 2008 51% of service users were male and 49% female. When compared to an average of our comparator authorities this shows a slightly different picture as 46% of service users were male and 54% female
• Ethnicity
When looking at ethnicity in Devon 95% were white, 3% were from a BME group and 2% did not wish to disclose their ethnicity. This representation is generally proportionate to the BME profile of Devon. It is also a very similar profile to an average of our comparator authorities
• Age
The chart below shows the age profile of clients who left a short term service in Devon during the period. Currently there is no benchmarking information available for age.
Breakdown of age for short term outcome forms submitted May 2007 - June 2008
344, 31%
209, 19%
202, 18%
163, 15%
14, 1% 181,
16%16-18
19-25
26-34
35-44
45-64
65+
Melanie Burke 6 08/12/2008 ACS-Management Information Team

Melanie Burke 7 08/12/2008 ACS-Management Information Team
5b. Short Term Outcomes Monitoring Outcome forms submitted May 2007 – June 2008 This table shows the number and proportion of clients who required support to meet each outcome indicator, as identified in the client support plan. This is followed by the number and percentage of those clients that achieved each outcome. This has been benchmarked against an average of the percentage of outcomes achieved in our comparator authorities and nationally. A traffic light system has been used to rank Devon’s status against the performance of our comparator authorities. This data is based on a total of 1113 outcomes forms submitted.
Very Good - Devon's performance is more than 5% above our comparator authorities Acceptable - Devon's performance is within 5% of our comparator authorities Ask questions about performance - Devon's performance is more than 5% below our comparator authorities
Short Term Supporting People Outcomes % and no of clients that
required support in Devon
% and no achieved in
Devon
% achieved in
Comparator Authorities
% achieved Nationally
Devon Status
1) Achieve Economic Wellbeing a) Did the client need support to maximise their income? 71% (790) 89% (700) 88% 88% A b) Did the client need support to reduce overall debt? 49% (545) 65% (355) 71% 69% R c) Did the client need support to obtain paid work? 25% (278) 33% (91) 33% 27% A 2) Enjoy and Achieve a) Did the client need support to participate in training and education? 41% (459) 61% (280) 64% 61% A b) Did the client need support to participate in leisure/cultural/faith/informal learning? 29% (323) 73% (237) 79% 77% R c) Did the client need support to participate in any work-like activities? 23% (254) 70% (177) 61% 60% G d) Did the client need support to establish contact with external services? 47% (520) 81% (421) 85% 85% A 3)Be Healthy a) Did the client need support to better manage their physical health? 40% (449) 76% (341) 78% 78% A b) Did the client need support to better manage their mental health? 40% (449) 74% (333) 75% 73% A c)Did the client need support to better manage their substance misuse issues? 34% (375) 59% (223) 56% 56% A d)Is assistive technology/aids and adaptations helping the client maintain independence? 3% (33) 91% (30) 91% 91% A
4)Stay Safe a)Did the client need support to maintain their accommodation and avoid eviction? 63% (703) 68% (475) 73% 70% A b)Did the client need support to comply with statutory orders? 17% (186) 68% (127) 73% 72% A ci)Did the client need support to better manage self harm? 11% (127) 69% (88) 78% 75% R cii)Did the client need support to avoid causing harm to others? 11% (117) 70% (82) 70% 70% A ciii)Did the client need support to minimise harm/risk of harm from others? 20% (220) 77% (169) 83% 80% R 5)Make A Positive Contribution a)Did the client need support in developing confidence and ability to have greater choice and/or control and/or involvement? 62% (690) 84% (578) 86% 84% A
G A R

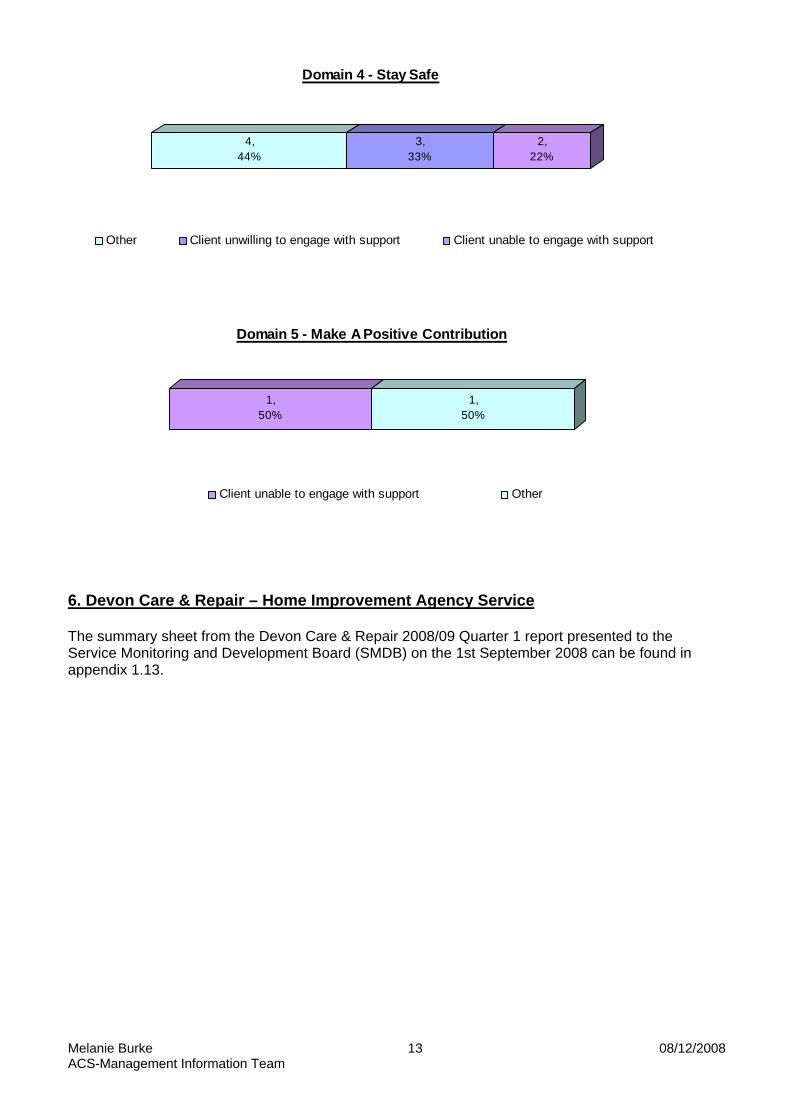
The charts shown below represent a limitation with the Outcomes framework responses in their current form. The majority of reasons captured why a client has not achieved a particular outcome are: “The client is unwilling to engage with support” or “The client ceased to receive support service before outcome was achieved” which is not necessarily useful. We will however use this information pro-actively to identify services that report a particularly high percentage of outcome responses in this manner, which will form part of our contract monitoring process.
162,35%
131,28%
43,9%
41,9%
26,6%
24,5%
23,5%
8,2%
5,1%
4,1%
Domain 1 - Achieve Economic Wellbeing
Client unwilling to engage with supportClient ceased to receive support before outcome was achievedClient had difficulties in making or maintaining payment arrangementsOtherClient unable to engage with supportClient unable to obtain paid workClient unable to work due to health problemsPaid work would not improve economic wellbeingClient did not qualify for benefit after being assessedProblems with local employment and/or careers service
Melanie Burke 8 08/12/2008 ACS-Management Information Team
145,35%
132,32%
49,12%
48,12%
14,3%
8,2%
7,2%
6,1%
5,1%
Domain 2 - Enjoy and Achieve
Client unwilling to engage with supportClient ceased to receive support service before outcome was achievedClient unable to engage with supportOtherClient unable to participate in training and/or education to health problemsCourse of training/education has not started by time of client departureClient had difficulties participating in chosen activities with social relationsClient unable to participate due to health problemsClient unable to establish contact due to personal difficulties
186,49%
107,28%
39,10%
26,7%
12,3%
3,1%
3,1%
3,1%
Domain 3 - Be Healthy
Client unwilling to engage with supportClient ceased to receive support service before outcome was achievedClient unable to engage with supportTreatment ongoingOtherClient awaiting assessmentLong waiting list for local mental health servicesProblems accessing alcohol services

Melanie Burke 9 08/12/2008 ACS-Management Information Team
151,37%
112,27%
58,14%
37,9%
32,8%
9,2%
5,1%
3,1% 3,
1%
2,0%
Domain 4 - Stay Safe
Client unwilling to engage with supportClient did not observe conditions of tenancy/occupancyClient ceased to receive support service before outcome was achievedOtherClient unable to engage with supportClient has personal difficulties relating to restrictions within statutory ordersProblems resulting from previous experience/risk of DV/abuseProblems with housing management services/landlordClient awaiting assessmentTreatment ongoing
45,40%
42,38%
16,14%
7,6%
1,1%
1,1%
Domain 5 - Make A Positive Contribution
Client unwilling to engage with supportClient ceased to receive support service before outcome was achievedClient unable to engage with supportOtherClient was refused access to services/activities related to increasing choice/involvement/controlMissing

5c. Long Term Outcomes Framework A sampling procedure is used to collect outcome information for long-term service users (intended duration of more than 2 years). This requires outcome forms to be submitted for a sample of clients on an annual basis (10% for older people and 50% for all other client groups). During July 2007 – March 2008 Devon Supporting People has received 507 outcome forms for long term service users. Demographic Summary
• Gender Of all long term outcome forms submitted in Devon July 2007 - March 2008 43% of service users were male and 57% female. This is a similar picture when compared to an average of our comparator authorities where 39% of service users were male and 61% female
• Ethnicity
When looking at ethnicity in Devon 98% were white, and 2% did not wish to disclose their ethnicity. This is a very similar profile to an average of our comparator authorities
• Age
The chart below shows the age profile of long term service users for whom outcome forms were submitted in Devon during the period. Currently there is no benchmarking information available for age.
Breakdown of age for long term outcome forms submitted July 2007 - March 2008
107, 21%
52, 10%
29, 6%15, 3%0, 0%
304, 60%
16-18
19-25
26-34
35-44
45-64
65+
Melanie Burke 10 08/12/2008 ACS-Management Information Team

Melanie Burke 11 08/12/2008 ACS-Management Information Team
5d. Long Term Outcomes Monitoring Outcome forms submitted July 2007 – March 2008 The approach for reporting on the long term outcomes framework is similar to the short term; however, the number and percentage of those service users needing on going support has been added to reflect the nature of long term services. This data is based on a total of 507 outcomes forms submitted.
Very Good - Devon's performance is more than 5% above our comparator authorities Acceptable - Devon's performance is within 5% of our comparator authorities Ask questions about performance - Devon's performance is more than 5% below our comparator authorities
G A R
Long Term Supporting People Outcomes
Proportion and no of clients that required
support in Devon
% and no achieved in Devon
% achieved in
Comparator Authorities
% achieved Nationally
Devon Status
% and no of clients
requiring on going support
in Devon 1) Achieve Economic Wellbeing a) Did the client need support to maximise their income? 68% (347) 98% (340) 97% 96% A 92% (312) b) Did the client need support to reduce overall debt? 10% (53) 94% (50) 80% 85% G 88% (44) c) Did the client need support to obtain paid work? 6% (32) 31% (10) 30% 24% A 90% (9) 2) Enjoy and Achieve a) Did the client need support to participate in training and education? 14% (70) 71% (50) 79% 70% R 90% (45) b) Did the client need support to participate in leisure/cultural/faith/informal learning? 47% (236) 92% (217) 94% 91% A 95% (206) c) Did the client need support to participate in any work-like activities? 14% (71) 72% (51) 79% 67% R 82% (42) d) Did the client need support to establish contact with external services? 60% (302) 97% (294) 96% 95% A 93% (273) 3)Be Healthy a) Did the client need support to better manage their physical health? 64% (326) 92% (301) 94% 93% A 96% (290) b) Did the client need support to better manage their mental health? 23% (117) 95% (111) 91% 91% A 94% (104) c)Did the client need support to better manage their substance misuse issues? 4% (20) 85% (17) 76% 74% G 88% (15) d)Is assistive technology/aids and adaptations helping the client maintain independence? 55% (281) 99% (278) 99% 99% A 89% (248) 4)Stay Safe a)Did the client need support to maintain their accommodation and avoid eviction? 52% (264) 99% (262) 98% 98% A 94% (245) b)Did the client need support to comply with statutory orders? 2% (8) 100% (8) 85% 86% G 63% (5) ci)Did the client need support to better manage self harm? 4% (20) 85% (17) 90% 91% A 100% (17) cii)Did the client need support to avoid causing harm to others? 3% (15) 80% (12) 87% 89% R 100% (12) ciii)Did the client need support to minimise harm/risk of harm from others? 11% (58) 98% (57) 97% 96% A 98% (56) 5)Make A Positive Contribution a)Did the client need support in developing confidence and ability to have greater choice and/or control and/or involvement? 58% (293) 99% (291) 97% 96% A 87% (252)

The charts below show the reasons given for why long term outcomes were not achieved, grouped into the five high level outcome domains
6,19%
6,19%
5,16%
5,16%
4,13%
4,13%
2,6%
Domain 1 - Achieve Economic Wellbeing
Client ceased to receive support before outcome was achieved
Paid work would not improve economic wellbeingClient unwilling to engage with support
Client unable to obtain paid work
Assessment of benefits pending
OtherClient has only recently begun to receive support (in the last 3 months)
20,31%
13,20%
9,14%
5,8%
4,6%
3,5%
3,5%
3,5%
2,3% 2,
3%
Domain 2 - Enjoy and Achieve
Client unwilling to engage with supportClient unable to engage with supportOtherClient ceased to receive support service before outcome was achievedClient unable to take part in activity due to health problemsClient had difficulties participating in chosen activities with social relationsClient had difficulties participating in chosen activitiesLocal opportunites for work-like activities are limited or unavailableTraining/education services unwilling to provide training and/or education to clientLocal facilities are limited or unavailable
12,32%
7,19%
7,19%
6,16%
3,8%
2,5%
Domain 3 - Be Healthy
Client unwilling to engage with support
Client unable to engage with support
Other
Treatment ongoing
Client has only recently begun to receive support (in the last 3 months)
Client awaiting assessment
Melanie Burke 12 08/12/2008 ACS-Management Information Team
4,44%
3,33%
2,22%
Domain 4 - Stay Safe
Other Client unwilling to engage with support Client unable to engage with support
1,50%
1,50%
Domain 5 - Make A Positive Contribution
Client unable to engage with support Other
6. Devon Care & Repair – Home Improvement Agency Service The summary sheet from the Devon Care & Repair 2008/09 Quarter 1 report presented to the Service Monitoring and Development Board (SMDB) on the 1st September 2008 can be found in appendix 1.13.
Melanie Burke 13 08/12/2008 ACS-Management Information Team

Services operating in more than one district as at 19/09/2008
Appendix 1.1
Provider Name Provision Name Primary Client Group Districts* Age Concern Devon Iris Enabling Service Physical / Sensory Disability ED, EX, MD, ND, SH,TE, TO, WD Care Initiative Care Initiative F/S Spot Physical / Sensory Disability ED, EX Carr-Gomm Domestic Violence Service Women at Risk of Domestic Violence ED, EX, MD, ND, SH,TE, TO, WD Exeter, East & Mid Devon High Complex Needs / Generic ED, EX, MD Exeter, East & Mid Devon Low Complex Needs / Generic ED, EX, MD North Devon & Torridge High Complex Needs / Generic ND, TO North Devon & Torridge Low Complex Needs / Generic ND, TO
Teignbridge, South Hams & West Devon High Complex Needs / Generic SH, TE, WD
Teignbridge, South Hams & West Devon Low Complex Needs / Generic SH, TE, WD
Young People'S Service Young People at Risk ED, EX, MD, ND, SH,TE, TO, WD Christian Alliance Housing Association Family Support In Housing
Homeless Families with Support Needs ED, EX
Community Projects North Devon Class Learning Disabilities ND, TO, WD Devon & Cornwall Housing Association Ltd Dcha Mh Floating Support Mental Health Problems MD, ND, TO Dcha Mums & Babies Teenage Parents ND, TE, TO Devon Care & Repair Older People with Support Needs ED, EX, MD, ND, SH,TE, TO, WD Pennsylvania Flexible Services Single Homeless with Support Needs ED, EX, MD
Devon County Council Baseline Support Services (Exeter) Physical / Sensory Disability ED, EX, MD, TE
Forward Living Forward Living Floating Support Services Learning Disabilities MD, TE
Guinness Care & Support Ltd Dchs Floating Support Older People with Support Needs ED, EX
Dchs-Exeter & East Floating Support Learning Disabilities ED, EX
Dchs-Mid/North Devon Floating Support Learning Disabilities MD, ND
Guinness Care & Support-F/S-Spot Physical / Sensory Disability ED, EX, MD, ND, SH, TE, TO, WD
Guinness Care & Support-Ld-Fs-North & Mid Learning Disabilities MD, ND, TO
Headway Devon Headway Devon Physical / Sensory Disability EX, MD Headway-F/S-Spot Physical / Sensory Disability ED, EX, MD, ND, SH, TE, TO, WD Homemaker (South West) Ltd Homemaker Support Services Single Homeless with Support Needs ED, EX, MD, ND, SH, TE, TO, WD Lifeways Community Care Ltd Lifeways F/S Spot Physical / Sensory Disability ED, EX, MD, ND, SH, TE, TO, WD Lifeways Ld Exeter & East F/S Learning Disabilities ED, EX Lifeways Ld Mid & North F/S Learning Disabilities MD, ND Lifeways Ld South & West F/S Learning Disabilities SH, TE, WD Newcare (Devon) Ltd Newcare-F/S-Spot Physical / Sensory Disability ED, EX, MD, ND, SH, TE, TO, WD Parkview Society, The Parkview Mh F/S Mental Health Problems ED, EX, TE Rethink Mh Fs Exeter & East Mental Health Problems ED, EX, MD, ND, SH, TE, TO, WD Mh Fs North & Torridge Mental Health Problems ED, EX, MD, ND, SH, TE, TO, WD
Mh Fs Teignbridge, South Hams & West Mental Health Problems ED, EX, MD, ND, SH, TE, TO, WD
Seeability Seeability F/S Spot Physical / Sensory Disability ED, EX, MD, ND, SH, TE, TO, WD Selborne Care Ltd Physical - Sensory - Fs Physical / Sensory Disability SH, TE Signpost Care Partnerships Ltd Devon Floating Support Single Homeless with Support Needs ED, EX, MD, SH
Exeter And East Devon Ex-Offenders
Offenders or People at Risk of Offending ED, EX
Trenovissick Domiciliary Care Agency Ltd Trenovissick F/S Spot Physical / Sensory Disability ED, EX, MD Westcountry Housing Association Ltd
Prince Street, Markers, Orchard St, Peacock Etc Older People with Support Needs ED, EX, MD
Westcountry Mh Floating Support Mental Health Problems ED, EX, MD, SH, TE Young Devon Yac Expanded Service Young People at Risk ED, EX, MD, ND, TE, TO, WD
KEY: EX - Exeter, ED - East Devon, MD - Mid Devon, ND - North Devon, WD - West Devon, SH - South Hams, TO - Torridge, TE – Teignbridge
Melanie Burke 14 08/12/2008 ACS-Management Information Team

Melanie Burke 15 08/12/2008 ACS-Management Information Team
Supporting People - Spend to
July 13th 2008 Performance Detail for 2008/09 YTD
Appendix 1.2
CAUTION: PI score between 90-94.99%RISK: PI score less than 90%
Please note that this report contains the total net spend to date for the Supporting People programme. Performance detail is present for those services required to submit a PI workbook through the performance framework
KEY:
Client Group Total Spend to date (% of Total Spend across
all Client Groups)
Contracted Units as at date shown above
(% of total units)
% of Available Units Occupied
% of Contracted Units Available
Projected Year-End Spend
Number of services as at date
shown above
HomelessnessSingle Homeless with Support Needs 99100 £751,699.92 ( 15% ) 576 ( 5% ) £2,637,817.6028
Rough Sleeper 100n/a £53,941.99 ( 1% ) 14 ( <1% ) £189,294.221
Homeless Families with Support Needs 9595 £87,884.71 ( 2% ) 50 ( <1% ) £257,869.084
Young People Leaving Care n/an/a £0.00 ( <1% ) ( ) £224,896.820
Young People at Risk 9699 £465,353.71 ( 9% ) 270 ( 2% ) £1,554,541.8526
Teenage Parents 132n/a £13,803.65 ( <1% ) 10 ( <1% ) £48,440.011
People with Drug Problems 86100 £76,426.94 ( 2% ) 29 ( <1% ) £268,199.374
People with Alcohol Problems 104100 £25,084.67 ( <1% ) 18 ( <1% ) £88,028.413
Offenders or People at risk of Offending 83100 £95,724.29 ( 2% ) 37 ( <1% ) £335,917.714
Women at Risk of Domestic Violence 88108 £145,217.08 ( 3% ) 54 ( <1% ) £509,597.935
Generic 100n/a £173,221.91 ( 3% ) 154 ( 1% ) £849,859.926
Gypsies & Travellers n/an/a £0.00 ( <1% ) ( ) £75,000.000
Homelessness Total 1212 ( 11% ) 100 96 £1,888,358.87 ( 38% ) £7,039,462.9282
Learning DisabilityPeople with Learning Disabilities 96100 £1,161,519.73 ( 23% ) 438 ( 4% ) £4,094,031.2842
Learning Disability Total 438 ( 4% ) 100 96 £1,161,519.73 ( 23% ) £4,094,031.2842
Mental HealthPeople with Mental Health Problems 10198 £854,268.90 ( 17% ) 517 ( 5% ) £2,987,996.6733
Mental Health Total 517 ( 5% ) 98 101 £854,268.90 ( 17% ) £2,987,996.6733
Older PeoplePeople with a Physical or Sensory Disabilit 105100 £134,190.74 ( 3% ) 143 ( 1% ) £711,941.5614
Older People with support needs 99100 £1,274,790.16 ( 26% ) 8885 ( 80% ) £5,315,407.72274
Frail Elderly 93100 £23,550.73 ( <1% ) 441 ( 4% ) £147,196.355
Older People Total 9469 ( 85% ) 100 99 £1,432,531.63 ( 29% ) £6,174,545.62293
Totals16 September 2008 11636 100 98 £5,336,679.13 £20,296,036.50450
Melanie Burke 16 08/12/2008 ACS-Management Information Team
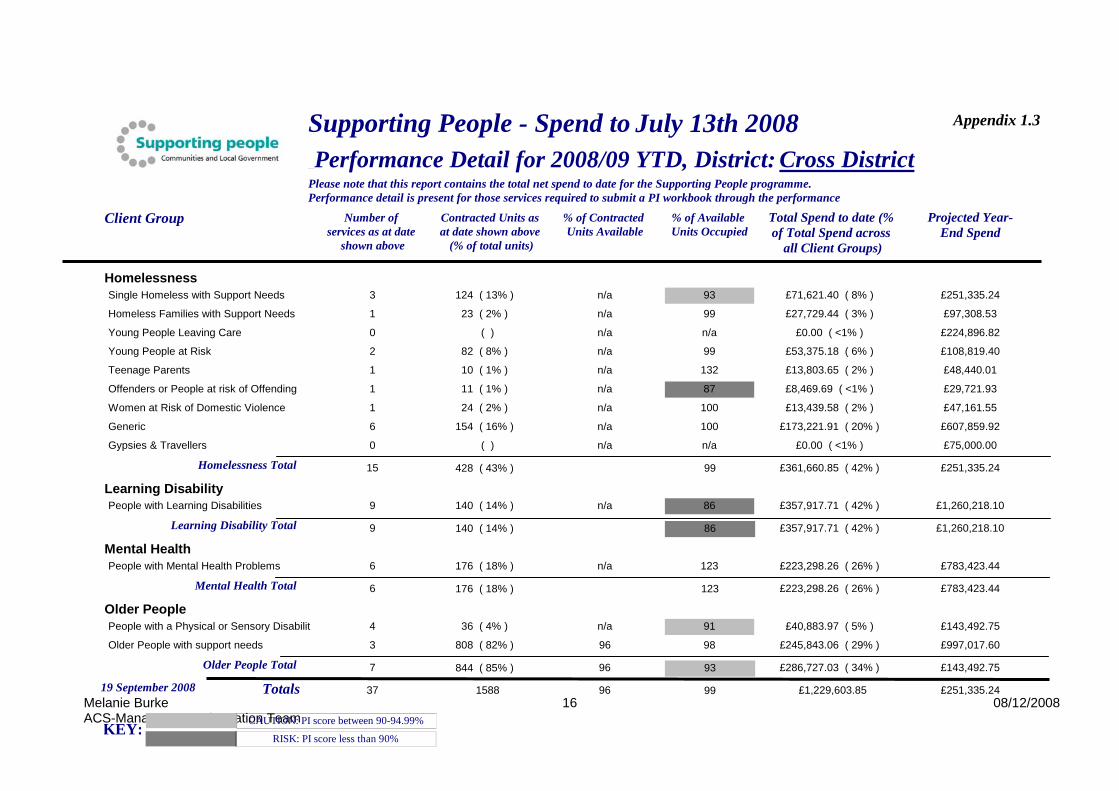
Supporting People - Spend to July 13th 2008 Performance Detail for 2008/09 YTD, District:
Appendix 1.3
Please note that this report contains the total net spend to date for the Supporting People programme. Performance detail is present for those services required to submit a PI workbook through the performance
Cross District
Client Group Total Spend to date (% of Total Spend across
all Client Groups)
Contracted Units as at date shown above
(% of total units)
% of Available Units Occupied
% of Contracted Units Available
Number of services as at date
shown above
Projected Year-End Spend
HomelessnessSingle Homeless with Support Needs 93n/a £71,621.40 ( 8% ) 124 ( 13% ) 3 £251,335.24
Homeless Families with Support Needs 99n/a £27,729.44 ( 3% ) 23 ( 2% ) 1 £97,308.53
Young People Leaving Care n/an/a £0.00 ( <1% ) ( ) 0 £224,896.82
Young People at Risk 99n/a £53,375.18 ( 6% ) 82 ( 8% ) 2 £108,819.40
Teenage Parents 132n/a £13,803.65 ( 2% ) 10 ( 1% ) 1 £48,440.01
Offenders or People at risk of Offending 87n/a £8,469.69 ( <1% ) 11 ( 1% ) 1 £29,721.93
Women at Risk of Domestic Violence 100n/a £13,439.58 ( 2% ) 24 ( 2% ) 1 £47,161.55
Generic 100n/a £173,221.91 ( 20% ) 154 ( 16% ) 6 £607,859.92
Gypsies & Travellers n/an/a £0.00 ( <1% ) ( ) 0 £75,000.00
Homelessness Total 428 ( 43% ) 99 £361,660.85 ( 42% ) 15 £251,335.24
Learning DisabilityPeople with Learning Disabilities 86n/a £357,917.71 ( 42% ) 140 ( 14% ) 9 £1,260,218.10
Learning Disability Total 140 ( 14% ) 86 £357,917.71 ( 42% ) 9 £1,260,218.10
Mental HealthPeople with Mental Health Problems 123n/a £223,298.26 ( 26% ) 176 ( 18% ) 6 £783,423.44
Mental Health Total 176 ( 18% ) 123 £223,298.26 ( 26% ) 6 £783,423.44
Older PeoplePeople with a Physical or Sensory Disabilit 91n/a £40,883.97 ( 5% ) 36 ( 4% ) 4 £143,492.75
Older People with support needs 9896 £245,843.06 ( 29% ) 808 ( 82% ) 3 £997,017.60
Older People Total 844 ( 85% ) 96 93 £286,727.03 ( 34% ) 7 £143,492.75
Totals19 September 2008 1588 96 99 £1,229,603.8537
CAUTION: PI score between 90-94.99%
RISK: PI score less than 90%KEY:
£251,335.24

Melanie Burke 17 08/12/2008 ACS-Management Information Team
Supporting People - Spend to July 13th 2008 Performance Detail for 2008/09 YTD, District:
Appendix 1.4
Please note that this report contains the total net spend to date for the Supporting People programme. Performance detail is present for those services required to submit a PI workbook through the performance
East Devon
Client Group Total Spend to date (% of Total Spend across
all Client Groups)
Contracted Units as at date shown above
(% of total units)
% of Available Units Occupied
% of Contracted Units Available
Number of services as at date
shown above
Projected Year-End Spend
HomelessnessSingle Homeless with Support Needs 103100 £53,212.37 ( 12% ) 53 ( 3% ) 2 £186,734.03
Young People at Risk 100100 £14,604.74 ( 3% ) 6 ( <1% ) 1 £51,251.26
Women at Risk of Domestic Violence 84125 £33,295.07 ( 8% ) 8 ( <1% ) 1 £116,839.87
Homelessness Total 67 ( 4% ) 108 98 £101,112.18 ( 23% ) 4 £186,734.03
Learning DisabilityPeople with Learning Disabilities 100100 £91,284.76 ( 21% ) 33 ( 2% ) 4 £320,374.40
Learning Disability Total 33 ( 2% ) 100 100 £91,284.76 ( 21% ) 4 £320,374.40
Mental HealthPeople with Mental Health Problems 100100 £41,041.08 ( 9% ) 25 ( 1% ) 3 £144,019.20
Mental Health Total 25 ( 1% ) 100 100 £41,041.08 ( 9% ) 3 £144,019.20
Older PeoplePeople with a Physical or Sensory Disabilit 112100 £62,816.20 ( 14% ) 55 ( 3% ) 5 £220,628.78
Older People with support needs 98100 £139,674.51 ( 32% ) 1589 ( 90% ) 68 £533,516.29
Older People Total 1644 ( 93% ) 100 99 £202,490.71 ( 46% ) 73 £220,628.78
Totals19 September 2008 1769 100 99 £435,928.7384
CAUTION: PI score between 90-94.99%
RISK: PI score less than 90%KEY:
£186,734.03

Melanie Burke 18 08/12/2008 ACS-Management Information Team
Supporting People - Spend to July 13th 2008 Performance Detail for 2008/09 YTD, District:
Appendix 1.5
Please note that this report contains the total net spend to date for the Supporting People programme. Performance detail is present for those services required to submit a PI workbook through the performance
Exeter
Client Group Total Spend to date (% of Total Spend across
all Client Groups)
Contracted Units as at date shown above
(% of total units)
% of Available Units Occupied
% of Contracted Units Available
Number of services as at date
shown above
Projected Year-End Spend
HomelessnessSingle Homeless with Support Needs 9899 £495,809.54 ( 33% ) 277 ( 19% ) 14 £1,739,902.14
Rough Sleeper 100n/a £53,941.99 ( 4% ) 14 ( <1% ) 1 £189,294.22
Homeless Families with Support Needs 9395 £60,155.27 ( 4% ) 27 ( 2% ) 3 £160,560.55
Young People at Risk 98100 £147,267.90 ( 10% ) 57 ( 4% ) 3 £516,791.37
People with Drug Problems 86n/a £10,752.02 ( <1% ) 14 ( <1% ) 2 £37,731.74
People with Alcohol Problems 98100 £9,414.18 ( <1% ) 8 ( <1% ) 2 £33,036.91
Offenders or People at risk of Offending 93100 £82,577.15 ( 5% ) 21 ( 1% ) 2 £289,781.23
Women at Risk of Domestic Violence 91100 £65,005.92 ( 4% ) 11 ( <1% ) 1 £228,119.90
Homelessness Total 429 ( 29% ) 99 96 £924,923.97 ( 61% ) 28 £1,739,902.14
Learning DisabilityPeople with Learning Disabilities 110100 £100,749.89 ( 7% ) 37 ( 3% ) 5 £369,547.54
Learning Disability Total 37 ( 3% ) 100 110 £100,749.89 ( 7% ) 5 £369,547.54
Mental HealthPeople with Mental Health Problems 104100 £301,594.24 ( 20% ) 134 ( 9% ) 11 £1,058,359.22
Mental Health Total 134 ( 9% ) 100 104 £301,594.24 ( 20% ) 11 £1,058,359.22
Older PeoplePeople with a Physical or Sensory Disabilit 100100 £2,417.94 ( <1% ) 21 ( 1% ) 1 £8,486.04
Older People with support needs 100100 £174,640.63 ( 12% ) 847 ( 58% ) 31 £645,712.61
Older People Total 868 ( 59% ) 100 100 £177,058.57 ( 12% ) 32 £8,486.04
Totals19 September 2008 1468 100 100 £1,504,326.6776
CAUTION: PI score between 90-94.99%
RISK: PI score less than 90%KEY:
£1,739,902.14

Melanie Burke 19 08/12/2008 ACS-Management Information Team
Supporting People - Spend to July 13th 2008 Performance Detail for 2008/09 YTD, District:
Appendix 1.6
Please note that this report contains the total net spend to date for the Supporting People programme. Performance detail is present for those services required to submit a PI workbook through the performance
Mid Devon
Client Group Total Spend to date (% of Total Spend across
all Client Groups)
Contracted Units as at date shown above
(% of total units)
% of Available Units Occupied
% of Contracted Units Available
Number of services as at date
shown above
Projected Year-End Spend
HomelessnessSingle Homeless with Support Needs 100100 £64,665.19 ( 22% ) 47 ( 5% ) 2 £226,924.39
Young People at Risk 98100 £26,247.32 ( 9% ) 16 ( 2% ) 2 £92,108.20
Offenders or People at risk of Offending 60n/a £4,677.45 ( 2% ) 5 ( <1% ) 1 £16,414.55
Homelessness Total 68 ( 7% ) 100 91 £95,589.96 ( 33% ) 5 £226,924.39
Learning DisabilityPeople with Learning Disabilities 102100 £42,988.08 ( 15% ) 35 ( 4% ) 4 £150,862.59
Learning Disability Total 35 ( 4% ) 100 102 £42,988.08 ( 15% ) 4 £150,862.59
Mental HealthPeople with Mental Health Problems 56100 £32,695.03 ( 11% ) 9 ( <1% ) 1 £146,057.98
Mental Health Total 9 ( <1% ) 100 56 £32,695.03 ( 11% ) 1 £146,057.98
Older PeoplePeople with a Physical or Sensory Disabilit 148n/a £24,454.32 ( 8% ) 21 ( 2% ) 1 £85,894.79
Older People with support needs 9999 £98,022.77 ( 33% ) 815 ( 86% ) 22 £337,243.30
Older People 836 ( 88% ) Total 99 101 £122,477.09 ( 42% ) 23 £85,894.79
T19 September 2008 948 100 97 £293,750.1633otals
CAUTION: PI score between 90-94.99%
RISK: PI score less than 90%KEY:
£226,924.39

Melanie Burke 20 08/12/2008 ACS-Management Information Team
Supporting People - Spend to July 13th 2008 Performance Detail for 2008/09 YTD, District:
Appendix 1.7
Please note that this report contains the total net spend to date for the Supporting People programme. Performance detail is present for those services required to submit a PI workbook through the performance
North Devon
Client Group Total Spend to date (% of Total Spend across
all Client Groups)
Contracted Units as at date shown above
(% of total units)
% of Available Units Occupied
% of Contracted Units Available
Number of services as at date
shown above
Projected Year-End Spend
HomelessnessSingle Homeless with Support Needs 93100 £10,072.74 ( 2% ) 7 ( <1% ) 1 £35,286.48
Young People at Risk 84100 £101,430.62 ( 19% ) 47 ( 3% ) 8 £355,943.65
People with Drug Problems 82100 £40,964.26 ( 8% ) 9 ( <1% ) 1 £143,752.49
People with Alcohol Problems 118n/a £15,670.49 ( 3% ) 10 ( <1% ) 1 £54,991.50
Women at Risk of Domestic Violence 83100 £33,476.51 ( 6% ) 11 ( <1% ) 2 £117,476.61
Homelessness Total 84 ( 5% ) 100 87 £201,614.62 ( 37% ) 13 £35,286.48
Learning DisabilityPeople with Learning Disabilities 100100 £17,222.70 ( 3% ) 12 ( <1% ) 2 £60,445.05
Learning Disability Total 12 ( <1% ) 100 100 £17,222.70 ( 3% ) 2 £60,445.05
Mental HealthPeople with Mental Health Problems 9391 £148,501.01 ( 27% ) 116 ( 7% ) 6 £521,113.82
Mental Health Total 116 ( 7% ) 91 93 £148,501.01 ( 27% ) 6 £521,113.82
Older PeoplePeople with a Physical or Sensory Disabilit 100100 £535.25 ( <1% ) 1 ( <1% ) 1 £1,878.50
Older People with support needs 98100 £161,956.39 ( 30% ) 1033 ( 63% ) 37 £592,641.82
Frail Elderly n/an/a £13,522.08 ( 2% ) 394 ( 24% ) 1 £49,927.68
Older People Total 1428 ( 87% ) 100 98 £176,013.72 ( 32% ) 39 £1,878.50
Totals19 September 2008 1640 99 95 £543,352.0560
CAUTION: PI score between 90-94.99%
RISK: PI score less than 90%KEY:
£35,286.48

Melanie Burke 21 08/12/2008 ACS-Management Information Team
Supporting People - Spend to July 13th 2008 Performance Detail for 2008/09 YTD, District:
Appendix 1.8
Please note that this report contains the total net spend to date for the Supporting People programme. Performance detail is present for those services required to submit a PI workbook through the performance
South Hams
Client Group Total Spend to date (% of Total Spend across
all Client Groups)
Contracted Units as at date shown above
(% of total units)
% of Available Units Occupied
% of Contracted Units Available
Number of services as at date
shown above
Projected Year-End Spend
HomelessnessSingle Homeless with Support Needs 112100 £28,054.13 ( 6% ) 19 ( 1% ) 2 £98,448.37
Young People at Risk 100100 £36,565.87 ( 8% ) 28 ( 2% ) 3 £128,317.75
Homelessness Total 47 ( 3% ) 100 105 £64,620.00 ( 14% ) 5 £98,448.37
Learning DisabilityPeople with Learning Disabilities 65n/a £245,301.19 ( 51% ) 74 ( 5% ) 3 £860,887.90
Learning Disability Total 74 ( 5% ) 65 £245,301.19 ( 51% ) 3 £860,887.90
Mental HealthPeople with Mental Health Problems 100100 £35,035.07 ( 7% ) 15 ( <1% ) 2 £122,944.22
Mental Health Total 15 ( <1% ) 100 100 £35,035.07 ( 7% ) 2 £122,944.22
Older PeopleOlder People with support needs 9998 £125,522.69 ( 26% ) 1360 ( 89% ) 32 £412,498.06
Frail Elderly 78100 £7,245.23 ( 2% ) 35 ( 2% ) 2 £87,497.22
Older People Total 1395 ( 91% ) 98 98 £132,767.92 ( 28% ) 34 £412,498.06
Totals19 September 2008 1531 98 96 £477,724.1844
CAUTION: PI score between 90-94.99%
RISK: PI score less than 90%KEY:
£98,448.37

Melanie Burke 22 08/12/2008 ACS-Management Information Team
Supporting People - Spend to July 13th 2008 Performance Detail for 2008/09 YTD, District:
Appendix 1.9
Please note that this report contains the total net spend to date for the Supporting People programme. Performance detail is present for those services required to submit a PI workbook through the performance
Teignbridge
Client Group Total Spend to date (% of Total Spend across
all Client Groups)
Contracted Units as at date shown above
(% of total units)
% of Available Units Occupied
% of Contracted Units Available
Number of services as at date
shown above
Projected Year-End Spend
HomelessnessSingle Homeless with Support Needs 100n/a £16,204.86 ( 4% ) 25 ( 2% ) 1 £56,866.49
Young People at Risk 96100 £56,640.25 ( 13% ) 19 ( 1% ) 3 £198,763.55
People with Drug Problems 89100 £24,710.66 ( 6% ) 6 ( <1% ) 1 £86,715.14
Homelessness Total 50 ( 3% ) 100 95 £97,555.77 ( 22% ) 5 £56,866.49
Learning DisabilityPeople with Learning Disabilities 103100 £162,085.43 ( 37% ) 67 ( 5% ) 9 £572,211.22
Learning Disability Total 67 ( 5% ) 100 103 £162,085.43 ( 37% ) 9 £572,211.22
Mental HealthPeople with Mental Health Problems 99100 £22,363.54 ( 5% ) 14 ( <1% ) 1 £78,476.81
Mental Health Total 14 ( <1% ) 100 99 £22,363.54 ( 5% ) 1 £78,476.81
Older PeoplePeople with a Physical or Sensory Disabilit n/an/a £157.88 ( <1% ) 7 ( <1% ) 1 £554.10
Older People with support needs 98100 £155,219.61 ( 35% ) 1351 ( 91% ) 37 £544,761.13
Older People Total 1358 ( 91% ) 100 98 £155,377.49 ( 36% ) 38 £554.10
Totals19 September 2008 1489 100 99 £437,382.2353
CAUTION: PI score between 90-94.99%
RISK: PI score less than 90%KEY:
£56,866.49

Melanie Burke 23 08/12/2008 ACS-Management Information Team
Supporting People - Spend to July 13th 2008 Performance Detail for 2008/09 YTD, District:
Appendix 1.10
Please note that this report contains the total net spend to date for the Supporting People programme. Performance detail is present for those services required to submit a PI workbook through the performance
Torridge
Client Group Total Spend to date (% of Total Spend across
all Client Groups)
Contracted Units as at date shown above
(% of total units)
% of Available Units Occupied
% of Contracted Units Available
Number of services as at date
shown above
Projected Year-End Spend
HomelessnessSingle Homeless with Support Needs 98100 £6,226.00 ( 4% ) 18 ( 2% ) 2 £21,848.42
Young People at Risk 11993 £24,309.89 ( 16% ) 12 ( 1% ) 3 £85,309.23
Homelessness Total 30 ( 4% ) 95 113 £30,535.89 ( 20% ) 5 £21,848.42
Learning DisabilityPeople with Learning Disabilities 89100 £32,907.65 ( 22% ) 18 ( 2% ) 3 £115,493.19
Learning Disability Total 18 ( 2% ) 100 89 £32,907.65 ( 22% ) 3 £115,493.19
Older PeopleOlder People with support needs 99100 £86,687.69 ( 57% ) 741 ( 93% ) 25 £304,243.66
Frail Elderly 100100 £2,783.42 ( 2% ) 12 ( 1% ) 2 £9,771.45
Older People Total 753 ( 94% ) 100 99 £89,471.11 ( 59% ) 27 £304,243.66
Totals19 September 2008 801 100 100 £152,914.6535
CAUTION: PI score between 90-94.99%
RISK: PI score less than 90%KEY:
£21,848.42

Melanie Burke 24 08/12/2008 ACS-Management Information Team
Supporting People - Spend to July 13th 2008 Performance Detail for 2008/09 YTD, District:
Appendix 1.11
Please note that this report contains the total net spend to date for the Supporting People programme. Performance detail is present for those services required to submit a PI workbook through the performance
West Devon
Client Group Total Spend to date (% of Total Spend across
all Client Groups)
Contracted Units as at date shown above
(% of total units)
% of Available Units Occupied
% of Contracted Units Available
Number of services as at date
shown above
Projected Year-End Spend
HomelessnessSingle Homeless with Support Needs 94100 £5,833.69 ( 3% ) 6 ( 1% ) 1 £20,472.04
Young People at Risk 100100 £4,911.94 ( 3% ) 3 ( <1% ) 1 £17,237.44
Homelessness Total 9 ( 2% ) 100 97 £10,745.63 ( 6% ) 2 £20,472.04
Learning DisabilityPeople with Learning Disabilities 100n/a £41,342.60 ( 24% ) 22 ( 5% ) 3 £145,077.29
Learning Disability Total 22 ( 5% ) 100 £41,342.60 ( 24% ) 3 £145,077.29
Mental HealthPeople with Mental Health Problems 100n/a £49,740.67 ( 28% ) 28 ( 7% ) 3 £174,546.98
Mental Health Total 28 ( 7% ) 100 £49,740.67 ( 28% ) 3 £174,546.98
Older PeoplePeople with a Physical or Sensory Disabilit n/an/a £3,441.40 ( 2% ) 2 ( <1% ) 1 £12,076.82
Older People with support needs 98100 £70,602.38 ( 40% ) 341 ( 85% ) 19 £247,772.81
Older People Total 343 ( 85% ) 100 98 £74,043.78 ( 42% ) 20 £12,076.82
Totals19 September 2008 402 100 99 £175,872.6828
CAUTION: PI score between 90-94.99%
RISK: PI score less than 90%KEY:
£20,472.04

Appendix 1.12 Comparator Authorities Below is a list of our comparator authorities which are similar to Devon in both demographics and size. Throughout the report Devon’s performance has been benchmarked against an average of the performance of our comparator authorities. Many of these authorities have a similar two-tier local government structure to Devon.
Somerset Cornwall Dorset
North Yorkshire West Sussex East Sussex
Gloucestershire Shropshire
Norfolk Lincolnshire
Cumbria Hampshire Cheshire Wiltshire
Worcestershire
Melanie Burke 25 08/12/2008 ACS-Management Information Team

Melanie Burke 26 08/12/2008 ACS-Management Information Team
SUMMARY REPORT TO: SMDB/HSSP/JCB/SMG REPORT FROM: PERFORMANCE OFFICER & SERVICE MANAGER DATE: 1st September 2008
DEVON CARE & REPAIR CONTRACT PERFORMANCE INFORMATION & FINANCIAL UPDATE
HIA Summary Report Quarter 1 2008/09 1. BACKGROUND 1.1 A new Devon HIA exceptions reporting framework has been developed that indicates
performance information against each of the seven service elements. The report is designed to be more user friendly for DMG chairs to use at a local monitoring level with local DCR managers. There are still new and updated targets to be set and agreed at the next contract review meeting on November 6th. CLG are testing a new Outcomes reporting framework for HIA’s and DCR are a pilot partner; an implementation plan is in place for this work.
2. Quantitative Performance 2.1 Performance Indicators (NI 142) – Quarter one 2008/09 indicator NI 142 states that 94.2%
(1,501 of service users) continued to live independently as a result of work completed or substantial advice given by the HIA service.
2.1 Service Performance Indicators – Enquiries for quarter one into the service stand at 2160, of
these 937 were new clients. Works completed for quarter one across minor, major and handyperson services are currently at
1,247 works. The service is performing exceptionally well in terms of the average time between initial enquiry
and first visit. It is also performing well against the average time between first visit and practical completion for handyperson works. Performance relating to works costing more than £1000 and less than £1,000 are causes for concern, with Exeter reporting the longest average recorded time. The majority of this work is structural done on behalf of Social Services. Availability of contractors for this work continues to be problematic and will be addressed by a sub group.
2.3 PAF D54 / Minor Adapts performance – The time between the decision being made to carry out
works and completing works was with seven working days for 93% for quarter one. Performance in this area has significantly improved over the last two quarters.
2.4 Major adaptations completed during Quarter 1 2008/09
o Between £1000 and £4999, the time between referral and submission to housing authority was on target being less than 28 days for 48% which is a decrease on the previous quarter’s performance.
o Over £5000, the time between referral and submission to housing authority fell within the key target of 56 days for 46% which is a decrease on the previous quarter’s performance.
o In quarter one 36% of major adaptations were inspected to ensure satisfactory completion. This task is delegated to the agency through the contract; expectation is 100% inspections.
o These indicators may highlight delays occurring within District Councils, Adult & Community Services and Children & Young Persons Services which impact on the Self Assessment Survey (SAS) 2.1 D045 relating to average waiting times for Major Adaptations. This is being investigated by the appointed sub group.

Melanie Burke 27 08/12/2008 ACS-Management Information Team
2.5 Falls Information - The Quarter 1 information suggests that 74% of clients fell into the no risk indicator category, 3% in the low risk category, 5% in the medium risk category and the remaining 18% in the high risk category. This information is now collected against all clients where possible.
2.6 Home Safety Assessments – There were a total of 67 HSA’s completed in quarter one. This key
preventative service has seen low uptake throughout the life of the contract; a sub group is addressing this issue.
3. Qualitative Performance 3.1 User Satisfaction - In the quarter ending June 2008 1,131 forms were sent out with 717 returned,
overall satisfaction result was 99%. 3.2 Complaints and Compliments - The number of complaints received in quarter one was two both
involving work that had been completed. The number of appreciations received was 16 referring mainly to the attitude of staff and the help and assistance given to clients. DCHA have developed a new system to record verbal complaints and appreciations.
3.3 District Monitoring Groups (DMG) issues / themes – In some areas the DMG’s still do not have a
full complement of partner members; but actions are in place to attract more service users and carers to these forums.
4. Financial Monitoring 4.1 Contributions from partners to date - Funding contributions from Partners received during quarter
one total £175,163.94 from District Councils and £69,495 from Devon PCT. 4.2 Spend on ACS commissioning minor adapts – The total spend on completed ACS commissioned
minor adaptations (up to £1000) is £48057.08 for quarter one. 4.3 Spend on major adapts – The total spend for quarter one on completed major adaptations (over
£1000) using the DFG budget is £378,801.31 4.4 Spend on repairs – The total quarter one spend on repairs and improvements using District
Council grants is £188,317.79 4.5 Money generated from hardship fund – Money generated from the hardship fund in quarter one
totals £29,175.57 with completed works from the fund costing £28,265.36 leaving the remaining £51,945.16 in the bank account.
5. Other Business 5.1 Social Enterprise – Although a range of new activities are being provided outside of the contract
it remains unclear whether these are being delivered at full cost recovery. DCR have been requested to provide further information at Quarter two as part of their Business Plan.
5.2 Rapid Equipment and Minor Adaptations Service (REMAS) – The pilot continues in the Torridge
area and DCR have now undertaken a total of 225 referrals for the assessment, fitting and fixing of equipment and minor adaptations on behalf of ACS.
5.3 Devon Care and Repair website – The website has now been upgraded to include a referral
page and links to other appropriate organisations. 5.4 Training and Development – Healthier Homes, Healthier Lives training sessions aimed at ACS
and NHS staff were successfully run in North Devon and will now be rolled out across the County. The training is designed to improve awareness of inadequate housing conditions