performance review q4 fy 2020-21
TRANSCRIPT
Investor PresentationQ4 FY 2020-21
19th April 2021
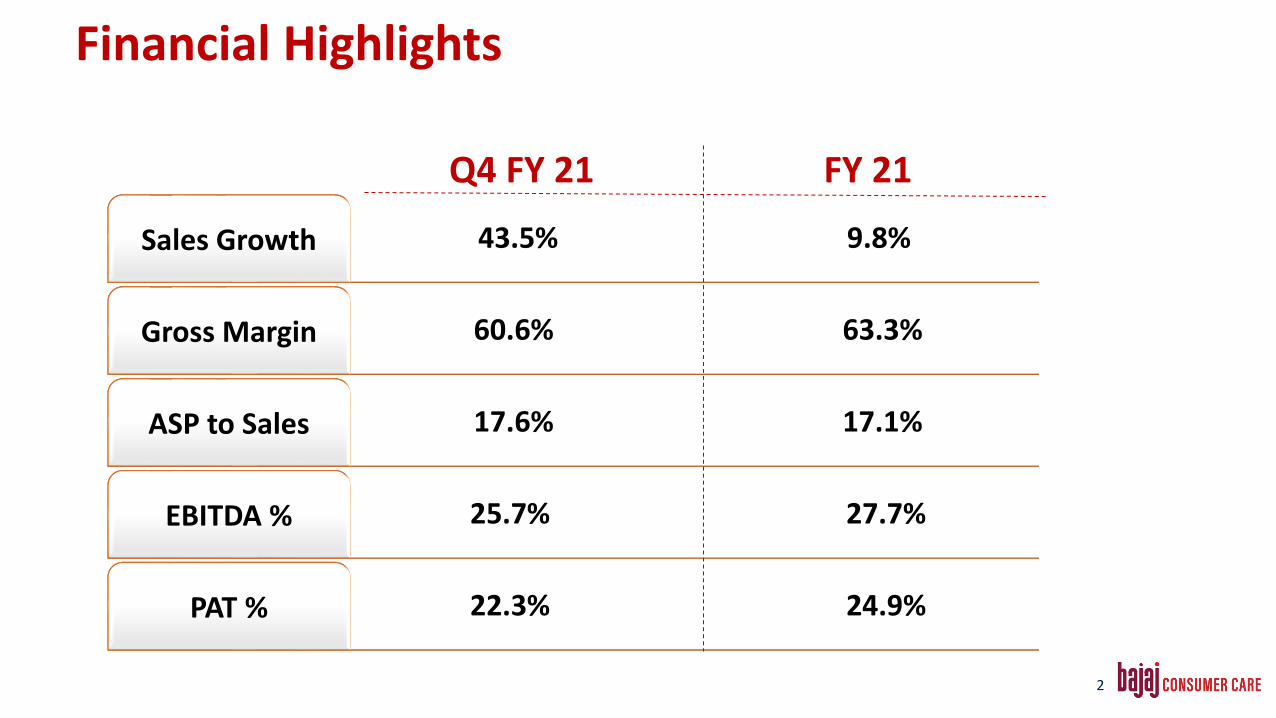
43.5% 9.8%Sales Growth
60.6% 63.3%Gross Margin
17.6% 17.1%ASP to Sales
25.7% 27.7%EBITDA %
22.3% 24.9%PAT %
Q4 FY 21 FY 21
Financial Highlights
2
Hair Oil Markets
3
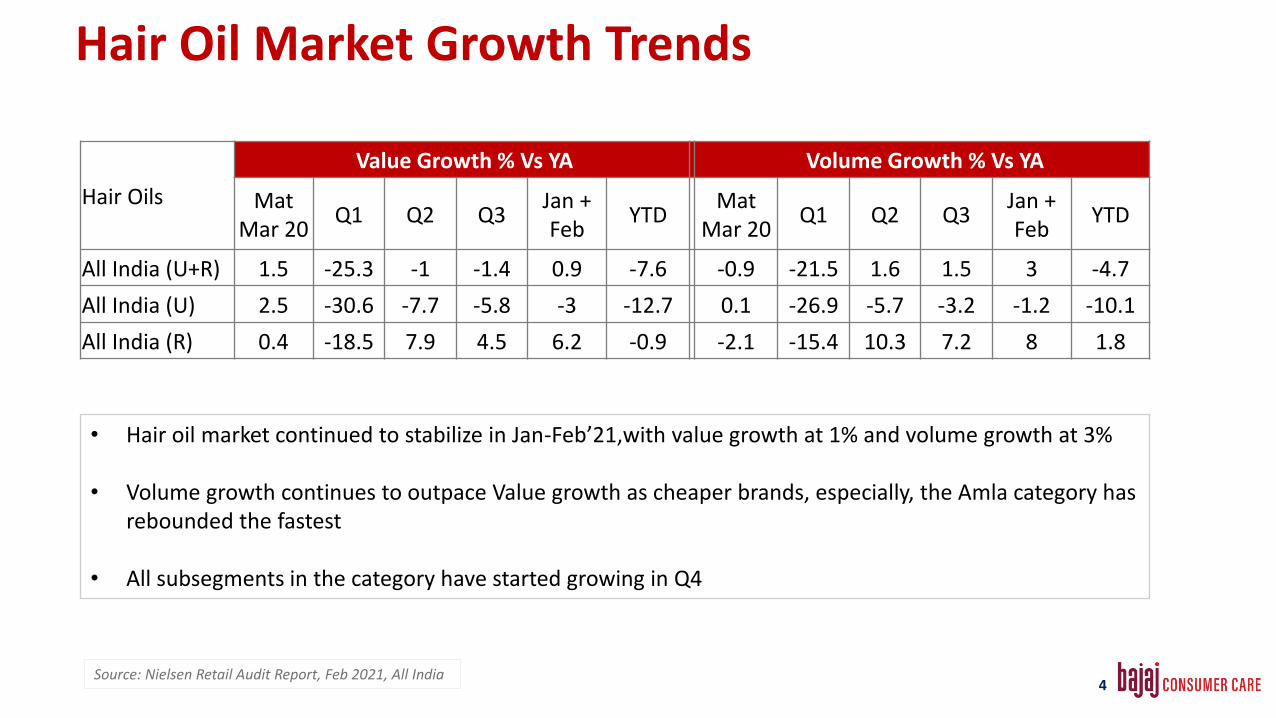
Source: Nielsen Retail Audit Report, Feb 2021, All India
• Hair oil market continued to stabilize in Jan-Feb’21,with value growth at 1% and volume growth at 3%
• Volume growth continues to outpace Value growth as cheaper brands, especially, the Amla category has rebounded the fastest
• All subsegments in the category have started growing in Q4
Hair Oil Market Growth Trends
Hair Oils
Value Growth % Vs YA Volume Growth % Vs YA
Mat Mar 20
Q1 Q2 Q3Jan + Feb
YTDMat
Mar 20Q1 Q2 Q3
Jan + Feb
YTD
All India (U+R) 1.5 -25.3 -1 -1.4 0.9 -7.6 -0.9 -21.5 1.6 1.5 3 -4.7
All India (U) 2.5 -30.6 -7.7 -5.8 -3 -12.7 0.1 -26.9 -5.7 -3.2 -1.2 -10.1
All India (R) 0.4 -18.5 7.9 4.5 6.2 -0.9 -2.1 -15.4 10.3 7.2 8 1.8
4
10.1 10.110.1 10.1 10.1 10.1
10.110.1
10.0
10.010.0 10.0
10.010.0 10.0
10.010.1
10.110.1
10.1
10.1
10.0
10.1 10.110.1
10.1
10.2
10.310.4
9.9
10.0
10.1
10.2
10.3
10.4
MATOCT18 MATDEC18 MATFEB19 MATAPR19 MATJUN19 MATAUG19 MATOCT19 MATDEC19 MATFEB20 MATAPR20 MATJUN20 MATAUG20 MATSEP20 MATNOV20 MAT FEB 21
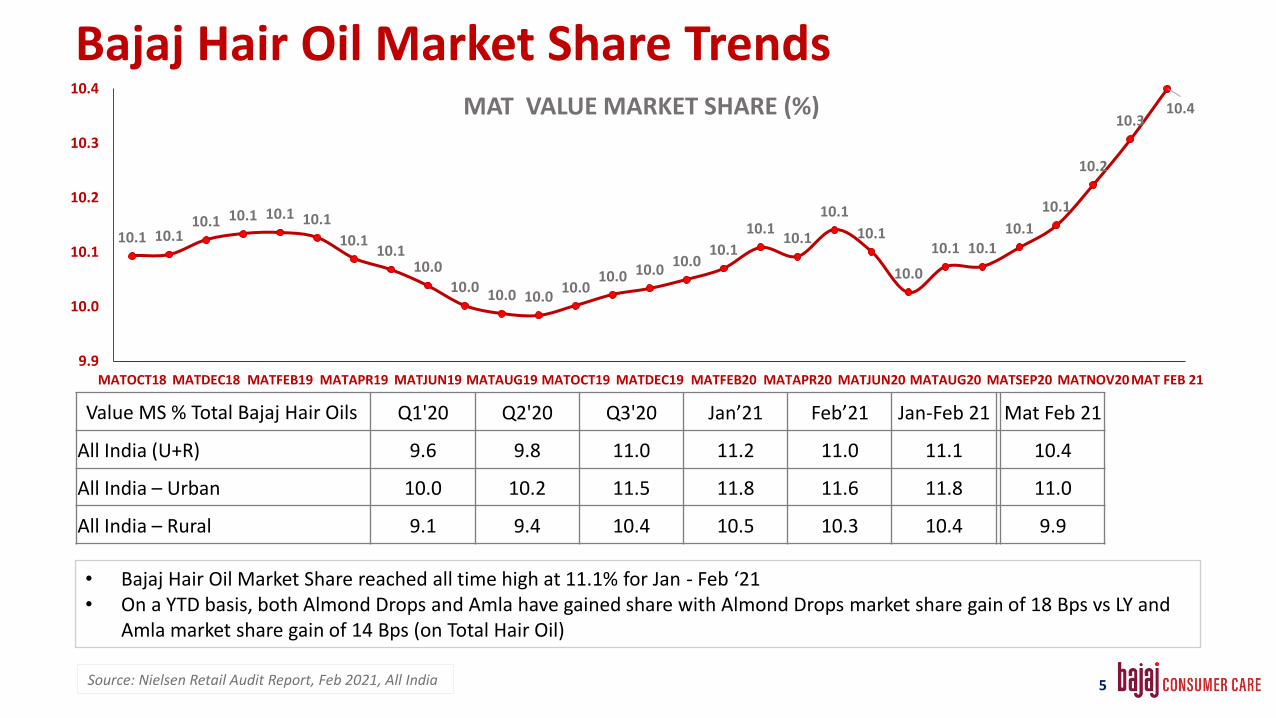
MAT VALUE MARKET SHARE (%)
Source: Nielsen Retail Audit Report, Feb 2021, All India
Value MS % Total Bajaj Hair Oils Q1'20 Q2'20 Q3'20 Jan’21 Feb’21 Jan-Feb 21 Mat Feb 21
All India (U+R) 9.6 9.8 11.0 11.2 11.0 11.1 10.4
All India – Urban 10.0 10.2 11.5 11.8 11.6 11.8 11.0
All India – Rural 9.1 9.4 10.4 10.5 10.3 10.4 9.9
• Bajaj Hair Oil Market Share reached all time high at 11.1% for Jan - Feb ‘21 • On a YTD basis, both Almond Drops and Amla have gained share with Almond Drops market share gain of 18 Bps vs LY and
Amla market share gain of 14 Bps (on Total Hair Oil)
Bajaj Hair Oil Market Share Trends
5

Marketing
6
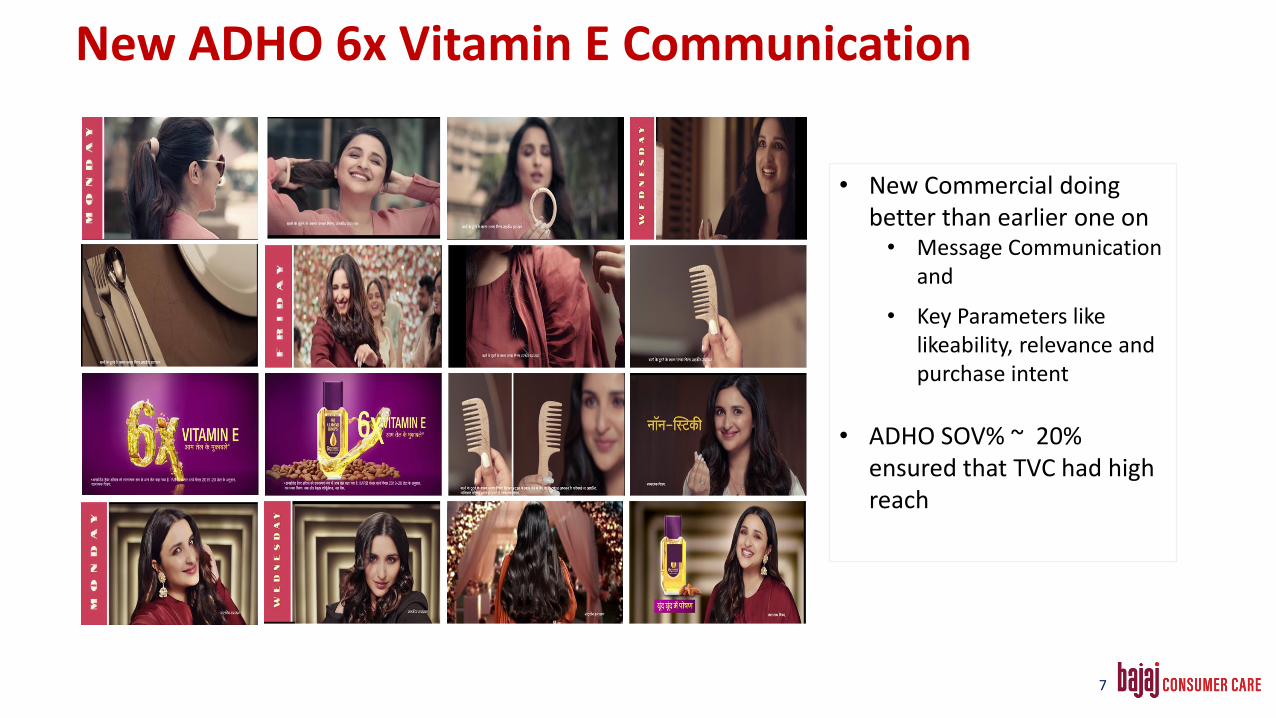
• New Commercial doing better than earlier one on • Message Communication
and
• Key Parameters like likeability, relevance and purchase intent
• ADHO SOV% ~ 20% ensured that TVC had high reach
New ADHO 6x Vitamin E Communication
7
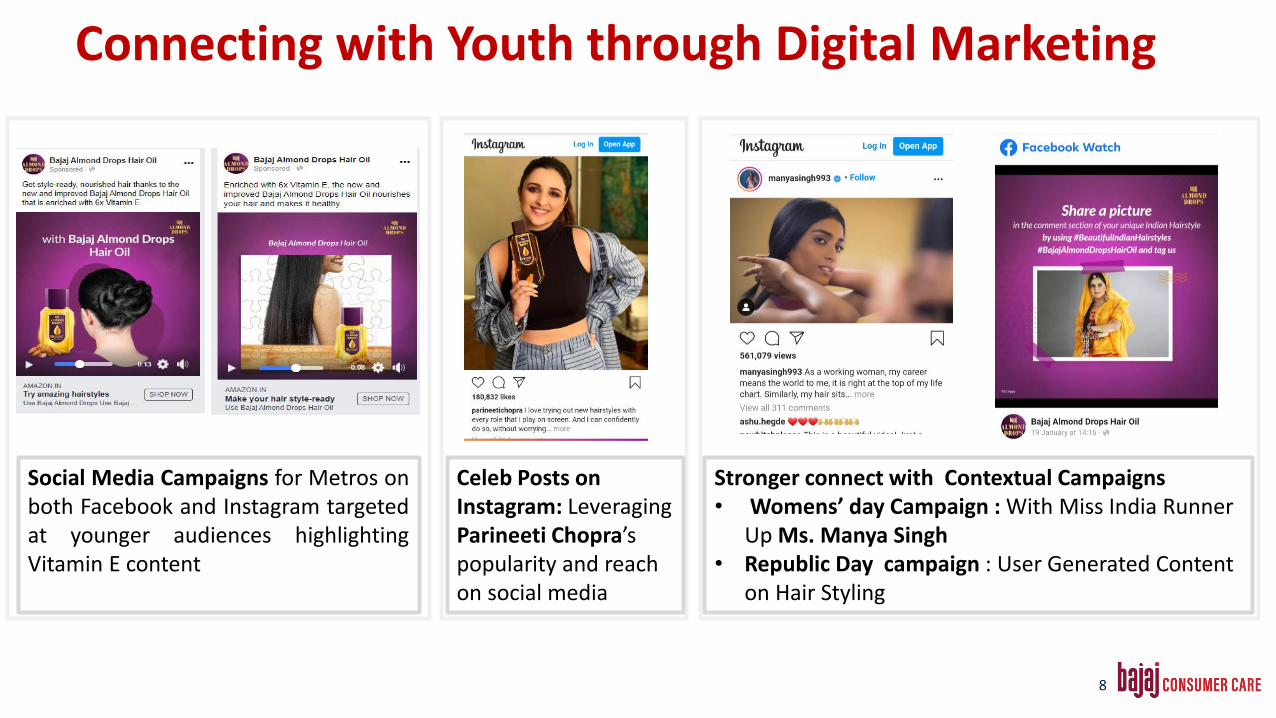
Social Media Campaigns for Metros onboth Facebook and Instagram targetedat younger audiences highlightingVitamin E content
Stronger connect with Contextual Campaigns• Womens’ day Campaign : With Miss India Runner
Up Ms. Manya Singh• Republic Day campaign : User Generated Content
on Hair Styling
Celeb Posts on Instagram: Leveraging Parineeti Chopra’s popularity and reach on social media
Connecting with Youth through Digital Marketing
8
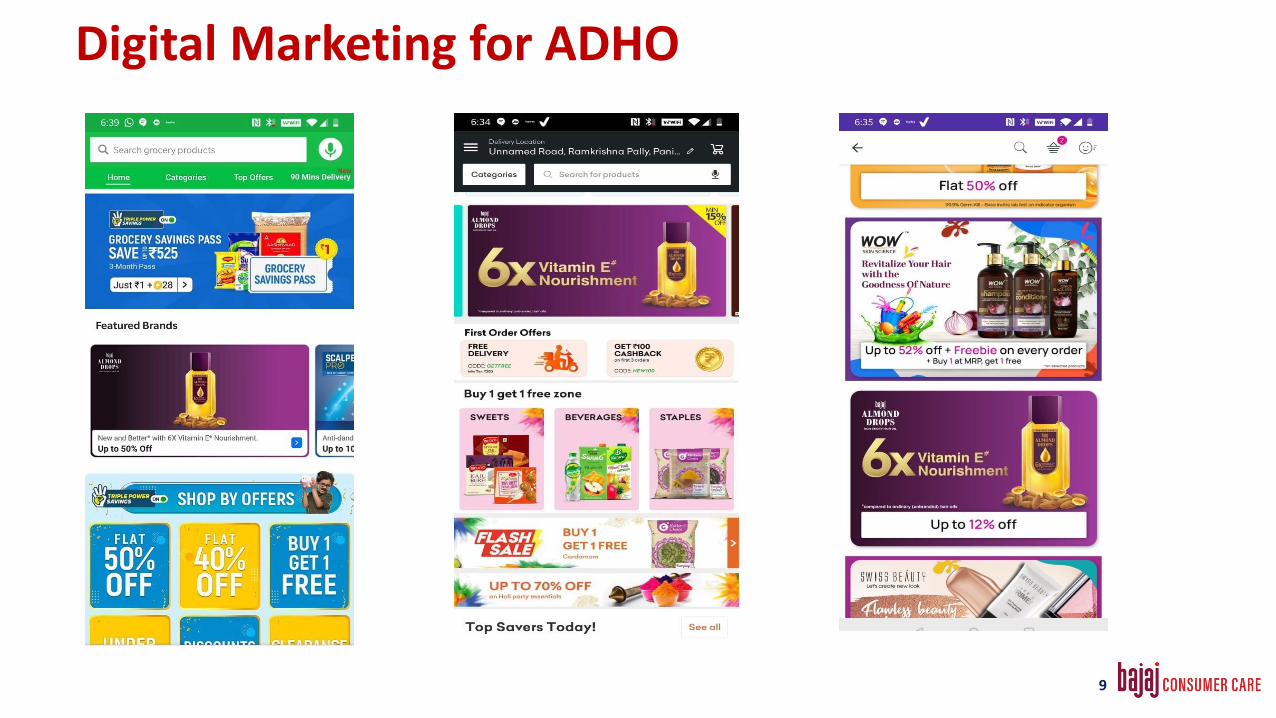
Digital Marketing for ADHO
9
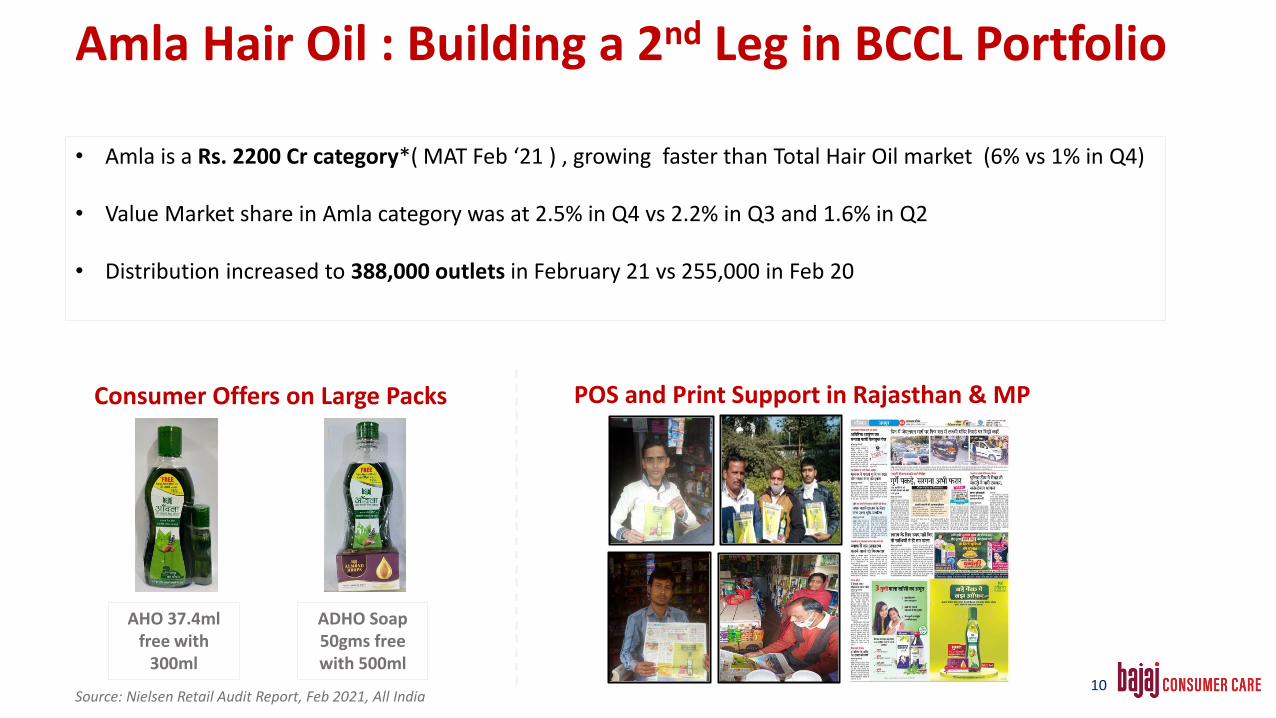
• Amla is a Rs. 2200 Cr category*( MAT Feb ‘21 ) , growing faster than Total Hair Oil market (6% vs 1% in Q4)
• Value Market share in Amla category was at 2.5% in Q4 vs 2.2% in Q3 and 1.6% in Q2
• Distribution increased to 388,000 outlets in February 21 vs 255,000 in Feb 20
ADHO Soap 50gms free with 500ml
AHO 37.4ml free with
300ml
Consumer Offers on Large Packs POS and Print Support in Rajasthan & MP
Amla Hair Oil : Building a 2nd Leg in BCCL Portfolio
Source: Nielsen Retail Audit Report, Feb 2021, All India10
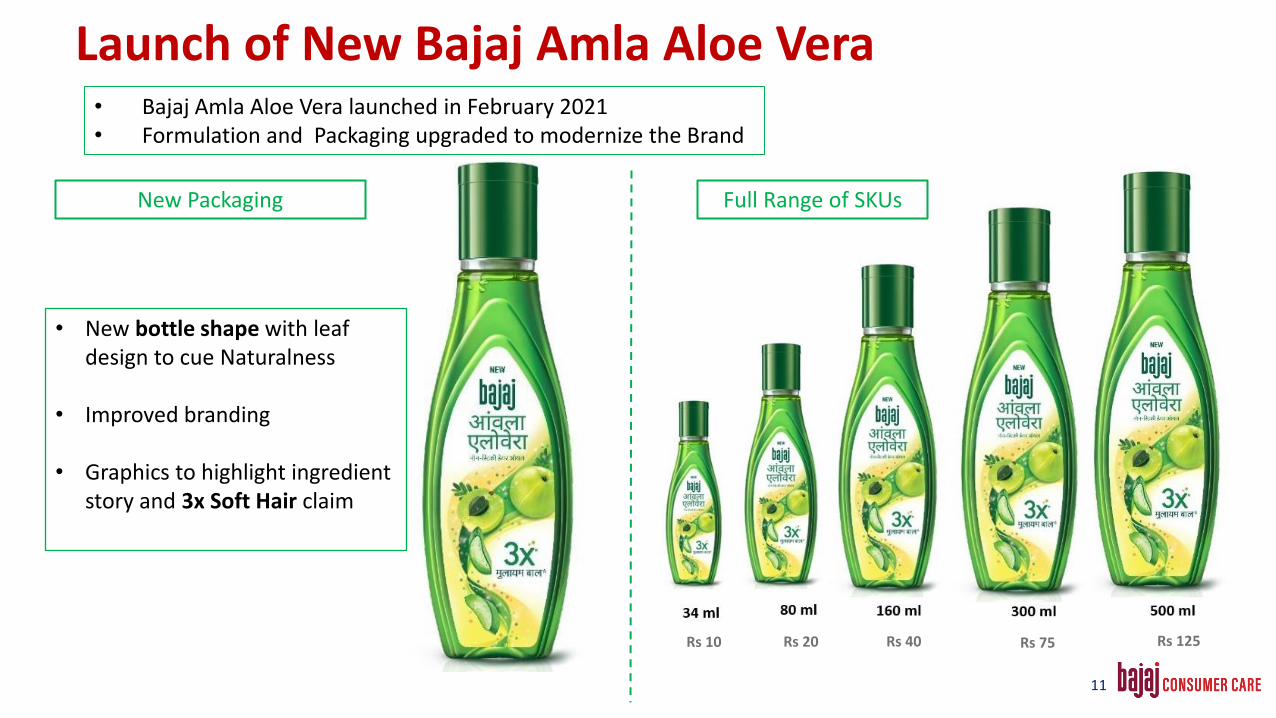
Full Range of SKUs
• New bottle shape with leaf design to cue Naturalness
• Improved branding
• Graphics to highlight ingredient story and 3x Soft Hair claim
Rs 10
New Packaging
Rs 20 Rs 40 Rs 75 Rs 125
11
Launch of New Bajaj Amla Aloe Vera • Bajaj Amla Aloe Vera launched in February 2021• Formulation and Packaging upgraded to modernize the Brand

New Formulation
Amla + Aloe Vera
Makes your hair Soft & Silky
New Claim
• New Hero Ingredient of Aloe Vera
• Aloe Vera stands for Softness & Moisturization in the consumer’s mind
• No other brand offers an Aloe Vera variant at this price range
New Bajaj Amla Aloe Vera Product Formulation
12

• Social Media campaign added to Display + Search Marketing in Q4
Funnel Based Approach: Different Platforms taken for SpecificObjectives• Youtube + Instagram + Facebook : Build Awareness• Influencers : For Education and Credibility• Ecommerce + Google Search : For Generating Trials
Bajaj Zero Grey – Digital First Brand Marketing
13
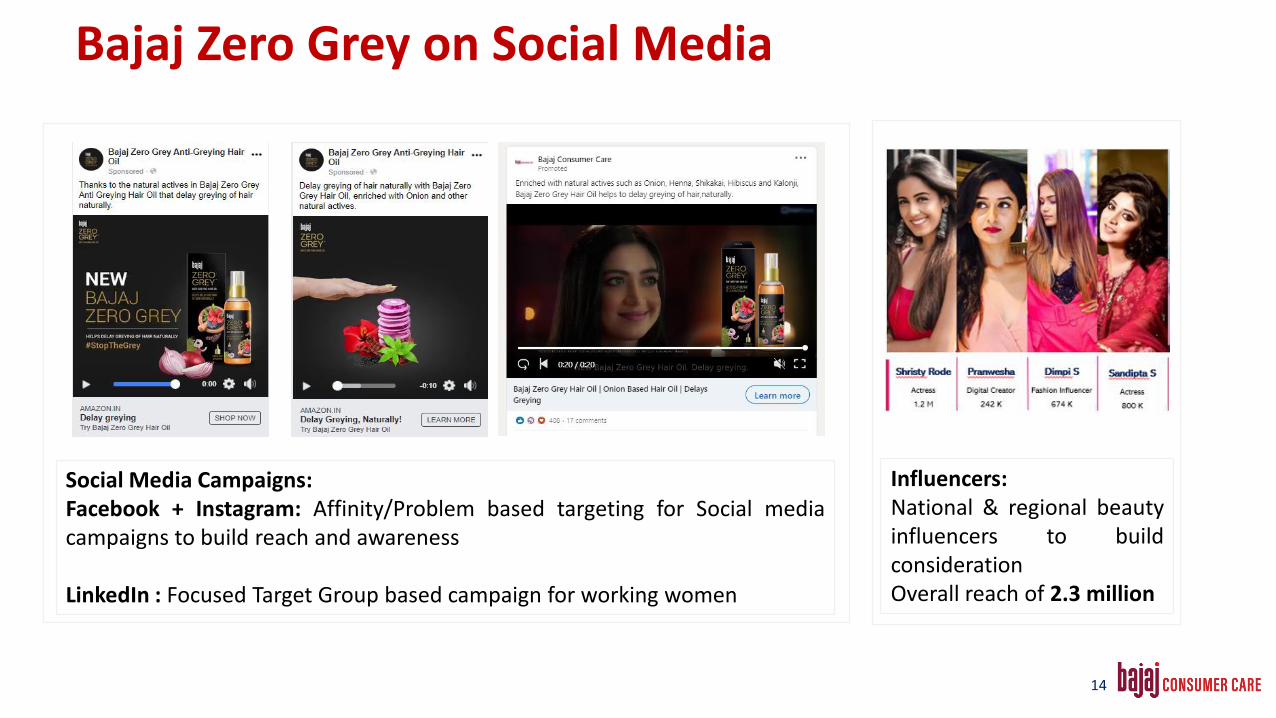
Social Media Campaigns:Facebook + Instagram: Affinity/Problem based targeting for Social mediacampaigns to build reach and awareness
LinkedIn : Focused Target Group based campaign for working women
Influencers:National & regional beautyinfluencers to buildconsiderationOverall reach of 2.3 million
Bajaj Zero Grey on Social Media
14
Sales
15
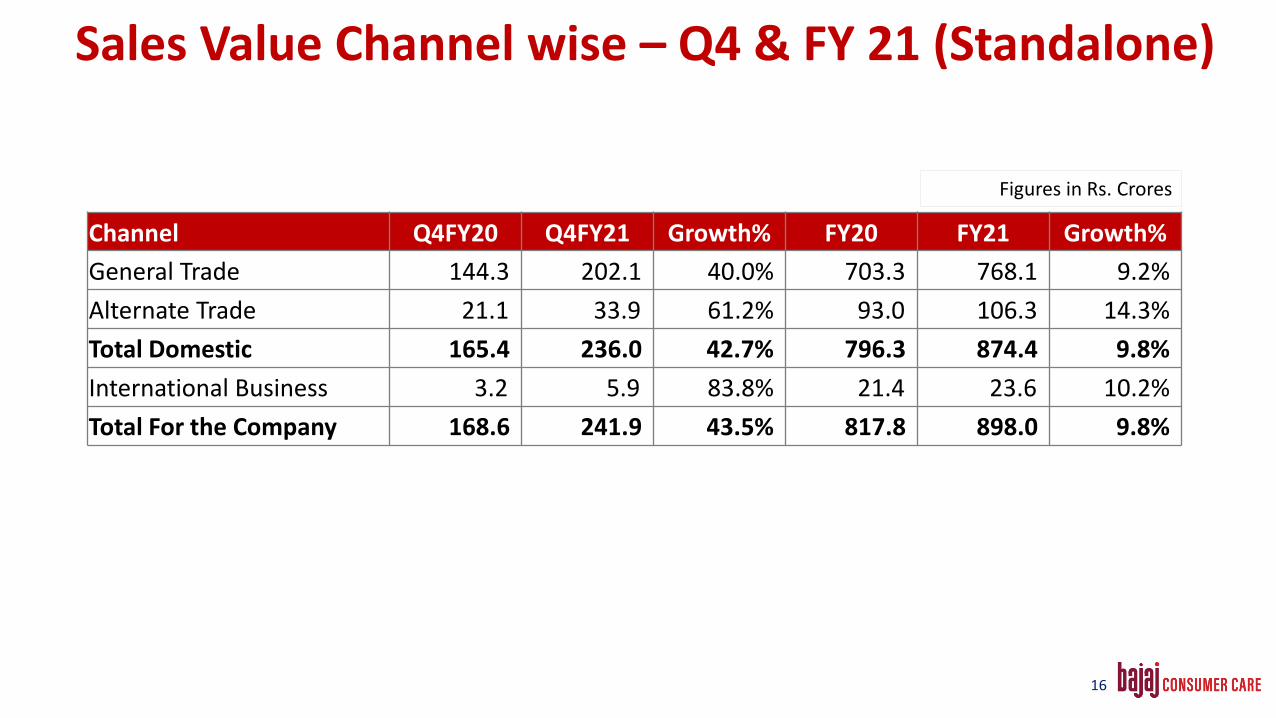
Figures in Rs. Crores
Channel Q4FY20 Q4FY21 Growth% FY20 FY21 Growth%
General Trade 144.3 202.1 40.0% 703.3 768.1 9.2%
Alternate Trade 21.1 33.9 61.2% 93.0 106.3 14.3%
Total Domestic 165.4 236.0 42.7% 796.3 874.4 9.8%
International Business 3.2 5.9 83.8% 21.4 23.6 10.2%
Total For the Company 168.6 241.9 43.5% 817.8 898.0 9.8%
Sales Value Channel wise – Q4 & FY 21 (Standalone)
16

General Trade Channel
17
• Q4 witnessed growth over last year of 40%, ending in a growth of 9.2% in General Trade for the full year
• ADHO continued to do well across geographies on the back of good growths in large packs, as well as, launch ofnew SKUs
• The new variant of Amla, Bajaj Amla Aloe Vera has been relaunched across key markets
• Urban is showing signs of recovery clocking a growth of 23% in Q4 after witnessing a 7% growth in Q3
• Rural markets continue to be robust with a growth of 61% in Q4, supported by strong van sales operations
• Restructuring of Field Force incentive has helped scale up distribution metrics of ECO and TLS
• Total outlets as per Nielsen has scaled upto 42.6 lakhs against 40 lakhs last year
General Trade Review for Q4 FY 21
18

Retail activation in Urban Markets
19

Van route optimization for
improved efficiency and reduced cost of
operation
GPS handheld implementation for
improved accuracy and efficiency
VSR incentive structure changed to push Amla sales
in rural
Van Operations – FY 2021 – 2022 Strategy
20
Alternate Trade Channels
21

Alternate Trade Business
Modern Trade
• Q4 saw continued recovery of Modern trade business with good traction during Republic day and Holi festival
• Consumer promotions to drive sales of larger SKUs with special visibility for brands
• Trade promotion with B2B and B2C chains in South to build pipe line to increase brand availability
• Enhanced the range at various national chains with brands – Zero Grey, Cool Almond Drops, Brahmi Amla to have better, shelf space and assortment to consumers
Institutional business including CSD and CPC
• Regular flow of orders from CSD in this quarter for all our brands
• After getting CAD activated, we have multiple brands like ADHO, BAHO and CAD active in CSD
• Institutional business remained steady with our products being offered as part of Combos by other Pharma/FMCG organisations
22

Republic Day display event in Modern Trade
23
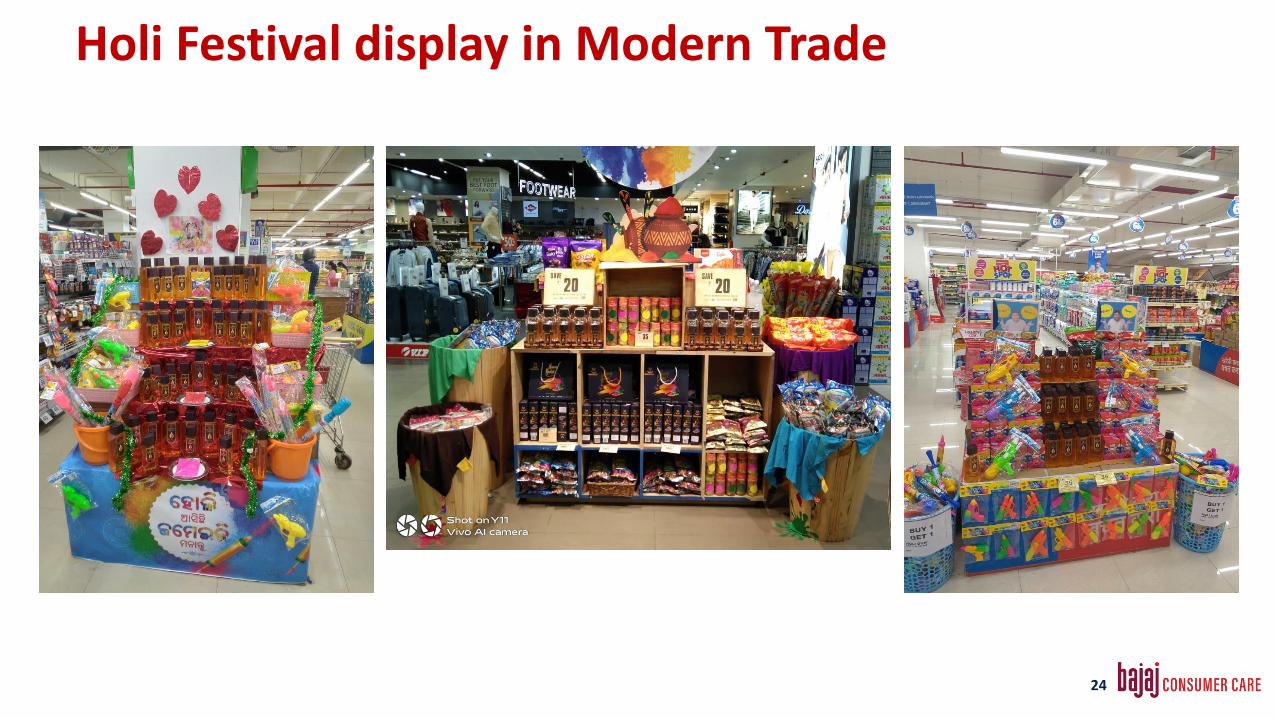
Holi Festival display in Modern Trade
24

• Focused digital marketing investments driving brand relevance and content optimization on e commerce platform
• Aggressive participation in Consumer Events during January on Amazon, Flipkart, Grofers, etc.
• Optimisation of online brand, response to consumer queries, optimisation of digital marketing spend done actively with help of external consultants
• Omni channel Retailers (Jio, D Mart Ready, etc) supporting home delivery showing growth in business
e-Commerce business grew by ~4x during Q4 FY21
25
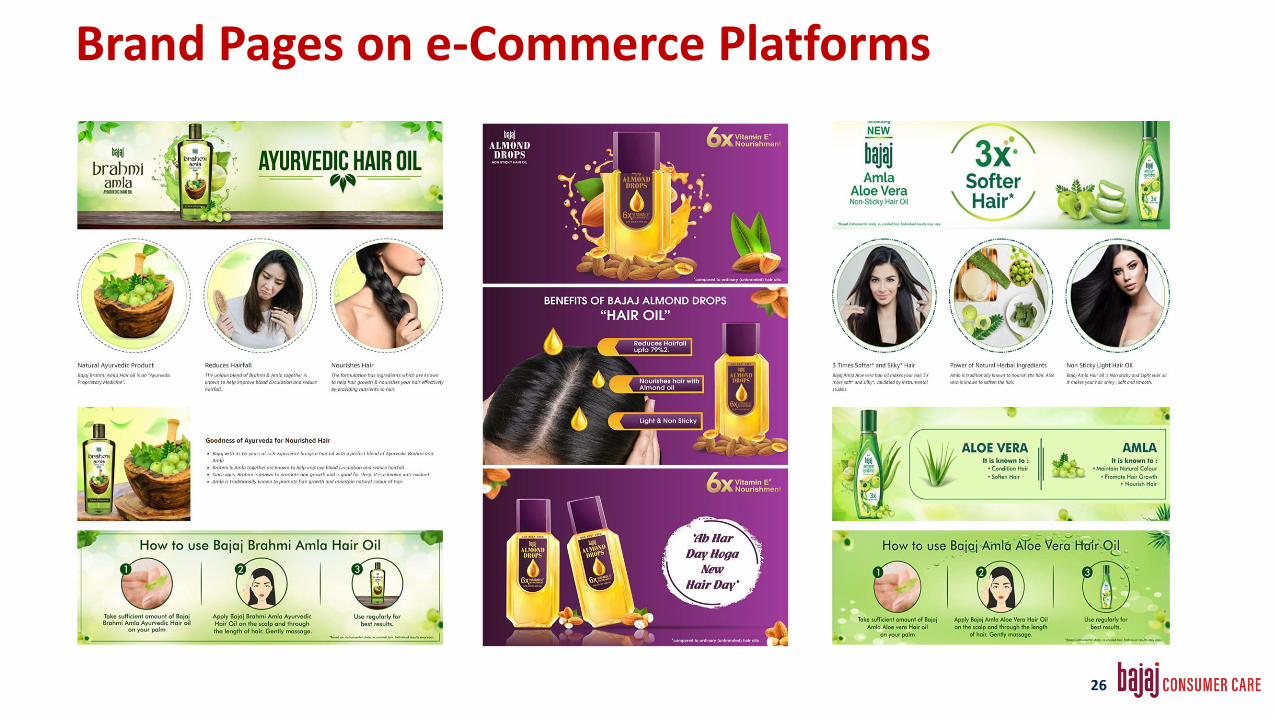
Brand Pages on e-Commerce Platforms
26
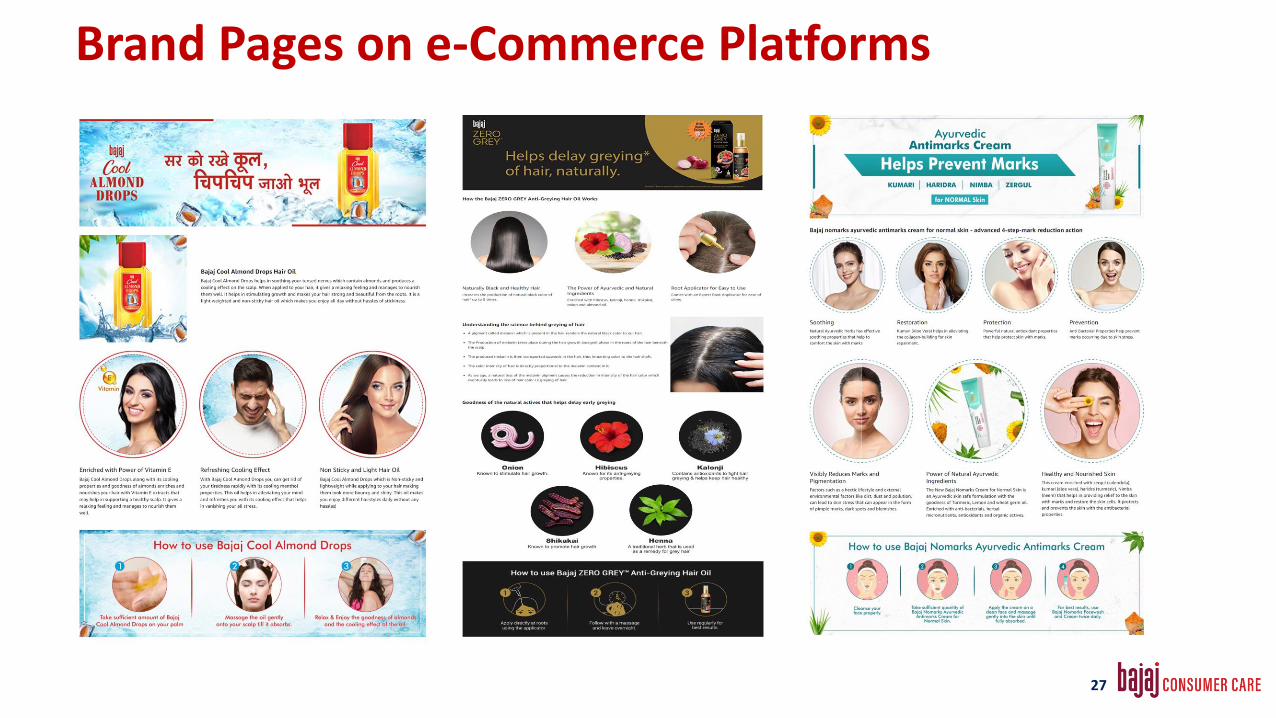
Brand Pages on e-Commerce Platforms
27
Business Operations
28

Light Liquid Paraffin(LLP)
• Upward trend due to supply issues in input RM base oil due to refinery shutdowns and rise in crude oil prices.
• Q4 prices about 23% above Q3
Refined Mustard oil(RMO)
• In line with increasing prices of edible oils due to supply issues, RMO has also been going up
• Q4 prices about 9% higher than Q3
62 60 58 58 51 49
57
70
Q1 19-20
Q2 19-20
Q3 19 -20
Q4 19-20
Q1 20-21
Q2 20-21
Q3 20-21
Q4 20-21
LLP PURCHASE PRICE PER KG
84 85 88 99 97
105 114
124
Q1 19 -20
Q2 19 -20
Q3 19 -20
Q4 19 -20
Q1 20 -21
Q2 20 -21
Q3 20 -21
Q4 20 -21
RMO PURCHASE PRICE PER KG
Price trends in LLP and RMO
29
To mitigate the impact of inflation, we have taken price increases in Feb 21 and Mar 21
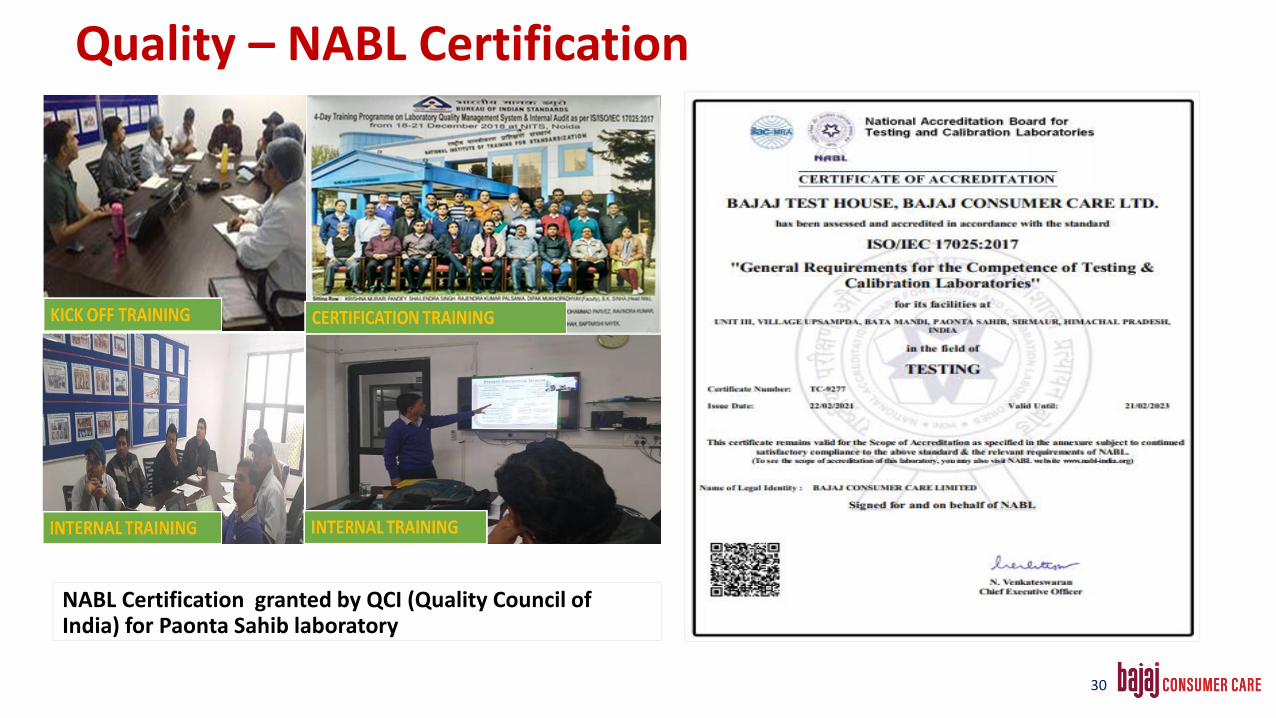
NABL Certification granted by QCI (Quality Council of India) for Paonta Sahib laboratory
Quality – NABL Certification
30
Human Resources
31

32
Project Pragati Talent Acquisition
Learning & Development Employee Engagement & Communication
• Stage 1 consisting of reorganizing the company as per industry standards, business growth plans nearing completion Structural recommendations aligned with the project team
• Stage 2 consisting of revamping the performance management system and total rewards system has been kickstarted
(Project on Organization Design, Performance Management & Rewards)
• Completed robust onboarding & induction for all newly joined Management Committee members
• Revamped Employee Background Verification process by partnering with a leading player. The operations is entirely IT enabled and would ensure improved governance on new hiring authenticity.
• elearning launched with a catalogue of Indianized content for giving employees opportunity to learn anytime, anywhere on any screen! The catalogue consists of functional and behavioural courses on universally relevant topics
• Strengthening the Mid-Management cadre through immersive learning journeys on “Emotional Intelligence” and “Understanding Unconscious Bias” with communication campaigns, experiential learning and 1:1 assessment
• Samvaad: Launched Communication platform of BCCL to ensure consistent, periodic & transparent two-way dissemination of company updates and feedback through Townhalls, newsletter and functional events
• Women’s Day celebration by holding a customized workshop for all our women employees on “Exploring Stereotypes” followed by delivery of personalized goody-bags
Human Resource Initiatives

BCCL has been certified as a “Great Place to Work” by the GreatPlace to Work (GPTW) Institute for the 3rd consecutive year
• GPTW Institute benchmarks best workplaces to identify & improveon people practices through its globally renowned framework
• A testimony of our progress is reflected in the survey Trust IndexScore - [from 77%(2019) to 79%(2020) to 83%(2021)}, we havenarrowed the gap with Top 100 Great Places to Work in the countryconsistently over the years
• Within Trust Index dimensions, on Credibility we had the highestdelta [(from 80%(2020) to 85%(2021)] followed by Pride [82%(2020)to 86%(2021)]
• General Trade department, the largest function emerged as the topscorer at 90% whereas few corporate functions continue to remainareas of opportunity in improving our engagement
• Taking a Plan, Do, Check and Act approach, we would continue tostrengthen our improvements and work on areas of opportunities
“Great Place to Work” for 3rd consecutive year
33

Financials
34
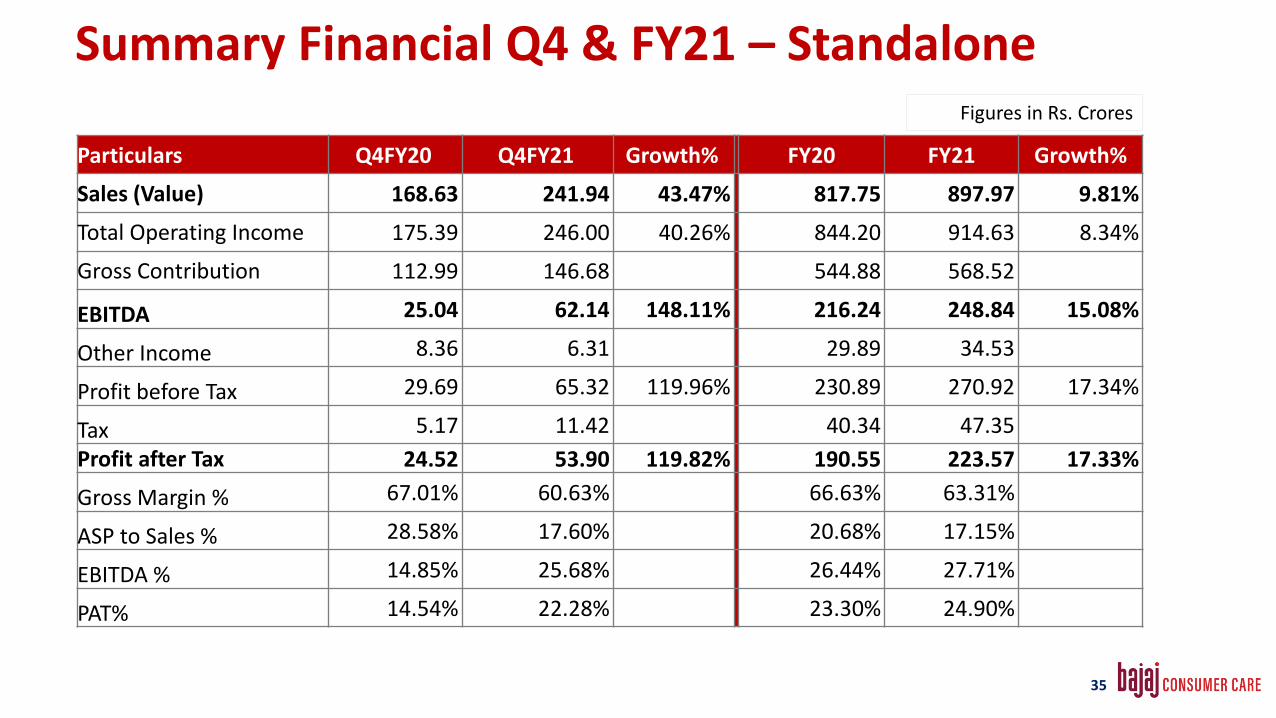
Figures in Rs. Crores
Particulars Q4FY20 Q4FY21 Growth% FY20 FY21 Growth%
Sales (Value) 168.63 241.94 43.47% 817.75 897.97 9.81%
Total Operating Income 175.39 246.00 40.26% 844.20 914.63 8.34%
Gross Contribution 112.99 146.68 544.88 568.52
EBITDA 25.04 62.14 148.11% 216.24 248.84 15.08%
Other Income 8.36 6.31 29.89 34.53
Profit before Tax 29.69 65.32 119.96% 230.89 270.92 17.34%
Tax 5.17 11.42 40.34 47.35
Profit after Tax 24.52 53.90 119.82% 190.55 223.57 17.33%
Gross Margin % 67.01% 60.63% 66.63% 63.31%
ASP to Sales % 28.58% 17.60% 20.68% 17.15%
EBITDA % 14.85% 25.68% 26.44% 27.71%
PAT% 14.54% 22.28% 23.30% 24.90%
Summary Financial Q4 & FY21 – Standalone
35
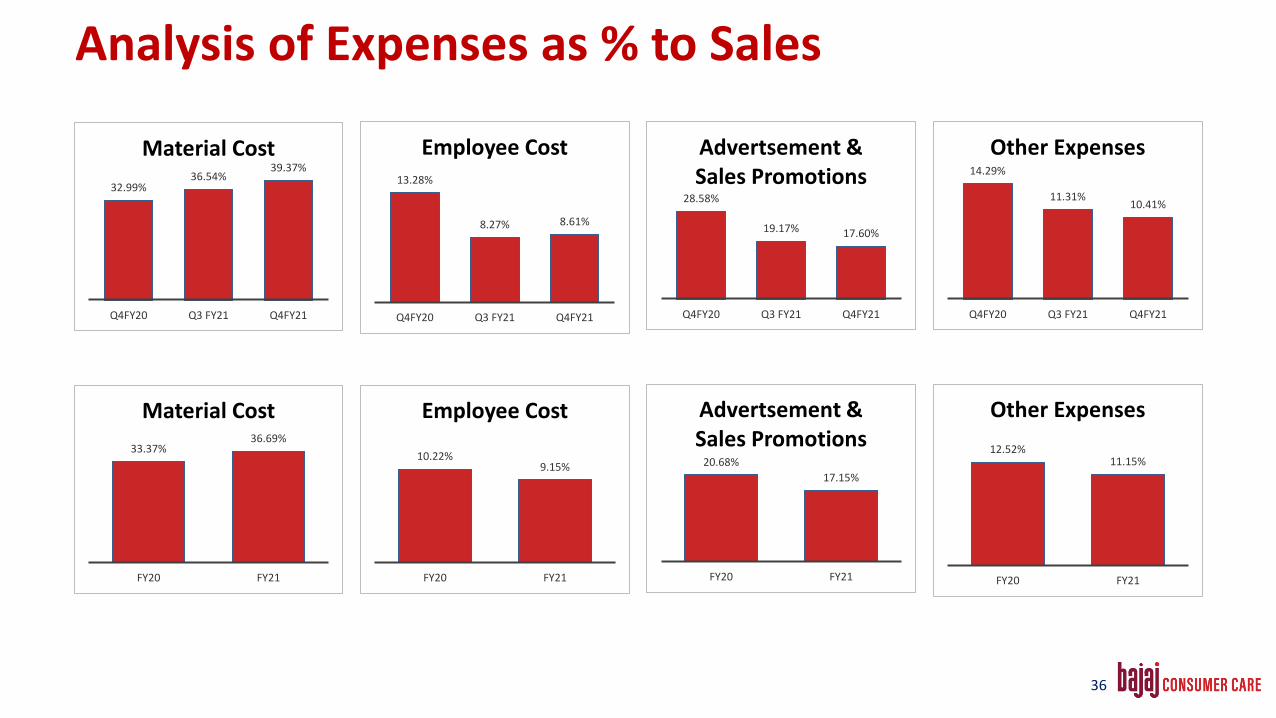
Analysis of Expenses as % to Sales
36
32.99%36.54%
39.37%
Q4FY20 Q3 FY21 Q4FY21
Material Cost13.28%
8.27% 8.61%
Q4FY20 Q3 FY21 Q4FY21
Employee Cost
28.58%
19.17% 17.60%
Q4FY20 Q3 FY21 Q4FY21
Advertsement & Sales Promotions 14.29%
11.31%10.41%
Q4FY20 Q3 FY21 Q4FY21
Other Expenses
33.37%36.69%
FY20 FY21
Material Cost
10.22%9.15%
FY20 FY21
Employee Cost
20.68%
17.15%
FY20 FY21
Advertsement & Sales Promotions
12.52%11.15%
FY20 FY21
Other Expenses
37
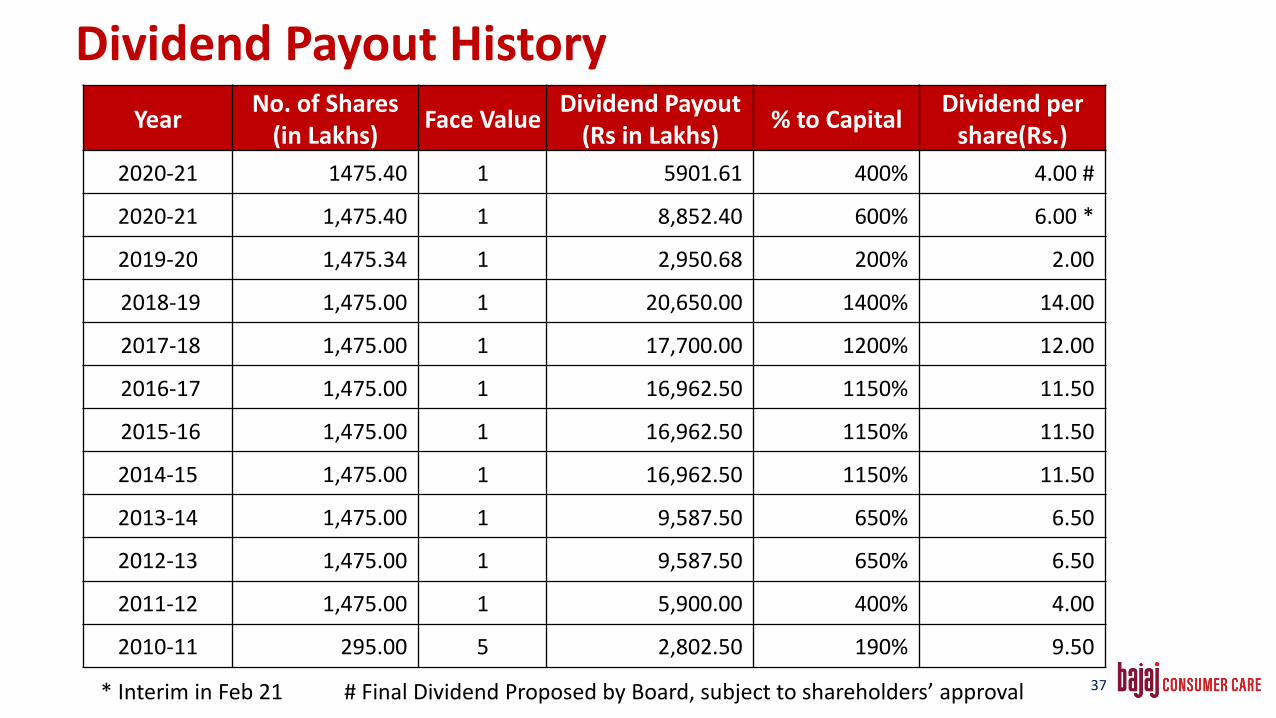
Dividend Payout History
YearNo. of Shares
(in Lakhs)Face Value
Dividend Payout(Rs in Lakhs)
% to CapitalDividend per
share(Rs.)
2020-21 1475.40 1 5901.61 400% 4.00 #
2020-21 1,475.40 1 8,852.40 600% 6.00 *
2019-20 1,475.34 1 2,950.68 200% 2.00
2018-19 1,475.00 1 20,650.00 1400% 14.00
2017-18 1,475.00 1 17,700.00 1200% 12.00
2016-17 1,475.00 1 16,962.50 1150% 11.50
2015-16 1,475.00 1 16,962.50 1150% 11.50
2014-15 1,475.00 1 16,962.50 1150% 11.50
2013-14 1,475.00 1 9,587.50 650% 6.50
2012-13 1,475.00 1 9,587.50 650% 6.50
2011-12 1,475.00 1 5,900.00 400% 4.00
2010-11 295.00 5 2,802.50 190% 9.50
* Interim in Feb 21 # Final Dividend Proposed by Board, subject to shareholders’ approval
Thank You
38