performance testing of evacuated tubular collectors
TRANSCRIPT

QAiST is supported by:
Project IEE/08/593/SI2.529236
Topic report for WP2 Solar thermal collectors
Performance testing of evacuated tubular collectors
Editor ITW: Stephan Fischer ([email protected])
With major contributions from
LNEG: Tiago Osório / Maria João Carvalho ([email protected])
TÜV: Ulrich Fritzsche ([email protected])
SP: Peter Kovacs ([email protected])
ISFH: Carsten Lampe ([email protected])
CSTB: Carol Buscarlet ([email protected])
ITW: Stephan Fischer ([email protected])
ISE: Korbinian Kramer ([email protected])
Version 2.1
Date: 07.06.2012
Summary of work carried out, main results and proposals for standard revision
Contact Info
Address: Pfaffenwaldring 6
Tel. : +49 711 68563231
Fax :+49 711 68563242
E-mail: [email protected]

Project IEE/08/593/SI2.529236
Performance testing of evacuated tubular collectors Page 2 of 81
Table of contents
Table of contents ........................................................................................ 2
1 Summary ............................................................................................. 4
2 Introduction .......................................................................................... 5
3 Thermal capacity of heat pipes and correlation to the incidence angle modifier ....................................................................................................... 7
4 Influence of the tilt angle on the performance of heat pipes ............... 13
4.1 Measurements on heat pipes only .............................................. 13
4.1.1 Measurements on heat pipes only ....................................... 13
4.1.2 Measurements on heat pipes only ....................................... 17
4.2 Measurements on complete collectors ........................................ 20
4.2.1 Measurements on complete collectors ................................. 20
4.2.2 Measurements on complete collectors ................................. 23
5 Start temperature and required irradiance for heat pipes ................... 26
5.1 Measurements on heat pipes only .............................................. 26
5.2 Measurements on complete collectors ........................................ 28
6 Impact of diffuse irradiance on the performance of evacuated tubular collectors with cylindrical absorber ............................................................ 28
6.1 Introduction ................................................................................. 28
6.2 Method to increase accuracy of steady state testing ................... 30
6.3 Results ....................................................................................... 31
6.4 Conclusions ................................................................................ 34
6.5 References ................................................................................. 34
7 Ageing effects of heat transfer paste .................................................. 36
7.1 Introduction ................................................................................. 36
7.2 Trend of collector performance over the long term exposure ...... 36
7.2.1 Description of the exposed collectors ................................... 36
7.2.2 Testing procedure ................................................................ 37
7.2.3 Results of performance tests ............................................... 37
7.3 Influence of changes in the heat transfer pastes over the exposure time on the decrease of collector performances .................................... 39
7.3.1 Visible changes in the heat transfer pastes over the exposure time ............................................................................................ 39
7.3.2 Results of comparative performance tests ........................... 40

Project IEE/08/593/SI2.529236
Performance testing of evacuated tubular collectors Page 3 of 81
7.3.3 Evaluation of thermal load of heat transfer paste ................. 40
7.4 Conclusion .................................................................................. 44
8 Performance limitation effects and inconsistent conductance of heat pipes in solar collectors ............................................................................. 45
9 Text proposals for standard revision .................................................. 56
9.1 Definition of the background during performance testing ............ 56
9.2 Fixed tilt during testing ................................................................ 56
9.3 Correlation between effective thermal capacity and incidence angle modifier ........................................................................................ 56
9.4 Post exposure performance test for heat pipe collectors ............. 58
9.5 Quasi-dynamic test parameter calculation out of steady state test results 58
9.6 Use of heat transfer paste ........................................................... 59
9.7 Performance dependency on ambient, mean fluid temperature or irradiance .............................................................................................. 59
10 Proposals for future work ................................................................ 61
10.1 Tilt dependency of heat pipe collectors ....................................... 61
10.2 Correlation between effective thermal capacity and incidence angle modifier ........................................................................................ 61
10.3 Limiting effects for heat pipes ..................................................... 61
10.4 Performance dependency on ambient temperature, mean fluid temperature or irradiation ...................................................................... 62
10.5 Test procedure for heat transfer paste ........................................ 62
Annex 1: Incidence angle modifier measurements on evacuated tubular collectors .................................................................................................. 63
Annex 2: Effects of long term exposure on performance of ETC with heat-pipe ........................................................................................................... 67
Annex 3: First summary on comparative test on heat-pipe-driven Evacuated Tubular Collectors ..................................................................................... 70
Annex 4: 1 year exposure - comparative tests on heat-pipe and direct flow ETCs after 1 year of dry exposure ............................................................ 74
Annex 5: Start temperature of heat pipes within complete collectors ......... 79

Project IEE/08/593/SI2.529236
Performance testing of evacuated tubular collectors Page 4 of 81
1 Summary
Stephan Fischer ([email protected])
This report summarises the work carried out within the QAiST project in the field of evacuated tubular collectors. The work was focusing on performance testing and quality assurance issues. Basically all types of ETCs were considered but the main efforts were directed to collectors of Dewar type using heat pipes as most of the new issues were identified for this type.
Section 2 (Introduction) points out the importance of a different treatment of evacuated tubular collectors compared to flat plate collectors and lists some major issues to keep in mind when dealing with evacuated tubular collectors.
Section 3 (Thermal capacity of heat pipes and correlation to the incidence angle modifier) shows why a high correlation between the thermal capacity of evacuated tubular collectors using heat pipes and the incidence angle modifier exist and how this issue can be solved.
Section 4 (Influence of the tilt angle on the performance of heat pipes) describes the different work carried out on single heat pipes and complete collectors to characterize the tilt dependency of the performance of evacuated tubular collectors using heat pipes.
Section 5 (Start temperature and required irradiance for heat pipes) summarizes the work being carried out on single heat pipes and complete collectors with the aim to determine the starting temperature and the minimum required irradiance level for heat pipes.
Section 6 (Impact of diffuse irradiance on the performance of evacuated tubular collectors with cylindrical absorber) describes in detail how the diffuse irradiance influences the performance of evacuated tubular collectors with cylindrical absorbers and how this effect should be accounted for.
Section 7 (Ageing effects of heat transfer paste) documents the investigations carried out on evacuated tubular collectors using a dry connection between the condenser of the heat pipe and the manifold. It turns out that the aging effects of the used heat transfer paste need to be considered in the future.
Section 8 (Performance limitation effects and inconsistent conductance of heat pipes in solar collectors) describes a very interesting example of a collector performance which is not depending on the temperature difference between mean fluid temperature and ambient temperature but on the absolute fluid temperature. Such collectors are up to now not fully covered by the EN 12975.

Project IEE/08/593/SI2.529236
Performance testing of evacuated tubular collectors Page 5 of 81
Section 9 (Text proposals for standard revision) summarizes the proposals for the revision of the current EN 12975. Altogether 7 major issues where determined:
1. Definition of the background during performance testing 2. Fixed tilt during testing 3. Correlation between thermal capacity and incidence angle modifier 4. Post exposure performance test for heat pipe collectors 5. Quasi-dynamic test parameter calculation out of steady state test
results 6. Use of heat transfer paste 7. Performance dependency on ambient, mean fluid temperature or
irradiance
Section 10 (Proposals for future work) lists from the point of view of the consortium the four most pressing issues where further work is needed to close the gap in testing procedure for evacuated tubular collectors. These four topics are:
1. Tilt dependency of heat pipe collectors 2. Limiting effects for heat pipes 3. Performance dependency on ambient temperature, mean fluid
temperature or irradiation 4. Test procedure for heat transfer paste
Annex 1 (Incidence angle modifier measurements on evacuated tubular collectors) describes additional experience gained during the incidence angle modifier measurement of evacuated tubular collectors.
Annex 2 to 5 presents slides dealing with the performance test after the long-time exposure.
Annex 5 (Start temperature of heat pipes within complete collectors) gives further information about the investigations described in section 5.2.
2 Introduction
Peter Kovacs ([email protected])
This report presents common work carried out on evacuated tubular collectors (ETCs) within the QAiST project. Focus is on the collectors’ specific features from the point of view of testing and quality assurance. Basically all types of ETCs are considered but the main efforts were directed to collectors of Dewar type using heat pipes as most of the new issues were identified for this type.
Testing thermal performance and quality of solar collectors has a relatively long history. Today’s European test standards where developed on the basis of ISO- and Ashrae standards that originate from before 1990. Even though the first evacuated tubular collectors where already present at that time, the flat plate collector was the norm and so it has been until around

Project IEE/08/593/SI2.529236
Performance testing of evacuated tubular collectors Page 6 of 81
2000. Therefore, the ETC and its specific properties has only been addressed to a minor extent in the standard so far. For the past ten years ETCs have started to gain market shares. This has partly been due to promising cost/ performance ratios and the fact that ETC tend to perform better than flat plates under some circumstances. However in some cases it has become obvious that low prices were also accompanied by low quality in different respects. Unfortunately, the low quality wasn’t always revealed due to inadequate or improper test methods. This is briefly why today’s test methods and requirements need to be updated and adapted. This is not only in order to create a fair competition between different collector types but also to give manufacturers and importers the proper tools to judge and further develop the quality and performance of ETCs. This way the technology will be able to contribute more significantly to the different European markets on the rise. Avoiding the risk that low quality products will destroy the good reputation of Solar thermal technology is another important reason to why ETCs need more attention in the test standards and in the quality assurance schemes.
Briefly, this report addresses the following subjects related to the performance of ETCs:
1. The thermal capacity of heat pipe collectors and how it is correlated to the Incidence angle modifier (IAM). A strong correlation could lead to a less accurate IAM determination which in turn would make the performance prediction more uncertain
2. ............................................................................................................. The tilt angle’s impact on the energy performance. This need to be better known both during testing and for performance prediction using collector models
3. ............................................................................................................. Impact of diffuse irradiance on the performance of evacuated tubular collectors. This is a specific, positive property of ETCs that may not be fully covered in today’s standard
4. ............................................................................................................. Ageing of heat transfer paste. Low quality pastes can reduce performance very soon and additionally cause heat pipes to stick in the manifold. The paste is not at all addressed in today’s standard
5. ............................................................................................................. General impact on the performance of ETCs after 30 days up to one year of outdoor exposure.
Furthermore, freeze testing of heat pipes has been analyzed and reported in a separate QAiST report.

Project IEE/08/593/SI2.529236
Performance testing of evacuated tubular collectors Page 7 of 81
3 Thermal capacity of heat pipes and correlation to the incidence angle modifier
Tiago Osório ([email protected]), Maria João Carvalho ([email protected]) and Ulrich Fritzsche ([email protected])
Within this section the different possibilities given by the European Standard EN 12975-2 to determine the effective thermal capacity and the incidence angle modifier are described and compared. For collectors having a large effective thermal capacity a significant correlation between this value and the measured values of the incident angle modifier could be observed and are discussed.
Two collectors have been analyzed in detail: one evacuated tube collector with a back reflector and direct flow circulation (ETC DF) and one all glass evacuated tube collector with heat pipes (ETC HP).
Determination of the effective thermal capacity in the quasi-dynamic test method
The great simplicity of the quasi-dynamic model results from its ability to model a collector subjected to changing conditions while it is not, in fact, a dynamic model. Within the time interval where the average values of the recorded quantities are calculated it is assumed that the power supplied by the collector is independent of what happened before that interval. Some collectors have high or very high thermal capacities, such as the vacuum tube collectors using all-glass tubes in combination with heat pipes. In these cases, the time that the collector takes to react and adapt to a new radiation condition is very large and can exceed the period of the integration interval. Thus, the model may not be able to accurately represent the behaviour of the collector. This situation can be mitigated, but not eliminated, by using the maximum interval of integration allowed by the EN 12975-2 standard (10 min).
Collector Method [kJ/(m²K)]
ETC DF Steady-state (according to EN 12975-2, Annex G) 37,6
Quasi-dynamic (5 min average) 30,9
Quasi-dynamic (10 min average) 33,8
ETC HP Steady-state (according to EN 12975-2, Annex G) 101,2
Quasi-dynamic (5 min average) 65,2
Quasi-dynamic (10 min average) 75,5

Project IEE/08/593/SI2.529236
Performance testing of evacuated tubular collectors Page 8 of 81
When the thermal capacities are high, the effective thermal capacity is underestimated by the quasi-dynamic test compared to the method according Annex G. The ETC all glass HP collector has a time constant of 573 s and it seems to be outside the limits where the clause 6.3 the EN 12975 standard should be applied if the MLR method is used for the parameter identification. Some work is needed to adapt the quasi-dynamic test methodology to these collectors. For ETC heat pipe collectors with fin absorber the resulting time constant (see figure 1) could reach periods close to flat plate absorbers like 80 to a maximum of 160 s and did not make any problems within quasi-dynamic evaluation.
Figure 1: Time constant of a heat pipe collector with fin absorber

Project IEE/08/593/SI2.529236
Performance testing of evacuated tubular collectors Page 9 of 81
Figure 2: Time constant of heat pipe collectors with all glass tube; the stability criteria is following EN 12975-2
The main problem of heat pipe collectors is that there is a two knot behavior of thermal capacity. The first capacity fraction is a relatively small one between inlet and outlet of the collector. This means, if we’ve got a temperature step at the inlet, these step will be detected very fast also at the outlet. The second capacity is between absorber surface and condenser and is mainly affected by irradiation steps. This one results into time constants of several hundred seconds for all glass tube heat pipe collectors as described above. If now the allowed inlet temperature changes up to ±1 K during testing will be combined with irradiation changes, the resulting effect could not be well handled by the existing collector equation.
Determination of the incidence angle modifier (IAM)
The high thermal capacity also influences the test for determining the IAM in the transversal direction. In the longitudinal direction, at any time of the year, the evolution of the angle of incidence over time takes place slowly. In the transversal direction it is often about 2,5º in 10 min. With a fixed test rack, the large angles of incidence are determined at the beginning or end of the day, when solar radiation increases or decreases even if measured in the perpendicular plane. In the setting of large incidence angles and varying radiation, the impact of high thermal capacity in the determination of the IAM is such that the IAM value is undervalued in the early morning and overvalued in the late afternoon. Because of taken the collector capacity into account (which is mainly influenced by irradiation changes), the quasi-dynamic method shows less over or under estimation effects than the steady state procedure using a fixed collector position (see MLR values in figure 3 and 4 and output power in figure 5).

Project IEE/08/593/SI2.529236
Performance testing of evacuated tubular collectors Page 10 of 81
0.4
0.6
0.8
1
1.2
1.4
1.6
1.8
-90 -70 -50 -30 -10 10 30 50 70 90
ETC HP
KTb quasi-dynamic
MLR Values
1/cos
KTb steady-state
Figure 3: IAM for the direct radiation over the transversal direction for the ETC all glass HP collector (10 min averaging interval). Quasi-dynamic and steady-state test results.
0.4
0.6
0.8
1
1.2
1.4
1.6
-90 -70 -50 -30 -10 10 30 50 70 90
ETC DF
KTb quasi-dynamic
MLR Values
KTb steady-state
Figure 4: IAM for the direct radiation over the transversal direction for the ETC DF collector (10 min averaging interval). Quasi-dynamic and steady-state test results.

Project IEE/08/593/SI2.529236
Performance testing of evacuated tubular collectors Page 11 of 81
The “KTb quasi-dynamic” values were obtained using the experimental data (clear sky and Tm ~ Tamb) and the calculated parameters and inverting the model equation for the IAM of direct radiation. The “MLR values” are the result of the regression for the different angle intervals. The values for the steady-state test were obtained considering 15% of diffuse radiation and the Kd obtained in the quasi-dynamic test. The curve corresponding to the equation 1/cos(θ) is interesting when evaluating vacuum tube collectors without reflector, as these are cylindrical tubes (with cylindrical absorbers) and for much of the day show the same intersection area to the solar radiation. The equation 1/cos(θ) only resets the radiation incident on the plane of the collector to the value it has on the plane perpendicular to the direction Earth-Sun. This approach, purely geometric, could avoid tests with angles of 20 º and 40 º, when performing the steady-state test method for this type of collectors.
Symmetry in relation to the longitudinal plane was considered for the IAM and the final values represent an average of data from the morning and afternoon, both in the case of the steady-state and the quasi-dynamic tests. Thus, a fundamental rule in the tests of this type of collectors is to acquire experimental data roughly symmetrical to the solar noon to prevent biased results. But this approach is limited and can show a seasonal influence. In Summer time, the radiation flux during high incidence angles could be lower than in winter time. Another more season independent approach for these collectors is described below.
Test results according to the EN12975 standard
For the two collectors presented an agreement between the two test methods is observed. The steady-state values are obtained by averaging the morning and the afternoon periods.
Collector Method IAM (50 º)
Longitudinal
IAM (20 º)
Transversal
IAM (40 º)
Transversal
IAM (60 º)
Transversal
ETC DF Steady-state 0,88 1,02 1,02 1,10
Quasi-dynamic
0,90 1,02 1,03 1,12
ETC HP Steady-state 0.89 1,07 1,33 1,45
Quasi-dynamic
0,92 1,06 1,30 1,47
Limits for test methods for IAM detection
For collectors with really high time constants and capacity values, it is better to use either the quasi-dynamic approach or the steady state approach with continuously tracked collector and a fixed transversal or longitudinal incidence angle. See also Annex 1 for a more detailed explanation of the proposed approach. For the steady state approach, only the period close to noon with nearly constant irradiation levels will provide useful results.

Project IEE/08/593/SI2.529236
Performance testing of evacuated tubular collectors Page 12 of 81
Figure 6 illustrates the importance of the requirement to collect efficiency figures with similar incidence angles before and after solar noon as extremely high deviation between morning and afternoon can be observed. Figure 5 is showing the result of an IAM-detection by using the quasi-dynamic method for an all glass ETC collector with heat pipe with a time constant of 530 s and an effective heat capacity of 128 kJ/(m²K). The over and underestimation is not really a problem but some inlet temperature changes shows minor deviations.
Figure 6: Output power during IAM detection by using the quasi-dynamic method and a fixed collector position.
Figure 6: IAM detection using steady state method and fixed collector position (similar collector than figure 5; lower values in the morning, higher in the afternoon)

Project IEE/08/593/SI2.529236
Performance testing of evacuated tubular collectors Page 13 of 81
4 Influence of the tilt angle on the performance of heat pipes
The performance of gravity driven heat pipes is influenced by tilt angle under which the heat pipes are installed. This section describes the work performed related to this effect. The section is divided into one part dealing with investigations performed on heat pipes only and onto a second part dealing with investigations on complete collectors using heat pipes.
4.1 Measurements on heat pipes only
4.1.1 Measurements on heat pipes only
Peter Kovacs ([email protected])
Introduction
This report explains a procedure for investigating the power output tilt dependency of heat pipes used in Evacuated tubular collectors (ETCs). The method was applied to one heat pipe type using a constant fluid temperature on the hot side of 99°C and of 25°C and 50°C respectively on the cold side. The results points at a need for a standard test of the power output tilt dependency of heat pipes as a complement to performance testing of ETCs, but this needs to be confirmed by repeated tests on a variety of heat pipes.
Method
The test setup used to determine the heat pipes tilt dependency is described in Figure 1 and Figure 2.

Project IEE/08/593/SI2.529236
Performance testing of evacuated tubular collectors Page 14 of 81
Figure 1: Test set up with heat pipe inserted in a copper tube with circulating water
Figure 2: Detail of test setup
The test setup consist of a copper tube with a heat pipe inside it with one opening in the bottom and one in the top to be able to circulate hot water around the heat pipe. The hot water was held constant at 99° C throughout the whole test. The hot water entered the copper tube containing the heat pipe in the bottom and exits at the top. The flow rate on the hot side was held constant at about 1 m3/h throughout the test.

Project IEE/08/593/SI2.529236
Performance testing of evacuated tubular collectors Page 15 of 81
The condenser bulb of the heat pipe was mounted into a small manifold box with room for only four heat pipes. Since only one heat pipe was used in this test three of the holes in the manifold box were plugged and well insulated. Water at temperatures of 25°C and 50°C was circulated through the manifold box (further denoted as the cold side). In order to determine the heat pipe tilt dependency the heat transferred from hot to cold side was measured at different tilts as given in Table 2.
The heat output at each tilt angle was determined at steady state. The system was considered to be at steady state when the criteria’s in Error! Reference source not found. were fulfilled. The tilt dependency was determined at tilts in ten degree steps from 90° to 30° in relation to the horizontal plane. For each angle a test period of 10 minutes at steady state was evaluated. Each test period was preceded by a preconditioning period of 10 minutes at steady state. A mean value of the power output over the manifold box was determined for each 10 minute period. This mean value was plotted against the tilt angle to determine the tilt dependency of the heat pipe.
Table 1: Criteria determining steady state conditions during the measurements
Parameter Permitted deviation
Surrounding temperature ± 1 K
Fluid mass flow rate ± 5%
Fluid temperature at the inlet ± 0.05 K
From Figure 3 and Figure 4 we can clearly see that the energy output of the heat pipe decreases with decreasing tilt angle. Figure 3 shows that the energy output is fairly constant above 60° tilt angle when the cold side inlet temperature was held at 25°C. Below 60° tilt angle the output starts to decrease relatively fast. This decrease in power output can probably be explained by the fact that the gravity cannot transfer the condensed liquid down through the heat pipe fast enough at angles lower than 60° with the given setup. The decrease at 80° tilt angle cannot be explained by theory and is probably due to measurement uncertainty.
The reduction in power output going from 45° tilt (normal tilt in performance testing at SP) down to 30°(normal tilt in many installations) is approximately 35%.
From Figure 4, Tin = 50°C we can see the decrease is slower than in the case with Tin = 25°C. This is probably due to a lower ∆T between the hot side and the cold side which results in less condensed liquid in the heat pipe and therefore it becomes less dependent on the tilt angle i.e. the gravity. The corresponding reduction in power output when changing the tilt from 45° to 30° is just below 15% in this case.

Project IEE/08/593/SI2.529236
Performance testing of evacuated tubular collectors Page 16 of 81
0
20
40
60
80
100
120
140
160
180
20 40 60 80 100
Q h
eat
pip
e [
W]
Inclination angle [°]
Figure 3: Q heat pipe for various tilt angles at Tin = 25 ° C
Table 2: Q heat pipe for various tilt angles at Tin = 25 ° C
Tilt angle ° 90 80 70 60 50 40 30
Q heat pipe, W 170 165 171 164 130 99 71
0
20
40
60
80
100
120
140
20 40 60 80 100
Q h
eat
pip
e [
W]
Incliantion angle [°]
Figure 4: Q heat pipe for various tilt angles at Tin = 50 ° C
Table 3: Q heat pipe for various tilt angles at Tin = 50 ° C
Tilt angle ° 90 80 70 60 50 40 30
Q heat pipe, W 122 118 110 1066 N/A N/A 80

Project IEE/08/593/SI2.529236
Performance testing of evacuated tubular collectors Page 17 of 81
Conclusions
The reported tests were carried out with high quality measuring equipment, using a thorough procedure and thus the results are highly credible. However, due to the fact that only one type of heat pipe was tested, and from that type, only one sample, the results should be seen as indicative. It is therefore highly recommended that the same type of test is performed on a variety of heat pipe types in order to enable general conclusion on this phenomena.
The results derived from this particular study, showing power reductions in the order of 15-30% when changing the tilt from standard test conditions to standard installation conditions, suggests that tilt dependency should be a compulsory part of performance testing of ETCs with heat pipes. Furthermore, the installer manual and data sheets should clearly explain the effects of collector tilt on the performance for this type of collector.
4.1.2 Measurements on heat pipes only
Stephan Fischer ([email protected])
To determine the influence of the tilt angle on the performance of heat pipes the power of 10 heat pipes of the same type has been measured under different angles. The tests have been carried out based on the test procedure described in [1] using a test facility as shown in figure 1.
T
T
F
thermostat
tako setter
heating case
Heating circuit
T
F
T
thermostat
MID
cooling case
Cooling circuit
Figure 1: Scheme of test facility for the performance measurement of heat pipes
For the measurements a heating temperature of 70 °C and a cooling temperature of 30 °C were used. According to [1] a condenser area of

Project IEE/08/593/SI2.529236
Performance testing of evacuated tubular collectors Page 18 of 81
5000 mm² was used. The measured power for all 10 heat pipes is listed in table 1 and picture 2 shows the measured power over the tilt angle.
Each measurement shows slightly different results these are basically due to the following two reasons:
1. Measurement uncertainty
2. Variation in the production of the heat pipes
Nevertheless the tendency is in all 10 measurements the same, see also picture 3 showing the mean of all measurements.
Table 1: Power [W] of the heat pipe related to the tilt angle
Tilt angle 0° 2° 3° 4° 5° 6° 7° 8°
Heat pipe 1 0,00 4,43 4,58 3,89 18,11 43,92 69,14 79,34
Heat pipe 2 0,00 0,00 0,00 0,00 49,90 57,82 66,64 91,07
Heat pipe 3 0,00 0,00 0,00 0,00 7,38 53,81 69,39 74,02
Heat pipe 5 0,00 0,00 0,00 0,00 37,48 44,83 63,48 65,21
Heat pipe 4 0,00 0,00 7,42 9,40 29,71 39,99 51,26 77,85
Heat pipe 6 0,00 0,00 15,49 27,21 36,47 64,45 81,15 90,29
Heat pipe 7 0,00 0,00 11,00 28,28 41,81 52,03 60,51 84,13
Heat pipe 8 0,00 0,00 0,00 13,60 23,00 31,28 48,35 70,54
Heat pipe 9 0,00 0,00 0,00 17,38 25,26 37,33 46,53 62,58
Heat pipe 10 0,00 0,00 0,00 8,34 15,14 25,39 35,77 62,54
Tilt angle 10° 15° 30° 45° 60° 75° 90°
Heat pipe 1 111,31 129,45 128,56 131,07 126,86 124,69 130,49
Heat pipe 2 106,47 124,69 131,10 126,23 125,29 117,29 119,71
Heat pipe 3 106,87 124,95 134,92 129,10 123,65 120,49 117,22
Heat pipe 5 114,12 123,04 128,46 128,38 128,31 125,20 125,09
Heat pipe 4 95,24 111,39 121,87 119,66 117,96 110,89 109,37
Heat pipe 6 105,91 117,20 119,02 112,89 112,62 107,48 105,07
Heat pipe 7 106,62 119,78 124,30 122,93 113,99 107,98 110,08
Heat pipe 8 99,18 116,57 121,52 124,69 121,73 117,26 113,41
Heat pipe 9 98,34 122,04 124,62 122,36 115,95 112,15 106,10
Heat pipe 10 102,85 121,20 129,15 125,16 118,53 113,21 109,69

Project IEE/08/593/SI2.529236
Performance testing of evacuated tubular collectors Page 19 of 81
0
20
40
60
80
100
120
140
160
0 10 20 30 40 50 60 70 80 90
Po
wer
[W]
Tilt angle[°]
Heatpipe 1 Heatpipe 2
Heatpipe 3 Heatpipe 4
Heatpipe 5 Heatpipe 6
Heatpipe 7 Heatpipe 8
Heatpipe 9 Heatpipe 10
Figure 2: Power of the heat pipe over tilt angle
0
20
40
60
80
100
120
140
160
0 10 20 30 40 50 60 70 80 90
Po
wer
[W]
Tilt angle[°]
Table 3: Power of the heat pipe over tilt angle (mean of all measurements)
The heat pipe under investigation starts to deliver heat to the condenser at tilt angles between 2 to 5 degrees. The power increases significantly in the range of 10 to 15 degrees and reaches its maximum at approximately 30°. At higher angles of incidence the power decreases slightly again.
The results shown are only valid for the heat pipes under investigation. Different designs are likely to show different behaviour.
[1] Nanjing HETE Energy Conservation and Environmental: Q/3200 HETE 005-2006

Project IEE/08/593/SI2.529236
Performance testing of evacuated tubular collectors Page 20 of 81
4.2 Measurements on complete collectors
4.2.1 Measurements on complete collectors
Carsten Lampe ([email protected])
Common evacuated tubular collectors (ETC) with heat pipes use gravity driven heat pipes (figure 1). In an evaporation zone (in thermal contact to the absorber) the heat pipe medium changes phase from liquid to vapour and vice versa in the condensing zone (in manifold) the vapour changes to liquid phase. As the density of vapour is below that from liquid phase the process is gravity driven with evaporation at the bottom and condensing above.
Figure 1: scheme of ETC with heat pipe
According to this gravity driven process the efficiency of ETCs with heat pipes is depending on the installation angle. Additional often the condenser has a bigger diameter than the evaporator, so at low tilt angles condensed fluid may remain in the condenser and be cut of the evaporating process. The influence of tilt angle has been determined for some kind of heat pipes at low angles.
Variations in tilt angle
At four different ETCs with heat pipe the influence of the tilt angle was determined in addition to a regular performance test indoors at 45° tilt angle using a solar irradiance simulator. The additional measurements were made at lower tilt angles and one fluid temperature (mean fluid temperature in collector tm about ambient air temperature ta), one collector also at a second higher temperature1. A steeper tilt angle has not been tested.
Figure 2 to figure 5 show the development of efficiency over tilt angle and time. Three of the tested collectors have condensers with a diameter above the diameter of the evaporator (figure 2 to figure 4) one collector has a uniform diameter over the whole heat pipe (figure 5).
1 For the view in the graphs the efficiency has been normalized to 0 (tm = ta)
(respectively at Tm* 0.07 Wm²/K)) using the efficiency data from test at 45° tilt angle.
vacuum tube
absorber
heat pipe
manifold
evaporator
condenser

Project IEE/08/593/SI2.529236
Performance testing of evacuated tubular collectors Page 21 of 81
0.0
0.1
0.2
0.3
0.4
0.5
0.6
0.7
0.8
0.9
1.0
0:00 0:30 1:00 1:30 2:00 2:30 3:00 3:30 4:00
Time (hh:mm)
Eff
icie
ncy (
)
Tm*
h0.064
5° tilt angle5°0° 10° 10°15°15°
0
(Tm* = 0.06 Km²/W)
20°25°45°45°25°
20°
Figure 2: Efficiency of ETC with heat pipe at fluid temperature = ambient air temperature and at fluid temperature about 80°C at different tilt angles (22 mm condenser)
0.0
0.1
0.2
0.3
0.4
0.5
0.6
0.7
0.8
0.9
1.0
0:00 0:30 1:00 1:30 2:00 2:30 3:00 3:30 4:00 4:30 5:00 5:30 6:00
Time (hh:mm)
0
45° 0° 5° 0°
no irradiance
1° 0.5° tilt angle
Figure 3: Efficiency of ETC with heat pipe at fluid temperature = ambient air temperature at different tilt angles (22 mm condenser)

Project IEE/08/593/SI2.529236
Performance testing of evacuated tubular collectors Page 22 of 81
0.0
0.1
0.2
0.3
0.4
0.5
0.6
0.7
0.8
0.9
1.0
0:00 0:30 1:00 1:30 2:00 2:30 3:00 3:30 4:00 4:30 5:00
Time (hh:mm)
0
tilt angle45° 15° 10° -0.5°0.5°5°
Figure 4: Efficiency of ETC with heat pipe at fluid temperature = ambient air temperature at different tilt angles (14 mm condenser)
0.0
0.1
0.2
0.3
0.4
0.5
0.6
0.7
0.8
0.9
1.0
0:00 0:30 1:00 1:30 2:00 2:30 3:00 3:30 4:00 4:30 5:00 5:30
Time (hh:mm)
0
tilt angle45° 15° 10° 5° 0° -0.5°
Figure 5: Efficiency of ETC with heat pipe at fluid temperature = ambient air temperature at different tilt angles (12 mm condenser)
Result
Three of the tested four collectors show an efficiency (at mean fluid temperature in collector tm about ambient air temperature ta) not depending on the tilt angle for tilt angles from 45° to 5°. The one collector with additional tests at elevated fluid temperature shows this stabile efficiency at

Project IEE/08/593/SI2.529236
Performance testing of evacuated tubular collectors Page 23 of 81
elevated temperatures down to a tilt angle of 20° with a slight decrease at 15° and 10° with a mayor loss at 5° tilt angle.
Neither a variation of fluid temperatures at different tilt angles nor tests to elevated tilt angles from 45° to 90° have been carried out. Therefore results from the tests documented here show just a low influence of tilt angle for
determination of 0.
4.2.2 Measurements on complete collectors
Carol Buscarlet ([email protected])
Summary
When testing thermal performances of solar collectors according to EN 12975-2 with the outdoor steady state method, it is convenient to vary the tilt angle of the collector to keep the incidence angle of solar radiation near the normal. But we know that the inclination affects the operation of a heat pipe.
Some tests on evacuated tubular collectors with heat pipes show this influence. The best performance does not correspond to the greatest inclination. Tilt angle affects especially the thermal loss coefficient.
Therefore a fixed tilt angle is recommended.
Introduction
When testing thermal performance of solar collectors according to EN 12975-2 with the outdoor steady state method, it is convenient to vary the tilt angle of the collector to keep the incidence angle of solar radiation near the normal.
There is a note in § 6.1.1.3 of EN 12975-2: For many collectors, the influence of tilt angle is small, but it can be an important variable for specialized collectors such as those incorporating heat pipes.
Then we have performed some tests to assess the influence of the tilt angle on the performance of a solar collector with heat pipes.
Tests
A series of thermal performance tests was done on an evacuated tube solar collector with heat pipes.
In the first test, azimuth and tilt angle vary in such a way that the incidence angle is close to the normal.

Project IEE/08/593/SI2.529236
Performance testing of evacuated tubular collectors Page 24 of 81
Figure 5: test with an automatic tilt (normal incidence is verified by the gnomon on the bottom right)
The three following tests have tilt angles of 25, 50 and 70 °, but following the sun (keeping it in the vertical plane of a tube).
The value of 25 ° is the minimum given by the manufacturer. The value of 70 ° is the maximum tilt angle of the test bench. 50 ° is an intermediate value.
Tilt angle 25°
Tilt angle 50°
Tilt angle 70°
Automatic tilt angle (28 to 48 °)
sun height 45 to 58 ° 30 to 43 ° 44 to 51 ° 42 to 62 °
incidence angle
20 to 7 ° < 10 ° 24 to 31 ° < 1,4 °
η0 0.755 0.750 0.735 0.741
a1 [W/(m²K)] 1.471 0.832 2.033 1.764
a2 [W/(m²K²)] 0.0169 0.0208 0.00 0.0029
Table 1: Test conditions and results
The best results are obtained with the 50° tilt angle. The worst results are obtained with the 70° tilt angle.
Project IEE/08/593/SI2.529236
Performance testing of evacuated tubular collectors Page 25 of 81
Varying tilt angle affects especially the thermal loss coefficients.
Discussion
The poorer performance obtained with the 70° tilt angle cannot be attributed solely to the incidence angle greater than in the other tests.
The tilt angle influences the functioning of the heat pipe. When the heat pipe is horizontal the efficiency of the collector is near zero. It grows when the tilt angle increases up to a certain value and then decreases.
This decrease is likely due to the circulation patterns of the two phases of the fluid. One could make the comparison with a bottle that empties with cross circulation of a liquid and a gas. The vertical bottle drains slower than a bottle with a slight slant.
Then with the outdoor steady state method, the results will depend on the season and on the hour of the day if the tilt angle varies to keep a normal incidence angle.
The best would be to test the collector at several tilt angles across the operating range but it is not easy with the outdoor steady state method.
Conclusion
Thermal performance tests on evacuated tubular collectors with heat pipes show the influence of the tilt angle on the efficiency. The best performance does not correspond to the greatest inclination. Tilt angle affects especially the thermal loss coefficient.
Therefore a fixed tilt angle is recommended, a value recommended by the manufacturer or fixed by the standard.

Project IEE/08/593/SI2.529236
Performance testing of evacuated tubular collectors Page 26 of 81
5 Start temperature and required irradiance for heat pipes
5.1 Measurements on heat pipes only
Stephan Fischer ([email protected])
The following will describe the influence of the heating and cooling temperature on the thermal performance of the heat pipes investigated under different tilt angles in the previous chapter.
The heat pipe was installed with a tilt angle of 30° in the test facility
described in figure 1 of section 4.1.2. Two cooling temperatures (cool) where investigated 5 °C and 20 °C. In both cases the heating temperature
(heat) was increased in steps of 5 K starting at cool until a temperature difference of 55 K was reached. The measured power is listed in table 1, figures 1 and 2 show the corresponding graphs over the temperature difference ΔT and the heating temperature respectively. It can be seen that the increase in the heating temperature leads to an increase in the power output as well as the increase in the temperature difference. However the power increase related to the temperature difference is higher at a cooling temperature of 20 °C than at 5 °C.
Table 1: Power of the heat pipe at different cooling and heating temperatures
Temperature difference ∆T
0 5 10 15 20 25
Cooling at 20 °C 0 11,58 21,13 32,59 45,41 60,48
Cooling at 5 °C 0 6,79 15,21 24,15 33,92 45,33
Temperature difference ∆T
30 35 40 45 50 55
Cooling at 20 °C 76,18 92,36 110,08 128,80 149,73 169,44
Cooling at 5 °C 58,43 72,89 88,06 104,61 122,57 140,18

Project IEE/08/593/SI2.529236
Performance testing of evacuated tubular collectors Page 27 of 81
0
20
40
60
80
100
120
140
160
180
0 5 10 15 20 25 30 35 40 45 50 55
Po
wer
[W]
temperature difference ΔT [K]
cooling with 20 °C
cooling with 5 °C
Figure 1: Power of the heat pipe over temperature difference for different cooling and heating temperatures
0
20
40
60
80
100
120
140
160
180
0 5 10 15 20 25 30 35 40 45 50 55 60 65 70 75
Po
wer
[W]
heating temperature [°C]
cooling with 20 °C
cooling with 5 °C
Figure 2: Power of the heat pipe over heating temperature for different cooling temperatures

Project IEE/08/593/SI2.529236
Performance testing of evacuated tubular collectors Page 28 of 81
5.2 Measurements on complete collectors
A detailed evaluation of several thermal performance tests on "all glass heat pipe" collectors had shown, that irradiation levels above 200 W/m² are always sufficient to start the heat pipe. Independent of the used method for detection of thermal performance characteristic or incidence angle modifier values, this 200 W/m² will always be exceeded. Because of the high effective thermal capacity of these collector types and the high fluctuation of irradiation level during sunrise, a detailed detection of the heat pipe starting temperature is only possible by using a sun simulator which is able to adjust the irradiation within low irradiation ranges between 50 and 200 W/m². See Annex 5 for more details.
6 Impact of diffuse irradiance on the performance of evacuated tubular collectors with cylindrical absorber
Peter Kovacs ([email protected])
6.1 Introduction
The European standard for solar collector testing (EN 12975-2:2006) offers two different methods for characterizing the thermal performance of solar thermal collectors: The steady state method (SS) and the quasi dynamic method (QDT). The first one originates from the Ashrae 93-77 and ISO 9806 standards where the performance model parameters are determined under clear sky conditions (maximum 20 % diffuse fraction allowed, however EN 12975 states maximum 30 %) and at high irradiance levels (minimum 800 W/m2, EN 12975 states 700 W/m2). The QDT method was developed and introduced in the EN standard in 2001, as the EN 12975 was first published. Compared to the SS method, the QDT method offers the following main advantages:
It allows for accurate characterization of a wide range of collector types
It allows for testing under a wide range of operating and ambient conditions which effectively reflect normal operation conditions
It gives a more complete characterization of the collector through an extended parameter set as compared to steady state testing
The fact that all model parameters are determined at the same time, from the same all day data base makes it possible to perform a direct model validation, especially

Project IEE/08/593/SI2.529236
Performance testing of evacuated tubular collectors Page 29 of 81
when testing odd collector designs or when obtaining unexpected results
In the QDT collector model (Perers 1993, Perers 1995, Perers 1997, Fischer 2004), see equation 1 below, the original steady state equation has been modified and extended with some correction terms. A single incidence angle modifier (IAM) for hemispherical irradiance has thereby been divided
into incidence angle modifiers for direct ( )(b
K
) and diffuse (d
K
)
irradiance and the thermal capacitance term (c5) is integrated in the equation. Furthermore, terms for the heat loss dependence on long wave irradiance (c4) and wind speed (c3) and wind speed dependence of the zero loss coefficients (c6) have been added.
When introducing the IAM, the term 0 in the steady state equation has
been replaced by en
)(F' , indicating that it is the optical efficiency for
direct irradiance only. However, as shown in the following, the 0 derived from a steady state test is biased by diffuse irradiance and therefore cannot
be assumed equal toen
)(F' . A more relevant designation of these two
parameters reflecting this fact, 0 en (resulting from a steady state test) and
0 b, en (resulting from QDT), has been proposed in the current revision of
the EN standard.
/dtm
dt c - )T-(E c )a
t-m
(tu c -
)a
t-m
(t c - )a
t-m
(t c - *Gu c - Gd d
K en
)(F' Gb )(b
K en
)(F' A / Q
5
4
L43
2
216
.
a
(Eq. 1)
These generalizations make it possible to test collectors under the most varying weather conditions and in fact, a certain variation in the weather during testing is desirable in order to have all relevant parameters properly identified. This feature is a great advantage in some European locations where steady state testing can be very time consuming. On the contrary, applying the present version of QDT can be difficult in other locations for some collector designs, where the weather is very stable or where diffuse fractions are constantly very low (Alfonso el al 2008). There is thus a need for further development of the QDT in order to make it fully applicable also at such locations.
The other very advantageous feature of QDT is its applicability to a wide range of collector designs, including ETC:s, concentrating, semi concentrating (Rönnelid, Perers, Karlsson 1996, 1997) and unglazed collectors (Perers 1987). A further extension of the QDT method for test of unglazed collectors operating under the dew point of the air (for heat pump applications) is also available, but not yet fully validated (Perers 2006, Perers 2010). An interesting future perspective of the QDT method is that it

Project IEE/08/593/SI2.529236
Performance testing of evacuated tubular collectors Page 30 of 81
has the potential for radically shortening the required testing time e.g. by using night time measurements and frequent controlled step changes in the collector inlet temperature.
As the market now grows, the collector types mentioned are becoming increasingly common and it is essential that performance testing within reasonable effort can deliver results that are not biased by unique features of a single collector type. Recent experiences from testing of these products however tell us that steady state testing in this respect is not powerful enough, which is shown in the following example. A method for increasing accuracy of the steady state method and the compatibility between the two performance test methods by calculating “missing” parameters from the ones determined in the steady state test is outlined. The method described here has been implemented in an Excel tool for collector annual energy output calculation which was recently introduced in the proposed new EN 12975-2 standard (Boverket 2009, Perers 2011). The following example focuses on an ETC collector of the Dewar type, i.e. with a cylindrical absorber, as this is the most obvious case where the accuracy of the steady state method can be improved. However, the correction method may also be possible to use in order to generalize the steady state method to different concentrating designs even though QDT presently is the most appropriate method for these collectors.
6.2 Method to increase accuracy of steady state testing
When testing ETC:s with cylindrical absorbers according to the steady state method, the ability to utilize irradiance coming from non-normal incidence angles, a specific feature of this collector type, can result in a significant bias in the resulting model parameters. This is due to the following two effects:
The impact of the incidence angle modifier for direct irradiance in the transverse direction )(
b K T
is positive
(i.e. e
)(F' >en
)(F' ) and much more pronounced compared to
e.g. flat plate collectors. Requirements in the EN (SS part) and ISO standards are that the IAM must not differ more than 2% from its value at normal incidence during performance testing. This makes the “acceptance angle” for determining
en)(F' by steady
state measurements very small (often below ±5 degrees). This should be further stressed in the EN 12975 standard as measurements at higher angles can lead to significant over estimation of the
en)(F' parameter. From a practical point of
view it means that a solar tracker should be used in testing unless very stable weather conditions are guaranteed at the test site. If the collector is mounted on a fixed structure the acceptance angle

Project IEE/08/593/SI2.529236
Performance testing of evacuated tubular collectors Page 31 of 81
of ± 5 degrees corresponds to a time window of only ± 20 minutes around solar noon.
The incidence angle modifier for diffuse irradiance is normally in the range of 1,0 <
d K
< 1,5 for this kind of collector i.e. resulting
in a higher efficiency for diffuse than for direct irradiance as compared to e.g. flat plate collectors where it is normally between 0,85 and 1,0 i.e. a less pronounced effect resulting in a lower efficiency for diffuse than for direct irradiance. Determination of
en)(F' that should represent direct irradiance at normal
incidence will therefore be positively biased even at relatively low
diffuse fractions during an EN-SS test. As d
K
is not identified
through the steady state test, this effect cannot be directly corrected for. If different diffuse fractions occur when
en)(F' and
e)(F' are measured this will probably also give a
bias in the values of KθbL and KθbT. The impact of these two effects are shown in table 2 by calculating the zero
loss coefficient 0 (which is effectively what is determined as F´(τα)en in the
steady state measurement) from a “fixed” en
)(F' for a set of incidence
angles and diffuse fractions, according to equation (2). Here, a zero loss coefficient for hemispherical irradiance is weighted together by the corresponding coefficients for direct and for diffuse irradiance.
0 = F´(τα)en*Kθb(θ=θi)* a + F´(τα)en*Kθd* (1-a) [--] (Eq. 2) Where Kθb(θi)= KθbL(θi,l)* KθbT(θi,T), a=fraction of direct irradiance, (1-a)=
fraction of diffuse irradiance. 0= zero loss efficiency from stationary
testing. θi is the average incidence angle during the SS - 0 test Now, if the IAM for diffuse irradiance Kθd can be determined, equation (2)
can be used to calculate F´(τα)en from measured values of 0, from measured or default values of the IAM for direct irradiance Kθb(θi) and from the fraction of direct irradiance a.
F´(τα)en= 0 /[ Kθb(θ=θi)* a + Kθd* (1-a)] (Eq. 3)
In the proposed method for adjusting steady state parameters to better accuracy, Kθd is first determined from the measured values of KθbL and KθbT,
by integrating them over a hemisphere, assuming isotropic sky conditions (Perers 1995). Thereafter, F´(τα)en is calculated according to equation (3).
6.3 Results
A typical evacuated tube collector with cylindrical absorber tested according to the steady state method is partly characterized by the IAM parameters according to table 1 and Figure 6.

Project IEE/08/593/SI2.529236
Performance testing of evacuated tubular collectors Page 32 of 81
Table 1: Incidence angle modifiers for direct hemispherical irradiance in the transverse and longitudinal directions for the example collector Angle of incidence [º]
0 10 20 30 40 50 60 70 80 90
KθbL 1.000 1.000 1.000 0.985 0.970 0.920 0.840 0.700 0.350 0.000
KθbT 1.000 1.070 1.140 1.275 1.410 1.730 1.760 1.760 0.880 0.000
0
0.2
0.4
0.6
0.8
1
1.2
1.4
1.6
1.8
2
0 20 40 60 80
KQ
L a
nd
KQ
T
Angle of incidence
K(Long)
K(Trans)
Figure 6: Incidence angle modifiers for direct hemispherical irradiance in the transverse and longitudinal directions for the example collector
Integrating the values of KθbL(θi,L) and KθbT(θi,T) over the hemisphere gives a calculated Kθd equal to 1,22.
Depending on the diffuse fraction and any incidence angle offset from normal incidence during steady state measurements of this particular ETC,
the measured 0-value will deviate from the true F´(τα)en value (0,65) according to table 2. In other words, the conventional steady state test will only produce the true F´(τα)en in the case represented in the first row of table 2 (for parallel light=beam radiation, at normal incidence, no diffuse radiation at all). The annual energy gain in table 2 has been calculated using weather data from Meteonorm for Stockholm and an Excel tool developed within the Solar Keymark II and Qaist projects (Boverket 2009, Perers 2011). The following collector model parameters have been used:
Project IEE/08/593/SI2.529236
Performance testing of evacuated tubular collectors Page 33 of 81
0 = According to table 2
a1=1.5 Wm-2K-1
a2=0.01 Wm-2K-2
IAM (KθbL and KθbT )= According to table 1
Kθd=1,22 (calculated from KθbL and KθbT according to the method described above)
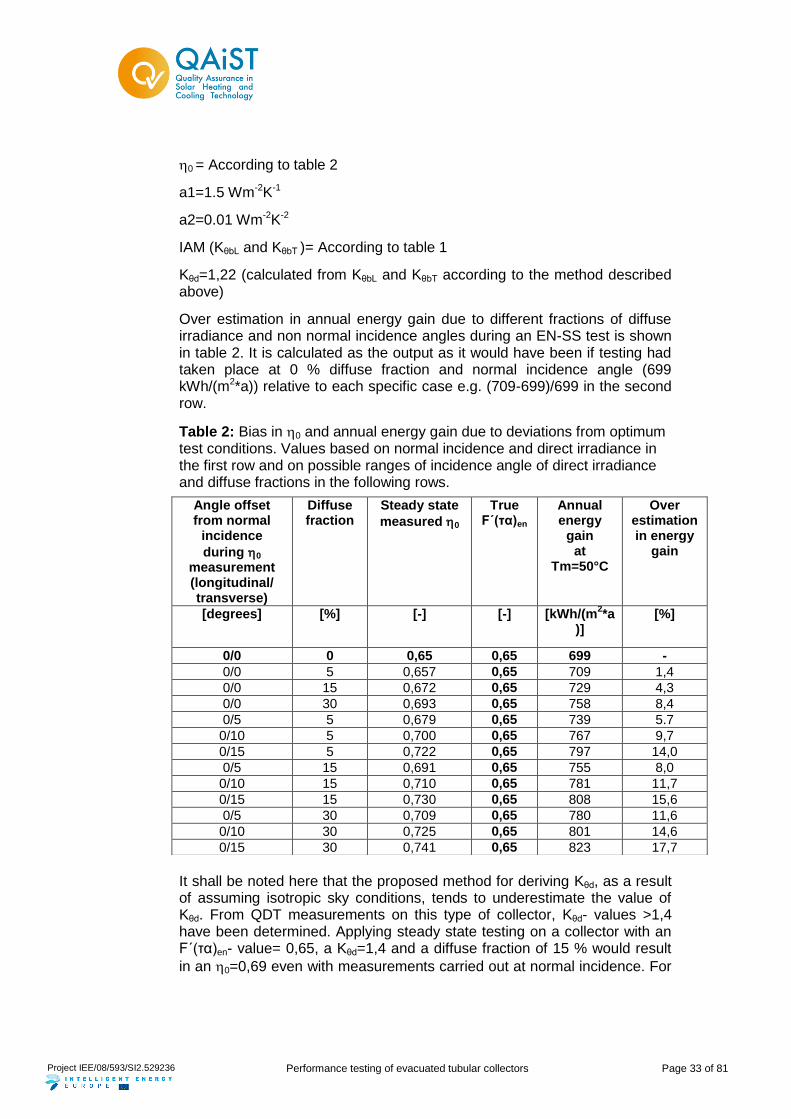
Over estimation in annual energy gain due to different fractions of diffuse irradiance and non normal incidence angles during an EN-SS test is shown in table 2. It is calculated as the output as it would have been if testing had taken place at 0 % diffuse fraction and normal incidence angle (699 kWh/(m2*a)) relative to each specific case e.g. (709-699)/699 in the second row.
Table 2: Bias in 0 and annual energy gain due to deviations from optimum test conditions. Values based on normal incidence and direct irradiance in the first row and on possible ranges of incidence angle of direct irradiance and diffuse fractions in the following rows.
It shall be noted here that the proposed method for deriving Kθd, as a result of assuming isotropic sky conditions, tends to underestimate the value of Kθd. From QDT measurements on this type of collector, Kθd- values >1,4 have been determined. Applying steady state testing on a collector with an F´(τα)en- value= 0,65, a Kθd=1,4 and a diffuse fraction of 15 % would result
in an 0=0,69 even with measurements carried out at normal incidence. For
Angle offset from normal
incidence
during 0 measurement (longitudinal/ transverse)
Diffuse fraction
Steady state
measured 0
True F´(τα)en
Annual energy
gain at
Tm=50°C
Over estimation in energy
gain
[degrees] [%] [-] [-] [kWh/(m2*a
)] [%]
0/0 0 0,65 0,65 699 -
0/0 5 0,657 0,65 709 1,4
0/0 15 0,672 0,65 729 4,3
0/0 30 0,693 0,65 758 8,4
0/5 5 0,679 0,65 739 5.7
0/10 5 0,700 0,65 767 9,7
0/15 5 0,722 0,65 797 14,0
0/5 15 0,691 0,65 755 8,0
0/10 15 0,710 0,65 781 11,7
0/15 15 0,730 0,65 808 15,6
0/5 30 0,709 0,65 780 11,6
0/10 30 0,725 0,65 801 14,6
0/15 30 0,741 0,65 823 17,7

Project IEE/08/593/SI2.529236
Performance testing of evacuated tubular collectors Page 34 of 81
collectors of conventional design with Kθd- values < 1,0 the result will be the
opposite i.e. an under estimation of 0 , however less pronounced as the IAM for diffuse irradiance (Kθd ) is closer to that for direct irradiance in this case. As a pragmatic approach to the issue of choosing incidence angles and diffuse fractions for a standardized correction procedure, it is suggested that normal incidence and a diffuse fraction of 15 % is applied in all calculations. This figure has no scientific basis but is merely an assumption or an estimate of average conditions prevailing during steady state testing. This is partly in accordance with the weighting procedure applied in EN 12975 where a reference steady state case has been defined for graphical presentation of QDT results. In that case 15% diffuse fraction and Θi equal to 15 degrees is used.
6.4 Conclusions
It has been shown that the zero loss coefficient and thus the energy performance of ETC:s with cylindrical absorbers when determined according to the steady state method described in EN 12975-2 is over estimated due to the specific characteristics of this collector type. The proposed method will deliver a more accurate value of F´(τα)en as well as a “new” parameter, Kθd when steady state testing is applied to an ETC collector with cylindrical absorber. Considering that the diffuse fraction of annual irradiance for many European locations is in the order of 35-45 % it is essential that this dependency can be accurately modeled. System simulations and annual performance predictions based on the steady state test can thus be carried out with significantly improved accuracy for this type of collector. In particular the modeling of collector characteristics and system performance can be improved at low irradiance levels and high diffuse fractions, more often occurring during the heating season i.e. autumn to spring, where heat produced is generally more valuable than in the summer season. The method tends to under estimate Kθd and could thus be further refined. If the method could be shown to give good agreement between measured (using QDT) and calculated (based on steady state measurements) values of Kθd it could open up for a wider application range also for steady state testing. The presented findings reveal a need for some further clarifications in the EN 12975 standard in order to avoid overestimation of collector performance for certain collector types.
6.5 References
Alfonso J., Mexa N., Carvalho M, 2008 ”Comparison between Steady State and Quasi-Dynamic test Method according to EN 12975- application to flat plate collectors.” Eurosun 2008

Project IEE/08/593/SI2.529236
Performance testing of evacuated tubular collectors Page 35 of 81
Boverket, 2009 “Swedish annual energy gain v 2008-11-27.xls” The National Boarding of Housing, Building and Planning of Sweden.
CEN, European committee for standardization, 2006 “EN 12975-2:2006, Thermal solar systems and components - Collectors - Part 2: Test methods”
Fischer S et. al, 2004 “Collector test method under quasi dynamic conditions according to the European Standard EN 12975-2” Solar Energy. Vol 76 pp 117-123
Perers, B, 1987 “Performance testing of Unglazed Collectors. Wind and Long wave Radiation Influence” IEA Task III. Studsvik 1987
Perers, B, 1993 “Dynamic Method for Solar Collector Array Testing and Evaluation with standard Database and Simulation Programs.” Solar Energy Vol 50. No 6. pp 517-526
Perers, B, 1995 “Optical modeling of Solar Collectors and Booster Reflectors under Non Stationary Conditions.” PhD Thesis. Uppsala University. ISBN 91-554-3496-7.
Perers, B, 1997 “An Improved Dynamic Solar Collector Test Method for determination of Nonlinear Optical and Thermal Characteristics with Multiple Regression.” Solar Energy 59 163-178.
Perers B, 2006 “A Dynamic Collector Model for Simulation of the operation below the dew point in Heat Pump Systems.” Eurosun Conference Glasgow
Perers, B, 2010 “An improved dynamic solar collector model including condensation and asymmetric incidence angle modifiers.” Eurosun 2010.
Perers, B et al, 2011 “A new tool for standardized collector performance calculations”. ISES 2011.
Rönnelid M., Perers B., Karlsson B,1996 “Construction and Testing of a Large area CPC collector and Comparison with a Flat plate collector.” Solar energy 57. 177-184.
Rönnelid M., Perers B., Karlsson B, 1997 “On the factorization of Incidence Angle Modifiers for CPC Collectors.” Solar Energy Vol. 99. No. 4-6. pp. 281-286.

Project IEE/08/593/SI2.529236
Performance testing of evacuated tubular collectors Page 36 of 81
7 Ageing effects of heat transfer paste
Carsten Lampe (c.lampe@isfh)
7.1 Introduction Within the QAiST project several project partners took part in a long term exposure test of collectors coordinated by CSTB with focus on durability.
ISFH, participating with evacuated tubular collectors (ETC) with heat pipes having a dry connection the manifold, kept a closer look on the performance of the exposed collectors. In recurring tests over the exposure time a proceeding decrease of the performance was observed. To give this observation a broader basis the tests of the primarily two collectors have been repeated with two more collectors.
In ETC with heat pipes having a dry connection to the manifold the use of heat transfer paste between condenser and manifold is common. The observation during the long term exposure results in the idea to evaluate the influence of heat transfer paste in the decrease of performance.
7.2 Trend of collector performance over the long term exposure
7.2.1 Description of the exposed collectors
Four ETC with heat pipe dry system and heat transfer paste between condenser and manifold have been long term exposed:
- 137-10/KP Koll 1: Single glass ETC with 20 tubes, selective coated copper absorber, copper heat pipes, and 14 mm condenser, aluminium connecting tube to 22 mm for manifold, heat transfer paste between condenser and tube and tube and manifold. Two-part manifold clamping the tube of the condenser.
- 137-10/KP Koll 2: Double glass ETC (dewar) with 15 tubes, selective coated glass absorber (outer side of inner glass tube), aluminium heat conduction sheets to copper heat pipes, and 14 mm condenser, heat transfer paste between condenser and manifold.
- 68-11/KP Koll 1: Single glass ETC with 20 tubes, selective coated copper absorber, copper heat pipes, and 22 mm condenser, heat transfer paste between condenser and manifold, thermal valve to avoid high temperatures in condenser.
Project IEE/08/593/SI2.529236
Performance testing of evacuated tubular collectors Page 37 of 81
- 68-11/KP Koll 2: Double glass ETC (dewar) with 15 tubes, selective coated glass absorber (outer side of inner glass tube), aluminium heat conduction sheets to copper heat pipes, and 14 mm condenser, heat transfer paste between condenser and manifold.
7.2.2 Testing procedure
The testing procedure is divided in subsequent indoor performance tests with interim outdoor empty exposure phases. In detail:
- initial performance test according to EN 12975-2:2006 (after at least 5 h empty exposure at an irradiance of at least 700 W/m²)
- outdoor empty exposure of at least 30 d at 14 MJ/m²d 2
- interim performance test
- continuation of outdoor empty exposure
- final performance test
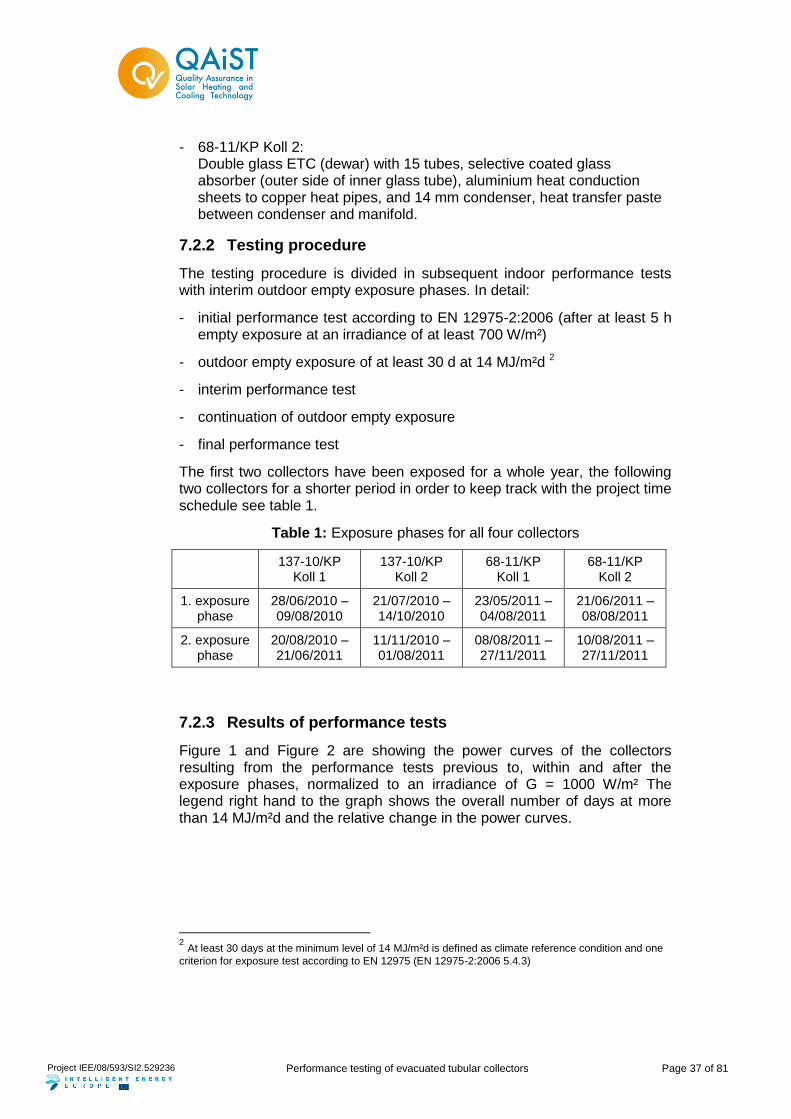
The first two collectors have been exposed for a whole year, the following two collectors for a shorter period in order to keep track with the project time schedule see table 1.
Table 1: Exposure phases for all four collectors
137-10/KP
Koll 1 137-10/KP
Koll 2 68-11/KP
Koll 1 68-11/KP
Koll 2
1. exposure phase
28/06/2010 – 09/08/2010
21/07/2010 – 14/10/2010
23/05/2011 – 04/08/2011
21/06/2011 – 08/08/2011
2. exposure phase
20/08/2010 – 21/06/2011
11/11/2010 – 01/08/2011
08/08/2011 – 27/11/2011
10/08/2011 – 27/11/2011
7.2.3 Results of performance tests
Figure 1 and Figure 2 are showing the power curves of the collectors resulting from the performance tests previous to, within and after the exposure phases, normalized to an irradiance of G = 1000 W/m² The legend right hand to the graph shows the overall number of days at more than 14 MJ/m²d and the relative change in the power curves.
2 At least 30 days at the minimum level of 14 MJ/m²d is defined as climate reference condition and one
criterion for exposure test according to EN 12975 (EN 12975-2:2006 5.4.3)

Project IEE/08/593/SI2.529236
Performance testing of evacuated tubular collectors Page 38 of 81
0
200
400
600
800
1000
1200
1400
1600
1800
0 20 40 60 80 100
tm-ta in K
po
wer
ou
tpu
t p
er
co
llecto
r u
nit
in
W
137-10/KP Koll 1 initial
137-10/KP Koll 1 interim(31 d at > 14 MJ/m²d)
137-10/KP Koll 1 final(138 d at > 14 MJ/m²d)
137-10/KP Koll 2 initial
137-10/KP Koll 2 interim(34 d at > 14 MJ/m²d)
137-10/KP Koll 2 final(142 d at > 14 MJ/m²d)
- 3.4 %
- 4.9 %
- 3.6 %
- 12.3 %
decrease of powercurves
compared to initial test
integral 0 - 100 K
Figure 1: Power curves according to EN 12975-2:2006 of test samples exposed in 2010/2011
0
200
400
600
800
1000
1200
1400
1600
1800
0 20 40 60 80 100
tm-ta in K
po
wer
ou
tpu
t p
er
co
llecto
r u
nit
in
W
68-11/KP Koll 1 initial
68-11/KP Koll 1 interim(51 d at > 14 MJ/m²)
68-11/KP Koll 1 final(95 d at > 14 MJ/m²)
68-11/KP Koll 2 initial
68-11/KP Koll 2 interim(30 d at > 14 MJ/m²d)
68-11/KP Koll 2 final(72 d at > 14 MJ/m²d)
- 3.6 %
- 6.2 %
- 3.0 %
- 5.1 %
decrease of powercurves
compared to initial test
integral 0 - 100 K
Figure 2: Power curves according to EN 12975-2:2006 of test samples exposed in 2011
Project IEE/08/593/SI2.529236
Performance testing of evacuated tubular collectors Page 39 of 81
7.3 Influence of changes in the heat transfer pastes over the exposure time on the decrease of collector performances
The final performance test after the long term exposure allows a direct evaluation of an ageing effect of the heat transfer paste performing the test first as exposed followed by a performance test with the exposed collector but renewed heat transfer paste.
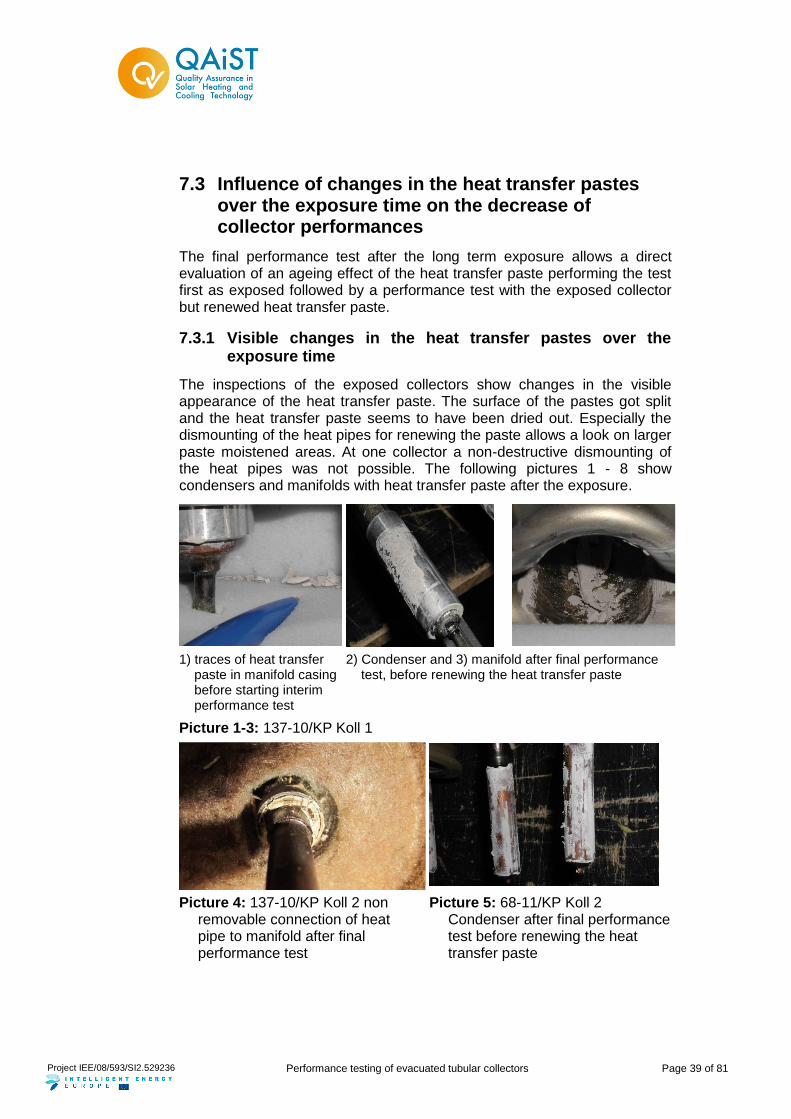
7.3.1 Visible changes in the heat transfer pastes over the exposure time
The inspections of the exposed collectors show changes in the visible appearance of the heat transfer paste. The surface of the pastes got split and the heat transfer paste seems to have been dried out. Especially the dismounting of the heat pipes for renewing the paste allows a look on larger paste moistened areas. At one collector a non-destructive dismounting of the heat pipes was not possible. The following pictures 1 - 8 show condensers and manifolds with heat transfer paste after the exposure.
1) traces of heat transfer paste in manifold casing before starting interim performance test
2) Condenser and 3) manifold after final performance test, before renewing the heat transfer paste
Picture 1-3: 137-10/KP Koll 1
Picture 4: 137-10/KP Koll 2 non removable connection of heat pipe to manifold after final performance test
Picture 5: 68-11/KP Koll 2 Condenser after final performance test before renewing the heat transfer paste

Project IEE/08/593/SI2.529236
Performance testing of evacuated tubular collectors Page 40 of 81
Picture 6-8: 68-11/KP Koll 1 Condenser and manifold after final
performance test before renewing the heat transfer paste
7.3.2 Results of comparative performance tests
In figure 3 the results of the indoor performance test of three of the exposed collectors with aged heat transfer paste compared to the same exposed collectors with renewed heat transfer paste are shown. Each of the tested collectors shows a deviation in performance caused by the ageing of the heat transfer paste. Collector 137-10/KP Koll 1 with reduction of the gap between condenser and manifold (to be bridged by the heat transfer paste) by clamping shows a minor effect.
0
200
400
600
800
1000
1200
1400
1600
1800
0 20 40 60 80 100
tm-ta in K
po
wer
ou
tpu
t p
er
co
llecto
r u
nit
in
W
137-10/KP Koll 1 final(138 d at > 14 MJ/m²d)
137-10/KP Koll 1 finalnew paste
68-11/KP Koll 1 final (95 d at > 14 MJ/m²d)
68-11/KP Koll 1 finalnew paste
68-11/KP Koll 2 final (72 d at > 14 MJ/m²d)
68-11/KP Koll 2 finalnew paste
- 1.7 %
- 4.5 %
influence of aged
heat transfer paste
on powercurves
integral 0 - 100 K
- 2.4 %
Figure 3: Power curves according to EN 12975-2:2006 after exposure with aged compared to new heat transfer paste
7.3.3 Evaluation of thermal load of heat transfer paste
As the examination of ageing of heat transfer pastes was no original aim of the long term exposure within the project the data of condenser temperatures does not cover the complete exposure time. The duration of

Project IEE/08/593/SI2.529236
Performance testing of evacuated tubular collectors Page 41 of 81
different thermal loads would be interesting to evaluate the reliability of heat transfer pastes.
Part of a standard test according to EN 12975 is the determination of stagnation temperature. The stagnation temperature of the four exposed collectors was determined during the 5 h empty exposure prior to the initial performance test.
Stagnation temperatures of the exposed collectors (normalized to global irradiance G = 1000 W/m² and ambient air temperature ta = 30 °C):
137-11/KP Koll 1: tstg = 280 °C
137-11/KP Koll 2: tstg = 235 °C
68-11/KP Koll 1: tstg = 165 °C3
68-11/KP Koll 2: tstg = 232 °C
Figures 4 to 6 show the times of occurrence of different temperatures in times with connected temperature sensors.
0
50
100
150
200
250
300
350
400
20 40 60 80 100 120 140 160 180 200 220 240 260 280
Temperatures at condenser (in °C)
ho
urs
28/06/2010 - 09/08/2010
28/06/2010 - 09/08/2010 +20/08/2010 - 27/10/2010
Figure 4: Hours of mean condenser temperatures (intervals of 20 °C up to the given abscissa value) during parts of the long term exposure of collector 137-10/KP Koll 1 (in 2010)
3 The heatpipes of collector 68-11/KP Koll 1 are equipped with a thermal valve
limiting the condenser temperature the measured temperature at the condenser has been 151 °C and the extrapolation procedure cannot reflect such a mechanism

Project IEE/08/593/SI2.529236
Performance testing of evacuated tubular collectors Page 42 of 81
0
50
100
150
200
250
300
350
400
20 40 60 80 100 120 140 160 180 200 220
Temperatures at condenser (in °C)
ho
urs
08/08/2011 - 27/11/2011
Figure 5: Hours of mean condenser temperatures (intervals of 20 °C up to the given abscissa value) during second part of the long term exposure of collector 68-11/KP Koll 1
Even collector 68-11/KP Koll 1 with a determined stagnation temperature of 165°C (at G = 1000 W/m² and ta = 30 °C) and a thermal valve shows a significant number of hours above 180 °C measured at the condenser (Figure 5).
0
50
100
150
200
250
300
350
400
450
500
20 40 60 80 100 120 140 160 180 200 220 240
Temperatures at condenser (in °C)
ho
urs
21/06/2011 - 08/08/2011
21/06/2011 - 08/08/2011 +10/08/2011 - 27/11/2011
Figure 6: Hours of mean condenser temperatures (intervals of 20 °C up to the given abscissa value) during the long term exposure of collector 68-11/KP Koll 2

Project IEE/08/593/SI2.529236
Performance testing of evacuated tubular collectors Page 43 of 81
For nearly the whole given period there are 30 min mean data of ambient air temperature and irradiance (Figure 7)4. Using this data and the determined stagnation temperatures of the collectors a rough estimation of the occurrence of different condenser temperature for the whole exposure phase is possible.
Figure 8 shows the estimated condenser temperatures using the extrapolation method from former German DIN V 4757-3:1995-11
stagastag
meas
measastagcond
cond GG
,3.1
1
3.11
,,
eq. 15
cond temperature at condenser,
stagcond, stagnation temperature,
measa, measured ambient air temperature,
measG measured irradiance,
staga, ambient air temperature at stagnation condition,
stagG irradiance at stagnation
Ambient air speed and characteristic of the tested collectors like the thermal valve to avoid high temperatures in condenser at collector 68-11/KP Koll 1 are neglected in this approximation.
4 No data in winter 28/11/2010-28/02/2011 as maintenance and calibration phase of
the measuring and logging equipment
5 The 1.3 in the denominator of the exponent of the irradiation is an approximate
value for flat plate collectors with rising errors to higher deviation of irradiance and ambient air temperature to the reference values. Nevertheless it is used here for tubular collectors as it is just to get a feeling of frequencies of occurrences of different temperatures.

Project IEE/08/593/SI2.529236
Performance testing of evacuated tubular collectors Page 44 of 81
0
100
200
300
400
500
600
100 200 300 400 500 600 700 800 900 1000 1100 1200
Mean hourly irradiance (in W/m²)
ho
urs
137-10/KP Koll 1
137-10/KP Koll 2
68-11/KP Koll 1
68-11/KP Koll 2
Figure 7: Hours of mean hourly irradiances (in intervals of 100 W/m² up to the given abscissa value) during the long term exposure of the four collectors (no data from 28/11/2010 to 28/02/2011)
0
100
200
300
400
500
600
20 40 60 80 100 120 140 160 180 200 220 240 260 280 300
Estimated mean hourly condenser temperature (in °C)
ho
urs
137-10/KP Koll 1
137-10/KP Koll 2
68-11/KP Koll 1
68-11/KP Koll 2
Figure 8: Hours of estimated mean hourly condenser temperatures (in intervals of 20°C up to the given abscissa value) during the long term exposure of the four collectors (no data from 28/11/2010 to 28/02/2011)
7.4 Conclusion
The thermal reliability of heat transfer paste has a significant influence on the performance of collectors. All pastes in the long term exposure

Project IEE/08/593/SI2.529236
Performance testing of evacuated tubular collectors Page 45 of 81
documented in the report on hand show a decrease in the thermal conductivity. The current standard EN 12975-2:2006 does not reflect any influence that may be caused by ageing of materials: “The Thermal performance test shall be carried out on a collector that had not been used for other tests” (EN 12975-2:2006, table 1, note f). The use of a heat transfer paste or the characteristic of heat transfer paste in case of using are at present not to be documented in the test reports.
Even the sometimes advertised easy replacement (or final de-mounting) of tubes at heat pipe collectors with dry connection between condensers and manifold is influenced by the thermal reliability or stability of the used heat transfer paste. An observation was that heat pipes brake during the attempt to change them since the heat transfer paste actually glues the condenser into the manifold.
Additional results are presented in OTTI 20126.
8 Performance limitation effects and inconsistent conductance of heat pipes in solar collectors
Carsten Lampe (c.lampe@isfh)
Introduction
Collectors with heat pipes are state of the art for non- or low concentrating evacuated tubular collectors (ETCs). They are already numerously tested and certified according to the Solar Keymark scheme rules. Solar collectors will be tested according to [EN 12975] and the collector power output will be described for a certain global irradiance level as a function of the heat gain and the temperature difference between ambient air and fluid. But it is possible that for heat pipe collectors in certain operation points this description can lead to wrong power curves, because of limitation effects within the internal heat transfer of the heat pipe. Depending on the construction of the heat pipe the power output of the collector for high irradiance levels can be a function of the collector fluid temperature instead of the temperature difference between ambient air and collector fluid.
At the Institut für Solarenergieforschung Hameln (ISFH an untypical power curve of a serial heat pipe collector type was determined. Additionally by means of a heat pipe test rig developed at the ISFH the performance data of the collector test were compared to the performance data calculated with the heat transfer limits of the single heat pipes used in the tested collector.
6 Jack, S. et al: „Wärmetransporteigenschaften von Sammlern aus
Vakuumröhrenkollektoren mit Wärmerohren“, proceedings 22. Symposium Thermische Solarenergie 2012, Bad Staffelstein, Germany.

Project IEE/08/593/SI2.529236
Performance testing of evacuated tubular collectors Page 46 of 81
The performance limiting effects of heat pipes relevant for the collector test and the collector use in practice are shown in this section. It presents the determination of heat transfer limits of heat pipes and the impact of these limits on the power curve of a solar collector.
Collector performance measurement
A heat pipe ETC with 30 tubes within was tested according to EN 12975.
Therefore the efficiency was determined at different temperature
differences T between the mean fluid temperature tm and ambient air
temperature ta. The efficiency is the ratio of thermal power output QGain to irradiance power input G·A. In figure 1 the power output of the collector
area A is plotted over the temperature difference T.
The results of the performance test show an untypical characteristic for lower temperature differences: At reduced temperature differences below 30 K the collector efficiency is getting lower than the efficiency at 30 K and the variation of the measurement points is getting higher. This power curve was reproducible and a further collector of the same type shows an identical behaviour.
0
200
400
600
800
1000
1200
1400
1600
1800
2000
0 10 20 30 40 50 60 70 80 90 100
tm-ta in K
po
we
r o
utp
ut
pe
r c
oll
ec
tor
un
it i
n W
1000-950 W/m² 52° - 59°
950-900 W/m² 56° - 65°
900-830 W/m² 67° - 69°
irradiance inclination
Figure 1: power curve according to EN 12975 for 1000 W/m² with
measurement data related to the temperature difference T
This characteristic is not explicable with an extraordinary behaviour of the thermal losses: There is no possibility that the heat loss coefficient of the collector insulation has a minimum at a defined temperature difference. Looking at equation 1 for the collector efficiency there remains the
conversion factor 0 as the reason for the untypical efficiency curve.
2
210 TaTaGAGA eq. 1

Project IEE/08/593/SI2.529236
Performance testing of evacuated tubular collectors Page 47 of 81
Having a closer look at the conversion factor in equation 2, we can concentrate our investigations on the thermal conductance uint.
lossint
inteffeff0 )(')(
UU
UF
eq. 2
The collector heat loss coefficient Uloss gets only marginally higher with an increasing temperature and the effective product of transmission and
absorption (eff describing the optical losses of a collector is constant over the temperature. Provided that the flow conditions of the solar circuit is almost identical the thermal conductance Uint of a direct flow collector is nearly constant as well (a small increase with higher temperatures is typical). But this does not apply generally for heat pipe collectors.
Heat transfer limitations and thermal conductance of heat pipes In collectors heat pipes are used for heat transfer from absorber to manifold. Inside of heat pipes a heat driven two-phase thermodynamic cycle takes place. Therefore, in the evaporator section of the heat pipe, which is located at the absorber, the working fluid is evaporated and transported to the condenser section, which is located at the manifold. Here the condensation takes place. Driven by gravity the condensate flows back into the evaporator section where it evaporates again. Typically in solar thermal collectors cost-effective gravitational heat pipes without capillary structures (two-phase closed thermosyphons) are used. Within collectors heat pipes function as highly concentrating heat exchangers based on the area ratio of the evaporator to the condenser. This specific characteristic has influence on the thermal conductance as well as the heat transfer limitations of heat pipes. Figure 2 represents an equivalent network of the mainly influencing thermal resistances on the overall thermal conductance of heat pipes.
abs Q
loss Q gain Q
vacuum tube
absorber
heat pipe
manifold
abs Q
1/Ufin 1/UHP 1/Umanifold1/Uloss
loss Q gain Q
TabsTamb Tfluid
1/Uint
abs Q
loss Q gain Q
vacuum tube
absorber
heat pipe
manifold
abs Q
1/Ufin 1/UHP 1/Umanifold1/Uloss
loss Q gain Q
TabsTamb Tfluid
1/Uint
Figure 2: Node collector model for HP collectors

Project IEE/08/593/SI2.529236
Performance testing of evacuated tubular collectors Page 48 of 81
For heat pipe collectors the thermal conductance Uint can be split into partial conductances for the absorber Ufin, the heat pipe UHP and the manifold Umanifold. In figure 2 is shown the sum of the inverse conductances – also called thermal resistances – in a node model. The thermal conductance of the absorber and the manifold are approximately constant, if the mass flow of the solar circuit not varies and if it occurs no transition of turbulent and laminar flow due to different fluid temperatures. Only the thermal conductance of the collector heat pipe UHP varies with the useful heat path Qgain, the inclination angle and the fluid temperature TFluid related on the collector (or the condenser temperature related on the heat pipe).
Especially the fluid temperature dependent heat transfer limitations of heat pipes are of interest. There are several physical effects, which limit the maximum heat transfer rate of heat pipes. The most relevant for heat pipes in solar collectors are the entrainment limitation and the dry-out limitation (e.g. [Faghri]). They are shown qualitatively in Figure 3. Due to heat transfer limitation at higher temperatures favourable stagnation temperature reduction of the collector may result and at lower temperatures critical performance reduction in the collector operation range is possible.
Figure 3: Qualitative heat transfer limitations of gravitational heat pipes
Dry-out limit
The dry-out limit will be reached at high operation temperatures. In this status the heat transfer is so high (or the filling ratio is so low) that all the working fluid of the heat pipe participates in the thermodynamic cycle and no fluid pool remains on the ground of the evaporator. With a further increase of the heat gain the heat pipe begins to dry-out and overheats from the bottom of the evaporator.
The stagnation temperature is reached if at the same time the heat loss flow of the collector is as high as the transferred heat of the heat pipe due to the high temperature level of the heat pipe. This is why it is possible to decrease the stagnation temperature of a collector with the dry-out limit [Mietkewitz].
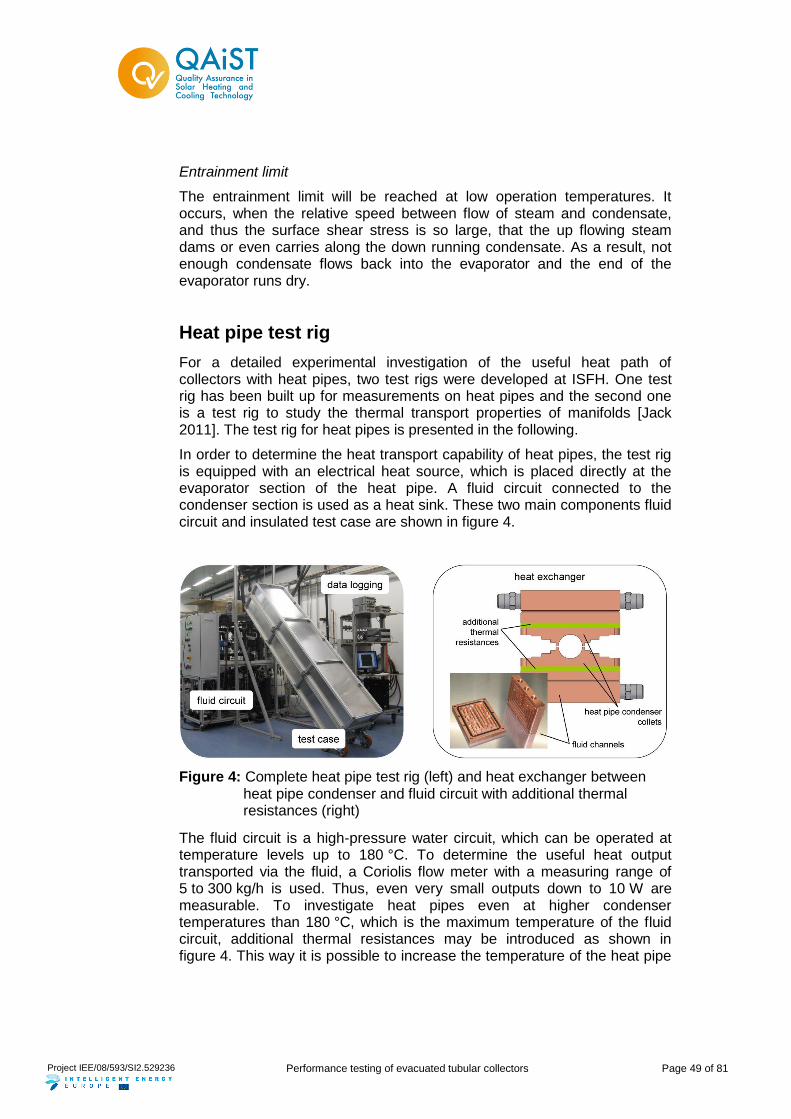
Project IEE/08/593/SI2.529236
Performance testing of evacuated tubular collectors Page 49 of 81
Entrainment limit
The entrainment limit will be reached at low operation temperatures. It occurs, when the relative speed between flow of steam and condensate, and thus the surface shear stress is so large, that the up flowing steam dams or even carries along the down running condensate. As a result, not enough condensate flows back into the evaporator and the end of the evaporator runs dry.
Heat pipe test rig
For a detailed experimental investigation of the useful heat path of collectors with heat pipes, two test rigs were developed at ISFH. One test rig has been built up for measurements on heat pipes and the second one is a test rig to study the thermal transport properties of manifolds [Jack 2011]. The test rig for heat pipes is presented in the following.
In order to determine the heat transport capability of heat pipes, the test rig is equipped with an electrical heat source, which is placed directly at the evaporator section of the heat pipe. A fluid circuit connected to the condenser section is used as a heat sink. These two main components fluid circuit and insulated test case are shown in figure 4.
Figure 4: Complete heat pipe test rig (left) and heat exchanger between heat pipe condenser and fluid circuit with additional thermal resistances (right)
The fluid circuit is a high-pressure water circuit, which can be operated at temperature levels up to 180 °C. To determine the useful heat output transported via the fluid, a Coriolis flow meter with a measuring range of 5 to 300 kg/h is used. Thus, even very small outputs down to 10 W are measurable. To investigate heat pipes even at higher condenser temperatures than 180 °C, which is the maximum temperature of the fluid circuit, additional thermal resistances may be introduced as shown in figure 4. This way it is possible to increase the temperature of the heat pipe

Project IEE/08/593/SI2.529236
Performance testing of evacuated tubular collectors Page 50 of 81
up to 400 °C [Schubert].
Heat pipe measurement
Using the test rig, the heat pipe’s thermal conductance [UHP] = W/K is determined as a function of the amount of transferred heat Qgain, the condenser temperature Tcond and the inclination angle. The inclination angle, condenser temperature Tcond and evaporator temperature Tevap are set as boundary conditions. The heat transfer is measured calorimetrically within the fluid circuit.
By increasing the temperature difference between evaporator and condenser ΔTHP the amount of transferred heat QGain increases. Thus, the heat transfer can be enlarged up to the heat transfer limitation of the heat pipe. Reaching a performance limit is typically characterized by the considerable increase in evaporator temperatures at the bottom of the heat pipe. For this reason, over the length of the evaporator several temperature sensors are distributed uniformly as shown in figure 5.
1: condenser section
2: transport section
thermocouples
Pt100-sensors
heat exchanger
fluid circuit
heat pipe el. heater
outer insulation inner insulation
evaporator section1 2
lossQcondloss,Q
gainQ
fluidQ
transQ
HPQ
1: condenser section
2: transport section
thermocouples
Pt100-sensors
1: condenser section
2: transport section
thermocouples
Pt100-sensors
heat exchanger
fluid circuit
heat pipe el. heater
outer insulation inner insulation
evaporator section1 2 evaporator section1 2
lossQcondloss,Q
gainQ
fluidQ
transQ
HPQ
Figure 5: Schematically displayed heat flows inside the test case and positions of temperature sensors
By means of experiments, the two relevant heat transfer limitations can be distinguished, because in contrast to hitting the dry-out limit the entrainment limit leads to stochastically pulsation of evaporator temperatures. This effect is clearly measurable and is based on the fact that the interaction between steam and condensate near the entrainment limit behaves unsteady. Time-varying flow conditions occur since the damming of the condensate cannot be maintained quasi-stationary, thus resulting in significant temperature fluctuations as shown exemplarily in figure 6.
Qel

Project IEE/08/593/SI2.529236
Performance testing of evacuated tubular collectors Page 51 of 81
100
150
200
250
300
350
400
0 10 20 30 40 50
Time in min
Eva
po
rato
r te
mp
era
ture
in
°C
increases of heat
pipe temperature
difference (and
therefore transferred
heat)
dry-out limit (T cond = 200°C)
entrainment limit (T cond = 100°C)
bottom of evaporator
20cm away from bottom
40cm away from bottom
φ = 45°
Figure 6: Time-dependent evaporator temperatures when hitting heat transfer limitations
Further rising of the evaporator temperature leads to extended drying of the evaporator and therefore to rising temperatures at the end of the evaporator (see right figure 7). Thus, the thermal conductance of the heat pipe is lowered, since the mean temperature difference between evaporator and condenser increases.

Project IEE/08/593/SI2.529236
Performance testing of evacuated tubular collectors Page 52 of 81
80
100
120
140
160
180
0 250 500 750 1000 1250 1500 1750 2000
heat pipe length in mm
Lo
ca
l te
mp
era
ture
in
°C
condenser sectionT cond = 80°C
φ = 45°transport section
evaporator section
x heat transfer limitation
o normal operation range
Figure 7: Increasing evaporator bottom temperatures due to dry out of evaporator
By varying the condenser temperature it is possible to determine the complete heat transfer limitations within the desired temperature range and thus the limit of the operating range of the heat pipe. Main influencing factor on the entrainment limit is the inner diameter of the heat pipe between evaporator and condenser (position of maximum vapor velocity, e.g. [Nguyen-Chi and Groll], [Bage]) and the main factors influencing the dry-out limit are the filling ratio and the type of working fluid (e.g. [Unk]).
With the presented experiments it was analysed if the untypical performance of the tested collector can be explained with the entrainment limit of the heat pipes. Figure 8 shows the entrainment limit and its beginning for the heat pipe of the tested collector. The beginning of entrainment is characterized by temperature fluctuations and a lowered thermal conductance UHP but the transferred heat still increases with higher temperature differences between evaporator and condenser. The entrainment limit is reached, if no additional heat can be transferred. Thus the thermal conductance UHP decreases on a very low level caused by the dry-out of the evaporator.

Project IEE/08/593/SI2.529236
Performance testing of evacuated tubular collectors Page 53 of 81
Figure 8: Determined entrainment limit of single heat pipe of the performance tested collector
In figure 8 the maximum heat transfer rates for 4 different condenser temperatures are displayed. Compared to other heat pipes the values are very low and indicate that the entrainment limit is responsible for the lowered collector performance at low temperatures. The construction and dimension of the heat pipe is identical to those of many other manufacturers, but such a low entrainment limit was never measured at comparable heat pipes. A possible explanation of these results is the existence of non-condensable gases in the heat pipe or the compound of the working fluid like water with a high fraction of antifreeze.
Description of collector performance with heat pipe limits
In order to compare the results of the heat pipe and the collector measurement a common scale basis must be found for the collector power curve. The entrainment limit depends on the condenser temperature and by means of a thermal conductance for the manifold the data can be referred on the fluid temperature. For the manifold construction of the tested collector a thermal conductance of 3.5 W/K was experimentally determined [Jack 2012]. Additionally it will be considered that the collector consists of 30 heat pipes in series. Therefore the corresponding fluid temperatures of the single heat pipes are differing between collector inlet and outlet

Project IEE/08/593/SI2.529236
Performance testing of evacuated tubular collectors Page 54 of 81
temperature. As a consequence in figure 9 the entrainment limit and the beginning of the entrainment were displaced against each other about 3 Kelvin.
0
500
1000
1500
2000
2500
3000
-10 0 10 20 30 40 50 60 70 80
tm-ta in K
po
we
r o
utp
ut
pe
r c
oll
ec
tor
un
it i
n W
tm in °C for ta = 20°C
30 4020
beginning of entrainment
entrainment limit
10
data of collector measurement
data of entrainment limit
data of entrainment beginning
3000
2000
2500
1000
1500
500
0
Figure 9: Power curve related on 1000 W/m² similar to EN 12975 with heat transfer limits for a ambient air temperature of 20°C and measurement points of the collector and the heat pipe performance test
In figure 9 the collector power curve according to EN 12975 and the measurement points beyond the transition zone of the entrainment limit are related on the irradiance level of 1000 W/m² and plotted over the temperature difference between mean fluid temperature tm and ambient air temperature ta. This dependence is not valid if the collector operates under conditions where the beginning of entrainment affects the collector performance. The entrainment limit is related exclusively on the fluid temperature. The measurement points of the collector performance inside the transition zone of entrainment limit must not be extrapolated to 1000 W/m² because of the limitation effect of the heat pipes.
Figure 9 shows that the transition zone of the beginning of entrainment and the entrainment limit correspond to the decreasing collector performance near the conversion factor. It demonstrates that in particular cases the performance of collectors with heat pipes can be partially limited by the entrainment limit of the heat pipes.
Literature
[Bage] Bage, B.K.: A review of entrainment limits in thermosyphons and heat pipes. Porous media, mixtures, and multiphase heat transfer: Papers, ASME, New York 1989

Project IEE/08/593/SI2.529236
Performance testing of evacuated tubular collectors Page 55 of 81
[EN 12975] DIN EN 12975-2. (2006). Thermische Solaranlagen und ihre Bauteile – Kollektoren – Teil 2: Prüfverfahren. CEN Europäisches Institut für Normung
[Faghri] Faghri, Amir: Heat pipe science and technology, Taylor & Francis, Washington, DC, 1995
[Jack 2011] Jack, S., Katenbrink, N., Schubert, F.: Evaluation Methods for Heat Pipes in Solar Thermal Collectors – Test Equipment and First Results. in: Proceedings of ISES SWC 2011, Kassel, 2011
[Jack 2012] Jack, S., Katenbrink, N., Schienbein, M., Lampe, C., Rockendorf, G.: Wärmetransporteigenschaften von Sammlern aus Vakuumröhren-kollektoren mit Wärmerohren Tagungsband 22. Symposium Thermische Solarenergie 2012, Staffelstein, 2012
[Nguyen-Chi and Groll] Nguyen-Chi, H., Groll M.: Entrainment or flooding limit in a closed two-phase thermosyphon. Journal of Heat Recovery Systems 1, Nr. 4, 275-286, 1981
[Mienkewitz] Mientkewitz, G.: Möglichkeiten eines Heatpipe-Kollektors ohne Stagnationsprobleme. in: Tagungsband 20. Symposium Thermische Solarenergie 2010, Staffelstein, 2010
[Schubert] Schubert, Felix: Aufbau, Inbetriebnahme und Überprüfung eines Prüfstands zur Bestimmung der Wärmetransporteigenschaften von Wärmerohren für solarthermische Kollektoren, bachelor thesis at TU Bergakademie Freiberg, Emmerthal, 2011
[Unk] Unk, J.: Ein Beitrag zur Theorie des geschlossenen Zweiphasen-Thermosiphons, dissertation at TU Berlin, Berlin, 1988
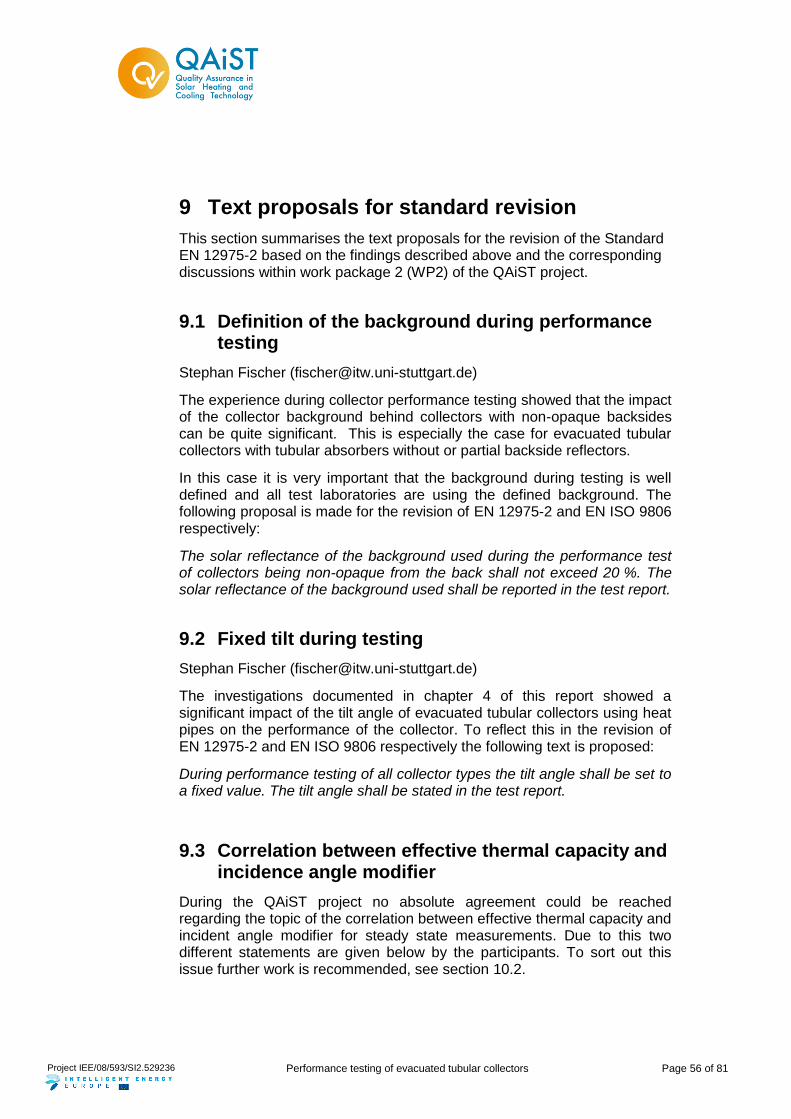
Project IEE/08/593/SI2.529236
Performance testing of evacuated tubular collectors Page 56 of 81
9 Text proposals for standard revision
This section summarises the text proposals for the revision of the Standard EN 12975-2 based on the findings described above and the corresponding discussions within work package 2 (WP2) of the QAiST project.
9.1 Definition of the background during performance testing
Stephan Fischer ([email protected])
The experience during collector performance testing showed that the impact of the collector background behind collectors with non-opaque backsides can be quite significant. This is especially the case for evacuated tubular collectors with tubular absorbers without or partial backside reflectors.
In this case it is very important that the background during testing is well defined and all test laboratories are using the defined background. The following proposal is made for the revision of EN 12975-2 and EN ISO 9806 respectively:
The solar reflectance of the background used during the performance test of collectors being non-opaque from the back shall not exceed 20 %. The solar reflectance of the background used shall be reported in the test report.
9.2 Fixed tilt during testing
Stephan Fischer ([email protected])
The investigations documented in chapter 4 of this report showed a significant impact of the tilt angle of evacuated tubular collectors using heat pipes on the performance of the collector. To reflect this in the revision of EN 12975-2 and EN ISO 9806 respectively the following text is proposed:
During performance testing of all collector types the tilt angle shall be set to a fixed value. The tilt angle shall be stated in the test report.
9.3 Correlation between effective thermal capacity and incidence angle modifier
During the QAiST project no absolute agreement could be reached regarding the topic of the correlation between effective thermal capacity and incident angle modifier for steady state measurements. Due to this two different statements are given below by the participants. To sort out this issue further work is recommended, see section 10.2.

Project IEE/08/593/SI2.529236
Performance testing of evacuated tubular collectors Page 57 of 81
Ulrich Fritzsche ([email protected])
For collectors with high effective capacity values (e.g. all glass heat pipe collectors), the steady state method while using a fixed collector orientation and measurement points before and after solar noon could result in high uncertainties for detection of the incidence angle modifier. For that kind of collectors it will be recommended to use either the quasi-dynamic test method or a sun tracker which is able to run with fixed incidence angles during midday (period with the lowest fluctuation of irradiation).
The high thermal capacities and the resulting long time constant shall be taken into consideration for determination of the required conditioning and measuring phase during steady state thermal performance testing. The general time of 10 or 15 minutes is not adequate for these collectors with high effective thermal capacities.
Maria João Carvalho ([email protected])
According to the investigations made by LNEG, TUV and ISE, collectors with high thermal capacity are the cause of problems in the evaluation of IAM (see chapter 3 and Annex 1).
To reflect this in the revision of EN 12975-2 and EN ISO 9806 respectively the following text is proposed in the case of QDT:
6.4.4.6.2 Description of test sequences 1
st paragraph:
… It shall also include data roughly symmetrical to the solar noon to prevent biased results.
In the case of SST an additional section 6.1.7.3.4 can be added where proposal included in Annex 1 as Method 2 is described and named Method 3.
6.1.7.3.4 Method 3
Collector facing south, tilt angle tracked to keep the incidence angle in the transversal plane
Continuous measurement over the daytime and plotting against theta (East- and West)
Graphical determination of average between East and West (Average)

Project IEE/08/593/SI2.529236
Performance testing of evacuated tubular collectors Page 58 of 81
9.4 Post exposure performance test for heat pipe collectors
Ulrich Fritzsche ([email protected])
If there are collectors available showing a massive degradation effect within first days of operation, a post exposure thermal performance test will be recommended to achieve a sufficient and reproducible result. Evaluation within the past years had shown that especially for heat pipe collectors this problem occurred in a non-negligible quantity. Thermal performance tests for collectors using heat pipes shall always be done as “post exposure performance tests”.
9.5 Quasi-dynamic test parameter calculation out of steady state test results
In chapter 6 it is explained why the QDT method gives a more accurate determination of the energy performance compared to Steady state testing for some collector types, including ETCs and concentrating collectors. In order to improve the accuracy in Steady state results thus making the two methods better harmonized a conversion of steady state results are proposed. I.e. instead of converting QDT parameters to a reference steady state case as in the present EN 12975 standard, steady state parameters should be used to calculate some “missing” QDT parameters. Details of this conversion are explained in section 6.2 and the corresponding equations are implemented in the Scenocalc tool which was developed within the QAiST project and now forms part of the Solar Keymark scheme rules. This set of equations are proposed to be included in an annex of the revised standard.
As part of the issue of harmonization between the two methods, also the following designation of the zero loss coefficients becomes relevant. When
determining the IAM using the QDT method, the term 0 in the steady state
equation is replaced by F’()en, indicating that it is the optical efficiency for
direct irradiance only. However, as shown in 6.2, the 0 derived from a
steady state test is biased by diffuse irradiance and therefore cannot be
assumed equal to F’()en. A more relevant designation of these two
parameters reflecting this fact,0 en (resulting from a steady state test) and
0 b, en (resulting from QDT), should therefore be integrated in the current
revision of the EN standard.

Project IEE/08/593/SI2.529236
Performance testing of evacuated tubular collectors Page 59 of 81
9.6 Use of heat transfer paste
Carsten Lampe ([email protected])
The general description of the collector in test reports (as in EN 12975-2:2006 normative Annex D) should include the question for heat transfer paste at collectors and in case of use the characteristic of the paste. The following extension of the listing in Annex D.2 Solar collector description is proposed:
“…
Heat transfer medium: water / oil / other
Specifications (additives etc.):
Alternative acceptable heat transfer fluids:”
New:
Heat transfer paste:
Thermal conductivity:
(Temperature) limitations:
Alternative acceptable heat transfer fluids:
9.7 Performance dependency on ambient, mean fluid temperature or irradiance
Stephan Fischer ([email protected])
In cases of performance dependency on ambient and/or mean fluid temperature the current standard EN 12975, section 6.1.4.8.4.1 General allows with the last sentence “Where necessary, tables of measurements of the collector performance are admitted” applies. However the following sentence need to be added to make sure that no extrapolation of the results is allowed.
In case tables of measurements are used the results may not be extrapolated to other values of ambient temperature, mean fluid temperatures and irradiations.
Carsten Lampe ([email protected])
In section 8 is shown that the performance of collectors with heat pipes can be partially limited by the entrainment limit of the heat pipes for lower fluid temperatures. To ensure for relevant temperatures in practice that this effect will be detected by the standard test the following text is proposed for the revision of EN 12975:

Project IEE/08/593/SI2.529236
Performance testing of evacuated tubular collectors Page 60 of 81
For collectors with heat pipes the determination of the conversion factor shall include measurements with collector fluid inlet temperatures (tin) of 15°C or lower to detect if the entrainment limit of the heat pipes effects the performance of the test collector. If the conversion factor varies for different fluid temperature it has to be stated in the test report.

Project IEE/08/593/SI2.529236
Performance testing of evacuated tubular collectors Page 61 of 81
10 Proposals for future work
During the work related to performance testing of evacuated tubular collectors well known and new issues came up which are relevant for solar thermal industry as well as for the users of solar thermal collectors.
This section lists and describes the most relevant issues to pave the way to future work items.
10.1 Tilt dependency of heat pipe collectors
Stephan Fischer ([email protected])
Since the tilt dependency of heat pipe collectors is still an open issue it is recommended that future work is carried out on this topic to gain more experience and to come up with a reliable procedure how to determine the tilt dependency in a reliable and cost effective way which can be included in future parts of EN 12975-3.
10.2 Correlation between effective thermal capacity and incidence angle modifier
Stephan Fischer ([email protected])
The correlation between effective thermal capacity and incidence angle modifier has been investigated and discussed with in section 3. However, as pointed out in section 9.3 no absolute consensus was found within the QAiST consortium.
In order to finally sort out this issue it is recommended to perform further work on this topic.
10.3 Limiting effects for heat pipes
Stephan Fischer ([email protected])
In case the condensed fluid within a heat pipe is evaporated again completely before it reaches the bottom of the heat pipe it is called a dry out. Since the dry out reduces the effective absorber area, depending on fluid and absorber area it has an impact on the performance of the heat pipe collector.
In order to quantify and model the dry out effects extensive measurements need to be carried out in the future.
Carsten Lampe ([email protected])

Project IEE/08/593/SI2.529236
Performance testing of evacuated tubular collectors Page 62 of 81
The determination of the heat pipe limits (entrainment limit and dry-out limit) as well as the determination of the thermal conductance of a manifold inclusive heat transfer paste are important characteristics of a heat pipe collector and can have a significant influence on the collector performance. Thus the test procedure and the boundary conditions for the test facility should be included at least as an informative part in the future work for the EN 12975-3.
10.4 Performance dependency on ambient temperature, mean fluid temperature or irradiation
Stephan Fischer ([email protected])
Performance dependencies on ambient temperature mean fluid temperature or irradiation as shown in e.g. chapter 8 of this report or resulting from the behaviour of thermotropic layers on absorbers and glazing can be treated within the standard. However up to now no extrapolation of the results to other values of ambient temperature, mean fluid temperature or irradiations than used during the measurements is possible.
In order to pave the way for new developments and products it is necessary to develop models and procedures to enable the extrapolation of the gained results to all possible conditions. Without this additional work no simulation of the collector performance on a daily or yearly basis will be possible for these products.
10.5 Test procedure for heat transfer paste
Stephan Fischer ([email protected])
To account for the importance of the heat transfer paste as described in chapter 6 of this report a test procedure should be developed and included into EN 12975-3 dealing with collector components.

Project IEE/08/593/SI2.529236
Performance testing of evacuated tubular collectors Page 63 of 81
Annex 1: Incidence angle modifier measurements on evacuated tubular collectors
Korbinian Kramer ([email protected])
Description
Chapter 6.1.7.3.3 of EN12975 describes a method for IAM-measurement on a stationary test rack, which can only be adjusted by tilt. Such an installation leads to a continuously changing angle of incidence which can be kept in the transversal plane, by adjusting the tilt angle.
The standard demands, that for each angle of incidence one efficiency value shall be identified before solar noon and one after. The efficiency value for a specific angle of incidence equals the average of the two values.
Paragraph 3 of chapter 6.1.7.3.3 demands that as according to Method 1 values shall be determined for an angle of incidence of 50° or – for collectors with unusual optical performance – for angles of 20°, 40°, 60° or other necessary angles. On a stationary test rack, the angle of incidence can obviously not be influenced and will reach the demanded values only in two specific moments over the daytime.
IAM- Measurement of ETC and comparison of Method 1 and 2
According to Chapter 6.1.7.3.2 – Method 1 collectors with unusual optical characteristics such as ETC have to be measured under angles of incidence of 20°, 40°, 60° or other necessary angles. It is not demanded that these values be measured before and after solar noon and averaged.
Especially when measuring heat pipe collectors with minimum tilt angles, high angles of incidence can often only be realized early in the morning and in the late afternoon. Due to the big slope in the irradiance level at these daytimes and the high thermal capacitance of this kind of collectors, the values for a specific angle of incidence after and before solar noon significantly diverge.
For the comparison of the two methods two ETC were measured as follows:
Method 1:
For each incidence angle (30°, 45° and 60°) 4 data points were recorded (named “East-M1” and “West-M1” in the graphs)
For each angle of incidence (30°, 45° and 60°) the measured IAM before and after solar noon were averaged (named “Average-M1” in the graphs)

Project IEE/08/593/SI2.529236
Performance testing of evacuated tubular collectors Page 64 of 81

Project IEE/08/593/SI2.529236
Performance testing of evacuated tubular collectors Page 65 of 81
Method 2:
Collector facing south, tilt angle tracked to keep the incidence angle in the transversal plane
Continuous measurement over the daytime and plotting against theta (East- and West-M2)
Graphical determination of average between East and West (Average-M2)
Fig. 1: IAM-measurement of two different ETC and comparison of Method 1 and 2 of EN12975 / ISO 9806

Project IEE/08/593/SI2.529236
Performance testing of evacuated tubular collectors Page 66 of 81
Conclusion
The comparison shows a good accord of method 1 with 2, referring to the values “Average-M1” and “Average-M2”. Method 2 is very well suited for the measurement of ETC.
The difference between the values East-M1 and West-M1 shows, that also when using method 1, it is advisable to determine average values from data points before and after solar noon. Also it is necessary to record not only one but a number of measurement values per incidence angle and again average these (4 data points in the shown measurement).
These requirements lead to a huge time effort for measuring an IAM at three different angles. Temporary violations of the normative conditions for steady-state measurements can lead to a fast increase of the required time, while, when using method 2, only the gaps between the values increase. If the weather is not too dynamic, interpolation is still possible. In our experience method 2 is often faster and less effort than method 1.
Paragraph 3 in chapter 6.1.7.3.3 does not make sense and should be substituted by the demand for a continuous measurement over one day’s time including angles between 20° and at least 55°.

Project IEE/08/593/SI2.529236
Performance testing of evacuated tubular collectors Page 67 of 81
Annex 2: Effects of long term exposure on performance of ETC with heat-pipe

Project IEE/08/593/SI2.529236
Performance testing of evacuated tubular collectors Page 68 of 81

Project IEE/08/593/SI2.529236
Performance testing of evacuated tubular collectors Page 69 of 81

Project IEE/08/593/SI2.529236
Performance testing of evacuated tubular collectors Page 70 of 81
Annex 3: First summary on comparative test on heat-pipe-driven Evacuated Tubular Collectors

Project IEE/08/593/SI2.529236
Performance testing of evacuated tubular collectors Page 71 of 81

Project IEE/08/593/SI2.529236
Performance testing of evacuated tubular collectors Page 72 of 81

Project IEE/08/593/SI2.529236
Performance testing of evacuated tubular collectors Page 73 of 81

Project IEE/08/593/SI2.529236
Performance testing of evacuated tubular collectors Page 74 of 81
Annex 4: 1 year exposure - comparative tests on heat-pipe and direct flow ETCs after 1 year of dry exposure

Project IEE/08/593/SI2.529236
Performance testing of evacuated tubular collectors Page 75 of 81

Project IEE/08/593/SI2.529236
Performance testing of evacuated tubular collectors Page 76 of 81
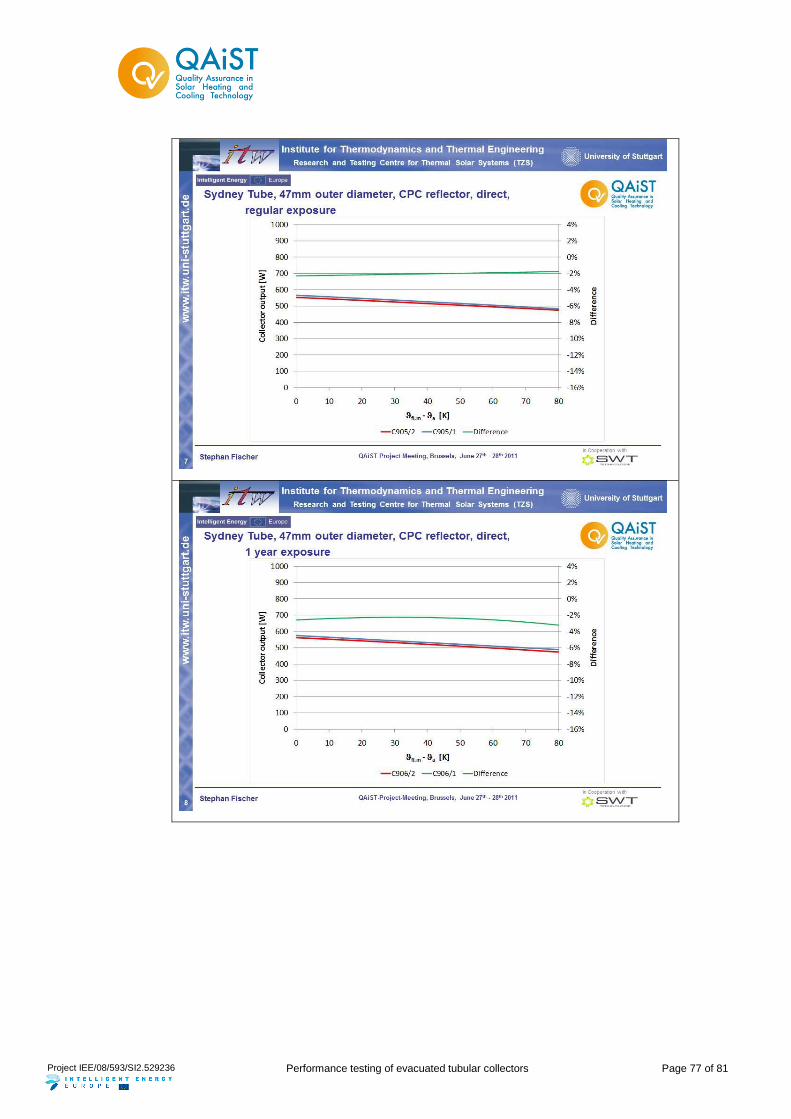
Project IEE/08/593/SI2.529236
Performance testing of evacuated tubular collectors Page 77 of 81

Project IEE/08/593/SI2.529236
Performance testing of evacuated tubular collectors Page 78 of 81

Project IEE/08/593/SI2.529236
Performance testing of evacuated tubular collectors Page 79 of 81
Annex 5: Start temperature of heat pipes within complete collectors
Ulrich Fritzsche ([email protected])
Description
Several papers had described the starting temperature of single heat pipes, which is easily to detect while putting the heat pipes into a water basing and raise the temperature slowly until the evaporation starts and the heat is reaching the condenser.
For complete mounted collectors or even heat pipes within an evacuated tube, the procedure which needs to be taken into account is much more complicated. The best way would be to perform the tests indoor under a solar simulator, but most simulators are not able to reach the needed low irradiation level between 50 and 200 W/m².
Because of that, TÜV had evaluated several outdoor performance tests used the quasi-dynamic approach with slowly rising irradiation level in the early morning and evening.
Determination of heat pipe start temperature by
evaluating quasi-dynamic test days
For evaluation of the starting temperature, several quasi-dynamic test days with low collector inlet temperatures (eta0days) were used. Because of the high thermal capacity of these collectors, some additional definitions were made.
- the global irradiation is rising nearly linear during the first hours after sunrise
- a linear rising of the outlet temperature “parallel” to the rising global irradiation is an indicator for a started heat pipe
- Because of the high effective heat capacity, the real starting point will be before starting of parallel rising of outlet temperature
- A time of approximately two times the time constant was taken into account
- The actual global irradiation at that time is a conservative evaluated value for the starting temperature of the heat pipes
Beside the global irradiation, also the ambient temperature needs to be taken into account. As we are mainly talking about evacuated tube collectors, the influence should be low. The same will be expected for the influence of the fluid temperature on the heat pipe copper temperature.

Project IEE/08/593/SI2.529236
Performance testing of evacuated tubular collectors Page 80 of 81
Figure 1 is showing the evaluation result for an all glass evacuated tube collector using heat pipes, an inlet temperature of ca. 27°C, an ambient temperature of 17 to 31 °C and a nearly linear rising of the global irradiation from 50 to 800 W/m².
Figure 1: Determination of starting temperature for one 30 tube heat pipe collector
Because of the special incidence angle modifier for these all around absorber, there’s no linear raising of outlet temperature respectively output power during the complete phase with linear increasing of global irradiation.
To show, that the starting temperature is not a problem for the testing labs and the used procedures for determine of collector characteristics the defined evaluation procedure is adequate.

Project IEE/08/593/SI2.529236
Performance testing of evacuated tubular collectors Page 81 of 81
Figure 2: Determination of starting temperature for one 10 tube heat pipe collector
Depending on the detected point for linear output temperature rising, the detected start temperature will be reached at 84 to 106 W/m².
As this is not the method with the highest accuracy, this deviation is neglect able.
Conclusion
The evaluation had shown that an irradiation level around 100 W/m² is high enough to start the heat pipe process. Usually, even the quasi-dynamic test procedure won’t be evaluated at lower irradiation levels. There’s no need to adapt any performance test procedure.
For a more precise detection of the starting temperature of heat pipes integrated into a complete collector, indoor tests under a solar simulator suitable for low irradiance measurement and smooth variation of these low levels need to be performed.