performance_tunning
TRANSCRIPT

8/7/2019 Performance_Tunning
http://slidepdf.com/reader/full/performancetunning 1/190
Oracle® Database
2 Day + Performance Tuning Guide
11g Release 1 (11.1)
B28275-02
August 2008

8/7/2019 Performance_Tunning
http://slidepdf.com/reader/full/performancetunning 2/190
Oracle Database 2 Day + Performance Tuning Guide, 11g Release 1 (11.1)
B28275-02
Copyright © 2007, 2008, Oracle. All rights reserved.
Primary Authors: Immanuel Chan, Lance Ashdown
Contributing Author: Sushil Kumar
Contributors: Pete Belknap, Supiti Buranawatanachoke, Nancy Chen, Kakali Das, Karl Dias, Mike Feng,Yong Feng, Cecilia Grant, Connie Green, William Hodak, Andrew Holdsworth, Sue K. Lee, Herve Lejeune,Colin McGregor, Mughees Minhas, Valarie Moore, Deborah Owens, Mark Ramacher, Uri Shaft, SusanShepard, Janet Stern, Hsiao-Te Su, Minde Sun, Mark Townsend, Stephen Wexler, Graham Wood, KhaledYagoub, Michael Zampiceni
The Programs (which include both the software and documentation) contain proprietary information; theyare provided under a license agreement containing restrictions on use and disclosure and are also protectedby copyright, patent, and other intellectual and industrial property laws. Reverse engineering, disassembly,or decompilation of the Programs, except to the extent required to obtain interoperability with otherindependently created software or as specified by law, is prohibited.
The information contained in this document is subject to change without notice. If you find any problems inthe documentation, please report them to us in writing. This document is not warranted to be error-free.Except as may be expressly permitted in your license agreement for these Programs, no part of thesePrograms may be reproduced or transmitted in any form or by any means, electronic or mechanical, for anypurpose.
If the Programs are delivered to the United States Government or anyone licensing or using the Programs onbehalf of the United States Government, the following notice is applicable:
U.S. GOVERNMENT RIGHTS Programs, software, databases, and related documentation and technical datadelivered to U.S. Government customers are "commercial computer software" or "commercial technical data"pursuant to the applicable Federal Acquisition Regulation and agency-specific supplemental regulations. Assuch, use, duplication, disclosure, modification, and adaptation of the Programs, including documentationand technical data, shall be subject to the licensing restrictions set forth in the applicable Oracle licenseagreement, and, to the extent applicable, the additional rights set forth in FAR 52.227-19, CommercialComputer Software--Restricted Rights (June 1987). Oracle USA, Inc., 500 Oracle Parkway, Redwood City, CA94065.
The Programs are not intended for use in any nuclear, aviation, mass transit, medical, or other inherentlydangerous applications. It shall be the licensee's responsibility to take all appropriate fail-safe, backup,redundancy and other measures to ensure the safe use of such applications if the Programs are used for suchpurposes, and we disclaim liability for any damages caused by such use of the Programs.
Oracle, JD Edwards, PeopleSoft, and Siebel are registered trademarks of Oracle Corporation and/or itsaffiliates. Other names may be trademarks of their respective owners.
The Programs may provide links to Web sites and access to content, products, and services from thirdparties. Oracle is not responsible for the availability of, or any content provided on, third-party Web sites.You bear all risks associated with the use of such content. If you choose to purchase any products or servicesfrom a third party, the relationship is directly between you and the third party. Oracle is not responsible for:(a) the quality of third-party products or services; or (b) fulfilling any of the terms of the agreement with thethird party, including delivery of products or services and warranty obligations related to purchasedproducts or services. Oracle is not responsible for any loss or damage of any sort that you may incur fromdealing with any third party.

8/7/2019 Performance_Tunning
http://slidepdf.com/reader/full/performancetunning 3/190
iii
Contents
Preface ................................................................................................................................................................. ix
Audience....................................................................................................................................................... ix
Documentation Accessibility..................................................................................................................... ix
Related Documents ..................................................................................................................................... x
Conventions ................................................................................................................................................. x
What's New in Oracle Performance? ................................................................................................ xi
Part I Getting Started
1 Introduction
About This Guide..................................................................................................................................... 1-1
Common Oracle DBA Tasks .................................................................................................................. 1-1
Tools for Tuning the Database .............................................................................................................. 1-2
2 Oracle Database Performance Method
Gathering Database Statistics Using the Automatic Workload Repository................................. 2-1
Time Model Statistics......................................................................................................................... 2-2
Wait Event Statistics .......................................................................................................................... 2-3
Session and System Statistics............................................................................................................ 2-4
Active Session History Statistics ...................................................................................................... 2-4
High-Load SQL Statistics .................................................................................................................. 2-4
Using the Oracle Performance Method ................................................................................................ 2-5
Preparing the Database for Tuning ................................................................................................. 2-5
Tuning the Database Proactively..................................................................................................... 2-6
Tuning the Database Reactively....................................................................................................... 2-6
Tuning SQL Statements..................................................................................................................... 2-7Common Performance Problems Found in Oracle Databases ........................................................ 2-8
Part II Proactive Database Tuning
3 Automatic Database Performance Monitoring
Overview of Automatic Database Diagnostic Monitor .................................................................... 3-1
ADDM Analysis ................................................................................................................................. 3-2

8/7/2019 Performance_Tunning
http://slidepdf.com/reader/full/performancetunning 4/190
iv
ADDM Recommendations................................................................................................................ 3-2
ADDM for Oracle Real Application Clusters................................................................................. 3-3
Configuring Automatic Database Diagnostic Monitor .................................................................... 3-3
Setting Initialization Parameters to Enable ADDM...................................................................... 3-3
Setting the DBIO_EXPECTED Parameter....................................................................................... 3-4
Managing AWR Snapshots............................................................................................................... 3-4
Creating Snapshots ..................................................................................................................... 3-5Modifying Snapshot Settings .................................................................................................... 3-5
Reviewing the Automatic Database Diagnostic Monitor Analysis ............................................... 3-7
Interpretation of Automatic Database Diagnostic Monitor Findings ........................................... 3-8
Implementing Automatic Database Diagnostic Monitor Recommendations.............................. 3-9
Viewing Snapshot Statistics................................................................................................................ 3-12
4 Monitoring Real-Time Database Performance
Monitoring User Activity........................................................................................................................ 4-2
Monitoring Top SQL.......................................................................................................................... 4-4
Monitoring Top Sessions................................................................................................................... 4-5
Monitoring Top Services................................................................................................................... 4-6
Monitoring Top Modules.................................................................................................................. 4-7
Monitoring Top Actions.................................................................................................................... 4-7
Monitoring Top Clients..................................................................................................................... 4-8
Monitoring Top PL/SQL .................................................................................................................. 4-9
Monitoring Top Files ......................................................................................................................... 4-9
Monitoring Top Objects ................................................................................................................. 4-10
Monitoring Instance Activity.............................................................................................................. 4-10
Monitoring Throughput................................................................................................................. 4-11
Monitoring I/O................................................................................................................................ 4-12
Monitoring I/O by Function .................................................................................................. 4-13Monitoring I/O by Type......................................................................................................... 4-14
Monitoring I/O by Consumer Group................................................................................... 4-15
Monitoring Parallel Execution ...................................................................................................... 4-16
Monitoring Services........................................................................................................................ 4-16
Monitoring Host Activity .................................................................................................................... 4-17
Monitoring CPU Utilization .......................................................................................................... 4-19
Monitoring Memory Utilization ................................................................................................... 4-22
Monitoring Disk I/O Utilization .................................................................................................. 4-25
Customizing the Database Performance Page ................................................................................. 4-27
5 Monitoring Performance AlertsSetting Metric Thresholds for Performance Alerts............................................................................ 5-1
Responding to Alerts ............................................................................................................................... 5-2
Clearing Alerts .......................................................................................................................................... 5-2
Part III Reactive Database Tuning

8/7/2019 Performance_Tunning
http://slidepdf.com/reader/full/performancetunning 5/190
v
6 Manual Database Performance Monitoring
Manually Running ADDM to Analyze Current Database Performance ...................................... 6-1
Manually Running ADDM to Analyze Historical Database Performance .................................. 6-3
Accessing Previous ADDM Results ..................................................................................................... 6-4
7 Resolving Transient Performance Problems
Overview of Active Session History..................................................................................................... 7-1
Running Active Session History Reports ............................................................................................ 7-2
Active Session History Reports ............................................................................................................. 7-3
Top Events........................................................................................................................................... 7-3
Top User Events .......................................................................................................................... 7-4
Top Background Events............................................................................................................. 7-4
Load Profile......................................................................................................................................... 7-4
Top SQL............................................................................................................................................... 7-5
Top Sessions........................................................................................................................................ 7-5
Top DB Objects ................................................................................................................................... 7-6
Top DB Files........................................................................................................................................ 7-6Activity Over Time ............................................................................................................................ 7-7
8 Resolving Performance Degradation Over Time
Managing Baselines ................................................................................................................................. 8-1
Creating a Baseline............................................................................................................................. 8-2
Creating a Single Baseline.......................................................................................................... 8-2
Creating a Repeating Baseline................................................................................................... 8-4
Deleting a Baseline............................................................................................................................. 8-5
Computing Threshold Statistics for Baselines ............................................................................... 8-6
Setting Metric Thresholds for Baselines.......................................................................................... 8-7
Setting Metric Thresholds for the Default Moving Baseline ................................................ 8-7
Setting Metric Thresholds for Selected Baselines................................................................... 8-8
Running the AWR Compare Periods Reports .................................................................................... 8-9
Comparing a Baseline to Another Baseline or Pair of Snapshots ............................................ 8-10
Comparing Two Pairs of Snapshots............................................................................................. 8-12
Using the AWR Compare Periods Reports....................................................................................... 8-15
Summary of the AWR Compare Periods Report........................................................................ 8-16
Snapshot Sets ............................................................................................................................ 8-16
Host Configuration Comparison........................................................................................... 8-17
System Configuration Comparison....................................................................................... 8-17
Load Profile...............................................................................................................................8-17
Top Timed Events.................................................................................................................... 8-17
Details of the AWR Compare Periods Report............................................................................. 8-18
Supplemental Information in the AWR Compare Periods Report .......................................... 8-18
Part IV SQL Tuning

8/7/2019 Performance_Tunning
http://slidepdf.com/reader/full/performancetunning 6/190
vi
9 Identifying High-Load SQL Statements
Identification of High-Load SQL Statements Using ADDM Findings ......................................... 9-1
Identifying High-Load SQL Statements Using Top SQL ................................................................ 9-2
Viewing SQL Statements by Wait Class ......................................................................................... 9-3
Viewing Details of SQL Statements................................................................................................. 9-4
Viewing SQL Statistics ............................................................................................................... 9-5
Viewing Session Activity ........................................................................................................... 9-6
Viewing the SQL Execution Plan.............................................................................................. 9-7
Viewing the SQL Tuning Information..................................................................................... 9-8
10 Tuning SQL Statements
Tuning SQL Statements Using SQL Tuning Advisor.................................................................... 10-2
Tuning SQL Manually Using SQL Tuning Advisor .................................................................. 10-2
Viewing Automatic SQL Tuning Results .................................................................................... 10-5
Managing SQL Tuning Sets ................................................................................................................ 10-8
Creating a SQL Tuning Set ............................................................................................................ 10-8
Creating a SQL Tuning Set: Options..................................................................................... 10-9Creating a SQL Tuning Set: Load Method ......................................................................... 10-10
Creating a SQL Tuning Set: Filter Options......................................................................... 10-13
Creating a SQL Tuning Set: Schedule ................................................................................. 10-15
Dropping a SQL Tuning Set ........................................................................................................ 10-16
Transporting SQL Tuning Sets.................................................................................................... 10-16
Exporting a SQL Tuning Set................................................................................................. 10-16
Importing a SQL Tuning Set ................................................................................................ 10-18
Managing SQL Profiles ...................................................................................................................... 10-19
Managing SQL Execution Plans ....................................................................................................... 10-20
11 Optimizing Data Access Paths
Running SQL Access Advisor............................................................................................................. 11-1
Running SQL Access Advisor: Initial Options ........................................................................... 11-2
Running SQL Access Advisor: Workload Source ...................................................................... 11-3
Using SQL Statements from the Cache................................................................................. 11-3
Using an Existing SQL Tuning Set ........................................................................................ 11-4
Using a Hypothetical Workload............................................................................................ 11-4
Running SQL Access Advisor: Filter Options............................................................................. 11-5
Defining Filters for Resource Consumption ........................................................................ 11-5
Defining Filters for Users........................................................................................................ 11-6
Defining Filters for Tables ......................................................................................................11-6
Defining Filters for SQL Text ................................................................................................. 11-6
Defining Filters for Modules .................................................................................................. 11-7
Defining Filters for Actions .................................................................................................... 11-7
Running SQL Access Advisor: Recommendation Options....................................................... 11-7
Running SQL Access Advisor: Schedule..................................................................................... 11-9
Reviewing the SQL Access Advisor Recommendations ............................................................. 11-13
Reviewing the SQL Access Advisor Recommendations: Summary...................................... 11-14
Reviewing the SQL Access Advisor Recommendations: Recommendations...................... 11-15

8/7/2019 Performance_Tunning
http://slidepdf.com/reader/full/performancetunning 7/190
vii
Reviewing the SQL Access Advisor Recommendations: SQL Statements........................... 11-18
Reviewing the SQL Access Advisor Recommendations: Details........................................... 11-19
Implementing the SQL Access Advisor Recommendations....................................................... 11-20
12 Analyzing SQL Performance Impact
SQL Performance Analyzer Usage..................................................................................................... 12-1
SQL Performance Analyzer Methodology ....................................................................................... 12-2
Capturing and Transporting a SQL Workload........................................................................... 12-3
Setting Up the Database Environment on the Test System ...................................................... 12-4
Executing a SQL Workload............................................................................................................ 12-4
Running SQL Performance Analyzer................................................................................................ 12-5
Testing an Initialization Parameter Change with SQL Performance Analyzer ..................... 12-6
Following a Guided Workflow with SQL Performance Analyzer........................................... 12-9
Creating a SQL Performance Analyzer Task Based on a SQL Tuning Set .................... 12-10
Establishing the Initial Environment .................................................................................. 12-11
Collecting SQL Performance Data Before the Change ..................................................... 12-12
Making the System Change.................................................................................................. 12-13
Collecting SQL Performance Data After the Change ....................................................... 12-14
Comparing SQL Performance Before and After the Change .......................................... 12-15
Reviewing the SQL Performance Analyzer Report ...................................................................... 12-17
Reviewing the SQL Performance Analyzer Report: General Information ........................... 12-17
Reviewing the SQL Performance Analyzer Report: Global Statistics ................................... 12-18
Reviewing the SQL Performance Analyzer Report: Global Statistics Details...................... 12-19
Index

8/7/2019 Performance_Tunning
http://slidepdf.com/reader/full/performancetunning 8/190
viii

8/7/2019 Performance_Tunning
http://slidepdf.com/reader/full/performancetunning 9/190
ix
Preface
This preface contains the following topics:
■ Audience
■ Documentation Accessibility
■ Related Documents
■ Conventions
AudienceThis guide is intended for Oracle database administrators (DBAs) who want to tuneand optimize the performance of Oracle Database. Before using this document, youshould complete Oracle Database 2 Day DBA.
In particular, this guide is targeted toward the following groups of users:
■ Oracle DBAs who want to acquire database performance tuning skills
■ DBAs who are new to Oracle Database
Documentation AccessibilityOur goal is to make Oracle products, services, and supporting documentationaccessible, with good usability, to the disabled community. To that end, ourdocumentation includes features that make information available to users of assistivetechnology. This documentation is available in HTML format, and contains markup tofacilitate access by the disabled community. Accessibility standards will continue toevolve over time, and Oracle is actively engaged with other market-leadingtechnology vendors to address technical obstacles so that our documentation can beaccessible to all of our customers. For more information, visit the Oracle AccessibilityProgram Web site at
http://www.oracle.com/accessibility/
Accessibility of Code Examples in Documentation
Screen readers may not always correctly read the code examples in this document. Theconventions for writing code require that closing braces should appear on anotherwise empty line; however, some screen readers may not always read a line of textthat consists solely of a bracket or brace.

8/7/2019 Performance_Tunning
http://slidepdf.com/reader/full/performancetunning 10/190
x
Accessibility of Links to External Web Sites in Documentation
This documentation may contain links to Web sites of other companies ororganizations that Oracle does not own or control. Oracle neither evaluates nor makesany representations regarding the accessibility of these Web sites.
TTY Access to Oracle Support Services
Oracle provides dedicated Text Telephone (TTY) access to Oracle Support Serviceswithin the United States of America 24 hours a day, 7 days a week. For TTY support,call 800.446.2398. Outside the United States, call +1.407.458.2479.
Related DocumentsFor more information about the topics covered in this document, see the followingdocuments:
■ Oracle Database 2 Day DBA
■ Oracle Database Administrator's Guide
■ Oracle Database Concepts
■ Oracle Database Performance Tuning Guide
ConventionsThe following conventions are used in this document:
Convention Meaning
boldface Boldface type indicates graphical user interface elements associatedwith an action, or terms defined in text or the glossary.
italic Italic type indicates book titles, emphasis, or placeholder variables forwhich you supply particular values.
monospace Monospace type indicates commands within a paragraph, URLs, codein examples, text that appears on the screen, or text that you enter.

8/7/2019 Performance_Tunning
http://slidepdf.com/reader/full/performancetunning 11/190
xi
What's New in Oracle Performance?
This section describes new performance features of Oracle Database 11g Release 1(11.1) and provides pointers to additional information. The features and enhancementsdescribed in this section comprise the overall effort to optimize database performance.
For a summary of all new features for Oracle Database 11g Release 1 (11.1), see OracleDatabase New Features Guide.
The new and updated performance features in Oracle Database 11g Release 1 (11.1)include:
■ Automatic Database Diagnostic Monitor (ADDM) enhancements
ADDM has been enhanced to perform global analysis on all instances of an OracleReal Application Clusters (Oracle RAC) cluster.
For more information, see "ADDM for Oracle Real Application Clusters" onpage 3-3.
■ Wait activity details
You can view wait activity details for services, modules, and actions from the TopActivity page.
For more information, see "Monitoring User Activity" on page 4-2.
■ Improved Automatic Workload Repository (AWR) baselines
You can create a single, fixed-time AWR baseline or a repeating baseline.Additionally, improved manageability of AWR baselines is now available,including the ability to compute threshold statistics.
For more information, see "Managing Baselines" on page 8-1.
■ Improved manageability of SQL Advisor, SQL Access Advisor, and SQL TuningSets
Significant improvements were made to managing SQL Tuning Advisor, SQLAccess Advisor, and SQL Tuning Sets.
For more information, see Chapter 10, "Tuning SQL Statements" and Chapter 11,"Optimizing Data Access Paths".
■ SQL Performance Analyzer
SQL Performance Analyzer enables you to measure the impact of system changeson SQL performance by testing these changes using a SQL workload on a testsystem.
For more information, see Chapter 12, "Analyzing SQL Performance Impact".

8/7/2019 Performance_Tunning
http://slidepdf.com/reader/full/performancetunning 12/190
xii
■ Active Session History (ASH) enhancements
The ASH report has been enhanced to include row-level tracking of top SQLstatements, top PL/SQL procedures, top Java workload, top phases of execution,and other session-related information.
For more information, see Chapter 7, "Resolving Transient PerformanceProblems".
■ Automated Maintenance Tasks
Key maintenance tasks such as optimizer statistics collection, Automatic SQLTuning, and Segment Advisor are now managed through the AutomaticMaintenance Task framework. This framework enables you to exercise finercontrol over the scheduling of maintenance tasks and on their CPU consumption.
For more information, see "Viewing Automatic SQL Tuning Results" on page 10-5.
■ Customizable Performance page
You can customize the Performance page to show only the graphs and charts thatyou want displayed. You can also choose whether to include AWR baselines in theperformance charts.
For more information, see "Customizing the Database Performance Page" onpage 4-27.
■ I/O Statistics
The Performance page now contains charts for Throughput, I/O, ParallelExecution, and Services. You can use the I/O charts to monitor I/O throughputand latency information based on various criteria such as function (for example,Recovery Manager), consumer groups, and file types.
For more information, see "Monitoring Instance Activity" on page 4-10.

8/7/2019 Performance_Tunning
http://slidepdf.com/reader/full/performancetunning 13/190
Part IGetting Started
Part I provides an introduction to this guide and explains the Oracle Databaseperformance method. This part contains the following chapters:
■ Chapter 1, "Introduction"
■ Chapter 2, "Oracle Database Performance Method"

8/7/2019 Performance_Tunning
http://slidepdf.com/reader/full/performancetunning 14/190

8/7/2019 Performance_Tunning
http://slidepdf.com/reader/full/performancetunning 15/190
Introduction 1-1
1Introduction
As an Oracle database administrator (DBA), you are responsible for the performanceof your Oracle database. Tuning a database to reach a desirable performance level maybe a daunting task, especially for DBAs who are new to Oracle Database. OracleDatabase 2 Day + Performance Tuning Guide is a quick start guide that teaches you howto perform day-to-day database performance tuning tasks using features provided byOracle Diagnostics Pack, Oracle Tuning Pack, and Oracle Enterprise Manager
(Enterprise Manager).This chapter contains the following sections:
■ About This Guide
■ Common Oracle DBA Tasks
■ Tools for Tuning the Database
About This GuideBefore using this guide, you need to do the following:
■ Read Oracle Database 2 Day DBA in its entirety.
■ Obtain the necessary products and tools described in "Tools for Tuning theDatabase" on page 1-2.
Oracle Database 2 Day + Performance Tuning Guide is task-oriented. The objective is todescribe why and when tuning tasks need to be performed.
This guide is not an exhaustive discussion of all Oracle Database concepts. For thistype of information, see Oracle Database Concepts.
This guide does not describe basic Oracle Database administrative tasks. For this typeof information, see Oracle Database 2 Day DBA. For a complete discussion of administrative tasks, see Oracle Database Administrator's Guide.
The primary interface used in this guide is the Enterprise Manager Database Control
console. This guide is not an exhaustive discussion of all Oracle Database performancetuning features and does not cover available application programming interfaces(APIs) that provide comparable tuning options to those presented in this guide. Forthis type of information, see Oracle Database Performance Tuning Guide.
Common Oracle DBA TasksAs an Oracle DBA, you can expect to be involved in the following tasks:
■ Installing Oracle software

8/7/2019 Performance_Tunning
http://slidepdf.com/reader/full/performancetunning 16/190
Tools for Tuning the Database
1-2 Oracle Database 2 Day + Performance Tuning Guide
■ Creating an Oracle database
■ Upgrading the database and software to new releases
■ Starting up and shutting down the database
■ Managing the storage structures of the database
■ Managing user accounts and security
■ Managing schema objects, such as tables, indexes, and views
■ Making database backups and performing database recovery, when necessary
■ Proactively monitoring the condition of the database and taking preventive orcorrective actions, as required
■ Monitoring and tuning database performance
In a small-to-midsize database environment, you might be the sole person performingthese tasks. In large, enterprise environments, the job is often divided among severalDBAs—each with his or her own specialty—such as database security or databasetuning. Oracle Database 2 Day + Performance Tuning Guide describes how to accomplishthe last two tasks in this list.
Tools for Tuning the DatabaseThe intent of this guide is to allow you to quickly and efficiently tune and optimize theperformance of Oracle Database.
To achieve the goals of this guide, you will need to acquire the following products,tools, features, and utilities:
■ Oracle Database 11g Enterprise Edition
Oracle Database 11g Enterprise Edition offers enterprise-class performance,scalability and reliability on clustered and single-server configurations. It includesmany performance features that are used in this guide.
■ Oracle Enterprise Manager
The primary tool to manage your database is Enterprise Manager, a Web-basedinterface. After you install the Oracle software, create or upgrade a database, andconfigure the network, you can use Oracle Enterprise Manager to manage yourdatabase. In addition, Enterprise Manager provides an interface for performanceadvisors and for database utilities, such as SQL*Loader and Recovery Manager(RMAN).
■ Oracle Diagnostics Pack
Oracle Diagnostics Pack offers a complete, cost-effective, and easy-to-use solutionto manage the performance of Oracle Database environments by providing uniquefeatures, such as automatic identification of performance bottlenecks, guided
problem resolution, and comprehensive system monitoring. Key features of OracleDiagnostics Pack that are used in this guide include Automatic DatabaseDiagnostic Monitor (ADDM) and Automatic Workload Repository (AWR).
■ Oracle Database Tuning Pack
Oracle Database Tuning Pack automates the database application tuning process,thereby significantly lowering database management costs while enhancingperformance and reliability. Key features of Oracle Database Tuning Pack that areused in this guide include the following:

8/7/2019 Performance_Tunning
http://slidepdf.com/reader/full/performancetunning 17/190
Tools for Tuning the Database
Introduction 1-3
– SQL Tuning Advisor
This feature enables you to submit one or more SQL statements as input andreceive output in the form of specific advice or recommendations for how totune statements, along with a rationale for each recommendation and itsexpected benefit. A recommendation relates to collection of statistics onobjects, creation of new indexes, restructuring of the SQL statements, or
creation of SQL Profiles.– SQL Access Advisor
This feature enables you to optimize data access paths of SQL queries byrecommending the proper set of materialized views and view logs, indexes,and partitions for a given SQL workload.
■ Oracle Real Application Testing
Oracle Real Application Testing consists of two key features: Database Replay andSQL Performance Analyzer. Database Replay enables you to capture the databaseworkload on a production system, and replay it on a test system with the exactsame timing and concurrency as the production system on the same or newerrelease of Oracle Database. SQL Performance Analyzer enables you to assess the
effect of system changes on SQL performance by identifying SQL statements thathave regressed, improved, or remained unchanged.
Note: Some of the products and tools in the preceding list, includingOracle Diagnostics Pack and Oracle Database Tuning Pack, requireseparate licenses. For more information, see Oracle Database LicensingInformation.

8/7/2019 Performance_Tunning
http://slidepdf.com/reader/full/performancetunning 18/190
Tools for Tuning the Database
1-4 Oracle Database 2 Day + Performance Tuning Guide

8/7/2019 Performance_Tunning
http://slidepdf.com/reader/full/performancetunning 19/190
Oracle Database Performance Method 2-1
2Oracle Database Performance Method
Performance improvement is an iterative process. Removing the first bottleneck (apoint where resource contention is at its highest) might not lead to performanceimprovement immediately because another bottleneck might be revealed that has aneven greater performance impact on the system. For this reason, the Oracleperformance method is iterative. Accurately diagnosing the performance problem isthe first step toward ensuring that the changes you make to the system will result in
improved performance.Performance problems generally result from a lack of throughput, unacceptable useror job response time, or both. The problem might be localized to specific applicationmodules, or it might span the entire system. Before looking at any database oroperating system statistics, it is crucial to get feedback from the most importantcomponents of the system: the users of the system and the people ultimately payingfor the application. Getting feedback from users makes determining the performancegoal easier, and improved performance can be measured in terms of real businessgoals, rather than system statistics.
The Oracle performance method can be applied until performance goals are met ordeemed impractical. Because this process is iterative, it is likely that someinvestigations will be made that have little impact on the performance of the system. It
takes time and experience to accurately pinpoint critical bottlenecks in a timelymanner. Automatic Database Diagnostic Monitor (ADDM) implements the Oracleperformance method and analyzes statistics to provide automatic diagnosis of majorperformance problems. Using ADDM can significantly shorten the time required toimprove the performance of a system, and it is the method used in this guide.
This chapter discusses the Oracle Database performance method and contains thefollowing sections:
■ Gathering Database Statistics Using the Automatic Workload Repository
■ Using the Oracle Performance Method
■ Common Performance Problems Found in Oracle Databases
Gathering Database Statistics Using the Automatic Workload RepositoryDatabase statistics provide information about the type of load on the database and theinternal and external resources used by the database. To accurately diagnoseperformance problems with the database using ADDM, statistics must be available.
Oracle Database generates many types of cumulative statistics for the system, sessions,and individual SQL statements. Oracle Database also tracks cumulative statistics aboutsegments and services. Automatic Workload Repository (AWR) automates database

8/7/2019 Performance_Tunning
http://slidepdf.com/reader/full/performancetunning 20/190
Gathering Database Statistics Using the Automatic Workload Repository
2-2 Oracle Database 2 Day + Performance Tuning Guide
statistics gathering by collecting, processing, and maintaining performance statisticsfor database problem detection and self-tuning purposes.
By default, the statistics gathering process repeats every hour and results in an AWRsnapshot, which is a set of data for a specific time that is used for performancecomparisons. The delta values captured by the snapshot represent the changes for eachstatistic over the time period. Statistics gathered by AWR are queried from memory.
The gathered data can be displayed in both reports and views.Gathering database statistics using AWR is enabled by default and is controlled by theSTATISTICS_LEVEL initialization parameter. The STATISTICS_LEVEL parametershould be set to TYPICAL or ALL to enable statistics gathering by AWR. The defaultsetting is TYPICAL. Setting the STATISTICS_LEVEL parameter to BASIC disablesmany Oracle Database features, including AWR, and is not recommended. Forinformation about the STATISTICS_LEVEL initialization parameter, see OracleDatabase Reference.
The CONTROL_MANAGEMENT_PACK_ACCESS initialization parameter should be set toDIAGNOSTIC+TUNING (default) or DIAGNOSTIC to enable automatic databasediagnostic monitoring. Setting CONTROL_MANAGEMENT_PACK_ACCESS to NONE disables many Oracle Database features, including ADDM, and is strongly
discouraged. For information about the CONTROL_MANAGEMENT_PACK_ACCESS initialization parameter, see Oracle Database Reference.
The database statistics collected and processed by AWR include:
■ Time Model Statistics
■ Wait Event Statistics
■ Session and System Statistics
■ Active Session History Statistics
■ High-Load SQL Statistics
Time Model StatisticsTime model statistics measure the time spent in the database by operation type. Themost important time model statistic is database time, or DB time. Database timerepresents the total time spent in database calls, and is an indicator of the total instanceworkload. As shown in Figure 2–1, database time makes up a portion of anapplication's overall user response time.
Figure 2–1 DB Time in Overall User Response Time
A session is a specific connection of a user to an Oracle Database instance through auser process. Database time is calculated by aggregating the CPU time and wait timeof all user sessions not waiting for idle wait events (user sessions that are not idle). Forexample, a user session may involve an online transaction made at a bookseller's Website consisting of the actions shown in Figure 2–2.

8/7/2019 Performance_Tunning
http://slidepdf.com/reader/full/performancetunning 21/190
Gathering Database Statistics Using the Automatic Workload Repository
Oracle Database Performance Method 2-3
Figure 2–2 DB Time in User Transaction
1. Query for novels by author
The user performs a search for novels by a particular author. This action causes theapplication to perform a database query for novels by the author.
2. Browse results of query
The user browses the returned list of novels by the author and accesses additionaldetails, such as user reviews and inventory status. This action causes theapplication to perform additional database queries.
3. Add item to cart
After browsing details about the novels, the user decides to add one of the novelsto the shopping cart. This action causes the application to make a database call toupdate the shopping cart.
4. Checkout
The user completes the transaction by checking out, using the address andpayment information previously saved at the bookseller's Web site from aprevious purchase. This action causes the application to perform various databaseoperations to retrieve the user's information, add a new order, update theinventory, and generate an E-mail confirmation.
For each of the preceding actions, the user makes a request to the database, asrepresented by the down arrow in Figure 2–2 on page 2-3. The CPU time spent by the
database processing the request and the wait time spent waiting for the database areconsidered DB time, as represented by the shaded areas. After the request iscompleted, the results are returned to the user, as represented by the up arrow. Thespace between the up and down arrows represents the total user response time forprocessing the request, which contains other components besides DB time, asillustrated in Figure 2–1 on page 2-2.
The objective of database tuning is to reduce the time that users spend performingactions on the database, or reducing database time. In this way, you can improve theoverall response time of user transactions on the application.
Wait Event StatisticsWait events are incremented by a session to indicate that the session had to wait for anevent to complete before being able to continue processing. When a session has to waitwhile processing a user request, the database records the wait by using one of a set of predefined wait events. The events are then grouped into wait classes, such as UserI/O and Network. Wait event data reveals symptoms of problems that might beaffecting performance, such as latch, buffer, and I/O contention.
See Also:
■ Oracle Database Performance Tuning Guide
■ Oracle Database Reference

8/7/2019 Performance_Tunning
http://slidepdf.com/reader/full/performancetunning 22/190
Gathering Database Statistics Using the Automatic Workload Repository
2-4 Oracle Database 2 Day + Performance Tuning Guide
Session and System StatisticsA large number of cumulative database statistics are available on a system and sessionlevel. Some of these statistics are collected by AWR.
Active Session History Statistics
The Active Session History (ASH) statistics are samples of session activity in thedatabase. The database samples active sessions every second and stores them in acircular buffer in the System Global Area (SGA). Any session that is connected to thedatabase and using CPU, or is waiting for an event that does not belong to the idlewait class, is considered an active session. By capturing only active sessions, amanageable set of data is represented. The size of the data is directly related to thework being performed, rather than the number of sessions allowed on the system.
Using the DB time example described in "Time Model Statistics" on page 2-2, samplesof session activity are collected from the online transaction made at the bookseller'sWeb site, represented as vertical lines below the horizontal arrow in Figure 2–3.
Figure 2–3 Active Session History
The light vertical lines represent samples of inactive session activity that are notcaptured in the ASH statistics. The bold vertical lines represent samples of activesessions that are captured at:
■ 7:38, while novels by the author are being queried
■ 7:42, while the user is browsing the query results
■ 7:50, when one of the novels is added to the shopping cart
■ 7:52, during the checkout process
Table 2–1 lists the ASH statistics that are collected for the active sessions, along withexamples of the session ID (SID), module, SQL ID, session state, and wait events thatare sampled.
High-Load SQL StatisticsSQL statements that are consuming the most resources produce the highest load on thesystem, based on criteria such as elapsed time and CPU time.
Table 2–1 Active Session History
Time SID Module SQL ID State Event
7:38 213 Book by author qa324jffritcf Waiting db file sequential read
7:42 213 Get review ID aferv5desfzs5 CPU
7:50 213 Add item to cart hk32pekfcbdfr Waiting buffer busy wait
7:52 213 Checkout abngldf95f4de Waiting log file sync

8/7/2019 Performance_Tunning
http://slidepdf.com/reader/full/performancetunning 23/190
Using the Oracle Performance Method
Oracle Database Performance Method 2-5
Using the Oracle Performance MethodPerformance tuning using the Oracle performance method is driven by identifyingand eliminating bottlenecks in the database, and by developing efficient SQLstatements. Database tuning is performed in two phases: proactively and reactively.
In the proactive tuning phase, you must perform tuning tasks as part of your dailydatabase maintenance routine, such as reviewing ADDM analysis and findings,monitoring the real-time performance of the database, and responding to alerts.
In the reactive tuning phase, you must respond to issues reported by the users, such asperformance problems that may occur for only a short duration of time, orperformance degradation to the database over a period of time.
SQL tuning is an iterative process to identify, tune, and improve the efficiency of high-load SQL statements.
Applying the Oracle performance method involves the following:
■ Performing pre-tuning preparations, as described in "Preparing the Database forTuning" on page 2-5
■ Tuning the database proactively on a regular basis, as described in "Tuning the
Database Proactively" on page 2-6
■ Tuning the database reactively when performance problems are reported by theusers, as described in "Tuning the Database Reactively" on page 2-6
■ Identifying, tuning, and optimizing high-load SQL statements, as described in"Tuning SQL Statements" on page 2-7
To improve the performance of your database, you will need to apply these principlesiteratively.
Preparing the Database for TuningThis section lists and describes the steps that must be performed before the database
can be properly tuned.
To prepare the database for tuning:
1. Get feedback from users.
Determine the scope of the performance project and subsequent performancegoals, and determine performance goals for the future. This process is key forfuture capacity planning.
2. Check the operating systems of all systems involved with user performance.
Check for hardware or operating system resources that are fully utilized. List anyoverused resources as possible concerns for later analysis. In addition, ensure thatall hardware is functioning properly.
3. Ensure that the STATISTICS_LEVEL initialization parameter is set to TYPICAL (default) or ALL to enable the automatic performance tuning features of OracleDatabase, including AWR and ADDM.
4. Ensure that the CONTROL_MANAGEMENT_PACK_ACCESS initialization parameter isset to DIAGNOSTIC+TUNING (default) or DIAGNOSTIC to enable ADDM.

8/7/2019 Performance_Tunning
http://slidepdf.com/reader/full/performancetunning 24/190
Using the Oracle Performance Method
2-6 Oracle Database 2 Day + Performance Tuning Guide
Tuning the Database ProactivelyThis section lists and describes the steps required to keep the database properly tunedon a regular basis. These tuning procedures are considered proactive and should beperformed as part of your daily maintenance of Oracle Database.
To tune the database proactively:
1. Review the ADDM findings, as described in Chapter 3, "Automatic DatabasePerformance Monitoring".
ADDM automatically detects and reports on performance problems with thedatabase, including most of the "Common Performance Problems Found in OracleDatabases" on page 2-8. The results are displayed as ADDM findings on the
Database Home page in Oracle Enterprise Manager (Enterprise Manager).Reviewing these findings enables you to quickly identify the performanceproblems that require your attention.
2. Implement the ADDM recommendations, as described in Chapter 3, "AutomaticDatabase Performance Monitoring".
ADDM automatically provides a list of recommendations for reducing the impactof the performance problem with each ADDM finding. Implementing arecommendation applies the suggested changes to improve the databaseperformance.
3. Monitor performance problems with the database in real time, as described inChapter 4, "Monitoring Real-Time Database Performance".
The Performance page in Enterprise Manager enables you to identify and respondto real-time performance problems. By drilling down to the appropriate pages,you can identify and resolve performance problems with the database in real time,without having to wait until the next ADDM analysis.
4. Respond to performance-related alerts, as described in Chapter 5, "MonitoringPerformance Alerts".
The Database Home page in Enterprise Manager enables you to viewperformance-related alerts generated by the system. Typically, these alerts revealperformance problems whose resolutions will improve the performance of yourdatabase.
5. Validate that the changes made have produced the desired effect, and verify that
the users perceive performance improvements.
6. Repeat these steps until your performance goals are met or become impossible toachieve because of other constraints.
Tuning the Database ReactivelyThis section lists and describes the steps required to tune the database based on userfeedback. This tuning procedure is considered reactive. Perform this procedureperiodically when performance problems are reported by the users.
See Also:
■ "Gathering Database Statistics Using the Automatic WorkloadRepository" on page 2-1 for information about configuring AWR
■ "Configuring Automatic Database Diagnostic Monitor" onpage 3-3

8/7/2019 Performance_Tunning
http://slidepdf.com/reader/full/performancetunning 25/190
Using the Oracle Performance Method
Oracle Database Performance Method 2-7
To tune the database reactively:
1. Run ADDM manually to diagnose current and historical database performancewhen performance problems are reported by the users, as described in Chapter 6,"Manual Database Performance Monitoring".
This task is useful if you want to analyze current database performance before thenext ADDM analysis, or to analyze historical database performance when you
were not proactively monitoring the system.2. Resolve transient performance problems, as described in Chapter 7, "Resolving
Transient Performance Problems".
The Active Session History (ASH) reports enable you to analyze transientperformance problems with the database that are short-lived and do not appear inthe ADDM analysis.
3. Resolve performance degradation over time, as described in Chapter 8, "ResolvingPerformance Degradation Over Time".
The Automatic Workload Repository (AWR) Compare Periods report enables youto compare database performance between two periods of time, and resolveperformance degradation that may happen from one time period to another.
4. Validate that the changes made have produced the desired effect, and verify thatthe users perceive performance improvements.
5. Repeat these steps until your performance goals are met or become impossible toachieve due to other constraints.
Tuning SQL StatementsThis section lists and describes the steps required to identify, tune, and optimizehigh-load SQL statements.
To tune SQL statements:
1.Identify high-load SQL statements, as described in Chapter 9, "IdentifyingHigh-Load SQL Statements".
Use the ADDM findings and the Top SQL section to identify high-load SQLstatements that are causing the greatest contention.
2. Tune high-load SQL statements, as described in Chapter 10, "Tuning SQLStatements".
You can improve the efficiency of high-load SQL statements by tuning them usingSQL Tuning Advisor.
3. Optimize data access paths, as described in Chapter 11, "Optimizing Data AccessPaths".
You can optimize the performance of data access paths by creating the proper setof materialized views, materialized view logs, and indexes for a given workloadby using SQL Access Advisor.
4. Analyze the SQL performance impact of SQL tuning and other system changes, asdescribed in Chapter 12, "Analyzing SQL Performance Impact".
You can analyze the performance impact of your SQL tuning activities or othersystem changes on a given SQL workload by using SQL Performance Analyzer.
5. Repeat these steps until all high-load SQL statements are tuned for greatestefficiency.

8/7/2019 Performance_Tunning
http://slidepdf.com/reader/full/performancetunning 26/190
Common Performance Problems Found in Oracle Databases
2-8 Oracle Database 2 Day + Performance Tuning Guide
Common Performance Problems Found in Oracle DatabasesThis section lists and describes common performance problems found in Oracledatabases. By following the Oracle performance method, you should be able to avoidthese problems. If you have these problems, then repeat the steps in the Oracleperformance method, as described in "Using the Oracle Performance Method" onpage 2-5, or consult the appropriate section that addresses these problems:
■ CPU bottlenecks
Is the application performing poorly because the system is CPU-bound?Performance problems caused by CPU bottlenecks are diagnosed by ADDM, asdescribed in Chapter 3, "Automatic Database Performance Monitoring". You canalso identify CPU bottlenecks by using the Performance page in EnterpriseManager, as described in "Monitoring CPU Utilization" on page 4-19.
■ Undersized memory structures
Are the Oracle memory structures—such as the System Global Area (SGA),Program Global Area (PGA), and buffer cache—adequately sized? Performanceproblems caused by undersized memory structures are diagnosed by ADDM, asdescribed in Chapter 3, "Automatic Database Performance Monitoring". You can
also identify memory usage issues by using the Performance page in EnterpriseManager, as described in "Monitoring Memory Utilization" on page 4-22.
■ I/O capacity issues
Is the I/O subsystem performing as expected? Performance problems caused byI/O capacity issues are diagnosed by ADDM, as described in Chapter 3,"Automatic Database Performance Monitoring". You can also identify disk I/Oissues by using the Performance page in Oracle Enterprise Manager, as describedin "Monitoring Disk I/O Utilization" on page 4-25.
■ Suboptimal use of Oracle Database by the application
Is the application making suboptimal use of Oracle Database? Problems such asestablishing new database connections repeatedly, excessive SQL parsing, andhigh levels of contention for a small amount of data (also known asapplication-level block contention) can degrade the application performancesignificantly. Performance problems caused by suboptimal use of Oracle Databaseby the application are diagnosed by ADDM, as described in Chapter 3, "AutomaticDatabase Performance Monitoring". You can also monitor top activity in variousdimensions—including SQL, session, services, modules, and actions—by using thePerformance page in Enterprise Manager, as described in "Monitoring UserActivity" on page 4-2.
■ Concurrency issues
Is the database performing suboptimally due to a high degree of concurrentactivities in the database? A high degree of concurrent activities might result in
contention for shared resources that can manifest in the forms of locks or waits forbuffer cache. Performance problems caused by concurrency issues are diagnosedby ADDM, as described in Chapter 3, "Automatic Database PerformanceMonitoring". You can also identify concurrency issues by using Top Sessions inEnterprise Manager, as described in "Monitoring Top Sessions" on page 4-5.
■ Database configuration issues
Is the database configured optimally to provide desired performance levels? Forexample, is there evidence of incorrect sizing of log files, archiving issues,excessive number of checkpoints, or suboptimal parameter settings? Performance

8/7/2019 Performance_Tunning
http://slidepdf.com/reader/full/performancetunning 27/190
Common Performance Problems Found in Oracle Databases
Oracle Database Performance Method 2-9
problems caused by database configuration issues are diagnosed by ADDM, asdescribed in Chapter 3, "Automatic Database Performance Monitoring".
■ Short-lived performance problems
Are users complaining about short-lived or intermittent performance problems?Depending on the interval between snapshots taken by AWR, performanceproblems that have a short duration may not be captured by ADDM. You can
identify short-lived performance problems by using the Active Session Historyreport, as described in Chapter 7, "Resolving Transient Performance Problems".
■ Degradation of database performance over time
Is there evidence that the database performance has degraded over time? Forexample, are you or your users noticing that the database is not performing as wellas it was 6 months ago? You can generate an AWR Compare Periods report tocompare the period when the performance was poor to a period when theperformance is stable to identify configuration settings, workload profile, andstatistics that are different between these two time periods. This technique willhelp you identify the cause of the performance degradation, as described inChapter 8, "Resolving Performance Degradation Over Time".
■ Inefficient or high-load SQL statementsAre any SQL statements using excessive system resources that impact the system?Performance problems caused by high-load SQL statements are diagnosed byADDM, as described in Chapter 3, "Automatic Database Performance Monitoring" and "Identification of High-Load SQL Statements Using ADDM Findings" onpage 9-1. You can also identify high-load SQL statements by using Top SQL inEnterprise Manager, as described in "Identifying High-Load SQL StatementsUsing Top SQL" on page 9-2. After they have been identified, you can tune thehigh-load SQL statements using SQL Tuning Advisor, as described in Chapter 10,"Tuning SQL Statements".
■ Object contention
Are any database objects the source of bottlenecks because they are continuouslyaccessed? Performance problems caused by object contention are diagnosed byADDM, as described in Chapter 3, "Automatic Database PerformanceMonitoring". You can also optimize the data access path to these objects using SQLAccess Advisor, as described in Chapter 11, "Optimizing Data Access Paths" onpage 4-25.
■ Unexpected performance regression after tuning SQL statements
Is the performance of SQL statements degrading after they have been tuned?Tuning SQL statements may cause changes to execution plans of SQL statements,resulting in a significant impact on SQL performance. In some cases, the changesmay result in the improvement of SQL performance. In other cases, the changesmay cause SQL statements to regress, resulting in a degradation of SQL
performance. Before making changes on a production system, you can analyze theperformance impact from tuning SQL statements on a test system by using SQLPerformance Analyzer, as described in Chapter 12, "Analyzing SQL PerformanceImpact".

8/7/2019 Performance_Tunning
http://slidepdf.com/reader/full/performancetunning 28/190
Common Performance Problems Found in Oracle Databases
2-10 Oracle Database 2 Day + Performance Tuning Guide

8/7/2019 Performance_Tunning
http://slidepdf.com/reader/full/performancetunning 29/190
Part IIProactive Database Tuning
Part II describes how to tune Oracle Database proactively on a regular basis andcontains the following chapters:
■ Chapter 3, "Automatic Database Performance Monitoring"
■ Chapter 4, "Monitoring Real-Time Database Performance"
■ Chapter 5, "Monitoring Performance Alerts"

8/7/2019 Performance_Tunning
http://slidepdf.com/reader/full/performancetunning 30/190

8/7/2019 Performance_Tunning
http://slidepdf.com/reader/full/performancetunning 31/190
Automatic Database Performance Monitoring 3-1
3Automatic Database Performance Monitoring
Automatic Database Diagnostic Monitor (ADDM) automatically detects and reportsperformance problems with the database. The results are displayed as ADDM findingson the Database Home page in Oracle Enterprise Manager (Enterprise Manager).Reviewing the ADDM findings enables you to quickly identify the performanceproblems that require your attention.
Each ADDM finding provides a list of recommendations for reducing the impact of theperformance problem. Reviewing ADDM findings and implementing therecommendations are tasks that you should perform daily as part of the regulardatabase maintenance. Even when the database is operating at an optimalperformance level, you should continue to use ADDM to monitor databaseperformance on an ongoing basis.
This chapter contains the following sections:
■ Overview of Automatic Database Diagnostic Monitor
■ Configuring Automatic Database Diagnostic Monitor
■ Reviewing the Automatic Database Diagnostic Monitor Analysis
■ Interpretation of Automatic Database Diagnostic Monitor Findings
■ Implementing Automatic Database Diagnostic Monitor Recommendations
■ Viewing Snapshot Statistics
Overview of Automatic Database Diagnostic MonitorADDM is self-diagnostic software built into Oracle Database. ADDM examines and
analyzes data captured in the Automatic Workload Repository (AWR) to determinepossible performance problems in Oracle Database. ADDM then locates the rootcauses of the performance problems, provides recommendations for correcting them,and quantifies the expected benefits. ADDM also identifies areas where no action isnecessary.
This section contains the following topics:
■ ADDM Analysis
■ ADDM Recommendations
See Also:
■ Oracle Database Performance Tuning Guide for information aboutusing the DBMS_ADVISOR package to diagnose and tune thedatabase with the Automatic Database Diagnostic Monitor

8/7/2019 Performance_Tunning
http://slidepdf.com/reader/full/performancetunning 32/190
Overview of Automatic Database Diagnostic Monitor
3-2 Oracle Database 2 Day + Performance Tuning Guide
■ ADDM for Oracle Real Application Clusters
ADDM Analysis
An ADDM analysis is performed after each AWR snapshot (every hour by default),and the results are saved in the database. You can then view the results by means of Oracle Enterprise Manager. Before using another performance tuning method
described in this guide, first review the results of the ADDM analysis.
The ADDM analysis is performed from the top down, first identifying symptoms andthen refining the analysis to reach the root causes of performance problems. ADDMuses the DB time statistic to identify performance problems. DB time is the cumulativetime spent by the database in processing user requests, including both the wait timeand CPU time of all user sessions that are not idle.
The goal of database performance tuning is to reduce the DB time of the system for agiven workload. By reducing DB time, the database is able to support more userrequests by using the same or a smaller amount of resources. ADDM reports systemresources that are using a significant portion of DB time as problem areas and sortsthem in descending order by the amount of related DB time spent. For moreinformation about the DB time statistic, see "Time Model Statistics" on page 2-2.
ADDM RecommendationsIn addition to diagnosing performance problems, ADDM recommends possiblesolutions. When appropriate, ADDM recommends multiple solutions from which youcan choose. ADDM recommendations include the following:
■ Hardware changes
Adding CPUs or changing the I/O subsystem configuration
■ Database configuration
Changing initialization parameter settings
■ Schema changes
Hash partitioning a table or index, or using automatic segment space management(ASSM)
■ Application changes
Using the cache option for sequences or using bind variables
■ Using other advisors
Running SQL Tuning Advisor on high-load SQL statements or running theSegment Advisor on hot objects
ADDM benefits apply beyond production systems. Even on development and testsystems, ADDM can provide an early warning of potential performance problems.
Performance tuning is an iterative process. Fixing one problem can cause a bottleneckto shift to another part of the system. Even with the benefit of the ADDM analysis, itcan take multiple tuning cycles to reach a desirable level of performance.
See Also:
■ Oracle Database 2 Day DBA for information the Segment Advisor

8/7/2019 Performance_Tunning
http://slidepdf.com/reader/full/performancetunning 33/190
Configuring Automatic Database Diagnostic Monitor
Automatic Database Performance Monitoring 3-3
ADDM for Oracle Real Application ClustersIn an Oracle Real Application Clusters (Oracle RAC) environment, you can use ADDMto analyze the throughput performance of a database cluster. ADDM for Oracle RACconsiders DB time as the sum of database times for all database instances and reportsfindings that are significant at the cluster level. For example, the I/O levels of eachcluster node may be insignificant when considered locally, but the aggregate I/O level
may be a significant problem for the cluster as a whole.
Configuring Automatic Database Diagnostic MonitorThis section describes how to configure ADDM and contains the following topics:
■ Setting Initialization Parameters to Enable ADDM
■ Setting the DBIO_EXPECTED Parameter
■ Managing AWR Snapshots
Setting Initialization Parameters to Enable ADDMAutomatic database diagnostic monitoring is enabled by default and is controlled bythe CONTROL_MANAGEMENT_PACK_ACCESS and the STATISTICS_LEVEL initialization parameters.
The CONTROL_MANAGEMENT_PACK_ACCESS initialization parameter should be set toDIAGNOSTIC+TUNING (default) or DIAGNOSTIC to enable automatic databasediagnostic monitoring. Setting CONTROL_MANAGEMENT_PACK_ACCESS to NONE disables many Oracle Database features, including ADDM, and is stronglydiscouraged.
The STATISTICS_LEVEL initialization parameter should be set to the TYPICAL (default) or ALL to enable automatic database diagnostic monitoring. SettingSTATISTICS_LEVEL to BASIC disables many Oracle Database features, includingADDM, and is strongly discouraged.
To determine whether ADDM is enabled:
1. From the Database Home page, click Server.
The Server subpage appears.
2. In the Database Configuration section, click Initialization Parameters.
The Initialization Parameters page appears.
3. In the Name field, enter statistics_level and then click Go.The table shows the setting of this initialization parameter.
4. Do one of the following:
■ If the Value column shows ALL or TYPICAL, then do nothing.
■ If the Value column shows BASIC, then select ALL or TYPICAL and clickApply.
5. In the Name field, enter control_management_pack_access and then clickGo.
See Also:
■ Oracle Database 2 Day + Real Application Clusters Guide forinformation about using ADDM for Oracle RAC

8/7/2019 Performance_Tunning
http://slidepdf.com/reader/full/performancetunning 34/190
Configuring Automatic Database Diagnostic Monitor
3-4 Oracle Database 2 Day + Performance Tuning Guide
The table shows the setting of this initialization parameter.
6. Do one of the following:
■ If the Value column shows DIAGNOSTIC or DIAGNOSTIC+TUNING, thendo nothing.
■ If the Value column shows NONE, then select DIAGNOSTIC or
DIAGNOSTIC+TUNING and click Apply.
Setting the DBIO_EXPECTED ParameterADDM analysis of I/O performance partially depends on a single argument,DBIO_EXPECTED, that describes the expected performance of the I/O subsystem. Thevalue of DBIO_EXPECTED is the average time it takes to read a single database block,in microseconds. Oracle Database uses the default value of 10 milliseconds, which isan appropriate value for most hard drives. If your hardware is significantly different,then consider using a different value.
To determine the correct setting for the DBIO_EXPECTED initialization parameter:
1. Measure the average read time of a single database block for your hardware.
This measurement must be taken for random I/O, which includes seek time if youuse standard hard drives. Typical values for hard drives are between 5000 and20000 microseconds.
2. Set the value one time for all subsequent ADDM executions.
For example, if the measured value is 8000 microseconds, then execute thefollowing PL/SQL code as the SYS user:
EXECUTE DBMS_ADVISOR.SET_DEFAULT_TASK_PARAMETER(
'ADDM', 'DBIO_EXPECTED', 8000);
Managing AWR SnapshotsBy default, the Automatic Workload Repository (AWR) generates snapshots of performance data once every hour, and retains the statistics in the workload repositoryfor 8 days. You can change the default values for both the snapshot interval and theretention period.
Oracle recommends that you adjust the AWR retention period to at least a month. You
can also extend the period to one business cycle so you can compare data across timeframes such as the close of the fiscal quarter. You can also create AWR baselines toretain snapshots indefinitely for important time periods.
The data in the snapshot interval is analyzed by ADDM. ADDM compares thedifference between snapshots to determine which SQL statements to capture, based onthe effect on the system load. The ADDM analysis shows the number of SQLstatements that need to be captured over time.
This section contains the following topics:
■ Creating Snapshots
See Also:
■ Oracle Database Reference for information about theSTATISTICS_LEVEL initialization parameter
■ Oracle Database Reference for information about theCONTROL_MANAGEMENT_PACK_ACCESS initialization parameter

8/7/2019 Performance_Tunning
http://slidepdf.com/reader/full/performancetunning 35/190
Configuring Automatic Database Diagnostic Monitor
Automatic Database Performance Monitoring 3-5
■ Modifying Snapshot Settings
Creating Snapshots
Manually creating snapshots is usually not necessary because AWR generatessnapshots of the performance data once every hour by default. In some cases,however, it may be necessary to manually create snapshots to capture different
durations of activity, such as when you want to compare performance data over ashorter period of time than the snapshot interval.
To create snapshots:
1. From the Database Home page, click Performance.
The Performance page appears.
2. Under Additional Monitoring Links, click Snapshots.
The Snapshots page appears with a list of the most recent snapshots.
3. Click Create.
The Confirmation page appears.
4. Click Yes.
The Processing: Create Snapshot page is displayed while the snapshot is beingtaken.
After the snapshot is taken, the Snapshots page reappears with a Confirmationmessage.
In this example, the ID of the snapshot that was created is 249.
Modifying Snapshot Settings
By default, AWR generates snapshots of performance data once every hour.
Alternatively, you can modify the default values of both the interval betweensnapshots and their retention period.
To modify the snapshot settings:
1. From the Database Home page, click Server.
The Server subpage appears.
2. In the Statistics Management section, click Automatic Workload Repository.
The Automatic Workload Repository page appears.

8/7/2019 Performance_Tunning
http://slidepdf.com/reader/full/performancetunning 36/190
Configuring Automatic Database Diagnostic Monitor
3-6 Oracle Database 2 Day + Performance Tuning Guide
In this example, snapshot retention is set to 8 days and snapshot interval is set to60 minutes.
3. Click Edit.
The Edit Settings page appears.
4. For Snapshot Retention, do one of the following:
■
Select Use Time-Based Retention Period (Days), and in the associated fieldenter the number of days to retain the snapshots.
■ Select Retain Forever to retain snapshots indefinitely.
It is recommended that you increase the snapshot retention period wheneverpossible based on the available disk space.
In this example, the snapshot retention period is changed to 30 days.
5. For Snapshot Collection, do one of the following:
■ Select System Snapshot Interval and, in the Interval list, select the desiredinterval to change the interval between snapshots.
■ Select Turn off Snapshot Collection to disable snapshot collection.
In this example, the snapshot collection interval is changed to 30 minutes.
6. Click the link next to Collection Level.
The Initialization Parameter page appears.
To change the statistics level, select the desired value in the Value list for thestatistics_level parameter. Click Save to File to set the value in the serverparameter file.
In this example, the default value of Typical is used.

8/7/2019 Performance_Tunning
http://slidepdf.com/reader/full/performancetunning 37/190
Reviewing the Automatic Database Diagnostic Monitor Analysis
Automatic Database Performance Monitoring 3-7
7. Click OK to apply the changes.
The Automatic Workload Repository page appears and displays the new settings.
Reviewing the Automatic Database Diagnostic Monitor AnalysisBy default, ADDM runs every hour to analyze snapshots taken by AWR during thatperiod. If the database finds performance problems, then it displays the results of theanalysis under Diagnostic Summary on the Database Home page.
The ADDM Findings link shows how many ADDM findings were found in the mostrecent ADDM analysis.
To view ADDM findings:
1. On the Database Home page, under Diagnostic Summary, click the link next toADDM Findings.
The Automatic Database Diagnostic Monitor (ADDM) page appears. The results of the ADDM run are displayed.
On the Automatic Database Diagnostic Monitor (ADDM) page, the DatabaseActivity chart shows the database activity during the ADDM analysis period.Database activity types are defined in the legend based on their correspondingcolors in the chart. Each icon below the chart represents a different ADDM task,which in turn corresponds to a pair of individual Oracle Database snapshots savedin the Workload Repository.

8/7/2019 Performance_Tunning
http://slidepdf.com/reader/full/performancetunning 38/190
Interpretation of Automatic Database Diagnostic Monitor Findings
3-8 Oracle Database 2 Day + Performance Tuning Guide
In this example, the largest block of activity from 8:00 onwards appears in greenand corresponds to CPU usage, as described in the legend. This data suggests thatCPU may be a performance bottleneck during the ADDM analysis period.
In the ADDM Performance Analysis section, the ADDM findings are listed indescending order, from highest impact to least impact. The Informational Findingssection lists the areas that do not have a performance impact and are for
informational purpose only.
2. Optionally, click the Zoom icons to shorten or lengthen the analysis perioddisplayed on the chart.
3. To view the ADDM findings in a report, click View Report.
The View Report page appears.
You can click Save to File to save the report for later access.
Interpretation of Automatic Database Diagnostic Monitor FindingsThe ADDM analysis results are represented as a set of findings. Each ADDM findingbelongs to one of three types:
■ Problem
Findings that describe the root cause of a database performance issue.
■ Symptom
Findings that contain information that often leads to one or more problemfindings.
■ Information
Findings that are used to report areas of the system that do not have aperformance impact.
Each problem finding is quantified with an estimate of the portion of DB time thatresulted from the performance problem.
When a specific problem has multiple causes, ADDM may report multiple findings. Inthis case, the impacts of these multiple findings can contain the same portion of DBtime. Because the performance problems can overlap, summing all the impacts of thereported findings can yield a number higher than 100 percent of DB time. For example,if a system performs many read I/O operations, ADDM may report a SQL statementresponsible for 50 percent of DB time due to I/O activity as one finding, and anundersized buffer cache responsible for 75 percent of DB time as another finding.
A problem finding can be associated with a list of recommendations for reducing theimpact of a performance problem. Each recommendation has a benefit that is anestimate of the portion of DB time that can be saved if the recommendation isimplemented. When multiple recommendations are associated with an ADDMfinding, the recommendations may contain alternatives for solving the same problem.In this case, the sum of the benefits may be higher than the impact of the finding. Youdo not need to apply all the recommendations to solve the same problem.

8/7/2019 Performance_Tunning
http://slidepdf.com/reader/full/performancetunning 39/190
Implementing Automatic Database Diagnostic Monitor Recommendations
Automatic Database Performance Monitoring 3-9
Recommendations are composed of actions and rationales. You must apply all theactions of a recommendation to gain the estimated benefit of that recommendation.The rationales explain why the set of actions was recommended, and provideadditional information for implementing the suggested recommendation. An ADDMaction may present multiple solutions to you. If this is the case, then choose the easiestsolution to implement.
Implementing Automatic Database Diagnostic Monitor RecommendationsThis section describes how to implement ADDM recommendations. ADDM findingsare displayed in the Automatic Database Diagnostic Monitor (ADDM) page underADDM Performance Analysis.
To implement ADDM recommendations:
1. On the Database Home page, under Diagnostic Summary, click the link next toADDM Findings.
The Automatic Database Diagnostic Monitor (ADDM) page appears.
2. In the ADDM Performance Analysis section, click the ADDM finding that has thegreatest impact.
In this example, the finding with the greatest impact is Top SQL by DB Time.
The Performance Finding Details page appears.
3. Under Recommendations, review the recommendations and required actions foreach recommendation.
The Category column displays the category of the recommendation. The Benefit(%) column displays the estimated benefit of implementing the recommendation.

8/7/2019 Performance_Tunning
http://slidepdf.com/reader/full/performancetunning 40/190
Implementing Automatic Database Diagnostic Monitor Recommendations
3-10 Oracle Database 2 Day + Performance Tuning Guide
In this example, two recommendations are displayed for this finding. The firstrecommendation contains one action and is estimated to have a maximum benefitof up to 84.6% of DB time in the analysis period. The second recommendationcontains one action and is estimated to have a maximum benefit of up to 78.3% of DB time in the analysis period.
4. If additional information about why the set of actions was recommended isavailable, then click Additional Information, or review the content displayedunder Additional Information.
For example, the Undersized Buffer Cache finding contains additional informationto indicate the value of the DB_CACHE_SIZE initialization parameter.
5. To view the history of a finding, click Finding History.
The Finding History page appears.
The Finding History page shows how often a particular finding has occurred in aselected 3-hour interval. You can use this information to determine whether thefinding was a transient or a persistent problem on the system. Based on thisinformation, you can determine whether the actions associated with the findingshould be implemented.

8/7/2019 Performance_Tunning
http://slidepdf.com/reader/full/performancetunning 41/190
Implementing Automatic Database Diagnostic Monitor Recommendations
Automatic Database Performance Monitoring 3-11
The Active Sessions chart shows the impact of the finding and of the other load onthe system. You can change the display as follows:
a. To move the 3-hour interval, click and drag the shaded box in the ActiveSessions chart to the time period in which you are interested.
b. To change dates, enter the desired date in the View field and click Go.
c.To view details about a finding, under Detail for Selected 3 Hour Interval, clickthe link in the Finding Details column to display the Performance FindingDetails page for the corresponding ADDM finding.
6. Optionally, create a filter to suppress known findings that have been tuned orcannot be tuned further. To create filters for this ADDM finding:
a. Click Filters.
The Filters for Finding page appears.
b. Click Create.
The Create Filter for Finding page appears.
c. In the Name field, enter a name for the ADDM filter.
d. In the Active Sessions field, specify the filter criteria, in terms of the numberof active sessions, for this finding.
The ADDM finding will be filtered for future ADDM runs if the number of active sessions for this finding is less than the specified filter criteria.
e. In the % Active Sessions field, specify the filter criteria, in terms of percentageof active sessions, for this finding.
The ADDM finding will be filtered for future ADDM runs if the number of active sessions for this finding is less than the specified filter criteria.
f. Click OK.
7. Perform the required action of a chosen recommendation.
Depending on the type of action you choose to perform, various buttons may be
available, such as Implement or Run Advisor Now. These buttons enable you toimplement the recommendation immediately with only a single mouse click.
In this example, the simplest solution is to click Run Advisor Now to immediatelyrun a SQL Tuning Advisor task on the SQL statement.
See Also:
■ Chapter 10, "Tuning SQL Statements"

8/7/2019 Performance_Tunning
http://slidepdf.com/reader/full/performancetunning 42/190
Viewing Snapshot Statistics
3-12 Oracle Database 2 Day + Performance Tuning Guide
Viewing Snapshot StatisticsYou can view the data contained in snapshots taken by AWR using EnterpriseManager. Typically, it is not necessary to review snapshot data because it consistsprimarily of raw statistics. Instead, you should rely on ADDM, which analyzes thesestatistics to identify performance problems. Snapshot statistics should be usedprimarily by advanced users, or by DBAs who are accustomed to using Statspack for
performance analysis.
To view snapshot statistics:
1. From the Database Home page, click Performance.
The Performance page appears.
2. Under Additional Monitoring Links, click Snapshots.
The Snapshots page appears with a list of the most recent snapshots.
3. To view the statistics gathered in a snapshot, click the ID link of the snapshot youwant to view.
The Snapshot Details appears, showing the Details subpage.
In this example, statistics gathered from the previous snapshot (snapshot 161) to
the selected snapshot (snapshot 162) are displayed.
4. To view a Workload Repository report of the statistics, click Report.
The Workload Repository report appears.
5. Optionally, click Save to File to save the report for later access.
See Also:
■ Chapter 8, "Resolving Performance Degradation Over Time"

8/7/2019 Performance_Tunning
http://slidepdf.com/reader/full/performancetunning 43/190
Monitoring Real-Time Database Performance 4-1
4Monitoring Real-Time Database Performance
The Performance page in Oracle Enterprise Manager (Enterprise Manager) displaysinformation in three sections that you can use to assess the overall performance of thedatabase in real time.
Figure 4–1 Performance Page
Typically, you should use the automatic diagnostic feature of Automatic DatabaseDiagnostic Monitor (ADDM) to identify performance problems with the database, asdescribed in Chapter 3, "Automatic Database Performance Monitoring". In some cases,however, you may want to monitor the database performance in real time to identify
performance problems as they happen. For example, ADDM performs its analysisafter each Automatic Workload Repository (AWR) snapshot, which by default is onceevery hour. However, if you notice a sudden spike in database activity on thePerformance page, then you may want to investigate the incident before the nextADDM analysis.
By drilling down to appropriate pages from the Performance page, you can identifyperformance problems with the database in real time. If you find a performanceproblem, then you can choose to run ADDM manually to analyze it immediately,without having to wait until the next ADDM analysis. To learn how to run ADDM

8/7/2019 Performance_Tunning
http://slidepdf.com/reader/full/performancetunning 44/190
Monitoring User Activity
4-2 Oracle Database 2 Day + Performance Tuning Guide
manually to analyze performance in real time, see "Manually Running ADDM toAnalyze Current Database Performance" on page 6-1.
This chapter contains the following sections:
■ Monitoring User Activity
■ Monitoring Instance Activity
■ Monitoring Host Activity
■ Customizing the Database Performance Page
Monitoring User ActivityThe Average Active Sessions chart of the Performance page shows potential problemsinside the database, including how much CPU users are consuming. The wait classesshow how much of the database activity is consumed by waiting for a resource such asdisk I/O.
Figure 4–2 Monitoring User Activity
By following the performance method explained in Chapter 2, "Oracle DatabasePerformance Method", you can drill down from the charts to identify the cause of instance-related performance issues and resolve them.
To monitor user activity:
1. From the Database Home page, click Performance.
The Performance page appears.
2. Locate the spikes in the Average Active Sessions chart.
When the CPU Used value reaches the Maximum CPU line (shown as a dottedline), the database instance is running at 100 percent of CPU time on the hostsystem.
All other values in the chart represent users waiting and contention for resources,which are categorized by wait classes in the legend. Values that use a larger blockof active sessions represent bottlenecks caused by a particular wait class, as
indicated by the corresponding color in the legend.In the chart shown in Figure 4–2 on page 4-2, the largest block of activity appearsin green and corresponds to the CPU Used wait class as described in the legend.
3. To identify each wait class, move your cursor over the block in the Average ActiveSessions chart corresponding to the class.
The corresponding wait class is highlighted in the chart legend.
4. Click the largest block of color on the chart or its corresponding wait class in thelegend to drill down to the wait class with the most active sessions.

8/7/2019 Performance_Tunning
http://slidepdf.com/reader/full/performancetunning 45/190
Monitoring User Activity
Monitoring Real-Time Database Performance 4-3
If you click CPU Used, then the Active Sessions Working page for the wait classappears. If you click a different wait class, such as User I/O, then the ActiveSessions Waiting page appears.
Figure 4–3 Active Sessions Working page
The Active Sessions Working page shows a 1-hour time line. Details for each waitclass are shown in 5-minute intervals under Detail for Selected 5 Minute Interval.
You can view the details of wait classes in different dimensions by proceeding toone of the following sections:
■ "Monitoring Top SQL" on page 4-4
■
"Monitoring Top Sessions" on page 4-5■ "Monitoring Top Services" on page 4-6
■ "Monitoring Top Modules" on page 4-7
■ "Monitoring Top Actions" on page 4-7
■ "Monitoring Top Clients" on page 4-8
■ "Monitoring Top PL/SQL" on page 4-9
■ "Monitoring Top Files" on page 4-9
■ "Monitoring Top Objects" on page 4-10
5. To change the time selected interval, move the slider below the chart to a different
interval.The information contained in the Detail for Selected 5 Minute Interval section isautomatically updated to display the selected time period.
In the example shown in Figure 4–3, the 5 -minute interval from 5:03 to 5:08 isselected for the CPU Used wait class.
6. If you discover a performance problem, then you can attempt to resolve it in realtime. On the Performance page, do one of the following:

8/7/2019 Performance_Tunning
http://slidepdf.com/reader/full/performancetunning 46/190
Monitoring User Activity
4-4 Oracle Database 2 Day + Performance Tuning Guide
■ Click a snapshot below the chart that corresponds to the time when theperformance problem occurred to run ADDM for that time period.
For information about ADDM analysis, see "Reviewing the AutomaticDatabase Diagnostic Monitor Analysis" on page 3-7.
■ Create a snapshot manually by clicking Run ADDM Now.
For information about creating snapshots manually, see "Creating Snapshots" on page 3-5. For information about running ADDM manually, see "ManuallyRunning ADDM to Analyze Current Database Performance" on page 6-1.
■ Click Run ASH Report to create an ASH report to analyze transientperformance problems that last for only a short period of time.
For information about ASH reports, see "Active Session History Reports" onpage 7-3.
Monitoring Top SQLOn the Active Sessions Working page, the Top Working SQL table shows the databaseactivity for actively running SQL statements that are consuming CPU resources. The
Activity (%) column shows the percentage of this activity consumed by each SQLstatement. If one or several SQL statements are consuming a majority of the activity,then you should investigate them.
Figure 4–4 Monitoring Top SQL
In the example shown in Figure 4–4, the SELECT statement is consuming over 90% of database activity and should be investigated.
To monitor the top working SQL statements:
1. On the Performance page, in the Average Active Sessions chart, click the CPUblock on the chart or its corresponding wait class in the legend.
The Active Sessions Working page appears.
2. Under Detail for Selected 5 Minute Interval, click the SQL ID link of the mostactive SQL statement in the Top Working SQL table.
The SQL Details page appears.
For SQL statements that are using the majority of the wait time, use SQL TuningAdvisor or create a SQL Tuning Set to tune the problematic SQL statements.

8/7/2019 Performance_Tunning
http://slidepdf.com/reader/full/performancetunning 47/190
Monitoring User Activity
Monitoring Real-Time Database Performance 4-5
Monitoring Top SessionsOn the Active Sessions Working page, the Top Working Sessions table displays the topsessions waiting for the corresponding wait class during the selected time period.Sessions represent specific user connections to the database through a user process.
Figure 4–5 Monitoring Top Sessions
A session lasts from the time the user connects to the database until the time the userdisconnects or exits the database application. For example, when a user startsSQL*Plus, the user must provide a valid database user name and password toestablish a session. If a single session is using the majority of the wait time, then youshould investigate it.
To monitor the top working sessions:
1. On the Performance page, in the Average Active Sessions chart, click the CPUUsed block on the chart or its corresponding wait class in the legend.
The Active Sessions Working page appears.
2. Under Detail for Selected 5 Minute Interval, click the Session ID link of thesession consuming the most database activity.
The Session Details page appears.
This page contains information such as session activity, session statistics, opencursors, blocking sessions, wait events, and parallel SQL for the selected session.
In the example shown in Figure 4–5, the SQL*Plus session for user sh isconsuming over 96% of database activity and should be investigated.
See Also:
■ "Viewing Details of SQL Statements" on page 9-4
■ "Tuning SQL Statements Using SQL Tuning Advisor" onpage 10-2

8/7/2019 Performance_Tunning
http://slidepdf.com/reader/full/performancetunning 48/190
Monitoring User Activity
4-6 Oracle Database 2 Day + Performance Tuning Guide
Figure 4–6 Viewing Session Details
In this example, because the session is consuming 100 percent of database activity,consider ending the session by clicking Kill Session, and proceeding to tune theSQL statement that this session is running.
Monitoring Top ServicesThe Top Services table displays the top services waiting for the corresponding waitevent during the selected time period.
Services represent groups of applications with common attributes, service-levelthresholds, and priorities. For example, the SYS$USERS service is the default servicename used when a user session is established without explicitly identifying its servicename. The SYS$BACKGROUND service consists of all Oracle Database backgroundprocesses. If a single service is using the majority of the wait time, then you should
investigate it.
To monitor a service:
1. On the Performance page, in the Average Active Sessions chart, click a block onthe chart or its corresponding wait class in the legend.
The Active Sessions Working page appears.
2. Under Detail for Selected 5 Minute Interval, select Top Services from the View list.
The Top Services table appears.
Figure 4–7 Monitoring Top Services
In the example shown in Figure 4–7, the SYS$USERS service is consuming 97.32%of database activity. This service corresponds to the SQL*Plus session for user sh shown in Figure 4–5.
See Also:
■ Chapter 10, "Tuning SQL Statements"

8/7/2019 Performance_Tunning
http://slidepdf.com/reader/full/performancetunning 49/190
Monitoring User Activity
Monitoring Real-Time Database Performance 4-7
3. Click the Service link of the most active service.
The Service page appears.
This page contains information about the modules, activity, and statistics for theselected service.
Monitoring Top ModulesThe Top Modules table displays the top modules waiting for the corresponding waitevent during the selected time period.
Modules represent the applications that set the service name as part of the workloaddefinition. For example, the DBMS_SCHEDULER module may assign jobs that runwithin the SYS$BACKGROUND service. If a single module is using the majority of thewait time, then it should be investigated.
To monitor a module:
1. On the Performance page, in the Average Active Sessions chart, click a block onthe chart or its corresponding wait class in the legend.
The Active Sessions Working page appears.2. Under Detail for Selected 5 Minute Interval, select Top Modules from the View
list.
The Top Modules table appears.
Figure 4–8 Monitoring Top Modules
3. Click the Module link of the module that is showing the highest percentage of activity.
The Module page appears.
This page contains information about the actions, activity, and statistics for theselected module.
In the example shown in Figure 4–8, the SQL*Plus module is consuming over 95%of database activity and should be investigated. As shown in Figure 4–5, theSQL*Plus session for user sh is consuming a huge percentage of database activity.
Monitoring Top ActionsThe Top Actions table displays the top actions waiting for the corresponding waitevent during the selected time period.
Actions represent the jobs that are performed by a module. For example, theDBMS_SCHEDULER module can run the GATHER_STATS_JOB action to gather statisticson all database objects. If a single action is using the majority of the wait time, thenyou should investigate it.

8/7/2019 Performance_Tunning
http://slidepdf.com/reader/full/performancetunning 50/190
Monitoring User Activity
4-8 Oracle Database 2 Day + Performance Tuning Guide
To monitor an action:
1. On the Performance page, in the Average Active Sessions chart, click a block onthe chart or its corresponding wait class in the legend.
The Active Sessions Working page appears.
2. Under Detail for Selected 5 Minute Interval, select Top Actions from the View list.
The Top Actions table appears.
Figure 4–9 Monitoring Top Actions
3. Click the Action link of the most active action.
The Action page appears.
This page contains statistics for the selected action.
In the example shown in Figure 4–9, the action associated with the SQL*Plusmodule and SALES_INFO action is consuming 96% of the database activity. Thisinformation is consistent with Figure 4–5, which shows that the SQL*Plus sessionfor user sh is consuming over 96% of database activity.
Monitoring Top Clients
The Top Clients table displays the top clients waiting for the corresponding wait eventduring the selected time period. A client can be a Web browser or any end-userprocess that initiates requests for an operation to be performed on the database. If asingle client is using the majority of the wait time, then you should investigate it.
To monitor a client:
1. On the Performance page, in the Average Active Sessions chart, click a block onthe chart or its corresponding wait class in the legend.
The Active Sessions Working page appears.
2. Under Detail for Selected 5 Minute Interval, select Top Clients from the View list.
The Top Clients table appears.
Figure 4–10 Monitoring Top Clients
3. Click the Client ID link of the most active client.
The Clients page appears.

8/7/2019 Performance_Tunning
http://slidepdf.com/reader/full/performancetunning 51/190
Monitoring User Activity
Monitoring Real-Time Database Performance 4-9
This page contains statistics for the selected user process.
Monitoring Top PL/SQL
The Top PL/SQL table displays the top PL/SQL subprograms waiting for thecorresponding wait event during the selected time period. If a single PL/SQLsubprogram is using the majority of the wait time, then you should investigate it.
To monitor a PL/SQL subprogram:
1. On the Performance page, in the Average Active Sessions chart, click a block onthe chart or its corresponding wait class in the legend.
The Active Sessions Working page appears.
2. Under Detail for Selected 5 Minute Interval, select Top PL/SQL from the View list.
The Top PL/SQL table appears.
Figure 4–11 Monitoring Top PL/SQL
3. Click the PL/SQL Subprogram link of the most active subprogram.
The PL/SQL Subprogram page appears.
This page contains statistics for the selected subprogram.
In Figure 4–11, the SYSMAN.MGMT_JOB_EXEC_UPDATE subprogram is consuming100% of database activity.
Monitoring Top FilesThe Top Files table displays the average wait time for specific files during the selectedtime period. This data is available from the Active Sessions Waiting: User I/O page.
To monitor a file:
1. On the Performance page, in the Average Active Sessions chart, click the User I/Oblock on the chart or its corresponding wait class in the legend.
The Active Sessions Waiting: User I/O page appears.
2. Under Detail for Selected 5 Minute Interval, select Top Files from the View list.
The Top Files table appears.
Figure 4–12 Monitoring Top Files
3. Click the Tablespace link of the file with the highest average wait time.
The View Tablespace page appears.

8/7/2019 Performance_Tunning
http://slidepdf.com/reader/full/performancetunning 52/190
Monitoring Instance Activity
4-10 Oracle Database 2 Day + Performance Tuning Guide
In the example shown in Figure 4–12, the wait times are all associated with I/O forthe file in the SYSTEM tablespace.
Monitoring Top ObjectsThe Top Objects table displays the top database objects waiting for the correspondingwait event during the selected time period. This data is available from the Active
Sessions Waiting: User I/O page.
To monitor an object:
1. On the Performance page, in the Average Active Sessions chart, click the User I/Oblock on the chart or its corresponding wait class in the legend.
The Active Sessions Waiting: User I/O page appears.
2. Under Detail for Selected 5 Minute Interval, select Top Objects from the View list.
The Top Objects table appears.
Figure 4–13 Monitoring Top Objects
3. Click the Object Name link of the object with the highest average wait time.
The View page for the object appears.
This example in Figure 4–13 shows that all the waits are for the SYS.I_SYSAUTH1 index. Given the information in Figure 4–4 and Figure 4–5, you can conclude thatthe performance problem is caused by the SELECT statement executed by user sh,which is waiting for access to the SYS.I_SYSAUTH1 index.
Monitoring Instance ActivityIn the Average Active Sessions section of the Performance page, you can use theThroughput, I/O, Parallel Execution, and Services charts to monitor database instanceactivity. As explained in "Customizing the Database Performance Page" on page 4-27,you can also customize the Performance page so that the most useful charts aredisplayed by default.
Figure 4–14 Monitoring Instance Activity
You can use the instance activity charts to perform the following tasks:
■ Monitoring Throughput
■ Monitoring I/O

8/7/2019 Performance_Tunning
http://slidepdf.com/reader/full/performancetunning 53/190
Monitoring Instance Activity
Monitoring Real-Time Database Performance 4-11
■ Monitoring Parallel Execution
■ Monitoring Services
Monitoring ThroughputThe Throughput charts show any contention that appears in the Average Active
Sessions chart. The charts indicate how much work the database is performing for theuser. The Throughput charts on the Performance page display:
■ Number of physical reads, redo size, logons, and transactions per second
■ Number of physical reads and redo size per transaction
Figure 4–15 Monitoring Throughput
Compare the peaks on the Throughput charts with the peaks on the Average ActiveSessions chart. If the Average Active Sessions chart displays a large number of sessionswaiting, indicating internal contention, but throughput is high, then the situation maybe acceptable. The database is probably also performing efficiently if internalcontention is low but throughput is high. However, if internal contention is high butthroughput is low, then consider tuning the database.
To monitor throughput:
1. From the Database Home page, click Performance.
The Performance page appears.
2. In the instance activity chart, click Throughput.
The Throughput charts are shown with Instance Throughput Rate set to thedefault value of Per Second. You can select Per Transaction to show thethroughput rate per transaction.
In the example in shown in Figure 4–15, the number of transactions and physicalreads per second spiked at around 10:45 a.m. The number of transactions persecond has remained between 1000 and 2000 for 25 minutes. The physical readshave remained between 500 and 1000 KB per second.
3. To view the top consumers for each type of activity, click the corresponding link inthe legend.
The Top Consumers page appears. This page shows the top sessions for theselected activity.

8/7/2019 Performance_Tunning
http://slidepdf.com/reader/full/performancetunning 54/190
Monitoring Instance Activity
4-12 Oracle Database 2 Day + Performance Tuning Guide
In this example, a SQL*Plus session created by operating system user lashdown isresponsible for the increase in database throughput.
4. Select any session and click View to obtain more information.
After you analyze the information, you can choose to end the session by clickingKill Session, or return to the Performance page.
Monitoring I/O
The I/O charts show I/O statistics collected from all database clients. The I/O waittime for a database process represents the amount of time that the process could havebeen doing useful work if a pending I/O had completed. Oracle Database captures theI/O wait times for all important I/O components in a uniform fashion so that everyI/O wait by any Oracle process can be deduced from the I/O statistics.
Figure 4–16 Monitoring I/O
The Latency for Synchronous Single Block Reads chart shows the total perceived I/Olatency for a block read, which is the time difference between when an I/O is issuedand when it is processed by the database. Most systems are performing satisfactorily if

8/7/2019 Performance_Tunning
http://slidepdf.com/reader/full/performancetunning 55/190
Monitoring Instance Activity
Monitoring Real-Time Database Performance 4-13
latency is fewer than 10 milliseconds. This type of I/O request is the best indicator of I/O performance for the following reasons:
■ Write operations may exhibit good performance because of write caches instorage.
■ Because multiblock I/O requests have varying sizes, they can take differentamounts of time.
■ The latency of asynchronous I/O requests does not represent the full I/O waittime.
The other charts shown depend on your selection for I/O Breakdown, as described inthe following sections:
■ Monitoring I/O by Function
■ Monitoring I/O by Type
■ Monitoring I/O by Consumer Group
Monitoring I/O by Function
The I/O Function charts determine I/O usage level by application or job. Thecomponent-level statistics give a detailed view of the I/O bandwidth usage, whichyou can then use in scheduling jobs and I/O provisioning. The component-levelstatistics fall in the following categories:
■ Background type
This category includes ARCH, LGWR, and DBWR.
■ Activity
This category includes XML DB, Streams AQ, Data Pump, Recovery, and RMAN.
■ I/O type
The category includes Direct Write, which is a write issued by a foreground
process that is not from the buffer cache; Direct Read, which is a physical I/O froma datafile that bypasses the buffer cache and reads the data block directly intoprocess-private memory; and Buffer Cache Read.
■ Others
This category includes I/Os such as control file I/Os.
To monitor I/O by function:
1. From the Database Home page, click Performance.
The Performance page appears.
2. In the instance activity chart, click I/O.
The I/O Megabytes per Second and I/O Requests per Second charts appear.3. For I/O Breakdown, select I/O Function.
The I/O Megabytes per Second by I/O Function and I/O Requests per Second byI/O Function charts appear.
The example in Figure 4–16 shows that a significant amount of I/O is beingperformed by the log writer. The log writer activity peaked at around 550 I/Orequests per second.

8/7/2019 Performance_Tunning
http://slidepdf.com/reader/full/performancetunning 56/190
Monitoring Instance Activity
4-14 Oracle Database 2 Day + Performance Tuning Guide
4. Click the largest block of color on the chart or its corresponding function in thelegend to drill down to the function with the highest I/O rate.
The I/O Details page appears.
You can view real-time or historical data for details on I/O megabytes or I/Orequests.
Monitoring I/O by Type
The I/O Type charts enable you to monitor I/O by the types of read and writeoperations. Small I/Os are requests smaller than 128 KB and are typically singledatabase block I/O operations. Large I/Os are requests greater than or equal to 128KB. Large reads are generated by database operations such as table/index scans, directdata loads, backups, restores, and archiving.
If you are optimizing for low transaction times, then monitor the rate at which I/Orequests are completed. Single-block performance is optimal when there is low I/Olatency. High latencies typically indicate that the storage system is a bottleneck.Performance is negatively impacted by large I/O workloads.
If you are optimizing for large queries, such as in a data warehouse, then performanceis dependent on the maximum throughput your storage system can achieve ratherthan the latency of the I/O requests. In this case, monitor the I/O megabytes persecond rather than the synchronous single-block read latencies.
To monitor I/O by type:
1. From the Database Home page, click Performance.
The Performance page appears.
2. In the instance activity chart, click I/O.
The I/O Megabytes per Second and I/O Requests per Second charts appear
3. For I/O Breakdown, select I/O Type.
See Also:
■ Oracle Database Concepts to learn about database backgroundprocesses such as ARCH, LGWR, and DBWR

8/7/2019 Performance_Tunning
http://slidepdf.com/reader/full/performancetunning 57/190
Monitoring Instance Activity
Monitoring Real-Time Database Performance 4-15
The I/O Megabytes per Second by I/O Type and I/O Requests per Second by I/OType charts appear.
In this example, the number of small writes per second increased to 550. Thesewrites correspond to the log writer I/O requests shown in Figure 4–16.
4. Click the largest block of color on the chart or its corresponding function in thelegend to drill down to the function with the highest I/O rate.
The I/O Details page appears.
You can view real-time or historical data for details on I/O megabytes or I/Orequests.
Monitoring I/O by Consumer Group
When Oracle Database Resource Manager is enabled, the database collects I/Ostatistics for all consumer groups that are part of the currently enabled resource plan.The Consumer Group charts enable you to monitor I/O by consumer group.
A resource plan specifies how the resources are to be distributed among various users(resource consumer groups). Resource consumer groups let you group user sessionstogether by resource requirements. Note that the _ORACLE_BACKGROUND_GROUP_ consumer group contains I/O requests issued by background processes.
To monitor I/O requests by consumer group:
1. From the Database Home page, click Performance.
The Performance page appears.
2. In the instance activity chart, click I/O.
The I/O Megabytes per Second and I/O Requests per Second charts appear.
3. For I/O Breakdown, select Consumer Group.
The I/O Megabytes per Second by Consumer Group and I/O Requests per Secondby Consumer Group charts appear.

8/7/2019 Performance_Tunning
http://slidepdf.com/reader/full/performancetunning 58/190
Monitoring Instance Activity
4-16 Oracle Database 2 Day + Performance Tuning Guide
Monitoring Parallel ExecutionThe Parallel Execution charts show system metrics related to parallel queries. Aparallel query divides the work of executing a SQL statement across multipleprocesses. The charts show parallel queries that were waiting for a particular waitevent that accounted for the highest percentages of sampled session activity.
Figure 4–17 Monitoring Parallel Execution
To monitor parallel execution:
1. From the Database Home page, click Performance.
The Performance page appears.
2. In the instance activity chart, click Parallel Execution.
The Parallel Execution charts appear.
Two pairs of charts are displayed. The first pair of charts shows the number of sessions on the y-axis, whereas the second pair shows the per second rate on they-axis.
In the example shown in Figure 4–17, query parallelization was active between11:30 a.m. to 12:20 p.m.
Monitoring Services
The Services charts show services waiting for the corresponding wait event during thetime period shown. Services represent groups of applications with common attributes,service-level thresholds, and priorities. For example, the SYS$USERS service is thedefault service name used when a user session is established without explicitly
identifying its service name. Only active services are shown.

8/7/2019 Performance_Tunning
http://slidepdf.com/reader/full/performancetunning 59/190
Monitoring Host Activity
Monitoring Real-Time Database Performance 4-17
Figure 4–18 Monitoring Services
To monitor services:
1. From the Database Home page, click Performance.
The Performance page appears.
2. In the instance activity chart, click Services.
The Services chart appears.
In Figure 4–18, the emdc and SYS$USERS services have the greatest number of active sessions.
3. Click the largest block of color on the chart or its corresponding service in thelegend to drill down to the service with the highest number of active sessions.
The Service page appears, showing the Activity subpage.
You can view real-time data showing the session load for all wait classesassociated with the service.
Monitoring Host ActivityThe Host chart on the Performance page displays utilization information about the
system hosting the database.
Figure 4–19 Monitoring Host Activity

8/7/2019 Performance_Tunning
http://slidepdf.com/reader/full/performancetunning 60/190
Monitoring Host Activity
4-18 Oracle Database 2 Day + Performance Tuning Guide
To determine if the host system has enough resources available to run the database,establish appropriate expectations for the amount of CPU, memory, and disk resourcesthat your system should be using. You can then verify that the database is notconsuming too many of these resources.
To view details about CPU, memory, and disk utilization:
1. From the Database Home page, click Performance.
The Performance page appears.
2. Click Load Average in the legend for the Host chart.
The Host page appears, showing the Performance subpage.
Figure 4–20 Performance Summary
The Performance Summary view is shown by default. The Performance Summaryview displays metric values for CPU utilization, memory utilization, disk I/Outilization, and the top 10 processes ordered by both CPU and memory utilization.
3. Determine whether sufficient resources are available and whether when yoursystem is using too many resources.
Determine the amount of CPU, memory, and disk resources the database uses inthe following scenarios:
■ When your system is idle, or when little database and nondatabase activityexists
■ At average workloads
■ At peak workloads
Workload is an important factor when evaluating the level of resource utilizationfor your system. During peak workload hours, 90 percent utilization of a resource,such as a CPU with 10 percent idle and waiting time, can be acceptable. However,if your system shows high utilization at normal workload, then there is no roomfor additional workload.

8/7/2019 Performance_Tunning
http://slidepdf.com/reader/full/performancetunning 61/190
Monitoring Host Activity
Monitoring Real-Time Database Performance 4-19
Use the procedures in the following sections to monitor the host activity for yourdatabase:
■ Monitoring CPU Utilization
■ Monitoring Memory Utilization
■ Monitoring Disk I/O Utilization
4. Set the appropriate threshold values for the performance metrics so the system canautomatically generate alerts when these thresholds are exceeded.
For information about setting metric thresholds, see "Setting Metric Thresholds forPerformance Alerts" on page 5-1.
Monitoring CPU UtilizationTo address CPU problems, first establish appropriate expectations for the amount of CPU resources your system should be using. You can then determine whethersufficient CPU resources are available and recognize when your system is consumingtoo many resources. This section describes how to monitor CPU utilization.
To monitor CPU utilization:1. From the Database Home page, click Performance.
The Performance page appears.
2. In the Host chart, click Load Average in the legend.
The Host page appears, showing the Performance subpage.
3. Select CPU Details from the View list.
The CPU Details view appears.
This view contains statistics about CPU utilization, I/O wait times, and loadgathered over the last hour. The top 10 processes are also listed ordered by CPUutilization.
4. Verify the current CPU utilization using the CPU Utilization chart.
The CPU Utilization chart shows CPU utilization over the last hour. The currentvalue is displayed below the chart. During standard workload hours, the valueshould not exceed the critical threshold.
5. Click CPU Utilization.
The CPU Utilization page appears.
This page contains CPU utilization statistics and related alerts generated over thelast 24 hours.

8/7/2019 Performance_Tunning
http://slidepdf.com/reader/full/performancetunning 62/190
Monitoring Host Activity
4-20 Oracle Database 2 Day + Performance Tuning Guide
In this example, the CPU utilization crossed the critical threshold value at 9:56p.m., so an alert for CPU utilization is generated to indicate that a CPU
performance problem may exist.If you notice an unexpected spike in this value that is sustained through normalworkload hours, then the CPU performance problem should be investigated.
6. Verify the current CPU I/O wait time using the CPU I/O Wait chart.
The CPU I/O Wait chart shows CPU I/O wait time over the last hour. The currentvalue is displayed below the chart. During normal workload hours, the value of CPU I/O wait should not exceed the warning threshold.
CPU I/O wait represents the average number of jobs waiting for I/O during aninterval.
7. Click CPU I/O Wait.
The CPU in I/O Wait page appears.This page contains CPU I/O wait statistics and related alerts generated over thelast 24 hours.
If you notice an unexpected spike in this value that is sustained through standardworkload hours, then a CPU performance problem might exist.
8. Verify the current CPU load using the CPU Load chart.

8/7/2019 Performance_Tunning
http://slidepdf.com/reader/full/performancetunning 63/190
Monitoring Host Activity
Monitoring Real-Time Database Performance 4-21
The CPU Load chart shows the CPU load over the last hour. The current value isdisplayed below the chart. During standard workload hours, the value of CPUload should not exceed the warning threshold.
CPU load represents the average number of processes waiting to be scheduled forCPU resources in the previous minute, or the level of CPU contention time overtime.
9. Click CPU Load.
The Run Queue Length page appears.
This page contains CPU load statistics and related alerts generated over the last 24hours.
In this example, the CPU load crossed the warning threshold, but it is still belowthe critical threshold, so an alert was not generated.
If you notice an unexpected spike in this value that is sustained through normalworkload hours, then a CPU performance problem might exist.
10. Return to the CPU Details view of the Host Performance subpage and review theTop 10 Processes table.
If a process is consuming too much of the CPU utilization percentage, then thisprocess should be investigated.
In this example, the database is consuming 100 percent of CPU utilization.Therefore, the database is the likely source of a potential CPU performanceproblem and should be investigated.
11. If a CPU performance problem is identified, then you can try to resolve the issueby doing the following:

8/7/2019 Performance_Tunning
http://slidepdf.com/reader/full/performancetunning 64/190
Monitoring Host Activity
4-22 Oracle Database 2 Day + Performance Tuning Guide
■ Using Oracle Database Resource Manager to reduce the impact of peak-load-use patterns by prioritizing CPU resource allocation
■ Avoiding running too many processes that use a lot of CPU
■ Increasing hardware capacity, including changing the system architecture
Monitoring Memory UtilizationOperating system performance issues commonly involve process management,memory management, and scheduling. This section describes how to monitor memoryutilization and identify problems such as paging and swapping.
To monitor memory utilization:
1. From the Database Home page, click Performance.
The Performance page appears.
2. In the Host chart, click Load Average in the legend.
The Host page appears, showing the Performance subpage.
3. Select Memory Details from the View list.
The Memory Details view of the Performance subpage appears.
This view contains statistics about memory utilization, page scan rates, and swaputilization gathered over the last hour. The top 10 processes are also listed orderedby memory utilization.
4. Verify the current memory page scan rate using the Memory Page Scan Rate chart.
The current value of the memory page scan rate is displayed below the chart. OnUNIX-based systems, this value represents the number of pages scanned persecond. On Microsoft Windows, this value represents the rate at which pages areread from or written to disk to resolve hard page faults. This value is a primaryindicator of the kinds of faults that may be causing systemwide delays.
5. Click Memory Scan Rate.
The Memory Page Scan Rate page appears.
See Also:
■ Oracle Database Performance Tuning Guide for information aboutresolving CPU issues
■ Oracle Database Administrator's Guide for information about OracleDatabase Resource Manager

8/7/2019 Performance_Tunning
http://slidepdf.com/reader/full/performancetunning 65/190
Monitoring Host Activity
Monitoring Real-Time Database Performance 4-23
This page contains memory page scan rate statistics and related alerts over the last24 hours.
In this example, an alert is not generated because a threshold is not defined.
If you notice an unexpected spike in this value that is sustained through standardworkload hours, then a memory performance problem might exist.
6. Verify the current memory utilization using the Memory Utilization chart.
The Memory Utilization chart shows how much memory is being used. Thecurrent value of memory utilization is displayed below the chart. During standardworkload hours, the value should not exceed the warning threshold (shown inyellow).
7. Click Memory Utilization.
The Memory Utilization page appears.
This page contains memory utilization statistics and related alerts generated over
the last 24 hours.
In this example, memory utilization is near, but does not exceed, the warningthreshold value (99 percent), so an alert is not generated.
If you notice an unexpected spike in this value that is sustained through normalworkload hours, then a memory performance problem might exist.

8/7/2019 Performance_Tunning
http://slidepdf.com/reader/full/performancetunning 66/190
Monitoring Host Activity
4-24 Oracle Database 2 Day + Performance Tuning Guide
8. Verify current swap utilization using the Swap Utilization chart.
The Swap Utilization chart shows how much swap space is being used. Thecurrent value of swap utilization is displayed below the chart. During normalworkload hours, the value should not exceed the warning threshold.
9. Click Swap Utilization.
The Swap Utilization page appears.This page contains swap utilization statistics and related alerts generated over thelast 24 hours.
In this example, swap utilization is below the warning threshold, so an alert is notgenerated.
If you notice an unexpected spike in this value that is sustained through normalworkload hours, then a memory performance problem might exist.
10. On the Memory Details view of the Host Performance subpage, verify the top
processes in the Top 10 Processes table.
If a process is taking up too much memory, then this process should beinvestigated.
In this example, the database is consuming 82.86 percent of the CPU. The residentsize is 259 MB, while the virtual size is 391 MB. Therefore, the database is thelikely source of a potential memory problem and should be investigated.
11. If a memory performance problem is identified, you can attempt to resolve theissue by doing the following:
■ Using Automatic Memory Management to automatically manage anddistribute memory between the System Global Area (SGA) and the aggregateprogram global area (PGA aggregate)

8/7/2019 Performance_Tunning
http://slidepdf.com/reader/full/performancetunning 67/190
Monitoring Host Activity
Monitoring Real-Time Database Performance 4-25
■ Using the Memory Advisor to set SGA and PGA memory target values
■ Using Automatic PGA Management to manage SQL memory execution
■ Avoiding running too many processes that use a lot of memory
■ Reducing paging or swapping
■ Reducing the number of open cursors and hard parsing with cursor sharing
Monitoring Disk I/O UtilizationBecause the database resides on a set of disks, the performance of the I/O subsystem isvery important to the performance of the database. Important disk statistics includethe disk I/Os per second and the length of the service times. These statistics show if the disk is performing optimally or if the disk is being overworked. This sectiondescribes how to monitor disk I/O utilization.
To monitor disk I/O utilization:
1. From the Database Home page, click Performance.
The Performance page appears.
2. In the Host chart, click Load Average in the legend.
The Host page appears, showing the Performance subpage.
3. Select Disk Details from the View list.
The Disk Details view appears.
This view contains disk I/O utilization and service time statistics gathered overthe last hour, and the top disk devices ordered by busy percentage.
4. Verify the current disk I/O utilization using the Disk I/O Utilization chart.
See Also:
■ Oracle Database Administrator's Guide for information about usingAutomatic Memory Management
■ Oracle Database 2 Day DBA for information about using theMemory Advisor
■ Oracle Database Performance Tuning Guide for information aboutresolving memory issues

8/7/2019 Performance_Tunning
http://slidepdf.com/reader/full/performancetunning 68/190
Monitoring Host Activity
4-26 Oracle Database 2 Day + Performance Tuning Guide
The Disk I/O Utilization chart shows how many disk I/Os are being performedper second. The current value for total I/Os per second is displayed below thechart.
5. Click Total I/Os per Second.
The Total Disk I/O Per Second page appears.
This page contains disk utilization statistics and related alerts generated over thelast 24 hours.
In this example, an alert is not generated because a threshold is not defined.
If you notice an unexpected spike in this value that is sustained through standardworkload hours, then a disk I/O performance problem might exist and should beinvestigated.
6. Verify the current I/O service time using the Longest I/O Service Time chart.
The Longest I/O Service Time chart shows the longest service time for disk I/Osin milliseconds. The current value for longest I/O service time is displayed below
the chart.
7. Click Longest I/O Service Time.
The Longest Service Time page appears.
This page contains I/O service time statistics and related alerts generated over thelast 24 hours.
In this example, an alert is not generated because a threshold is not defined.

8/7/2019 Performance_Tunning
http://slidepdf.com/reader/full/performancetunning 69/190
Customizing the Database Performance Page
Monitoring Real-Time Database Performance 4-27
If you notice an unexpected spike in this value that is sustained through normalworkload hours, then a disk I/O performance problem might exist and should beinvestigated.
8. On the Disk Details page, verify the disk devices in the Top Disk Devices table.
If a particular disk is busy a high percentage of the time, then this disk should beinvestigated.
In this example, the drive that hosts Oracle Database (drive C) is only busy about2.82 percent of the time, and there does not appear to be a disk performanceproblem.
9. If a disk I/O performance problem is identified, you can attempt to resolve theproblem by doing the following:
■ Using Automatic Storage Management (ASM) to manage database storage
■ Striping everything across every disk to distribute I/O
■ Moving files such as archived redo logs and online redo logs to separate disks
■ Storing required data in memory to reduce the number of physical I/Os
Customizing the Database Performance Page
You can customize the Performance page so that it specifically addresses yourrequirements. As explained in "Monitoring Instance Activity" on page 4-10, you canspecify which charts you want to appear by default in the Performance page, and howyou want them to appear. You can also decide whether to include baseline values inthe Throughput and Services charts.
Enterprise Manager stores persistent customization information for each user in therepository. Enterprise Manager retrieves the customization data when you access thePerformance page and caches it for the remainder of the browser session until youchange the settings.
To customize the Performance page:
1. From the Database Home page, click Performance.
The Performance page appears.
2. On the Performance page, click Settings.
The Performance Page Settings page appears.
See Also:
■ Oracle Database Performance Tuning Guide for information aboutresolving disk I/O issues

8/7/2019 Performance_Tunning
http://slidepdf.com/reader/full/performancetunning 70/190
Customizing the Database Performance Page
4-28 Oracle Database 2 Day + Performance Tuning Guide
3. In the Detailed Chart Settings section, choose the defaults for display of theinstance activity charts. Complete the following steps:
a. In Default View, select the instance activity chart to appear by default in theAverage Active Session section.
See "Monitoring Instance Activity" on page 4-10 for a description of theThroughput, I/O, Parallel Execution, and Services charts.
b. In Throughput Chart Settings, select Per Second or Per Transaction as thedefault instance throughput rate to be displayed in the Throughput chart.
See "Monitoring Throughput" on page 4-11 to learn how to use theThroughput charts.
c. In I/O Chart Settings, select the default I/O breakdown to be displayed in theI/O chart.
See "Monitoring I/O" on page 4-12 to learn how to use the I/O charts.
4. In the Baseline Display section, choose how Automatic Workload Repository(AWR) baselines will be displayed in the performance charts. Do one of thefollowing:
■ Select Do not show the baseline values to prevent baselines from appearing.
■ Select Show the 99th percentile line using the system moving windowbaseline to specify a percentile to display for the Throughput and Servicescharts.
Note that the 99th percentile is a very high significance level.
■ Select Show the 99th percentile line using a static baseline with computedstatistics and then select a baseline name from the Baseline Name list.
Note that you can select only baselines that have undergone schedule statisticscomputation, as described in "Computing Threshold Statistics for Baselines" on page 8-6.
5. Click OK.
The Performance page reappears.
The charts are now displayed according to your customization settings.

8/7/2019 Performance_Tunning
http://slidepdf.com/reader/full/performancetunning 71/190
Monitoring Performance Alerts 5-1
5Monitoring Performance Alerts
Oracle Database includes a built-in alerts infrastructure to notify you of impendingproblems with the database. By default, Oracle Database enables the following alerts:
■ Tablespace Usage
■ Snapshot Too Old
■ Recovery Area Low on Free Space
■ Resumable Session Suspended
For information about alerts and how to manage them, see Oracle Database 2 Day DBA.
In addition to these default alerts, you can use performance alerts to detect anyunusual changes in database performance.
This chapter contains the following sections:
■ Setting Metric Thresholds for Performance Alerts
■ Responding to Alerts
■ Clearing Alerts
Setting Metric Thresholds for Performance AlertsA metric is defined as the rate of change in some cumulative statistic. This rate can bemeasured against a variety of units, including time, transactions, or database calls. Forexample, the number database calls per second is a metric.
Performance alerts are based on metrics that are performance-related. These alerts areeither environment-dependent or application-dependent.
Environment-dependent performance alerts may not be relevant on all systems. Forexample, the AVERAGE_FILE_READ_TIME metric generates an alert when the averagetime to read a file exceeds the metric threshold. This alert may be useful on a systemwith only one disk. On a system with multiple disks, however, the alert may not be
relevant because I/O processing is spread across the entire subsystem.Application-dependent performance alerts are typically relevant on all systems. Forexample, the BLOCKED_USERS metric generates a performance alert when the numberof users blocked by a particular session exceeds the metric threshold. This alert isrelevant regardless of how the environment is configured.
To obtain the most relevant information from performance alerts, set the thresholdvalues of performance metrics to values that represent desirable boundaries for yoursystem. You can then fine-tune these values over time until an equilibrium is reached.

8/7/2019 Performance_Tunning
http://slidepdf.com/reader/full/performancetunning 72/190
Responding to Alerts
5-2 Oracle Database 2 Day + Performance Tuning Guide
To set thresholds for performance metrics:
1. On the Database Home page, under Related Links, click Metric and PolicySettings.
The Metric and Policy Settings page appears, showing the Metric Thresholdssubpage.
2. For each performance metric relevant for your system, click the Edit icon.
The Edit Advanced Settings page appears.
3. Follow the steps of the wizard to set the threshold value.
Responding to AlertsWhen an alert is generated by Oracle Database, it appears under Alerts on theDatabase Home page.
Oracle Enterprise Manager enables you to configure alerts to be sent by means of e-mail, pager, or cellular phone text messaging.
To respond to an alert:
1. On the Database Home page, under Alerts, locate the alert that you want toinvestigate and click the Message link.
A page that contains further information about the alert appears.
2. Do one of the following:
■ Follow the recommendations.
■ Run Automatic Database Diagnostic Monitor (ADDM) or another advisor toget more detailed diagnostics of the system or object behavior.
Clearing AlertsMost alerts, such as the CPU Utilization alert, are cleared automatically when thecause of the problem disappears. However, other alerts, such as the Generic Alert LogError alert, must be acknowledged.
After taking the necessary corrective measures, you can acknowledge an alert byclearing or purging it. Clearing an alert sends the alert to the Alert History, which can
See Also:
■ "Setting Metric Thresholds for Baselines" on page 8-7
■ Oracle Database 2 Day DBA to learn how to set metric thresholds
See Also:
■ Oracle Database 2 Day DBA for information about how to configurethe alert notification method

8/7/2019 Performance_Tunning
http://slidepdf.com/reader/full/performancetunning 73/190
Clearing Alerts
Monitoring Performance Alerts 5-3
be viewed from the Database Home page under Related Links. Purging an alertremoves it from the Alert History.
To clear alerts:
1. On the Database Home page, under Diagnostic Summary, click the Alert Log link.
The Alert Log Errors page appears.
2. Do one of the following:
■ Select the alerts that you want to clear and click Clear.
■ To clear all open alerts, click Clear Every Open Alert.
3. Do one of the following:
■ Select the alerts that you want to purge and click Purge.
■ To purge all alerts, click Purge Every Alert.
See Also:
■ Oracle Database 2 Day DBA to learn how to manage alerts

8/7/2019 Performance_Tunning
http://slidepdf.com/reader/full/performancetunning 74/190
Clearing Alerts
5-4 Oracle Database 2 Day + Performance Tuning Guide

8/7/2019 Performance_Tunning
http://slidepdf.com/reader/full/performancetunning 75/190
Part IIIReactive Database Tuning
Part III describes how to tune Oracle Database in response to a reported problem, suchas when the user reports a performance problem with the database that must be tunedimmediately.
This part contains the following chapters:
■ Chapter 6, "Manual Database Performance Monitoring"
■ Chapter 7, "Resolving Transient Performance Problems"
■ Chapter 8, "Resolving Performance Degradation Over Time"

8/7/2019 Performance_Tunning
http://slidepdf.com/reader/full/performancetunning 76/190

8/7/2019 Performance_Tunning
http://slidepdf.com/reader/full/performancetunning 77/190
Manual Database Performance Monitoring 6-1
6Manual Database Performance Monitoring
You can run the Automatic Database Diagnostic Monitor (ADDM) manually tomonitor current and historical database performance. Typically, you use the automaticdiagnostic feature of ADDM to identify performance problems with the database. Asdescribed in Chapter 3, "Automatic Database Performance Monitoring", ADDM runsonce every hour by default. It is possible to configure ADDM to run more or lessfrequently. However, in some cases you may want to run ADDM manually.
One reason for running ADDM manually is to analyze a time period longer than oneADDM analysis period. For example, you may want to analyze database performancein a full workday by analyzing 8 consecutive hours of activity. One technique is toanalyze each of the individual ADDM analyses within this 8-hour period. However,this approach may become complicated if performance problems exist for only part of the 8-hour period, because they may appear in only some of the individual ADDManalyses. Alternatively, you can run ADDM manually with a pair of AutomaticWorkload Repository (AWR) snapshots that encompass the 8-hour period. In this case,ADDM will identify the most critical performance problems in the entire time period.
This chapter contains the following sections:
■ Manually Running ADDM to Analyze Current Database Performance
■ Manually Running ADDM to Analyze Historical Database Performance
■ Accessing Previous ADDM Results
Manually Running ADDM to Analyze Current Database PerformanceBy default, ADDM runs every hour to analyze snapshots taken by AWR during thisperiod. In some cases you may notice performance degradation that did not exist inthe previous ADDM analysis period, or a sudden spike in database activity on thePerformance page, as described in Chapter 4, "Monitoring Real-Time DatabasePerformance". If the next ADDM analysis is not scheduled to run for 30 minutes, thenyou may want to run ADDM manually to identify and resolve the performanceproblem.
When you run ADDM manually, a manual AWR snapshot is created automatically.This manual run may affect the ADDM run cycle. For example, if you scheduledADDM to run hourly at the start of each hour and the last ADDM run was at 8:00 p.m.,running ADDM manually at 8:30 p.m. will cause the next scheduled ADDM run tostart at 9:30 p.m., not 9:00 p.m. All subsequent ADDM runs will continue on the newrun cycle, occurring hourly at the half-hour instead of the start of each hour.
To analyze current database performance by manually running ADDM:
1. On the Database Home page, under Related Links, click Advisor Central.

8/7/2019 Performance_Tunning
http://slidepdf.com/reader/full/performancetunning 78/190
Manually Running ADDM to Analyze Current Database Performance
6-2 Oracle Database 2 Day + Performance Tuning Guide
The Advisor Central page appears.
2. Under Advisors, click ADDM.
The Run ADDM page appears.
In this example, CPU usage spiked in the last 10 minutes.
3. Select Run ADDM to analyze current instance performance and click OK.
The Confirmation page appears.4. Click Yes.
The Processing: Run ADDM Now page appears while the database takes a newAWR snapshot.
An ADDM run occurs for the time period between the new and the previoussnapshot. After ADDM completes the analysis, the Automatic Database DiagnosticMonitor (ADDM) page appears with the results.
5. Click View Report.
The View Report page appears.
6. Optionally, click Save to File to save the results of the ADDM task in a report forlater access.
See Also:
■ "Reviewing the Automatic Database Diagnostic Monitor Analysis" on page 3-7

8/7/2019 Performance_Tunning
http://slidepdf.com/reader/full/performancetunning 79/190
Manually Running ADDM to Analyze Historical Database Performance
Manual Database Performance Monitoring 6-3
Manually Running ADDM to Analyze Historical Database PerformanceYou can run ADDM manually to analyze historical database performance by selectinga pair or range of AWR snapshots as the analysis period. This technique is useful whenyou have identified a time period in the past when database performance was poor.
In the Performance page, you can monitor historical performance by selectingHistorical from the View Data list. In Historical view, you can monitor databaseperformance in the past, up to the duration defined by the AWR retention period. If you notice performance degradation, then you can drill down to appropriate pagesfrom the Performance page to identify historical performance problems with thedatabase, as described in Chapter 4, "Monitoring Real-Time Database Performance". If you identify a problem, then you can run ADDM manually to analyze a particulartime period.
To analyze historical database performance by manually running ADDM:
1. On the Database Home page, under Related Links, click Advisor Central.
The Advisor Central page appears.
2. Under Advisors, click ADDM.
The Run ADDM page appears.
3. Select Run ADDM to analyze past instance performance.
4. Specify a time period for analysis by selecting a pair of AWR snapshots. Completethe following steps:
a. Select Period Start Time.
b. Below the chart for the starting snapshot, click the snapshot you want to usefor the start time.
A play icon (displayed as an arrow) appears over the snapshot icon.
In this example, database activity peaked from 10 p.m. to 11 p.m., so the
snapshot taken at 10:00 p.m. is selected for the start time.c. Select Period End Time.
d. Below the chart for the ending snapshot, click the snapshot you want to usefor the end time.
A stop icon (displayed as a square) appears over the snapshot icon.
In this example, the snapshot taken at 10:00 p.m. is selected.
5. Click OK.

8/7/2019 Performance_Tunning
http://slidepdf.com/reader/full/performancetunning 80/190
Accessing Previous ADDM Results
6-4 Oracle Database 2 Day + Performance Tuning Guide
After ADDM completes the analysis, the Automatic Database Diagnostic Monitor(ADDM) page appears with the results of the ADDM run.
Figure 6–1 Analyzing Historical Database Performance
6. Click View Report.
The View Report page appears.
7. Optionally, click Save to File.
Accessing Previous ADDM ResultsIf you ran ADDM manually to analyze current or historical database performance, theresults are displayed on the Automatic Database Diagnostic Monitor (ADDM) pageafter the ADDM run has completed.
You can access the ADDM results at a later time, or access the ADDM results fromprevious executions.
To access the ADDM results:
1. On the Database Home page, under Related Links, click Advisor Central.
The Advisor Central page appears.2. Complete the following steps:
a. Under Advisor Tasks, select ADDM from the Advisory Type list.
b. Select the appropriate search criteria.
For example, you can select All in the Advisor Runs list to view all ADDMtasks.
c. Click Go.
See Also:
■ "Reviewing the Automatic Database Diagnostic Monitor Analysis" on page 3-7

8/7/2019 Performance_Tunning
http://slidepdf.com/reader/full/performancetunning 81/190
Accessing Previous ADDM Results
Manual Database Performance Monitoring 6-5
The ADDM tasks are displayed under Results.
3. To view an ADDM result, select the desired ADDM task and click View Result.
The results from the selected ADDM task are shown in the Automatic DatabaseDiagnostic Monitor (ADDM) page.
See Also:
■ "Reviewing the Automatic Database Diagnostic Monitor Analysis" on page 3-7

8/7/2019 Performance_Tunning
http://slidepdf.com/reader/full/performancetunning 82/190
Accessing Previous ADDM Results
6-6 Oracle Database 2 Day + Performance Tuning Guide

8/7/2019 Performance_Tunning
http://slidepdf.com/reader/full/performancetunning 83/190
Resolving Transient Performance Problems 7-1
7Resolving Transient Performance Problems
Transient performance problems are short-lived and do not appear in the AutomaticDatabase Diagnostic Monitor (ADDM) analysis. ADDM tries to report the mostsignificant performance problems during an analysis period in terms of their effect onDB time. If a problem lasts for a brief time, then its severity might be averaged out orminimized by other performance problems in the entire analysis period. Therefore, theproblem may not appear in the ADDM findings. Whether or not a performance
problem is captured by ADDM depends on its duration compared to the intervalbetween the Automatic Workload Repository (AWR) snapshots.
If a performance problem lasts for a significant portion of the time between snapshots,then it will be captured by ADDM. For example, if the snapshot interval is one hour, aperformance problem that lasts 30 minutes should not be considered a transientperformance problem because its duration represents a significant portion of thesnapshot interval and will likely be captured by ADDM.
On the other hand, a performance problem that lasts 2 minutes could be a transientperformance problem because its duration represents a small portion of the snapshotinterval and will likely not show up in the ADDM findings. For example, if the systemwas slow between 10:00 p.m. and 10:10 p.m., but the ADDM analysis for the timeperiod between 10:00 p.m. and 11:00 p.m. does not show a performance problem, a
transient performance problem may have occurred for only a few minutes of the10-minute interval reported by the user.
This chapter contains the following sections:
■ Overview of Active Session History
■ Running Active Session History Reports
■ Active Session History Reports
Overview of Active Session HistoryTo capture a detailed history of database activity, Oracle Database samples active
sessions each second with the Active Session History (ASH) sampler. The AutomaticWorkload Repository (AWR) snapshot processing collects the sampled data intomemory and writes it to persistent storage. ASH is an integral part of the OracleDatabase self-management framework and is extremely useful for diagnosingperformance problems.
Unlike instance-level statistics gathered by AWR, sampled data is gathered at thesession level by ASH. By capturing statistics for only active sessions, a manageable setof data is represented. The size of this data is directly related to the work beingperformed, rather than to the entire database instance.

8/7/2019 Performance_Tunning
http://slidepdf.com/reader/full/performancetunning 84/190
Running Active Session History Reports
7-2 Oracle Database 2 Day + Performance Tuning Guide
Sampled data captured by ASH can be aggregated based on the various dimensionsthat it captures, including the following:
■ SQL identifier of a SQL statement
■ Object number, file number, and block number
■ Wait event identifier and parameters
■ Session identifier and session serial number
■ Module and action name
■ Client identifier of the session
■ Service hash identifier
You can run ASH reports to analyze transient performance problems with the databasethat only occur during specific times. This technique is especially useful when you aretrying to do either of the following:
■ Resolve transient performance problems that may last for only a short period of time, such as why a particular job or session is not responding when the rest of theinstance is performing as usual
■ Perform scoped or targeted performance analysis by various dimensions or theircombinations, such as time, session, module, action, or SQL identifier
Running Active Session History ReportsThis section describes how to generate ASH reports using Oracle Enterprise Manager(Enterprise Manager).
To run ASH reports:
1. On the Performance page, under Average Active Sessions, click Run ASH Report.
The Run ASH Report page appears.
2. Enter the date and time for the start and end of the time period when the transientperformance problem occurred.
In this example, database activity increased between 1:45 p.m. and 2:00 p.m., so anASH report needs to be created for that time period.
3. Click Generate Report.
The Processing: View Report page appears while the report is being generated.
After the report is generated, the ASH report appears under Report Results on theRun ASH Report page.
See Also:
■ "Active Session History Statistics" on page 2-4

8/7/2019 Performance_Tunning
http://slidepdf.com/reader/full/performancetunning 85/190
Active Session History Reports
Resolving Transient Performance Problems 7-3
4. Optionally, click Save to File to save the report in HTML for future analysis.
Active Session History ReportsYou can use an ASH report to identify the source of transient performance problems.The report is divided into titled sections. The following sections of the ASH report area useful place to begin the investigation:
■
Top Events■ Load Profile
■ Top SQL
■ Top Sessions
■ Top DB Objects
■ Top DB Files
■ Activity Over Time
Top EventsThe Top Events section of the report describes the top wait events of the sampledsession activity categorized by user, background, and priority. Use this information toidentify the wait events that may be the cause of the transient performance problem.
The Top Events section of the report contains the following subsections:
■ Top User Events
See Also:
■ Oracle Database Performance Tuning Guide for more detailed
information about the ASH report

8/7/2019 Performance_Tunning
http://slidepdf.com/reader/full/performancetunning 86/190
Active Session History Reports
7-4 Oracle Database 2 Day + Performance Tuning Guide
■ Top Background Events
Top User Events
The Top User Events subsection of the report lists the top wait events from userprocesses that accounted for the highest percentages of sampled session activity.
The example in Figure 7–1 shows that 84 percent of database activity is consumed by
the CPU + Wait for CPU event. In this example, the Load Profile section should beexamined next to determine the type of activity that is causing this wait event.
Figure 7–1 Top User Events
Top Background Events
The Top Background Events subsection of the report lists the top wait events from the
background events that accounted for the highest percentages of sampled sessionactivity.
The example in Figure 7–2 shows that 17.65 percent of sampled session activity isconsumed by the CPU + Wait for CPU event.
Figure 7–2 Top Background Events
Load ProfileThe Load Profile section of the report describes the load analyzed in the sampledsession activity. Use the information in this section to identify the service, client, orSQL command type that may be the cause of the transient performance problem. TheTop Service/Module subsection lists the services and modules that accounted for thehighest percentages of sampled session activity.
The example in Figure 7–3 shows that 81 percent of database activity is consumed bythe SYS$USERS service running the SQL*Plus module. In this example, it appears thatthe user is running a high-load SQL statement that is causing the performanceproblem indicated in Figure 7–1. The Top SQL section of the report should be
analyzed next to determine whether a particular type of SQL statement makes up theload.
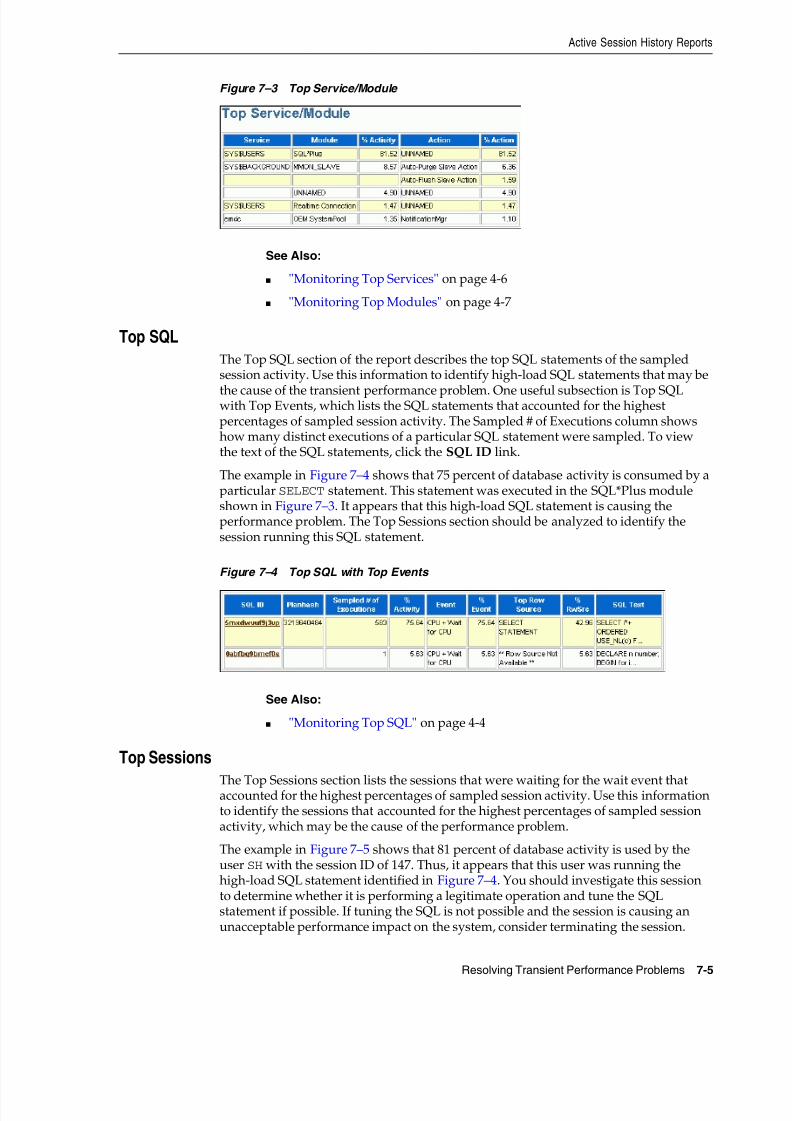
8/7/2019 Performance_Tunning
http://slidepdf.com/reader/full/performancetunning 87/190
Active Session History Reports
Resolving Transient Performance Problems 7-5
Figure 7–3 Top Service/Module
Top SQL
The Top SQL section of the report describes the top SQL statements of the sampledsession activity. Use this information to identify high-load SQL statements that may be
the cause of the transient performance problem. One useful subsection is Top SQLwith Top Events, which lists the SQL statements that accounted for the highestpercentages of sampled session activity. The Sampled # of Executions column showshow many distinct executions of a particular SQL statement were sampled. To viewthe text of the SQL statements, click the SQL ID link.
The example in Figure 7–4 shows that 75 percent of database activity is consumed by aparticular SELECT statement. This statement was executed in the SQL*Plus moduleshown in Figure 7–3. It appears that this high-load SQL statement is causing theperformance problem. The Top Sessions section should be analyzed to identify thesession running this SQL statement.
Figure 7–4 Top SQL with Top Events
Top Sessions
The Top Sessions section lists the sessions that were waiting for the wait event thataccounted for the highest percentages of sampled session activity. Use this informationto identify the sessions that accounted for the highest percentages of sampled sessionactivity, which may be the cause of the performance problem.
The example in Figure 7–5 shows that 81 percent of database activity is used by theuser SH with the session ID of 147. Thus, it appears that this user was running thehigh-load SQL statement identified in Figure 7–4. You should investigate this sessionto determine whether it is performing a legitimate operation and tune the SQLstatement if possible. If tuning the SQL is not possible and the session is causing anunacceptable performance impact on the system, consider terminating the session.
See Also:
■ "Monitoring Top Services" on page 4-6
■ "Monitoring Top Modules" on page 4-7
See Also:
■ "Monitoring Top SQL" on page 4-4

8/7/2019 Performance_Tunning
http://slidepdf.com/reader/full/performancetunning 88/190
Active Session History Reports
7-6 Oracle Database 2 Day + Performance Tuning Guide
Figure 7–5 Top Sessions
Top DB ObjectsThe Top DB Objects subsection lists the database objects (such as tables and indexes)that accounted for the highest percentages of sampled session activity.
The example in Figure 7–6 shows that the objects accounting for the most sessionactivity are in the SYSTEM and SYSAUX tablespaces. In each row of the table, the eventis db file sequential read, which signifies that a user process is reading abuffer into the system global area (SGA) buffer cache and is waiting for a physical I/Ocall to return.
Figure 7–6 Top DB Objects
Top DB Files
The Top DB Files subsection lists the database files that accounted for the highestpercentages of sampled session activity.
The example in Figure 7–7 shows that most of the session activity involves the datafilein the SYSTEM tablespace. This information is consistent with Figure 7–6, which showsthat the objects accounting for the most session activity are located in the SYSTEM and
SYSAUX tablespaces.
Figure 7–7 Top DB Files
See Also:
■ "Monitoring Top Sessions" on page 4-5
■ Chapter 10, "Tuning SQL Statements"

8/7/2019 Performance_Tunning
http://slidepdf.com/reader/full/performancetunning 89/190
Active Session History Reports
Resolving Transient Performance Problems 7-7
Activity Over TimeThe Activity Over Time section of the ASH report is particularly useful for longer timeperiods because it provides in-depth details about activities and workload profilesduring the analysis period. The Activity Over Time section is divided into multipletime slots.
Figure 7–8 Activity Over Time
Each of the time slots contains information regarding that particular time slot, asdescribed in Table 7–1.
All inner slots are 2 minutes each and can be compared to each other. The first and lastslots, which are also called the outer slots, are odd-sized because they are the only slotsthat do not have a fixed slot time.
When comparing the inner slots, perform a skew analysis by identifying spikes in theEvent Count and Slot Count columns. A spike in the Event Count column indicates anincrease in the number of sampled sessions waiting for a particular event. A spike inthe Slot Count column indicates an increase in active sessions, because ASH data issampled from active sessions only and a relative increase in database workload.Typically, when the number of active session samples and the number of sessions
Table 7–1 Activity Over Time
Column Description
Slot Time (Duration) Duration of the slot
Slot Count Number of sampled sessions in the slot
Event Top three wait events in the slot
Event Count Number of ASH samples waiting for the wait event
% Event Percentage of ASH samples waiting for wait events in the entireanalysis period

8/7/2019 Performance_Tunning
http://slidepdf.com/reader/full/performancetunning 90/190
Active Session History Reports
7-8 Oracle Database 2 Day + Performance Tuning Guide
associated with a wait event increase, the slot may be the cause of the transientperformance problem.
The example in Figure 7–8 indicates that the number of sampled sessions rose sharplyin the first inner slot and fell sharply in the last inner slot. The slot count and eventcount peaked in the 13:54 p.m. time slot.

8/7/2019 Performance_Tunning
http://slidepdf.com/reader/full/performancetunning 91/190
Resolving Performance Degradation Over Time 8-1
8Resolving Performance Degradation OverTime
Performance degradation of the database over time happens when your database wasperforming optimally in the past, such as 6 months ago, but has gradually degraded toa point where it becomes noticeable to the users. The Automatic Workload Repository(AWR) Compare Periods report enables you to compare database performance
between two periods of time.While an AWR report shows AWR data between two snapshots (or two points intime), the AWR Compare Periods report shows the difference between two periods (ortwo AWR reports, which equates to four snapshots). Using the AWR Compare Periodsreport helps you to identify detailed performance attributes and configuration settingsthat differ between two time periods. The two time periods selected for the AWRCompare Periods report can be of different durations. The report normalizes thestatistics by the amount of time spent on the database for each time period andpresents statistical data ordered by the largest difference between the periods.
For example, a batch workload that historically completed in the maintenance windowbetween 10:00 p.m. and midnight is currently showing poor performance andcompleting at 2 a.m. You can generate an AWR Compare Periods report from 10:00
p.m. to midnight on a day when performance was good and from 10:00 a.m. to 2 a.m.on a day when performance was poor. The comparison of these reports should identifyconfiguration settings, workload profile, and statistics that were different in these twotime periods. Based on the differences identified, you can more easily diagnose thecause of the performance degradation.
This chapter contains the following sections:
■ Managing Baselines
■ Running the AWR Compare Periods Reports
■ Using the AWR Compare Periods Reports
Managing BaselinesBaselines are an effective way to diagnose performance problems. AWR supports thecapture of baseline data by enabling you to specify and preserve a pair or a range of snapshots as a baseline. The snapshots contained in a baseline are excluded from theautomatic AWR purging process and are retained indefinitely.
See Also:
■ "Gathering Database Statistics Using the Automatic WorkloadRepository" on page 2-1

8/7/2019 Performance_Tunning
http://slidepdf.com/reader/full/performancetunning 92/190
Managing Baselines
8-2 Oracle Database 2 Day + Performance Tuning Guide
A moving window baseline corresponds to all AWR data that exists within the AWRretention period. Oracle Database automatically maintains a system-defined movingwindow baseline. The default size of the window is the current AWR retention period,which by default is 8 days.
This section contains the following topics:
■ Creating a Baseline
■ Deleting a Baseline
■ Computing Threshold Statistics for Baselines
■ Setting Metric Thresholds for Baselines
Creating a BaselineBefore creating a baseline, carefully consider the time period you choose as a baselinebecause it should represent the database operating at an optimal level. In the future,you can compare these baselines with other baselines or snapshots captured duringperiods of poor performance to analyze performance degradation over time.
You can create the following types of baseline:
■ Creating a Single Baseline
■ Creating a Repeating Baseline
Creating a Single Baseline
A single baseline is captured at a single, fixed time interval. For example, a singlebaseline may be captured on March 5, 2007 from 5:00 p.m. to 8:00 p.m.
You can choose a start time and an end time that are in the future to create a baselinethat captures future database activity. If both the start time and the end time are in thefuture, a baseline template with the same name as the baseline will also be created. Abaseline template is a specification that enables Oracle Database to automatically
generate a baseline for a future time period.
To create a single baseline:
1. From the Database Home page, click Server.
The Server subpage appears.
2. Under Statistics Management, click AWR Baselines.
The AWR Baselines page appears with a list of existing baselines displayed.
3. Click Create.
The Create Baseline: Baseline Interval Type page appears.
4. Select Single.

8/7/2019 Performance_Tunning
http://slidepdf.com/reader/full/performancetunning 93/190
Managing Baselines
Resolving Performance Degradation Over Time 8-3
5. Click Continue.
The Create Baseline: Single Baseline page appears.
6. In the Baseline Name field, enter a name for the baseline.
7. Under Baseline Interval, select whether to use a snapshot range or a time range forthe baseline. Do one of the following:
■
To use a snapshot range, selectSnapshot Range
. Complete the followingsteps:
– Optionally, to view older snapshots that are not displayed below theActive Sessions chart, expand Change Chart Time Period. Enter thedesired start date in the Chart Start Date field and the desired end date inthe Chart End Date field, and click Go.
– Under Select Time Period, select a start time for the baseline by selectingPeriod Start Time and the snapshot icon below the Active Sessions chartthat corresponds to the desired start time.
– Select an end time for the baseline by selecting Period End Time and thesnapshot icon below the Active Sessions chart that corresponds to thedesired end time.
In this example, a snapshot range on March 5, 2007 from 5:00 p.m. to 8:00 p.m.is selected.

8/7/2019 Performance_Tunning
http://slidepdf.com/reader/full/performancetunning 94/190
Managing Baselines
8-4 Oracle Database 2 Day + Performance Tuning Guide
■ To use a time range, select Time Range. Complete the following steps:
– In the Start Time fields, select a start time for the baseline.
– In the End Time fields, select an end time for the baseline.
In this example, a time range from 5:00 p.m. to 8:00 p.m. on March 5, 2007 isselected.
8. Click Finish.
The AWR Baselines page reappears with the newly created baseline displayed.
Creating a Repeating Baseline
A repeating baseline is a baseline that repeats during a time interval over a specificperiod. For example, a repeating baseline may repeat every Monday from 5:00 p.m. to8:00 p.m. for the year 2007.
To create a repeating baseline:
1. From the Database Home page, click Server.
The Server subpage appears.
2. Under Statistics Management, click AWR Baselines.
The AWR Baselines page appears with a list of existing baselines displayed.
3. Click Create.
The Create Baseline: Baseline Interval Type page appears.
4. Select Repeating and then click Continue.
The Create Baseline: Repeating Baseline Template page appears.
5. In the Baseline Name Prefix field, enter a name prefix for the baseline.

8/7/2019 Performance_Tunning
http://slidepdf.com/reader/full/performancetunning 95/190
Managing Baselines
Resolving Performance Degradation Over Time 8-5
6. Under Baseline Time Period, specify the time of the day that you want the baselineto begin collecting AWR data and the duration of the baseline collection.
7. Under Frequency, do one of the following:
■ Select Daily if you want the baseline to repeat on a daily basis.
■ Select Weekly if you want the baseline to repeat on a weekly basis and select
the day of the week on which the baseline will repeat.8. Under Interval of Baseline Creation, complete the following steps:
a. In the Start Time fields, select a date and time in the future when the datacollection should begin.
b. In the End Time fields, select a date and time in the future when the datacollection should end.
9. Under Purge Policy, enter the number of days to retain baselines that have beencaptured.
10. Click Finish.
A baseline template with the same name as the baseline name prefix will also be
created. A baseline template is a specification that enables Oracle Database toautomatically generate a baseline for a future time period.
In this example, a repeating baseline that repeats weekly on Mondays from 5:00p.m. to 8:00 p.m. for the year 2007 will be created.
Deleting a BaselineTo conserve storage space, you may want to periodically delete unused baselinesstored in the database.
To delete a baseline:1. From the Database Home page, click Server.
The Server subpage appears.
2. Under Statistics Management, click AWR Baselines.
The AWR Baselines page appears with a list of existing baselines displayed.
3. Select a baseline and click Delete.
The Confirmation page appears.

8/7/2019 Performance_Tunning
http://slidepdf.com/reader/full/performancetunning 96/190
Managing Baselines
8-6 Oracle Database 2 Day + Performance Tuning Guide
4. Select whether to purge the underlying data associated with the baseline.
The underlying data includes the individual snapshots preserved in the baselineand any statistics that are computed for the baseline. Do one of the following:
■ To delete the underlying data, select Purge the underlying data associatedwith the baseline.
■
To preserve the underlying data, select Do not purge the underlying dataassociated with the baseline.
5. Click Yes.
The AWR Baselines page reappears. A message informs you that the baseline wasdeleted successfully.
Computing Threshold Statistics for Baselines
Computing threshold statistics for baselines enables you to graphically display thecomputed statistics in the charts on the Performance page.
To compute threshold statistics for baselines:
1. From the Database Home page, click Server.
The Server subpage appears.
2. Under Statistics Management, click AWR Baselines.
The AWR Baselines page appears with a list of existing baselines displayed.
3. Select the baseline for which you want to compute statistics.
Select a baseline that does not already have computed statistics. These baselinesare identified by No in the Statistics Computed column.
4. From the Actions list, select Schedule Statistics Computation, and then click Go.
The Compute Threshold Statistics page appears.
5. In the Name field, enter a name for the task.
Alternatively, you can choose to use the system-generated name.

8/7/2019 Performance_Tunning
http://slidepdf.com/reader/full/performancetunning 97/190
Managing Baselines
Resolving Performance Degradation Over Time 8-7
6. In the Description field, enter a description for the task.
Alternatively, you can choose to use the system-generated description.
7. Under Start, do one of the following:
■ Select Immediately to run the task immediately after it has been submitted.
■ Select Later to run the task at a later time as specified using the Date and Time
fields.
8. Click Submit.
The AWR Baselines page appears. A message informs you that statisticscomputation has been scheduled for the selected baseline.
Setting Metric Thresholds for BaselinesAs explained in "Setting Metric Thresholds for Performance Alerts" on page 5-1, ametric is the rate of change in a cumulative statistic. Alerts notify you when particularmetric thresholds are crossed. When the metric thresholds are crossed, the system is inan undesirable state. You can edit the threshold settings for baseline metrics.
You can create the following types of baseline:
■ Setting Metric Thresholds for the Default Moving Baseline
■ Setting Metric Thresholds for Selected Baselines
Setting Metric Thresholds for the Default Moving BaselineThis section describes the easiest technique for setting the metric thresholds for thedefault moving baseline. You can choose a group of basic metric threshold settingsbased on common database workload profiles: OLTP, data warehousing, and OLTPwith nighttime batch jobs. After choosing a workload profile, you can expand orchange the threshold values as needed.
To set metric thresholds for the default moving baseline:
1. On the Database Home page, under Related Links, click Baseline MetricThresholds.
The Threshold Configuration tab of the Baseline Metric Thresholds page appears.
2. Click Quick Configuration.The Quick Configuration: Baseline Metric Thresholds page appears.
3. In Workload Profile, select one of the following options, depending on how youare using the database:
■ Primarily OLTP (pure transaction processing 24 hours a day)
■ Primarily Data Warehousing (query and load intensive)
■ Alternating (OLTP during the daytime and batch during the nighttime)
See Also:
■ "Customizing the Database Performance Page" on page 4-27 forinformation about displaying computed statistics on thePerformance page
■ Oracle Database 2 Day DBA for information about thresholds andhow to manage them

8/7/2019 Performance_Tunning
http://slidepdf.com/reader/full/performancetunning 98/190
Managing Baselines
8-8 Oracle Database 2 Day + Performance Tuning Guide
In this example, select Primarily OLTP.
4. Click Continue.
The Quick Configuration: Review OLTP Threshold Settings page appears.
5. Review the metric threshold settings and click Finish.
You are returned to the Baseline Metric Thresholds page, with the ThresholdConfiguration tab selected. The metric threshold settings are displayed.
Setting Metric Thresholds for Selected Baselines
This section explains how to select a baseline and edit its thresholds. You can configurethe type of threshold, for example, whether it is based on significance levels,percentage of maximum values, or fixed values. You can also configure the thresholdlevels that determine when the system generates critical alerts and warnings.
You can edit thresholds for the default moving baseline or a baseline that you createdin the AWR Baselines page. You can select a baseline in the Edit Thresholds page afteryou have scheduled statistics computation from the AWR Baselines page and thestatistics have finished computing on the static baseline.
To set a metric threshold for the default moving baseline:
1. On the Database Home page, under Related Links, click Baseline MetricThresholds.
The Threshold Configuration tab of the Baseline Metric Thresholds page appears.
2. In the View list, select Basic Metrics.
The Baseline Metric Thresholds page appears.
3. In the Category/Name column, click the link for the metric whose threshold youwant to set or change. For example, click Number of Transactions (per second).
The Edit Thresholds: Number of Transactions (per second) appears.

8/7/2019 Performance_Tunning
http://slidepdf.com/reader/full/performancetunning 99/190
Running the AWR Compare Periods Reports
Resolving Performance Degradation Over Time 8-9
The charts on this page provide thumbnail and detailed views of metric activityfor a 24-hour period. In the top thumbnail chart, click a day to view the value of the metric plotted against a 24-hour period.
4. Under AWR Baseline, in the Name list, select either the defaultSYSTEM_MOVING_WINDOW or the name of a baseline created in the AWRBaselines page.
A baseline appears in the AWR Baseline list after you have scheduled statisticscomputation from the AWR Baselines page and the statistics have finishedcomputing on the static baseline.
In this example, select AWR_BASELINES_2007.
The page refreshes to show the charts for the baseline that you selected.
5. In the Threshold Settings section, complete the following steps:
a. In Threshold Type, leave Significance Level selected.
b. In Critical, select Extreme.
c. In Warning, select Very High.
d. In Occurrences, leave the current value.
6. Click Apply Thresholds.You are returned to the Baseline Metric Thresholds page. This page shows thealtered metric threshold settings.
Running the AWR Compare Periods ReportsThis section describes how to run the Automatic Workload Repository (AWR)Compare Periods reports using Oracle Enterprise Manager.

8/7/2019 Performance_Tunning
http://slidepdf.com/reader/full/performancetunning 100/190
Running the AWR Compare Periods Reports
8-10 Oracle Database 2 Day + Performance Tuning Guide
You can use AWR Compare Periods reports to compare the database performancebetween two time periods by:
■ Comparing a Baseline to Another Baseline or Pair of Snapshots
■ Comparing Two Pairs of Snapshots
Comparing a Baseline to Another Baseline or Pair of SnapshotsWhen performance degradation happens to a database over time, you should run theAWR Compare Periods report to compare the degraded performance, captured as anew baseline or a pair of snapshots, to an existing baseline. You will need a baselinethat represents the system operating at an optimal level. If an existing baseline is notavailable, then you can compare database performance between two periods of timeby using two arbitrary pairs of snapshots, as described in "Comparing Two Pairs of Snapshots" on page 8-12.
To compare a baseline to another baseline:
1. From the Database Home page, click Server.
The Server subpage appears.
2. Under Statistics Management, click Automatic Workload Repository.
The Automatic Workload Repository page appears.
3. Under Manage Snapshots and Baselines, click the link next to Baselines.
The AWR Baselines page appears.
4. Complete the following steps:
a. Select the baseline to use for the report.
At least one existing baseline must be available.
b. From the Actions list, select Compare Periods and click Go.
The Compare Periods: Second Period Start page appears. Under First Period, theselected baseline is displayed.

8/7/2019 Performance_Tunning
http://slidepdf.com/reader/full/performancetunning 101/190
Running the AWR Compare Periods Reports
Resolving Performance Degradation Over Time 8-11
In this example, the baseline named AWR_BASELINE_2007 is selected.
5. Compare the baseline selected in the first period to another baseline or a pair of
snapshots. Do one of the following:■ To compare to another baseline, select Select a Baseline and the baseline you
want to use in the second period, and then click Next.
In this example, the baseline named SYSTEM_MOVING_WINDOW is selected.
The Compare Periods: Review page appears. Go to Step 7.
■ To compare to a pair of snapshots, select Select Beginning Snapshot and thebeginning snapshot to use in the second period, and then click Next.
In this example, snapshot 102, taken on March 22, 2007 at 5:00 p.m., is selected.
The Compare Periods: Second Period End appears. Proceed to the next step.
6. Select the ending snapshot for the snapshot period that will be included in thereport and click Next.
In this example, snapshot 103, taken on March 22, 2007 at 5:30 p.m., is selected.
The Compare Periods: Review page appears.

8/7/2019 Performance_Tunning
http://slidepdf.com/reader/full/performancetunning 102/190
Running the AWR Compare Periods Reports
8-12 Oracle Database 2 Day + Performance Tuning Guide
7. Review the periods to be included in the report and click Finish.
The Compare Periods: Results page appears.
Data from the selected periods appears under the General subpage. You can viewdata per second or per transaction by selecting an option from the View Data list.
In this example, parse time in the second period is much higher than the first.
8. Click Report to view the report.
The Processing: View Report page appears while the report is being generated.After it completes, the report will appear. To change periods, click ChangePeriods. To save the report as an HTML file, click Save to File.
Comparing Two Pairs of SnapshotsIf an existing baseline is not available, then you can compare the database performanceby using two arbitrary pairs of snapshots, one pair taken when the database is
See Also:
■ "Creating a Baseline" on page 8-2
■ "Using the AWR Compare Periods Reports" on page 8-15

8/7/2019 Performance_Tunning
http://slidepdf.com/reader/full/performancetunning 103/190
Running the AWR Compare Periods Reports
Resolving Performance Degradation Over Time 8-13
performing optimally, and another pair when the database is performing poorly. Atleast four existing snapshots must be available.
To compare performance using two pairs of snapshots:
1. From the Database Home page, click Server.
The Server subpage appears.
2. Under Statistics Management, click Automatic Workload Repository.
The Automatic Workload Repository page appears.
3. Under Manage Snapshots and Baselines, click the link next to Snapshots.
The Snapshots page appears.
4. From the Go To Time list, select the time for the starting snapshot and click Go.
This action filters the snapshots and displays only the snapshot taken at the startof the comparison period. The time in this example is 5:00 p.m. on March 21, 2007.
5. Under Select Beginning Snapshot, select the starting point for the first snapshotperiod to be included in the report.
In this example, snapshot 53, taken on Mar 21, 2007 5:00 p.m., is selected.
6. From the Actions list, select Compare Periods and click Go.

8/7/2019 Performance_Tunning
http://slidepdf.com/reader/full/performancetunning 104/190
Running the AWR Compare Periods Reports
8-14 Oracle Database 2 Day + Performance Tuning Guide
The Compare Periods: First Period End page appears.
7. Select the ending point for the first snapshot period to be included in the reportand click Next.
In this example, snapshot 55, taken on Mar 21, 2007 6:00 p.m., is selected.
The Compare Periods: Second Period Start page appears.
8. Select the starting point for the second snapshot period to be included in thereport and click Next.
In this example, snapshot 104, taken on March 22, 2007 at 6:00 p.m., is selected.
The Compare Periods: Second Period End page appears.9. Select the end point for the second period that will be included in the report and
click Next.
In this example, snapshot 106, taken on March 22, 2007 at 7:00 p.m., is selected.
The Compare Periods: Review page appears.
10. Review the selected periods that will be included in the report and click Finish.
The Compare Periods: Results page appears.
Data from the selected periods appears under the General subpage. You can viewdata per second or per transaction by selecting an option from the View Data list.

8/7/2019 Performance_Tunning
http://slidepdf.com/reader/full/performancetunning 105/190
Using the AWR Compare Periods Reports
Resolving Performance Degradation Over Time 8-15
In this example, the first period shows significantly more activity, especially insession reads, than the second period.
11. To view the report, click the Report tab.
The Processing: View Report page appears while the report is being generated.After it completes, the report will appear. To change periods, click ChangePeriods. To save the report as an HTML file, click Save to File.
Using the AWR Compare Periods ReportsAfter an AWR Compare Periods report is generated for the time periods you want tocompare, you can use it to perform an analysis of performance degradation withOracle Database that may have happened over time. To learn how to generate AWRCompare Periods reports, see "Running the AWR Compare Periods Reports" onpage 8-9.
Figure 8–1 shows an example of an AWR Compare Periods report.

8/7/2019 Performance_Tunning
http://slidepdf.com/reader/full/performancetunning 106/190
Using the AWR Compare Periods Reports
8-16 Oracle Database 2 Day + Performance Tuning Guide
Figure 8–1 AWR Compare Periods Report
The AWR Compare Periods report is divided into the following sections:
■ Summary of the AWR Compare Periods Report
■ Details of the AWR Compare Periods Report
■ Supplemental Information in the AWR Compare Periods Report
Summary of the AWR Compare Periods ReportThe report summary is at the beginning of the AWR Compare Periods report, andsummarizes information about the snapshot sets and loads used in the report. Thereport summary contains the following sections:
■ Snapshot Sets
■ Host Configuration Comparison
■ System Configuration Comparison
■ Load Profile
■ Top Timed Events
Snapshot Sets
The Snapshot Sets section displays information about the snapshot sets used for thisreport, such as instance, host, and snapshot information.

8/7/2019 Performance_Tunning
http://slidepdf.com/reader/full/performancetunning 107/190
Using the AWR Compare Periods Reports
Resolving Performance Degradation Over Time 8-17
In the example shown in Figure 8–1 on page 8-16, the first snapshot periodcorresponds to the time when performance was stable on March 21, 2007 from 1:59p.m. to 4:00 p.m. The second snapshot period corresponds to the time whenperformance degradation occurred on March 22, 2007 from 9:00 p.m. to 11:00 p.m.
Host Configuration Comparison
The Host Configuration Comparison section compares the host configurations used inthe two snapshot sets. For example, the report compares physical memory andnumber of CPUs. Any differences in the configurations are quantified as percentagesin the %Diff column.
System Configuration Comparison
The System Configuration Comparison section compares the database configurationsused in the two snapshot sets. For example, the report compares the SGA and logbuffer size. Any differences in the configurations are quantified as percentages in the%Diff column.
Load Profile
The Load Profile section compares the loads used in the two snapshot sets. Anydifferences in the loads are quantified as percentages in the %Diff column.
Top Timed Events
The Top 5 Timed Events section displays the five timed events or operations thatconsumed the highest percentage of total DB time in each of the snapshot sets.

8/7/2019 Performance_Tunning
http://slidepdf.com/reader/full/performancetunning 108/190
Using the AWR Compare Periods Reports
8-18 Oracle Database 2 Day + Performance Tuning Guide
In this example, CPU time is over eight times higher in the second period than in thefirst. The number of waits for the db file sequential read event in the secondperiod is over double the number in the first.
Details of the AWR Compare Periods Report
The details section follows the summary of the AWR Compare Periods report, andprovides statistics about the snapshot sets and loads used in the report. For example,
the section includes statistics for database time, wait events, SQL execution time, andinstance activity.
Supplemental Information in the AWR Compare Periods ReportThe supplemental information is at the end of the AWR Compare Periods report, andprovides additional information about initialization parameters and SQL statements.The init.ora Parameters section lists all the initialization parameter values for the firstsnapshot set. The Complete List of SQL Text section lists each statement by SQL IDand shows the text of the SQL statement.

8/7/2019 Performance_Tunning
http://slidepdf.com/reader/full/performancetunning 109/190
Part IVSQL Tuning
Part IV describes how to effectively tune SQL statements and contains the followingchapters:
■ Chapter 9, "Identifying High-Load SQL Statements"
■ Chapter 10, "Tuning SQL Statements"
■ Chapter 11, "Optimizing Data Access Paths"
■ Chapter 12, "Analyzing SQL Performance Impact"

8/7/2019 Performance_Tunning
http://slidepdf.com/reader/full/performancetunning 110/190

8/7/2019 Performance_Tunning
http://slidepdf.com/reader/full/performancetunning 111/190
Identifying High-Load SQL Statements 9-1
9Identifying High-Load SQL Statements
High-load SQL statements may consume a disproportionate amount of systemresources. These SQL statements often cause a large impact on database performanceand must be tuned to optimize their performance and resource consumption. Evenwhen a database itself is properly tuned, inefficient SQL statements can significantlydegrade database performance.
Identifying high-load SQL statements is an important SQL tuning activity that youmust perform regularly. Automatic Database Diagnostic Monitor (ADDM) automatesthis task by proactively identifying potential high-load SQL statements. Additionally,you can use Oracle Enterprise Manager (Enterprise Manager) to identify high-loadSQL statements that require further investigation. After you have identified thehigh-load SQL statements, you can tune them with SQL Tuning Advisor and SQLAccess Advisor.
This chapter describes how to identify high-load SQL statements and contains thefollowing sections:
■ Identification of High-Load SQL Statements Using ADDM Findings
■ Identifying High-Load SQL Statements Using Top SQL
Identification of High-Load SQL Statements Using ADDM FindingsBy default, ADDM runs proactively once every hour. It analyzes key statistics gatheredby the Automatic Workload Repository (AWR) over the last hour to identify anyperformance problems, including high-load SQL statements. When the system findsperformance problems, it displays them as ADDM findings in the Automatic DatabaseDiagnostic Monitor (ADDM) page.
ADDM provides recommendations with each ADDM finding. When a high-load SQLstatement is identified, ADDM gives appropriate recommendations, such as runningSQL Tuning Advisor on the SQL statement. You can begin tuning as described inChapter 10, "Tuning SQL Statements".
See Also:
■ "Overview of Automatic Database Diagnostic Monitor" onpage 3-1
■ "Interpretation of Automatic Database Diagnostic MonitorFindings" on page 3-8
■ "Implementing Automatic Database Diagnostic MonitorRecommendations" on page 3-9

8/7/2019 Performance_Tunning
http://slidepdf.com/reader/full/performancetunning 112/190
Identifying High-Load SQL Statements Using Top SQL
9-2 Oracle Database 2 Day + Performance Tuning Guide
Identifying High-Load SQL Statements Using Top SQLADDM automatically identifies high-load SQL statements that may be causingsystemwide performance degradation. Under normal circumstances, manualidentification of high-load SQL statements is not necessary. In some cases, however,you may want to monitor SQL statements at a more granular level. The Top SQLsection of the Top Activity page in Enterprise Manager enables you to identify
high-load SQL statements for any 5-minute interval.Figure 9–1 shows an example of the Top Activity page.
Figure 9–1 Top Activity Page
To access the Top Activity page:
1. From the Database Home page, click Performance.
The Performance page appears.
2. Under Additional Monitoring Links, click Top Activity.
The Top Activity page appears.
This page shows a 1-hour time line of the top activity running on the database.
SQL statements that are using the highest percentage of database activity are listedunder the Top SQL section, and are displayed in 5-minute intervals.
3. To move the 5-minute interval, drag and drop the shaded box to the time of interest.
The information contained in the Top SQL section will be automatically updatedto reflect the selected time period. Use this page to identify high-load SQLstatements that may be causing performance problems.

8/7/2019 Performance_Tunning
http://slidepdf.com/reader/full/performancetunning 113/190
Identifying High-Load SQL Statements Using Top SQL
Identifying High-Load SQL Statements 9-3
4. To monitor SQL statements for a longer duration than one hour, select Historical from the View Data list.
In Historical view, you can view the top SQL statements for the duration definedby the AWR retention period.
This section contains the following topics:
■
Viewing SQL Statements by Wait Class■ Viewing Details of SQL Statements
Viewing SQL Statements by Wait ClassThe SQL statements that appear in the Top SQL section of the Top Activity page arecategorized into various wait classes, based on their corresponding color as describedin the legend on the Top Activity chart.
To view the SQL statements for a particular wait class, click the block of color on thechart for the wait class, or its corresponding wait class in the legend. The ActiveSessions Working page for the selected wait class appears, and the Top SQL sectionwill be automatically updated to show only the SQL statements for that wait class.
The example in Figure 9–2 shows the Active Sessions Working page for the CPU Usedwait class. Only SQL statements that are consuming the most CPU time are displayedin the Top Working SQL section.
Figure 9–2 Viewing SQL Statement by Wait Class
See Also:
■ "Monitoring User Activity" on page 4-2 for information aboutusing the Active Sessions Working page

8/7/2019 Performance_Tunning
http://slidepdf.com/reader/full/performancetunning 114/190
Identifying High-Load SQL Statements Using Top SQL
9-4 Oracle Database 2 Day + Performance Tuning Guide
Viewing Details of SQL StatementsThe Top SQL section of the Top Activity page displays the SQL statements executedwithin the selected 5-minute interval in descending order based on their resourceconsumption. The SQL statement at the top of this table represents the mostresource-intensive SQL statement during that time period, followed by the secondmost resource-intensive SQL statement, and so on.
In the example shown in Figure 9–1 on page 9-2, the SQL statement with SQL_ID 05b6pvb81dg8b is consuming 89.7 percent of database activity and should beinvestigated.
To view details of SQL statements:
1. From the Database Home page, click Performance.
The Performance page appears.
2. Under Additional Monitoring Links, click Top Activity.
The Top Activity page appears.
3. In the Top SQL section, click the SQL ID link of the SQL statement.
The SQL Details page for the selected SQL statement appears.
4. To view SQL details for a longer time period, select Historical from the View Datalist.
You can now view SQL details in the past, up to the duration defined by the AWRretention period.
5. Review the SQL text for the SQL statement.
The Text section contains the SQL text for the selected SQL statement.
If only part of the SQL statement is displayed, then a plus sign (+) icon will appearnext to the Text heading. To view the SQL text for the entire SQL statement, clickthe plus sign (+) icon.
6. If the SQL statement has multiple plans, then select All from the Plan Hash Valuelist to show SQL details for all plans.
Alternatively, you can select a particular plan to display SQL details for that planonly.
7. Access the subpages from the SQL Details page to gather more information aboutthe SQL statement, as described in the following sections:
■ Viewing SQL Statistics
■ Viewing Session Activity
■ Viewing the SQL Execution Plan
■ Viewing the SQL Tuning Information

8/7/2019 Performance_Tunning
http://slidepdf.com/reader/full/performancetunning 115/190
Identifying High-Load SQL Statements Using Top SQL
Identifying High-Load SQL Statements 9-5
8. If the SQL statement is a high-load SQL statement, then tune it as described inChapter 10, "Tuning SQL Statements".
Viewing SQL Statistics
The Statistics subpage of the SQL Details page displays statistical information aboutthe SQL statement.
To view statistics for the SQL statement:
1. On the SQL Details page, under Details, click Statistics.
The Statistics subpage appears.
2. View the statistics for the SQL statement, as described in the following sections:
■ SQL Statistics Summary
■ General SQL Statistics
■ Activity by Wait Statistics and Activity by Time Statistics
■ Elapsed Time Breakdown Statistics
■ Shared Cursors Statistics and Execution Statistics
■ Other SQL Statistics
SQL Statistics Summary The Summary section displays SQL statistics and activity on achart.
In the Real Time view, the Active Sessions chart shows the average number of activesessions executing the SQL statement in the last hour. If the SQL statement hasmultiple plans and All is selected in the Plan Hash Value list, then the chart willdisplay each plan in different colors, enabling you to easily spot if the plan changedand whether this may be the cause of the performance degradation. Alternatively, youcan select a particular plan to display that plan only.

8/7/2019 Performance_Tunning
http://slidepdf.com/reader/full/performancetunning 116/190
Identifying High-Load SQL Statements Using Top SQL
9-6 Oracle Database 2 Day + Performance Tuning Guide
In the Historical view, the chart shows execution statistics in different dimensions. Toview execution statistics, select the desired dimension from the View list:
■ Elapsed time per execution
■ Executions per hour
■ Disk reads per execution
■ Buffer gets per execution
This view enables you to track the response time of the SQL statement using differentdimensions and determine if the performance of the SQL statement has degradedbased on the dimension selected.
To view statistics of the SQL statement for a particular time interval, click the snapshoticon below the chart. You can also use the arrows to scroll the chart to locate a desiredsnapshot.
General SQL Statistics The General section enables you to identify the origin of the SQLstatement by listing the following information:
■ Module, if specified using the DBMS_APPLICATION_INFO package
■ Action, if specified using the DBMS_APPLICATION_INFO package
■ Parsing schema, or the database users account that is used to execute the SQLstatement
■ PL/SQL source, or the code line if the SQL statement is part of a PL/SQL programunit
Activity by Wait Statistics and Activity by Time Statistics The Activity by Wait and Activityby Time sections enable you to identify where the SQL statement spent most of itstime. The Activity by Wait section contains a graphical representation of how muchelapsed time is consumed by CPU and by remaining waits. The Activity by Timesection breaks out the total elapsed time into CPU time and wait time by seconds.
Elapsed Time Breakdown Statistics The Elapsed Time Breakdown section enables you toidentify if the SQL statement itself is consuming a lot of time, or if the total elapsedtime is inflated due to the amount of time the originating program or application isspending with the PL/SQL or Java engine. If the PL/SQL time or Java time makes upa significant portion of the elapsed time, then there may be minimal benefit gained bytuning the SQL statement. Instead, you should examine the application to determinehow the PL/SQL time or Java time can be reduced.
Shared Cursors Statistics and Execution Statistics The Shared Cursors Statistics andExecution Statistics sections provide information about the efficiency of various stagesof the SQL execution process.
Other SQL Statistics The Other Statistics section provides additional information aboutthe SQL statement, such as average persistent and run-time memory.
Viewing Session Activity
To view session activity for the SQL statement, in the Details section, click Activity.
The Activity subpage contains a graphical representation of the session activity.

8/7/2019 Performance_Tunning
http://slidepdf.com/reader/full/performancetunning 117/190
Identifying High-Load SQL Statements Using Top SQL
Identifying High-Load SQL Statements 9-7
The Activity subpage displays details of various sessions executing the SQL statement.The Active Sessions chart profiles the average number of active sessions over time.You can drag the shaded box to select a 5-minute interval. The Detail for Selected 5Minute Interval section lists the sessions that executed the SQL statement during theselected 5-minute interval. The multicolored bar in the Activity % column depicts howthe database time is divided for each session while executing the SQL statement. To
view more details for a particular session, click the link in the SID column of thesession you want to view to display the Session Details page.
Viewing the SQL Execution Plan
To view the execution plan for the SQL statement, in the Details section, click Plan.The execution plan for a SQL statement is the sequence of operations Oracle Databaseperforms to run the statement.
The Plan subpage displays the execution plan for the SQL statement in a graph viewand a table view.
To view the SQL execution in a graph view, click Graph.
See Also:
■ "Monitoring Top Sessions" on page 4-5 for information aboutmonitoring session activity and details

8/7/2019 Performance_Tunning
http://slidepdf.com/reader/full/performancetunning 118/190
Identifying High-Load SQL Statements Using Top SQL
9-8 Oracle Database 2 Day + Performance Tuning Guide
In the graph view, you can display details about the operations shown in the executionplan by selecting the operation in the graph. Details about the selected operations aredisplayed under Selection Details. If the selected operation is on a particular databaseobject (such as a table), then you can view further details about the database object byclicking the Object link.
To view the SQL execution in a table view, click Table.
Oracle Database compares the cost for the query, with and without query rewrite, andselects the least costly alternative. If a rewrite is necessary, then the query rewrite andits cost benefit are displayed in the Explain Rewrite section.
Viewing the SQL Tuning Information
To view the tuning information for the SQL statement, in the Details section, clickTuning Information.
The Tuning Information subpage contains information about the SQL tuning tasks andthe SQL profiles recommended by SQL Tuning Advisor for the SQL statement.
The SQL Profiles and Outlines section displays SQL profiles and outlines associatedwith the SQL statement. A SQL profile contains additional statistics of the SQLstatement. An outline contains hints for the SQL statement for the query optimizer.Both are used by the query optimizer to generate a better execution plan for the SQLstatement.
The SQL Tuning History section displays a history of SQL Tuning Advisor or SQLAccess Advisor tasks.
The ADDM Findings for this SQL During Historic Period section displays the numberof occurrences of ADDM findings that are associated with the SQL statement.
See Also:
■ Chapter 10, "Tuning SQL Statements" for information aboutexecution plan and the query optimizer

8/7/2019 Performance_Tunning
http://slidepdf.com/reader/full/performancetunning 119/190
Identifying High-Load SQL Statements Using Top SQL
Identifying High-Load SQL Statements 9-9
See Also:
■ Chapter 10, "Tuning SQL Statements" for information about SQLTuning Advisor and SQL profiles
■ "Managing SQL Profiles" on page 10-19
■ Chapter 11, "Optimizing Data Access Paths" for information aboutSQL Access Advisor

8/7/2019 Performance_Tunning
http://slidepdf.com/reader/full/performancetunning 120/190
Identifying High-Load SQL Statements Using Top SQL
9-10 Oracle Database 2 Day + Performance Tuning Guide

8/7/2019 Performance_Tunning
http://slidepdf.com/reader/full/performancetunning 121/190
Tuning SQL Statements 10-1
10Tuning SQL Statements
A SQL statement expresses the data you want Oracle Database to retrieve. Forexample, you can use a SQL statement to retrieve the names of all employees in adepartment. When Oracle Database executes the SQL statement, the query optimizer(also called simply the optimizer) first determines the best and most efficient way toretrieve the results.
The optimizer determines whether it is more efficient to read all data in the table,called a full table scan, or use an index. It compares the cost of all possible approachesand chooses the approach with the least cost. The access method for physicallyexecuting a SQL statement is called an execution plan, which the optimizer isresponsible for generating. The determination of an execution plan is an importantstep in the processing of any SQL statement, and can greatly affect execution time.
The query optimizer can also help you tune SQL statements. By using SQL TuningAdvisor and SQL Access Advisor, you can invoke the query optimizer in advisorymode to examine a SQL statement or set of statements and determine how to improvetheir efficiency. SQL Tuning Advisor and SQL Access Advisor can make variousrecommendations, such as creating SQL profiles, restructuring SQL statements,creating additional indexes or materialized views, and refreshing optimizer statistics.Additionally, Oracle Enterprise Manager (Enterprise Manager) enables you to accept
and implement many of these recommendations with just a few mouse clicks.
SQL Access Advisor is primarily responsible for making schema modificationrecommendations, such as adding or dropping indexes and materialized views. SQLTuning Advisor makes other types of recommendations, such as creating SQL profilesand restructuring SQL statements. If significant performance improvements can begained by creating a new index, then SQL Tuning Advisor may recommend it.However, such recommendations should be verified by running SQL Access Advisorusing a SQL workload that contains a set of representative SQL statements.
This chapter describes how to tune SQL statements using the SQL Tuning Advisor andcontains the following sections:
■ Tuning SQL Statements Using SQL Tuning Advisor
■ Managing SQL Tuning Sets
■ Managing SQL Profiles
■ Managing SQL Execution Plans
See Also:
■ Chapter 9, "Identifying High-Load SQL Statements"
■ Chapter 11, "Optimizing Data Access Paths" for information aboutSQL Access Advisor

8/7/2019 Performance_Tunning
http://slidepdf.com/reader/full/performancetunning 122/190
Tuning SQL Statements Using SQL Tuning Advisor
10-2 Oracle Database 2 Day + Performance Tuning Guide
Tuning SQL Statements Using SQL Tuning AdvisorYou can use SQL Tuning Advisor to tune one or more SQL statements. When tuningmultiple statements, keep in the mind that SQL Tuning Advisor does not recognizeinterdependencies between the SQL statements. Instead, it is intended as a convenientway to run SQL Tuning Advisor for a large number of SQL statements.
Besides enabling you to tune SQL statements manually, Oracle Database generatesSQL tuning reports automatically. Automatic SQL Tuning runs during systemmaintenance windows as an automated maintenance task, searching for ways toimprove the execution plans of high-load SQL statements.
Tuning SQL Manually Using SQL Tuning Advisor
As described in Chapter 9, "Identifying High-Load SQL Statements", ADDMautomatically identifies high-load SQL statements. In such cases, simply clickSchedule/Run SQL Tuning Advisor on the Recommendation Detail page to invokeSQL Tuning Advisor.
To tune SQL statements manually using SQL Tuning Advisor:
1. On the Database Home page, under Related Links, click Advisor Central.The Advisor Central page appears.
2. Under Advisors, click SQL Advisors.
The SQL Advisors page appears.
3. Under SQL Tuning Advisor, click SQL Tuning Advisor.
The Schedule SQL Tuning Advisor page appears.
4. In the Name field, enter a name for the SQL tuning task.
If unspecified, a system-generated name is used.
5. Do one of the following:
■ To run a SQL tuning task for one or more high-load SQL statements, underSQL Tuning Advisor Data Source Links, click Top Activity.

8/7/2019 Performance_Tunning
http://slidepdf.com/reader/full/performancetunning 123/190
Tuning SQL Statements Using SQL Tuning Advisor
Tuning SQL Statements 10-3
The Top Activity page appears.
Under Top SQL, select the SQL statement you want to tune and click ScheduleSQL Tuning Advisor. For information about identifying high-load SQLstatements using the Top Activity page, see "Identifying High-Load SQLStatements Using Top SQL" on page 9-2.
■ To run a SQL tuning task for historical SQL statements from the Automatic
Workload Repository (AWR), under SQL Tuning Advisor Data Source Links,click Historical SQL (AWR).
The Historical SQL (AWR) page appears.
Under Historical SQL (AWR), click the band below the chart, and select the24-hour interval for which you want to view SQL statements that ran on thedatabase. Under Detail for Selected 24 Hour Interval, select the SQL statementyou want to tune, and click Schedule SQL Tuning Advisor.
■ To run a SQL tuning task for a SQL Tuning Set, click SQL Tuning Sets.
The SQL Tuning Sets page appears.
Select the SQL Tuning Set that contains the SQL statements you want to tune
and click Schedule SQL Tuning Advisor. For information about creating SQLTuning Sets, see "Creating a SQL Tuning Set" on page 10-8.
The Schedule SQL Tuning Advisor page reappears.
6. To display the SQL text of the selected statement, expand SQL Statements.
7. Under Scope, select the scope of tuning to perform. Do one of the following:
■ Select Limited.
A limited scope takes approximately 1 second to tune each SQL statement butdoes not recommend a SQL profile.
■ Select Comprehensive, and then set a time limit (in minutes) for each SQLstatement in the Time Limit per Statement field, and a total time limit (inminutes) in the Total Time Limit field.
A comprehensive scope performs a complete analysis and recommends a SQLprofile, when appropriate, but may take much longer. Note that setting thetime limit too small may affect the quality of the recommendations.
Running a SQL Tuning Advisor task in comprehensive mode may take severalminutes to tune a single SQL statement. This mode is both time and resource
intensive because each time a query must be hard-parsed. Thus, you shouldonly use comprehensive scope for high-load SQL statements that have asignificant impact on the entire system.
For information about SQL profiles, see "Managing SQL Profiles" on page 10-19.

8/7/2019 Performance_Tunning
http://slidepdf.com/reader/full/performancetunning 124/190
Tuning SQL Statements Using SQL Tuning Advisor
10-4 Oracle Database 2 Day + Performance Tuning Guide
8. Under Schedule, do one of the following:
■ Select Immediately to run the SQL tuning task immediately, and then proceedto Step 10 after the SQL Tuning Results page appears.
■ Select Later to schedule a specific time in the future, and click OK.
9. Optionally, on the Advisor Central page, do one of the following:
■ To view results for the SQL tuning task after it completes, select the SQLTuning Advisor task and click View Result.
The SQL Tuning Results page appears. Select the recommendation you wantto implement and click View.
Proceed to the next step.
■ To delete a SQL tuning task, select the SQL Tuning Advisor task and clickDelete.
■ To reschedule a SQL tuning task, select the SQL Tuning Advisor task. From theActions list, select Re-schedule and click Go.
■ To interrupt a SQL tuning task that is running, select the SQL Tuning Advisortask. From the Actions list, select Interrupt and click Go.
■ To cancel a scheduled SQL tuning task, select the SQL Tuning Advisor task.From the Actions list, select Cancel and click Go.
■
To change the expiration of a SQL tuning task, select the SQL Tuning Advisortask. From the Actions list, select Change Expiration and click Go.
Results of each advisor run are stored in the database so that they can bereferenced later. This data is stored until it expires, at which point it will bedeleted by the AWR purging process.
■ To edit a scheduled SQL tuning task, select the SQL Tuning Advisor task.From the Actions list, select Edit and click Go.
10. On the SQL Tuning Results page, click View.
The Recommendations for SQL ID page appears.
If you used a SQL Tuning Set, then multiple recommendations may be displayed.To help you decide whether or not to implement a recommendation, an estimatedbenefit of implementing the recommendation is displayed in the Benefit (%)column. The Rationale column displays an explanation of why therecommendation is made.

8/7/2019 Performance_Tunning
http://slidepdf.com/reader/full/performancetunning 125/190
Tuning SQL Statements Using SQL Tuning Advisor
Tuning SQL Statements 10-5
11. Optionally, if multiple recommendations are displayed, then do one of thefollowing:
■ To view the original execution plan for the SQL statement, click OriginalExplain Plan.
■ To compare the new and original execution plans, click the icon in theCompare Explain Plans column.
■ To view the new execution plan for the SQL statement, click the icon in theNew Explain Plan column.
For information about viewing execution plans, see "Viewing the SQL ExecutionPlan" on page 9-7.
12. To implement the recommendation, click Implement.
The SQL Tuning Results page appears with a confirmation that the recommendedaction was completed.
Viewing Automatic SQL Tuning ResultsBy analyzing information stored in the Automatic Workload Repository (AWR), thedatabase can identify routine maintenance tasks that need to be run. The automatedmaintenance tasks infrastructure (known as AutoTask) schedules these tasks to run inOracle Scheduler time periods known as maintenance windows. By default, onewindow is scheduled for each day of the week. You can customize attributes of these
maintenance windows, including start and end time, frequency, and days of the week.AutoTask automatically schedules SQL Tuning Advisor to run during the maintenancewindows. You can view the results of automated execution of SQL Tuning Advisor onobserved high-load SQL statements.
To view automatic SQL tuning results:
1. On the Database Home page, under Related Links, click Advisor Central.
The Advisor Central page appears.
2. Under Advisors, click SQL Advisors.

8/7/2019 Performance_Tunning
http://slidepdf.com/reader/full/performancetunning 126/190
Tuning SQL Statements Using SQL Tuning Advisor
10-6 Oracle Database 2 Day + Performance Tuning Guide
The SQL Advisors page appears.
3. Under SQL Tuning Advisor, click Automatic SQL Tuning Results.
The Automatic SQL Tuning Result Summary page appears.
The top half of the page includes sections for the status and activity summary of the SQL Tuning task.
The bottom half of the Automatic SQL Tuning Result Summary page showsstatistics for the overall task and the profile effect.
The Tuned SQL DB Time Benefit chart estimates the weekly DB time saved by SQLprofiles that were automatically implemented. The chart also shows time thatcould be saved if other recommended SQL profiles were implemented. Forexample, the Before bar in the Implemented set aggregates the DB times during
the week before tuning for all SQL statements with profiles implemented. TheAfter bar projects the new weekly cumulative DB time, calculated by lowering thetime of each SQL statement according to the benefit found by test execution. Thus,the Implemented set shows DB time benefit that has already been realized,whereas the Recommended set shows the potential benefit of profiles that werenot automatically accepted by the SQL Tuning Advisor.
4. Optionally, in the Task Status section, click Configure to change the attributes of the Automatic SQL Tuning task.
The Automated Maintenance Tasks Configuration page appears.

8/7/2019 Performance_Tunning
http://slidepdf.com/reader/full/performancetunning 127/190
Tuning SQL Statements Using SQL Tuning Advisor
Tuning SQL Statements 10-7
In this page, you can enable or disable the Automatic SQL Tuning task and specifywhich days it should run. Click Apply or Revert to return to the previous page.
5. In the Task Activity Summary section, leave All selected for the Time Period andthen click View Report.
The Automatic SQL Tuning Result Details page appears.
The page lists SQL statements that have been automatically selected by thedatabase as candidates for SQL tuning.
6. Under Recommendations, select a SQL statement and then click ViewRecommendations.
The Recommendations for SQL ID page appears.
This page can include recommendations for SQL profiles and indexes. See "TuningSQL Manually Using SQL Tuning Advisor" on page 10-2 to learn how toimplement recommendations made by SQL Tuning Advisor.

8/7/2019 Performance_Tunning
http://slidepdf.com/reader/full/performancetunning 128/190
Managing SQL Tuning Sets
10-8 Oracle Database 2 Day + Performance Tuning Guide
Managing SQL Tuning SetsA SQL Tuning Set is a database object that includes one or more SQL statements andtheir execution statistics and execution context. You can use the set as an input sourcefor various advisors, such as SQL Tuning Advisor, SQL Access Advisor, and SQLPerformance Analyzer. You can load SQL statements into a SQL Tuning Set fromdifferent SQL sources, such as AWR, the cursor cache, or high-load SQL statements
that you identified.A SQL Tuning Set includes the following:
■ A set of SQL statements
■ Associated execution context, such as user schema, application module name andaction, list of bind values, and the cursor compilation environment
■ Associated basic execution statistics, such as elapsed time, CPU time, buffer gets,disk reads, rows processed, cursor fetches, the number of executions, the numberof complete executions, optimizer cost, and the command type
■ Associated execution plans and row source statistics for each SQL statement(optional)
SQL statements can be filtered using the application module name and action, or anyof the execution statistics. In addition, SQL statements can be ranked based on anycombination of execution statistics.
SQL Tuning Sets are transportable across databases and can be exported from onesystem to another, allowing SQL workloads to be transferred between databases forremote performance diagnostics and tuning. When high-load SQL statements areidentified on a production system, it may not be desirable to perform investigationand tuning activities on the production system directly. This feature enables you totransport the high-load SQL statements to a test system, where they can be safelyanalyzed and tuned. For information about transporting SQL Tuning Sets, see OracleDatabase Performance Tuning Guide.
Using Oracle Enterprise Manager, you can manage SQL Tuning Sets by doing thefollowing:
■ Creating a SQL Tuning Set
■ Dropping a SQL Tuning Set
■ Transporting SQL Tuning Sets
Creating a SQL Tuning Set
This section describes how to create a SQL Tuning Set by using Oracle EnterpriseManager.
To create a SQL Tuning Set:
1. Specify the initial options for the SQL Tuning Set, as described in "Creating a SQLTuning Set: Options" on page 10-9.
2. Select the load method to use for collecting and loading SQL statements into theSQL Tuning Set, as described in "Creating a SQL Tuning Set: Load Method" onpage 10-10.
3. Specify the filter options for the SQL Tuning Set, as described in "Creating a SQLTuning Set: Filter Options" on page 10-13.

8/7/2019 Performance_Tunning
http://slidepdf.com/reader/full/performancetunning 129/190
Managing SQL Tuning Sets
Tuning SQL Statements 10-9
4. Schedule and submit a job to collect the SQL statements and load them into theSQL Tuning Set, as described in "Creating a SQL Tuning Set: Schedule" onpage 10-15.
Creating a SQL Tuning Set: Options
The first step in creating a SQL Tuning Set is to specify initial options for the set such
as name, owner, and description.
To specify options for creating a SQL Tuning Set:
1. On the Database Performance page, under Additional Monitoring Links, clickSQL Tuning Sets.
The SQL Tuning Sets page appears. Existing SQL Tuning Sets are displayed on thispage.
2. Click Create.
The Create SQL Tuning Set: Options page appears.
3. In the SQL Tuning Set Name field, enter a name for the SQL Tuning Set.
4. In the Owner field, enter the owner of the SQL Tuning Set.
5. In the Description field, enter a description of the SQL Tuning Set.
6. Optionally, if you want to create an empty SQL Tuning Set and add SQLstatements to it at a later time, then complete the following steps:
a. Enable Create an empty SQL tuning set.
b. Click Next.
The Create SQL Tuning Set: Review page appears.
c. Review the SQL Tuning Set options that you have selected and click Submit.
The empty SQL Tuning Set is created. You can add SQL statements to it at alater time.
7. Click Next.
The Create SQL Tuning Set: Load Methods page appears.

8/7/2019 Performance_Tunning
http://slidepdf.com/reader/full/performancetunning 130/190
Managing SQL Tuning Sets
10-10 Oracle Database 2 Day + Performance Tuning Guide
8. Proceed to the next step, as described in "Creating a SQL Tuning Set: LoadMethod" on page 10-10.
Creating a SQL Tuning Set: Load Method
After options are specified for the SQL Tuning Set, select the load method to use forcollecting and loading SQL statements into the SQL Tuning Set, as described in thefollowing sections:
■
Loading Active SQL Statements Incrementally from the Cursor Cache■ Loading SQL Statements from the Cursor Cache
■ Loading SQL Statements from AWR Snapshots
■ Loading SQL Statements from AWR Baselines
■ Loading SQL Statements from a User-Defined Workload
Loading Active SQL Statements Incrementally from the Cursor Cache You can load active SQL
statements from the cursor cache into the SQL Tuning Set incrementally over aspecified period of time. This method enables you to not only collect current andrecent SQL statements stored in the SQL cache, but also SQL statements that will runduring the specified time period in the future.
To load active SQL statements incrementally from the cursor cache:
1. On the Create SQL Tuning Set: Load Methods page, select Incrementally captureactive SQL statements over a period of time from the cursor cache.
2. In the Duration field, specify how long active SQL statements will be captured.
3. In the Frequency field, specify how often active SQL statements will be capturedduring the specified duration.
4. Click Next.
The Create SQL Tuning Set: Filter Options page appears.
5. Proceed to the next step, as described in "Creating a SQL Tuning Set: FilterOptions" on page 10-13.
Loading SQL Statements from the Cursor Cache You can load SQL statements from thecursor cache into the SQL Tuning Set. However, because only current and recent SQLstatements are stored in the SQL cache, collecting these SQL statements only once may
Tip: Before selecting the load method for the SQL Tuning Set, createa SQL Tuning Set and specify the initial options, as described in"Creating a SQL Tuning Set: Options" on page 10-9

8/7/2019 Performance_Tunning
http://slidepdf.com/reader/full/performancetunning 131/190
Managing SQL Tuning Sets
Tuning SQL Statements 10-11
result in a SQL Tuning Set this is not representative of the entire workload on yourdatabase.
To load SQL statements from the cursor cache:
1. On the Create SQL Tuning Set: Load Methods page, select Load SQL statementsone time only.
2. In the Data Source field, select Cursor Cache.
3. Click Next.
The Create SQL Tuning Set: Filter Options page is shown.
4. Proceed to the next step, as described in "Creating a SQL Tuning Set: FilterOptions" on page 10-13.
Loading SQL Statements from AWR Snapshots You can load SQL statements captured inAWR snapshots. This is useful when you want to collect SQL statements for specific
snapshot periods of interest that can be used for later comparison or tuning purposes.
To load SQL statements from AWR snapshots:
1. On the Create SQL Tuning Set: Load Methods page, select Load statements onetime only.
2. In the Data Source field, select AWR Snapshots.
3. In the AWR Snapshots field, select the snapshots to include. Do one of thefollowing:
■ Select Last 24 hours and then go to Step 5.
Only snapshots that are captured and stored in AWR in the last 24 hours will
be included.■ Select Last 7 days and then go to Step 5.
Only snapshots that are captured and stored in AWR in the last 7 days will beincluded.
■ Select Last 31 days and then go to Step 5.
Only snapshots that are captured and stored in AWR in the last 31 days will beincluded.
■ Select ALL and then go to Step 5.
All snapshots that are captured and stored in AWR will be included.
■
Select Customize and then proceed to Step 4.Only snapshots that are captured and stored in AWR during a customizedtime period that you specify will be included.
4. To select a customized time period of snapshots to include, complete the followingsteps:
a. Select Customize and click Go.

8/7/2019 Performance_Tunning
http://slidepdf.com/reader/full/performancetunning 132/190
Managing SQL Tuning Sets
10-12 Oracle Database 2 Day + Performance Tuning Guide
The Select Time Period window opens.
b. For the starting snapshot, select Period Start Time and click the snapshot icon
below the Active Session graph that corresponds to the desired start time.
c. For the ending snapshot, select Period End Time and click the snapshot iconbelow the Active Session graph that corresponds to the desired end time.
d. Click Select.
In this example, the snapshot taken on March 4, 2007 at 9:01 p.m. is selected as thestart time, and the snapshot taken on March 5, 2007 at 1:00 a.m. is selected as theend time.
5. Click Next.
The Create SQL Tuning Set: Filter Options page is shown.
6. Proceed to the next step, as described in "Creating a SQL Tuning Set: FilterOptions" on page 10-13.
Loading SQL Statements from AWR Baselines You can load SQL statements captured inAWR baselines. This is useful when you want to collect SQL statements that arerepresentative of a time period during known performance levels that can be used forlater comparison or tuning purposes.
To load SQL statements from AWR baselines:
1. On the Create SQL Tuning Set: Load Methods page, select Load SQL statementsone time only.
2. In the Data Source field, select AWR Baseline.
3. In the AWR Baseline field, select the baseline to include.
4. Click Next.
The Create SQL Tuning Set: Filter Options page is shown.

8/7/2019 Performance_Tunning
http://slidepdf.com/reader/full/performancetunning 133/190
Managing SQL Tuning Sets
Tuning SQL Statements 10-13
5. Proceed to the next step, as described in "Creating a SQL Tuning Set: FilterOptions" on page 10-13.
Loading SQL Statements from a User-Defined Workload You can load SQL statements byimporting from a table or view. This is useful if the workload you want to analyze isnot currently running on the database or captured in an existing AWR snapshot orAWR baseline.
There are no restrictions on which schema the workload resides in, the name of thetable, or the number of tables that you can define. The only requirement is that theformat of the table must match format of the USER_WORKLOAD table.
To load SQL statements from a user-defined workload:
1. On the Create SQL Tuning Set: Load Methods page, select Load statements onetime only.
2. In the Data Source field, select User-Defined Workload.
3. In the User-Defined Workload field, select the table or view to include.
4. Click Next.
The Create SQL Tuning Set: Filter Options page is shown.
5. Proceed to the next step, as described in "Creating a SQL Tuning Set: FilterOptions" on page 10-13.
Creating a SQL Tuning Set: Filter Options
After the load method is selected, you can apply filters to reduce the scope of the SQLstatements found in the SQL Tuning Set. While using filters is optional, it can be very
beneficial due to the following:
■ Using filters directs the various advisors that use the SQL Tuning Set as aworkload source—such as SQL Tuning Advisor, SQL Access Advisor, and SQLPerformance Analyzer—to make recommendations based on a specific subset of SQL statements, which may lead to better recommendations.
■ Using filters removes extraneous SQL statements from the SQL Tuning Set, whichmay greatly reduce processing time when it is used as a workload source for thevarious advisors.
To specify filter options for a SQL Tuning Set:
1. On the Create SQL Tuning Set: Filter Options page, specify the values of filterconditions that you want use in the search in the Value column, and an operator ora condition in the Operator column.
Tip: Before you can specify the filter options for the SQL Tuning Set,do the following:
■ Create a SQL Tuning Set and specify the initial options, asdescribed in "Creating a SQL Tuning Set: Options" on page 10-9
■ Select the load method, as described in "Creating a SQL TuningSet: Load Method" on page 10-10

8/7/2019 Performance_Tunning
http://slidepdf.com/reader/full/performancetunning 134/190
Managing SQL Tuning Sets
10-14 Oracle Database 2 Day + Performance Tuning Guide
Only the SQL statements that meet all of the specified filter conditions will beadded to the SQL Tuning Set. Unspecified filter values will not be included asfilter conditions in the search.
By default, the following filter conditions are displayed:
■ Parsing Schema Name
■
SQL Text■ SQL ID
■ Elapsed Time (sec)
2. To add filter conditions, under Filter Conditions, select the filter condition youwant to add and click Add a Filter or Column.
The available filter conditions include the following:
■ Plan hash value
■ Module
■ Action
■ Buffer gets
■ Disk reads
■ Disk writes
■ Rows processed
■ Fetches
■ Executions
■ End of fetch count
■ Command type
After the desired filter conditions have been added, specify their values in theValue column, and an operator or a condition in the Operator column.
3. To remove any unused filter conditions, click the icon in the Remove column forthe corresponding filter condition you want to remove.
4. Click Next.
The Create SQL Tuning Set: Schedule page appears.
5. Proceed to the next step, as described in "Creating a SQL Tuning Set: Schedule" onpage 10-15.

8/7/2019 Performance_Tunning
http://slidepdf.com/reader/full/performancetunning 135/190
Managing SQL Tuning Sets
Tuning SQL Statements 10-15
Creating a SQL Tuning Set: Schedule
After the filter options are specified for the SQL Tuning Set, you can schedule andsubmit a job to collect the SQL statements and load them into the SQL Tuning Set.
To schedule and submit a job to create a SQL Tuning Set:
1. On the Create SQL Tuning Set: Schedule page, under Job Parameters, enter a namein the Job Name field if you do not want to use the system-generated job name.
2. In the Description field, enter a description of the job.
3. Under Schedule, do one of the following:
■ Immediately to run the job immediately after it has been submitted
■ Later to run the job at a later time as specified using the Time Zone, Date, andTime fields
4. Click Next.
The Create SQL Tuning Set: Review page appears.
Tip: Before you can schedule a job to create the SQL Tuning Set, dothe following:
■
Create a SQL Tuning Set and specify the initial options, asdescribed in "Creating a SQL Tuning Set: Options" on page 10-9.
■ Select the load method, as described in "Creating a SQL TuningSet: Load Method" on page 10-10.
■ Specify the filter options, as described in "Creating a SQL TuningSet: Filter Options" on page 10-13.

8/7/2019 Performance_Tunning
http://slidepdf.com/reader/full/performancetunning 136/190
Managing SQL Tuning Sets
10-16 Oracle Database 2 Day + Performance Tuning Guide
5. Review the SQL Tuning Set options that you have selected.
To view the SQL statements used by the job, expand Show SQL.
6. Click Submit.
The SQL Tuning Sets page appears.
If the job was scheduled to run immediately, then a message is displayed to inform
you that the job and the SQL Tuning Set were created successfully. If the job wasscheduled to run at a later time, a message is displayed to inform you that the jobwas created successfully.
7. To view details about the job, such as operation status, click View Job Details.
The View Job page appears to display details about the job.
Dropping a SQL Tuning Set
This section describes how to drop a SQL Tuning Set. To conserve storage space, youmay want to periodically drop unused SQL Tuning Sets stored in the database.
To drop a SQL Tuning Set:
1. On the Database Performance page, under Additional Monitoring Links, clickSQL Tuning Sets.
The SQL Tuning Sets page appears.
Existing SQL Tuning Sets are displayed on this page.
2. Select the SQL Tuning Set you want to drop and click Drop.
The Confirmation page appears to verify if you want to delete the selected SQLTuning Set.
3. Click Yes.
The SQL Tuning Sets page appears.
A confirmation message is displayed to indicate that the SQL Tuning Set wassuccessfully deleted.
Transporting SQL Tuning SetsYou can transport SQL Tuning Sets from one system to another by first exporting aSQL Tuning Set from one system, then importing it into another system.
This section contains the following topics:
■ Exporting a SQL Tuning Set
■ Importing a SQL Tuning Set
Exporting a SQL Tuning Set
This section describes how to export a SQL Tuning Set, thereby enabling it to betransported to another system.
To export a SQL Tuning Set:
1. On the Database Performance page, under Additional Monitoring Links, clickSQL Tuning Sets.
The SQL Tuning Sets page appears.

8/7/2019 Performance_Tunning
http://slidepdf.com/reader/full/performancetunning 137/190
Managing SQL Tuning Sets
Tuning SQL Statements 10-17
Existing SQL Tuning Sets are displayed on this page.
2. Select the SQL Tuning Set you want to export and click Export.
The Export SQL Tuning Set page appears.
3. In the Directory Object field, select a directory where the export file will becreated.
For example, to use the Oracle Data Pump directory, select DATA_PUMP_DIR. TheDirectory Name field refreshes automatically to indicate the selected directory.
4. In the Export File field, enter a name for the dump file that will be exported.
Alternatively, you can accept the name generated by the system.
5. In the Log File field, enter a name for the log file for the export operation.
Alternatively, you can accept the name generated by the system.
6. Select a tablespace to temporarily store the data for the export operation.
By default, SYSAUX is used.
7. Under Job Parameters, in the Job Name field, enter a name for the job.
Alternatively, you can accept the name generated by the system.
8. Under Schedule, do one of the following:
■ Select Immediately to run the job immediately after it has been submitted.
■ Select Later to run the job at a later time as specified by selecting or enteringvalues in the Time Zone, Date, and Time fields.
9. Click OK.
The SQL Tuning Sets page appears.
A confirmation message is displayed to indicate that the job was successfullycreated.
10. Optionally, transport the export file to another system using the mechanism of choice (such as Oracle Data Pump or a database link).

8/7/2019 Performance_Tunning
http://slidepdf.com/reader/full/performancetunning 138/190
Managing SQL Tuning Sets
10-18 Oracle Database 2 Day + Performance Tuning Guide
Importing a SQL Tuning Set
Before a SQL Tuning Set can be imported, you must first export a SQL Tuning Setfrom another system and transport it to your current system. For more information,see "Exporting a SQL Tuning Set" on page 10-16.
To import a SQL Tuning Set:
1. On the Database Performance page, under Additional Monitoring Links, clickSQL Tuning Sets.
The SQL Tuning Sets page appears.
2. Click Import.
The Import SQL Tuning Set page appears.
3. In Directory Object, select a directory where the import file is stored.
The directory should contain the export file that was transported to your currentsystem. For example, if the file resides in the Data Pump directory, then selectDATA_PUMP_DIR. The Directory Name field refreshes automatically to indicatethe selected directory.
4. In the Import File field, enter the name of the dump file that will be imported.
5. In the Log File field, enter a name for the log file for the import operation.
6. To replace an existing SQL Tuning Set with the one that you are importing, selectReplace the existing SQL tuning set if one exists.
7. Select a tablespace to temporarily store the data for the import operation.
By default, SYSAUX is used.
8. Under Job Parameters, in the Job Name field, enter a name for the job.
Alternatively, you can accept the name generated by the system.
9. Under Schedule, do one of the following:
■ Select Immediately to run the job immediately after it has been submitted.

8/7/2019 Performance_Tunning
http://slidepdf.com/reader/full/performancetunning 139/190
Managing SQL Profiles
Tuning SQL Statements 10-19
■ Select Later to run the job at a later time as specified by selecting or enteringvalues in the Time Zone, Date, and Time fields.
10. Click OK.
The SQL Tuning Sets page appears.
A confirmation message is displayed to indicate that the job was successfully
created. If the job is scheduled to run immediately, then the imported SQL TuningSet will be displayed on this page. You may need to refresh the page.
Managing SQL ProfilesWhen running a SQL Tuning Advisor task with a limited scope, the query optimizermakes estimates about cardinality, selectivity, and cost. These estimates can sometimesbe off by a significant amount, resulting in poor execution plans.
To address this problem, consider running a SQL Tuning Advisor task with acomprehensive scope to collect additional information using sampling and partialexecution techniques to verify and, if necessary, adjust these estimates. These auxiliarystatistics about the SQL statement are collected into a SQL profile.
During SQL profiling, the query optimizer uses the execution history informationabout the SQL statement to create appropriate settings for optimizer parameters. Afterthe SQL profiling completes, the query optimizer uses the information stored in theSQL profile, in conjunction with regular database statistics, to generate executionplans. The availability of the additional information makes it possible to producewell-tuned plans for corresponding SQL statements.
After running a SQL Tuning Advisor task with a comprehensive scope, a SQL profilemay be recommended. If you accept the recommendation, then the SQL profile will becreated and enabled for the SQL statement.
In some cases, you may want to disable a SQL profile. For example, you may want totest the performance of a SQL statement without using a SQL profile to determine if the SQL profile is actually beneficial. If the SQL statement is performing poorly afterthe SQL profile is disabled, then you should enable it again to avoid performancedegradation. If the SQL statement is performing optimally after you have disabled theSQL profile, you may want to remove the SQL profile from your database.
To enable, disable, or delete a SQL profile:
1. On the Performance page, click Top Activity.
The Top Activity page appears.
2. Under Top SQL, click the SQL ID link of the SQL statement that is using a SQLprofile.
The SQL Details page appears.
3. Click the Tuning Information tab.
A list of SQL profiles is displayed under SQL Profiles and Outlines.
4. Select the SQL profile you want to manage. Do one of the following:

8/7/2019 Performance_Tunning
http://slidepdf.com/reader/full/performancetunning 140/190
Managing SQL Execution Plans
10-20 Oracle Database 2 Day + Performance Tuning Guide
■ To enable a SQL profile that is disabled, click Disable/Enable.
■ To disable a SQL profile that is enabled, Disable/Enable.
■ To remove a SQL profile, click Delete.
A confirmation page appears.
5. Click Yes to continue, or No to cancel the action.
Managing SQL Execution PlansSQL plan management records and evaluates the execution plans of SQL statementsover time. This mechanism builds SQL plan baselines composed of a set of existingplans known to be efficient. If the same SQL statement is run repeatedly, and if theoptimizer generates a new plan that differs from the baseline, then the databasecompares the new plan with the baseline and chooses the best one.
Some events can cause changes to SQL execution plans, such as new optimizerstatistics, changes to initialization parameter values, a database upgrade that causes achange to the optimizer, and so on. These changes can cause regressions in SQLperformance, which can be difficult and time-consuming to fix manually. As a
preventative measure, you can fix SQL plan baselines to preserve performance of corresponding SQL statements, regardless of changes occurring in the system.
To load SQL execution plans:
1. From the Database Home page, click Server.
The Server subpage appears.
2. Under Query Optimizer, click SQL Plan Control.
The SQL Profile subpage of the SQL Plan Control page appears.
3. Click SQL Plan Baseline.
The SQL Plan Baseline subpage appears.
4. Under Settings, click the link next to Capture SQL Plan Baselines.
The Initialization Parameters page appears.
5. In the Value column of the table, select TRUE and then click OK.
You are returned to the SQL Plan Baseline subpage, which now shows CaptureSQL Baselines set to TRUE.

8/7/2019 Performance_Tunning
http://slidepdf.com/reader/full/performancetunning 141/190
Managing SQL Execution Plans
Tuning SQL Statements 10-21
Because you configured baselines to be captured, the database automatically keepsa history of execution plans for all SQL statements executed more than once.
6. Click Load.
The SQL Plan Control page appears.
7. Select the SQL plan baselines to be loaded. Complete the following steps:
a. Under Load SQL Plan Baselines, select Load plans from SQL Tuning Set
(STS).
In this example, load plans from the SQL Tuning Set that you created in"Creating a SQL Tuning Set" on page 10-8.
b. In Job Name, enter a name for the job. In this example, enterSPM_LOAD_TEST.
c. Under Schedule, select Immediately.
d. Click OK.
The SQL Profile subpage of the SQL Plan Control page appears. The table displaysa list of SQL plans that are stored as SQL plan baselines.

8/7/2019 Performance_Tunning
http://slidepdf.com/reader/full/performancetunning 142/190
Managing SQL Execution Plans
10-22 Oracle Database 2 Day + Performance Tuning Guide
8. Optionally, fix the execution plan of a baseline so that the database will not useany alternative SQL plan baseline. Complete the following steps:
a. Select a SQL plan baseline that is not fixed.
b. Select Fixed - Yes from the list preceding the baseline table.
c. Click Go.
The table is refreshed to show the SQL execution plan with the value YES in theFixed column of the table.
See Also:
■ Oracle Database Performance Tuning Guide to learn how to use SQL
plan management

8/7/2019 Performance_Tunning
http://slidepdf.com/reader/full/performancetunning 143/190
Optimizing Data Access Paths 11-1
11Optimizing Data Access Paths
To achieve optimum performance for data-intensive queries, materialized views andindexes are essential when tuning SQL statements. Implementing these objects,however, does not come without a cost. Creation and maintenance of these objects canbe time-consuming, and space requirements can be significant. SQL Access Advisorenables you to optimize data access paths of SQL queries by recommending the properset of materialized views and view logs, indexes, SQL profiles, and partitions for a
given workload.A materialized view provides access to table data by storing query results in a separateschema object. Unlike an ordinary view, which does not take up storage space orcontain data, a materialized view contains the rows resulting from a query against oneor more base tables or views. A materialized view log is a schema object that recordschanges to a master table's data, so that a materialized view defined on the mastertable can be refreshed incrementally. SQL Access Advisor recommends how tooptimize materialized views so that they can be rapidly refreshed and take advantageof the general query rewrite feature. For more information about materialized viewsand view logs, see Oracle Database Concepts.
SQL Access Advisor also recommends bitmap, function-based, and B-tree indexes. Abitmap index provides a reduced response time for many types of ad hoc queries and
reduced storage requirements compared to other indexing techniques. Afunction-based index derives the indexed value from the table data. For example, tofind character data in mixed cases, a function-based index can be used to look for thevalues as if they were all in uppercase characters. B-tree indexes are most commonlyused to index unique or near-unique keys.
Using SQL Access Advisor involves the following tasks:
■ Running SQL Access Advisor
■ Reviewing the SQL Access Advisor Recommendations
■ Implementing the SQL Access Advisor Recommendations
Running SQL Access AdvisorThis section describes how to run SQL Access Advisor to make recommendations on aSQL workload.
See Also:
■ Chapter 9, "Identifying High-Load SQL Statements"
■ Chapter 10, "Tuning SQL Statements" for information about SQLTuning Advisor

8/7/2019 Performance_Tunning
http://slidepdf.com/reader/full/performancetunning 144/190
Running SQL Access Advisor
11-2 Oracle Database 2 Day + Performance Tuning Guide
To run SQL Access Advisor:
1. Select the initial options, as described in "Running SQL Access Advisor: InitialOptions" on page 11-2.
2. Select the workload source you want to use for the analysis, as described in"Running SQL Access Advisor: Workload Source" on page 11-3.
3. Define the filters options, as described in "Running SQL Access Advisor: Filter
Options" on page 11-5.
4. Choose the types of recommendations, as described in "Running SQL AccessAdvisor: Recommendation Options" on page 11-7.
5. Schedule the SQL Access Advisor task, as described in "Running SQL AccessAdvisor: Schedule" on page 11-9.
Running SQL Access Advisor: Initial OptionsThe first step in running SQL Access Advisor is to select the initial options on the SQLAccess Advisor: Initial Options page.
To select initial options:1. On the Database Home page, under Related Links, click Advisor Central.
The Advisor Central page appears.
2. Under Advisors, click SQL Advisors.
The SQL Advisors page appears.
3. Click SQL Access Advisor.
The SQL Access Advisor: Initial Options page appears.
4. Select the initial options. Do one of the following:
■ Select Verify use of access structures (indexes, materialized views,
partitioning, and so on) only to verify existing structures.■ Select Recommend new access structures to use the recommended options
defined in the Oracle Enterprise Manager default template.
If you select this option, then you can optionally complete the followingadditional steps:
– Select Inherit Options from a previously saved Task or Template to usethe options defined in an existing SQL Access Advisor task or anothertemplate.
– In Tasks and Templates, select the task or template that you want to use.
In this example, Recommend new access structures is selected.

8/7/2019 Performance_Tunning
http://slidepdf.com/reader/full/performancetunning 145/190
Running SQL Access Advisor
Optimizing Data Access Paths 11-3
5. Click Continue.
The SQL Access Advisor: Workload Source page appears.
6. Proceed to the next step, as described in "Running SQL Access Advisor: WorkloadSource" on page 11-3.
Running SQL Access Advisor: Workload SourceAfter initial options are specified for SQL Access Advisor, select the workload sourcethat you want to use for the analysis, as described in the following sections:
■ Using SQL Statements from the Cache
■ Using an Existing SQL Tuning Set
■ Using a Hypothetical Workload
Using SQL Statements from the Cache
You can use SQL statements from the cache as the workload source. However, becauseonly current and recent SQL statements are stored in the SQL cache, this workloadsource may not be representative of the entire workload on your database.
To use SQL statements from the cache as the workload source:
1. On the SQL Access Advisor: Workload Source page, select Current and RecentSQL Activity.
In this example, Use Default Options is selected.
2. Proceed to the next step, as described in "Running SQL Access Advisor: FilterOptions" on page 11-5.
Tip: Before you can select the workload source for SQL AccessAdvisor, select the initial options, as described in "Running SQLAccess Advisor: Initial Options" on page 11-2.

8/7/2019 Performance_Tunning
http://slidepdf.com/reader/full/performancetunning 146/190
Running SQL Access Advisor
11-4 Oracle Database 2 Day + Performance Tuning Guide
Using an Existing SQL Tuning Set
You can use an existing SQL Tuning Set as the workload source. This option is usefulbecause SQL Tuning Sets can be used repeatedly as the workload source for not onlySQL Access Advisor, but also SQL Tuning Advisor.
To use a SQL Tuning Set as the workload source:
1. On the SQL Access Advisor: Workload Source page, select Use an existing SQLTuning Set.
2. Click the SQL Tuning Set search icon to use an existing SQL Tuning Set.
The Search and Select: SQL Tuning Set dialog box appears.
3. In the Schema field, enter the name of the schema containing the SQL Tuning Setyou want to use and click Go.
A list of SQL Tuning Sets contained in the selected schema appears.
4. Select the SQL Tuning Set to be used for the workload source and click Select.
The Search and Select: SQL Tuning Set dialog box closes and the selected SQLTuning Set now appears in the SQL Tuning Set field.
5. Proceed to the next step, as described in "Running SQL Access Advisor: FilterOptions" on page 11-5.
Using a Hypothetical Workload
A dimension table stores all or part of the values for a logical dimension in a star orsnowflake schema. You can create a hypothetical workload from dimension tablescontaining primary or foreign key constraints. This option is useful if the workload tobe analyzed does not exist. In this case, SQL Access Advisor examines the currentlogical schema design, and provides recommendations based on the definedrelationships between tables.
To use a hypothetical workload as the workload source:
1. On the SQL Access Advisor: Workload Source page, select Create a HypotheticalWorkload from the Following Schemas and Tables.
2. Leave Schemas and Tables empty and click Add to search for tables.
The Workload Source: Search and Select Schemas and Tables page appears.
3. In the Tables section, enter a schema name in the Schema field and click Search.
A list of tables in the selected schema is displayed.
4. Select the tables to be used in creating the hypothetical workload and click AddTables.
The selected tables now appear in the Schemas and Tables field.
5. Click OK.
The SQL Access Advisor: Workload Source page appears with the selected tablesnow added.
6. Proceed to the next step, as described in "Running SQL Access Advisor: FilterOptions" on page 11-5.
See Also:
■ "Managing SQL Tuning Sets" on page 10-8

8/7/2019 Performance_Tunning
http://slidepdf.com/reader/full/performancetunning 147/190
Running SQL Access Advisor
Optimizing Data Access Paths 11-5
Running SQL Access Advisor: Filter OptionsAfter the workload source is selected, you can apply filters to reduce the scope of theSQL statements found in the workload. While using filters is optional, it can be verybeneficial due to the following:
■ Using filters directs SQL Access Advisor to make recommendations based on aspecific subset of SQL statements from the workload, which may lead to better
recommendations.
■ Using filters removes extraneous SQL statements from the workload, which maygreatly reduce processing time.
To apply filters to the workload source:1. On the SQL Access Advisor: Workload Source page, click Filter Options.
The Filter Options section expands.
2. Select Filter Workload Based on these Options.
The Filter Options section is enabled.
3. Define the filters you want to apply, as described in the following sections:
■ Defining Filters for Resource Consumption
■ Defining Filters for Users
■ Defining Filters for Tables
■ Defining Filters for SQL Text
■ Defining Filters for Modules
■ Defining Filters for Actions
4. Click Next.
The Recommendation Options page appears.
5. Proceed to the next step, as described in "Running SQL Access Advisor:Recommendation Options" on page 11-7.
Defining Filters for Resource Consumption
The resource consumption filter restricts the workload to include only the number of high-load SQL statements that you specify.
To define a filter for resource consumption:
1. On the SQL Access Advisor: Workload Source page, under User ResourceConsumption, enter the number of high-load SQL statements in the Number ofStatements field.
2. From the Order by list, select one of the methods by which the SQL statements areto be ordered.
Tip: Before you can select the filter options for the workload, do thefollowing:
■ Select initial options, as described in "Running SQL AccessAdvisor: Initial Options" on page 11-2.
■ Select the workload source, as described in "Running SQL AccessAdvisor: Workload Source" on page 11-3.

8/7/2019 Performance_Tunning
http://slidepdf.com/reader/full/performancetunning 148/190
Running SQL Access Advisor
11-6 Oracle Database 2 Day + Performance Tuning Guide
Defining Filters for Users
The users filter restricts the workload to include or exclude SQL statements executedby users that you specify.
To define a filter for users:
1. On the SQL Access Advisor: Workload Source page, under Users, select Include
only SQL statements executed by these users or Exclude all SQL statementsexecuted by these users.
2. To search for available users, click the Users search icon.
The Search and Select: Users dialog box appears.
3. Select the users for which you want to include or exclude SQL statements andclick Select.
The Search and Select: Users dialog box closes and the selected tables now appearin the Users field.
In this example, a filter is defined to include only SQL statements executed by theuser SH.
Defining Filters for Tables
The tables filter restricts the workload to include or exclude SQL statements that accessa list of tables that you specify. Table filters are not permitted if you selected the Createa Hypothetical Workload from the Following Schemas and Tables option, asdescribed in "Using a Hypothetical Workload" on page 11-4.
To define a filter for tables:
1. To include only SQL statements that access a specific list of tables, enter the tablenames in the Include only SQL statements that access any of these tables field.
2. To exclude all SQL statements that access a specific list of tables, enter the tablenames in the Exclude all SQL statements that access any of these tables field.
3. To search for available tables, click the Tables search icon.
The Search and Select: Schema and Table dialog box appears.
4. Select the tables for which you want to include or exclude SQL statements andclick Select.
The Search and Select: Schema and Table dialog box closes and the selected tablesnow appear in the corresponding Tables field.
Defining Filters for SQL Text
The SQL text filter restricts the workload to include or exclude SQL statements thatcontains SQL text substrings that you specify.
To define a filter for SQL text:
1. To include only SQL statements that contains specific SQL text, enter the SQL textto be included in the Include only SQL statements containing these SQL textsubstrings field.

8/7/2019 Performance_Tunning
http://slidepdf.com/reader/full/performancetunning 149/190
Running SQL Access Advisor
Optimizing Data Access Paths 11-7
2. To exclude all SQL statements that contain specific SQL text, enter the SQL text tobe excluded in the Exclude all SQL statements containing these SQL textsubstrings field.
Defining Filters for Modules
The module filter restricts the workload to include or exclude SQL statements that are
associated with modules that you specify.
To define a filter for module ID:
1. To include only SQL statements associated with a specific module ID in theworkload, select Include only SQL statements associated with these modules.
2. To exclude all SQL statements associated to a specific module ID from theworkload, select Exclude all SQL statements associated with these modules.
3. In the Modules field, enter the names of the modules for which associated SQLstatements will be included or excluded.
Defining Filters for Actions
The actions filter restricts the workload to include or exclude SQL statements that areassociated with actions that you specify.
To define a filter for actions:
1. To include only SQL statements associated with a specific action in the workload,select Include only SQL statements associated with these actions.
2. To exclude all SQL statements associated with a specific action from the workload,select Exclude all SQL statements associated with these actions.
3. In the Actions field, enter the actions for which associated SQL statements will beincluded or excluded.
Running SQL Access Advisor: Recommendation OptionsTo improve the underlying data access methods chosen by the optimizer for theworkload, SQL Access Advisor provides recommendation for indexes, materializedviews, and partitioning. Using these access structures can significantly improve theperformance of the workload by reducing the time required to read data from thedatabase. However, you must balance the benefits of using these access structuresagainst the cost to maintain them.
To specify recommendation options:
1. On the SQL Access Advisor: Recommendation Options page, under AccessStructures to Recommend, select the type of access structures to be recommendedby SQL Access Advisor:
Tip: Before you can select the recommendation options for SQLAccess Advisor, do the following:
■ Select initial options, as described in "Running SQL AccessAdvisor: Initial Options" on page 11-2.
■ Select the workload source, as described in "Running SQL AccessAdvisor: Workload Source" on page 11-3.
■ Define the filter options, as described in "Running SQL AccessAdvisor: Filter Options" on page 11-5.

8/7/2019 Performance_Tunning
http://slidepdf.com/reader/full/performancetunning 150/190
Running SQL Access Advisor
11-8 Oracle Database 2 Day + Performance Tuning Guide
■ Indexes
■ Materialized Views
■ Partitioning
In this example, all of the preceding access types are selected.
2. Under Scope, select the mode in which SQL Access Advisor will run. Do one of the following:
■ Select Limited Mode.
In limited mode, SQL Access Advisor focuses on SQL statements with thehighest cost in the workload. The analysis is quicker, but the recommendationsmay be limited.
■ Select Comprehensive Mode.
In comprehensive mode, SQL Access Advisor analyzes all SQL statements inthe workload. The analysis can take much longer, but the recommendationswill be exhaustive.
In this example, Limited Mode is selected.
3. Optionally, click Advanced Options.
The Advanced Options section expands. This section contains the followingsubsections:
■ Workload Categorization
In this section, you can specify the type of workload for which you want arecommendation. The following categories are available:
– Workload Volatility
Select Consider only queries if the workload contains primarily read-onlyoperations, as in data warehouses. Volatility data is useful for online trans-action processing (OLTP) systems, where the performance of INSERT,UPDATE, and DELETE operations is critical.
– Workload Scope
Select Recommend dropping unused access structures if the workloadrepresents all access structure use cases.
■ Space Restrictions
Indexes and materialized views increase performance at the cost of space. Doone of the following:

8/7/2019 Performance_Tunning
http://slidepdf.com/reader/full/performancetunning 151/190
Running SQL Access Advisor
Optimizing Data Access Paths 11-9
– Select No, show me all recommendations (unlimited space) to specify nospace limits. When SQL Access Advisor is invoked with no space limits, itmakes the best possible performance recommendations.
– Select Yes, limit additional space to and then enter the space limit inmegabytes, gigabytes, or terabytes. When SQL Access Advisor is invokedwith a space limit, it produces only recommendations with space
requirements that do not exceed the specified limit.■ Tuning Prioritization
This section enables you to specify how SQL statements will be tuned.Complete the following steps:
– From the Prioritize tuning of SQL statements by list, select a method bywhich SQL statements are to be tuned and then click Add.
– Optionally, select Allow Advisor to consider creation costs whenforming recommendations to weigh the cost of creating access structuresagainst the frequency and potential improvement of SQL statementexecution time. Otherwise, creation cost will be ignored. You should selectthis option if you want specific recommendations generated for SQL
statements that are executed frequently.■ Default Storage Locations
Use this section to override the defaults defined for schema and tablespacelocations. By default, indexes are in the schema and tablespace of the tablethey reference. Materialized views are in the schema and tablespace of the firsttable referenced in the query. Materialized view logs are in the defaulttablespace of the schema of the table that they reference.
4. Click Next.
The SQL Access Advisor: Schedule page appears.
5. Proceed to the next step, as described in "Running SQL Access Advisor: Schedule"
on page 11-9.
Running SQL Access Advisor: ScheduleUse the SQL Access Advisor Schedule page to set or modify the schedule parametersfor the SQL Access Advisor task.

8/7/2019 Performance_Tunning
http://slidepdf.com/reader/full/performancetunning 152/190
Running SQL Access Advisor
11-10 Oracle Database 2 Day + Performance Tuning Guide
Figure 11–1 Scheduling a SQL Access Advisor Task
To schedule a SQL Access Advisor task:
1. On the SQL Access Advisor: Schedule page, under Advisor Task Information,enter a name in the Task Name field if you do not want to use thesystem-generated task name.
In the example shown in Figure 11–1, SQLACCESS9084523 is entered.
2. In the Task Description field, enter a description of the task.
In the example shown in Figure 11–1, SQL Access Advisor is entered.
3. From the Journaling Level list, select the level of journaling for the task.
Journaling level controls the amount of information that is logged to the SQLAccess Advisor journal during task execution. This information appears on theDetails subpage when viewing task results.
Tip: Before you can schedule a SQL Access Advisor task, do thefollowing:
■ Select initial options, as described in "Running SQL AccessAdvisor: Initial Options" on page 11-2.
■ Select the workload source, as described in "Running SQL AccessAdvisor: Workload Source" on page 11-3.
■ Define the filter options, as described in "Running SQL AccessAdvisor: Filter Options" on page 11-5.
■ Specify the recommendation options, as described in "RunningSQL Access Advisor: Recommendation Options" on page 11-7.

8/7/2019 Performance_Tunning
http://slidepdf.com/reader/full/performancetunning 153/190
Running SQL Access Advisor
Optimizing Data Access Paths 11-11
In the example shown in Figure 11–1 on page 11-10, Basic is selected.
4. In the Task Expiration (Days) field, enter the number of days the task will beretained in the database before it is purged.
In the example shown in Figure 11–1 on page 11-10, 30 is entered.
5. In the Total Time Limit (minutes) field, enter the maximum number of minutes
that the job is permitted to run.You must enter a time in this field rather than use the default of UNLIMITED. Inthe example shown in Figure 11–1 on page 11-10, 10 is entered.
6. Under Scheduling Options, in the Schedule Type list, select a schedule type for thetask and a maintenance window in which the task should run. Do one of thefollowing:
■ Click Standard.
This schedule type enables you to select a repeating interval and start time forthe task. Complete the following steps:
– Enter your time zone code in the Time Zone field or click the search iconto locate the code for your area.
– In the Repeat list, select Do Not Repeat to perform the task only once, orselect a unit of time and enter the number of units in the Interval field.
– Under Start, select Immediately to start the task now, or Later to schedulethe task to start at a time specified using the Date and Time fields.
■ Click Use predefined schedule.
This schedule type enables you to select an existing schedule. Do one of thefollowing:
– In the Schedule field, enter the name of the schedule to be used for thetask.
– To search for a schedule, click the search icon.The Search and Select: Schedule dialog box appears.
Select the desired schedule and click Select. The selected schedule nowappears in the Schedule field.
■ Click Standard using PL/SQL for repeated interval.
This schedule types enables you to select a repeating interval and an executiontime period (window) for the task. Complete the following steps:
– Enter your time zone code in the Time Zone field or click the search iconto locate the code for your area.
– Under Available to Start, select Immediately to start the task now, or Later
to schedule the task to start at a time specified using the Date and Time fields.
– In the Repeat list, select Do Not Repeat to perform the task only once, orselect a unit of time and enter the number of units in the Interval field.
– In the Repeated Interval field, enter a PL/SQL schedule expression, suchas SYSDATE+1.
– Under Not Available After, select No End Date to indicate that there is noend date for the execution window, or Specified End Date to specify anend date using the Date and Time fields.

8/7/2019 Performance_Tunning
http://slidepdf.com/reader/full/performancetunning 154/190
Running SQL Access Advisor
11-12 Oracle Database 2 Day + Performance Tuning Guide
■ Click Use predefined window.
This schedule type enables you to select an existing window. Select Stop onWindow Close to stop the job when the window closes. Do one of thefollowing:
– In the Window field, enter the name of the window to be used for the task.
– To search for a window, click the search icon.The Search and Select: Window and Window Groups dialog box appears.
Select the desired window and click Select. The selected window nowappears in the Schedule field.
■ Click Event.
Complete the following steps:
– Enter your time zone code in the Time Zone field or click the search iconto locate the code for your area.
– Under Event Parameters, enter values in the Queue Name and Condition fields.
– Under Start, select Immediately to start the task now, or Later to schedulethe task to start at a time specified using the Date and Time fields.
– Under Not Available After, select No End Date to indicate that there is noend date for the execution window, or Specified End Date to specify anend date using the Date and Time fields.
■ Click Calendar.
Complete the following steps:
– Enter your time zone code in the Time Zone field or click the search iconto locate the code for your area.
– Under Calendar Expression, enter a calendar expression.
– Under Start, select Immediately to start the task now, or Later to schedulethe task to start at a time specified using the Date and Time fields.
– Under Not Available After, select No End Date to indicate that there is noend date for the execution window, or Specified End Date to specify anend date using the Date and Time fields.
In the example shown in Figure 11–1 on page 11-10, Standard is selected forschedule type. The task will not repeat and is scheduled to start immediately.
7. Click Next.
The SQL Access Advisor: Review page appears.

8/7/2019 Performance_Tunning
http://slidepdf.com/reader/full/performancetunning 155/190
Reviewing the SQL Access Advisor Recommendations
Optimizing Data Access Paths 11-13
Under Options, a list of modified options for the SQL Access Advisor task isshown. To display both modified and unmodified options, click Show AllOptions. To view the SQL text for the task, click Show SQL.
8. Click Submit.
The Advisor Central page appears. A message informs you that the task wascreated successfully.
Reviewing the SQL Access Advisor RecommendationsSQL Access Advisor graphically displays the recommendations and provideshyperlinks so that you can quickly see which SQL statements benefit from arecommendation. Each recommendation produced by the SQL Access Advisor islinked to the SQL statement it benefits.
To review the SQL Access Advisor recommendations:
1. On the Advisor Central page, select the SQL Access Advisor task for review andclick View Result.
In this example, Limited Mode is selected.
If the task is not displayed, then you may need to refresh the screen. The Resultsfor Task page appears.
2. Review the Summary subpage, which provides an overview of the SQL AccessAdvisor analysis, as described in "Reviewing the SQL Access AdvisorRecommendations: Summary" on page 11-14.
3. Review the Recommendations subpage, which enables you to view therecommendations ranked by cost improvement, as described in "Reviewing theSQL Access Advisor Recommendations: Recommendations" on page 11-15.
Tip: Before reviewing the SQL Access Advisor recommendations,run SQL Access Advisor to make the recommendations, as described
in "Running SQL Access Advisor" on page 11-1.

8/7/2019 Performance_Tunning
http://slidepdf.com/reader/full/performancetunning 156/190
Reviewing the SQL Access Advisor Recommendations
11-14 Oracle Database 2 Day + Performance Tuning Guide
4. Review the SQL statements analyzed in the workload, as described in "Reviewingthe SQL Access Advisor Recommendations: SQL Statements" on page 11-18.
5. Review the details of the workload, task options, and the SQL Access Advisortask, as described in "Reviewing the SQL Access Advisor Recommendations:Details" on page 11-19.
Reviewing the SQL Access Advisor Recommendations: SummaryThe Summary subpage displays an overview of the SQL Access Advisor analysis.
In this example, Limited Mode is selected.
To review the recommendations summary:
1. On the Results for Tasks page, click Summary.
The Summary subpage appears.
In this example, Limited Mode is selected.
2. Under Overall Workload Performance, assess the potential for improvement inimplementing the recommendations.
3. Use the Workload I/O Cost chart to compare the original workload I/O cost (inred) with the new cost (in blue).
In this example, the workload I/O cost will decrease from 877 to 867 byimplementing the recommendations.
4. Use the Query Execution Time Improvement chart to compare the improvement in
query execution time.This chart shows the percentage of SQL statements in the workload whoseexecution time will improve by accepting the recommendations. The SQLstatements are grouped by the projected improvement factor along the horizontalaxis on the chart (1x to >10x). The percentage of SQL statements that will improveby the projected improvement factor are along the vertical axis (0% to 100%).
In this example, approximately 75 percent of SQL statements in the workload willgain no performance improvement in execution time, but about 25 percent willhave the potential for improvement of over 4x or more.

8/7/2019 Performance_Tunning
http://slidepdf.com/reader/full/performancetunning 157/190
Reviewing the SQL Access Advisor Recommendations
Optimizing Data Access Paths 11-15
5. Under Recommendations, click Show Recommendation Action Counts.
In this example, creating 1 index, 4 materialized views, and 6 materialized viewlogs is recommended.
In this example, Limited Mode is selected.
6. Under SQL Statements, click Show Statement Counts to display the type of SQLstatement.
In this example, 19 SELECT statements are analyzed.
In this example, Limited Mode is selected.
Reviewing the SQL Access Advisor Recommendations: RecommendationsThe Recommendations subpage ranks the SQL Access Advisor recommendations bycost improvement. You can also view details about each recommendation.
To review recommendation details:
1.On the Results for Tasks page, click Recommendations.The Recommendations subpage appears.

8/7/2019 Performance_Tunning
http://slidepdf.com/reader/full/performancetunning 158/190
Reviewing the SQL Access Advisor Recommendations
11-16 Oracle Database 2 Day + Performance Tuning Guide
2. Use the Recommendations by Cost Improvement chart to view recommendationsordered by the cost improvement.
Under Select Recommendations for Implementation, each recommendation islisted with its implementation status, recommendation ID, cost improvement,space consumption, and the number of affected SQL statements for eachrecommendation. Implementing the top recommendation will have the biggest
benefit to the total performance of the workload.
3. To view details for a particular recommendation, select the recommendation andclick Recommendation Details.
The Recommendation Details page appears.

8/7/2019 Performance_Tunning
http://slidepdf.com/reader/full/performancetunning 159/190
Reviewing the SQL Access Advisor Recommendations
Optimizing Data Access Paths 11-17
The Recommendation Details page displays all actions for the specifiedrecommendation.
Under Actions, you can choose to modify the schema name, tablespace name, andstorage clause for each action. To view the SQL text of an action, click the link inthe Action column for the specified action.
Under SQL Affected by Recommendation, the SQL text of the SQL statement andcost improvement information are displayed.
4. Click OK.
The Recommendations subpage appears.
5. To view the SQL text of a recommendation, select the recommendation and click
Show SQL.The Show SQL page for the selected recommendation appears.

8/7/2019 Performance_Tunning
http://slidepdf.com/reader/full/performancetunning 160/190
Reviewing the SQL Access Advisor Recommendations
11-18 Oracle Database 2 Day + Performance Tuning Guide
Reviewing the SQL Access Advisor Recommendations: SQL StatementsThe SQL Statements subpage ranks SQL statements in the workload by costimprovement. You can use this page to view details about the SQL statementsanalyzed in the workload.
To review SQL statements:
1. On the Results for Tasks page, click SQL Statements.
The SQL Statements subpage appears.

8/7/2019 Performance_Tunning
http://slidepdf.com/reader/full/performancetunning 161/190
Reviewing the SQL Access Advisor Recommendations
Optimizing Data Access Paths 11-19
2. Use the SQL Statements by Cost Improvement chart to view SQL statements in theworkload ordered by the cost improvement.
Under Select SQL Statements to be Improved, each SQL statement is listed with its
statement ID, SQL text, associated recommendation, cost improvement, andexecution count.
Implementing the recommendation associated with the top SQL statement willhave the biggest benefit to the total performance of the workload. In this example,implementing the recommendation with ID 1 will produce the biggest benefit, acost improvement of 57.14 percent, for the SQL statement with ID 2421.
3. To view the SQL text of a recommendation, select the recommendation and clickShow SQL.
The Show SQL page for the selected recommendation appears.
Reviewing the SQL Access Advisor Recommendations: DetailsThe Details subpage displays a list of all the workload and task options used in theanalysis. You can also use this subpage to view a list of journal entries for the task,based on the journaling level used when the task was created.
To review workload and task details:
■ On the Results for Tasks page, click Details.
The Details subpage appears.

8/7/2019 Performance_Tunning
http://slidepdf.com/reader/full/performancetunning 162/190
Implementing the SQL Access Advisor Recommendations
11-20 Oracle Database 2 Day + Performance Tuning Guide
Under Workload and Task Options, a list of options that were selected when theadvisor task was created is displayed.
Under Journal Entries, a list of messages that were logged to the SQL AccessAdvisor journal while the task was executing is displayed.
Implementing the SQL Access Advisor RecommendationsA SQL Access Advisor recommendation can range from a simple suggestion to acomplex solution that requires partitioning a set of existing base tables andimplementing a set of database objects such as indexes, materialized views, andmaterialized view logs. You can select the recommendations for implementation andschedule when the job should be executed.
To implement the SQL Access Advisor recommendations:
1. On the Results for Tasks page, click Recommendations.
The Recommendations subpage appears.
2. Under Select Recommendations for Implementation, select the recommendationyou want to implement and click Schedule Implementation.
Tip: Before implementing the SQL Access Advisorrecommendations, review them for cost benefits to determine whichones, if any, should be implemented. For more information, see
"Reviewing the SQL Access Advisor Recommendations" onpage 11-13.

8/7/2019 Performance_Tunning
http://slidepdf.com/reader/full/performancetunning 163/190
Implementing the SQL Access Advisor Recommendations
Optimizing Data Access Paths 11-21
In this example, the recommendation with ID value 1 is selected.
The Schedule Implementation page appears.
3. In the Job Name field, enter a name for the job if you do not want to use the
system-generated job name.4. Determine whether or not the implementation job should stop if an error is
encountered. Do one of the following:
■ To stop processing if an error occurs, select Stop on Error.
■ To continue processing even if an error occurs, deselect Stop on Error.
5. Under Scheduling Options, in the Schedule Type list, select a schedule type for thetask and a maintenance window in which the task should run. Do one of thefollowing:
■ Click Standard.
This schedule type enables you to select a repeating interval and start time for
the task. Complete the following steps:– Enter your time zone code in the Time Zone field or click the search icon
to locate the code for your area.
– In the Repeat list, select Do Not Repeat to perform the task only once, orselect a unit of time and enter the number of units in the Interval field.
– Under Start, select Immediately to start the task now, or Later to schedulethe task to start at a time specified using the Date and Time fields.
■ Click Use predefined schedule.
This schedule type enables you to select an existing schedule. Do one of thefollowing:
– In the Schedule field, enter the name of the schedule to be used for thetask.
– To search for a schedule, click the search icon.
The Search and Select: Schedule dialog box appears.
Select the desired schedule and click Select. The selected schedule nowappears in the Schedule field.
■ Click Standard using PL/SQL for repeated interval.

8/7/2019 Performance_Tunning
http://slidepdf.com/reader/full/performancetunning 164/190
Implementing the SQL Access Advisor Recommendations
11-22 Oracle Database 2 Day + Performance Tuning Guide
This schedule type enables you to select a repeating interval and an executionwindow for the task. Complete the following steps:
– Enter your time zone code in the Time Zone field or click the search iconto locate the code for your area.
– Under Available to Start, select Immediately to start the task now, or Later to schedule the task to start at a time specified using the Date and Time
fields.
– In the Repeat list, select Do Not Repeat to perform the task only once, orselect a unit of time and enter the number of units in the Interval field.
– In the Repeated Interval field, enter a PL/SQL schedule expression, suchas SYSDATE+1.
– Under Not Available After, select No End Date to indicate that there is noend date for the execution window, or Specified End Date to specify anend date using the Date and Time fields.
■ Click Use predefined window.
This schedule type enables you to select an existing window. Select Stop on
Window Close to stop the job when the window closes. Do one of thefollowing:
– In the Window field, enter the name of the window to be used for the task.
– To search for a window, click the search icon.
The Search and Select: Window and Window Groups dialog box appears.
Select the desired window and click Select. The selected window nowappears in the Schedule field.
■ Click Event.
Complete the following steps:
– Enter your time zone code in the Time Zone field or click the search iconto locate the code for your area.
– Under Event Parameters, enter values in the Queue Name and Condition fields.
– Under Start, select Immediately to start the task now, or Later to schedulethe task to start at a time specified using the Date and Time fields.
– Under Not Available After, select No End Date to indicate that there is noend date for the execution window, or Specified End Date to specify anend date using the Date and Time fields.
■ Click Calendar.
Complete the following steps:
– Enter your time zone code in the Time Zone field or click the search iconto locate the code for your area.
– Under Calendar Expression, enter a calendar expression.
– Under Start, select Immediately to start the task now, or Later to schedulethe task to start at a time specified using the Date and Time fields.
– Under Not Available After, select No End Date to indicate that there is noend date for the execution window, or Specified End Date to specify anend date using the Date and Time fields.

8/7/2019 Performance_Tunning
http://slidepdf.com/reader/full/performancetunning 165/190
Implementing the SQL Access Advisor Recommendations
Optimizing Data Access Paths 11-23
In this example, Standard is selected for schedule type. The job will not repeat andis scheduled to start immediately.
6. Optionally, click Show SQL to view the SQL text for the job.
7. To submit the job, click Submit.
If the job is scheduled to start immediately, then the Results for Tasks page for theSQL Access Advisor task appears with a confirmation that the job was successfullycreated.
8. Do one of the following, depending on whether the job is scheduled to startimmediately or later:
■ If you submitted the job immediately, and if the Results for Task page isshown, then click the link in the Scheduler Job field to display the View Jobpage. Go to Step 10.
■ If the job is scheduled to start at a later time, then proceed to Step 9.
9. Complete the following steps:
a. On the Server page, under Oracle Scheduler, click Jobs.
The Scheduler Jobs page appears.
b. Select the implementation job and click View Job Definition.
The View Job page for the selected job appears.
10. On the View Job page, under Operation Detail, check the status of the operation.

8/7/2019 Performance_Tunning
http://slidepdf.com/reader/full/performancetunning 166/190
Implementing the SQL Access Advisor Recommendations
11-24 Oracle Database 2 Day + Performance Tuning Guide
11. Optionally, select the operation and click View.
The Operation Detail page appears.
This page contains information (such as start date and time, run duration, CPUtime used, and session ID) that you can use to troubleshoot the failure.
12. On the Schema subpage, verify that the access structure recommended by SQL
Access Advisor is created.Depending on the type of access structure that is created, you can display theaccess structure using the Indexes page, Materialized Views page, or theMaterialized View Logs page.
In this example, a materialized view named MV$$_00690000 is created in the SH schema.

8/7/2019 Performance_Tunning
http://slidepdf.com/reader/full/performancetunning 167/190
Analyzing SQL Performance Impact 12-1
12Analyzing SQL Performance Impact
System changes, such as upgrading a database or adding an index, may cause changesto execution plans of SQL statements, resulting in a significant impact on SQLperformance. In some cases, the system changes may cause SQL statements to regress,resulting in performance degradation. In other cases, the system changes may improveSQL performance. Being able to accurately forecast the potential impact of systemchanges on SQL performance enables you to tune the system beforehand in cases
where the SQL statements regress, or to validate and measure the performance gain incases where the performance of the SQL statements improves.
SQL Performance Analyzer enables you to forecast the impact of system changes on aSQL workload by:
■ Measuring the performance before and after the change
■ Generating a report that describes the change in performance
■ Identifying the SQL statements that regressed or improved
■ Providing tuning recommendations for each SQL statement that regressed
■ Enabling you to implement the tuning recommendations when appropriate
This chapter contains the following sections:■ SQL Performance Analyzer Usage
■ SQL Performance Analyzer Methodology
■ Running SQL Performance Analyzer
■ Reviewing the SQL Performance Analyzer Report
SQL Performance Analyzer UsageYou can use SQL Performance Analyzer to analyze the SQL performance impact of any type of system changes. Examples of system changes include the following:
■ Database upgrade
When performing a database upgrade, you may not be able to predict how thesystem will perform after the upgrade, or if an existing functionality may beadversely affected. For example, a database upgrade installs a new version of theoptimizer, which has an effect on SQL performance. SQL Performance Analyzerenables you to compare the SQL performance between two versions of Oracle
See Also:
■ Oracle Database Real Application Testing User's Guide for moreinformation about SQL Performance Analyzer

8/7/2019 Performance_Tunning
http://slidepdf.com/reader/full/performancetunning 168/190
SQL Performance Analyzer Methodology
12-2 Oracle Database 2 Day + Performance Tuning Guide
Database. In this way, you can identify and tune SQL statements that maypotentially regress after the database upgrade without affecting your productionsystem.
■ Changes to the operating system, hardware, and database configuration
Changes to the operating systems (such as installing a new operating system),hardware (such as adding more CPU or memory), or database configuration (such
as moving from a single instance database environment to Oracle Real ApplicationClusters) may have a significant effect on SQL performance. SQL PerformanceAnalyzer enables you to determine the improvement or deterioration to SQLperformance when making these changes.
■ Schema change
Changing a schema, such as altering indexes or creating new ones, almostinevitably affects SQL performance. SQL Performance Analyzer enables you todetermine the effect on SQL performance when making a schema change.
■ Database initialization parameter change
Changing the value of a database parameter may produce unexpected results. Forexample, you may enable a specific initialization parameter to improveperformance, but this change may produce unexpected results because the systemconstraints may have changed. SQL Performance Analyzer enables you todetermine the effect on SQL performance when changing a database initializationparameter.
■ SQL tuning
Accepting recommendations from an advisor (such as ADDM, SQL TuningAdvisor, or SQL Access Advisor) may require you to tune problematic SQLstatements. For example, SQL Tuning Advisor may recommend that you accept aSQL profile for a particular SQL statement. SQL Performance Analyzer enablesyou to measure the performance improvement that may be gained by tuning SQLstatements as recommended by the advisors, and determine whether to accept
these recommendations.
SQL Performance Analyzer MethodologyYou can run SQL Performance Analyzer on a test system that closely resembles theproduction system, or on the production system itself. Performing a SQL PerformanceAnalyzer analysis is resource-intensive, so performing the analysis on the productionsystem may cause significant performance degradation.
Any global changes made on the system to test the performance effect may also affectother users of the system. For smaller changes, such as adding or dropping an index,the effect on other users may be acceptable. However, for systemwide changes, such asa database upgrade, using a production system is not recommended and should be
considered only if a test system is unavailable. If a separate test system is available,then running SQL Performance Analyzer on the test system enables you to test theeffects of the changes without affecting the production system.
To ensure that SQL Performance Analyzer can accurately analyze the SQLperformance impact, the test system should be as similar to the production system aspossible. For these reasons, running SQL Performance Analyzer on a test system isrecommended and is the methodology described here. If you choose to run SQLPerformance Analyzer on the production system, then substitute the productionsystem for the test system where applicable.

8/7/2019 Performance_Tunning
http://slidepdf.com/reader/full/performancetunning 169/190
SQL Performance Analyzer Methodology
Analyzing SQL Performance Impact 12-3
Analyzing the SQL performance effect of system changes using SQL PerformanceAnalyzer is an iterative process that involves the following steps:
1. Capture the SQL workload that you want to analyze on the production system, asdescribed in "Capturing and Transporting a SQL Workload" on page 12-3.
2. Transport the SQL workload from the production system to the test system, asdescribed in "Capturing and Transporting a SQL Workload" on page 12-3.
3. Create a SQL Performance Analyzer task on the test system using the SQLworkload as its input source, as described in "Following a Guided Workflow withSQL Performance Analyzer" on page 12-9.
4. Set up the environment on the test system to match the production system asclosely as possible, as described in "Establishing the Initial Environment" onpage 12-11.
5. Build the pre-change performance data by executing the SQL workload on thesystem before the change, as described in "Collecting SQL Performance DataBefore the Change" on page 12-12.
6. Perform the system change on the test system, as described in "Making the SystemChange" on page 12-13.
7. Build the post-change performance data by executing the SQL workload on thesystem after the change, as described in "Collecting SQL Performance Data Afterthe Change" on page 12-14.
8. Compare and analyze the pre-change and post-change versions of performancedata, as described in "Comparing SQL Performance Before and After the Change" on page 12-15.
9. Generate and review a report to identify the SQL statements in the SQL workloadthat have improved, remain unchanged, or regressed after the system change.
10. Tune any regressed SQL statements that are identified, as described in Chapter 10,"Tuning SQL Statements".
11. Ensure that the performance of the tuned SQL statements is acceptable byrepeating Step 5 through Step 10 until your performance goals are met.
This section contains the following topics:
■ Capturing and Transporting a SQL Workload
■ Setting Up the Database Environment on the Test System
■ Executing a SQL Workload
Capturing and Transporting a SQL Workload
Before running SQL Performance Analyzer, capture a set of SQL statements on theproduction system that represents the SQL workload that you intend to analyze andtransport to the test system. The captured SQL statements should include thefollowing information:
■ SQL text
■ Execution environment
– SQL binds, which are bind values needed to execute a SQL statement andgenerate accurate execution statistics
– Parsing schema under which a SQL statement can be compiled

8/7/2019 Performance_Tunning
http://slidepdf.com/reader/full/performancetunning 170/190
SQL Performance Analyzer Methodology
12-4 Oracle Database 2 Day + Performance Tuning Guide
– Compilation environment, including initialization parameters under which aSQL statement is executed
■ Number of times a SQL statement was executed
You can store captured SQL statements in SQL Tuning Sets and use them as an inputsource for SQL Performance Analyzer. Capturing a SQL workload using a SQLTuning Set enables you to do the following:
■ Store the SQL text and any necessary auxiliary information in a single, persistentdatabase object
■ Populate, update, delete, and select captured SQL statements in the SQL TuningSet
■ Load and merge content from various data sources, such as the AutomaticWorkload Repository (AWR) or the cursor cache
■ Export the SQL Tuning Set from the system where the SQL workload is capturedand import it into another system
■ Reuse the SQL workload as an input source for other advisors, such as SQLTuning Advisor and SQL Access Advisor
After you have captured the SQL workload into a SQL Tuning Set on the productionsystem, you must transport it to the test system.
Setting Up the Database Environment on the Test SystemThere are many ways to create a test database. For example, you can use theDUPLICATE command of Recovery Manager (RMAN), Oracle Data Pump, ortransportable tablespaces. Oracle recommends using RMAN because it can create the
test database from pre-existing backups or from the active production datafiles. Theproduction and test databases can reside on the same host or on different hosts.
You should configure the test database environment to match the databaseenvironment of the production system as closely as possible. In this way, SQLPerformance Analyzer can more accurately forecast the effect of the system change onSQL performance.
Executing a SQL WorkloadAfter the SQL workload is captured and transported to the test system, and the initialdatabase environment is properly configured, execute the SQL workload to build thepre-change performance data before making the system change. Executing a SQLworkload runs each of the SQL statements contained in the workload to completion.During execution, SQL Performance Analyzer generates execution plans andcomputes execution statistics for each SQL statement in the workload. After thepre-change performance data is built, you can perform the system change.
See Also:
■ "Creating a SQL Tuning Set" on page 10-8
■ "Transporting SQL Tuning Sets" on page 10-16
See Also:
■ Oracle Database Backup and Recovery User's Guide for informationabout duplicating a database with RMAN

8/7/2019 Performance_Tunning
http://slidepdf.com/reader/full/performancetunning 171/190
Running SQL Performance Analyzer
Analyzing SQL Performance Impact 12-5
After performing the system change, execute the SQL workload again to build thepost-change performance data. SQL Performance Analyzer generates execution plansand computes execution statistics for each SQL statement in the workload a secondtime, resulting in a new set of performance data that can be used to compare to thepre-change version of the performance data.
Depending on its size, executing a SQL workload can be resource-intensive and cause
a significant performance impact. When executing a SQL workload, you can choose togenerate execution plans only, without collecting execution statistics. This techniqueshortens the time to run the execution and lessens the effect on system resources, butthe results of the comparison analysis may not be as accurate. If you are running SQLPerformance Analyzer on the production system, then consider executing the SQLworkload using a private session to avoid affecting the rest of the system.
Running SQL Performance AnalyzerSQL Performance Analyzer enables you to analyze the effects of environmentalchanges on execution of SQL statements in SQL Tuning Sets. As explained in"Managing SQL Tuning Sets" on page 10-8, a SQL Tuning Set is a database object thatincludes one or more SQL statements along with their execution statistics and
execution context. In addition to the performance analysis, SQL Performance Analyzercan invoke SQL Advisor and provide tuning recommendations.
SQL Performance Analyzer guides you through the SQL workload comparison bymeans of the following workflows:
■ Parameter Change
Use this workflow to determine how a database initialization parameter changewill affect SQL performance.
■ Guided Workflow
Use this workflow to compare SQL performance for all types of system changesother than a database initialization parameter change.
In each of the preceding workflows, you must create a SQL Performance Analyzertask. A task is a container for the results of SQL trials. A SQL trial captures theexecution performance of a SQL Tuning Set under specific environmental conditions.
To run SQL Performance Analyzer:
1. On the Database Home page, click Advisor Central.
The Advisor Central page appears.
2. Click SQL Performance Analyzer.
SQL Performance Analyzer page appears. A list of existing SQL PerformanceAnalyzer tasks are displayed.

8/7/2019 Performance_Tunning
http://slidepdf.com/reader/full/performancetunning 172/190
Running SQL Performance Analyzer
12-6 Oracle Database 2 Day + Performance Tuning Guide
3. Do one of the following:
■ Proceed to "Testing an Initialization Parameter Change with SQL PerformanceAnalyzer" on page 12-6.
■ Proceed to "Following a Guided Workflow with SQL Performance Analyzer" on page 12-9.
Testing an Initialization Parameter Change with SQL Performance AnalyzerThe Parameter Change workflow enables you to test the performance effect on a SQLTuning Set when you vary a single environment initialization parameter between twovalues. For example, you can compare SQL performance when the sort area size isincreased from 1 MB to 2 MB.
After you select a SQL Tuning Set and a comparison metric, SQL PerformanceAnalyzer creates a task and performs a trial with the initialization parameter set to theoriginal value. The Analyzer then performs a second trial with the parameter set to the
new value. The system-generated SQL trial Comparison report evaluates theregression.
To test an initialization parameter change:
1. On the SQL Performance Analyzer page, click Parameter Change.
The Parameter Change page appears.
See Also:
■ Oracle Database Real Application Testing User's Guide forinformation about running SQL Performance Analyzer using APIs

8/7/2019 Performance_Tunning
http://slidepdf.com/reader/full/performancetunning 173/190
Running SQL Performance Analyzer
Analyzing SQL Performance Impact 12-7
2. In the Task Name field, enter the name of the task.
For example, enter SORT_TIME.
3. Select the SQL Tuning Set. Do one of the following:
■ In SQL Tuning Set, enter the name the SQL Tuning Set that contains the SQLworkload to be analyzed.
■ Click the search icon to search for a SQL Tuning Set, and then select the set.
The tuning set now appears in the SQL Tuning Set field.
4. In the Description field, optionally enter a description of the task.
For example enter the following text: Double the value ofsort_area_size.
5. In the Creation Method list, determine how the SQL trial is created and whatcontents are generated by performing one of the following actions:
■ Select Execute SQLs.
The SQL trial generates both execution plans and statistics for each SQLstatement in the SQL tuning set by actually running the SQL statements.
■ Select Generate Plans.
The SQL trial invokes the optimizer to create execution plans only withoutactually running the SQL statements.
6. In the Per-SQL Time Limit list, determine the time limit for SQL execution duringthe trial by performing one of the following actions:
■ Select Unlimited.

8/7/2019 Performance_Tunning
http://slidepdf.com/reader/full/performancetunning 174/190
Running SQL Performance Analyzer
12-8 Oracle Database 2 Day + Performance Tuning Guide
The execution will run each SQL statement in the SQL tuning set tocompletion and gather performance data. Collecting execution statisticsprovides greater accuracy in the performance analysis but takes a longer time.
■ Select Customize and enter the specified number of seconds, minutes, orhours.
7. In the Parameter Change section, complete the following steps:
a. In the Parameter Name field, enter the name of the initialization parameterwhose value you want to modify, or click the Search icon to review the currentparameter settings.
For example, enter sort_area_size.
b. In the Base Value field, enter the current value of the initialization parameter.
For example, enter 1048576.
c. In the Changed Value field, enter the new value of the initializationparameter.
For example, enter 2097152.
8. In the Comparison Metric list, select the comparison metric to use for the analysis:■ If you selected Generate Plans in Step 5, then select Optimizer Cost.
■ If you selected Execute SQLs in Step 5, then select one of the followingoptions:
– Elapsed Time
– CPU Time
– Buffer Gets
– Disk Reads
– Direct Writes
– Optimizer Cost
To perform the comparison analysis by using more than one comparison metric,perform separate comparison analyses by repeating this procedure using differentmetrics.
9. In the Schedule section:
a. In the Time Zone list, select your time zone code.
b. Select Immediately to start the task now, or Later to schedule the task to startat a time specified using the Date and Time fields.
10. Click Submit.
A confirmation message appears.
In the SQL Performance Analyzer Tasks section, the status of this task isdisplayed. To refresh the status icon, click Refresh. After the task completes, theLast Run Status icon changes to a check mark.

8/7/2019 Performance_Tunning
http://slidepdf.com/reader/full/performancetunning 175/190
Running SQL Performance Analyzer
Analyzing SQL Performance Impact 12-9
11. In the SQL Performance Analyzer Tasks section, select the task and click the linkin the Name column.
The SQL Performance Analyzer Task page appears.
This page contains the following sections:
■ SQL Tuning Set
This section summarizes information about the SQL tuning set, including itsname, owner, description, and the number of SQL statements it contains.
■ SQL Trials
This section includes a table that lists the SQL trials used in the SQL
Performance Analyzer task.■ SQL Trial Comparisons
This section contains a table that lists the results of the workload comparisons
12. Click the icon in the Comparison Report column.
The SQL Performance Analyzer Task Result page appears.
13. Review the results of the performance analysis, as described in "Reviewing theSQL Performance Analyzer Report" on page 12-17.
Following a Guided Workflow with SQL Performance AnalyzerYou can use the guided workflow to compare the performance of SQL statementsbefore and after a variety of system changes that can impact the performance of theSQL workload.
Tip: Before you can create a SQL Performance Analyzer task, capturethe SQL workload to be used in the performance analysis into a SQLTuning Set on the production system. Afterward, transport theworkload to the test system where the performance analysis will beperformed, as described in "Capturing and Transporting a SQLWorkload" on page 12-3.

8/7/2019 Performance_Tunning
http://slidepdf.com/reader/full/performancetunning 176/190
Running SQL Performance Analyzer
12-10 Oracle Database 2 Day + Performance Tuning Guide
To initiate a guided workflow:
1. On the SQL Performance Analyzer page, click Guided Workflow.
The Guided Workflow page appears.
This page lists the required steps in the SQL Performance Analyzer task insequential order. Each step must be completed in the order displayed before youcan begin the next step.
2. Proceed to the next step, as described in "Creating a SQL Performance AnalyzerTask Based on a SQL Tuning Set" on page 12-10.
Creating a SQL Performance Analyzer Task Based on a SQL Tuning Set
To run SQL Performance Analyzer, you must create a SQL Performance Analyzer task.The task requires you to select the SQL Tuning Set containing the workload to be usedin the performance analysis.
The SQL Tuning Set remains constant in the SQL Performance Analyzer task and isexecuted in isolation during each SQL trial. Thus, performance differences betweentrials are caused by environmental differences.
To create a task based on a SQL Tuning Set:
1. In the Guided Workflow page, click the Execute icon for the Create SQLPerformance Analyzer Task based on SQL Tuning Set step.
The Create SQL Performance Analyzer Task page appears.
Tip: Before you can create a SQL Performance Analyzer task basedon a SQL Tuning Set, capture the SQL workload for the performanceanalysis in a SQL Tuning Set on the production system. Transport theset to the test system, as described in "Capturing and Transporting aSQL Workload" on page 12-3.

8/7/2019 Performance_Tunning
http://slidepdf.com/reader/full/performancetunning 177/190
Running SQL Performance Analyzer
Analyzing SQL Performance Impact 12-11
2. In the Name field, enter the name of the task.
3. In the Description field, optionally enter a description of the task.
4. In the SQL Tuning Set section, do one of the following:
■ In Name, enter the name the SQL Tuning Set that contains the SQL workload
to be analyzed.
■ Click the search icon to search for a SQL Tuning Set, and then select the set.
The tuning set now appears in the Name field.
5. Click Create.
The Guided Workflow page appears.
The Status icon of this step has changed to a check mark and the Execute icon forthe next step is now enabled.
6. Proceed to the next step, as described in "Establishing the Initial Environment" onpage 12-11.
Establishing the Initial Environment
After selecting a SQL Tuning Set as the input source, establish the initial environmenton the test system. This step is not included in the Guided Workflow page becauseyou must perform it manually. For more information about setting up the databaseenvironment, see "Setting Up the Database Environment on the Test System" onpage 12-4.
To establish the initial environment:
1. On the test system, manually make any necessary environmental changes affectingSQL optimization and performance.
These changes could include changing initialization parameters, gathering orsetting optimizer statistics, and creating indexes.
2. Proceed to the next step, as described in "Collecting SQL Performance Data Beforethe Change".
Tip: Before you establish the initial environment, select a SQLTuning Set, as described in "Creating a SQL Performance AnalyzerTask Based on a SQL Tuning Set" on page 12-10.

8/7/2019 Performance_Tunning
http://slidepdf.com/reader/full/performancetunning 178/190
Running SQL Performance Analyzer
12-12 Oracle Database 2 Day + Performance Tuning Guide
Collecting SQL Performance Data Before the Change
After you have properly configured the initial environment on the test system, buildthe pre-change version of performance data by executing the SQL workload beforeperforming the system change. For more information about executing a workload, see"Executing a SQL Workload" on page 12-4.
To collect SQL performance data before the change:
1. On the Guided Workflow page, click the Execute icon for the Replay SQL TuningSet in Initial Environment step.
The Create SQL trial page appears. A summary of the selected SQL Tuning Setcontaining the SQL workload is displayed.
2. In the SQL Trial Name field, enter the name of the SQL trial.
3. In the SQL Trial Description field, enter a description of the SQL trial.
4. In the Creation Method list, determine how the SQL trial is created and whatcontents are generated by performing one of the following actions:
■ Select Execute SQLs Locally.
The SQL trial generates both execution plans and statistics for each SQLstatement in the SQL tuning set by actually running the SQL statementslocally on the test system.
■ Select Execute SQLs Remotely.
The SQL trial generates both execution plans and statistics for each SQLstatement in the SQL tuning set by actually running the SQL statementsremotely on another test system over a public database link.
■ Select Generate Plans Locally.
The SQL trial invokes the optimizer to create execution plans locally on thetest system without actually running the SQL statements.
■ Select Generate Plans Remotely.
Tip: Before computing the pre-change version of performance data,establish the initial environment, as described in "Establishing theInitial Environment" on page 12-11.

8/7/2019 Performance_Tunning
http://slidepdf.com/reader/full/performancetunning 179/190
Running SQL Performance Analyzer
Analyzing SQL Performance Impact 12-13
The SQL trial invokes the optimizer to create execution plans remotely onanother test system over a public database link without actually running theSQL statements.
■ Select Build From SQL Tuning Set.
The SQL trial copies the execution plans and statistics from the SQL tuning setdirectly into the trial.
5. In the Per-SQL Time Limit list, determine the time limit for SQL execution duringthe trial by performing one of the following actions:
■ Select Unlimited.
The execution will run each SQL statement in the SQL tuning set tocompletion and gather performance data. Collecting execution statisticsprovides greater accuracy in the performance analysis but takes a longer time.
■ Select Customize and enter the specified number of seconds, minutes, orhours.
6. Ensure that the database environment on the test system matches the productionenvironment as closely as possible, and select Trial environment established.
7. In the Schedule section, do one of the following:
a. Enter your time zone code in the Time Zone field or click the search icon tolocate the code for your area.
b. Select Immediately to start the task now, or Later to schedule the task to startat a time specified with the Date and Time fields.
8. Click OK.
The Guided Workflow page appears when the execution begins.
The status icon of this step changes to a clock while the execution is in progress.To refresh the status icon, click Refresh. Depending on the options selected andthe size of the SQL workload, the execution may take a long time to complete.
After the execution is completed, the Status icon will change to a check mark andthe Execute icon for the next step is enabled.
9. Proceed to the next step, as described in "Making the System Change" onpage 12-13.
Making the System Change
After computing the pre-change SQL performance data, perform the system change onthe test system. This step is not included in the Guided Workflow page because youmust perform it manually. Depending on the type of change, it may be necessary toreconfigure the environment on the test system to match the new environment forwhich you want to perform SQL performance analysis, as described in "Setting Up theDatabase Environment on the Test System" on page 12-4.
SQL Performance Analyzer can analyze the SQL performance impact of any type of system change. For example, you may want to test an application upgrade thatinvolves changes such as database table redesign, adding or removing indexes, and soon. For examples of different types of system changes that can be analyzed by SQLPerformance Analyzer, see "SQL Performance Analyzer Usage" on page 12-1.
Tip: Before making the system change, build the pre-change versionof performance data, as described in "Collecting SQL PerformanceData Before the Change" on page 12-12.

8/7/2019 Performance_Tunning
http://slidepdf.com/reader/full/performancetunning 180/190
Running SQL Performance Analyzer
12-14 Oracle Database 2 Day + Performance Tuning Guide
To make the system change:
1. Make the necessary changes to the test system.
2. Proceed to the next step, as described in "Collecting SQL Performance Data Afterthe Change" on page 12-14.
Collecting SQL Performance Data After the Change
After you have made the system change, build the post-change version of performancedata by executing the SQL workload again. For more information about executing aworkload, see "Executing a SQL Workload" on page 12-4.
To collect SQL performance after the change:
1. On the Guided Workflow page, click the Execute icon for the Replay SQL TuningSet in Changed Environment step.
The Create SQL trial page appears.
2. In the SQL Trial Name field, enter the name of the execution.
3. In the SQL Trial Description field, enter a description of the execution.
4. In the Creation Method list, determine how the SQL trial is created and whatcontents are generated by performing one of the following actions:
■ Select Execute SQLs Locally.
The SQL trial generates both execution plans and statistics for each SQLstatement in the SQL tuning set by actually running the SQL statementslocally on the test system.
■ Select Execute SQLs Remotely.
The SQL trial generates both execution plans and statistics for each SQLstatement in the SQL tuning set by actually running the SQL statementsremotely on another test system over a public database link.
■ Select Generate Plans Locally.
The SQL trial invokes the optimizer to create execution plans locally on thetest system without actually running the SQL statements.
■ Select Generate Plans Remotely.
The SQL trial invokes the optimizer to create execution plans remotely onanother test system over a public database link without actually running theSQL statements.
For each of these creation methods, the application schema and data shouldalready exist on the local or remote test system.
5. In the Per-SQL Time Limit list, determine the time limit for SQL execution duringthe trial by performing one of the following actions:
■ Select Unlimited.
The execution will run each SQL statement in the SQL tuning set tocompletion and gather performance data. Collecting execution statisticsprovides greater accuracy in the performance analysis but takes a longer time.
Tip: Before you can build the post-change version of performancedata, make the system change, as described in "Making the SystemChange" on page 12-13.

8/7/2019 Performance_Tunning
http://slidepdf.com/reader/full/performancetunning 181/190
Running SQL Performance Analyzer
Analyzing SQL Performance Impact 12-15
■ Select Customize and enter the specified number of seconds, minutes, orhours.
6. Ensure that the database environment on the test system is set up to match theproduction environment as closely as possible, and select Trial environmentestablished.
7. In the Schedule section, complete the following steps:
a. Enter your time zone code in the Time Zone field or click the search icon tolocate the code for your area.
b. Select Immediately to start the task now, or Later to schedule the task to startat a time specified using the Date and Time fields.
8. Click OK.
The Guided Workflow page appears when the execution begins.
The status icon of this step changes to an arrow icon while the execution is inprogress. To refresh the status icon, click Refresh. Depending on the optionsselected and the size of the SQL workload, the execution may take a long time tocomplete. After the execution is completed, the Status icon will change to a check
mark and the Execute icon for the next step is enabled.9. Proceed to the next step, as described in "Comparing SQL Performance Before and
After the Change" on page 12-15.
Comparing SQL Performance Before and After the Change
After the post-change SQL performance data is built, compare the pre-change versionof performance data to the post-change version by running a comparison analysis.
To analyze SQL performance before and after the change:
1. On the Guided Workflow page, click the Execute icon for Compare Step 2 andStep 3.
The Run SQL Trial Comparison page appears.
Tip: Before you can compare the pre-change version of performancedata with the post-change version, build the post-change version of performance data, as described in "Collecting SQL Performance DataAfter the Change" on page 12-14.

8/7/2019 Performance_Tunning
http://slidepdf.com/reader/full/performancetunning 182/190
Running SQL Performance Analyzer
12-16 Oracle Database 2 Day + Performance Tuning Guide
In this example, theSQL_TRIAL_1207494888380
andSQL_TRIAL_1207499034916 trials are selected for comparison.
2. To compare trials other than those listed by default, select the desired trials in theTrial 1 Name and Trial 2 Name lists.
Note that you cannot compare a statistical trial with a trial that tests the explainplan only.
3. In the Comparison Metric list, select the comparison metric to use for thecomparison analysis.
The types of comparison metrics you can use include:
■ Elapsed Time
■ CPU Time
■ Buffer Gets
■ Disk Reads
■ Direct Writes
■ Optimizer Cost
To perform the comparison analysis by using more than one comparison metric,perform separate comparison analyses by repeating this procedure with differentmetrics.
4. In the Schedule section, complete the following steps:
a. Enter your time zone code in the Time Zone field or click the search icon tolocate the code for your area.
b. Select Immediately to start the task now, or Later to schedule the task to startat a time specified using the Date and Time fields.
5. Click Submit.
The Guided Workflow page appears when the comparison analysis begins.
The status icon of this step changes to an arrow icon while the comparisonanalysis is in progress. To refresh the status icon, click Refresh. Depending on the

8/7/2019 Performance_Tunning
http://slidepdf.com/reader/full/performancetunning 183/190
Reviewing the SQL Performance Analyzer Report
Analyzing SQL Performance Impact 12-17
amount of performance data collected from the pre-change and post-changeexecutions, the comparison analysis may take a long time to complete. After thecomparison analysis is completed, the Status icon changes to a check mark.
6. Click the Execute icon for View Trial Comparison Result.
The SQL Performance Analyzer Task Result page appears.
7.Review the results of the analysis, as described in "Reviewing the SQLPerformance Analyzer Report" on page 12-17.
Reviewing the SQL Performance Analyzer ReportWhen a SQL Performance Analyzer task is completed, the resulting data is generatedinto a report. This section shows a sample of a SQL Performance Analyzer report. Thissample report uses the elapsed time comparison metric to compare the pre-change andpost-change executions of a SQL workload.
To review the SQL Performance Analyzer report:
1. Review the general information about the performance analysis, as described in"Reviewing the SQL Performance Analyzer Report: General Information" onpage 12-17.
2. Review general statistics, as described in "Reviewing the SQL Performance
Analyzer Report: Global Statistics" on page 12-18.
3. Optionally, review the detailed statistics, as described in "Reviewing the SQLPerformance Analyzer Report: Global Statistics Details" on page 12-19.
Reviewing the SQL Performance Analyzer Report: General Information
The General Information section contains basic information and metadata about theworkload comparison performed by SQL Performance Analyzer.

8/7/2019 Performance_Tunning
http://slidepdf.com/reader/full/performancetunning 184/190
Reviewing the SQL Performance Analyzer Report
12-18 Oracle Database 2 Day + Performance Tuning Guide
To review general information:
1. On the SQL Performance Analyzer Task Result page, review the information at thetop of the page.
This summary at the top of the page includes the following information:
■ The name, owner, and description of the SQL Performance Analyzer task
■ The name and owner of the SQL Tuning Set
■ The total number of SQL statements in the tuning set and the number of failing statements
■ The names of the SQL trials and the comparison metric used
2. Optionally, click the link next to SQL Tuning Set Name.
The SQL Tuning Set page appears.
This page contains information the SQL ID, SQL text, and related informationabout every SQL statement in the set.
3. Click the link next to SQL Statements With Errors if errors were found.
The SQL Performance Analyzer Task Result page appears.
The Errors table reports all errors that occurred while executing a given SQLworkload. An error may be reported at the SQL Tuning Set level if it is common toall statements executions in the SQL Tuning Set, or at the execution level if it isspecific to a SQL statement or execution plan.
4. Review general statistics, as described in "Reviewing the SQL Performance
Analyzer Report: Global Statistics" on page 12-18.
Reviewing the SQL Performance Analyzer Report: Global Statistics
The Global Statistics section reports statistics that describe the overall performance of the entire SQL workload. This section is a very important part of the SQL PerformanceAnalyzer analysis because it reports on the impact of the system change on the overallperformance of the SQL workload. Use the information in this section to understandthe tendency of the workload performance, and determine how the workloadperformance will be affected by the system change.
To review the global statistics:
1. Review the chart in the Projected Workload Execute Elapsed Time subsection.The chart shows the two replay executions on the x-axis and the execute elapsedtime (in seconds) on the y-axis.

8/7/2019 Performance_Tunning
http://slidepdf.com/reader/full/performancetunning 185/190
Reviewing the SQL Performance Analyzer Report
Analyzing SQL Performance Impact 12-19
The most important statistic is the overall impact, which is given as a percentage.The overall impact is the difference between the improvement impact and theregression impact. You can click the link for any impact statistic to obtain moredetails, as described in "Reviewing the SQL Performance Analyzer Report: GlobalStatistics Details" on page 12-19.
In this example, the improvement impact is 44%, while the regression impact is-6%, so the overall impact of the system change is an improvement of approximately 37%.
2. Review the chart in the SQL Statement Count subsection.
The x-axis of the chart shows the number of SQL statements that are improved,regressed, and unchanged after the system change. The y-axis shows the numberof SQL statements. The chart also indicates whether the explain plan was changedor unchanged for the SQL statements.
This chart enables you to quickly weigh the relative performance of the SQLstatements. You can click any bar in the chart to obtain more details, as describedin "Reviewing the SQL Performance Analyzer Report: Global Statistics Details" onpage 12-19.
In this example, all SQL statements were unchanged after the system change.
Reviewing the SQL Performance Analyzer Report: Global Statistics Details
You can use the SQL Performance Analyzer Report to obtain detailed statistics for theSQL workload comparison. The details chart enables you to drill down into the
performance of SQL statements that appears in the Result Summary section of thereport. Use the information in this section to investigate why the performance of aparticular SQL statement regressed.
To review the global statistics details:
1. Click the bar in any chart on the SQL Performance Analyzer Task Result page, orclick the impact percentages in the Projected Workload Execute Elapsed Timesubsection.

8/7/2019 Performance_Tunning
http://slidepdf.com/reader/full/performancetunning 186/190
Reviewing the SQL Performance Analyzer Report
12-20 Oracle Database 2 Day + Performance Tuning Guide
A table including the detailed statistics appears. Depending on the table, thefollowing columns are included:
■ SQL ID
This column indicates the ID of the SQL statement.
■ Net Impact on Workload (%)
This column indicates the impact of the system change relative to theperformance of the SQL workload.
■ Elapsed Time
This column indicates the total time (in seconds) of the SQL statementexecution.
■ Net Impact on SQL (%)
This column indicates the local impact of the change on the performance of aparticular SQL statement.
■ % of Workload
This column indicates the percentage of the total workload consumed by thisSQL statement.
■ Plan Changed
This column indicates whether the SQL execution plan changed.
2. Click SQL ID for any SQL statement in the table.
The SQL Details page appears.
You can use this page to access the text of the SQL statement and obtain low-leveldetails such as CPU time, buffer gets, and optimizer cost.

8/7/2019 Performance_Tunning
http://slidepdf.com/reader/full/performancetunning 187/190
Index-1
Index
A
actionsabout, 4-7
Active Session Historyabout, 7-1report
about, 7-2activity over time, 7-7load profile, 7-4running, 7-2top events, 7-3Top SQL, 7-5using, 7-3
sampled data, 7-1statistics, 2-4
alertsclearing, 5-3default, 5-1performance, 5-1purging, 5-3
responding to, 5-2Automatic Database Diagnostic Monitorabout, 3-1accessing results, 6-4analysis, 3-2configuring, 3-3DB time, 3-2enabling, 2-5findings
about, 3-8viewing, 3-7
for Oracle RAC, 3-3identifying high-load SQL, 9-1recommendations
actions, 3-9implementing, 3-9interpreting, 3-8rationales, 3-9types, 3-2
report, 3-8reviewing results, 3-7running manually
analyzing current database performance, 6-1analyzing historical database performance, 6-3
Automatic SQL Tuning
modifying task attributes, 10-7viewing recommendations, 10-7viewing results, 10-5
Automatic Workload Repositoryabout, 2-1baselines, 8-1compare periods report
about, 8-1details, 8-18saving, 8-12, 8-15summary, 8-16supplemental information, 8-18using, 8-15using another baseline, 8-10using snapshot pairs, 8-13
configuring, 2-2enabling, 2-2, 2-5snapshots, 2-2statistics collected, 2-2using, 3-4
B
baselinesabout, 8-1baseline template
about, 8-2, 8-5comparing, 8-10computing threshold statistics for, 8-6creating
single, 8-2deleting, 8-5
C
clientsabout, 4-8
CONTROL_MANAGEMENT_PACK_ACCESSparameter and ADDM, 3-3
CPUI/O wait, 4-20load, 4-21performance problems, 4-21utilization
about, 4-18monitoring, 4-19

8/7/2019 Performance_Tunning
http://slidepdf.com/reader/full/performancetunning 188/190
Index-2
customizing the Performance page, 4-27
D
data access paths, optimizing, 11-1database
statistics, 2-1time, 2-2, 3-2, 3-8
database performancealerts, 5-1automatic monitoring, 3-1comparing, 8-1current analysis, 6-1degradation over time, 8-1historical analysis, 6-3manual monitoring, 6-1overview, 2-1
Database Resource Managerusing, 4-22
database tuningperformance degradation over time, 8-1preparing the database, 2-5proactive tuning, 2-6reactive tuning, 2-7real-time performance problems, 4-1SQL tuning, 2-7tools, 1-2transient performance problems, 7-1using the Performance page, 4-1
DB timeabout, 2-2and ADDM, 3-2and ADDM finding, 3-8
DBIO_EXPECTED parameterabout, 3-4setting, 3-3, 3-4
DBMS_ADVISOR packageconfiguring ADDM, 3-4setting DBIO_EXPECTED, 3-4
diskperformance problems, 4-27utilization
about, 4-18monitoring, 4-25
E
execution planabout, 10-1viewing for a SQL statement, 9-7
H
high-load SQLabout, 9-1identifying using ADDM, 9-1identifying using Top SQL, 9-2identifying using Top SQL by wait class, 9-3statistics, 2-4tuning, 10-2, 10-5viewing details, 9-4
viewing execution plans, 9-7viewing session activity, 9-6viewing SQL profiles, 9-8viewing SQL text, 9-4viewing SQL Tuning Advisor tasks, 9-8viewing statistics, 9-5viewing tuning information, 9-8
host activity, monitoring, 4-17
I
indexabout, 11-1bitmap, 11-1B-tree, 11-1creating, 11-2functional, 11-1
indexescreating, 2-7
instance activitymonitoring, 4-10monitoring I/O wait times, 4-12monitoring parallel execution, 4-16monitoring services, 4-16monitoring throughput, 4-11
I/O wait times, monitoring, 4-12
M
materialized view logsabout, 11-1creating, 2-7, 11-2
materialized viewscreating, 2-7, 11-2
memoryperformance problems, 4-24swap utilization, 4-24utilization
about, 4-18monitoring, 4-22
metrics, 5-1, 8-7modules, 4-7
N
new features, list of, xi
O
optimizer, use of SQL profiles in, 10-19
Oracle performance methodabout, 2-1pretuning tasks, 2-5proactive database tuning tasks, 2-6reactive database tuning tasks, 2-7SQL tuning tasks, 2-7using, 2-5
P
parallel execution, monitoring, 4-16

8/7/2019 Performance_Tunning
http://slidepdf.com/reader/full/performancetunning 189/190
Index-3
parametersDBIO_EXPECTED, 3-4initialization, 8-18STATISTICS_LEVEL, 2-2, 2-5
Performance page customization, 4-27performance problems
common, 2-8CPU, 4-21diagnosing, 3-1disk, 4-27memory, 4-24real-time, 4-1transient, 7-1
S
servicesabout, 4-6, 4-16monitoring, 4-6, 4-16
sessions, monitoring, 4-5snapshots
about, 2-2comparing, 8-13creating, 3-5default interval, 3-4filtering, 8-13modifying settings, 3-5viewing statistics, 3-12
SQL Access Advisorabout, 10-1, 11-1filters, 11-5initial options, 11-2recommendations
about, 11-1details, 11-15implementing, 11-20options, 11-7reviewing, 11-13SQL, 11-18summary, 11-14
running, 11-2scheduling, 11-10task options, 11-19workload options, 11-19workload source, 11-3
SQL Performance Analyzerabout, 12-1database environment
setting up, 12-4
following guided workflow, 12-9initial environmentestablishing, 12-11
methodology, 12-2performance data
collecting post-change version, 12-14collecting pre-change version, 12-12comparing, 12-15
running, 12-5SQL Performance Analyzer report
general information, 12-17
global statistics, 12-18global statistics details, 12-19reviewing, 12-17
SQL Tuning Setselecting, 12-10
SQL workloadcapturing, 12-3executing, 12-4transporting, 12-4
system changemaking, 12-13
testing parameter change, 12-6usage, 12-1
SQL profilesabout, 10-19deleting, 10-19disabling, 10-19enabling, 10-19viewing information, 9-8
SQL Tuning Advisorabout, 10-1automated maintenance tasks, 10-5comprehensive scope, 10-3implementing recommendations, 10-5limited scope, 10-3using, 10-2, 10-5viewing information, 9-8viewing results, 10-4
SQL Tuning Setsabout, 10-8, 12-5creating, 10-8load method, 10-10transporting, 10-8
statisticsActive Session History, 2-4
baselines, 8-1databases, 2-1DB time, 2-2, 3-2, 3-8default retention, 3-4gathered by the Automatic Workload
Repository, 2-2gathering, 2-1high-load SQL, 2-4, 9-5, 9-6sampled data, 7-1session, 2-4system, 2-4time model, 2-2wait events, 2-3
STATISTICS_LEVEL parameter
and ADDM, 3-3and the Automatic Workload Repository, 2-2setting, 2-5
T
throughput, monitoring, 4-11time model statistics
about, 2-2Top Actions
user activity, 4-7

8/7/2019 Performance_Tunning
http://slidepdf.com/reader/full/performancetunning 190/190
top activitytop SQL, 9-2, 9-4
Top Clientsuser activity, 4-8
Top Filesuser activity, 4-9
Top Modulesuser activity, 4-7
Top Objectsuser activity, 4-10
Top PL/SQLuser activity, 4-9
Top Servicesuser activity, 4-6
Top SQLActive Session History report, 7-5by wait class, 9-3identifying high-load SQL, 9-2user activity, 4-4
Top Working Sessionsuser activity, 4-5
U