performanperformancccce highlightse highlightse highlights · performanperformancccce highlightse...
TRANSCRIPT


PerformanPerformanPerformanPerformancccce Highlightse Highlightse Highlightse Highlights
� Sharp decline in the performance of SLPEs during the previous years till 2015-16 continue to cast shadow over the performance during the past six months
� Total turnover: Rs.1302 Crores
� Number for profit making units: 11
� Net loss of 41 units: Rs.59 crores
� Turnaround units
• Travancore Cochin Chemicals Ltd
• Travancore Titanium Products Ltd
• Steel and Industrial Forgings Ltd � Chemical Sector contributes 53% of the overall turnover
� Chemical, Wood based and Developmental and Infrastructure sectors are in operating profitably
• Profit earned by major PSUs.
• Kerala Minerals and Metals Ltd: Rs.23.22 crores
• Malabar Cements Ltd: Rs.18.59 crores � Textile sector and Electrical Sector together causes
more than 50% of the loss.

1
PUBLIC SECTOR RESTRUCTURING AND INTERNAL
AUDIT BOARD (RIAB)
Sub:- Half yearly Performance of the State Level Public Enterprises during
the period April to September 2016
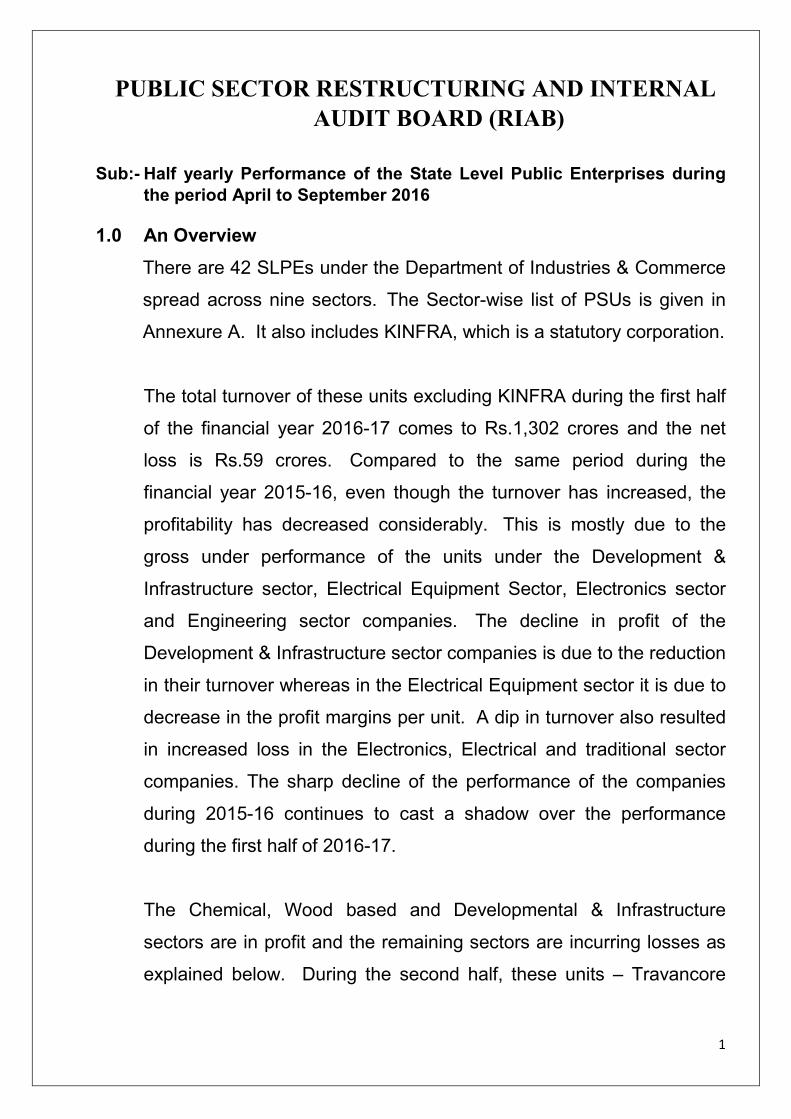
1.0 An Overview
There are 42 SLPEs under the Department of Industries & Commerce
spread across nine sectors. The Sector-wise list of PSUs is given in
Annexure A. It also includes KINFRA, which is a statutory corporation.
The total turnover of these units excluding KINFRA during the first half
of the financial year 2016-17 comes to Rs.1,302 crores and the net
loss is Rs.59 crores. Compared to the same period during the
financial year 2015-16, even though the turnover has increased, the
profitability has decreased considerably. This is mostly due to the
gross under performance of the units under the Development &
Infrastructure sector, Electrical Equipment Sector, Electronics sector
and Engineering sector companies. The decline in profit of the
Development & Infrastructure sector companies is due to the reduction
in their turnover whereas in the Electrical Equipment sector it is due to
decrease in the profit margins per unit. A dip in turnover also resulted
in increased loss in the Electronics, Electrical and traditional sector
companies. The sharp decline of the performance of the companies
during 2015-16 continues to cast a shadow over the performance
during the first half of 2016-17.
The Chemical, Wood based and Developmental & Infrastructure
sectors are in profit and the remaining sectors are incurring losses as
explained below. During the second half, these units – Travancore

2
Titanium Products Ltd (TTP)., Travancore-Cochin Chemicals Ltd
(TCC) and Steel and Industrial Forgings Ltd (SIFL) – turned profitable.
Sector-wise Performance Details
(Rs. In Crores)
No. Sector
Apr 15 to Sep 15 Apr 16 to Sep 16
Turnover Net
Profit / Loss
Turnover Net
Profit / Loss
1 Chemical Industries 538.95 35.00 694.24 39.59
2 Development & Infrastructure
148.87 14.45 86.63 0.24
3 Wood Based 7.79 0.09 17.97 0.12
4 Ceramic 2.05 -5.52 1.89 -4.80
5 Traditional 57.82 -6.48 49.85 -7.43
6 Electronics 191.71 -8.04 180.39 -12.34
7 Engineering 55.18 -10.69 58.82 -12.53
8 Electrical Equipment 181.54 -18.57 151.59 -25.76
9 Textile 63.05 -33.81 61.13 -36.00
Total 1,246.96 -33.57 1,302.51 -58.92
The turnover of the engineering sector has improved but the net
profitability has declined. Eventhough the Engineering sector has
witnessed remarkable growth over the last few years driven by
increased investments in infrastructure and industrial production at the
national level, the performance of this sector in the State is not so
encouraging. This is basically because the prevailing sickness in steel
sector in India due to cheap imports.
S e c t o r w i s e c o m p o s i t i o n o f t h e t u r n o v e r r e g i s t e r e d d u r i n g A p r i l2 0 1 6 t o S e p t e m b e r 2 0 1 6

3
The huge loss incurred by SAIL had a negative impact on the SAIL-
SCL joint venture and the unit is yet to commence its operations as
envisaged in the JV agreements.
The recession in the textile sector together with low selling price of
yarn with negative contribution leaves the sector in loss. None of the
units are generating profits. Considering the social obligation, the units
are rendered operational with occasional support from the
Government. The impact of the recent demonetization has also been
severe in the sector on account of the prevalence of cash and carry
trade for yarn.
Overall performance of PSUs – A comparative analysis
Particulars Apr-15 to Sep-15
Apr-16 to Sep-16
Profit making units
No of units 9 11
Turnover (in Rs. Crores) 530.52 783.20
Profit (in Rs. crores) 63.78 59.79
Loss incurring units
No of units 32 30
Turnover (in Rs. Crores) 716.44 519.30
Loss (in Rs. crores) -97.35 -118.71
Overall units
No of units 41 41
Turnover (in Rs. Crores) 1,246.96 1,302.50
Profits / Loss (in Rs. Crores) -33.57 -58.92
Sector wise unit wise performance of PSUs may be seen as
Annexure A.

4
2.0 Analysis on Profit making units
2.1 Profit Making Units
Eleven units have registered profit during the period April to
September 2016. These units together achieved a profit of Rs.59.79
crores against a turnover of Rs.783.21 crores.
Profit making units
Sl. No
Name of the Company
Turnover (in Crs) Net Profit / Loss
(in Crs)
Apr 15 - Sep 15
Apr 16 - Sep 16
Apr 15 - Sep 15
Apr 16 - Sep 16
1 The Kerala Minerals and Metals Ltd
238.00 353.66 33.10 23.22
2 Malabar Cements Ltd 133.19 157.64 13.88 18.59
3 Kerala State Industrial Development Corporation Ltd
22.26 18.20 15.75 12.02
4 Travancore Titanium Products Ltd 57.96 60.79 -2.22 3.27
5 HANTEX 24.95 22.78 0.03 1.01
6 Travancore-Cochin Chemicals Ltd 79.96 97.05 -6.74 0.98
7 Steel and Industrial Forgings Ltd. 26.76 29.22 -1.40 0.32
8 Keltron Electro Ceramics Ltd 4.30 4.10 0.20 0.26
9 Forest Industries (Travancore) Ltd 7.79 17.97 0.09 0.12
10 Kerala Artisan's Development Corporation Ltd
4.65 4.00 -0.08 0.01
11 Steel Industrials Kerala Ltd 10.33 17.80 -0.17 0.0002
Total 610.15 783.21 52.44 59.79
Three Units (TTP, TCC, SIFL) that were loss making during the
previous year turned to profitable operations during the current period.
Two others (SILK & KADCO) have reduced losses and are making
nominal profits. These units have registered a growth of 28.36% in
their turnover resulting into 14.02% growth in their profits. Kerala
Minerals and Metals tops the list with a profit of Rs.23.22 crores
followed by Malabar Cements with a profit of Rs.18.59 crores.

5
2.2 Companies achieved a turnaround during the period Increase in turnover directly contributed to increase in profits in these
units. Hence these units may be expanded or ensured of full capacity
utilisation. The analysis shows that 5 units who had reported losses
during April 15 to September 15 have registered profits during the
current financial year. These units together reported a profit of Rs.4.58
crores during 2016-17 against losses of Rs.10.61 crores at the end of
half year during 2015-16. Out of these units Travancore Cochin
Chemicals have considerably increased their profits with an increase
of 21% in their turnover.
Turnaround companies during April to September 2016
Sl. No
Name of the Company
Turnover (in Crs) Net Profit / Loss
(Crs.)
Apr 15 - Sep 15
Apr 16 - Sep 16
Apr 15 - Sep 15
Apr 16 - Sep 16
1 Travancore Titanium Products Ltd 57.96 60.79 -2.22 3.27
2 Travancore-Cochin Chemicals Ltd 79.96 97.05 -6.74 0.98
3 Steel and Industrial Forgings Ltd. 26.76 29.22 -1.40 0.32
4 Kerala Artisan's Development Corporation Ltd
4.65 4.00 -0.08 0.01
5 Steel Industrials Kerala Ltd 10.33 17.80 -0.17 0.0002
Total 179.66 208.86 -10.61 4.58
SILK, which reported a marginal profit during this period, gained not
from their core business activity but by venturing more into civil works.
Kerala Artisans’ Development Corporation is a welfare corporation
rather to work on a commercial in nature. However, they are also
generating profits and manage their operations without depending
much on governmental funds. The rest of the units are now generating
profits out of their improved operational efficiencies.

6
2.3 Companies that have registered increase in profits
Four companies have increased their profit from what had achieved
during April to September 2015. These units together increased their
profit by Rs.5.78 crores with an increase in turnover of Rs.32.26
crores. Malabar Cement Ltd tops this list.
Companies with increase in profits
Sl. No
Name of the Company
Turnover (Crs.) Net Profit / Loss
(Crs.)
Apr 15 - Sep 15
Apr 16 - Sep 16
Apr 15 - Sep 15
Apr 16 - Sep 16
1 Malabar Cements Ltd 133.19 157.64 13.88 18.59
2 Keltron Electro Ceramics Ltd 4.30 4.10 0.20 0.26
3 Forest Industries (Travancore) Ltd 7.79 17.97 0.09 0.12
4 HANTEX 24.95 22.78 0.03 1.01
Total 170.23 202.49 14.20 19.98
Malabar Cements Ltd was shut down since 22-09-2016 for want of
coal / laterite thus incurring a loss of Rs.83.71 lakhs during September
2016, Rs.455.48 lakhs during October 16 and Rs.584.42 lakhs during
November 2016.
2.4 Companies whose profit has come down even with an increase in turnover
In Kerala Minerals and Metals Limited, even when the turnover had
increased by 48.60%, the profit had come down by 29.85%. This is

7
due to lower realization on account of adverse market situation despite
decrease in cost of production.
Of later there are indications of the pigment prices picking up.
Sl. No
Name of the Company
Turnover (Crs.) Net Profit / Loss
(Crs.)
Apr 15 - Sep 15
Apr 16 - Sep 16
Apr 15 - Sep
15
Apr 16 - Sep
16
1 The Kerala Minerals and Metals Ltd 238.00 353.66 33.10 23.22
3.0 Analysis of Loss Incurring Units 3.1 Loss incurring units Thirty units have incurred losses with an overall net loss of Rs. 118.70
crores against a turnover of Rs.519.31 crores during the first half of
2016-17. The corresponding turnover and loss of these units during
2015-16 were Rs.634.91 crores and Rs.85.19 crores respectively.
Considerable decrease in turnover has resulted in an increase in
losses by 39.34%.
The textile sector accounts to 30.33% of overall losses among the loss
making units and Electrical Sector accounts to 21.70%.

8
List of Loss Incurring Units During April 2016 To September 2016
Sl.No Name of the Company
Turnover (Crs) Net Profit / Loss
(Crs)
Apr-15 Sep-15
Apr 16 - Sep 16
Apr-15 Sep-15
Apr 16 - Sep 16
1 Kerala State Mineral Development Corporation Ltd
0.43 0.20 -0.09 -0.04
2 KELPALM 0.08 0.05 -0.05 -0.10
3 TEXFED 14.09 14.14 -0.04 -0.11
4 The Metal Industries Ltd 1.26 0.95 -0.27 -0.70
5 Kerala State Industrial Enterprises Ltd 18.20 30.03 0.04 -1.15
6 HANVEEV 14.72 10.37 0.24 -1.29
7 Trivandrum Spinning Mills Ltd 0.29 1.85 -1.26 -1.60
8 Traco Cable Company Ltd 67.11 54.89 0.44 -1.71
9 Handicrafts Dev Corp. (Kerala) Ltd 6.59 6.09 -1.85 -1.77
10 Kerala Clays & Ceramic Products Ltd. 0.80 0.54 -3.01 -1.95
11 Alleppey Co-operative Spinning Mills Ltd 5.34 6.16 -2.28 -2.14
12 Keltron Component Complex Ltd 24.18 26.27 -1.66 -2.26
13 Kerala State Drugs & Pharmaceuticals Ltd 15.71 12.97 -0.13 -2.27
14 Kerala Automobiles Ltd 4.02 2.18 -1.71 -2.62
15 Sitaram Textiles Ltd 5.58 4.87 -2.97 -2.83
16 The Kerala Ceramics Ltd 1.25 1.35 -2.51 -2.85
17 The Quilon Co-operative Spinning Mills Ltd 2.83 4.27 -3.18 -3.01
18 The Cannannore Co-op Spinning Mills Ltd 6.21 7.55 -2.90 -3.24
19 The Trichur Co-op. Spinning Mills Ltd 3.50 4.27 -3.45 -3.31
20 United Electrical Industries Ltd. 6.88 3.67 -2.91 -3.34
21 The Malappuram Co-op. Spinning Mills Ltd 8.44 8.96 -3.70 -3.44
22 Autokast Ltd. 9.44 7.97 -2.16 -4.13
23 The Travancore Cements Ltd 13.70 11.93 -2.81 -4.15
24 Kerala State Bamboo Corporation Ltd. 6.77 6.55 -4.77 -5.29
25 Steel Complex Ltd 1.52 0.70 -4.17 -5.40
26 Kerala Electrical & Allied Engineering Company Ltd.
42.12 61.02 -5.98 -5.45
27 Kerala State Electronics Development Corporation Ltd
163.23 150.03 -6.56 -10.34
28 Kerala Small Industries Development Corporation Ltd
108.41 38.41 -1.33 -10.63
29 Transformers and Electricals Kerala Ltd 65.43 32.00 -10.13 -15.25
30 Kerala State Textile Corporation Ltd 16.78 9.07 -14.03 -16.33
Total 634.91 519.31 -85.19 -118.71

9
Kerala State Textiles Corporation Ltd (KSTC) is the highest loss
making unit with a loss of Rs.16.33 crores during the first half of the
current financial year. The units of KSTC have been under lay-off due
to disconnection of power, non-availability of raw material and for want
of working capital. As mentioned earlier, poor contribution with low
market rate of yarn made the entire units under the textile sector in
red.
Central-State PSU joint ventures also did not fare well. Both SAIL-SCL
and NTPC-TELK are incurring losses. Commitments from the part of
Central PSU partners are not met as per the JV agreements. SAIL-
SCL is taking up only conversion jobs of SAIL and that too with a
negative contribution. On the other side, TELK being the JV partner do
not enjoy any preference in getting work orders from NTPC.
While the requirements of KSEB can be fully met by the Public Sector
Companies in Kerala, the majority of the orders are being taken away
by the private sector being less competitive. As a result of this, SLPEs
are incurring losses continuously. Consequent to negative
contribution, the funds are getting dried up and the units are
depending more on Governmental funds which are never getting
repaid. This has resulted in mounting liabilities affecting the profitability
of those units.
Units like KEL, Traco, UEIL, KCCL, KSDP, STL, TCL, TTP etc. are on
the verge of reference to BIFR*. Details of the companies with
negative net-worth as on 31/03/2016 is attached as Annexure B.
Hence steps are to be initiated for restructuring their balance sheet for
making the units bankable and this would require a policy decision.
* National Committee Law Tribunal (NCLT)

10
3.2 Units that slipped into losses during April to September 2016
Three companies viz. Traco, KSIE & Hanveev reported losses during
the first half of 2016-17 against profits during the corresponding
period of 2015-16. Traco Cable Company has been depending
completely on KSEB orders. They could bag only 50% of the KSEB
requirement through open tenders after competing with the private
sector companies. Karnataka Electricity Board orders are not all that
profitable.
Hanveev is operating with high cost of production in a highly
competitive market.
The major income of KSIE was from the handling of cargo in the two
International Airports in Trivandrum and Calicut, which is at present
not doing well. Mounting interest liability is also another factor
affecting the performance of the companies.
Sl.No
Name of the Company
Turnover (Crs) Net Profit / Loss
(Crs)
Apr-15 Sep-15
Apr 16 - Sep 16
Apr-15 tSep-
15
Apr 16 - Sep 16
1 Traco Cable Company Ltd 67.11 54.89 0.44 -1.71
2 HANVEEV 14.72 10.37 0.24 -1.29
3 Kerala State Industrial Enterprises Ltd
18.20 30.03 0.04 -1.15
Total 100.03 95.29 0.72 -4.15

11
3.3 Units with increase in losses or turned into losses even with an
increase in turnover Performance of the following six companies has come down even
when their turnover has increased. Increase in fixed cost, mounting
interest liability, increase in cost of raw material, decreasing
contribution are attributed to the increase in loss.
Sl.No Name of the Company
Turnover (Crs) Net Profit / Loss
(Crs)
Apr-15 Sep-15
Apr 16 - Sep 16
Apr-15 Sep-15
Apr 16 - Sep 16
1 Kerala State Industrial Enterprises Ltd
18.20 30.03 0.04 -1.15
2 Keltron Component Complex Ltd
24.18 26.27 -1.66 -2.26
3 The Cannannore Co-op. Spinning Mills Ltd
6.21 7.55 -2.90 -3.24
4 The Kerala Ceramics Ltd 1.25 1.35 -2.51 -2.85
5 Trivandrum Spinning Mills Ltd 0.29 1.85 -1.26 -1.60
6 TEXFED 14.09 14.14 -0.04 -0.11
Total 64.22 81.19 -8.33 -11.21
3.4 Units whose performance have improved even when the turnover
decreased The following companies have reported improved performance during
the first half of 2016-17, when their turnover had decreased.
Supportive market trends, decrease in operational expenses
consequent to non-operations, high value orders etc are attributed to
this.

12
Sl.No Name of the Company
Turnover (Crs) Net Loss (Crs)
Apr-15 Sep-15
Apr 16 - Sep 16
Apr-15 Sep-15
Apr 16 - Sep 16
1 Kerala Clays & Ceramic Products Ltd.
0.80 0.54 -3.01 -1.95
2 Sitaram Textiles Ltd 5.58 4.87 -2.97 -2.83
3 Handicrafts Dev Corp. (Kerala) Ltd
6.59 6.09 -1.85 -1.77
4 Kerala State Mineral Development Corporation Ltd
0.43 0.20 -0.09 -0.04
Total 13.40 11.7 -7.92 -6.59
4.0 Conclusion:
Performance of these units came down drastically during the past few
years (since 2011) and are continuing the trend during the first half of
2016-17. On analysing the present status of these PSUs, it is learnt
that majority of the issues are common but the reasons attributed vary.
In this background, RIAB is analysing each of these units in detail to
arrive at a comprehensive revival / restructuring package.
There is an increasing dependence of PSUs on state exchequer even
for day to day operations. Such a situation cannot continue eternally.
In deserving cases, a one-time support will be recommended upon
development of a sustainable and viable restructuring plan. A meeting
with Financial Institutions / Banks at the government level would help
to the settlement of long term dues. Financial restructuring is essential
in many of the units prior to initiate revival steps, which needs
decisions at policy level.
Possibilities of synergy among PSUs in the government sector are
being explored to strengthen their working.

13
Sixteen companies have completed their statutory audits. Details of
the audit status is also attached as Annexure C.
Monthly performance review of units is being undertaken regularly by
RIAB. This will be further strengthened by review at the Hon.
Minister’s level on a quarterly level basis.
****************

14
Annexure A
Performance of the PSU's (both Manufacturing & Non-Manufacturing under the Industries Department upto September 2016 (Provisional)
Rs in Crs
Sl.No Name of the Company Turnover Net Profit /
Loss
Chemical Sector
1 The Kerala Minerals and Metals Ltd 353.66 23.22
2 Malabar Cements Ltd 157.64 18.59
3 Travancore Titanium Products Ltd 60.79 3.27
4 Travancore-Cochin Chemicals Ltd 97.05 0.98
5 Kerala State Drugs & Pharmaceuticals Ltd 12.97 -2.27
6 The Travancore Cements Ltd 11.93 -4.15
7 Kerala State Mineral Development Corporation Ltd
0.20 -0.04
Sub Total (A) 694.24 39.59
Electrical Sector
8 Kerala Electrical & Allied Engineering Company Ltd.
61.02 -5.45
9 Traco Cable Company Ltd 54.89 -1.71
10 Transformers and Electricals Kerala Ltd 32.00 -15.25
11 United Electrical Industries Ltd. 3.67 -3.35
Sub Total (B) 151.59 -25.76
Engineering Sector
12 Steel and Industrial Forgings Ltd. 29.22 0.32
13 Steel Industrials Kerala Ltd 17.80 0.0002
14 Autokast Ltd. 7.97 -4.13
15 Kerala Automobiles Ltd 2.18 -2.62
16 Steel Complex Ltd 0.70 -5.40

15
17 The Metal Industries Ltd 0.95 -0.70
Sub Total (C) 58.82 -12.53
Electronic Sector
18 Kerala State Electronics Development Corporation Ltd
150.03 -10.34
19 Keltron Component Complex Ltd 26.27 -2.26
20 Keltron Electro Ceramics Ltd 4.10 0.26
Sub Total (D) 180.39 -12.34
Textile Sector
21 Kerala State Textile Corporation Ltd 9.07 -16.33
22 Sitaram Textiles Ltd 4.87 -2.83
23 Trivandrum Spinning Mills Ltd 1.85 -1.60
24 TEXFED 14.14 -0.11
25 Alleppey Co-operative Spinning Mills Ltd 6.16 -2.14
26 The Quilon Co-operative Spinning Mills Ltd 4.27 -3.01
27 The Trichur Co-operative Spinning Mills Ltd 4.27 -3.31
28 The Malappuram Co-operative Spinning Mills Ltd
8.96 -3.44
29 The Cannannore Co-op. Spinning Mills Ltd 7.55 -3.24
Sub Total (E) 61.13 -36.00
Ceramic Sector
30 Kerala Clays & Ceramic Products Ltd. 0.54 -1.95
31 The Kerala Ceramics Ltd 1.35 -2.85
Sub Total (F) 1.89 -4.80
Traditional Sector
32 Handicrafts Dev Corp. (Kerala) Ltd 6.09 -1.77
33 HANVEEV 10.37 -1.29
34 HANTEX 22.78 1.01

16
35 Kerala State Bamboo Corporation Ltd. 6.55 -5.29
36 Kerala Artisan's Development Corporation Ltd 4.00 0.01
37 KELPALM 5.41 -0.10
Sub Total (G) 49.85 -7.43
Wood Based Sector
38 Forest Industries (Travancore) Ltd 17.97 0.12
Sub Total (H) 17.97 0.12
Development Sector
39 Kerala State Industrial Development Corporation Ltd
18.20 12.02
40 Kerala State Industrial Enterprises Ltd 30.03 -1.15
41 Kerala Small Industries Development Corporation Ltd
38.41 -10.63
Sub Total (I) 86.63 0.24
Grand Total (A+B+C+D+E+F+G+H+I) 1,302.50 -58.92
Source: Company

17
Annexure B
NET WORTH AS ON 31/03/2016 (PROVISIONAL)
Rs. Crs
Sl.No Company Networth
(31/03/16)
Provisional
1 Autokast Ltd -109.55
2 Kerala State Drugs & Pharmaceuticals Ltd -104.53
3 Kerala State Textile Corporation Ltd** -65.58
4 The Kerala Ceramics Ltd -61.40
5 The Quilon Co-operative Spinning Mills Ltd -51.75
6 SAIL-SCL Kerala Ltd -42.81
7 Kerala Automobiles Ltd -42.79
8 Kerala State Bamboo Corporation Ltd. -42.25
9 The Trichur Co-opearative Spinning Mills Ltd -38.95
10 United Electrical Industries Ltd -38.42
11 The Travancore Cements Ltd -34.77
12 Kerala State Handloom Development Corp Ltd -31.12
13 The Malappuram Co-operative Spinning Mills Ltd -30.75
14 The Cannannore Co-op.Spinning Mills Ltd -27.35
15 Kerala Electrical & Allied Engineering Company Ltd. -26.45
16 Kerala Small Industries Development Corporation -21.48
17 Sitaram Textiles Ltd -18.98
18 Handicrafts Dev Corp. (Kerala) Ltd -18.02
19 Alleppey Co-operative Spinning Mills -13.52
20 HANTEX -13.52
21 Travancore Titanium Products Ltd -12.60

18
22 Trivandrum Spinning Mills * -10.89
23 Keltron Component Complex Ltd -9.07
24 Texfed -3.58
25 Travancore-Cochin Chemicals Ltd -2.72
26 Traco Cable Company Limited -1.59
27 KELPALM -0.51
Total (PSUs with negative networth) -874.94
28 Kerala Artisans Development Corporation Ltd 0.23
29 Keltron Electro Ceramics Ltd 1.36
30 The Metal Industries Ltd 1.46
31 Kerala State Mineral Development Corporation Ltd 1.81
32 Forest Industries (Travancore) Ltd 3.52
33 Kerala State Electronic Development Corporation Ltd 5.81
34 Kerala Clays & Ceramic Products Ltd. 7.46
35 Steel Industrials Kerala Ltd 8.90
36 Kerala State Industrial Enterprises Ltd 36.23
37 Steel and Industrial Forgings Ltd 51.99
38 Transformers and Electricals Kerala Ltd 86.38
39 Malabar Cements Ltd 255.10
40 The Kerala Minerals and Metals Ltd 608.40
41 Kerala State Industrial Development Corporation Ltd 682.97
Total (PSUs with Postivive networth) 1,751.62
Grand Total 876.67
19
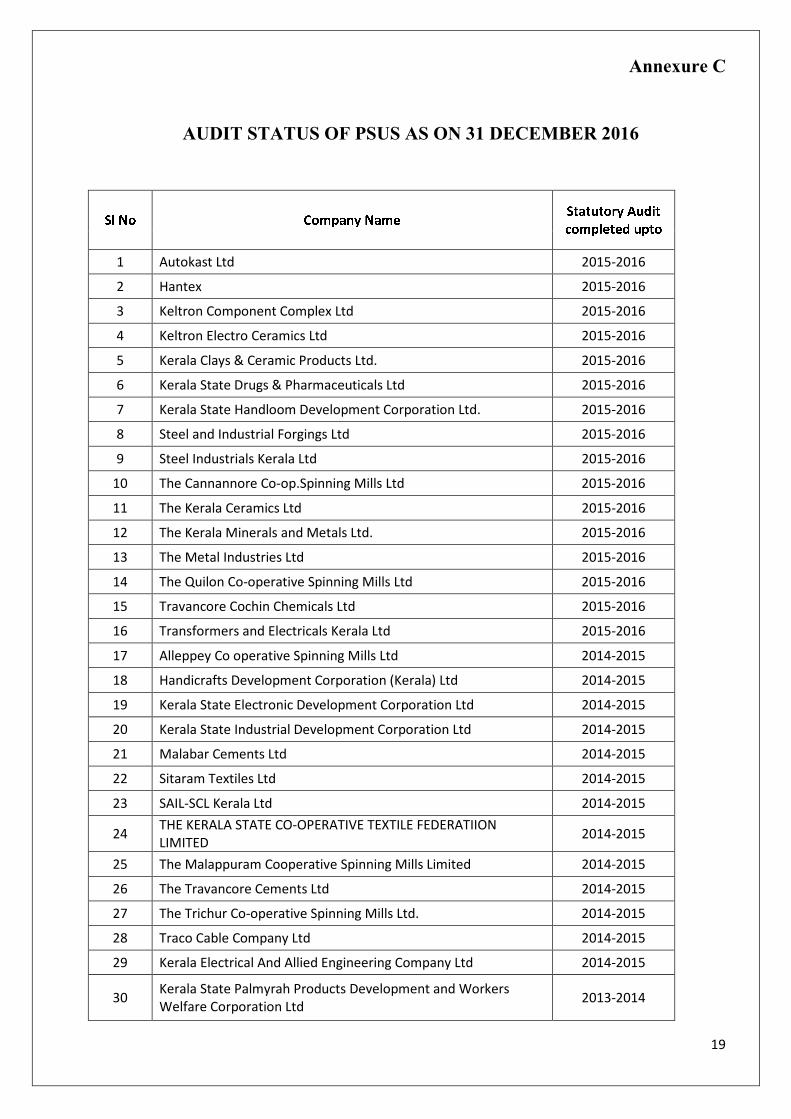
Annexure C
AUDIT STATUS OF PSUS AS ON 31 DECEMBER 2016
S l N o C o m p a n y N a m e S t a t u t o r y A u d i tc o m p l e t e d u p t o1 Autokast Ltd 2015-2016
2 Hantex 2015-2016
3 Keltron Component Complex Ltd 2015-2016
4 Keltron Electro Ceramics Ltd 2015-2016
5 Kerala Clays & Ceramic Products Ltd. 2015-2016
6 Kerala State Drugs & Pharmaceuticals Ltd 2015-2016
7 Kerala State Handloom Development Corporation Ltd. 2015-2016
8 Steel and Industrial Forgings Ltd 2015-2016
9 Steel Industrials Kerala Ltd 2015-2016
10 The Cannannore Co-op.Spinning Mills Ltd 2015-2016
11 The Kerala Ceramics Ltd 2015-2016
12 The Kerala Minerals and Metals Ltd. 2015-2016
13 The Metal Industries Ltd 2015-2016
14 The Quilon Co-operative Spinning Mills Ltd 2015-2016
15 Travancore Cochin Chemicals Ltd 2015-2016
16 Transformers and Electricals Kerala Ltd 2015-2016
17 Alleppey Co operative Spinning Mills Ltd 2014-2015
18 Handicrafts Development Corporation (Kerala) Ltd 2014-2015
19 Kerala State Electronic Development Corporation Ltd 2014-2015
20 Kerala State Industrial Development Corporation Ltd 2014-2015
21 Malabar Cements Ltd 2014-2015
22 Sitaram Textiles Ltd 2014-2015
23 SAIL-SCL Kerala Ltd 2014-2015
24 THE KERALA STATE CO-OPERATIVE TEXTILE FEDERATIION
LIMITED 2014-2015
25 The Malappuram Cooperative Spinning Mills Limited 2014-2015
26 The Travancore Cements Ltd 2014-2015
27 The Trichur Co-operative Spinning Mills Ltd. 2014-2015
28 Traco Cable Company Ltd 2014-2015
29 Kerala Electrical And Allied Engineering Company Ltd 2014-2015
30 Kerala State Palmyrah Products Development and Workers
Welfare Corporation Ltd 2013-2014
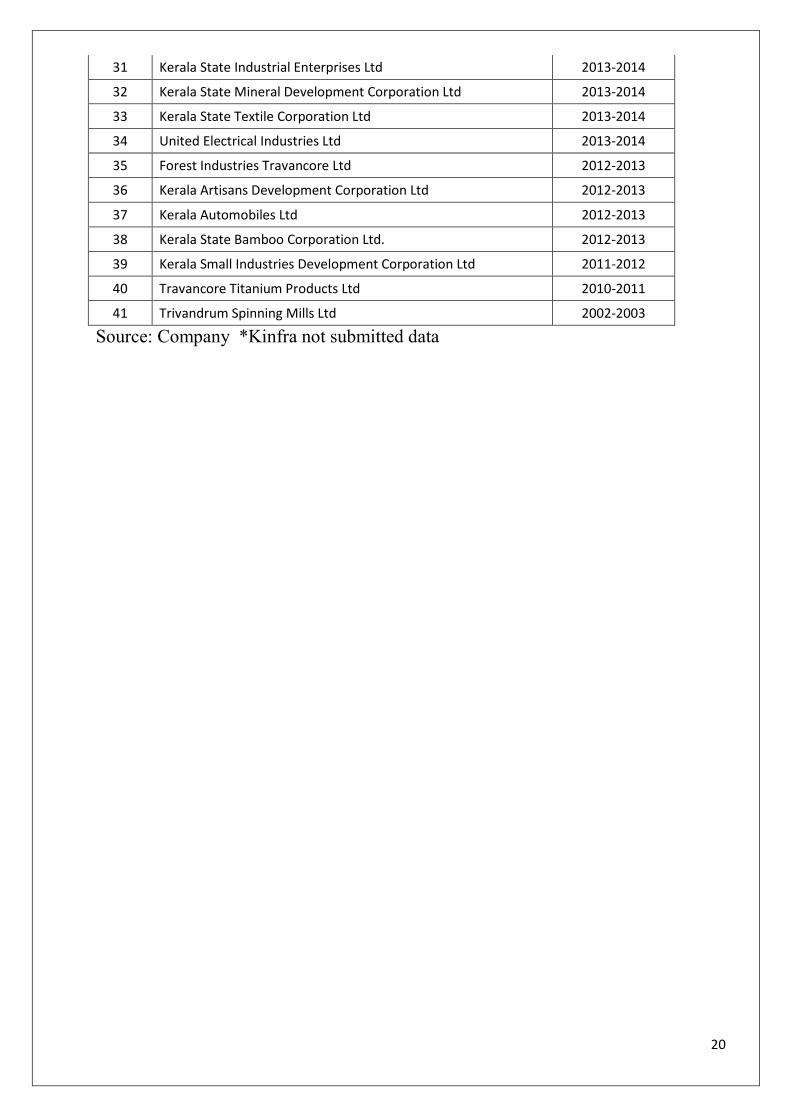
20
31 Kerala State Industrial Enterprises Ltd 2013-2014
32 Kerala State Mineral Development Corporation Ltd 2013-2014
33 Kerala State Textile Corporation Ltd 2013-2014
34 United Electrical Industries Ltd 2013-2014
35 Forest Industries Travancore Ltd 2012-2013
36 Kerala Artisans Development Corporation Ltd 2012-2013
37 Kerala Automobiles Ltd 2012-2013
38 Kerala State Bamboo Corporation Ltd. 2012-2013
39 Kerala Small Industries Development Corporation Ltd 2011-2012
40 Travancore Titanium Products Ltd 2010-2011
41 Trivandrum Spinning Mills Ltd 2002-2003
Source: Company *Kinfra not submitted data