performing a reliability assessment deferred $50 million...
TRANSCRIPT

Performing a Reliability Assessment Deferred $50 Million in Capital Costs David Bereskin, PE1, Dennis Porter1, J.D. Solomon, PE, CRE, CMRP2
1 Greenville Water System 2 CH2M
Greenville Water desired a quantified evaluation of reliability and risk associated with their North Saluda and Table Rock water supply and transmission systems. These two systems provide approximately 80% of the water supply to the Greenville Water service area, and each includes a reservoir, major raw water pump station, and more than ten of miles of transmission line. The evaluation and related optimization was further complicated by the interactive relationship between the two systems in providing water supply to the Stovall Water Treatment Plant by alternating gravity and pumping systems.
Primary concerns for the North Saluda system were recommendations from the 2009 Master Plan for $8 million (M) in electrical and backup power generation in the 2010-2015 timeframe, over $4M to replace pumps in the 2015-2025 timeframe, and $50.6M for a parallel raw water transmission main in the 2025-2035 timeframe. Staff wanted to accelerate the parallel raw water transmission pipeline and do all three projects in the current CIP. No capital recommendations were provided for the Table Rock system because it had some upgrades in the last 15 years. It was not considered as old as the North Saluda system and had “redundancy”, but it too did not have backup power generating capabilities.
The use of the reliability and risk approaches and tools built upon some of the basic engineering and financial analysis previously performed by others, which did not fully address the uncertainty and value concerns that interested the utility’s executive leadership. Better decisions could ultimately be made by understanding and communicating the true definitions of risk, reliability, and redundancy through the formal reliability assessment that was performed in this evaluation.
Ultimately the work enabled the executive leadership to improve their understanding of the different operating system alternatives and to improve their decision-making related to the timing and inter-relationships of the potential capital improvements. Specifically, the projects that had been slated for inclusion in the capital improvements program were not those of greatest concern to system reliability and risk. The evaluation uncovered a critical operations component that is often overlooked in traditional master planning process and related projects, as well as the need for higher priority on formal maintenance and contingency strategies and developing critical spare parts analysis and inventories. It also demonstrated the ability to use the commercial software applications to enhance and improve work performed previously by others, and how to use the tools in a complimentary way rather than a purely competitive manner with other approaches.

KEYWORDS:
Reliability, Risk, Water Supply Systems, Infrastructure Management, Renewal and Replacement Probabilistic Forecasting; Planning
INTRODUCTION
Greenville Water (GW) currently serves most of Greenville County and portions of three adjoining counties. GW also provides wholesale water supply to several surrounding utilities. Most of the finished water supply comes from the L.B. Stovall Water Treatment Plant (Stovall WTP). The Stovall WTP, commissioned in 2000, is supplied by water from the Table Rock and North Saluda reservoirs. This facility is GW’s primary treatment facility that provides the greatest amount of finished water to the service area.
The Table Rock and North Saluda reservoirs are owned and managed by GW. Because the drainage areas are protected watersheds, the water supply in the reservoirs has an excellent water quality. The Stovall WTP has a permitted capacity to treat 75 mgd for a maximum daily demand (MDD).
Based on workshop discussions, it was determined that the primary intended function of the raw water transmission system was to provide 75 mgd of raw water to the Stovall WTP, 30 mgd from the Table Rock subsystem and 45 mgd from the North Saluda subsystem. The location and general description of the required flows from each subsystem is shown in Figure 1.
Figure 1 Stoval WTP Raw Water Transmission System
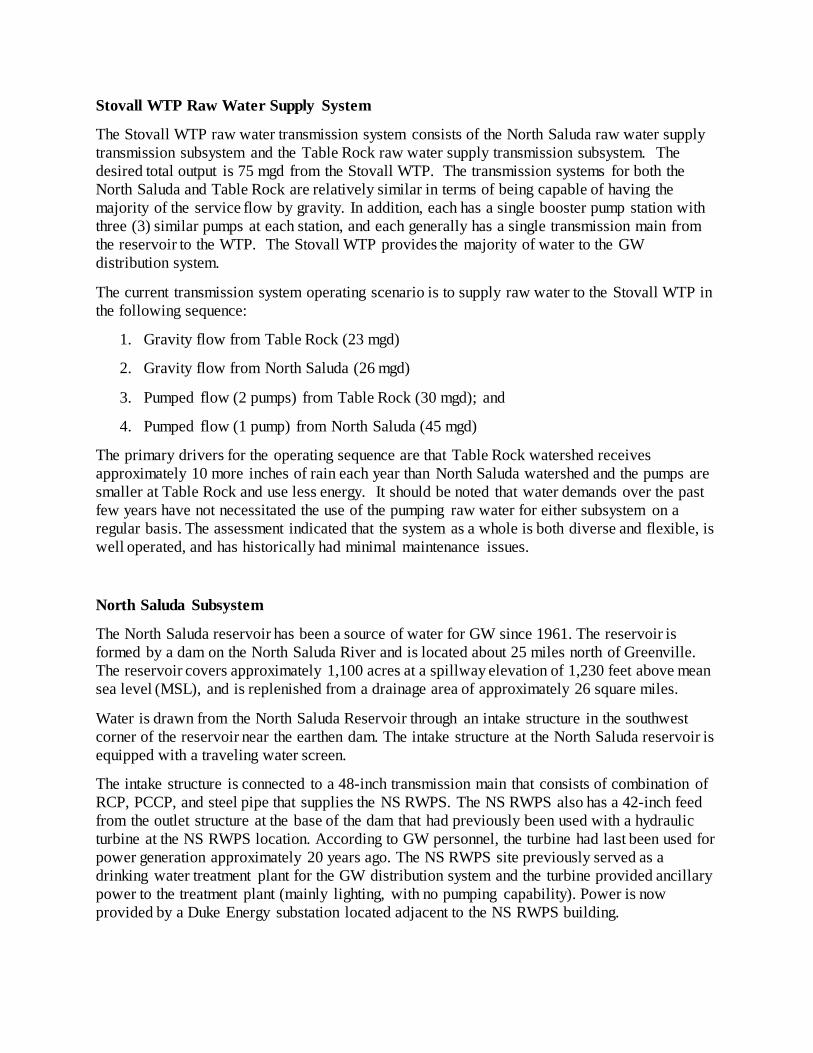
Stovall WTP Raw Water Supply System
The Stovall WTP raw water transmission system consists of the North Saluda raw water supply transmission subsystem and the Table Rock raw water supply transmission subsystem. The desired total output is 75 mgd from the Stovall WTP. The transmission systems for both the North Saluda and Table Rock are relatively similar in terms of being capable of having the majority of the service flow by gravity. In addition, each has a single booster pump station with three (3) similar pumps at each station, and each generally has a single transmission main from the reservoir to the WTP. The Stovall WTP provides the majority of water to the GW distribution system.
The current transmission system operating scenario is to supply raw water to the Stovall WTP in the following sequence:
1. Gravity flow from Table Rock (23 mgd)
2. Gravity flow from North Saluda (26 mgd)
3. Pumped flow (2 pumps) from Table Rock (30 mgd); and
4. Pumped flow (1 pump) from North Saluda (45 mgd)
The primary drivers for the operating sequence are that Table Rock watershed receives approximately 10 more inches of rain each year than North Saluda watershed and the pumps are smaller at Table Rock and use less energy. It should be noted that water demands over the past few years have not necessitated the use of the pumping raw water for either subsystem on a regular basis. The assessment indicated that the system as a whole is both diverse and flexible, is well operated, and has historically had minimal maintenance issues.
North Saluda Subsystem
The North Saluda reservoir has been a source of water for GW since 1961. The reservoir is formed by a dam on the North Saluda River and is located about 25 miles north of Greenville. The reservoir covers approximately 1,100 acres at a spillway elevation of 1,230 feet above mean sea level (MSL), and is replenished from a drainage area of approximately 26 square miles.
Water is drawn from the North Saluda Reservoir through an intake structure in the southwest corner of the reservoir near the earthen dam. The intake structure at the North Saluda reservoir is equipped with a traveling water screen.
The intake structure is connected to a 48-inch transmission main that consists of combination of RCP, PCCP, and steel pipe that supplies the NS RWPS. The NS RWPS also has a 42-inch feed from the outlet structure at the base of the dam that had previously been used with a hydraulic turbine at the NS RWPS location. According to GW personnel, the turbine had last been used for power generation approximately 20 years ago. The NS RWPS site previously served as a drinking water treatment plant for the GW distribution system and the turbine provided ancillary power to the treatment plant (mainly lighting, with no pumping capability). Power is now provided by a Duke Energy substation located adjacent to the NS RWPS building.

When the Stovall WTP was built, the NS RWPS site changed to the current raw water pumping station to supply water from the reservoir to the Stovall WTP. The NS RWPS now serves to increase the flow rate above the gravity flow rate from the North Saluda reservoir during high demand periods.
The pumps and electrical equipment at the NS RWPS were installed in 1971. It is equipped with three 1,750-horsepower (hp) pumps rated at 30 mgd at a total dynamic head (TDH) of 225 feet with a firm capacity of 60 mgd. Each of the NS RWPS pumps has a suction valve and a 24-inch automatic Pratt ball valve with a Limitorque actuator on the discharge side. Typically, the NS RWPS is a “pass-through” for raw water gravity flow being conveyed to the Stovall WTP, at a flow rate of approximately 26 mgd.
The existing transmission main was constructed around 1961 and is approximately 11 miles of 48-inch PCCP transmission main. This transmission main typically provides 26 mgd via gravity or 45 mgd with a single pump operating. It can provide as much as 63 mgd with 2 pumps operating.
Table Rock Subsystem
The Table Rock Reservoir, located 25 miles northwest of Greenville, was placed in service in 1930. The reservoir covers approximately 500 acres and has a drainage area of approximately 14 square miles. While the drainage area is smaller than North Saluda, the drawdown recovery of the reservoir is better since the reservoir’s watershed averages approximately 10 inches more annual rainfall than the North Saluda watershed.
The Table Rock Reservoir was originally built with a 30-inch diameter transmission main serving the City of Greenville. In 1939, a second 30-inch diameter transmission main was installed to increase the gravity flow capacity.
In 1954, a booster pumping station, Gayley RWPS, was installed to increase the capacity of these two lines. The Gayley RWPS is located near the point where the 30-inch transmission main crosses S.C. Highway 288 (Pumpkintown Road). The pump station is equipped with three 500-hp pumps rated at 15 mgd each at a TDH of 127 feet and has a firm capacity of 30 mgd.
In 1997, Gayley RWPS was updated with variable frequency drives (VFDs), new pumps and new yard piping. In 2006-2007, the VFDs were removed in favor of soft starts. The VFDs were not providing GW much benefit as the VFDs did not provide the desired flow management (especially lower flow volumes), so they were changed to soft starts to lower the initial power draw to the pumps and a lower cost of maintenance.
A new 42-inch DIP transmission main was also installed from Gayley RWPS to the Stovall WTP in 1997. This pipeline is approximately 33,000 linear feet. As the transmission main crosses Valley Road, it parallels the 48-inch North Saluda raw water supply transmission mains to where it enters the Stovall WTP site and to the valve box before splitting to the WTP flocculation basins. There is a pinch (ball) valve at the end of the transmission main in the same valve pit as the sleeve valve on the North Saluda raw water transmission main.
In 2005, a second intake was installed in the reservoir with a 42-inch transmission main installed by directional drill through the earthen section of the reservoir (natural ground). The 42-inch has

interconnects with both original mains. A new 42-inch raw water transmission main was installed replacing the 1939 transmission main which reportedly had some failures. The original intake remains operational and has been taken offline but the original 1930 30-inch diameter raw water supply transmission main still has the ability to provide service to the Gayley RWPS through an interconnection with 42-inch diameter transmission main.
METHODOLOGY
A variety of approaches and tools for the reliability assessment were used. Approaches included the use of Failure Modes and Effects Analysis (FMEA), Reliability Block Diagrams (RBDs) and Fault Tree Analysis (FTA). Analytical software included the Palisade industry-leading risk software tools for optimizing systems performance, including StatTools, @Risk, and PrecisonTree, and commercially available reliability software from Reliasoft. A seven-step reliability assessment was used to guide the overall process:
1. Establish the Problem/Reliability Statement – each system had been built and modified over many decades; a common understanding of the reliability statements for the system as a whole and for each subsystem was needed.
2. Verify and calculate future stresses - loads/demands/flows were analyzed in the previous master plan in a deterministic manner with outdated unit factors; the existing master plan was also performed several years previous and without the data from the post-2008/2009 economic recession. Probabilistic analysis was utilized in this assessment to more accurately forecast system demands and to capture the range of risk and uncertainty for the system as a whole.
3. Assess Infrastructure/System - system condition and asset performance history was collected and reviewed; documentation of O&M history or condition assessment was not used in the previous master plan
4. Perform systems reliability analysis – formal reliability assessments were performed using calculations and with commercially viable software tools for each subsystem and the system as a whole.
5. Evaluate ability to predict or accept risk associated with potential reliability shortfalls – risk were evaluated based on probabilistic analysis and reliability tools rather than risk matrices or other more subjective approaches.
6. Determine Repair or Replacement Alternative(s) – alternatives were developed in response to the reliability and risk analyses; this included capital alternatives, improvements maintenance strategies, spare parts analysis. The alternatives were delineated in short-, medium-, and long-term priorities.
7. Document and Communicate Repair or Replacement Alternative(s) – documentation was completed in draft and final form; communication included written and formal communication with staff and well as presentation to the Board.

The North Saluda subsystem was evaluated between June and August, 2014. The Table Rock subsystem was subsequently evaluated between October and December, 2014.
The following sections provide an overview of each step.
Step 1 - Establish the Problem/Reliability Statement
Each system had been built and modified over many decades; a common understanding of the reliability statements for the system as a whole and for each subsystem was needed. The methodology for this assessment is built upon sentiment expressed by Moubray (1992) that the underlying benefit of systematic approaches is to “clarify and build consensus about what assets really matter and about where large, complex systems are particularly vulnerable” [1]. The use of cross-functional teams, including aspects such as engineering, planning, operations, maintenance, safety, and quality, is a best practice (SAE, 1999).
The reliability statement, or specification, must contain: a definition of failure that should cover all of the system’s failure modes relevant to its function(s); a full description of the operating environment(s) for the system; and a statement of the reliability requirement and/or a statement of failure modes and effects which are particularly critical, regardless whether they have a low likelihood of occurrence (O’Connor and Kleyner, 2012).
In the context of Failure Modes and Effects Analysis (FMEA), Wasserman (2003) states that each failure mode is rated by its criticality – the severity of the failure event multiplied by the likelihood of its occurrence – or by its risk prioritization number (RPN) – severity multiplied by the likelihood of its occurrence and multiplied again by the likelihood of it not being detected. Wasserman and others have recommended prioritization of actions related to failure modes based on: (1) effects that have the highest severity rating; (2) causes that have the highest severity times occurrence ratings, and (3) the highest RPNs. FMEA should be performed in a cross-functional team setting, which was the case for this assessment.
Reliability Block Diagrams (RBDs) are an effective tool for understanding the logical connections between a system’s components. The RBD is not necessarily the same as a schematic diagrams of the system layout; the RBD analysis consists of reducing the system to a simple series of asset blocks that can provide a fundamental understanding of system success. Fault Tree Analysis (FTA) is a similar approach that statically focuses on what causes the system to fail. It continue until the trail can be traced no further and therefore leads to the critical root causes associated with system failure. If a design issue is noted then a system re-design is required; if a procedural issue is noted then the procedural issue must be corrected or s method to protect against the damage must be implemented (Gulati, 2012). RBDs and FTAs were also developed in a cross-functional team environment, both to confirm the reliability statement and as a basis for future calculations.
The primary boundary conditions that were essential to consider in this analysis were the quality of the source water and the quantity of required raw water. Based on water quality records, compliance history, and staff expertise, it was concluded that water quality would not vary significantly over the 10- to 20-year evaluation period. It was thus held as a fixed boundary condition. A more detailed water quality analysis is being performed with a separate study outside the scope of this analysis.

Step 2- Verify and Calculate Future Stresses
The baseline for the quantity of required raw water was the water demand forecast that was developed as part of the 2009 Comprehensive Water Distribution System Master Plan (CDM, 2009). In order to gain a better understanding of the expected demands over the next 10- to 20-years, CH2M HILL deconstructed the 2009 Master Plan forecast, developed a revised forecast that included the four most recent years of water demand data, and then added a probabilistic analysis to the demand forecast to better determine the potential influence on uncertainty on the forecast. Tracking the actual demands against the 2009 Master Plan projections provided the ability to recommend any adjustments in timing of capital improvements through 2035.
Growth trends at the time of the 2009 Master Plan demand analysis changed in the immediate years following that study. There are two predominant issues that caused these changes:
1. The majority of data that was available during the development of the 2009 Master Plan pre-dated the economic collapse near the end of 2008.
2. During the drought year of 2008, domestic users started reducing their usage of water from a usage rate used throughout the industry of 75 gallons per capita per day (gcpd) to usage rates significantly lower in an effort to conserve water.
These changes are reflected in Table 1, which lists a comparison of the anticipated water demands against the actual water demands for 2010-2013. Actual demands have been notably less than the projections in the 2009 Master Plan.
Table 1
Historical Water Demands for the Entire GW Service Area, 2010-2013
ADD Projected (MGD)1
ADD Actual (MGD)2
MDD Projected (MGD)1
MDD Actual (MGD)2
2010 66 58 110 94
2011 67 57 112 99
2012 68 56 113 96
2013 69 50 115 79 1 Data Source: Linear extrapolation from 2009 Master Plan 2 Data Source: GW Stovall WTP finished water meter data
The 2009 Master Plan was developed using a deterministic model and provides no estimates of uncertainty or risk. For the North Saluda subsystem, the 2009 Master Plan forecast indicates that the system would require 2 of 3 pumps working on a regular basis at the present time, which is not currently required.
Based on the updated water demand pattern, from recent years, and the probabilistic analysis conducted it was determined that the potential need for two pumps at the North Saluda raw water pumping station (NS RWPS) could occur as soon as 2019 or as late as 2029. There is an outside possibility (approximately 5 percent) that 2 of 3 pumps will be needed regularly in 2016. Table 2

shows the comparison of linear extrapolations of the 2009 Master Plan projections and the forecasted range of demands by CH2M HILL. The percentages presented in Table 2 represent the probability that the level of identified demand, or less, will occur in an individual year (Example: in 2035 there is a 95 percent chance that the average daily demand will be 87 MGD or less).
Table 2
Reconstructed Future Water Demand for the Entire GW Service Area
Average Daily Demand (MGD) Maximum Daily Demand (MGD)
CH2M Hill Forecast - Range
CH2M Hill Forecast - Range
MP 2009
5% 50% 95% MP 2009 5% 50% 95%
2015 71 62 65 67 119 95 102 108
2020 76 65 68 72 127 100 108 116
2025 81 68 73 77 135 104 114 124
2030 85 71 76 82 142 108 120 133
2035 90 73 81 87 150 112 127 142
As a second method to confirm the water demand over the past decade and to concurrently confirm the reported operations sequence for the transmission system, raw water meter data was evaluated from both North Saluda and Table Rock subsystems independently and concurrently. Raw water supplies from each subsystem from 2006 – 2013 were reviewed to understand the operational responses to varying conditions. An example is shown in Figure 2.

Figure 2
Scatterplot of 2012 Hourly Flow Data for North Saluda and Table Rock Water Supply
The lower left quadrant of Figure 2, as defined by the black dashed lines, indicates the hours when gravity flow was typically received at the Stovall WTP. While there are few points outside of this quadrant flow for 2012, the data points confirm that the Gayley RWPS is typically used before the NS RWPS. This data also shows no points above 45 mgd for NS RWPS, which indicates no usage of more than one pump at a time. This data was additionally correlated to annual and seasonal weather patterns to help validate the impacts of seasonal variations on water demand.
Step 3: Assess Infrastructure/System
The Infrastructure Assessment aspect of the evaluation included: interviews, discussions, and site visits; review of existing O&M records; non-destructive condition evaluations using thermography and vibration analysis; and discussions with local service providers and equipment vendors. The thermography analysis was performed using a FLIR E-4 thermography camera and the vibration analysis with a TPI-9070 hand-held vibration unit.
There have been limited failures with either subsystem and GW does not have a maintenance management system; therefore, run-time records and some purchase receipts were the primary non-verbal O&M records that were available.
Step 4: Perform Reliability Analysis
The reliability analysis was performed utilizing a combination of facilitated workshops, reliability modeling using commercial off-the shelf software (Reliasoft), and simulation

modeling using historical weather patterns in conjunction with modified system water demands. Facilitated workshops included the development of problem statements and the use of Reliability Block Diagrams (RBDs), Fault Tree Analysis (FTA), and Failure Modes and Effects Analysis (FMEA). The reliability modeling utilized the BlockSim module of Reliasoft in conjunction and industry data for typical useful lives and failure distributions. Simulated future demands based on historical weather patterns and modified system water demands were performed with spreadsheet tools.
Infrastructure Assessment North Saluda Subsystem
This section reviews the history of the North Saluda raw water transmission subsystem and potential challenges related to the infrastructure in the subsystem.
Transmission Main Review
The North Saluda transmission main is located inside a 50-foot right-of-way (ROW) and is located with an approximate 4-foot of cover over the majority of the transmission main. Isolation valves are located approximately every 10,000 linear feet with blow-offs typically being located adjacent to the isolation valves and air release valves at high points in the transmission main. The existing grade has remained consistent from the grade at the time of installation, except for areas near some highway crossings (e.g. Highway 11).
A formal hydraulic analysis has been performed on the Table Rock subsystem. This type of analysis does not exist on the North Saluda subsystem. Therefore, for the purpose of this assessment, the Darcy formula and a simplified approach to estimating the maximum capacity of a 48-inch pipeline by gravity results in a flow rate less than 28 mgd.
There has not been a significant break history along the transmission main and only two reported minor issues. It is important to note that formal corrective maintenance documentation is not available. According to a cross functional group of GW staff that included staff from Stovall WTP and GW Engineering, the breaks that have occurred have been due to:
1. Contractor error (2000) – A Contractor working near the transmission main scraped the pipe causing a leak.
This threat is the most likely cause for a pipe failure. Areas to monitor would include any roadway work in the area of pipe crossings and any future development.
2. Shifting rock (2000) – Along a creek bottom, the transmission main was not encased and changes to the landscape above it eventually exposed the transmission main.
Natural changes in landscape conditions will continue to be a threat to any pipeline. Consistent inspection of rights-of-ways may assist in avoidance of these type of pipe failures.
Another issue that has occurred was a pressure triggered event, however, there was no damage to the transmission main. Again, a formal manner of documentation and a root cause analysis was not performed and the problem has not occurred again. Pressure in the transmission main caused an appurtenance to fail in 2011. The cause of the failure appears to have been an anomaly in the SCADA system that has not occurred since.

This range of failures provides a good reason for the development of a repair/mitigation plan for this transmission main. While staff has experience in working with PCCP and feel they can repair a leak within approximately 5 days, there may be some areas that are difficult to access or may require additional coordination with the property owner or South Carolina Department of Transportation (SC DOT). CH2M HILL has identified the most critical areas for excavation along the transmission main route. These areas include:
Transmission main route along the Cliffs at Mountain Park – the transmission main is located through the golf course. While GW has ROW through the property and has maintained good communication with the owner, this area may require special considerations for access.
Crossing of SC Highway 11 - activities for road improvements were being constructed during the time of this study. This is a highly traveled area that will require coordination with the SC DOT.
Side road crossings (Hart Cut Road, Bates Crossing Road, Pleasant Retreat Road) – repair procedures may be extensive due to the angle of the road crossings in these areas. Mitigation plans should include communication with nearby property owners in these areas for an extended road closings.
Pump Station Review
Due to the age of the pumping equipment, GW has concerns about the reliability of the pump station to use when needed. The pumps and motors were analyzed using thermography to detect high temperature readings and vibration readings to check for any vibration in the operation of

the pump and motor, along with a review of the statistical evidence of failure for the raw water pumps.
There have been few times in the last 10 years where more than one pump has had to run. In the 1980s / 1990s, drought conditions required 2 pumps to be running regularly; however, flow records since 2006 show less than 10 hours where GW ran 2 pumps from the NS RWPS together. The most extensive use of the NS RWPS was in 2010-2011 during the installation of the new Table Rock 42-inch ductile iron raw water supply line. The cumulative pump usage for the NS RWPS is indicated on the pump run times shown in Figure 3.
Figure 3
Pumping Hours Since 2006 (Cumulative All Pumps)
Since most of the flow has historically been obtained by gravity, the NS RWPS has low operating hours (Pump #1 has 7,904 hours, #2 has 8,201 hours and #3 has 8,053 hours of recorded service). These pumps have never been rebuilt, nor have they had any major modifications to the interior of the pumps.
Reliability Analysis
The analysis of failure modes centered on two primary scenarios: all flow stops from North Saluda (highest consequence event under any operating condition) and flow above 26 mgd stops (the total failure of the pumping system; consequences depend upon operating condition). The North Saluda subsystem must provide 45 mgd of the maximum 75 mgd of the system and the failure of the transmission main in this area can significantly impact reliability of the system as a whole.
Failure Modes
Under the “All Flow Stops from North Saluda (High Consequences)” scenario, three major subsystem aspects were identified as the most probable sources of the failure mode. The first and perhaps most obvious was a transmission line collapse from the NS RWPS to the Stovall WTP. Staff reported that they had piping splice designs on the shelf, equipment and supplies available on the yard, and experience with repairing PCCP elsewhere in the system. Staff

estimated total repair time on the order of a few days to one week; however, our analysis also indicated a number of areas where access may be restricted and therefore some formal job planning needs to be developed in advance of a failure.
A second potential source of total failure was identified as the collapse of the transmission main from the reservoir intake to the pump station. This line passes below the dam and there have been no condition assessments performed on it or the intake. By all accounts the repair will be problematic and time consuming. There has been no formal planning for mitigating this type of event. The existing 48-inch diameter is RCP and PCCP, was installed in1960 and has had no failures or issues to date.
The third potential source of total failure was identified as the sleeve valve in the junction box at the lower end of the transmission line just prior to flow entering the Stovall WTP. The sleeve valve was installed in 1997 and has had no issues. It is a unique valve type for GW. As a result, there has been no preventative maintenance performed on the valve and no formal planning for its potential failure. It is believed that the valve would fail partially open and that some flow could reach the plant either through it or through a bypass pipe just upstream; however, this has not been investigated in detail and at best only partial flow would arrive at the plant.
Under the scenario of “all flow stops above 26 mgd” scenario, three major subsystem aspects were again identified as the most probable sources of the failure mode. From a subsystem operations standpoint, this is a scenario where the ability to pump water is lost since the subsystem can provide 26 mgd by gravity.
Under the “all flow stops above 26 mgd” scenario, the most obvious potential source of the failure mode included the loss of power. The incoming transmission line and the power substation at the NS RWPS is owned and operated by Duke Energy. Lightning strikes are not uncommon in summer months in upstate South Carolina. It was noted that such events has never delayed the ability to provide water nor is there any institutional knowledge of losing power at the facility for an extended period of time. The pumps were used only a few times over the past several years, but were used extensively when construction related to the Table Rock subsystem was occurring in 2010-2011 and during the drought of 2007.
A second potential source of this failure mode was the loss of one or more motor control centers (MCCs). The MCCs at the NS RWPS are old and have some operating nuances. On the other hand, there have been no failure issues related to the MCCs over the history of the pump station and only 1 of 3 pumps are needed in the current operating scenario for the foreseeable future. A local service provider has provided an indication that spare parts were available and that repair of an MCC would take less than a week depending on the failed component. A formal maintenance job plan or formal repair/mitigation plan has not been prepared for the MCCs.
The third potential source of this failure mode is the loss of one or more of the pump systems, and the primary concern is with a pump or motor which will have repair times of several months. All pumps are by the same manufacturer (KSB) who has stated that they service these pumps. The motors are similar and from the same manufacturer (Ideal Electric) and at least one local service company supports the repair of these motors. Other pump system components, primarily the actuators and valves take less than a week to repair. With the exception of the replacement of an actuator, there have been no known failures associated with the pump systems, and due to

their relatively limited use there has been no corrective maintenance needed for the motors or the pumps.
Failure Modeling
Failure modeling was performed using a combination of Fault Tree Analysis (FTA) and Reliability Block Diagram (RBD) analysis. With the assistance of GW, a schematic layout of the North Saluda subsystem was developed as shown in Figure 4, where each block is a critical point in the subsystem and each of the three pump systems is represented by the second block diagram. The BlockSim module within the Reliasoft reliability software suite was used to facilitate the reliability calculations. Reliability parameters were based on published references and modified, where applicable, based on site related information and experience.
Figure 4
Workshop Schematic of North Saluda Subsystem RBD
Failure modeling involves a number of uncertainties. Perhaps the largest uncertainties that can impact the results are the historical operating stresses and maintenance histories associated with individual system components. For repairable systems, there are also important distinctions relative to assumed maintenance standards and related activities (repaired “better than new”, “good as new”, “like old”, or “worse than old”).
Development of any model is a progressive process. Later versions of the model typically have more detailed data in order to refine the primary results. First generation models typically provide primary results, insights into system behavior and direction for gathering additional highly valued information. For the North Saluda subsystem, some of the key insights included:

1. There is a relatively high degree of uncertainty associated with both ends of the transmission line, notably both the transmission line from the intake to pump station and at the sleeve valve, where there has been no inspection or maintenance;
2. The prediction of reliability of the NS RWPS greatly benefits from needing only one of the three available pump system to meet the reliability requirements; and
3. There is on the order of 8,000 to 15,000 of total operation hours remaining for the exiting pump system.
There is meaningful uncertainty in this forecast due to several factors. Therefore while immediate new capital improvements is not recommended, more formal preventative and corrective maintenance planning is needed as well as new project planning and preliminary design is advisable in order to maintain system reliability.
Infrastructure Assessment for Table Rock Subsystem
This section reviews the history of the Table Rock raw water transmission subsystem and potential challenges related to the infrastructure in the subsystem.
Transmission Main Review
There have been no failures on the new 42-inch DIP since the new transmission mains have been installed. The most likely threat to the transmission main for a pipe failure is contractor excavations. It is recommended that GW monitor any roadway work in the area of pipe crossings and any future development.
As in the case for North Saluda transmission main, there is good reason for the development of a repair/mitigation plan for this main. While staff has extensive experience in working with DIP, this transmission main is also a cross-country transmission main and may include some areas that are difficult to access or may require additional coordination with a property owner(s) or SC DOT.
To determine the maximum capacity available by gravity in the 42-inch DIP transmission main, the Darcy formula was used to calculate the head loss by gravity and compare it to the available head in the system.
Using this formula, the maximum volume through a 42-inch transmission main from the full reservoir to the Stovall WTP is approximately 25 mgd. Line losses through the main from bends and appurtenances reduce the flow through the transmission main and therefore result in the 23 mgd that is typically seen at the Stovall WTP.
As part of the workshop discussions with GW staff, GW performed flow tests to determine the available flow from the 42-inch with the 30-inch supply offline. These tests were performed on December 3, 2014.
At the Gayley RWPS a single pump is able to increase flow to the WTP, providing approximately 30 mgd. With one pump running mild to severe cavitation occurs in the pump. When pumping with 2 of the 3 pumps, the cavitation is dissipated or is considered mild. The

pump station is able to pump approximately 35 mgd, with 2 pumps and using only the 42-inch transmission main.
Compared to previous results with the pumps running and the 30-inch online, a single pump is able to provide approximately the same flow (30-31 mgd), while there is an increase of approximately 2 mgd with both mains supplying the pumps. The amount of cavitation was not recorded during this flow test performed on August 7, 2014. During the condition assessment of the pump station, CH2M HILL personnel noted only very mild cavitation during any of the flow tests.
Pump Station Review
The MCCs, pumps, motors, and valves have approximately 13,000 hours each since they were installed in 1997. Figure 5 shows the cumulative pumping hours for the Table Rock pump station since 2006. The soft starts were installed in 2006-2007 and have significantly less hours of operation.
Figure 5
Pump Run Times for Gayley RWPS
The equipment has been maintained in terms of regular lubrication and regular exercise of the rotating components. Only one actuator has had an issue and it had no impact on raw water transmission. As shown in Figure 5, two of the three pump systems typically operates while the third remains in standby.
Reliability Analysis
The analysis of failure modes centered on two primary scenarios: all flow stops from Table Rock (highest consequence event under any operating condition) and flow above 23 mgd stops (the total failure of the pumping system; consequences depend upon operating condition). A third scenario, gravity flow from the reservoir to the Gayley RWPS was discussed but not

analyzed in detail since the 30-inch transmission main cannot provide 23 mgd by gravity flow by itself. This line does not provide full redundancy for the Table Rock subsystem.
Failure Modes
Under the “All Flow Stops from Table Rock (High Consequences)” scenario, three major subsystem aspects were identified as the most probable sources of the failure mode. All three were similar to the North Saluda subsystem, which is not surprising since the core design layouts are very similar (equipment and material types are different).
The most obvious potential source of the failure mode is the total collapse of the raw water transmission main from the Gayley RWPS to Stovall WTP. This 42-inch diameter DIP raw water transmission main is relatively new, constructed in 1997. There has been no failures associated with the transmission main and DIP is typically much easier to repair than the PCCP that is the North Saluda transmission main material. Regardless of pipe material, this pipeline is still a potential single point of system failure.
Unlike the sleeve valve associated with the North Saluda transmission main, the ball valve that is associated with the Table Rock transmission main in the junction box at the Stovall WTP is well understood by staff.
Under the scenario of “all flow stops above 23 mgd”, several primary sources of the potential failure modes were identified – however, none were considered highly probable and no historical failures had been experienced.
Backup power generation is not present; however, there have been no power outages of significance in the history of the pump station. Duke Energy provides power to the site and owns, operates, and maintains the substation.
Failure Modeling
Failure modeling was performed using a combination of Fault Tree Analysis (FTA) and Reliability Block Diagram (RBD) analysis. The BlockSim module within the Reliasoft reliability software suite was used to facilitate the calculations. Reliability parameters were based on published references and modified where applicable based on site related information and experience.
Although the 42-inch and 30-inch transmission mains around and upstream of the Gayley RWPS both can convey raw water to the Gayley RWPS, the transmission system in this area was modeled in series since the 30-inch diameter line cannot provide 23 mgd alone. One outcome of the reliability workshop with GW staff for the Table Rock subsystem was to do a more detailed field analysis of the varying alternatives and potential for maximum flow (although hydraulically 23 mgd cannot be achieved by gravity in the 30-inch line). The pump systems were considered to act in parallel, with two of three pumps operating and one in standby, to achieve 10 mgd of flow beyond the 23 mgd provided by the gravity flow system. It is possible to run one pump by itself, but this condition does not yield more than a few mgd of additional flow to the Stovall WTP, as well as it does not provide the reliability target of 30 mgd.

The analysis indicated that the Table Rock subsystem is highly reliable in its current condition. The primary insight gained was that the subsystem truly functions in a serial manner, not with any true redundancy from the parallel 42-inch and 30-inch transmission mains. All serial systems are only as strong as their weakest component. Therefore, formal maintenance planning and programs are needed to minimize risk associated with decreasing reliability as the system ages.
RESULTS
Step 5: Evaluate Ability to Predict or Accept Risk Associated with Potential Reliability Shortfalls and Step 6: Determine Repair or Replacement Alternative(s)
Findings and Recommendations for Raw Water Supply System
The Stovall WTP raw water transmission system is fully capable of providing 75 mgd to the Stovall WTP in a highly reliable manner for the next 5 to 10 years. With relatively small capital investment and more formal maintenance practices the system should provide a high level of reliability for 20 years and beyond.
In terms of capital projects, the system as a whole will need the capital projects provided in the 2009 Master Plan at some point. However, based on the actual demands in the five years since the 2009 Master Plan, the modified demand projections based on recent history, and the reliability analysis performed for this assessment, it is our opinion that those capital improvements can be delayed on the order of 5 years from the recommended times provided in the 2009 Master Plan.
Backup power availability for both the Table Rock and the North Saluda subsystems was discussed as a concern to the reliability of the pump stations. With the redundancy that is built into the system by having separate reservoirs that can provide some raw water supply, the decision on implementing these capital projects may also be delayed. For each pump station, the installation of a fixed generator that requires regular maintenance and operation by GW staff may be able to be replaced by a portable generator(s) that can be connected on as as-needed basis by GW. Further investigation is required for the assessment of the need and options for backup power.
The Table Rock subsystem has some advantages in terms of redundancy over the North Saluda subsystem. These advantages include the transmission system around and upstream of Gayley RWPS, and the familiarity of staff repairing cast iron pipe (CIP) and ductile iron pipe (DIP) over the prestressed concrete cylinder pipe (PCCP), but Table Rock has generally the same level of redundancy as a subsystem as does North Saluda.
The operating procedures and criticality of the raw water supply system will increase over the next decade. There also will be less flexibility in operating the system as demands increase. A more formal maintenance and reliability program is needed. This should include the operations, maintenance, engineering and compliance functions of the organization. A computerized maintenance management system is recommended to help drive business process and formal planning activities that will be needed to continue to have a reliable system.

Findings and Recommendations for North Saluda
The issue related to capital improvements to North Saluda subsystem is not “if” but “when”. The subsystem infrastructure is old but still in good condition and should be reliably functional over the next 5 to 10 years under the assumed conditions for this assessment. The pumping system has been used less than 500 hours in the past several years (July 2012 to July 2014), and it is effectively a backup for the Table Rock transmission system pumps, except in times of drought. While this analysis recommends delaying the timing of major capital improvements, Appendix C includes costs for alternatives that would have the largest impact on the risk, reliability and redundancy of the North Saluda system.
Developing, establishing, and maintaining formal preventative maintenance (PM) and corrective maintenance (CM) programs are essential to reliability. The North Saluda subsystem does not have such a program in place currently. While the reliable historical performance of the subsystem is a credit to its design, operation, and maintenance to date, there is a lower probability of the benefit of this being realized without a more formal system in place in the future. There are simply too many points of potential failure for reliability to be addressed sufficiently and cost-effectively with the capital improvement projects that have been proposed and the informal maintenance processes that are currently being used.
In summary, the following is recommended:
• Short-term (present to 1 years)
- Condition Assessment - Intake to Pump Station
- Corrective Maintenance (repair/mitigate) Plan – Intake to Pump Station
- Preventative and Corrective Maintenance Plan – MCCs
- Preventative and Corrective Maintenance (repair/mitigate) Plan – Sleeve Valve
• Short-term to Intermediate term (present to 5 years)
- Preventative and Corrective Maintenance (repair/replace) Plan – Pumps and Motors
- Corrective Maintenance (repair/mitigate) Plan – Difficult Transmission Areas
- Investigate Portable Generator Hook-up for backup power source for one pump
• Long-term (5 to 10 years prior to implementation)
- MCC Replacement (planning and preliminary design begin in the next 2 years)
- Pump and Motor Replacement (planning and preliminary design begin in the next 2 years)
- Standby Power Generation
- Parallel Transmission Line
A detailed critical spare parts assessment was beyond the scope of services of this project. However the following observations were made:

• The transmission main components are well known to the staff and the single biggest issue will be to keep a reasonable quantity of components readily available. Although there is not a formal maintenance management system in place, with associated job plans and bill of materials, there is every indication that sufficient quantities of spare parts are readily accessible.
• In terms of the NS RWPS, the spare parts available come from the fact that there are only 1 of 3 pump systems needed for the foreseeable future and even in the long-term projection only 2 of 3 are needed. The fact that all three systems (MCCs, pumps, motors, valves, and actuators) are the same provides readily available spares under the current operating scenario. Lead time for pump repairs from KSB was indicated to be 18 to 25 weeks (depending on the nature of the repairs) were the longest of the reparable items, while non-repairable replacement components were estimated to be on the order of one week.
• While all of the mechanical and electrical components related to three pump systems have been run in a balanced manner and therefore subject to potential failures in the same timeframe, the condition assessment indicated no issues of concern.
Findings and Recommendations for Table Rock
Like the North Saluda subsystem, the Table Rock subsystem does not have a formal maintenance management system. Also similar to the North Saluda subsystem, there is good historical performance in terms of reliability which is a credit to its design, operation, and maintenance to date. Many of the components of this subsystem are relatively new, which is generally good but can also be a blind spot, as there are several single points of potential failure which could be addressed by a more formal maintenance program.
The 2009 Master Plan included capital projects for backup power generation and replacement of the 30-inch raw water main from Table Rock to the Gayley RWPS. The transmission main replacement was completed in 2011.
In summary, the following is recommended:
Short-term to Intermediate term (present to 5 years):
• Preventative and Corrective Maintenance (repair/replace) Plan – Pumps and Motors
• Investigate Portable Generator Hook-up for backup power source for one pump
A detailed critical spare parts assessment was beyond the scope of services of this project. However the following observations were made:
• The transmission pipeline components (DIP) are well known to the staff and the single biggest issue will be to keep a reasonable quantity of components readily available. Although there is not a formal maintenance management system in place, with associated job plans and bill of materials, there is every indication that sufficient quantities of spare parts are readily accessible either on-site or from nearby suppliers.
• In terms of the Gayley RWPS, the pump system is relatively new and spare parts are readily available from local suppliers. Pumps and motors typically require months of lead time for repair, and in this case there is a singular, although technically sufficient, standby pump system. A more formal maintenance plan, including a bill of materials and the locations/sources of the components, should be developed and maintained.
Similar to the NS RWPS, the mechanical and electrical components related to three pump systems at Gayley RWPS have been run in a balanced manner. They are relatively new but with increased service time they will be subject to potential failures in the same timeframe. The condition assessment performed at the time of the visit indicated no issues of concern and regular vibration monitoring at the site has indicated no issues of concern at the present time.
DISCUSSION
Step 7: Document and Communicate Repair or Replacement Alternative(s)
It is one thing to calculate reliability and risk, and another thing to communicate it. It is important to both laypeople and to experts, but the effective communication of risk is so rarely taught that misrepresenting numbers is the rule rather than the exception (Gigerenzer, 2014). Whether vertically within different departments or horizontally across different departments, in every organization there are competing interests and competing perceptions of risk. Solomon and Sharpe (2013) have documented a number of details and best practices associated with communicating reliability and risk information to decision makers.
In the case of this project, a relatively simple and straightforward approach was utilized. This approach was consistent with having the full engagement of the Chief Executive Officer (CEO) and Chief Operating Officer (COO) engaged in the project combined with a desire of both the executive leadership and Board of Directors to understand the timing of required investment rather than to defend pet projects in the Capital improvement Program (CIP). In the end, the need for fundamental improvements in maintenance strategies and critical spare parts greatly over-shadowed the need to spend over $50 million in the short-term on capital projects.
CONCLUSIONS
The most obvious benefit for implementing a formal reliability assessment was that it enabled decision makers to defer $50 M of capital improvements that are not needed in the near-term. Perhaps just as important, the formal reliability assessment found several critical systems components, the most significant being the condition of the raw water intake pipeline and the top of the system and the sleeve valve at the bottom end of the system, which did not have capital or maintenance considerations.
Another benefit of the formal reliability assessment was to develop a more clear understanding among the staff related to required system performance and to debunk several key misconceptions. The most significant of these debunked was the perception that the Table Rock transmission pipeline was redundant and required no near-term planning or funding, when indeed the pipeline was not a redundant system.

A third benefit of the formal reliability assessment was that it concisely indicated where and why improvements were needed to the maintenance strategies and management systems. While it was true that the system did not have significant maintenance issues, it was clearly proven that it was just a matter of time before reliability problems occurred and that spending $50 million of capital in the wrong places would not solve that issue.
REFERENCES
Gigerenzer, Gerd (2014) Risk Savvy: How to Make Good Decisions. Penguin Group, p. 245-261, p 17-42
Gulati, Ramesh (2012) Maintenance and Reliability Best Practices, 2nd Edition, New York, Industrial Press, p. 167-169, 380-381
Moubray, John (1992) Reliability Centered Maintenance, Second Edition, Industrial Press Inc., p. 280-284
O’Connor, Patrick; Kleyner, Andre (2012) Practical Reliability, Fifth Edition, John Wiley & Sons, p. 421-449
SAE JA 1011-1999 (1999) Evaluation Criteria for Reliability-Centered Maintenance (RCM) Processes, Society of Automotive Engineers
Solomon, JD; Sharpe, Adam (2013) Regional Planning Using @RISK, PrecisionTree and Evolver, Part 2: Communicating to Decision Makers; proceedings from The Risk Conference 2013, Chicago, Illinois.
Wasserman, Gary S. (2003) Reliability Verification, Testing, and Analysis in Engineering Design, Marcel Dekker Inc., p. 9, p. 45-51