peri-urbanisation in europe - trimis · 96 agricultural and rural development policies annette...
TRANSCRIPT
PERI-URBANISATION IN EUROPE Towards European Policies to Sustain Urban-Rural Futures
SyNThESIS REPORT
EditorsAnnette Piorr
Joe Ravetz Ivan Tosics


1
PERI-URBANISATION IN EUROPE

2
PERI-URBANISATION IN EUROPE Towards
European Policies to Sustain Urban-Rural Futures
EditorsAnnette Piorr
Joe RavetzIvan Tosics
SyNThESIS REPORT
7 Preface Kjell Nilsson
8 EXECUTIVE SUMMARy Joe Ravetz, Annette Piorr, Ivan Tosics
18 A NEW KIND OF SPACE
20 Why the peri-urban? Ivan Tosics, Kjell Nilsson
24 Concepts and methods Wolfgang Loibl, Annette Piorr, Joe Ravetz
30 The dynamics of the peri-urban: global change and regional response Joe Ravetz, Wolfgang Loibl
42 PERI-URBAN AGENDAS 44 Economy and employment Piotr Korcelli, Elzbieta Kozubek
50 Population and migration Wolfgang Loibl, Simon Bell
56 housing and community Wolfgang Loibl
61 Mobility and transport Mika Ristimäki
65 Food and farming Annette Piorr
72 Environment and landscape Ingo Zasada, Regine Berges
76 Recreation and tourism Regine Berges, Ingo Zasada
80 Managing Growth Ivan Tosics, Joe Ravetz
CONTENTS
88 EUROPEAN POLICy AGENDAS 90 Cohesion Policies Annette Piorr
96 Agricultural and Rural Development Policies Annette Piorr
102 Transport Policies Mika Ristimäki, Ville Helminen, Panu Kontio
104 Landscape and Environmental Policies Ingo Zasada, Regine Berges, Simon Bell
106 Towards Europe 2020 Joe Ravetz
112 INTEGRATED DEVELOPMENT AND EU POLICy OPTIONS
114 Integrated Development for Peri-Urban Territorial Cohesion Joe Ravetz
124 New European Directions Ivan Tosics
132 ANNEX 134 Methods und models Annette Piorr
136 PLUREL XPlorer Katharina Helming
138 iIAT-EU Annette Piorr, Ingo Zasada
140 References
142 List of Authors
143 Imprint
6
7
U rban development is by far the most rapid type of land use change in Europe. Regardless which
future scenario we choose, urban expansion will continue at 0.5 – 0.7 % per year, which is more than 10 times higher than any other land use change. Ar-eas classified as peri-urban are growing four times faster than urban areas, at a rate which, if continued, would double their area of 48,000 km2 in 30-50 years.
Urban development has a lot of positive effects as a locomotive for economic development, but there are also many negative consequences of such rapid expansion. The results of the PLUREL project show that consumption of agricultural land will continue in all parts of Europe. Landscape fragmen-tation is concentrated in central western Europe, where only small patches of open landscapes re-main. With increasing welfare, changing lifestyle and consumption patterns, peri-urban growth is likely to continue, especially in the conversion re-gions of south and central eastern Europe. Other negative consequences of urban sprawl are traffic congestion, decay of inner city areas, unhealthy life styles and social segregation.
A better balanced and more sustainable devel-opment requires more policy attention at the re-gional level and the urban-rural interface. When it comes to policy making, the time has come to chal-lenge the conventional distinction between urban and rural issues. Instead, we need a more holistic, territorially integrated perspective to shape future EU Cohesion Policy, especially where it concerns eco-nomic development, social inclusion, transport, agri-culture, environment and landscape.
New research from the PLUREL project quanti-fies the trends, risks and potentials for peri-urbani-sation in Europe, and provides recommendations for
targeted policies and new concepts of urban-rural linkages. This synthesis report, authored and edited by Annette Piorr (Leibniz-Centre for Agricultural Landscape Research, ZALF), Joe Ravetz (University of Manchester, UOM) and Ivan Tosics (Metropolitan Re-search Institute, MRI), is based on data, maps and written contributions from scientists representing 35 institutions from 14 European countries and China. PLUREL, an Integrated Project funded by the EU’s 6th Framework Programme, started in 2007 and terminated in 2011.
PLUREL has approached the peri-urban issue on two administrative and geographical levels: the pan-European and the rural-urban region. This report focuses on the pan-European level, while the results of the studies on the regional level, based on six Euro-pean and one Chinese case study, are presented in a forthcoming book published by Springer (Pauleit et al., 2011). During the research process, a fruitful and inspiring dialogue has taken place with the EC (DG Research, DG Regio, DG Agri and European Environ-ment Agency), PURPLE, ICLEI and Eurocities.
I thank Thomas Sick Nielsen for his successful project management and all the authors of this syn-thesis report for their valuable contributions:
Simon Bell (Edinburgh CA, UK), Regine Berges (ZALF, DE), Piotr Korcelli (Polish Academy of Science, PAS, PL), Wolfgang Loibl (Austrian Institute of Tech-nology, AIT, AT), Annette Piorr (ZALF, DE), Joe Ravetz (UOM, UK), Mika Ristimäki (SYKE, FI), Ivan Tosics (MRI, HU) and Ingo Zasada (ZALF, DE).
Frederiksberg, December 2010Dr. Kjell NilssonForest & Landscape, University of Copenhagen – LIFECoordinator of PLUREL
Preface

8
9
Facts on peri-urbanisation
Today, the European areas classified as ‘peri-ur-ban’ have the same amount of built-up land as urban areas, but are only half as densely popu-lated.
There is a real risk of increasing urban sprawl: The growth of built development of peri-urban areas will be up to 3.7 times as high as in urban areas.
European-wide projections of built development in peri-urban areas are for 1.4 – 2.5% per annum – if such trends continue. Total built develop-ment in peri-urban areas could double between 2040 – 2060.
Similar modelling on the impacts of urbanisa-tion show that land fragmentation, loss of habi-tats and amenity values will all be more serious in the peri-urban than today.
Meanwhile, the peri-urban is also a place of in-novation and increasing employment in the service and IT sectors: 25% of peri-urban regions are classified as ‘highly innovative’.
New research from the EU Project PLUREL quan-tifies the trends, risks and potentials for peri-ur-ban regions, and provides recommendations for targeted policies and new concepts of urban-ru-ral linkages.
Executive Summary
New research results from the FP6 PLUREL project show that urban development is by far the most rapidly expanding land use change in Europe. Urban development has a lot of posi-tive effects as a locomotive for economic development, but it can also have serious negative social and environmental con-sequences, for example, through urban sprawl. A better bal-anced and sustainable development requires more policy at-tention at the regional level and on the urban-rural interface. The EU can promote an integrated rural-urban development by targeting its policies and funding towards peri-urban areas.
Energy wood plantation near Trieste, Italy
10
A New Kind Of Space
Why the peri-urban?
T he peri-urban – the space around urban areas which merges into the rural landscape – is grow-
ing rapidly across Europe. There is about 48,000 km2 of built development in peri-urban areas, almost equal to that in urban areas. But while most urban areas are now slow growing (at 0.5-0.6% per year), built development in peri-urban areas is growing at four times this rate.
There are many impacts of such rapid expan-sion. In many cases the result is sprawl, with increas-ing problems of social segregation, urban decline, wasted land, and dependency on oil for transport. However, there are examples of alternatives, with opportunities for improved quality of life, green in-frastructure, better linkages between city and coun-tryside, and more sustainable urban and rural devel-opment.
How to avoid the sprawl and achieve the op-portunities? A wide range of trends, projections and policy responses have been investigated by PLUREL, an Integrated Project under the EU’s 6th Framework Programme (EC FP6 036921). Emerging from this is a set of recommendations for policy.
Overall, the challenges of the peri-urban need to be addressed at the wider strategic level of the surrounding ‘rural-urban region’. This requires more effective local government, alongside new forms of social enterprise and cooperation, for ‘integrated de-velopment’ (i.e. ‘joined-up policy’) in the rural-urban region. Achieving this is a multilevel agenda, from local to national and European. At this higher level, there are a range of options for EU action.
What is the peri-urban?
T he peri-urban is the area between urban settle-ment areas and their rural hinterland. Larger
peri-urban areas can include towns and villages within an urban agglomeration. Such areas are of-ten fast changing, with complex patterns of land use and landscape, fragmented between local or re-gional boundaries.
Peri-urban areas are defined in the PLUREL project as ‘discontinuous built development, con-taining settlements of less than 20,000, with an average density of at least 40 persons per km2 (av-eraged over 1km2 cells)’ (figure 2, p.25).
In the EU, there are nearly 48,000 km2 of built development (‘artificial surfaces’) in areas which are classed as peri-urban, similar to the 49,000 km2 in urban areas.
The ‘hot spots’ – regions with the largest share of peri-urban land use and generally the highest rates of peri-urban growth – are mainly concen-trated in the central Pentagon area (i.e. between London, Paris, Milan, Munich and Hamburg), but also in parts of central and eastern Europe. Of the ‘top twenty’ peri-urban regions, nine are in the Netherlands, five in the UK, and the others in Germany, Poland and Belgium.
Rural-urban regions (‘RUR’) are the overall terri-torial unit for the PLUREL project. They include both the ‘Functional Urban Area’ (zone of daily commuting), and the surrounding rural hinter-land. Figure 3 on page 27 maps ‘statistical’ rural-urban regions across the EU. However, in policy terms, the boundaries are flexible in order to re-spond to problems and opportunities.
So, in summary: The urban area + peri-urban area = Functional Urban Area.
And also: The urban area + peri-urban area + ru-ral hinterland = rural-urban region (RUR).

11
Peri-urban areas suffer from urban pressures, but they also gain from proximity to urban areas, mar-kets and cultures. The direct impacts of uncontrolled expansion of built development are focused on ur-ban sprawl – defined by the European Environment Agency as ‘unplanned incremental urban develop-ment, characterised by a low density mix of land uses on the urban fringe’. Even without the expansion of built development, there are urban pressures on peri-urban areas: housing shortages, transport con-gestion, decline of landscape quality, economic re-structuring and social change. On the other hand, there are positive effects, such as proximity to mar-kets and work places, quality of life, and innovation.
What are the dynamics of change?
U rban expansion on a wider front is driven by economic growth and restructuring, new em-
ployment opportunities, growth of transport infra-structure, population growth and household change, as well as a decline of traditional rural economies. There are also more intangible factors, such as cultural values, lifestyles, social segregation, and urban/rural attitudes and perceptions. The combination of high economic growth with weak or fragmented govern-ance generally produces the worst types of urban sprawl.
The PLUREL project developed a set of scenarios based on the global climate scenario scheme of the IPCC (2001):
A1 – ‘Hypertech’: growth, technology innovation and out-migration to rural areas.
A2 – ‘Extreme water’: rapid climate change, and defence against flood and drought.
B1 – ‘Peak oil’: energy price shock, with re-popula-tion of cities and towns.
B2 – ‘Social fragmentation’: communities in re-treat into private enclaves.
For each of these a set of detailed models calculated the effects of economic growth, population change, environmental and technology factors onto land use change and built development up to the year 2025. The projections for an increase in built devel-opment (defined as ‘artificial surfaces’) are espe-cially high in peri-urban areas at 1.4 – 2.5% per an-num. In contrast, urban areas can expect growth rates of only 0.5 – 0.7%. If such trends continue, the total built development in peri-urban areas could double between 30-50 years. In practice, there are many localised differences within and between re-gions, depending on factors such as migration, transport systems and spatial planning.
There are implications for the EUROPE 2020 strategy, with its goal of “smart, sustainable and in-clusive growth”, which is almost in line with the in-novation friendly PLUREL scenario A1 ‘Hypertech’. This economic development path tends to assume large amounts of new built development, but there are side-effects which don’t appear in the strategy. The implication is clear – unless governance and spa-tial planning systems can be rapidly strengthened in some parts of eastern and south eastern Europe, the EUROPE 2020 strategy is likely to produce more ur-ban expansion and uncontrolled urban develop-ment.
12
Peri-Urban AgendasEconomy and employment
E conomic growth and restructuring often look to-wards lower density peri-urban locations. With
the ‘pull’ of the global economy, and with the ‘push’ of urban overcrowding and congestion, there are strong pressures for the relocation of economic activ-ity to peri-urban zones, with easier access to large sites and major roads.
There is also a capital accumulation dynamic. The peri-urban is often seen as a place to make higher profits at lower risk than in urban areas by landowners and developers, entrepreneurs and in-vestors, and by house builders and house owners. Rural economic change also contributes as the de-creasing labour intensity of agriculture combines with the influx of more affluent workers and retired households to rural areas. This generates demand for local service sector activities, and encourages the transition from rural to peri-urban economies.
The economic policy agenda revolves around ‘peri-urban territorial cohesion’. There are crucial dif-ferences between an urban-regional economy based on ‘branch plants’ serviced by commuter settle-ments and one which is diverse, resilient and sus-tainable. If the latter goal is to be achieved, policies and programmes should aim at capacity building for restructuring, diversification, and better urban-rural linkages, especially for entrepreneurialism, finance and markets.
Population and migration
Population changes in peri-urban areas show high contrasts. In the central and eastern EU, many rural areas depopulate, while urban areas experience modernisation, some with population decline and others with growth. In the western EU, many rural areas are re-populated by urban-based residents. In both cases, peri-urban change is about social and economic restructuring, as much as direct urban ex-pansion.
In the future, as population growth is projected to level off, migration at various levels will become a greater influence. Demographic trends will widen the interregional gaps across Europe, so that more
peripheral regions in central and eastern Europe have less chance of catching up. Europe-wide migra-tion (in particular from eastern EU and from outside the EU), as well as national level migration will change the demographic structure, with effects on employment, lifestyles, cultures and communities.
The policy agenda is aimed towards communi-ties which are balanced in age, class, ethnicity and occupations. Urban regeneration should increase the social and economic viability of inner areas, while rural development should sustain the rural so-cial structure and balance. In between, the PLUREL research has identified the agenda for sustainable peri-urban communities, which combine old with new, and urban with rural. This is both a local issue for towns and villages in the peri-urban, and a stra-tegic issue at the level of the rural-urban region.
housing and communities
Social and cultural preferences for housing location can be a powerful driver for spatial segregation and social fragmentation. Most peri-urban development is due to families and older groups, and most hous-ing in-migration is due to high income and educa-tion groups. This further encourages urban sprawl, gated communities and the removal of local com-munity services from the peri-urban areas.
For the future, there are key drivers of change: rapid changes in lifestyles and housing location choices, teleworking, dual career households, as well as flexible household and retirement arrangements. Self-determined lifestyles often result in fewer peo-ple per household, with growth in housing area de-mand. Technology, such as on-line public services and shopping, is changing the structure of local cen-tres and the pattern of housing and settlements. On the other hand, rising oil prices might constrain long-distance commuting.
The policy agenda aims towards social inclu-sion, integration and cohesion. Housing markets and allocation systems have the primary role to play. Housing locations should be accessible, environ-mentally sustainable and available for all social groups, as well as being integrated into the sur-rounding landscape. Positive support is needed for public and commercial services in peri-urban settle-ments, which are vulnerable to change and restruc-turing.
13
Mobility and transport
A t present, low density urban sprawl causes longer commuting distances, increased infra-
structure costs and less viable public transport sys-tems. Urban expansion encourages car use, and car use encourages urban expansion. Improvements to infrastructure can reduce congestion and emissions, but often exclude the poor and those without cars, while encouraging longer distance commuting.
The PLUREL modelling looked at the effect of different spatial types. The transport system that has the lowest impact works with a monocentric settlement pattern with public transport modes. For a polycentric settlement pattern, multimodal and trans-modal systems are possible, but would require larger public investments.
To achieve the optimum is a challenge: how to coordinate and obtain investment into multimodal transport choices in a fragmented peri-urban area? Or how to locate urban developments and activities in the most accessible parts of the peri-urban? Each solution requires stronger and more strategic gov-ernance at the level of the rural-urban region.
Food and farming
Food security is one of the first priorities for the EU, but there is a critical interface between agriculture and peri-urban land use change. At present, regions with strong agriculture sectors, combined with the highest proportions of peri-urban areas, include north west Germany, Denmark and the Benelux, large parts of Poland and Hungary, southern UK, western France and eastern Italy. Conflicts often arise where urban expansion destabilises rural economies, patrimony systems and land markets. There is also great potential, where peri-urban farm-ing provides local or high value products, in a more sustainable multifunctional landscape.
Future trends will depend on biotechnology, on climate change, water and soil, on fertilizers and the possibility of ‘Peak oil’. A key factor is the changing rural economy and the availability of labour, full-time or part-time. The PLUREL scenario modelling projects a general increase in farm productivity, as former low-capital and small scale farming is modernised. Some scenario projections show the doubling of peri-urban areas in 30-40 years, and peri-urban agricultural areas (many of them with the highest quality land) could be reduced by up to 15%.
Overall, the agriculture policy agenda aims to turn the conflicts between agriculture and peri-ur-ban into opportunities – employment and quality of life in diverse, productive, multifunctional land-scapes. Success will depend on a new peri-urban fo-cus that links agricultural policy with wider agendas, such as climate change and adaptation, public health and food quality, leisure and community services.
Landscape, ecology, recreation, and tourism
Large parts of the European environment are under pressure from peri-urban development. This affects many types of ‘ecosystem services’, including biodi-versity, water supply, flood control, soil quality, land-scape aesthetics and the capacity for climate change adaptation. The concept of ‘ecosystem services’ is a key theme for peri-urban policy. Moreover, many of Europe’s wide variety of landscapes – places for re-creation and regional identity – are endangered by further urban growth, as shown by the PLUREL mod-elling results. This negatively affects flows of matter, energy and species, such as the fragmentation of habitats and reduced groundwater recharge etc. As to the future – the PLUREL scenario modelling anticipates higher growth of artificial surfaces in areas which are already under the most pressure. On the social side, peri-urban areas are under pressure from recreation and tourism: Where the local ‘brand’ and image lead the way, then housing and services often follow. The demographic shift towards a semi- or non-working population is also a ‘leisure shift’, with the result that large peri-urban areas are in ‘golf course’ or ‘horsiculture’ uses for affluent consumers.
The policy agenda includes the goals of multi-functional landscapes, sustainable resource man-agement, conservation of habitats and cultural landscapes. But in reality, there are challenges – how to manage and fund ‘ecosystem services’ in a fast changing peri-urban context? And how to develop coordination and cooperation in a fragmented and undefined territory? Such challenges suggest the need for a new kind of multilevel, multifunctional governance.
14
Managing Growth
T he problem of uncontrolled urban sprawl can be seen as a market failure. Society would be better
off as a whole by coordinating development, but of-ten lacks the means to do so. This is a problem not only of urban expansion, but urban shrinkage (par-ticularly in older industrial areas), which also causes and is caused by expansion.
In reality, there is often fragmentation between government units, and a ‘governance gap’ for deci-sion making and investment. There is therefore an urgent policy agenda to set up or enable such bodies. The PLUREL research looked at three main issues:
Firstly, there are general problems with the ca-pacity of the formal government system and planning policy regime to control land use changes in most EU member states. The PLUREL project analysed the level of organisation, the level of democratic control, and the level of frag-mentation of governance structures in a typical rural-urban region;
The question of spatial planning follows in rela-tion to its lack of legal strength and capacity for cross-border coordination, and its lack of influ-ence on infrastructure provision. Besides, there are problems with the NIMBY (“Not In My Back Yard”) and similar lobbies and political move-ments, with incentives for continuing urban sprawl;
Thirdly, financial and taxation mechanisms of-ten create incentives for urban sprawl, either di-rectly (e.g. linking public support to population number) or indirectly (through local tax compe-tition). Each country needs to review its system for local or regional taxation and reinvestment. This can involve both the public sector and also new kinds of partnerships, such as for ‘ecosys-tem services’ and social reinvestment.
15
European policyagendas
Policy Response
N ational or EU policies rarely take the peri-urban sphere into account, and the peri-urban (often
cross-cutting administrative boundaries) rarely makes the best use of policies and funding. Many peri-urban areas qualify for either urban or rural de-velopment funding from various sectoral budgets. But this is rarely focused on place-specific require-ments, and there is a hidden risk of uncoordinated development and urban sprawl.
Meanwhile, it is clear that peri-urban areas have great potential and great opportunities. So we need to refocus policy to address this. At the EU level, this applies particularly to the Structural and Cohe-sion Funds, as well as the CAP and various transport/environment policies. Around 20% of the total Structural Funds in the Programming period 2007 – 2013 will be spent in rural areas, and around 32% in urban areas. The Structural Funds and associated programmes have an indirect but powerful effect on peri-urban development, as well as in regions which are predominantly peri-urban.
In terms of agriculture, countries with large peri-urban areas spend more of the Rural Develop-ment budget for diversification measures than those countries which are mainly rural. In most other countries, investment support and agri-environ-mental payments are the main focus of Rural Devel-opment funding. In terms of better policy targeting, it has to be stated that the potential for rural-urban linkages has not yet been realised. In future, the CAP should focus on these linkages, with a more multi-functional landscape of urban, peri-urban and rural food production with short supply chains, peri-ur-ban leisure activities, sustainable landscape man-agement and urban-rural LEADER initiatives.
In some countries, more than 10% of NATURA 2000 sites are in peri-urban areas. While Rural Devel-opment programmes support extensive agriculture and diversification in such peri-urban areas of high ecological value, other measures such as LEADER do not.
Towards EUROPE 2020
Current and projected development trends are likely to bring rapid changes to peri-urban areas:
Globalisation and innovation. Conventional eco-nomic development often takes peri-urban land as the location for large scale industry, science and business parks, roads and other urban infra-structure;
Demographic change. The shrinking of some re-gions, the ageing of many others, and one-sided migration tendencies bring challenges to the population stability of peri-urban areas, lead to Europe-wide unwanted restructurings of popu-lation, and further widen the gap between over- and under-populated areas;
Climate change impacts combined with urbani-sation and fragmentation of peri-urban areas resulting in flooding and sea-level rise in some areas, while in others, soil erosion and habitat loss. Energy shortages will change the viability of peri-urban transport, while the search for re-newable sources will claim peri-urban land use.
EUROPE 2020 is a potential driver of policy innova-tion for “territorial cohesion”, integrating economic, environmental and social aspects. But achieving the Lisbon Agenda, on current trends, is likely to produce urban sprawl on a massive scale. So, there is a need for a stronger policy focus on the peri-urban agenda, particularly in terms of major financial interven-tions. EUROPE 2020 could become an opportunity for new thinking on core agendas in the peri-urban. This would require, however, a multilevel approach, particularly with national government systems, planning policies and financing for local and re-gional development.
16
Government and governance for integrated development
A strong and democratic government is the pre-condition for the management of market forces
for public benefit. In peri-urban areas, there are par-ticular problems of fragmentation, under-invest-ment and ‘winner takes all’ conflicts. Therefore, the government at the local and rural-urban region level needs to focus on its effectiveness and outcomes:
The local government financing system and source of revenue. This should avoid fiscal incen-tives that lead to wasteful competition for houses or investments;
The local taxation system. This should encour-age balanced development for business and households, and avoid tax incentives for urban sprawl;
Sectoral policies and subsidies for infrastructure, transport, housing or agriculture. Each should aim at diverse and resilient patterns of develop-ment, for instance, with multi-modal transport planning;
Spatial planning and regulatory coordination of development, land use change and especially larger projects aiming not only at restrictions, but also the positive enabling of polycentric di-versified activities;
Finally, effective mechanisms for cooperation at the level of the rural-urban region, aiming to-wards joint strategic planning rather than a ‘winner takes all’ competition for development.
There is also an agenda for more responsive ‘bottom-up’ forms of governance – not to replace formal pol-icies, but to work alongside them and fill in any gaps. The PLUREL case studies identified ‘new institutional’ partnership models for collaboration between pub-lic, private and community sectors. There are also ‘policy intelligence’ models to deal with complex problems, and ‘social entrepreneur’ models to mobi-lise resources in the social economy.
In parallel, there are ‘territorial models’ for inte-grated spatial development. At the rural-urban re-
gion level, strategic planning should promote low-impact infrastructure and public services in sustainable settlement forms. This then applies to many territorial types: from the airport zones and business parks, to large urban infrastructure, to towns and villages, and to multifunctional land-scapes connected by green-blue infrastructure. Overall, there is a policy menu for putting the whole picture together – i.e. managing the peri-urban through ‘integrated development models for rural-urban regions’:
Spatial strategy – policy framework at the level of the rural-urban region to coordinate peri-ur-ban development and low-impact infrastructure, and to set up controls and incentives to avoid sprawl. Focus on the potential for zoning, such as green belts, to be positive catalysts more than restrictions;
Economic strategy – peri-urban diversification and resilience of local economies and employ-ment involving rural diversification and multi-functional land-based activity, as well as urban regeneration with improved urban-rural links. Focus on the social economy in the peri-urban, and on mobilising hidden resources;
Social strategy – housing and service provision to encourage balanced, inclusive and resilient com-munities. Focus on the needs and opportunities in different settlement types, and on social functions and values provided by peri-urban areas;
Environmental strategy – ecosystem services policy and investment system involving climate change mitigation and adaptation, landscape and habitat conservation, and multilevel green-blue-infrastructure. Focus on diversified, resilient, multifunctional agriculture and forestry;
Governance strategy – strong and democratic municipal government focusing on healthy fi-nances and fiscal policy, a capacity for invest-ment in infrastructure, playing an active role in the local economy, and transparency with public and stakeholder participation. Focus on the ca-pacity for strategic and cross-border coordina-tion at the level of the rural-urban region.
Integrated Development and EU Policy Options
17
EU policy options
T he agenda for managing the peri-urban is multi-level: from the local to the rural-urban region, to
the national and European levels. Policies and pro-grammes at the European level may be part of the problem or they may be part of the solution. So there is a new agenda for EU policies and funds with any kind of linkage to spatial development and ter-ritorial cohesion. In particular, the PLUREL results show that to meet the challenges of the EUROPE 2020, we need to refocus and retarget EU policy and investment to include for its effects on peri-urban change.
To do this, the core objectives of EU policies and funding programmes should include support for ter-ritorial ‘integrated development models for rural-urban regions’. And by implication, if an EU interven-tion appears likely to produce urban sprawl, it should not proceed. To support this, in the optimal case, a system of definitions and boundaries will be needed (to be developed by the nation-states, along a given EU framework regulation), so that clear targets and benchmarks can be drawn.
So, how to make this work for Europe? We set out here five possible ‘options’ for EU-level policy and/or financial intervention that would promote ‘integrated development models for rural-urban re-gions’. The most effective option is first, and the fall-back option is last.
1. EU DIRECTIVE for Integrated Rural-Urban Development: A legal mandate and operational structure for ‘inte-grated development models for rural-urban regions’. The target is defined in the form of framework crite-ria, with a focus on the procedural system. Following the example of the Water Framework Directive, this involves not only EU financing, but all forms of de-velopment.
2. EU CONDITIONALITY for Integrated Rural-Urban Development: For access to European financing (Structural Funds, CAP etc) integrated development plans would have to be prepared on the rural-urban region level, and approved by relevant authorities. Rural-urban re-gions would be accepted as the main territorial ba-sis for EU financial programming and assistance.
3. EU COMMUNITY INITIATIVE for Integrated Rural-Urban Development: A dedicated fund would be allocated among the member states to be used directly for specific pilot and demonstration projects (following the example of the pre-2007 version of the URBAN Community Initiative).
4. EU Open Method of Coordination for Integrated Rural-Urban Development: Benchmarking and indexing with a common sup-port system. Member states would prepare a Na-tional Action Plan, with a capacity building pro-gramme of best practice, skills development and policy advocacy.
5. EU Reference Framework for Integrated Rural-Urban Development: An advisory service with some technical backup, in-cluding guidance, tools and documentation.
Each of these options recognises the immense chal-lenges of peri-urban change, and the impacts of cur-rent EU and national policy. They also need to recog-nise the potential of positive visions, strategic goals and integrated policy frameworks to generate new opportunities for all involved.

18

19
A NEW KIND OF SPACE
20
Urban sprawl and the consequences
I n 2008, for the first time in human history, the number of people living in urban areas exceeded
the rural population. Urbanisation is a worldwide phenomenon. The World Resources Institute (2001) estimated that in 2025, more than 50% of the Afri-can and Asian populations would be living in urban areas. In central and south America, these figures will be between 75 and 85% (figure 1).
Managing urban population change will be one of the most important challenges during the next decades, along with moderating the impacts of climate change. In developed countries, the urban future will involve dealing with complex changes in the composition of urban populations and contai-ning urban sprawl beyond the suburbs to retain the critical ecosystem services that will sustain popula-tion growth. In developing countries, where 80% of the world’s population resides, central issues will be how to cope with an unprecedented increase in the number of people living in urban areas, and with the
Why the peri-urban?
Urban areas are expanding due to a combination of population growth and outward spread of urban activities. The result is that urban and rural areas are no longer separate territories. The newly emerging ‘peri-urban’ areas are the site of the most dynamic changes. Peri-urban problems and opportuni-ties are best addressed at the level of the rural-urban region, which includes both peri-urban and rural hinterland areas.
10
9
8
76
54
3
2
1
0 1950 1975 2000 2025RURAL DeveLoPIngRURAL DeveLoPeD
URbAn DeveLoPIngURbAn DeveLoPeD
100
90
80
7060
5040
30
20
10
0 Afrika Asia europeCentralAmerika
northAmerika
SouthAmerika
1970 2000 2025
persentFigure 1: estimated urban population by region. Figures from World Resources Institute (2001)
21
growing concentration of these urbanites in large cities with millions of residents and declining availa-bility of natural resources.
In the decade 1990 – 2000, the growth of ur-ban areas and associated infrastructure throughout Europe consumed more than 8000 km2 – equivalent to the entire territory of the state of Luxembourg, or 0.25% of the total area of agriculture, forest and na-ture land (EEA, 2006). This is an almost irreversible process, since less than 10% goes the opposite way, i.e. is transferred from urban land into brownfields, and only a minor part of these are reclaimed for ar-able land use or nature. An important driving force behind urban expansion is, of course, the growth of the urban population. An equally important effect, however, is the ‘per capita sprawl’: cities have be-come much less compact. Since the mid 1950s, Eu-ropean urban areas have expanded on average by 78%, whereas their population has grown only by 33% (EEA, 2006). Even in regions where the popula-tion is decreasing, urban areas are still growing, no-tably in Spain, Portugal, Italy and in eastern Ger-many. Leipzig-Halle is an example of a region which suffers from both the problems of a shrinking city and urban sprawl. The same trend – that urban ar-eas expand faster than the population – can be seen in the United States and China (Nilsson and Nielsen, 2010).
The dominant spatial form of the continued ur-ban expansion processes is urban sprawl, which blurs of boundaries between what is urban and what is rural. Infrastructure, activities and inhabit-ants affect rural zones at a growing distance from the city centres, causing land use changes, land use competition, and social and economic changes in what were previously rural areas. The rural land-scape is no longer simply for agricultural production and residential use, but also for purposes of recrea-tion and amenity.
It is no longer easy to argue for the traditional split between the two geographies of urban and ru-ral Europe. In most countries, urban centres have long since lost their particular privileges, and there is no longer a clear difference in the administrative status between town and countryside. The rural life is urbanised by transcending commodity relations, and lifestyles are organised around mass consump-tion regardless of location (ESPON, 2006).
There are increasing conflicts between urban and rural uses that need to be addressed (Mcrit, 2010). For example, water availability for agriculture versus water to drink and for industry, using land for
agriculture or to urbanise and build upon, and unaf-fordable housing prices due to increased demand as metropolitan expansion or residential tourism takes place.
As differences between urban and rural be-come decreasingly clear-cut, it is difficult to analyse urban and rural areas separately, but instead as fuzzy territories composed of mixed areas, from more the densely urbanised to diffuse and disperse zones and isolated towns (Mcrit, 2010). The terms ‘rural’ and ‘urban’ refer increasingly to social atti-tudes and stereotypes, or narratives, than to real places. Urban areas can be found in rather rural landscapes, such as urban sprawl, in commuting ar-eas of a major metropolis, large food processing dis-tricts and scientific clusters, while rural areas can be found within urban environments, namely urban farming and gardening, urban forestry and agricul-tural communities within metropolitan areas.
The spatial context: The rural-urban region
PLUREL deals with the problems of urban expansion through the lens of the rural-urban regions (RUR). This concept can be considered as the spatial exten-sion of the Functional Urban Area (an urban core and its surrounding commuting ring, see e.g. ESPON 1.1.1 (ESPON, 2005)), including both the peri-urban and rural part of an urban catchment up to a dis-tance where daily commuting ceases due to travel times becoming too long. Areas of recreational use, food supply and nature conservation located in pre-dominantly rural areas are also part of the RUR. Ru-ral-urban regions can also be described as spatial clusters of three interrelated regional sub-systems – the urban zone, the peri-urban surroundings and the rural hinterland, all characterised by different structures, functions and relations which are re-flected through different land use classes.
It is a natural wish of many families to increase their quality of life by acquiring low-rise single fam-ily residences on larger plots. However, the advan-tages of the individual families must be balanced against the negative impacts of urban expansion. These impacts depend to a large extent on the spa-tial pattern of urban growth: polycentric develop-ment is less harmful then unlimited urban sprawl.
Empirical investigations have resulted in long lists of negative impacts related to urban sprawl. Most well known are the environmental impacts. For example, the consumption of mostly non-re-
22
newable resources such as land and soil, as well as the negative effects on the ecosystems functions, the environmental impacts such as poor air quality and high noise levels etc. But there are also eco-nomic impacts (the loss of concentration and eco-nomy of scale, and the increase in travel needs be-tween work and home) and social impacts (greater residential segregation of different social classes) (see e.g. SCATTER, 2004).
The peri-urban area is the dynamic transition zone between the denser urban core and the rural hinterland, consisting of a lower density discontinu-ous urban fabric and a mix of residential, commer-cial and leisure-related land uses. Peri-urban areas exhibit throughout Europe very different character-istics regarding spatial structure and density of the different land uses, ranging from continuous low density urban fabric, to scattered medium density settlements and commercial sites; from dense horti-cultural areas to arable and range land, to forests and natural areas.
The peri-urban is not just an in-between fringe. It is instead a new and distinct kind of multifunc-tional territory, and often the location for opportuni-ties such as airports, business parks and high value housing, which are all seen as essential to urban/re-gional development. However, in most cases, it is also the location for problems: urban sprawl, wasted public funds, traffic congestion, agricultural land un-der pressure, damage to landscapes and biodiversity, fragmented communities and social polarisation.
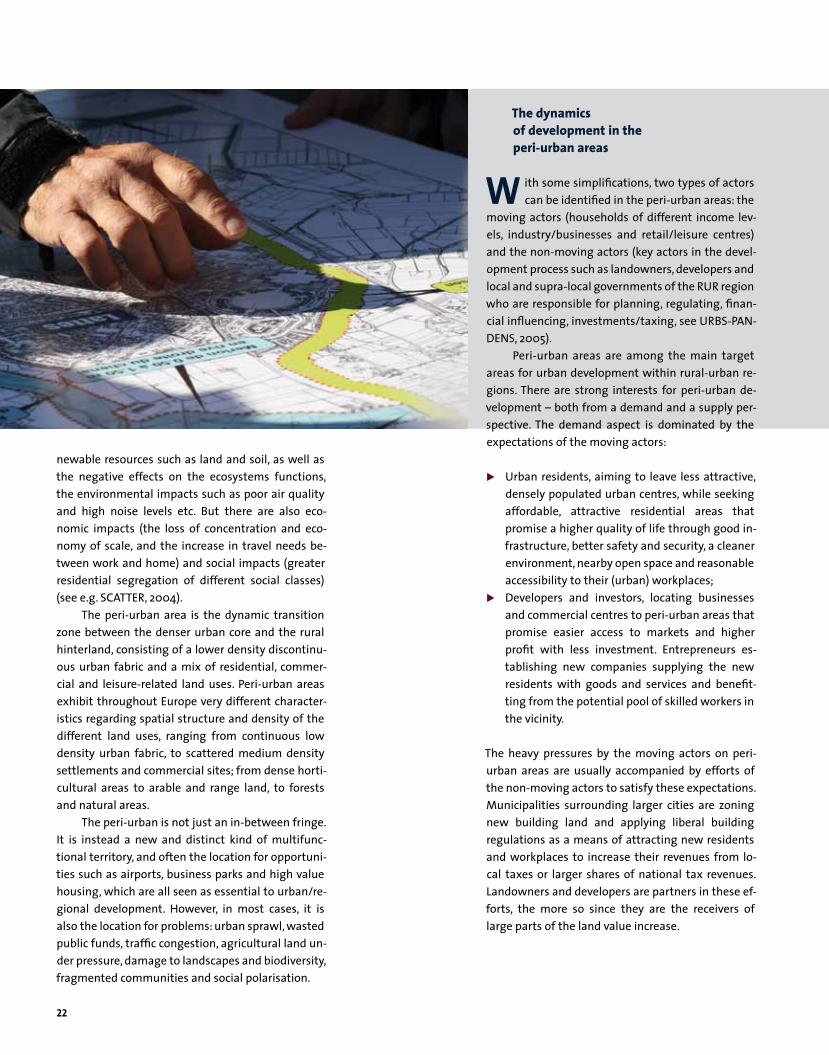
The dynamics of development in the peri-urban areas
W ith some simplifications, two types of actors can be identified in the peri-urban areas: the
moving actors (households of different income lev-els, industry/businesses and retail/leisure centres) and the non-moving actors (key actors in the devel-opment process such as landowners, developers and local and supra-local governments of the RUR region who are responsible for planning, regulating, finan-cial influencing, investments/taxing, see URBS-PAN-DENS, 2005).
Peri-urban areas are among the main target areas for urban development within rural-urban re-gions. There are strong interests for peri-urban de-velopment – both from a demand and a supply per-spective. The demand aspect is dominated by the expectations of the moving actors:
Urban residents, aiming to leave less attractive, densely populated urban centres, while seeking affordable, attractive residential areas that promise a higher quality of life through good in-frastructure, better safety and security, a cleaner environment, nearby open space and reasonable accessibility to their (urban) workplaces;
Developers and investors, locating businesses and commercial centres to peri-urban areas that promise easier access to markets and higher profit with less investment. Entrepreneurs es-tablishing new companies supplying the new residents with goods and services and benefit-ting from the potential pool of skilled workers in the vicinity.
The heavy pressures by the moving actors on peri-urban areas are usually accompanied by efforts of the non-moving actors to satisfy these expectations. Municipalities surrounding larger cities are zoning new building land and applying liberal building regu lations as a means of attracting new residents and workplaces to increase their revenues from lo-cal taxes or larger shares of national tax revenues. Landowners and developers are partners in these ef-forts, the more so since they are the receivers of large parts of the land value increase.

23
Urban sprawl as a policy challenge
Urban expansion is a natural process. However, it is a difficult policy challenge to steer this process
and avoid urban sprawl. Peri-urban areas and their problems cross many administrative and sectoral boundaries, and they are rapidly changing locations towards both success and failure side-by-side, in social, economic and environmental terms. For all these reasons, effective policy responses are likely to be multilevel, multiagency and multifunctional.
Today there is a clear need for peri-urban think-ing, coming from at least three sides, and for slightly different reasons. Rural stakeholders and environ-mentalists are directly interested in resisting the ur-ban push for land use change of the green. Urban
stakeholders and protagonists of sustainable devel-opment are looking for the most suitable level of territorial governance for complex and contradictory urban problems which cross municipal boundaries. Finally, at least some of the EU stakeholders aim to tackle the controversies of EU fund regulations, and are looking for spatially integrated interventions to replace single-sector policies that usually have large externalities. There is growing awareness that the major EU interventions – Cohesion Funds and Com-mon Agricultural Policy (CAP) subsidies and pro-grammes – largely ignore peri-urban issues and sometimes even contribute to the sprawling version of urban growth.
view from the old town of Sibiu towards the urban fringe, Romania
24
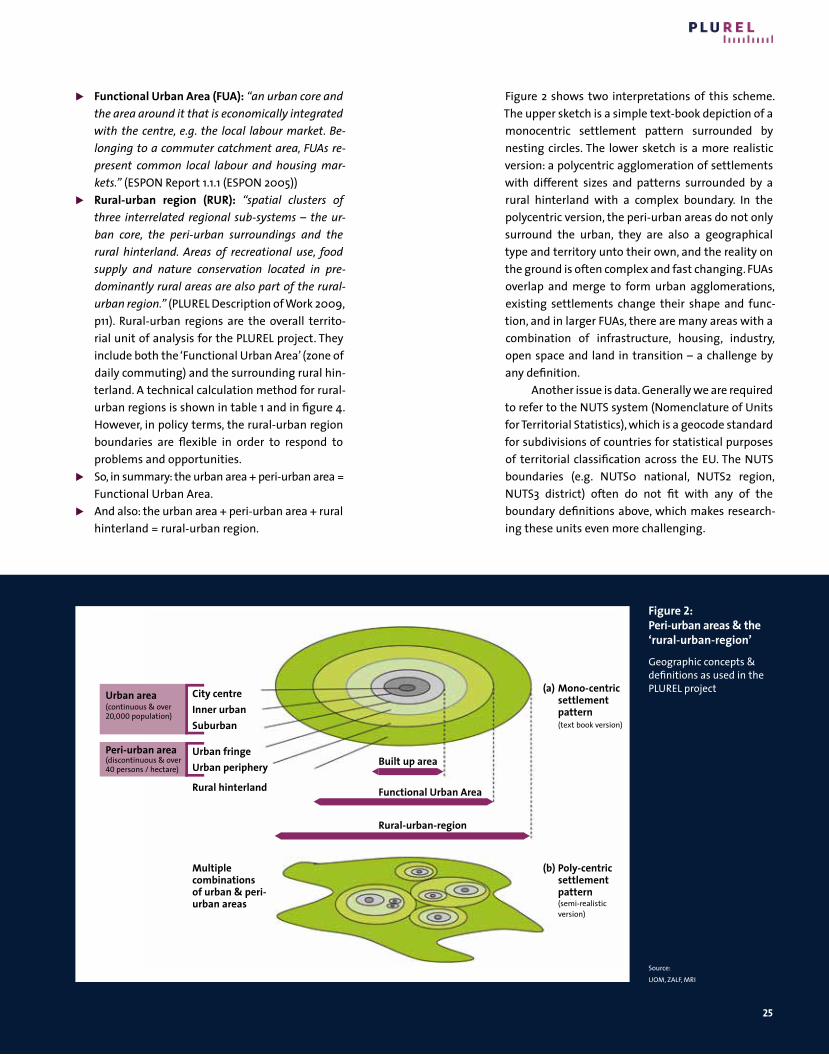
Definition of peri-urban as transition zones
The peri-urban is a zone of transition between ur-ban and rural areas. In many cases, this zone
changes rapidly as the urban area expands and re-structures, while in some regions it is carefully man-aged and preserved. Increasingly, the peri-urban is also recognised as a spatial type and territory in it-self, characterised by a dispersed and non-contigu-ous fabric of built-up and open spaces surrounding the urban core areas.
To understand the peri-urban area and the dy-namics of change, we need to explore the spatial context more extensively. Within the PLUREL project, a ‘rural-urban region’ (RUR) has been defined as the main unit of analysis, with a range of area types shown below as nesting circles (figure 2). (Note that the meanings of each of these areas may vary be-tween different countries and languages. A techni-cal definition of the rural-urban region is shown in the next section). These area types include:
Urban core – which includes the Central Busi-ness District and other civic functions;
Inner urban area – generally higher density built development (built-up areas);
Suburban area – generally lower density contigu-ous built-up areas that are attached to inner ur-ban areas and where houses are typically not more than 200 metres apart;
Urban fringe – a zone along the edges of the built-up area, which consists of a scattered pat-tern of lower density settlement areas, urban concentrations at transport hubs and large green open spaces;
Urban periphery – a zone surrounding the main built-up areas with a lower population density, but belonging to the Functional Urban Area as described below. This can include smaller settle-ments, industrial areas and other urban land uses;
Rural hinterland – rural areas surrounding the peri-urban area, but within the rural-urban region.
The peri-urban area includes both the urban fringe and urban periphery. This is defined for the PLUREL project as: ‘discontinuous built development containing settlements of each less than 20,000 population, with an average density of at least 40 persons per hectare (averaged over 1km cells)’ (Loibl and Köstl, 2008).
Each of these area types is contained within a whole urban system. A number of different concepts related to urban system units with different bounda ry definitions are in use. Some of these are vague and some are quite specific. The PLUREL project focuses on two classifications:
Concepts and methods
The peri-urban is a zone of transitions between urban settle-ments and their rural hinterland. Here we introduce concepts and definitions of the peri-urban within the wider context of the ‘rural-urban region’. The technical analysis and typology shows the distribution of peri-urban areas and the locations of ‘hot spot’ concentrations around europe.
25
Functional Urban Area (FUA): “an urban core and the area around it that is economically integrated with the centre, e.g. the local labour market. Belonging to a commuter catchment area, FUAs represent common local labour and housing markets.” (ESPON Report 1.1.1 (ESPON 2005))
Rural-urban region (RUR): “spatial clusters of three interrelated regional subsystems – the urban core, the periurban surroundings and the rural hinterland. Areas of recreational use, food supply and nature conservation located in predominantly rural areas are also part of the ruralurban region.” (PLUREL Description of Work 2009, p11). Rural-urban regions are the overall territo-rial unit of analysis for the PLUREL project. They include both the ‘Functional Urban Area’ (zone of daily commuting) and the surrounding rural hin-terland. A technical calculation method for rural-urban regions is shown in table 1 and in figure 4. However, in policy terms, the rural-urban region boundaries are flexible in order to respond to problems and opportunities.
So, in summary: the urban area + peri-urban area = Functional Urban Area.
And also: the urban area + peri-urban area + rural hinterland = rural-urban region.
Figure 2 shows two interpretations of this scheme. The upper sketch is a simple text-book depiction of a monocentric settlement pattern surrounded by nesting circles. The lower sketch is a more realistic version: a polycentric agglomeration of settlements with different sizes and patterns surrounded by a rural hinterland with a complex boundary. In the polycentric version, the peri-urban areas do not only surround the urban, they are also a geographical type and territory unto their own, and the reality on the ground is often complex and fast changing. FUAs overlap and merge to form urban agglomerations, existing settlements change their shape and func-tion, and in larger FUAs, there are many areas with a combination of infrastructure, housing, industry, open space and land in transition – a challenge by any definition.
Another issue is data. Generally we are required to refer to the NUTS system (Nomenclature of Units for Territorial Statistics), which is a geocode standard for subdivisions of countries for statistical purposes of territorial classification across the EU. The NUTS boundaries (e.g. NUTS0 national, NUTS2 region, NUTS3 district) often do not fit with any of the boundary definitions above, which makes research-ing these units even more challenging.
Figure 2: Peri-urban areas & the ‘rural-urban-region’
Geographic concepts & definitions as used in the PLUREL project(a) Mono-centric
settlement pattern (text book version)
(b) Poly-centric settlement pattern (semi-realistic version)
Urban area(continuous & over 20,000 population)
Peri-urban area(discontinuous & over 40 persons / hectare)
City centre Inner urban Suburban
Urban fringeUrban periphery
Rural hinterlandF
F
F
built up area
Functional Urban Area
Rural-urban-region
Multiple combinations of urban & peri-urban areas
Source: UOM, ZALF, MRI
26
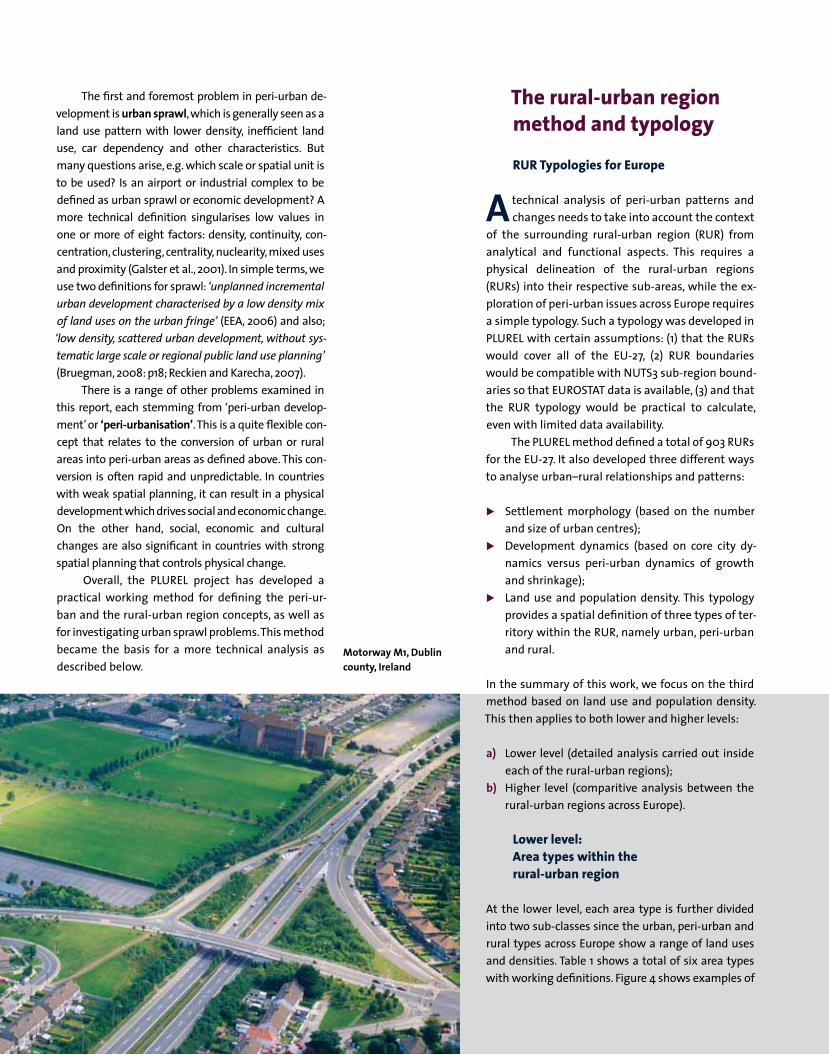
The first and foremost problem in peri-urban de-velopment is urban sprawl, which is generally seen as a land use pattern with lower density, inefficient land use, car dependency and other characteristics. But many questions arise, e.g. which scale or spatial unit is to be used? Is an airport or industrial complex to be defined as urban sprawl or economic development? A more technical definition singularises low values in one or more of eight factors: density, continuity, con-centration, clustering, centrality, nuclearity, mixed uses and proximity (Galster et al., 2001). In simple terms, we use two definitions for sprawl: ‘unplanned incremental urban development characterised by a low density mix of land uses on the urban fringe’ (EEA, 2006) and also; ‘low density, scattered urban development, without systematic large scale or regional public land use planning’ (Bruegman, 2008: p18; Reckien and Karecha, 2007).
There is a range of other problems examined in this report, each stemming from ‘peri-urban develop-ment’ or ‘peri-urbanisation’. This is a quite flexible con-cept that relates to the conversion of urban or rural areas into peri-urban areas as defined above. This con-version is often rapid and unpredictable. In countries with weak spatial planning, it can result in a physical development which drives social and economic change. On the other hand, social, economic and cultural changes are also significant in countries with strong spatial planning that controls physical change.
Overall, the PLUREL project has developed a practical working method for defining the peri-ur-ban and the rural-urban region concepts, as well as for investigating urban sprawl problems. This method became the basis for a more technical analysis as described below.
The rural-urban region method and typology
RUR Typologies for Europe
A technical analysis of peri-urban patterns and changes needs to take into account the context
of the surrounding rural-urban region (RUR) from analytical and functional aspects. This requires a physical delineation of the rural-urban regions (RURs) into their respective sub-areas, while the ex-ploration of peri-urban issues across Europe requires a simple typology. Such a typology was developed in PLUREL with certain assumptions: (1) that the RURs would cover all of the EU-27, (2) RUR boundaries would be compatible with NUTS3 sub-region bound-aries so that EUROSTAT data is available, (3) and that the RUR typology would be practical to calculate, even with limited data availability.
The PLUREL method defined a total of 903 RURs for the EU-27. It also developed three different ways to analyse urban–rural relationships and patterns:
Settlement morphology (based on the number and size of urban centres);
Development dynamics (based on core city dy-namics versus peri-urban dynamics of growth and shrinkage);
Land use and population density. This typology provides a spatial definition of three types of ter-ritory within the RUR, namely urban, peri-urban and rural.
In the summary of this work, we focus on the third method based on land use and population density. This then applies to both lower and higher levels:
a) Lower level (detailed analysis carried out inside each of the rural-urban regions);
b) Higher level (comparitive analysis between the rural-urban regions across Europe).
Lower level: Area types within the rural-urban region
At the lower level, each area type is further divided into two sub-classes since the urban, peri-urban and rural types across Europe show a range of land uses and densities. Table 1 shows a total of six area types with working definitions. Figure 4 shows examples of
Motorway M1, Dublin county, Ireland
27
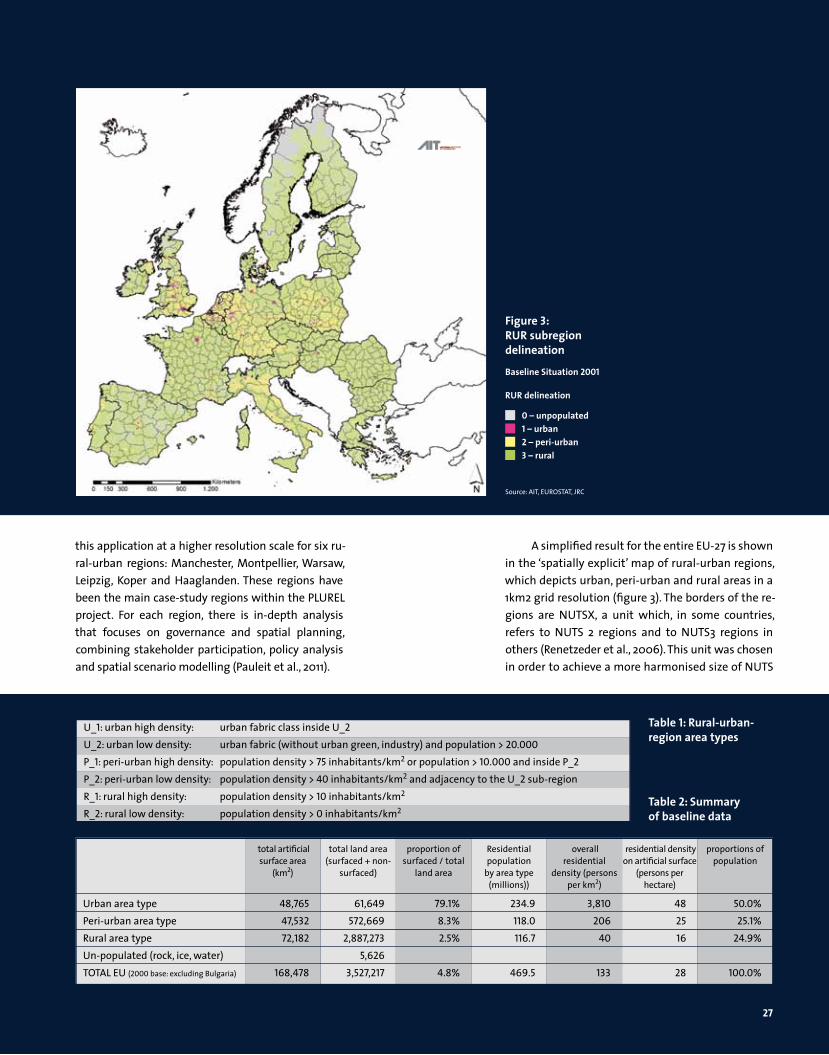
this application at a higher resolution scale for six ru-ral-urban regions: Manchester, Montpellier, Warsaw, Leipzig, Koper and Haaglanden. These regions have been the main case-study regions within the PLUREL project. For each region, there is in-depth analysis that focuses on governance and spatial planning, combining stakeholder participation, policy analysis and spatial scenario modelling (Pauleit et al., 2011).
A simplified result for the entire EU-27 is shown in the ‘spatially explicit’ map of rural-urban regions, which depicts urban, peri-urban and rural areas in a 1km2 grid resolution (figure 3). The borders of the re-gions are NUTSX, a unit which, in some countries, refers to NUTS 2 regions and to NUTS3 regions in others (Renetzeder et al., 2006). This unit was chosen in order to achieve a more harmonised size of NUTS
Urban area type 48,765 61,649 79.1% 234.9 3,810 48 50.0% Peri-urban area type 47,532 572,669 8.3% 118.0 206 25 25.1% Rural area type 72,182 2,887,273 2.5% 116.7 40 16 24.9% Un-populated (rock, ice, water) 5,626 TOTAL EU (2000 base: excluding Bulgaria) 168,478 3,527,217 4.8% 469.5 133 28 100.0%
proportions of population
residential density on artificial surface
(persons per hectare)
overall residential
density (persons per km2)
Residential population
by area type (millions))
proportion of surfaced / total
land area
total land area (surfaced + non-
surfaced)
total artificial surface area
(km2)
Table 1: Rural-urban-region area types
Table 2: Summary of baseline data
U_1: urban high density: urban fabric class inside U_2 U_2: urban low density: urban fabric (without urban green, industry) and population > 20.000 P_1: peri-urban high density: population density > 75 inhabitants/km2 or population > 10.000 and inside P_2 P_2: peri-urban low density: population density > 40 inhabitants/km2 and adjacency to the U_2 sub-region R_1: rural high density: population density > 10 inhabitants/km2
R_2: rural low density: population density > 0 inhabitants/km2
Figure 3: RUR subregion delineation
baseline Situation 2001
RUR delineation
1 – urban2 – peri-urban3 – rural
0 – unpopulated
Source: AIT, EUROSTAT, JRC
28
w
Koper, SI Haaglanden, nL
Manchester, UK
Warszawa, PL Leipzig, De
Montpellier, FR
urban high density urban low density peri-urban high density
peri-urban low density rural high density
rock, glacier, water no data
rural low densitySource: Austrian Institute of Technology, AIT
RUR delineation (6 classes)
Source: Leibniz Centre for Agricultural Landscape Research (ZALF)
NUTSX NUTSX Code Name
NL21 Overijssel 88,51 8,02 NL13 Drenthe 88,37 5,52 NL12 Friesland (NL) 87,30 5,23 DEA3 Muenster 86,09 9,88 NL11 Groningen 85,20 7,08 NL42 Limburg (NL) 83,37 14,50 UKH3 Essex 82,64 10,22 NL41 Noord-Brabant 82,18 13,00 PL211 Krakowsko-tarnowski 78,15 4,45 DEA4 Detmold 78,00 9,67 BE23 Prov. Oost-Vlaanderen 77,67 24,86 UKJ4 Kent 75,11 10,48 UKH2 Bedfordshire, 74,10 13,31 Hertfordshire NL23 Flevoland 73,91 5,53 NL31 Utrecht 72,85 17,01 NL22 Gelderland 72,72 9,21 UKE3 South Yorkshire 71,56 20,96 DEA1 Duesseldorf 70,24 23,74 PL612 Torunsko-wloclawski 69,36 1,83 UKJ1 Berkshire, Bucks 68,05 10,27 and Oxfordshire
Peri-urban Area (RUR2) in %
Table 3: Top 20 peri-urban regions in the eU-27
Artificial Surface CLC in %
Figure 4: RUR delineation in PLUReL case study regions
Share of Peri-Urban Surface per nUTSX regionin % of total area
> 30 – 50> 50 – 70> 70
> 10 – 300 – 10
Figure 5: Hot spots of peri-urbanisation
29
w
regions within Europe. All EU-wide databases and indicators used in PLUREL have been calculated on NUTSX, based on available NUTS2 or NUTS 3 data.
The totals for artificial surfaces, areas, popula-tion and densities in each of the area types of urban, peri-urban and rural are shown in table 2.
Higher level: Comparitive analysis across the EU-27
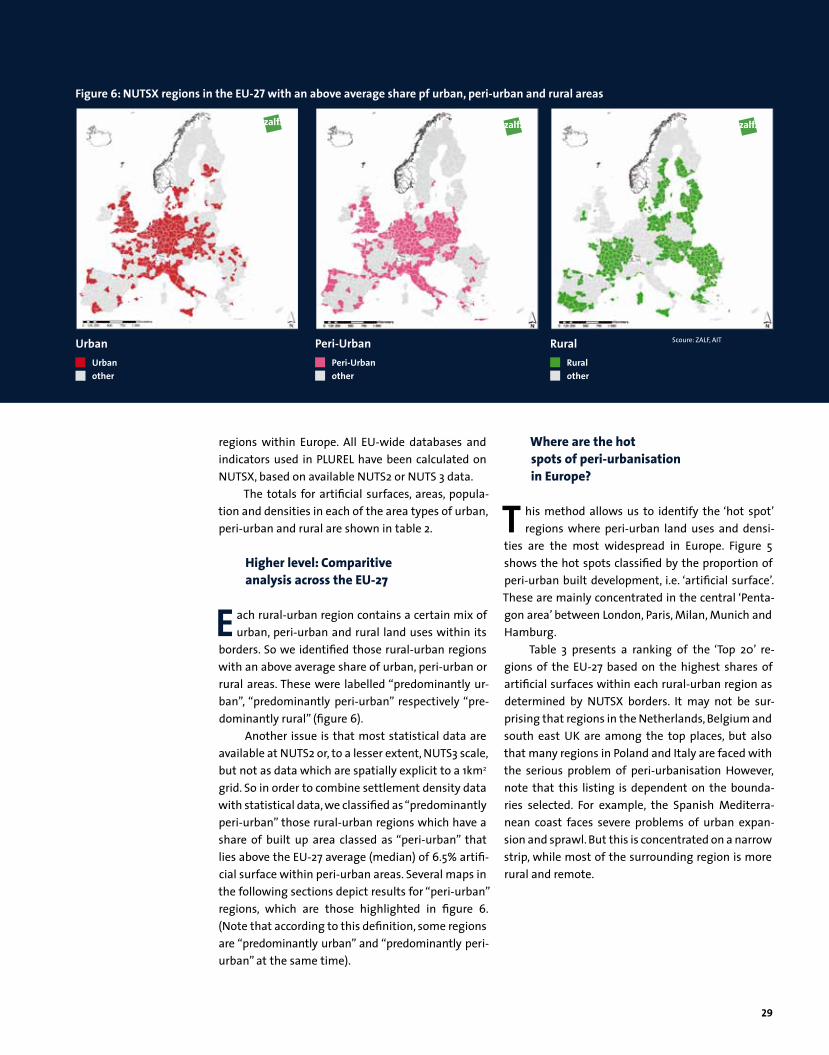
e ach rural-urban region contains a certain mix of urban, peri-urban and rural land uses within its
borders. So we identified those rural-urban regions with an above average share of urban, peri-urban or rural areas. These were labelled “predominantly ur-ban”, “predominantly peri-urban” respectively “pre-dominantly rural” (figure 6).
Another issue is that most statistical data are available at NUTS2 or, to a lesser extent, NUTS3 scale, but not as data which are spatially explicit to a 1km2 grid. So in order to combine settlement density data with statistical data, we classified as “predominantly peri-urban” those rural-urban regions which have a share of built up area classed as “peri-urban” that lies above the EU-27 average (median) of 6.5% artifi-cial surface within peri-urban areas. Several maps in the following sections depict results for “peri-urban” regions, which are those highlighted in figure 6. (Note that according to this definition, some regions are “predominantly urban” and “predominantly peri-urban” at the same time).
Where are the hot spots of peri-urbanisation in Europe?
T his method allows us to identify the ‘hot spot’ regions where peri-urban land uses and densi-
ties are the most widespread in Europe. Figure 5 shows the hot spots classified by the proportion of peri-urban built development, i.e. ‘artificial surface’. These are mainly concentrated in the central ‘Penta-gon area’ between London, Paris, Milan, Munich and Hamburg.
Table 3 presents a ranking of the ‘Top 20’ re-gions of the EU-27 based on the highest shares of artificial surfaces within each rural-urban region as determined by NUTSX borders. It may not be sur-prising that regions in the Netherlands, Belgium and south east UK are among the top places, but also that many regions in Poland and Italy are faced with the serious problem of peri-urbanisation However, note that this listing is dependent on the bounda-ries selected. For example, the Spanish Mediterra-nean coast faces severe problems of urban expan-sion and sprawl. But this is concentrated on a narrow strip, while most of the surrounding region is more rural and remote.
Peri-Urban
otherPeri-Urban
Rural
otherRural
Scoure: ZALF, AITUrban
otherUrban
Figure 6: nUTSX regions in the eU-27 with an above average share pf urban, peri-urban and rural areas
30
The global urban agenda
I n some parts of the world, the peri-urban is a loca-tion for affluence and conspicuous consumption.
In others, it is a fragmented zone of poverty and dis-placement – a kind of front line between the prob-lems of the city and the countryside. Underlying this is the changing nature of the city and urban expan-sion itself. Along with the physical growth of urban form, there is a wider economic, social and cultural dynamic of change via the ‘global urban system’. Looking beyond the conventional divide between ‘ur-ban’ and ‘rural’, the ‘peri-urban’ is the central feature, and this can be both a local, regional and global space. Some see a new kind of ‘edge city’ (Garreau, 1991), and new kinds of metropolitan landscapes or ‘metro-scapes’ (Greater Helsinki Vision, 2007; Kraffczyk, 2004).
Behind the European peri-urban agenda lies the greater global challenge of urbanisation. At present, 3.3 billion people live in urban centres across the globe. By 2030, this number is projected to reach five billion, with 95 percent of this growth in devel-
oping countries (UN Population Fund, 2007). While megacities tend to dominate the development policy agenda, their overall growth may slow down, while smaller cities of less than 500,000 will contain most new urban residents. On current projections, the majority of these will live in slums (Davis, 2005). As such cities modernise their transport networks and extend their zone of influence, they will merge into larger agglomerations with extended peri-urban areas and be organised around interchanges, airports, low density parks and campuses for business, research, shopping and leisure. The effect is a current global rate of doubling of urban built development (counted here as ‘artificial surfaces’) every 15-20 years (Angel et al., 2005).
There is an implication for the European agenda and the PLUREL research, namely that urban areas around the world are now aiming for growth and modernisation – in many cases faster than in Europe. If Europe can demonstrate practical ways of manag-ing growth, avoiding urban sprawl, and encouraging more sustainable urban development, this can then transfer to other parts of the world, with benefits on a global scale.
The dynamics of the peri-urban: Global change and regional response
The peri-urban may be the dominant urban design and plan-ning challenge of the 21st century. It is not only an in-between fringe, but a new and rapidly growing multifunctional terri-tory, often with globalised industries, high mobility and trans-port dependence, fragmented communities and degraded landscapes. In this chapter, we look at the dynamics of growth and change, a range of alternative scenarios for the future and the respective results of the PLUReL scenario modelling.
31
32
Dynamics and driving forces
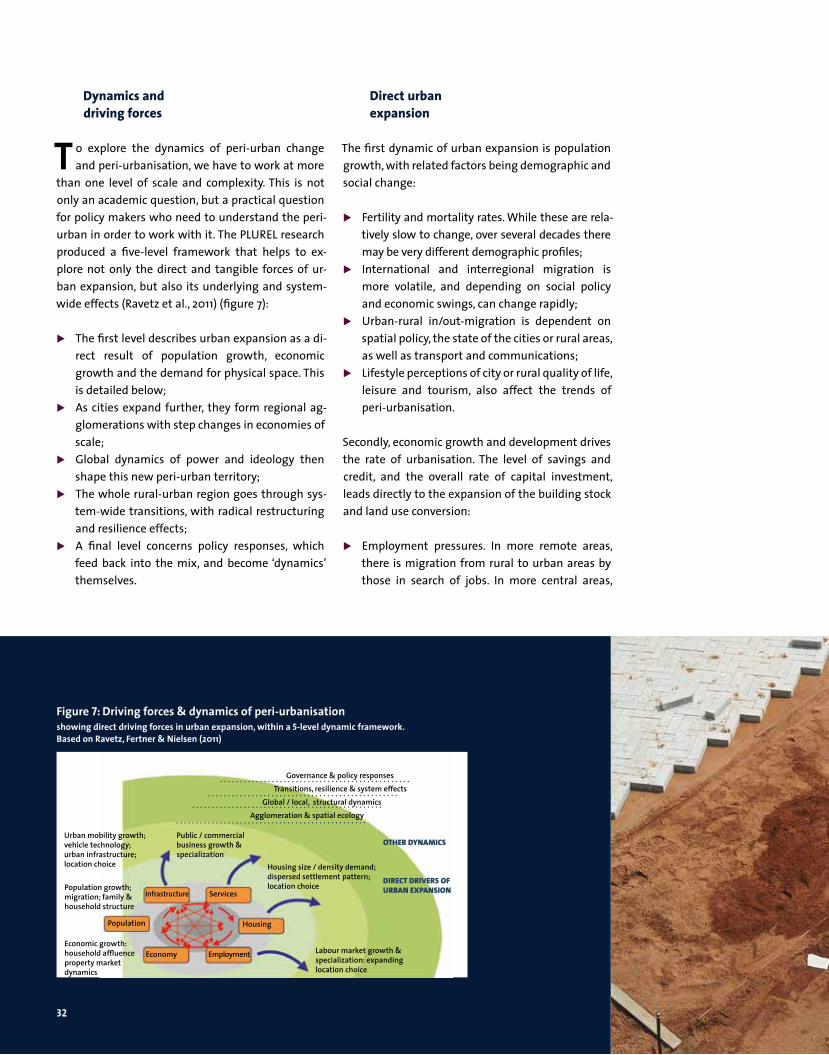
T o explore the dynamics of peri-urban change and peri-urbanisation, we have to work at more
than one level of scale and complexity. This is not only an academic question, but a practical question for policy makers who need to understand the peri-urban in order to work with it. The PLUREL research produced a five-level framework that helps to ex-plore not only the direct and tangible forces of ur-ban expansion, but also its underlying and system-wide effects (Ravetz et al., 2011) (figure 7):
The first level describes urban expansion as a di-rect result of population growth, economic growth and the demand for physical space. This is detailed below;
As cities expand further, they form regional ag-glomerations with step changes in economies of scale;
Global dynamics of power and ideology then shape this new peri-urban territory;
The whole rural-urban region goes through sys-tem-wide transitions, with radical restructuring and resilience effects;
A final level concerns policy responses, which feed back into the mix, and become ‘dynamics’ themselves.
Direct urban expansion
The first dynamic of urban expansion is population growth, with related factors being demographic and social change:
Fertility and mortality rates. While these are rela-tively slow to change, over several decades there may be very different demographic profiles;
International and interregional migration is more volatile, and depending on social policy and economic swings, can change rapidly;
Urban-rural in/out-migration is dependent on spatial policy, the state of the cities or rural areas, as well as transport and communications;
Lifestyle perceptions of city or rural quality of life, leisure and tourism, also affect the trends of peri-urbanisation.
Secondly, economic growth and development drives the rate of urbanisation. The level of savings and credit, and the overall rate of capital investment, leads directly to the expansion of the building stock and land use conversion:
Employment pressures. In more remote areas, there is migration from rural to urban areas by those in search of jobs. In more central areas,
Infrastructure Services
Housing
EmploymentEconomy
Population
Population growth; migration; family & household structure
Urban mobility growth; vehicle technology; urban infrastructure; location choice
Public / commercial business growth & specialization
Housing size / density demand; dispersed settlement pattern; location choice
Labour market growth & specialization: expanding location choice
Economic growth: household affluence property market dynamics
Governance & policy responses Transitions, resilience & system effects Global / local, structural dynamicsAgglomeration & spatial ecology
OTHER DYNAMICS
DIRECT DRIVERS OF URBAN EXPANSION
Figure 7: Driving forces & dynamics of peri-urbanisationshowing direct driving forces in urban expansion, within a 5-level dynamic framework. based on Ravetz, Fertner & nielsen (2011)
33
larger and more specialised labour markets are enabled by peri-urban development and road-based mobility;
Employment and occupation patterns also affect the trends of peri-urbanisation. For example, the spread of teleworking in the service industries can encourage out-migration to peri-urban or rural areas;
Business technology will affect not only employ-ment, but also supply chain logistics, as well as the distribution of production, services and con-sumption;
Peri-urban development is shaped by the prop-erty market. High value housing will tend to be located in high quality environments and segre-gated from other social groups. Meanwhile, there emerges many peri-urban social housing estates with multiple problems.
Environmental dynamics are varied, but it seems that climate change effects will dominate peri-urban development for the foreseeable future:
Climate change impacts include sea-level rise and fluvial flooding, extreme storms and heat waves, soil erosion and habitat change;
As a result of climate change, urban environ-ments are likely to become more unpleasant and hazardous, which then encourages further out-migration to more liveable peri-urban areas;
Water resource issues will meanwhile put pres-sure on peri-urban development, particularly in arid climates and/or areas vulnerable to flood-ing;
Renewable energy sources such as biomass are often sited in peri-urban areas, and may start to influence the pattern of development;
Urban infrastructure such as waste and sewage treatment is usually in peri-urban locations. However, new concepts in recycling and ‘zero-waste’ may change this.
The urban development regime, housing markets and investment cycles, housing design and layout are all linked to the growth and pattern of peri-ur-ban development:
Transport and communications are central to the peri-urban agenda. Access to networks or in-frastructure can enable and encourage in/out-migration, counter-urbanisation, or re-urbanisa-tion;
Spatial planning policy may aim to manage or contain growth in larger cities, smaller cities and towns, or smaller rural settlements, or allow a free market;
Behind formal spatial planning policy is a less vis-ible ‘regime effect’ from the system of property rights, land markets, patrimony and inheritance.
Rural development and landscape quality have tra-ditionally been on the receiving end of urban expan-sion. This may be changing however, with environ-mental effects on property values, new rural economies and new urban systems for food and other resources. The dynamics of change are there-fore complex:
Agriculture, particularly driven by the CAP re-forms relating to intensive or extensive produc-tion, is a major influence on land use change;
Biodiversity and habitat protection is a direct policy choice that may aim to take parts of the peri-urban area out of urban development;
Rural economic development trends are also very sensitive to growth pressures and policy agendas, as detailed in the next section.
Agglomeration effects
T he urban expansion scheme outlined above is not a one-way process: it also generates responses
and changes in the surrounding areas that start to amount to a ‘regional agglomeration’ effect. This is where the focus of attention shifts from a free-stand-ing city in rural surroundings towards the wider com-munity of interconnected and multilayered settle-ment forms. The result is that, for the majority of residents, previously separate peri-urban areas de-velop into continuously functional, but low density, cities for most forms of living, working and shopping. The process is described by Soja (2000): restructuring of the urban economic base; formation of a global ur-ban system; restructuring of urban form and land use; restructuring of the urban social pattern; formation of the ‘carceral’ city and an ‘archipelago’ of enclaves; and finally, new types of urban images and cultures that are powerful dynamics in their own right.
In practical terms, there are strong incentives for peri-urban locations for retail markets, labour markets or logistics hubs. A firm looking for a large new site will often prefer a peri-urban location which is accessible (generally by road) and serves a larger population from several urban areas.
Soil sealing is expected to increase nearly four times faster in peri-urban areas than in urban areas
34
Structural dynamics and transitions
o ne way to explore the underlying dynamics of power and ideology is through ‘critical perspec-
tives’ (Roberts et al., 2009). They are critical in the sense that existing structures of power, wealth and ideology are not assumed as inevitable and fixed. One perspective starts with globalisation and the economic effects on the structure of business and fi-nance, political effects of which social groups are in favour, and cultural effects through media and ICT (‘information and communications technology’). A counterpart force can be seen as ‘localisation’, where the cultural identities of local people and places can emerge and be reconstructed in new ways. Many peri-urban areas are stark demonstrations of this. There is a liberalisation agenda, re-shaping the state-market balance, which involves privatisation, fran-chising, and cost recovery, with powerful effects on urban governance and public services. Meanwhile the consumption culture is a driver of cultural identity, with new perceptions of peri-urban environments through leisure, tourism and locational decisions. These combine in many ways. For instance, in the ‘post-metropolis’ concept of Edward Soja (2000), the ‘space of flows’ from Manuel Castells (1996), the ‘risk society’ concept of Ulrich Beck (1995) and the ‘cos-mopolis’ of Leonie Sandercock (2003).
A structural approach looks beyond the physi-cal land use processes at the underlying dynamics of power, wealth and ideology. Here we can see the
peri-urban as a relationship of dependency and colo-nisation, and as a new kind of urban hinterland and service zone. There is also a powerful discourse on the peri-urban as a kind of frontier for enterprise that is shared by the science park developers and financiers, with images of green field sites, fast air-port connections, and generally a ‘cultural-cogni-tive-capitalist’ creative zone (Scott, 2000). There is also a peri-urban of resistance, which is the home of illegitimate, informal, grey or black economies – farmers who deal in scrap lorries or youths looking for a festival location (Shoard, 1983).
All this raises very topical questions for this re-port – for whom or what is the peri-urban land-scape? Who should decide, and who receives the costs or benefits?
Large parts of the peri-urban area are no longer competitive in agricultural use, and there are many other possibilities which require a policy decision, such as nature conservation, housing, infrastructure, enterprise or new forms of cultivation for urban food or energy (Ravetz, 2011). Increasingly, peri-urban areas are privately owned by ‘high net worth’ indi-viduals, even while there are increasing pressures for public access. Overall, there are many agendas – eco-nomic, ecological, historical, residential and func-tional – which can be in competition or conflict.
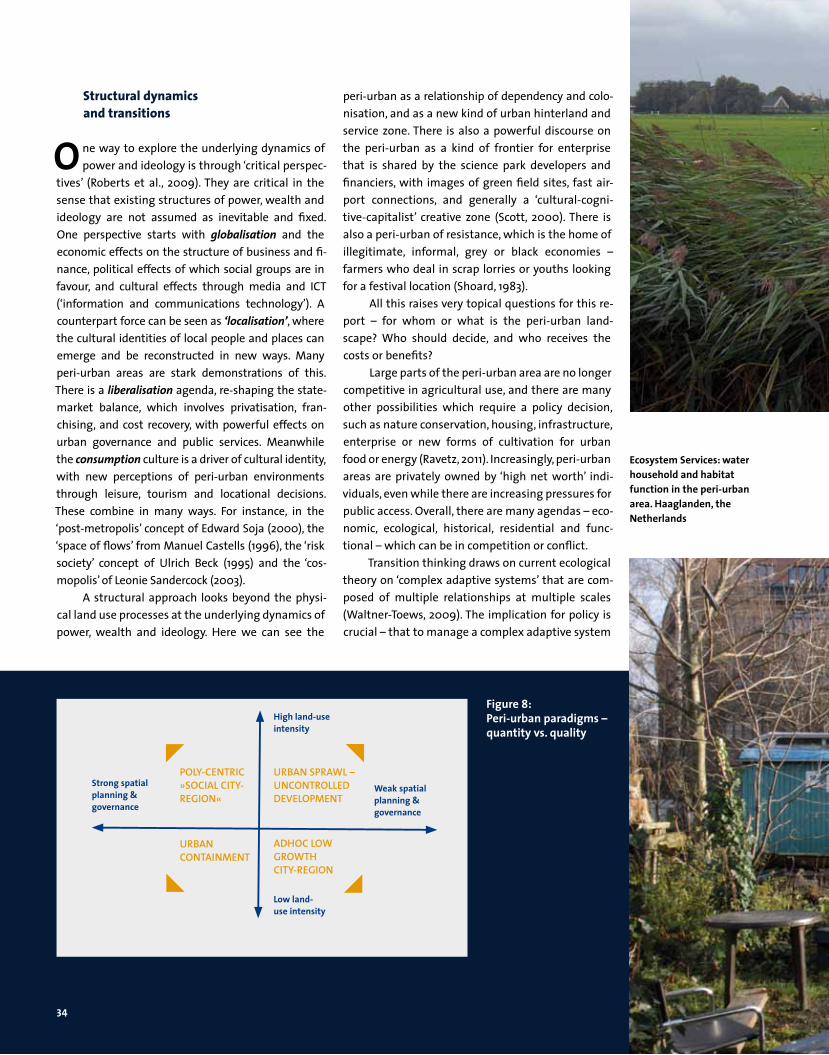
Transition thinking draws on current ecological theory on ‘complex adaptive systems’ that are com-posed of multiple relationships at multiple scales (Waltner-Toews, 2009). The implication for policy is crucial – that to manage a complex adaptive system
POLY-CENTRIC »SOCIAL CITY-REGION«
URBAN SPRAWL – UNCONTROLLED DEVELOPMENT
ADHOC LOW GROWTH CITY-REGION
URBAN CONTAINMENT
Weak spatial planning & governance
Low land-use intensity
High land-use intensity
Strong spatial planning & governance
Figure 8: Peri-urban paradigms – quantity vs. quality
ecosystem Services: water household and habitat function in the peri-urban area. Haaglanden, the netherlands
35
is a different task to managing linear systems, and that governance itself needs to evolve along with its territory. However, there is also a ‘de-territorialisa-tion’ effect, where the urban social-economic order is ‘splintering’ into globalised networks and discon-nected from the local (Graham and Marvin, 2001). This is seen clearly in some peri-urban areas that lack the traditional patterns of settlement hubs and meeting points, and instead form a diffused net-work of ‘spaces of flows’ with ‘landscapes of power’ that are shaped by global images and consumption aspirations (Zukin, 1998).
Governance and policy responses
T he final level in this framework looks at govern-ance, spatial planning and the policy system it-
self. This is both a response to problems, and also a dynamic in itself. For instance, the Green Belt policy in the UK is at least partly successful in its objective of urban containment, but it then shapes the land and property market and generates other problems such as dis-investment and land hoarding, which are then the objective of further policies, and so on.
Firstly, there are questions on the overall scope and effects of ‘spatial governance’ – the system of territorial government, spatial planning and the poli- cy system (figure 8). The portion on the left shows the main factors in direct urban expansion, with al-ternative modes of spatial governance:
High or low land use intensity, e.g. the amount of area demanded for each unit of housing or business. This factor could be further analysed in terms of economic intensity, value or production, or social intensity in terms of welfare measures. Environmental land use intensity is also relevant, where the urban system demands land for eco-system services, material supplies, waste man-agement, leisure and amenity. The land use in-tensities are normally assumed as on a growth trajectory that is similar to that of economic GDP. In the scenario modelling (next section), land use intensity is assumed to be correlated with economic growth and capital investment;
Strong or weak spatial governance. This ranges from active and coordinated spatial planning and governance in the public interest to ad hoc and fragmented governance for short term en-terprise and private profit.
The many issues in governance and spatial planning are covered in later chapters. Here, the point is that these can be dynamics in their own right. This is clear, with the overall policy agenda to redirect the process of urban development and ‘peri-urbanisa-tion’ away from sprawl towards polycentric develop-ment in a ‘social city region’ (Howard, 1898; Ravetz, 2000). This involves looking at both quantity (land use intensity) and quality (coordination of land use patterns), not only in the peri-urban, but across the whole rural-urban region.
Coexistence: Alternative trailer commune next to town house. berlin, germany, 2010
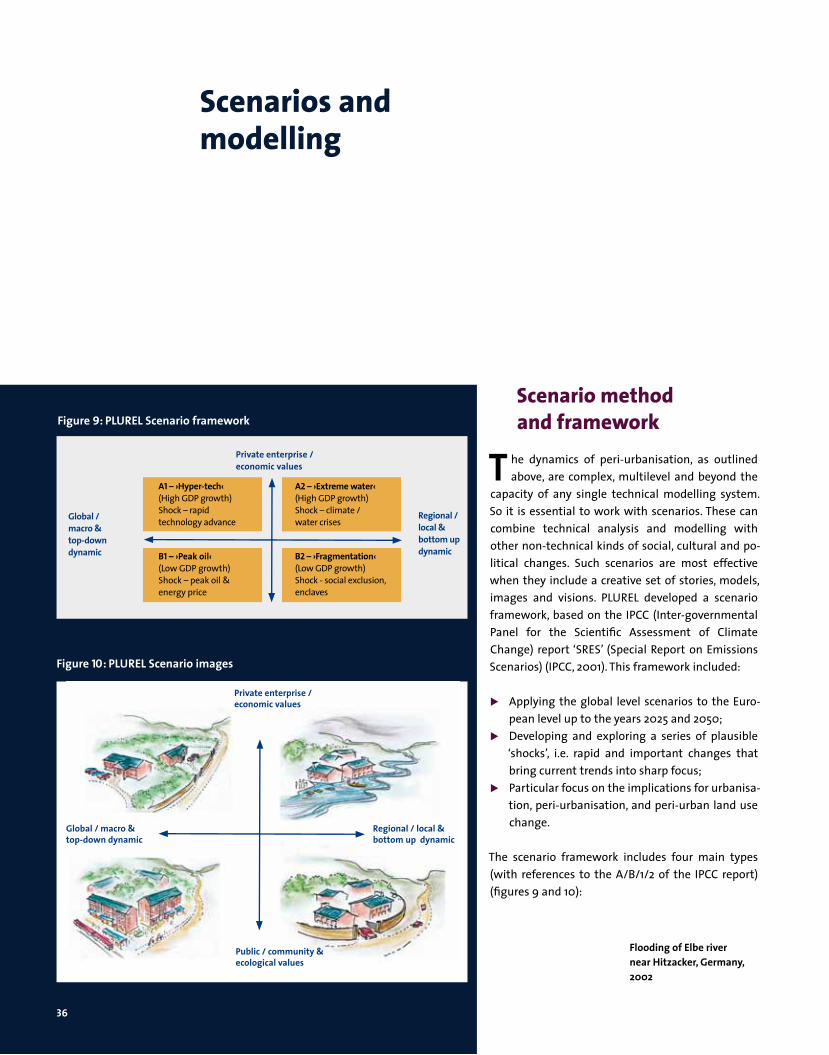
Scenario method and framework
T he dynamics of peri-urbanisation, as outlined above, are complex, multilevel and beyond the
capacity of any single technical modelling system. So it is essential to work with scenarios. These can combine technical analysis and modelling with other non-technical kinds of social, cultural and po-litical changes. Such scenarios are most effective when they include a creative set of stories, models, images and visions. PLUREL developed a scenario framework, based on the IPCC (Inter-governmental Panel for the Scientific Assessment of Climate Change) report ‘SRES’ (Special Report on Emissions Scenarios) (IPCC, 2001). This framework included:
Applying the global level scenarios to the Euro-pean level up to the years 2025 and 2050;
Developing and exploring a series of plausible ‘shocks’, i.e. rapid and important changes that bring current trends into sharp focus;
Particular focus on the implications for urbanisa-tion, peri-urbanisation, and peri-urban land use change.
The scenario framework includes four main types (with references to the A/B/1/2 of the IPCC report) (figures 9 and 10):
Scenarios and modelling
Flooding of elbe river near Hitzacker, germany, 2002
Private enterprise / economic values
Public / community & ecological values
global / macro & top-down dynamic
Regional / local & bottom up dynamic
Figure 10: PLUReL Scenario images
Figure 9: PLUReL Scenario framework
b2 – ›Fragmentation‹ (Low GDP growth) Shock - social exclusion, enclaves
global /macro & top-down dynamic
Regional / local & bottom updynamic
Private enterprise / economic values
A1 – ›Hyper-tech‹(High GDP growth) Shock – rapid technology advance
A2 – ›extreme water‹(High GDP growth) Shock – climate / water crises
b1 – ›Peak oil‹(Low GDP growth) Shock – peak oil & energy price
36

37
A1 – high growth scenario (‘Hypertech’)
... a future world of rapid economic growth, global population that peaks midcentury, and the rapid spread of more efficient technologies. Investment in research and development is high, and nations share knowledge and pool resources in a global market place. Energy prices decline as supply is driven by new renewable and nuclear energy sources. The ‘shock’ concerns the rapid acceleration of ICT, which transforms home and work. The effect on the periurban is to accelerate outmigration and counterurbanisation, so that large areas become ‘periurban/perirural’. These see extended networks of settlements, serving affluent knowledge workers in flexible employment with digital connections to the global urban system.
A2 – climate change scenario (‘Extreme water’)
… a more heterogeneous world of selfreliance and local identity. While the population increases, economic development is regionallyoriented: economic growth and technological change are slow and fragmented. The ‘shock’ here is subtitled ‘Extreme water’, and this sees the rapid onset of climate change effects – flooding, drought, storm and a sealevel increase. The effect in the typical periurban area is constrained development, uneven growth and uncoordinated sprawl without the affluence to compensate.
B1 – energy crisis scenario (‘Peak oil’)
… a future of environmental and social awareness – a global approach to sustainable development, involving governments, businesses and households. Economic development is more balanced, with investment in resource efficiency, social equity and environmental protection. Population levels are relatively stable. The ‘shock’ in this scenario is driven by the early arrival of ‘Peak oil’, i.e. a decline in global oil production and rapid rises in energy prices, with many social and economic effects. The periurban agenda here is dominated by the rising costs of carbased settlement patterns. There is a return to cities and consolidation of rural towns. Many periurban areas are depopulated and returned to lowenergy farming.
B2 – social fragmentation scenario (‘Walls and enclaves’)
... Europe sees a fragmentation of society in terms of age, ethnicity and international distrust. The elderly are increasingly dependent on the younger generation, migrant workers undercut each other, and there are intergenerational and interethnic conflicts. The ‘shock’ then accelerates this process of fragmentation and segregation of different communities. Cities become more dispersed as younger migrants dominate city centres, and older natives populate the outskirts and enclaves outside the cities so that the periurban becomes more like ‘perisociety’.

38
These scenarios were used at the EU level to model the effects on land use of economic growth and development combined with demo-graphic change. Details of the modelling method are described in the Annex. The scenarios were also used in regional case studies together with stakeholder input on social and cultural trends, as well as their implications for governance.
European-wide scenario projections
T here is a gap between population growth and the growth of artificial surface within
Europe. In the post-war period, European cities have grown between 40% and 300% in size but considerably less in population (EEA, 2006). Ac-cording to all four scenarios, this gap will grow further in the coming years, meaning increasing per capita land consumption.
Besides this, the scenarios show some differ-ences in possible future development. Economic development is 50% higher in the scenario A1 than in B2. Similar growth rates are seen with the increase of artificial surface within Europe. On the other hand, population development is similar in all scenarios, changing only by a very low annual increase (figure 11). As in the previous chapter, the PLUREL method analysed the whole EU territory by urban, peri-urban and rural area types. Table 5 illustrates the key results of the typology and sce-nario modelling exercise.
All four scenarios show a continued growth of built development, i.e. ‘artificial surface’, across Europe (Figure 12). Peri-urban areas will experi-ence the highest growth rates of up to 2.46% per year, while growth in rural areas will be nearly as rapid in the A1 – Hypertech scenario. In contrast, areas which are already predominantly urban will experience relatively small changes, indicating that these areas are relatively ‘full up’. The pro-jected population growth is much more gradual at a maximum of 0.18% in the peri-urban areas. However, there is much variation across Europe, as illustrated in the figures 13 and 14. There are large contrasts projected between the central ar-eas of the ‘Pentagon’, the Mediterranean coast and central eastern Europe. Higher growth is pre-dicted for some of the more remote areas in northern and western Europe, but from a base-line that is sparsely populated and developed. Meanwhile, some more remote areas in eastern Europe may continue to depopulate.
Table 4: Annual growth rates 1990-2000 and scenario projections
Projected annual increase by scenario in %
A1 A2 B1 B2 Population * 0.16 0.14 0.13 0.15 GDP/capita ** 2.22 1.92 1.53 1.43 Artificial surface *** 1.86 1.55 1.10 1.09
* 2000-2025, EU -27 without Bulgaria: Source AIT** Data for 2005-2025. Prices 2000. Bulgaria not included in scenario data*** Data for 2000-2025
Table 5: Projected growth of artificial surface in urban, peri-urban and rural areas
Sub-region Artificial surface area in 2000 Annual increase until 2025 by scenario (with share of total area) A1 A2 B1 B2
48,765 km2
Urban (79.1 %) 0.65% 0.61% 0.50% 0.48%
47,532 km2
Peri-Urban (8.3 %) 2.46% 2.06% 1.44% 1.44%
72,182 km2
Rural (2.5 %) 2.13% 1.75% 1.24% 1.24%
168,478 km2
Total (4.7 %) 1.86% 1.55% 1.10% 1.09%
Table 6: Projected growth of population in urban, peri-urban and rural areas
Resident population Sub-region in 2000 (millions) Annual increase until 2025 by scenario (with share of total) A1 A2 B1 B2 234.85 Urban (50.1%) 0,17% 0,15% 0,12% 0,17%
117.95 Peri-Urban (25.1%) 0,18% 0,15% 0,13% 0,16%
116.67 Rural (24.9%) 0,11% 0,08% 0,14% 0,10%
Total 469.47 0.16% 0.14% 0.13% 0.15%
Comparison of scenario average for population, GDP and built development
0
50
100
150
200
250
1990 1995 2000 2005 2010 2015 2020 2025
1990
= 1
00
population
GDP
artificialsurface
250
1190 1195 2000 2005 2010 2015 2020 2025
200
150
100
50
0
population gDP artificial surface
Figure 11: Comparison of scenario average for population, gDP and built development
1990
= 10
0
Souce: (Tables 4-6, figures 11, 12): IIASA, ERASME, University of Edinburgh, Austrian Institute of Technology
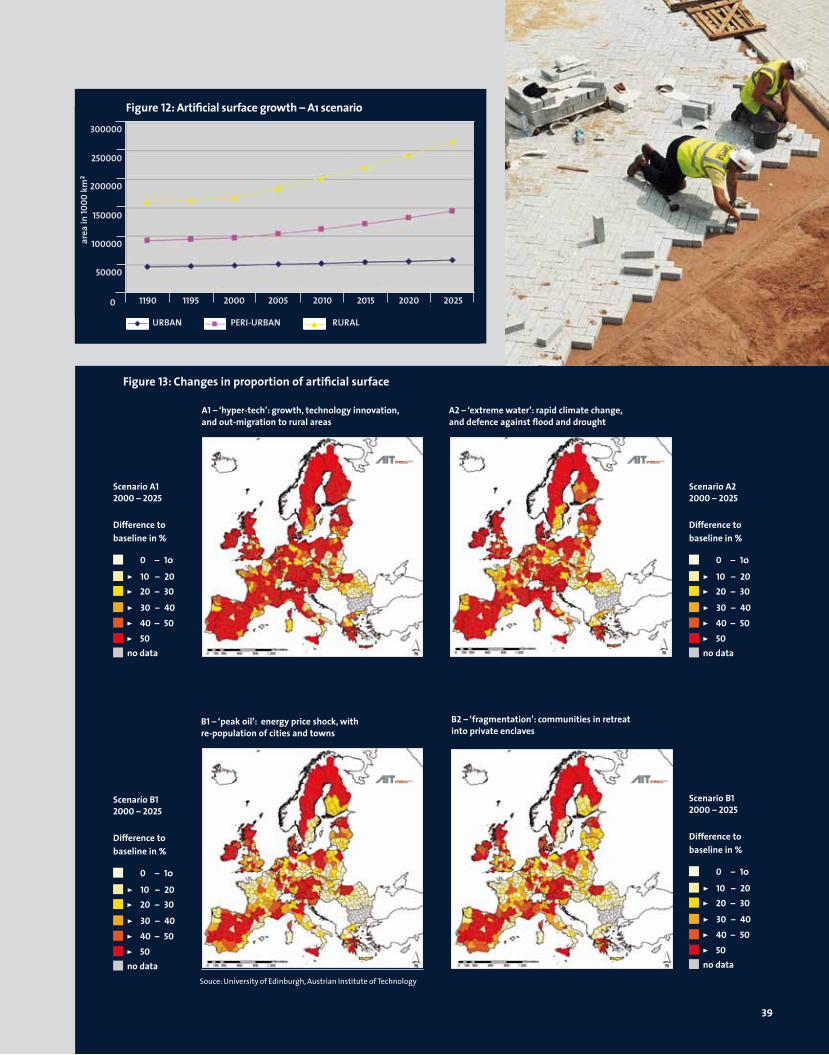
39
300000
1190 1195 2000 2005 2010 2015 2020 2025
250000
200000
150000
100000
50000
0
URbAn PeRI-URbAn RURAL
Figure 12: Artificial surface growth – A1 scenario
area
in 10
00 k
m2
A1 – ‘hyper-tech’: growth, technology innovation, and out-migration to rural areas
A2 – ‘extreme water’: rapid climate change,and defence against flood and drought
b1 – ‘peak oil’: energy price shock, with re-population of cities and towns
b2 – ‘fragmentation’: communities in retreat into private enclaves
Scenario A1 2000 – 2025
Difference to baseline in %
0 – 1o
> 10 – 20> 20 – 30
> 30 – 40> 40 – 50> 50 no data
Scenario b1 2000 – 2025
Difference to baseline in %
0 – 1o
> 10 – 20> 20 – 30
> 30 – 40> 40 – 50> 50 no data
Scenario b1 2000 – 2025
Difference to baseline in %
0 – 1o
> 10 – 20> 20 – 30
> 30 – 40> 40 – 50> 50 no data
Scenario A2 2000 – 2025
Difference to baseline in %
0 – 1o
> 10 – 20> 20 – 30
> 30 – 40> 40 – 50> 50 no data
Souce: University of Edinburgh, Austrian Institute of Technology
Figure 13: Changes in proportion of artificial surface
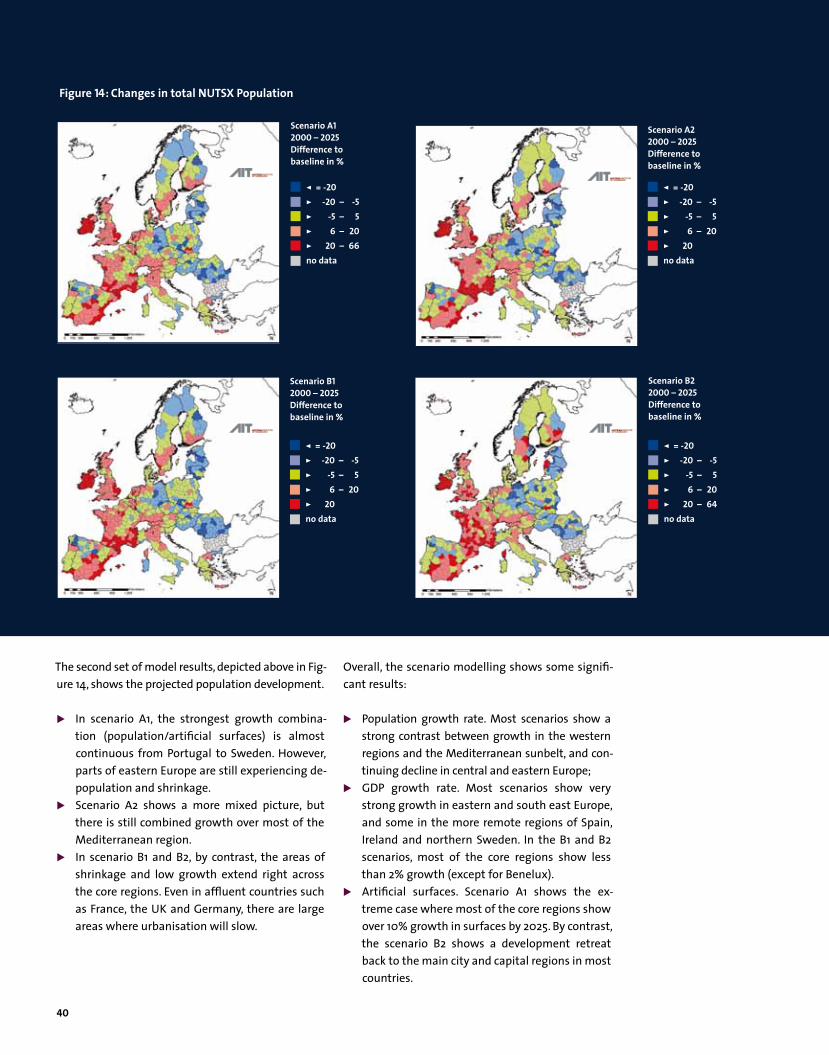
40
Figure 14: Changes in total nUTSX Population
Scenario A12000 – 2025Difference to baseline in %
< = -20> -20 – -5> -5 – 5> 6 – 20> 20 – 66no data
Scenario A22000 – 2025Difference to baseline in %
< = -20> -20 – -5> -5 – 5> 6 – 20> 20 no data
Scenario b12000 – 2025Difference to baseline in %
< = -20> -20 – -5> -5 – 5> 6 – 20> 20 no data
Scenario b22000 – 2025Difference to baseline in %
< = -20> -20 – -5> -5 – 5> 6 – 20> 20 – 64no data
The second set of model results, depicted above in Fig-ure 14, shows the projected population development.
In scenario A1, the strongest growth combina-tion (population/artificial surfaces) is almost continuous from Portugal to Sweden. However, parts of eastern Europe are still experiencing de-population and shrinkage.
Scenario A2 shows a more mixed picture, but there is still combined growth over most of the Mediterranean region.
In scenario B1 and B2, by contrast, the areas of shrinkage and low growth extend right across the core regions. Even in affluent countries such as France, the UK and Germany, there are large areas where urbanisation will slow.
Overall, the scenario modelling shows some signifi-cant results:
Population growth rate. Most scenarios show a strong contrast between growth in the western regions and the Mediterranean sunbelt, and con-tinuing decline in central and eastern Europe;
GDP growth rate. Most scenarios show very strong growth in eastern and south east Europe, and some in the more remote regions of Spain, Ireland and northern Sweden. In the B1 and B2 scenarios, most of the core regions show less than 2% growth (except for Benelux).
Artificial surfaces. Scenario A1 shows the ex-treme case where most of the core regions show over 10% growth in surfaces by 2025. By contrast, the scenario B2 shows a development retreat back to the main city and capital regions in most countries.
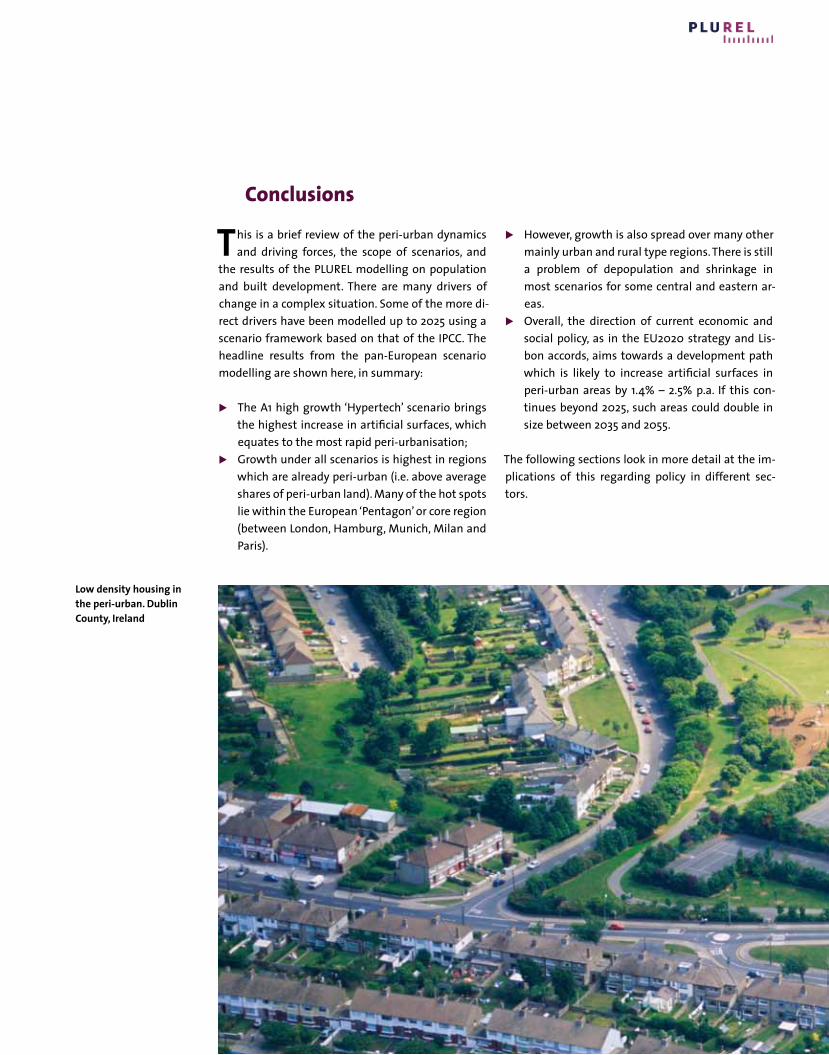
41
T his is a brief review of the peri-urban dynamics and driving forces, the scope of scenarios, and
the results of the PLUREL modelling on population and built development. There are many drivers of change in a complex situation. Some of the more di-rect drivers have been modelled up to 2025 using a scenario framework based on that of the IPCC. The headline results from the pan-European scenario modelling are shown here, in summary:
The A1 high growth ‘Hypertech’ scenario brings the highest increase in artificial surfaces, which equates to the most rapid peri-urbanisation;
Growth under all scenarios is highest in regions which are already peri-urban (i.e. above average shares of peri-urban land). Many of the hot spots lie within the European ‘Pentagon’ or core region (between London, Hamburg, Munich, Milan and Paris).
Conclusions
However, growth is also spread over many other mainly urban and rural type regions. There is still a problem of depopulation and shrinkage in most scenarios for some central and eastern ar-eas.
Overall, the direction of current economic and social policy, as in the EU2020 strategy and Lis-bon accords, aims towards a development path which is likely to increase artificial surfaces in peri-urban areas by 1.4% – 2.5% p.a. If this con-tinues beyond 2025, such areas could double in size between 2035 and 2055.
The following sections look in more detail at the im-plications of this regarding policy in different sec-tors.
Low density housing in the peri-urban. Dublin County, Ireland

42
43
PERI-URBAN AGENDAS
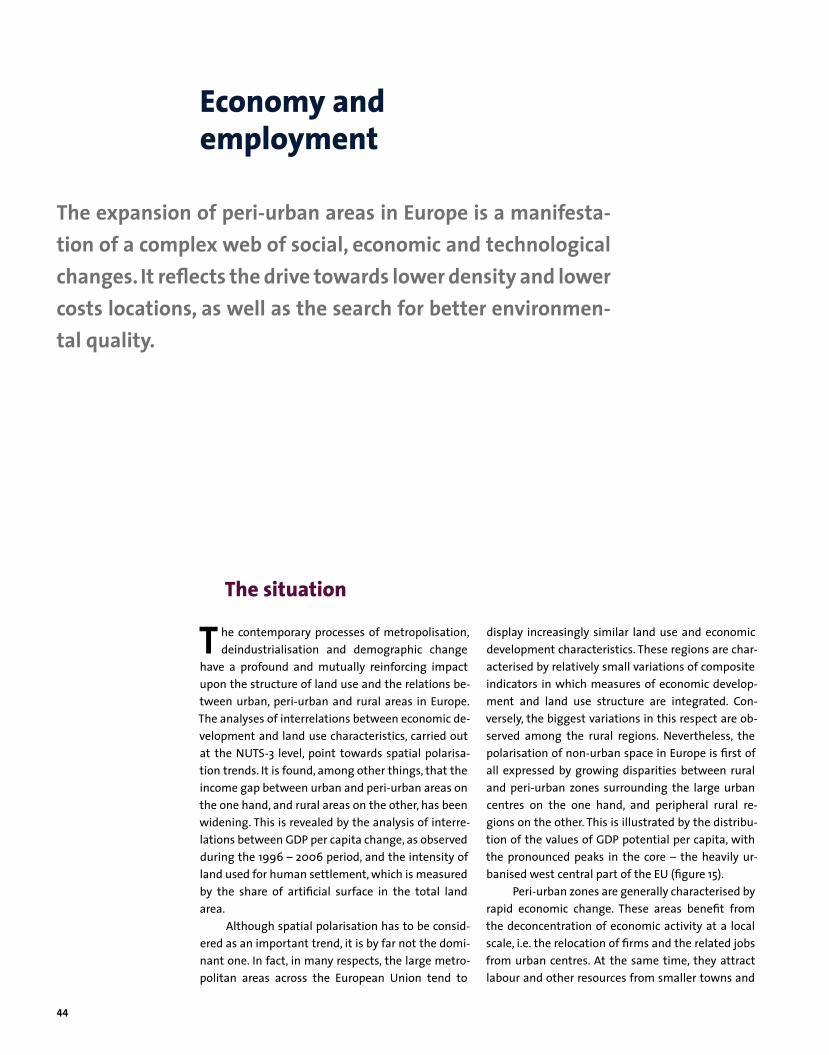
44
The situation
T he contemporary processes of metropolisation, deindustrialisation and demographic change
have a profound and mutually reinforcing impact upon the structure of land use and the relations be-tween urban, peri-urban and rural areas in Europe. The analyses of interrelations between economic de-velopment and land use characteristics, carried out at the NUTS-3 level, point towards spatial polarisa-tion trends. It is found, among other things, that the income gap between urban and peri-urban areas on the one hand, and rural areas on the other, has been widening. This is revealed by the analysis of interre-lations between GDP per capita change, as observed during the 1996 – 2006 period, and the intensity of land used for human settlement, which is measured by the share of artificial surface in the total land area.
Although spatial polarisation has to be consid-ered as an important trend, it is by far not the domi-nant one. In fact, in many respects, the large metro-politan areas across the European Union tend to
display increasingly similar land use and economic development characteristics. These regions are char-acterised by relatively small variations of composite indicators in which measures of economic develop-ment and land use structure are integrated. Con-versely, the biggest variations in this respect are ob-served among the rural regions. Nevertheless, the polarisation of non-urban space in Europe is first of all expressed by growing disparities between rural and peri-urban zones surrounding the large urban centres on the one hand, and peripheral rural re-gions on the other. This is illustrated by the distribu-tion of the values of GDP potential per capita, with the pronounced peaks in the core – the heavily ur-banised west central part of the EU (figure 15).
Peri-urban zones are generally characterised by rapid economic change. These areas benefit from the deconcentration of economic activity at a local scale, i.e. the relocation of firms and the related jobs from urban centres. At the same time, they attract labour and other resources from smaller towns and
Economy and employment
The expansion of peri-urban areas in Europe is a manifesta-tion of a complex web of social, economic and technological changes. It reflects the drive towards lower density and lower costs locations, as well as the search for better environmen-tal quality.
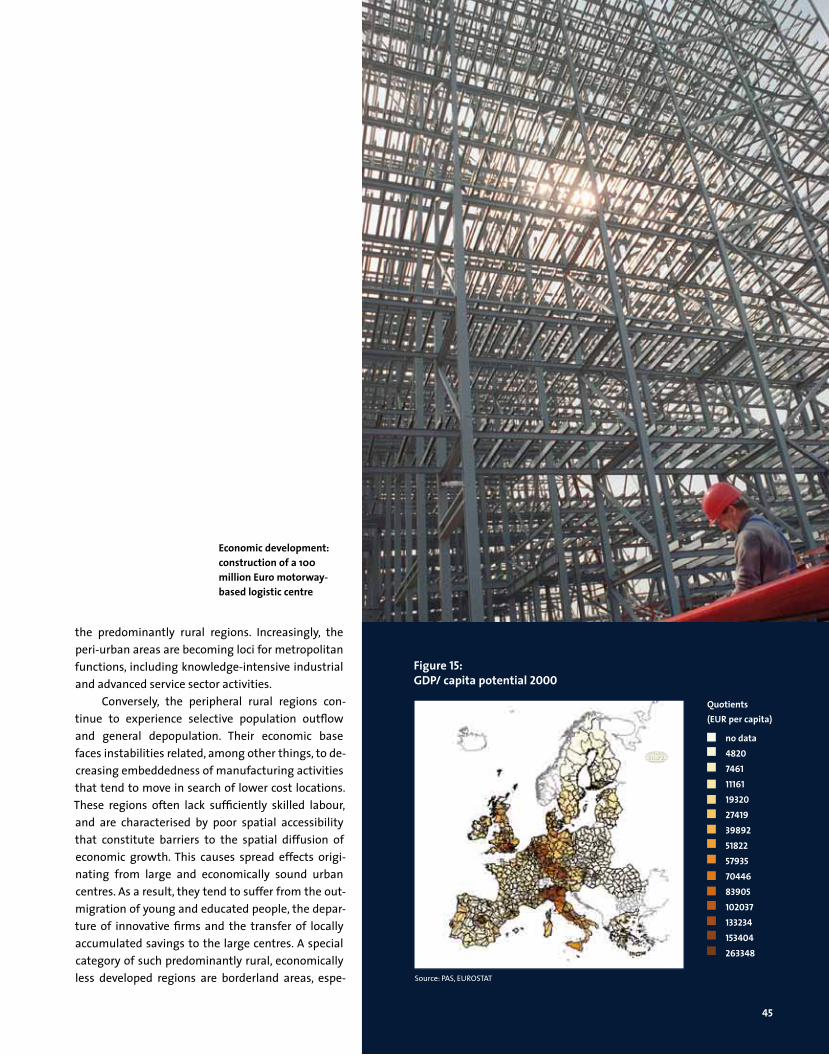
45
the predominantly rural regions. Increasingly, the peri-urban areas are becoming loci for metropolitan functions, including knowledge-intensive industrial and advanced service sector activities.
Conversely, the peripheral rural regions con-tinue to experience selective population outflow and general depopulation. Their economic base faces instabilities related, among other things, to de-creasing embeddedness of manufacturing activities that tend to move in search of lower cost locations. These regions often lack sufficiently skilled labour, and are characterised by poor spatial accessibility that constitute barriers to the spatial diffusion of economic growth. This causes spread effects origi-nating from large and economically sound urban centres. As a result, they tend to suffer from the out-migration of young and educated people, the depar-ture of innovative firms and the transfer of locally accumulated savings to the large centres. A special category of such predominantly rural, economically less developed regions are borderland areas, espe-
Figure 15:GDP/ capita potential 2000
no data482074611116119320274193989251822579357044683905102037133234153404263348
Quotients (EUR per capita)
Source: PAS, EUROSTAT
Economic development: construction of a 100 million Euro motorway-based logistic centre
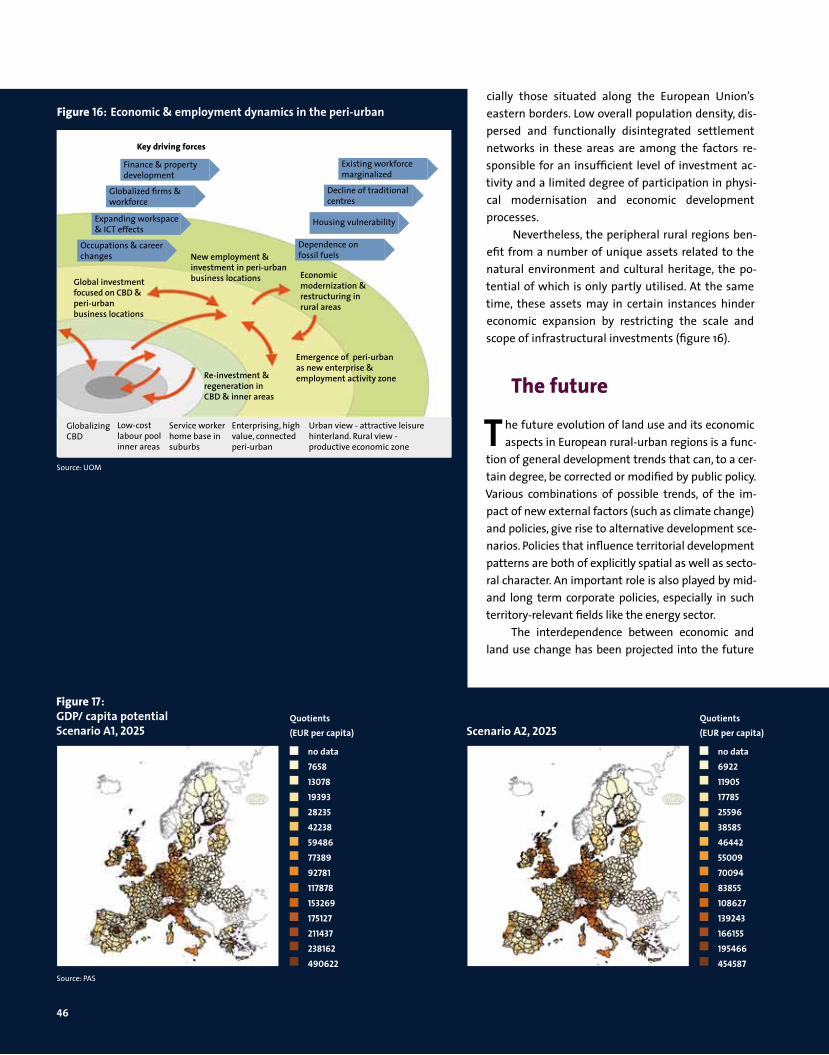
46
cially those situated along the European Union’s eastern borders. Low overall population density, dis-persed and functionally disintegrated settlement networks in these areas are among the factors re-sponsible for an insufficient level of investment ac-tivity and a limited degree of participation in physi-cal modernisation and economic development processes.
Nevertheless, the peripheral rural regions ben-efit from a number of unique assets related to the natural environment and cultural heritage, the po-tential of which is only partly utilised. At the same time, these assets may in certain instances hinder economic expansion by restricting the scale and scope of infrastructural investments (figure 16).
The future
T he future evolution of land use and its economic aspects in European rural-urban regions is a func-
tion of general development trends that can, to a cer-tain degree, be corrected or modified by public policy. Various combinations of possible trends, of the im-pact of new external factors (such as climate change) and policies, give rise to alternative development sce-narios. Policies that influence territorial development patterns are both of explicitly spatial as well as secto-ral character. An important role is also played by mid- and long term corporate policies, especially in such territory-relevant fields like the energy sector.
The interdependence between economic and land use change has been projected into the future
Figure 17: GDP/ capita potential Scenario A1, 2025 Scenario A2, 2025
no data765813078193932823542238594867738992781117878153269175127211437238162490622
Quotients (EUR per capita)
no data69221190517785255963858546442550097009483855108627139243166155195466454587
Quotients (EUR per capita)
Key impacts
Finance & property development
Globalized firms & workforce
Expanding workspace & ICT effects
Occupations & career changes
Key driving forces
Existing workforce marginalized
Decline of traditional centres
Housing vulnerability
Dependence on fossil fuels
Global investment focused on CBD &peri-urban business locations
New employment & investment in peri-urban business locations Economic
modernization & restructuring in rural areas
Emergence of peri-urban as new enterprise & employment activity zoneRe-investment &
regeneration in CBD & inner areas
Globalizing CBD
Low-cost labour pool inner areas
Service worker home base in suburbs
Enterprising, high value, connected peri-urban
Urban view - attractive leisure hinterland. Rural view - productive economic zone
Figure 16:›Economic & employment dynamics in the peri-urban
Source: PAS
Source: UOM
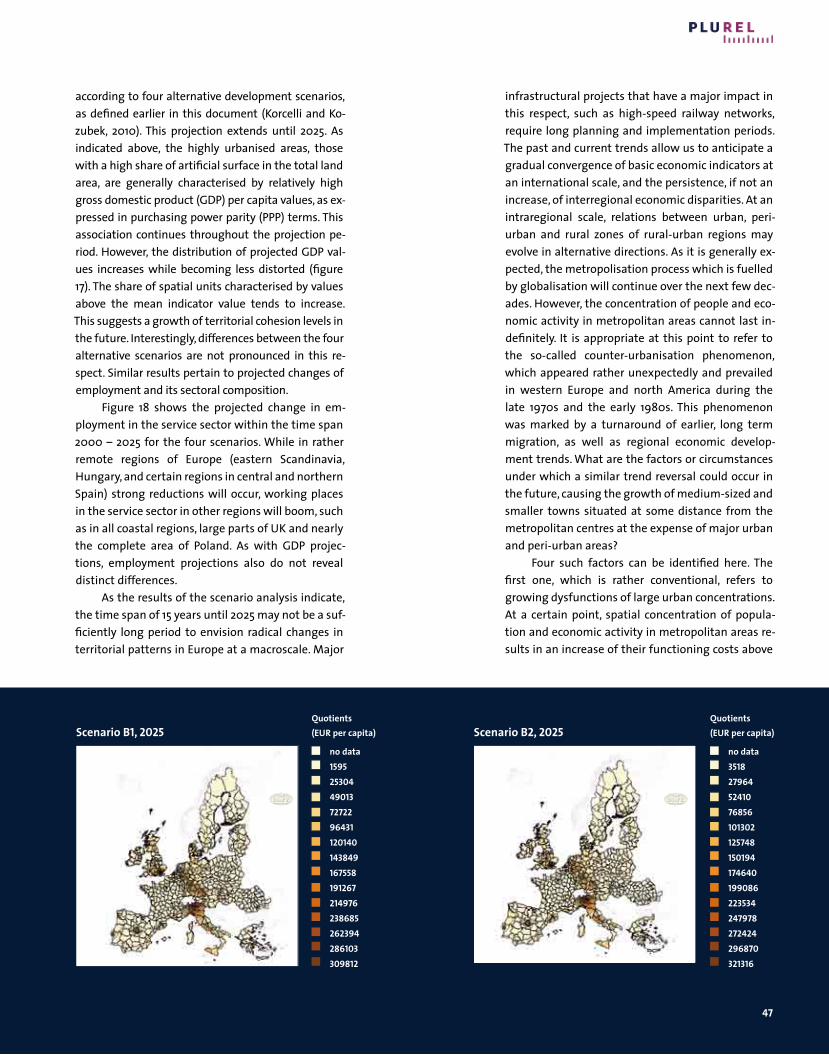
47
according to four alternative development scenarios, as defined earlier in this document (Korcelli and Ko-zubek, 2010). This projection extends until 2025. As indicated above, the highly urbanised areas, those with a high share of artificial surface in the total land area, are generally characterised by relatively high gross domestic product (GDP) per capita values, as ex-pressed in purchasing power parity (PPP) terms. This association continues throughout the projection pe-riod. However, the distribution of projected GDP val-ues increases while becoming less distorted (figure 17). The share of spatial units characterised by values above the mean indicator value tends to increase. This suggests a growth of territorial cohesion levels in the future. Interestingly, differences between the four alternative scenarios are not pronounced in this re-spect. Similar results pertain to projected changes of employment and its sectoral composition.
Figure 18 shows the projected change in em-ployment in the service sector within the time span 2000 – 2025 for the four scenarios. While in rather remote regions of Europe (eastern Scandinavia, Hungary, and certain regions in central and northern Spain) strong reductions will occur, working places in the service sector in other regions will boom, such as in all coastal regions, large parts of UK and nearly the complete area of Poland. As with GDP projec-tions, employment projections also do not reveal distinct differences.
As the results of the scenario analysis indicate, the time span of 15 years until 2025 may not be a suf-ficiently long period to envision radical changes in territorial patterns in Europe at a macroscale. Major
infrastructural projects that have a major impact in this respect, such as high-speed railway networks, require long planning and implementation periods. The past and current trends allow us to anticipate a gradual convergence of basic economic indicators at an international scale, and the persistence, if not an increase, of interregional economic disparities. At an intraregional scale, relations between urban, peri-urban and rural zones of rural-urban regions may evolve in alternative directions. As it is generally ex-pected, the metropolisation process which is fuelled by globalisation will continue over the next few dec-ades. However, the concentration of people and eco-nomic activity in metropolitan areas cannot last in-definitely. It is appropriate at this point to refer to the so-called counter-urbanisation phenomenon, which appeared rather unexpectedly and prevailed in western Europe and north America during the late 1970s and the early 1980s. This phenomenon was marked by a turnaround of earlier, long term migration, as well as regional economic develop-ment trends. What are the factors or circumstances under which a similar trend reversal could occur in the future, causing the growth of medium-sized and smaller towns situated at some distance from the metropolitan centres at the expense of major urban and peri-urban areas?
Four such factors can be identified here. The first one, which is rather conventional, refers to growing dysfunctions of large urban concentrations. At a certain point, spatial concentration of popula-tion and economic activity in metropolitan areas re-sults in an increase of their functioning costs above
Scenario B1, 2025 Scenario B2, 2025no data159525304490137272296431120140143849167558191267214976238685262394286103309812
Quotients (EUR per capita)
no data3518279645241076856101302125748150194174640199086223534247978272424296870321316
Quotients (EUR per capita)
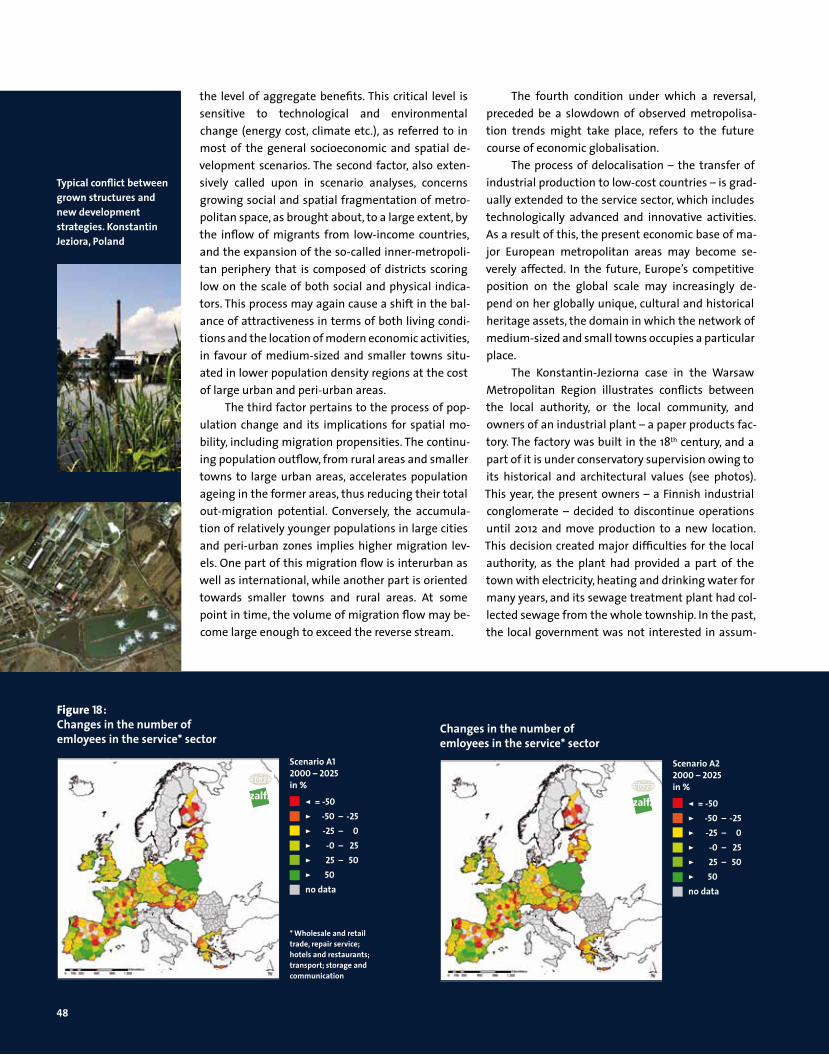
48
the level of aggregate benefits. This critical level is sensitive to technological and environmental change (energy cost, climate etc.), as referred to in most of the general socioeconomic and spatial de-velopment scenarios. The second factor, also exten-sively called upon in scenario analyses, concerns growing social and spatial fragmentation of metro-politan space, as brought about, to a large extent, by the inflow of migrants from low-income countries, and the expansion of the so-called inner-metropoli-tan periphery that is composed of districts scoring low on the scale of both social and physical indica-tors. This process may again cause a shift in the bal-ance of attractiveness in terms of both living condi-tions and the location of modern economic activities, in favour of medium-sized and smaller towns situ-ated in lower population density regions at the cost of large urban and peri-urban areas.
The third factor pertains to the process of pop-ulation change and its implications for spatial mo-bility, including migration propensities. The continu-ing population outflow, from rural areas and smaller towns to large urban areas, accelerates population ageing in the former areas, thus reducing their total out-migration potential. Conversely, the accumula-tion of relatively younger populations in large cities and peri-urban zones implies higher migration lev-els. One part of this migration flow is interurban as well as international, while another part is oriented towards smaller towns and rural areas. At some point in time, the volume of migration flow may be-come large enough to exceed the reverse stream.
The fourth condition under which a reversal, preceded be a slowdown of observed metropolisa-tion trends might take place, refers to the future course of economic globalisation.
The process of delocalisation – the transfer of industrial production to low-cost countries – is grad-ually extended to the service sector, which includes technologically advanced and innovative activities. As a result of this, the present economic base of ma-jor European metropolitan areas may become se-verely affected. In the future, Europe’s competitive position on the global scale may increasingly de-pend on her globally unique, cultural and historical heritage assets, the domain in which the network of medium-sized and small towns occupies a particular place.
The Konstantin-Jeziorna case in the Warsaw Metropolitan Region illustrates conflicts between the local authority, or the local community, and owners of an industrial plant – a paper products fac-tory. The factory was built in the 18th century, and a part of it is under conservatory supervision owing to its historical and architectural values (see photos). This year, the present owners – a Finnish industrial conglomerate – decided to discontinue operations until 2012 and move production to a new location. This decision created major difficulties for the local authority, as the plant had provided a part of the town with electricity, heating and drinking water for many years, and its sewage treatment plant had col-lected sewage from the whole township. In the past, the local government was not interested in assum-
Figure 18: Changes in the number of emloyees in the service* sector
Scenario A12000 – 2025in %
< = -50> -50 – -25> -25 – 0> -0 – 25> 25 – 50> 50no data
* Wholesale and retail trade, repair service; hotels and restaurants; transport; storage and communication
Changes in the number of emloyees in the service* sector
Scenario A22000 – 2025in %
< = -50> -50 – -25> -25 – 0> -0 – 25> 25 – 50> 50no data
Typical conflict between grown structures and new development strategies. Konstantin Jeziora, Poland

49
ing responsibility for the plant. Now it is no longer for sale. The township is presently facing the prob-lem of finding an alternative solution with all the associated costs and delays involved.
Goals, objectives and policy challenges
P olicies that focus on relationships between eco-nomic development and land use are generally
governed by the sustainability principle. This in-volves searching for a balance between territorial cohesion and economic competitiveness viewed from a long term perspective. Such a balance re-quires partnership relations to exist between urban, peri-urban and rural segments of the rural-urban re-gions – the kind of linkages which are expressed in flows that compensate for spatial concentration ef-fects implied by the metropolisation processes. The more specific policy objectives pertaining to the less-urbanised, particularly peripheral areas, should include: improving connectivity with major urban centres; enhancing the functioning of public institu-tions in these areas by aiming to improve both qual-ity and access to public services with education held in foremost regard; supporting the development of local specialisation based on endogenous resources; and preserving environmental quality. Another rele-vant policy objective in this context is physical revi-talisation of smaller towns with an emphasis on
their cultural and historical heritage assets. These globally unique assets may help to preserve the competitiveness of European space in the long term.
Nevertheless, the balance between cohesion and competitiveness-oriented policies may assume various forms in different parts, or sub-regions, of Europe. In the densely populated and heavily urban-ised west European countries, the focus tends to be put on secondary growth poles – the utilisation of potentials available in smaller urban regions, and in areas facing economic restructuring problems, such as old industrial regions. In the new EU member countries of central and eastern Europe, strategic spatial policy articulates the need to upgrade the in-ternational standing – to elevate the ranking of the main urban regions, including the capital regions, by closing existing infrastructural gaps and promoting the development of an advanced, knowledge-based economy. In those countries with strongly polycen-tric urban systems, the formation of integrated city networks is seen as a means of creating spatial syn-ergy effects, thus allowing for increased specialisa-tion and the emergence of new, high order func-tions. For regions of predominantly rural character throughout the EU, with primary sector activities such as agriculture, forestry, renewable energy pro-duction all playing an important role, the advisable strategies should aim at strengthening the eco-nomic and cultural functions of local medium-size centres, including the policy that would help to re-sist economic marginalisation and progressive de-population of these areas.
Changes in the number of emloyees in the service* sector
Scenario B12000 – 2025in %
< = -50> -50 – -25> -25 – 0> -0 – 25> 25 – 50> 50no data
Changes in the number of emloyees in the service* sector
Scenario B22000 – 2025in %
< = -50> -50 – -25> -25 – 0> -0 – 25> 25 – 50> 50no data
50
The situation
S ocial transitions appear as different but highly interrelated issues. Migration, education, em-
ployment and birth rates are all effects of changing lifestyles. Migration towards urban centres is driven by the desire for better education, better jobs and higher income, even though the urban environment might not be attractive to all. Higher independence and better education lead to higher female employ-ment rates and women giving birth to fewer children. Self-determined lifestyles result in fewer marriages and more divorces, all leading to more one-person and single-parent households. Duel income families with a higher level of income demand better hous-ing standards, which accelerates the movement to-wards attractive suburban and peri-urban areas. Longer life expectancy leads to an increase in the population segment comprising of elderly people who may also migrate to attractive places for their retirement.
Migration, ethnicity and their relationship to land use change
E urope is experiencing various migration flows that head towards wealthy countries away from
the less rich ones (in and outside Europe). These flows also target economically active urban and peri-urban areas and attractive coastal areas, while moving away from rural areas. Migration can be of several types, including labour migration for work and better income, forced migration by refugees, and retirement migration. Thus migration and eth-nicity can be seen to be related. Such migration flows, combined with short distance domestic rural-urban migration, cause population densification in urban (often low rent) areas and trigger further in-terregional migration flows that will be addressed later. We can see some clear patterns depicted in table 7.
Population and migration
Continental migration flows and regional population move-ments affect peri-urban development. Social transition in terms of birth rates, ageing and household structure also contribute to peri-urban land use change, which creates en-vironmental pressures and social fragmentation. Instru-ments to manage growth and control decline must concen-trate on developing compact sub-centres in peri-urban areas by establishing strict zoning regulations against urban sprawl, and by restructuring urban low-rent areas.

51
Societal diversity: Stairs, La grande Arche, La Defense. Paris, France

52
CATEGORY TYPE MIGRATION CHARACTER LAND USE CHANGE CHARACTER LOCATIONS WHERE THIS CHANGE TAKES PLACE
1 Abandoned rural
Flow of young people to cities, flow of working age people to cities or abroad, older residents left behind
Land abandonment: fields lie uncultivated, empty farms, forest colonising abandoned land, landscape becoming progressively »wilder«.
Eastern Europe (Baltics away from main cities), parts of Poland, Bulgaria and Romania, Portugal and Spain, parts of Swiss, Austrian, Italian and Greek mountains.
2 Extensified rural
Flow of young people to cities, general depopulation out of the region.
Extensification of agriculture and forestry: more land farmed by fewer people, extensive modes of farming and industrial forestry. May be some tourism development in places.
Eastern Finland, Eastern Germany, parts of Romania, Italy, central Sweden, Hungary, eastern France, Iceland.
3 Stable rural Slight increase in population but low rates of migration, mostly to urban centres within the area.
Traditional farming continues or there is extensification in remoter places and tourism development including holiday houses.
Western and northern Norway, northern Finland, rural Ireland.
4 Idyllic rural Foreign migration into rural areas by well-off people from elsewhere in Europe or migration to remoter areas within countries. Retirement migration.
Rural houses and villages are regenerated and revitalised by foreign incomers. Traditional rural landscape is maintained or slightly extensified. Tourism development also uses old settlement infrastructure.
Western and central France, Central and northern Italy, parts of Portugal and Spain, small trend in Greece, Romania and Bulgaria, northern Scotland and parts of England and Wales.
5 Intensive rural Labour migration into productive agricultural areas
Areas where agricultural production and horticulture is economic but relies on low wages. Landscape covered by polytunnels and other modern technology of agriculture.
Eastern England, Netherlands, southern Spain, Greece
6 Grey rural International retirement migration from northern to southern Europe
Ex-urban suburban developments along coastal areas, in association with golf courses and other amenities.
Southern Spain, southern France and Brittany, the Algarve in Portugal, Greek islands.
7 Gentrified rural
Not strictly migration but movement of better-off people from the city to rural edge or hinterland
Villages close to large urban centres expand, new residential developments in rural areas within commuting distance of the city. Urbanisation of rural areas (more roads, street lights) and local people priced out of the housing market.
UK, Ireland, southern Germany, southern Scandinavia, France, national or regional capital cities in most countries or economically developing cities in Eastern Europe.
8 Dynamic urban
National migration from rural to city, EU labour and non-EU immigration, intensive in scale and multi-ethnic in composition in many places.
Pressure on urban areas leading to densification, reducing quality of some neighbourhood environments as well as urban sprawl. Ethnic composition of some urban districts changes, local population is displaced to the urban fringe.
Cities in UK, France, central Germany, Italy, Spain, Netherlands, Belgium, Scandinavia and other regionally dynamic areas
9 Stagnant urban
Moderate population change from inward and outward migration, net effect being slight reduction in population. Some non-EU immigration substitutes for the loss of national population.
Some decay of urban infrastructure, reduction in development pressures, increase in brownfield land.
Central Germany, parts of Eastern Europe, ex-industrial cities across Europe
10 Shrinking urban
Net out-migration from failing cities to other more economically active regions or countries. May be in-migration at a rate that does not balance out-migration
Reduction in development pressure, vacant housing in less-desirable areas, increase in brownfield sites.
Eastern Germany, Baltics, regional cities in eastern Europe.
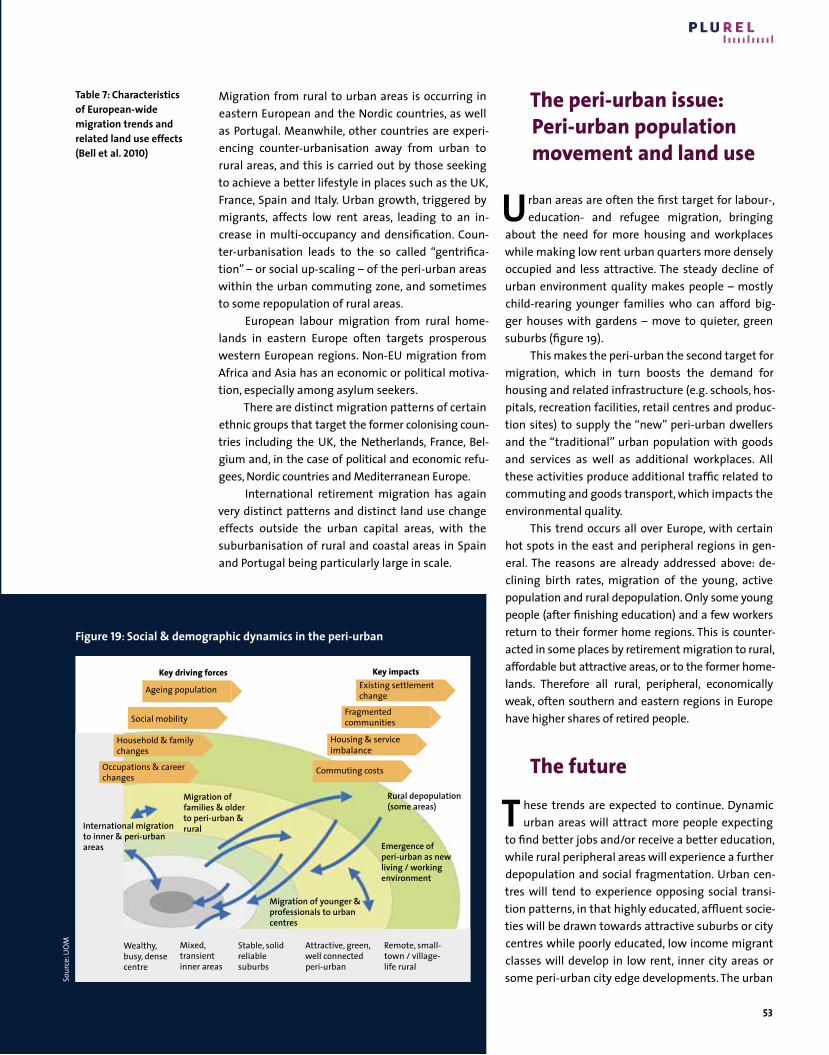
53
Migration from rural to urban areas is occurring in eastern European and the Nordic countries, as well as Portugal. Meanwhile, other countries are experi-encing counter-urbanisation away from urban to rural areas, and this is carried out by those seeking to achieve a better lifestyle in places such as the UK, France, Spain and Italy. Urban growth, triggered by migrants, affects low rent areas, leading to an in-crease in multi-occupancy and densification. Coun-ter-urbanisation leads to the so called “gentrifica-tion” – or social up-scaling – of the peri-urban areas within the urban commuting zone, and sometimes to some repopulation of rural areas.
European labour migration from rural home-lands in eastern Europe often targets prosperous western European regions. Non-EU migration from Africa and Asia has an economic or political motiva-tion, especially among asylum seekers.
There are distinct migration patterns of certain ethnic groups that target the former colonising coun-tries including the UK, the Netherlands, France, Bel-gium and, in the case of political and economic refu-gees, Nordic countries and Mediterranean Europe.
International retirement migration has again very distinct patterns and distinct land use change effects outside the urban capital areas, with the suburbanisation of rural and coastal areas in Spain and Portugal being particularly large in scale.
The peri-urban issue: Peri-urban population movement and land use
U rban areas are often the first target for labour-, education- and refugee migration, bringing
about the need for more housing and workplaces while making low rent urban quarters more densely occupied and less attractive. The steady decline of urban environment quality makes people – mostly child-rearing younger families who can afford big-ger houses with gardens – move to quieter, green suburbs (figure 19).
This makes the peri-urban the second target for migration, which in turn boosts the demand for housing and related infrastructure (e.g. schools, hos-pitals, recreation facilities, retail centres and produc-tion sites) to supply the “new” peri-urban dwellers and the “traditional” urban population with goods and services as well as additional workplaces. All these activities produce additional traffic related to commuting and goods transport, which impacts the environmental quality.
This trend occurs all over Europe, with certain hot spots in the east and peripheral regions in gen-eral. The reasons are already addressed above: de-clining birth rates, migration of the young, active population and rural depopulation. Only some young people (after finishing education) and a few workers return to their former home regions. This is counter-acted in some places by retirement migration to rural, affordable but attractive areas, or to the former home-lands. Therefore all rural, peripheral, economically weak, often southern and eastern regions in Europe have higher shares of retired people.
The future
T hese trends are expected to continue. Dynamic urban areas will attract more people expecting
to find better jobs and/or receive a better education, while rural peripheral areas will experience a further depopulation and social fragmentation. Urban cen-tres will tend to experience opposing social transi-tion patterns, in that highly educated, affluent socie-ties will be drawn towards attractive suburbs or city centres while poorly educated, low income migrant classes will develop in low rent, inner city areas or some peri-urban city edge developments. The urban
Table 7: Characteristics of European-wide migration trends and related land use effects (Bell et al. 2010)
Figure 19: Social & demographic dynamics in the peri-urban
International migration to inner & peri-urban areas
Migration of families & older to peri-urban & rural
Rural depopulation(some areas)
Emergence of peri-urban as new living / working environment
Migration of younger & professionals to urban centres
Wealthy, busy, dense centre
Mixed, transient inner areas
Stable, solid reliable suburbs
Attractive, green, well connected peri-urban
Remote, small-town / village-life rural
Ageing population
Social mobility
Household & family changes
Occupations & career changes
Key driving forcesExisting settlement change
Fragmented communities
Housing & service imbalance
Key impacts
Commuting costs
Sour
ce: U
OM
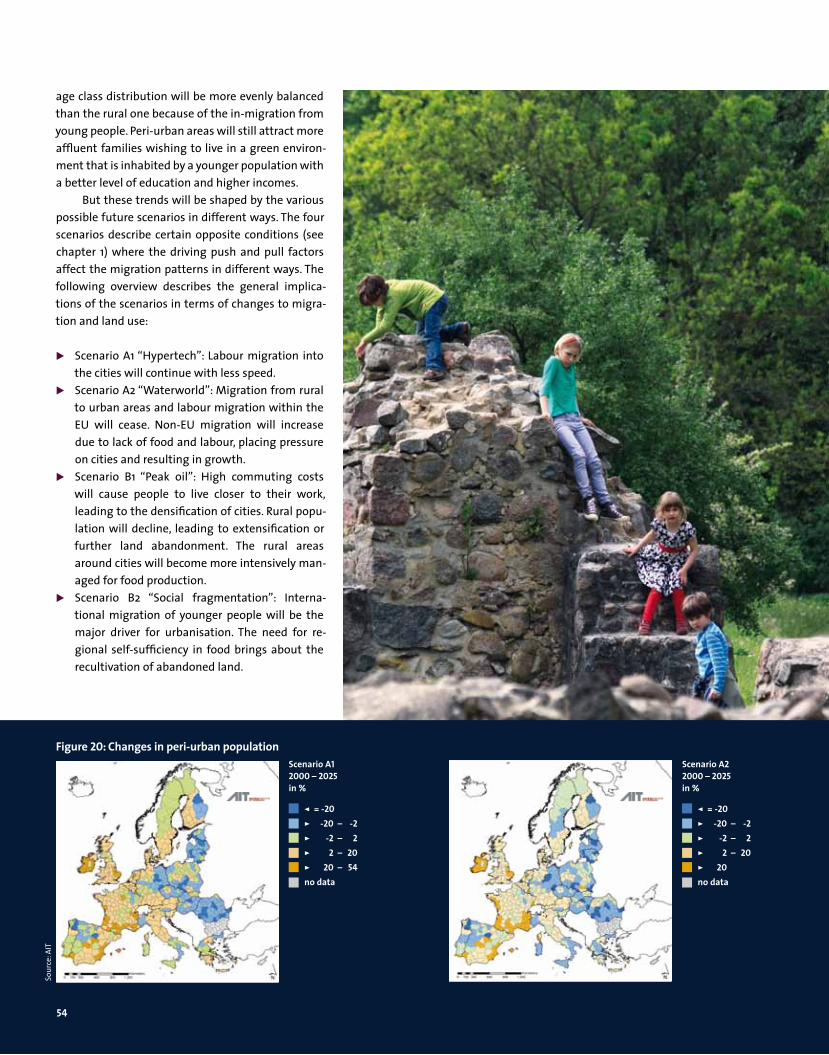
54
age class distribution will be more evenly balanced than the rural one because of the in-migration from young people. Peri-urban areas will still attract more affluent families wishing to live in a green environ-ment that is inhabited by a younger population with a better level of education and higher incomes.
But these trends will be shaped by the various possible future scenarios in different ways. The four scenarios describe certain opposite conditions (see chapter 1) where the driving push and pull factors affect the migration patterns in different ways. The following overview describes the general implica-tions of the scenarios in terms of changes to migra-tion and land use: Scenario A1 “Hypertech”: Labour migration into
the cities will continue with less speed. Scenario A2 “Waterworld”: Migration from rural
to urban areas and labour migration within the EU will cease. Non-EU migration will increase due to lack of food and labour, placing pressure on cities and resulting in growth.
Scenario B1 “Peak oil”: High commuting costs will cause people to live closer to their work, leading to the densification of cities. Rural popu-lation will decline, leading to extensification or further land abandonment. The rural areas around cities will become more intensively man-aged for food production.
Scenario B2 “Social fragmentation”: Interna-tional migration of younger people will be the major driver for urbanisation. The need for re-gional self-sufficiency in food brings about the recultivation of abandoned land.
Figure 20: Changes in peri-urban populationScenario A12000 – 2025in %
< = -20> -20 – -2> -2 – 2> 2 – 20> 20 – 54no data
Scenario A22000 – 2025in %
< = -20> -20 – -2> -2 – 2> 2 – 20> 20 no data
Sour
ce: A
IT
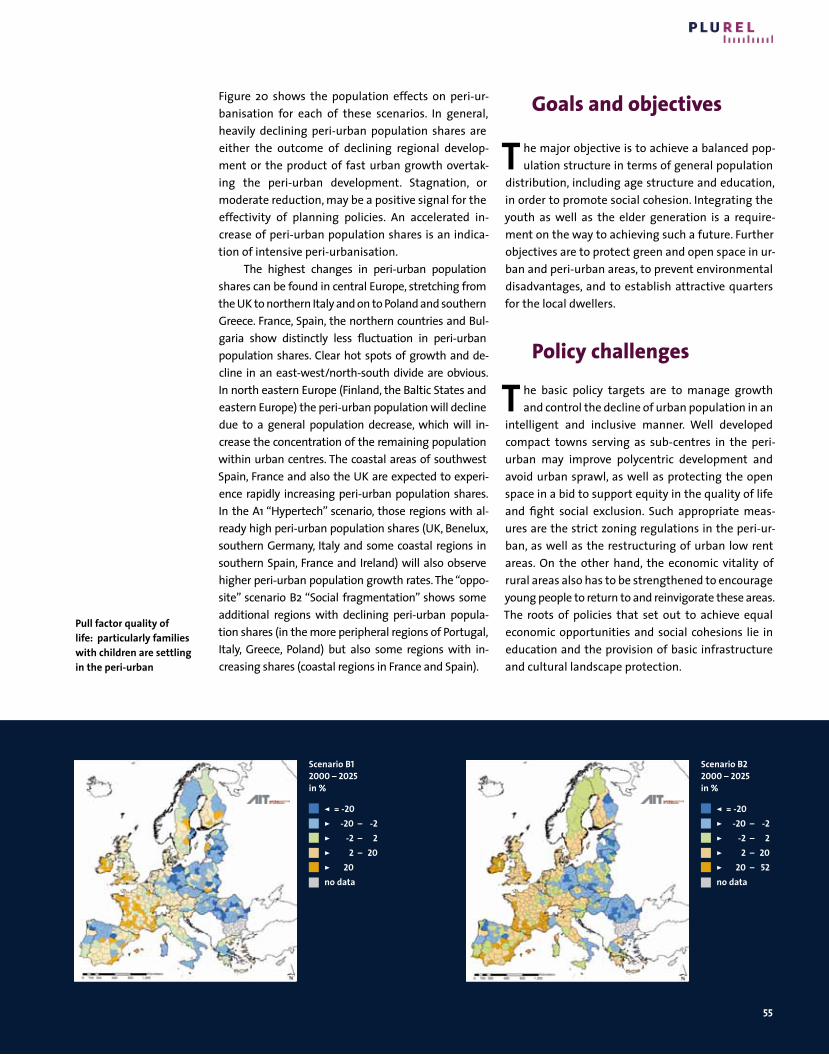
55
Figure 20 shows the population effects on peri-ur-banisation for each of these scenarios. In general, heavily declining peri-urban population shares are either the outcome of declining regional develop-ment or the product of fast urban growth overtak-ing the peri-urban development. Stagnation, or moderate reduction, may be a positive signal for the effectivity of planning policies. An accelerated in-crease of peri-urban population shares is an indica-tion of intensive peri-urbanisation.
The highest changes in peri-urban population shares can be found in central Europe, stretching from the UK to northern Italy and on to Poland and southern Greece. France, Spain, the northern countries and Bul-garia show distinctly less fluctuation in peri-urban population shares. Clear hot spots of growth and de-cline in an east-west/north-south divide are obvious. In north eastern Europe (Finland, the Baltic States and eastern Europe) the peri-urban population will decline due to a general population decrease, which will in-crease the concentration of the remaining population within urban centres. The coastal areas of southwest Spain, France and also the UK are expected to experi-ence rapidly increasing peri-urban population shares. In the A1 “Hypertech” scenario, those regions with al-ready high peri-urban population shares (UK, Benelux, southern Germany, Italy and some coastal regions in southern Spain, France and Ireland) will also observe higher peri-urban population growth rates. The “oppo-site” scenario B2 “Social fragmentation” shows some additional regions with declining peri-urban popula-tion shares (in the more peripheral regions of Portugal, Italy, Greece, Poland) but also some regions with in-creasing shares (coastal regions in France and Spain).
Goals and objectives
T he major objective is to achieve a balanced pop-ulation structure in terms of general population
distribution, including age structure and education, in order to promote social cohesion. Integrating the youth as well as the elder generation is a require-ment on the way to achieving such a future. Further objectives are to protect green and open space in ur-ban and peri-urban areas, to prevent environmental disadvantages, and to establish attractive quarters for the local dwellers.
Policy challenges
T he basic policy targets are to manage growth and control the decline of urban population in an
intelligent and inclusive manner. Well developed compact towns serving as sub-centres in the peri-urban may improve polycentric development and avoid urban sprawl, as well as protecting the open space in a bid to support equity in the quality of life and fight social exclusion. Such appropriate meas-ures are the strict zoning regulations in the peri-ur-ban, as well as the restructuring of urban low rent areas. On the other hand, the economic vitality of rural areas also has to be strengthened to encourage young people to return to and reinvigorate these areas. The roots of policies that set out to achieve equal economic opportunities and social cohesions lie in education and the provision of basic infrastructure and cultural landscape protection.
Scenario B12000 – 2025in %
< = -20> -20 – -2> -2 – 2> 2 – 20> 20 no data
Scenario B22000 – 2025in %
< = -20> -20 – -2> -2 – 2> 2 – 20> 20 – 52no data
Pull factor quality of life: particularly families with children are settling in the peri-urban
56
The situation
E urope is home to various social groups with dif-fering educational standards, income levels, age
distributions and household structures. We can ob-serve social fragmentation between countries, re-gions and within the rural-urban regions where people are impacted by economic prosperity, local opportunities and also their community, so that they evolve a certain lifestyle that is influenced by media and local society which includes their parents, teachers, friends and neighbours.
Different lifestyles, income, lifecycle positions and family settings result in different household types with varying demands for floor space require-ments, different housing preferences, and different locational preferences for residential areas and the related infrastructure (e.g. schools). This drives the segregation of social groups into, or exclusion from,
different dwelling areas and housing types based on alternate levels of affordability. The perception of the city versus the alternative peri-urban target areas, as well as the attractiveness gradients between the former residential area and a future one, are impor-tant issues when deciding on location options for the urban versus the peri-urban (figure 21).
As addressed earlier, low rent residential areas are attractive to job-seeking rural people or immi-grants with low income who have recently moved into urban centres, and who may not be in a position to consider other location assets. Members of the population who can gradually afford better housing quality will leave these areas in preference of middle class residential quarters – either inner urban or suburban. Childless households with higher educa-tion and income levels often stay in the urban cen-
Housing and community
Self-determined lifestyles result in increasing household numbers, accompanied by a growth of smaller households with a corresponding decline in larger ones. To change these trends would require various interventions. The housing market can be one instrument. For example, by building larger flats, couples may be compelled to live together in-stead of in separate households. Sufficient social infrastruc-ture is another way of improving the quality of life for all population groups in all quarters of a city.
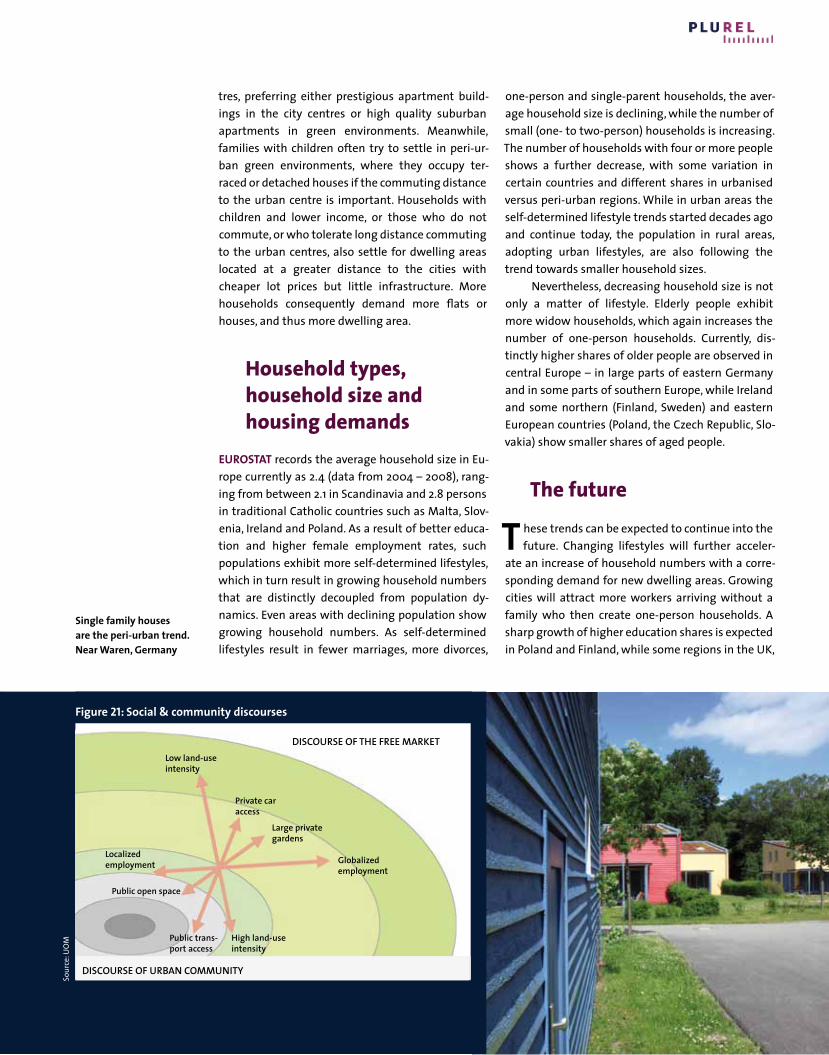
57
tres, preferring either prestigious apartment build-ings in the city centres or high quality suburban apartments in green environments. Meanwhile, families with children often try to settle in peri-ur-ban green environments, where they occupy ter-raced or detached houses if the commuting distance to the urban centre is important. Households with children and lower income, or those who do not commute, or who tolerate long distance commuting to the urban centres, also settle for dwelling areas located at a greater distance to the cities with cheaper lot prices but little infrastructure. More households consequently demand more flats or houses, and thus more dwelling area.
Household types, household size and housing demands
EUROSTAT records the average household size in Eu-rope currently as 2.4 (data from 2004 – 2008), rang-ing from between 2.1 in Scandinavia and 2.8 persons in traditional Catholic countries such as Malta, Slov-enia, Ireland and Poland. As a result of better educa-tion and higher female employment rates, such populations exhibit more self-determined lifestyles, which in turn result in growing household numbers that are distinctly decoupled from population dy-namics. Even areas with declining population show growing household numbers. As self-determined lifestyles result in fewer marriages, more divorces,
one-person and single-parent households, the aver-age household size is declining, while the number of small (one- to two-person) households is increasing. The number of households with four or more people shows a further decrease, with some variation in certain countries and different shares in urbanised versus peri-urban regions. While in urban areas the self-determined lifestyle trends started decades ago and continue today, the population in rural areas, adopting urban lifestyles, are also following the trend towards smaller household sizes.
Nevertheless, decreasing household size is not only a matter of lifestyle. Elderly people exhibit more widow households, which again increases the number of one-person households. Currently, dis-tinctly higher shares of older people are observed in central Europe – in large parts of eastern Germany and in some parts of southern Europe, while Ireland and some northern (Finland, Sweden) and eastern European countries (Poland, the Czech Republic, Slo-vakia) show smaller shares of aged people.
The future
T hese trends can be expected to continue into the future. Changing lifestyles will further acceler-
ate an increase of household numbers with a corre-sponding demand for new dwelling areas. Growing cities will attract more workers arriving without a family who then create one-person households. A sharp growth of higher education shares is expected in Poland and Finland, while some regions in the UK,
Figure 21: Social & community discourses
DISCOURSE OF URBAN COMMUNITY
DISCOURSE OF THE FREE MARKETLow land-use intensity
Private car access
Large private gardens
Globalized employment
High land-use intensity
Public trans-port access
Localized employment
Public open space
Sour
ce: U
OM
Single family houses are the peri-urban trend. Near Waren, Germany

58
the Netherlands, Greece, Ireland and some French regions will show moderate growth. Growing retiree numbers (in the urban as well as in the rural areas) will further increase the number of one-person households.
The trends may be influenced by different fu-ture conditions as defined in the scenarios. The trend variations will follow the variations of the popula-tion dynamics, while the influence of lifestyle on the household structure will appear to be stable.
In general, the future trend scenarios predict that peri-urban areas will experience specific dy-namics in population movement and economic growth. A certain variation of growth patterns of
the peri-urban settlement area can be expected for the coming decades. The hot spot areas with the fastest peri-urban settlement growth will be ob-served in south England, Benelux, northern Italy and large parts of Germany (as outlined in chapter 1). Moderate growth may occur in France, northern UK, central Europe, the eastern European capital regions, and along the coastal regions of the Mediterranean and southern Scandinavia. Changes of artificial sur-face shares in the peri-urban will attract households with a different floor space demand. The scenario maps above and below depict the regional differ-ences in the change of household proportions occu-pied by one individual and four or more people.
Figure 22: Changes in proportion of 1-person households
Source: AIT, EUROSTAT
Scenario A12000 – 2025in %
> -9,2 – 0,0> 0 – 2,5> 2,5 – 5,0> 5 – 10> 10no data
Scenario A22000 – 2025in %
> -9,2 – 0,0> 0 – 2,5> 2,5 – 5,0> 5 – 10> 10no data
Figure 23: Changes in proportion of 4plus person households
Source: AIT, EUROSTAT
Scenario A12000 – 2025in %
< -15 ,0> -15 – -10> -10 – -5> -5 – 0> 0no data
Scenario A22000 – 2025in %
< -15 ,0> -15 – -10> -10 – -5> -5 – 0> 0no data
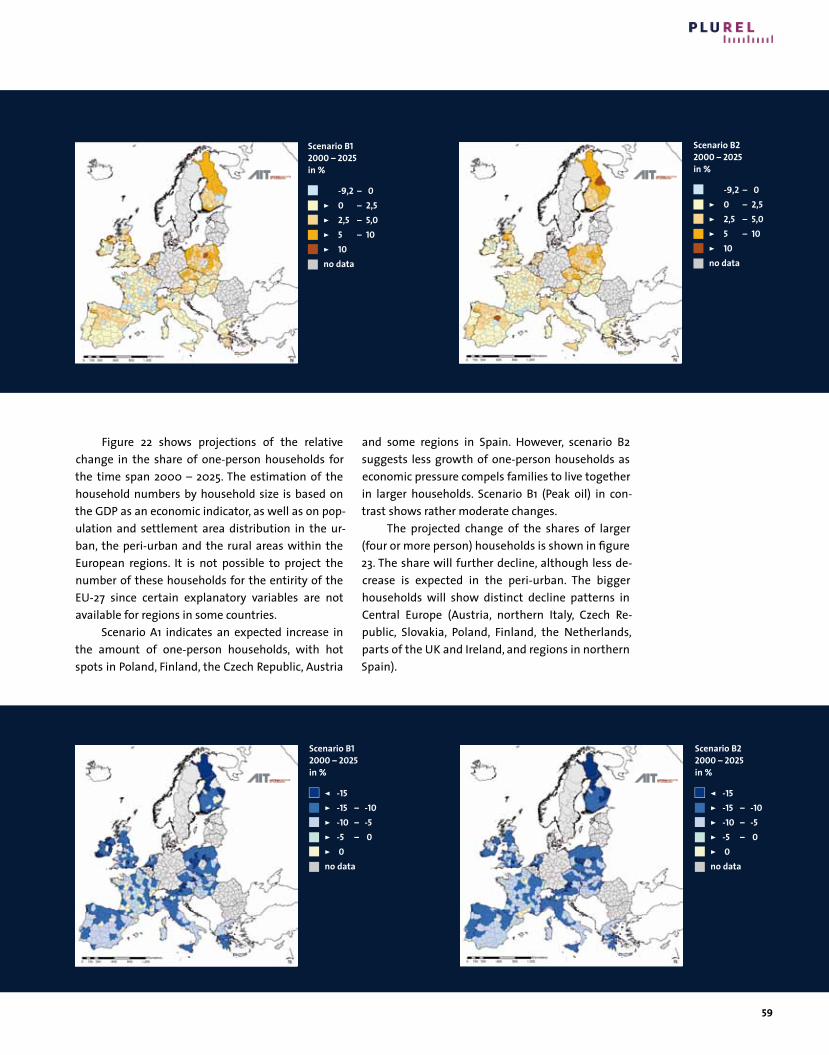
59
Figure 22 shows projections of the relative change in the share of one-person households for the time span 2000 – 2025. The estimation of the household numbers by household size is based on the GDP as an economic indicator, as well as on pop-ulation and settlement area distribution in the ur-ban, the peri-urban and the rural areas within the European regions. It is not possible to project the number of these households for the entirity of the EU-27 since certain explanatory variables are not available for regions in some countries.
Scenario A1 indicates an expected increase in the amount of one-person households, with hot spots in Poland, Finland, the Czech Republic, Austria
and some regions in Spain. However, scenario B2 suggests less growth of one-person households as economic pressure compels families to live together in larger households. Scenario B1 (Peak oil) in con-trast shows rather moderate changes.
The projected change of the shares of larger (four or more person) households is shown in figure 23. The share will further decline, although less de-crease is expected in the peri-urban. The bigger households will show distinct decline patterns in Central Europe (Austria, northern Italy, Czech Re-public, Slovakia, Poland, Finland, the Netherlands, parts of the UK and Ireland, and regions in northern Spain).
Scenario B12000 – 2025in %
> -9,2 – 0,0> 0 – 2,5> 2,5 – 5,0> 5 – 10> 10no data
Scenario B22000 – 2025in %
> -9,2 – 0,0> 0 – 2,5> 2,5 – 5,0> 5 – 10> 10no data
Scenario B12000 – 2025in %
< -15 ,0> -15 – -10> -10 – -5> -5 – 0> 0no data
Scenario B22000 – 2025in %
< -15 ,0> -15 – -10> -10 – -5> -5 – 0> 0no data
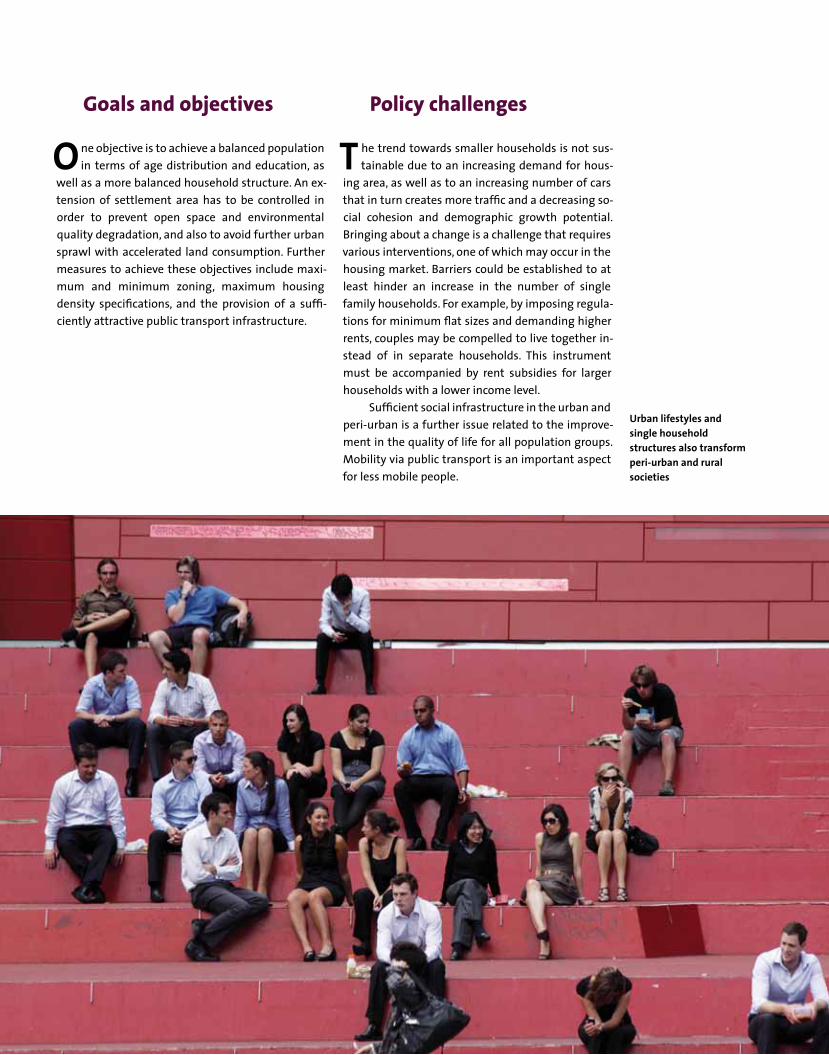
60
Goals and objectives
O ne objective is to achieve a balanced population in terms of age distribution and education, as
well as a more balanced household structure. An ex-tension of settlement area has to be controlled in order to prevent open space and environmental quality degradation, and also to avoid further urban sprawl with accelerated land consumption. Further measures to achieve these objectives include maxi-mum and minimum zoning, maximum housing density specifications, and the provision of a suffi-ciently attractive public transport infrastructure.
Policy challenges
T he trend towards smaller households is not sus-tainable due to an increasing demand for hous-
ing area, as well as to an increasing number of cars that in turn creates more traffic and a decreasing so-cial cohesion and demographic growth potential. Bringing about a change is a challenge that requires various interventions, one of which may occur in the housing market. Barriers could be established to at least hinder an increase in the number of single family households. For example, by imposing regula-tions for minimum flat sizes and demanding higher rents, couples may be compelled to live together in-stead of in separate households. This instrument must be accompanied by rent subsidies for larger households with a lower income level.
Sufficient social infrastructure in the urban and peri-urban is a further issue related to the improve-ment in the quality of life for all population groups. Mobility via public transport is an important aspect for less mobile people.
Urban lifestyles and single household structures also transform peri-urban and rural societies

61
Transport and pollution
T he overall air pollutant emission trends in Europe are expected to decline despite an increasing
amount of emission-generating activities and goods consumption patterns. However, the trends show
different directions and intensities (figure 24). For transport, NOx particulate matter and CO2 emis-sions remain a problem. NOx emissions from road transportation are expected to decline despite an increase in traffic, but only to the level when all cars are equipped with a catalyst. Little improvement has occurred in energy efficiency and particulate matter emissions. Therefore, the amount of kilometres cov-ered by vehicles is an important factor in the reduc-tion of air pollution emissions caused by traffic. Ur-ban form and spatial structure are the most important issues influencing vehicle kilometres travelled.
The situation
T he ultimate goal of a transportation system is to be highly accessible. Optimal accessibility is usu-
ally reached at densely built areas where destina-tions i.e. workplaces, shops, services and activities, are all agglomerated. Urban sprawl and low density peri-urbanisation lead to longer commuting and higher emissions. It also tends to exclude low in-come earners and those without cars.
Mobility means actual physical movement in-cluding walking, cycling, public transit, car and other
Mobility and transport
At present, low density urban sprawl causes longer commut-ing distances, increased infrastructure costs, and less viable public transport systems. Urban expansion encourages car use, and car use encourages urban expansion. Policies that support non-motorised transport modes, substituting mo-bility and planning more accessible land use patterns, are sustainable ways to increase accessibility.
Emission totals per 50x50km EMEP raster cells
EMEP_base2004.NOX_S07
< 0< 1.000 T< 2.500 T< 5.000 T< 10.000 T> 10.000 T
Figure 24: NOx emissions from road traffic
Source: AIT, applying data from CORINEAIR 2004
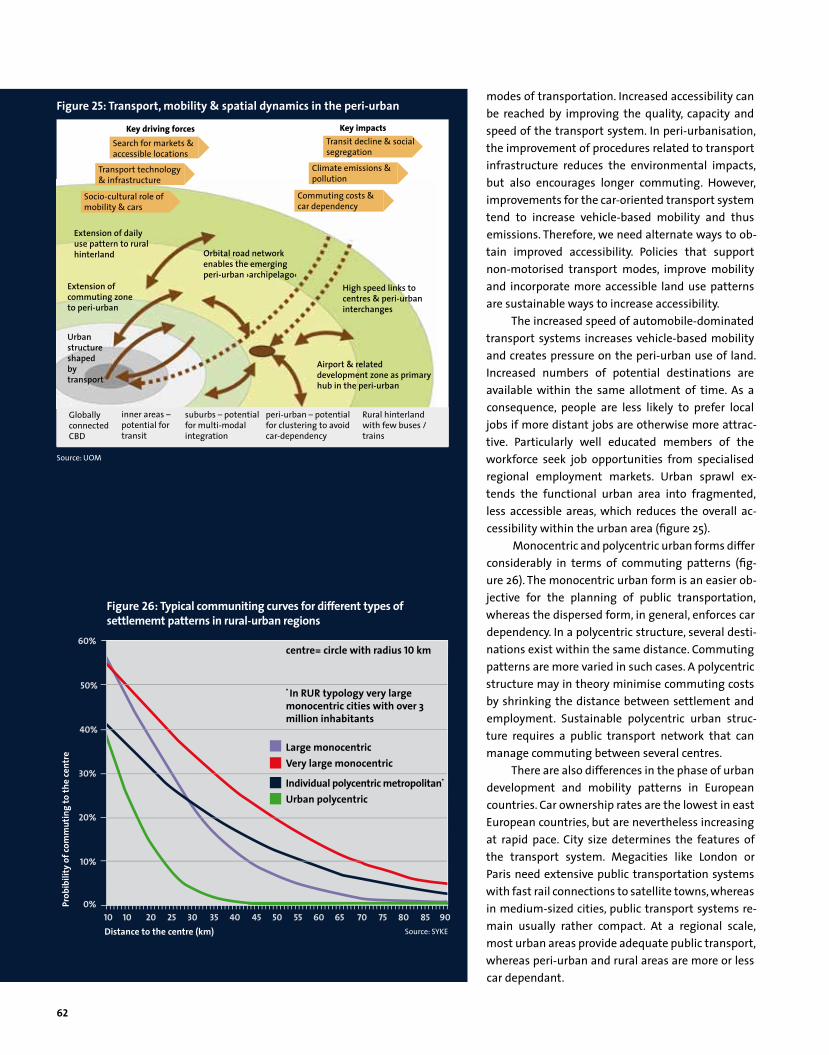
62
modes of transportation. Increased accessibility can be reached by improving the quality, capacity and speed of the transport system. In peri-urbanisation, the improvement of procedures related to transport infrastructure reduces the environmental impacts, but also encourages longer commuting. However, improvements for the car-oriented transport system tend to increase vehicle-based mobility and thus emissions. Therefore, we need alternate ways to ob-tain improved accessibility. Policies that support non-motorised transport modes, improve mobility and incorporate more accessible land use patterns are sustainable ways to increase accessibility.
The increased speed of automobile-dominated transport systems increases vehicle-based mobility and creates pressure on the peri-urban use of land. Increased numbers of potential destinations are available within the same allotment of time. As a consequence, people are less likely to prefer local jobs if more distant jobs are otherwise more attrac-tive. Particularly well educated members of the workforce seek job opportunities from specialised regional employment markets. Urban sprawl ex-tends the functional urban area into fragmented, less accessible areas, which reduces the overall ac-cessibility within the urban area (figure 25).
Monocentric and polycentric urban forms differ considerably in terms of commuting patterns (fig-ure 26). The monocentric urban form is an easier ob-jective for the planning of public transportation, whereas the dispersed form, in general, enforces car dependency. In a polycentric structure, several desti-nations exist within the same distance. Commuting patterns are more varied in such cases. A polycentric structure may in theory minimise commuting costs by shrinking the distance between settlement and employment. Sustainable polycentric urban struc-ture requires a public transport network that can manage commuting between several centres.
There are also differences in the phase of urban development and mobility patterns in European countries. Car ownership rates are the lowest in east European countries, but are nevertheless increasing at rapid pace. City size determines the features of the transport system. Megacities like London or Paris need extensive public transportation systems with fast rail connections to satellite towns, whereas in medium-sized cities, public transport systems re-main usually rather compact. At a regional scale, most urban areas provide adequate public transport, whereas peri-urban and rural areas are more or less car dependant.
Extension of daily use pattern to rural hinterland
Extension of commuting zoneto peri-urban
Orbital road network enables the emerging peri-urban ›archipelago‹
Urban structure shaped by transport
High speed links to centres & peri-urban interchanges
Airport & related development zone as primary hub in the peri-urban
Globally connected CBD
inner areas – potential for transit
suburbs – potential for multi-modal integration
peri-urban – potential for clustering to avoid car-dependency
Rural hinterland with few buses / trains
Search for markets & accessible locations
Transport technology & infrastructure
Socio-cultural role of mobility & cars
Key driving forcesTransit decline & social segregation
Climate emissions & pollution
Commuting costs & car dependency
Key impacts
Figure 25: Transport, mobility & spatial dynamics in the peri-urban
10 10
10%
20%
30%
40%
50%
60%
0%20 25 30 35 40 45 50 55 60 65 70 75 80 85 90
Distance to the centre (km)
Prob
ibili
ty o
f com
mut
ing
to th
e ce
ntre
centre= circle with radius 10 km
* In RUR typology very large monocentric cities with over 3 million inhabitants
Large monocentricVery large monocentric
Individual polycentric metropolitan*
Urban polycentric
Figure 26: Typical communiting curves for different types of settlememt patterns in rural-urban regions
Source: SYKE
Source: UOM
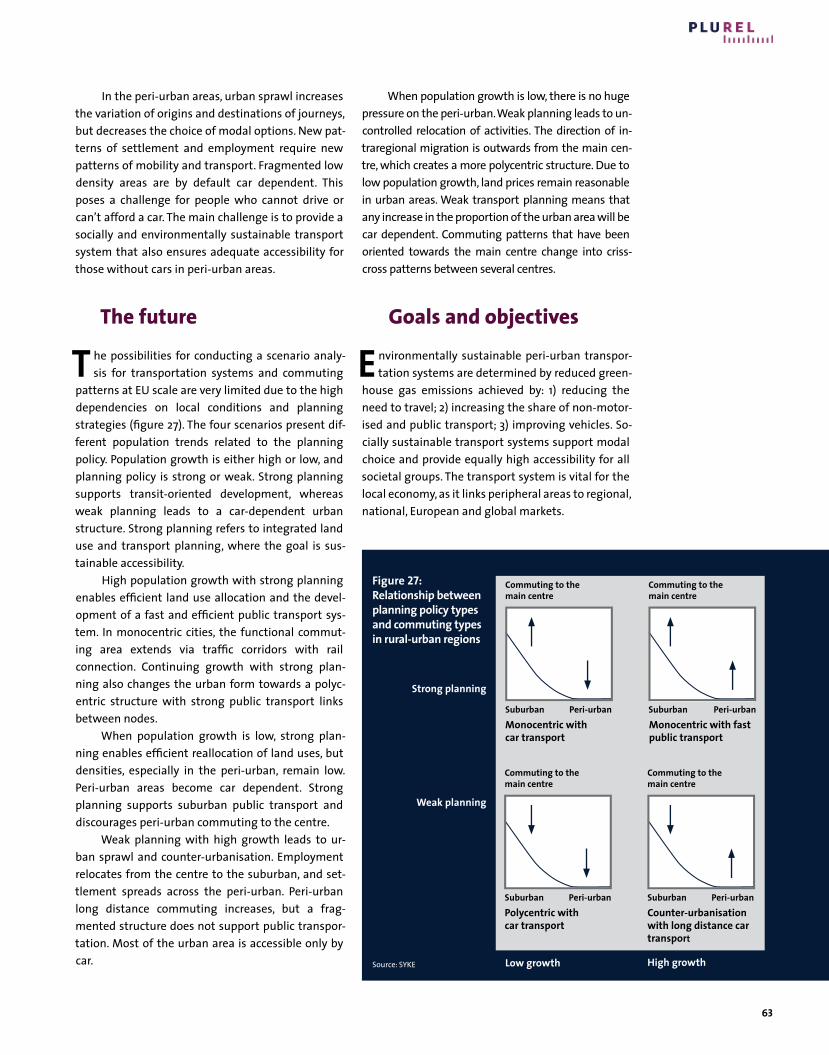
63
In the peri-urban areas, urban sprawl increases the variation of origins and destinations of journeys, but decreases the choice of modal options. New pat-terns of settlement and employment require new patterns of mobility and transport. Fragmented low density areas are by default car dependent. This poses a challenge for people who cannot drive or can’t afford a car. The main challenge is to provide a socially and environmentally sustainable transport system that also ensures adequate accessibility for those without cars in peri-urban areas.
The future
T he possibilities for conducting a scenario analy-sis for transportation systems and commuting
patterns at EU scale are very limited due to the high dependencies on local conditions and planning strategies (figure 27). The four scenarios present dif-ferent population trends related to the planning policy. Population growth is either high or low, and planning policy is strong or weak. Strong planning supports transit-oriented development, whereas weak planning leads to a car-dependent urban structure. Strong planning refers to integrated land use and transport planning, where the goal is sus-tainable accessibility.
High population growth with strong planning enables efficient land use allocation and the devel-opment of a fast and efficient public transport sys-tem. In monocentric cities, the functional commut-ing area extends via traffic corridors with rail connection. Continuing growth with strong plan-ning also changes the urban form towards a polyc-entric structure with strong public transport links between nodes.
When population growth is low, strong plan-ning enables efficient reallocation of land uses, but densities, especially in the peri-urban, remain low. Peri-urban areas become car dependent. Strong planning supports suburban public transport and discourages peri-urban commuting to the centre.
Weak planning with high growth leads to ur-ban sprawl and counter-urbanisation. Employment relocates from the centre to the suburban, and set-tlement spreads across the peri-urban. Peri-urban long distance commuting increases, but a frag-mented structure does not support public transpor-tation. Most of the urban area is accessible only by car.
When population growth is low, there is no huge pressure on the peri-urban. Weak planning leads to un-controlled relocation of activities. The direction of in-traregional migration is outwards from the main cen-tre, which creates a more polycentric structure. Due to low population growth, land prices remain reasonable in urban areas. Weak transport planning means that any increase in the proportion of the urban area will be car dependent. Commuting patterns that have been oriented towards the main centre change into criss-cross patterns between several centres.
Goals and objectives
E nvironmentally sustainable peri-urban transpor-tation systems are determined by reduced green-
house gas emissions achieved by: 1) reducing the need to travel; 2) increasing the share of non-motor-ised and public transport; 3) improving vehicles. So-cially sustainable transport systems support modal choice and provide equally high accessibility for all societal groups. The transport system is vital for the local economy, as it links peripheral areas to regional, national, European and global markets.
Figure 27: Relationship between planning policy types and commuting types in rural-urban regions
Strong planning
Weak planning
Source: SYKE
Suburban Peri-urbanSuburban Peri-urbanMonocentric with car transport
Commuting to the main centre
Suburban Peri-urbanPolycentric with car transport
Commuting to the main centre
Suburban Peri-urbanCounter-urbanisation with long distance car transport
Monocentric with fast public transport
Low growth High growth
Commuting to the main centre
Commuting to the main centre
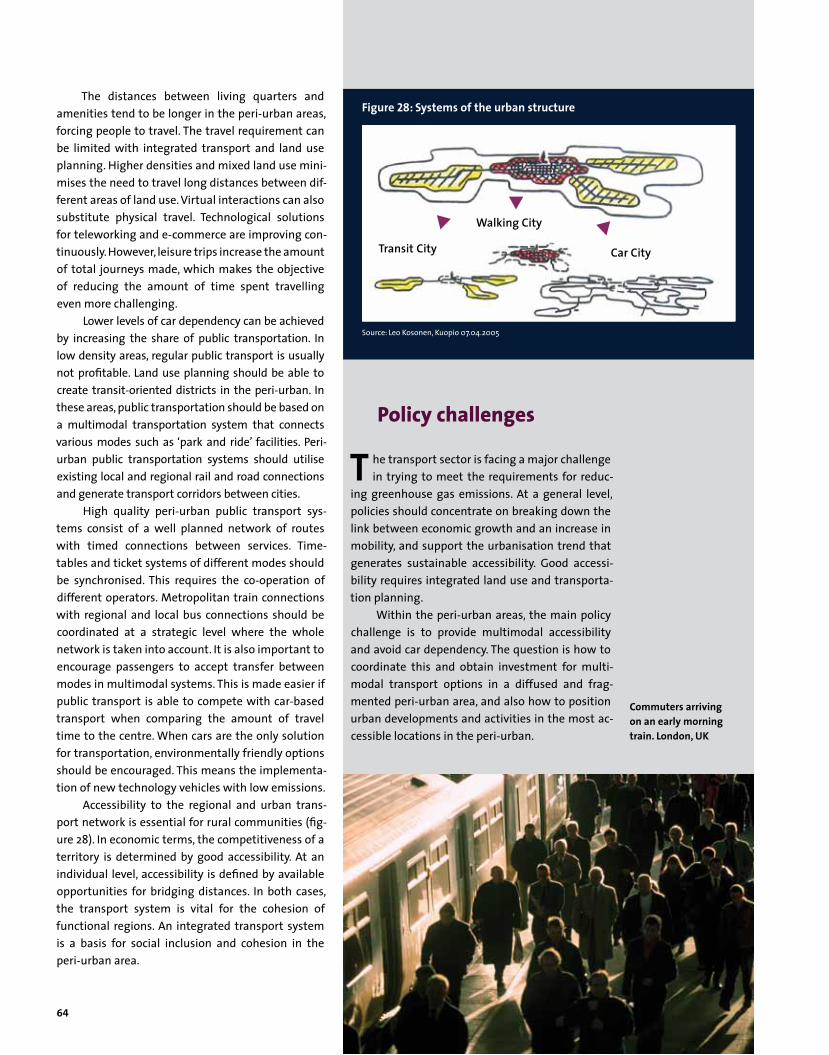
64
The distances between living quarters and amenities tend to be longer in the peri-urban areas, forcing people to travel. The travel requirement can be limited with integrated transport and land use planning. Higher densities and mixed land use mini-mises the need to travel long distances between dif-ferent areas of land use. Virtual interactions can also substitute physical travel. Technological solutions for teleworking and e-commerce are improving con-tinuously. However, leisure trips increase the amount of total journeys made, which makes the objective of reducing the amount of time spent travelling even more challenging.
Lower levels of car dependency can be achieved by increasing the share of public transportation. In low density areas, regular public transport is usually not profitable. Land use planning should be able to create transit-oriented districts in the peri-urban. In these areas, public transportation should be based on a multimodal transportation system that connects various modes such as ‘park and ride’ facilities. Peri-urban public transportation systems should utilise existing local and regional rail and road connections and generate transport corridors between cities.
High quality peri-urban public transport sys-tems consist of a well planned network of routes with timed connections between services. Time-tables and ticket systems of different modes should be synchronised. This requires the co-operation of different operators. Metropolitan train connections with regional and local bus connections should be coordinated at a strategic level where the whole network is taken into account. It is also important to encourage passengers to accept transfer between modes in multimodal systems. This is made easier if public transport is able to compete with car-based transport when comparing the amount of travel time to the centre. When cars are the only solution for transportation, environmentally friendly options should be encouraged. This means the implementa-tion of new technology vehicles with low emissions.
Accessibility to the regional and urban trans-port network is essential for rural communities (fig-ure 28). In economic terms, the competitiveness of a territory is determined by good accessibility. At an individual level, accessibility is defined by available opportunities for bridging distances. In both cases, the transport system is vital for the cohesion of functional regions. An integrated transport system is a basis for social inclusion and cohesion in the peri-urban area.
Policy challenges
T he transport sector is facing a major challenge in trying to meet the requirements for reduc-
ing greenhouse gas emissions. At a general level, policies should concentrate on breaking down the link between economic growth and an increase in mobility, and support the urbanisation trend that generates sustainable accessibility. Good accessi-bility requires integrated land use and transporta-tion planning.
Within the peri-urban areas, the main policy challenge is to provide multimodal accessibility and avoid car dependency. The question is how to coordinate this and obtain investment for multi-modal transport options in a diffused and frag-mented peri-urban area, and also how to position urban developments and activities in the most ac-cessible locations in the peri-urban.
Figure 28: Systems of the urban structure
Transit City
Walking City
Car City
Source: Leo Kosonen, Kuopio 07.04.2005
Commuters arriving on an early morning train. London, UK

65
The situation
E uropean agriculture is multifunctional. It pro-duces food, fibres and renewable energy, but also
natural and cultural resources that we have increas-ingly come to value, such as biodiversity, traditional landscapes and the capacity to mitigate climate change.
European agriculture takes place in the urban-rural context. Though most land devoted to agricul-
tural use is located in rural areas, the functions of agriculture have to be seen as a complex exchange between urban and rural regions (figure 29). The majority of consumers live in towns (72% average in Europe), where they do not only demand sufficient and healthy food, but also public goods like clean water, and that the surrounding countryside is of great natural, aesthetical and recreational value.
Figure 29: Spatial dynamics of agriculture in the peri-urban
New technologies:production of energy crops e.g. precision farming
New markets: Horsification, nurseriesNew networks:Local markets, hobby farms, rural tourism, on-farm catering
New initiatives: urban agriculture (e.g. socially inclusive, intercultural, vertical) Adoption of innovation
Land consumption
Higher population density
Scarcity of environ-mental resources
Awareness for healthy regional food
Key driving forces
Increasing land prices and land rents
New markets, new creative ideas
Growing demand for ecosystem services
More organic farming, more specialization
Key impacts
Pressure from increasing land prices
Food and farming
Pressures on agriculture are high in peri-urban areas. As a re-sult, conflicts between farming and other land uses are more intense than elsewhere. On the other hand, particular oppor-tunities for sustainable agriculture emerge in this environ-ment – from the neighbourhood to the market.
Sour
ce: U
OM
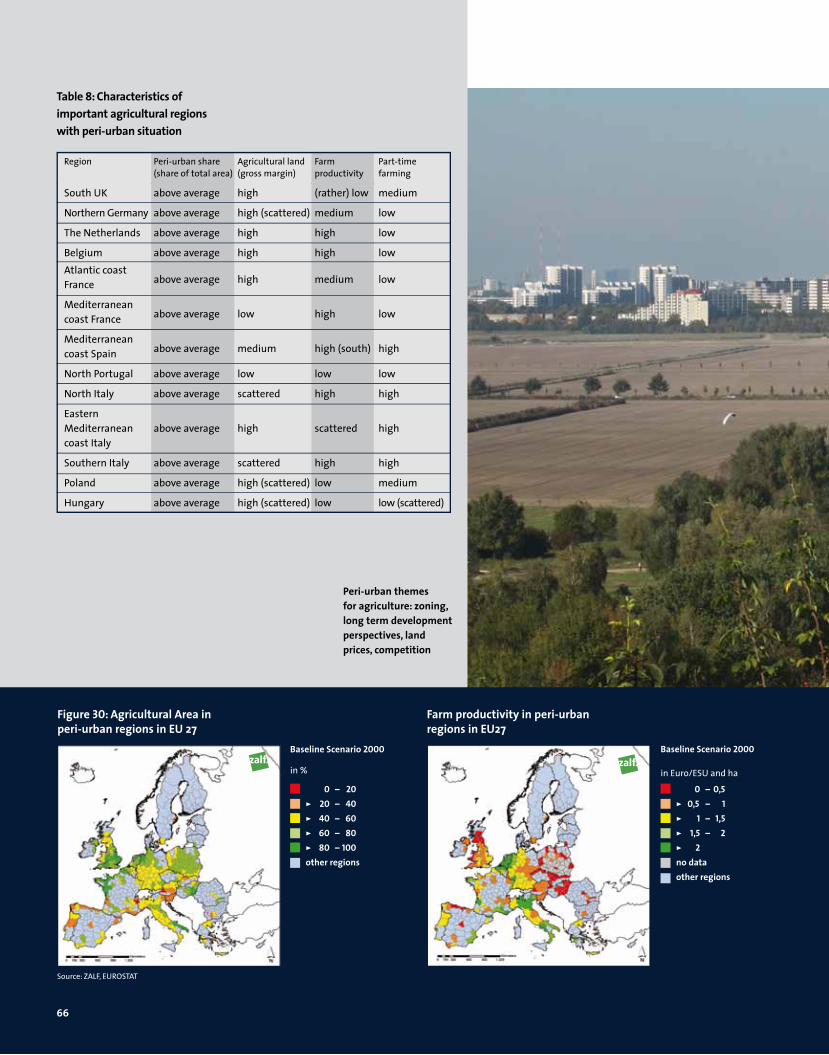
66
Table 8: Characteristics of important agricultural regions with peri-urban situation
Region Peri-urban share Agricultural land Farm Part-time (share of total area) (gross margin) productivity farming
South UK above average high (rather) low medium
Northern Germany above average high (scattered) medium low
The Netherlands above average high high low
Belgium above average high high low Atlantic coast France above average high medium low
Mediterranean coast France above average low high low
Mediterranean coast Spain above average medium high (south) high
North Portugal above average low low low
North Italy above average scattered high high
Eastern Mediterranean above average high scattered high coast Italy
Southern Italy above average scattered high high
Poland above average high (scattered) low medium
Hungary above average high (scattered) low low (scattered)
Source: ZALF, EUROSTAT
Figure 30: Agricultural Area in peri-urban regions in EU 27
Baseline Scenario 2000
in %
0 – 20> 20 – 40> 40 – 60> 60 – 80> 80 – 100other regions
Baseline Scenario 2000
in Euro/ESU and ha
0 – 0,5> 0,5 – 1> 1 – 1,5> 1,5 – 2> 2no dataother regions
Farm productivity in peri-urbanregions in EU27
Peri-urban themes for agriculture: zoning, long term development perspectives, land prices, competition
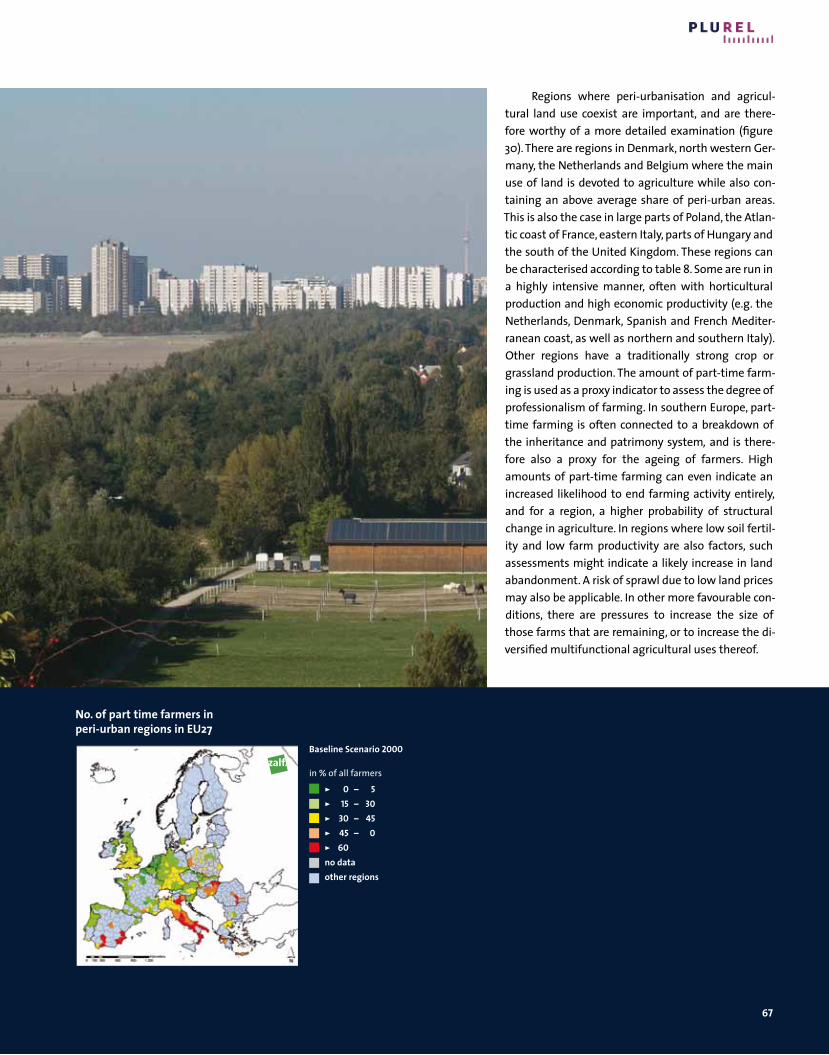
67
Regions where peri-urbanisation and agricul-tural land use coexist are important, and are there-fore worthy of a more detailed examination (figure 30). There are regions in Denmark, north western Ger-many, the Netherlands and Belgium where the main use of land is devoted to agriculture while also con-taining an above average share of peri-urban areas. This is also the case in large parts of Poland, the Atlan-tic coast of France, eastern Italy, parts of Hungary and the south of the United Kingdom. These regions can be characterised according to table 8. Some are run in a highly intensive manner, often with horticultural production and high economic productivity (e.g. the Netherlands, Denmark, Spanish and French Mediter-ranean coast, as well as northern and southern Italy). Other regions have a traditionally strong crop or grassland production. The amount of part-time farm-ing is used as a proxy indicator to assess the degree of professionalism of farming. In southern Europe, part-time farming is often connected to a breakdown of the inheritance and patrimony system, and is there-fore also a proxy for the ageing of farmers. High amounts of part-time farming can even indicate an increased likelihood to end farming activity entirely, and for a region, a higher probability of structural change in agriculture. In regions where low soil fertil-ity and low farm productivity are also factors, such assessments might indicate a likely increase in land abandonment. A risk of sprawl due to low land prices may also be applicable. In other more favourable con-ditions, there are pressures to increase the size of those farms that are remaining, or to increase the di-versified multifunctional agricultural uses thereof.
Baseline Scenario 2000
in % of all farmers
> 0 – 5> 15 – 30> 30 – 45> 45 – 0> 60 no dataother regions
No. of part time farmers in peri-urban regions in EU27
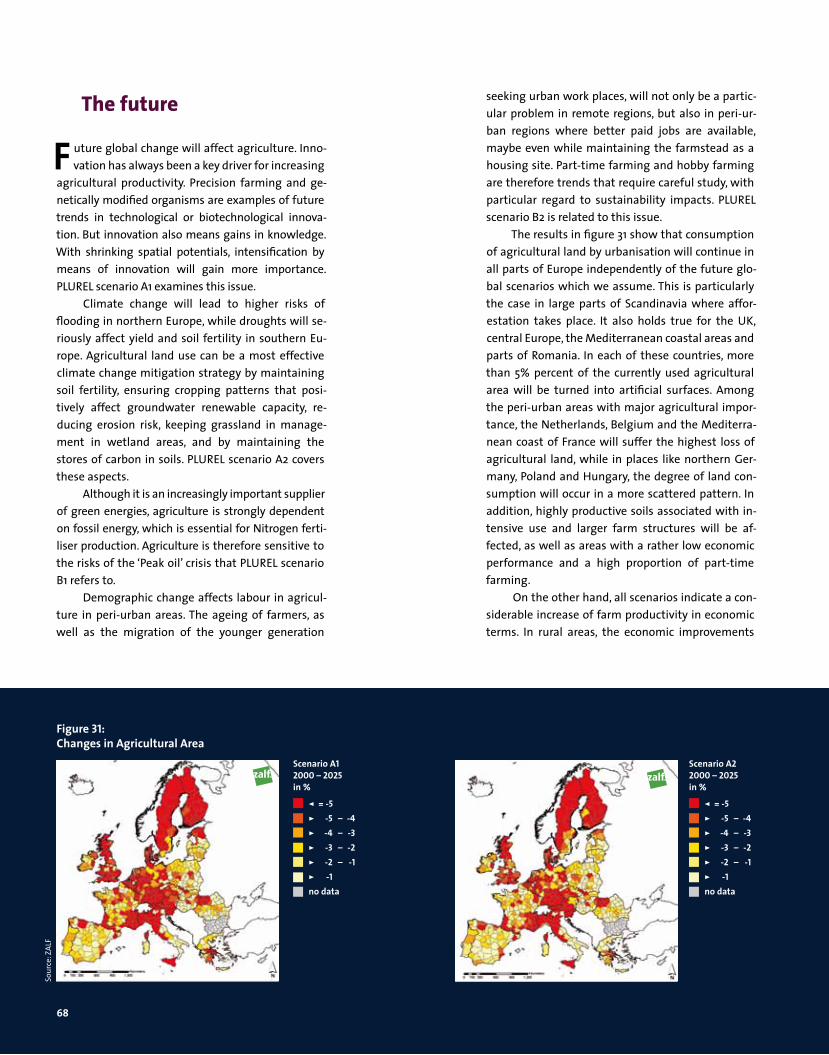
68
The future
F uture global change will affect agriculture. Inno-vation has always been a key driver for increasing
agricultural productivity. Precision farming and ge-netically modified organisms are examples of future trends in technological or biotechnological innova-tion. But innovation also means gains in knowledge. With shrinking spatial potentials, intensification by means of innovation will gain more importance. PLUREL scenario A1 examines this issue.
Climate change will lead to higher risks of flooding in northern Europe, while droughts will se-riously affect yield and soil fertility in southern Eu-rope. Agricultural land use can be a most effective climate change mitigation strategy by maintaining soil fertility, ensuring cropping patterns that posi-tively affect groundwater renewable capacity, re-ducing erosion risk, keeping grassland in manage-ment in wetland areas, and by maintaining the stores of carbon in soils. PLUREL scenario A2 covers these aspects.
Although it is an increasingly important supplier of green energies, agriculture is strongly dependent on fossil energy, which is essential for Nitrogen ferti-liser production. Agriculture is therefore sensitive to the risks of the ‘Peak oil’ crisis that PLUREL scenario B1 refers to.
Demographic change affects labour in agricul-ture in peri-urban areas. The ageing of farmers, as well as the migration of the younger generation
seeking urban work places, will not only be a partic-ular problem in remote regions, but also in peri-ur-ban regions where better paid jobs are available, maybe even while maintaining the farmstead as a housing site. Part-time farming and hobby farming are therefore trends that require careful study, with particular regard to sustainability impacts. PLUREL scenario B2 is related to this issue.
The results in figure 31 show that consumption of agricultural land by urbanisation will continue in all parts of Europe independently of the future glo-bal scenarios which we assume. This is particularly the case in large parts of Scandinavia where affor-estation takes place. It also holds true for the UK, central Europe, the Mediterranean coastal areas and parts of Romania. In each of these countries, more than 5% percent of the currently used agricultural area will be turned into artificial surfaces. Among the peri-urban areas with major agricultural impor-tance, the Netherlands, Belgium and the Mediterra-nean coast of France will suffer the highest loss of agricultural land, while in places like northern Ger-many, Poland and Hungary, the degree of land con-sumption will occur in a more scattered pattern. In addition, highly productive soils associated with in-tensive use and larger farm structures will be af-fected, as well as areas with a rather low economic performance and a high proportion of part-time farming.
On the other hand, all scenarios indicate a con-siderable increase of farm productivity in economic terms. In rural areas, the economic improvements
Figure 31: Changes in Agricultural Area
Scenario A1 2000 – 2025 in %
< = -5> -5 – -4> -4 – -3> -3 – -2> -2 – -1> -1no data
Scenario A2 2000 – 2025in %
< = -5> -5 – -4> -4 – -3> -3 – -2> -2 – -1> -1no data
Sour
ce: Z
ALF
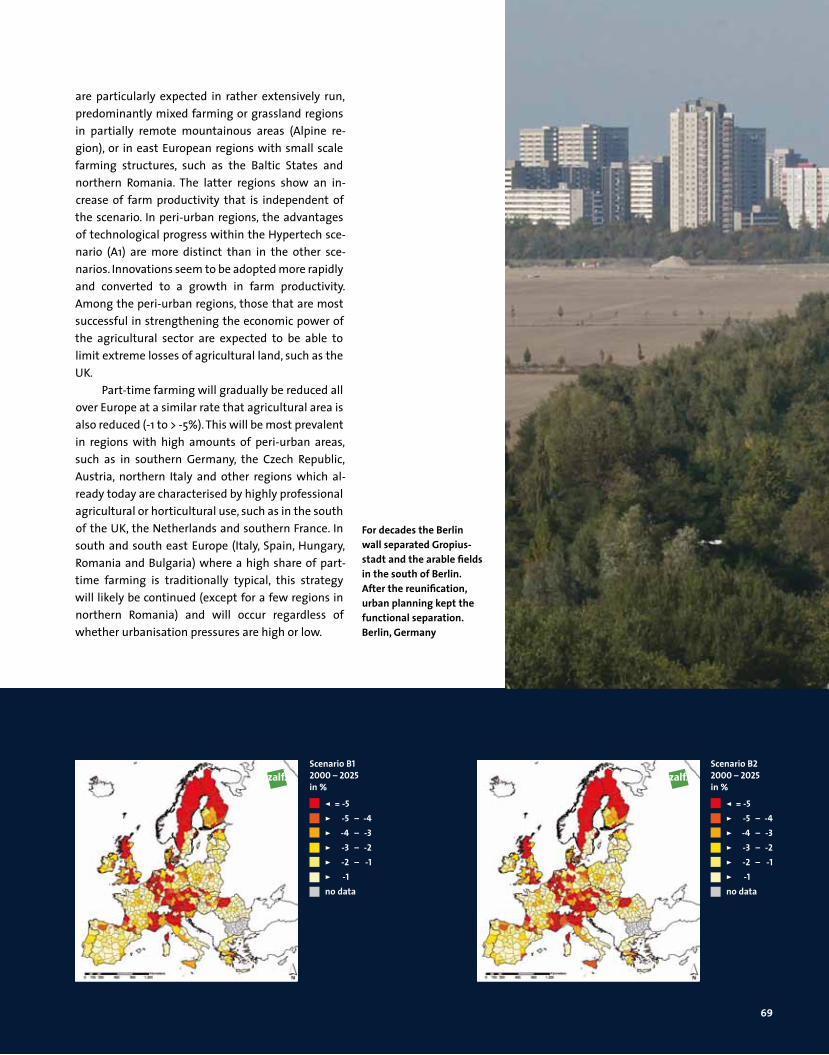
69
are particularly expected in rather extensively run, predominantly mixed farming or grassland regions in partially remote mountainous areas (Alpine re-gion), or in east European regions with small scale farming structures, such as the Baltic States and northern Romania. The latter regions show an in-crease of farm productivity that is independent of the scenario. In peri-urban regions, the advantages of technological progress within the Hypertech sce-nario (A1) are more distinct than in the other sce-narios. Innovations seem to be adopted more rapidly and converted to a growth in farm productivity. Among the peri-urban regions, those that are most successful in strengthening the economic power of the agricultural sector are expected to be able to limit extreme losses of agricultural land, such as the UK.
Part-time farming will gradually be reduced all over Europe at a similar rate that agricultural area is also reduced (-1 to > -5%). This will be most prevalent in regions with high amounts of peri-urban areas, such as in southern Germany, the Czech Republic, Austria, northern Italy and other regions which al-ready today are characterised by highly professional agricultural or horticultural use, such as in the south of the UK, the Netherlands and southern France. In south and south east Europe (Italy, Spain, Hungary, Romania and Bulgaria) where a high share of part-time farming is traditionally typical, this strategy will likely be continued (except for a few regions in northern Romania) and will occur regardless of whether urbanisation pressures are high or low.
Scenario B1 2000 – 2025in %
< = -5> -5 – -4> -4 – -3> -3 – -2> -2 – -1> -1no data
Scenario B2 2000 – 2025in %
< = -5> -5 – -4> -4 – -3> -3 – -2> -2 – -1> -1no data
For decades the Berlin wall separated Gropius-stadt and the arable fields in the south of Berlin. After the reunification, urban planning kept the functional separation. Berlin, Germany

70
Goals and objectives
P eri-urban regions do not only experience the sprawl of suburbs and malls. They are also the
space of creative multifunctional agriculture, as well as the area experiencing the highest urbanisation pressures on agriculture. The main problem relates to the loss of area through the conversion of land for settlement and infrastructure purposes. Land prices rise and long term planning security falls, for exam-ple, when it is measured in terms of land-rental con-tract duration. As a consequence, urbanisation influ-ences the structure of agricultural production even more. Farm sizes, the socio-economic situation of farms, and farm households change. Farms without successors become subject to part-time farming, hobby farming or otherwise disappear, as other farms grow and specialise (Zasada, 2011). Depending on natural yield expectation and urban-rural devel-opment conditions, the broad spectrum of adapta-tion processes will occur in aspects that relate to specialisation (e.g. horticulture, nurseries, horse keeping), extensification (organic farming), diversifi-cation (agrotourism) and land abandonment, with
negative impacts on the natural and recreational value of the region.
On the other hand, peri-urban areas offer par-ticular opportunities for agricultural land use. The entrepreneurial activities of farmers tend to stem from directly perceived societal demands and expec-tations, but also from new market opportunities that emerge in a creative urban environment. Exam-ples that can be found all over Europe are direct marketing at local food markets (especially for or-ganic food), new niche products, services (riding fa-cilities), community farming initiatives and new in-stitutional forms for nature conservation. Typically, they all have a high degree of social inclusion in common.
In recent years, creative green urban trends have explored agriculture and gardening as activi-ties where production, leisure, political action and community building merge into a fruitful and col-ourful mix. ‘Guerrilla gardening’, ‘transition agricul-ture’ and ‘nomadic green’ are the keywords of such movements.
Producer – consumer interaction: farmers plant market
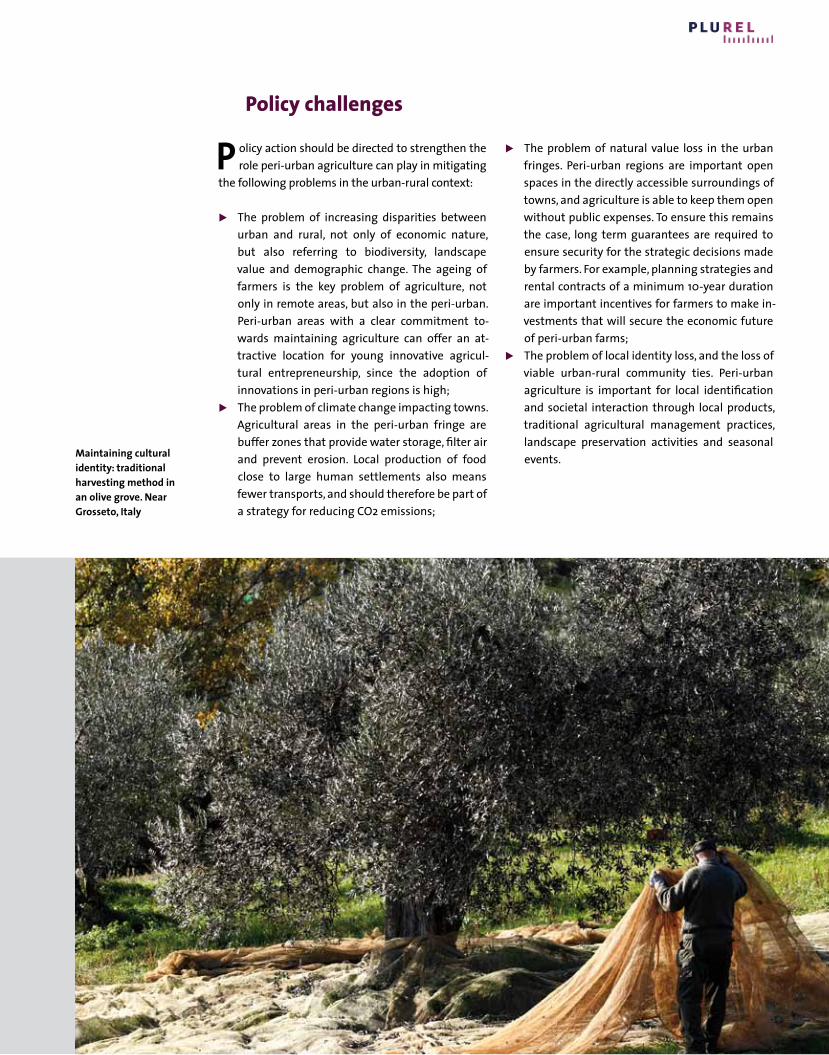
71
Policy challenges
P olicy action should be directed to strengthen the role peri-urban agriculture can play in mitigating
the following problems in the urban-rural context:
The problem of increasing disparities between urban and rural, not only of economic nature, but also referring to biodiversity, landscape value and demographic change. The ageing of farmers is the key problem of agriculture, not only in remote areas, but also in the peri-urban. Peri-urban areas with a clear commitment to-wards maintaining agriculture can offer an at-tractive location for young innovative agricul-tural entrepreneurship, since the adoption of innovations in peri-urban regions is high;
The problem of climate change impacting towns. Agricultural areas in the peri-urban fringe are buffer zones that provide water storage, filter air and prevent erosion. Local production of food close to large human settlements also means fewer transports, and should therefore be part of a strategy for reducing CO2 emissions;
The problem of natural value loss in the urban fringes. Peri-urban regions are important open spaces in the directly accessible surroundings of towns, and agriculture is able to keep them open without public expenses. To ensure this remains the case, long term guarantees are required to ensure security for the strategic decisions made by farmers. For example, planning strategies and rental contracts of a minimum 10-year duration are important incentives for farmers to make in-vestments that will secure the economic future of peri-urban farms;
The problem of local identity loss, and the loss of viable urban-rural community ties. Peri-urban agriculture is important for local identification and societal interaction through local products, traditional agricultural management practices, landscape preservation activities and seasonal events.Maintaining cultural
identity: traditional harvesting method in an olive grove. Near Grosseto, Italy
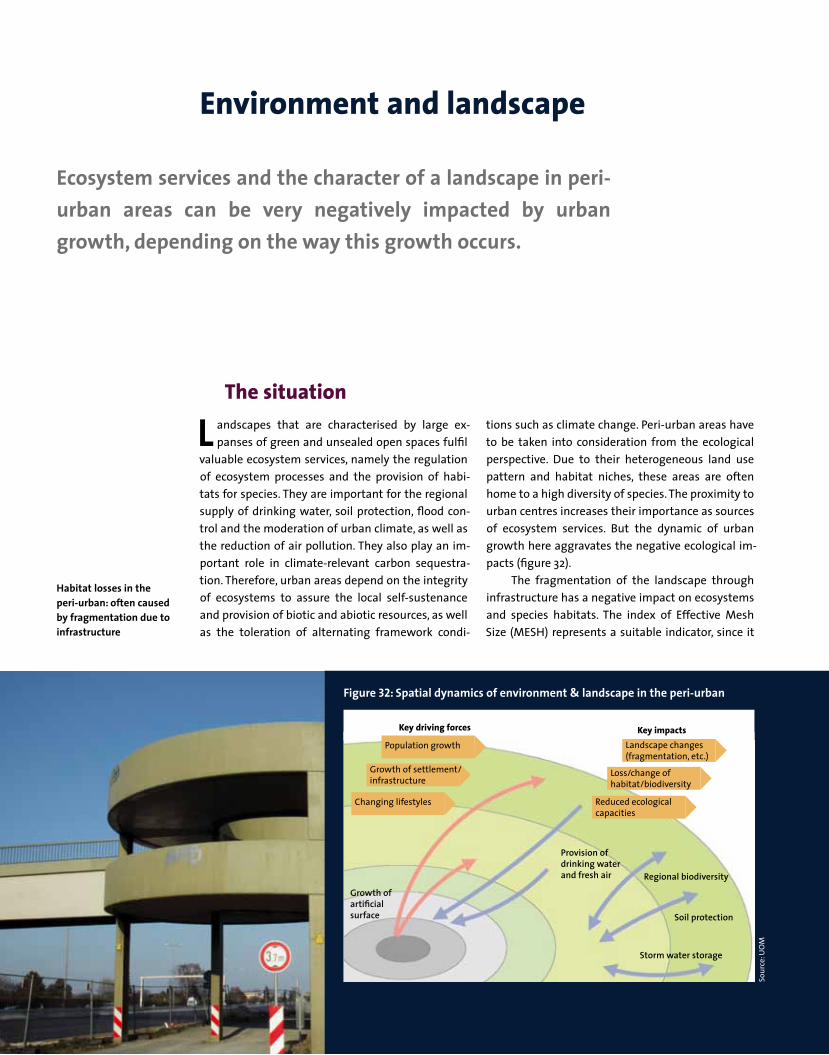
72
The situation
L andscapes that are characterised by large ex-panses of green and unsealed open spaces fulfil
valuable ecosystem services, namely the regulation of ecosystem processes and the provision of habi-tats for species. They are important for the regional supply of drinking water, soil protection, flood con-trol and the moderation of urban climate, as well as the reduction of air pollution. They also play an im-portant role in climate-relevant carbon sequestra-tion. Therefore, urban areas depend on the integrity of ecosystems to assure the local self-sustenance and provision of biotic and abiotic resources, as well as the toleration of alternating framework condi-
tions such as climate change. Peri-urban areas have to be taken into consideration from the ecological perspective. Due to their heterogeneous land use pattern and habitat niches, these areas are often home to a high diversity of species. The proximity to urban centres increases their importance as sources of ecosystem services. But the dynamic of urban growth here aggravates the negative ecological im-pacts (figure 32).
The fragmentation of the landscape through infrastructure has a negative impact on ecosystems and species habitats. The index of Effective Mesh Size (MESH) represents a suitable indicator, since it
Environment and landscape
Ecosystem services and the character of a landscape in peri-urban areas can be very negatively impacted by urban growth, depending on the way this growth occurs.
Soil protection
Storm water storage
Provision of drinking water and fresh air
Growth of artificial surface
Regional biodiversity
Population growth
Growth of settlement/ infrastructure
Changing lifestyles
Key driving forces
Landscape changes (fragmentation, etc.)
Loss/change of habitat/biodiversity
Reduced ecological capacities
Key impacts
Figure 32: Spatial dynamics of environment & landscape in the peri-urban
Sour
ce: U
OM
Habitat losses in the peri-urban: often caused by fragmentation due to infrastructure

73
indicates the probability of individuals meeting in a landscape fragmented by infrastructure and settle-ments. Figure 33 shows the situation for this index in the year 2000 within the EU-27. Not surprising, it is observed that the index is closely related to the de-gree of urbanisation, and also that mostly rural and remote regions possess comparably large and con-tinuing habitats. Fragmentation is concentrated in central western Europe, where only small patches of open landscapes remain. Low landscape fragmenta-tion, in contrast, cannot only be observed in regions with low population density, but also in large parts of northern, eastern and southern Europe.
Due to an economic requirement to increase ef-ficiency in production, farming and forestry, land use systems have become larger in size, and in so doing, have reduced the amount of marginal land. Further-more, urban growth (following a very similar pattern of sprawl) and ex-urban development have both contrib-uted to a shrinking diversity and homogenisation of landscapes. The landscape structure has been spatially analysed based on landscape metrics, which give valu-able insights in the intermixing, continuity and diver-sity of land cover at a landscape level, and has revealed that urbanisation contributes to a greater evenness and a reduced continuity of the landscape.
Figure 33: Landscape fragmentation (Effective Mesh Size)
Baseline Situation in 2000 in km2
> 0 – 250> 250 – 500> 500 – 750> 750 – 1000> 1000no data
Source: ZALF
Management of open landscapes providing important ecosystem services, such as water retention and reduction of flood risks. Elbe river. Germany

74
The future
A long with increasing welfare, changing life-style and consumption patterns, urban growth
is most likely to continue, especially in the conver-sion regions of south and central eastern Europe, where increasing pressure on ecological functioning of landscapes is causing soil compaction and the sealing, or disturbance, of soil horizons. Within ur-ban areas, the hydrological capacity of soils to re-ceive water from the surface is thus depleted, along with the ability to recharge groundwater and cope with extreme meteorological events. In the context of climate change, the effects of urban growth on ecological functions are aggravated. In urban areas, the ecological balancing capacity is limited to a few areas, such as housing green, street green or parks. Soil sealing differs between European regions as a result of varying urban development and design tra-ditions. In Germany, approximately half a city’s area is considered to be sealed. In southern and eastern European countries, urban areas are more densely built-up, leading to higher degrees of imperviousness.
Figure 34 proves a spatially differentiated pat-tern of the changes in landscape fragmentation due to urbanisation within the time span 2000 – 2025 in scenario A1. A remarkable decrease of Mesh size up to 40%, which indicates a strong increase of land-scape fragmentation and, accordingly, a deteriora-tion of ecological and habitat value, can be observed in parts of Denmark, Sweden, Ireland, the Polish Bal-
tic Sea coast, many regions of Spain and in Sicily. Characterised by their composition of individual
patches and structures of various land cover types, landscapes will undergo major alterations in terms of their diversity and continuity. With the European transportation infrastructure network expansion, open landscapes will become increasingly frag-mented (figure 35). Roads and rail tracks will trans-form the physical conditions on and adjacent to the landscapes, creating edge effects. Settlement struc-tures will also account for fragmentation effects. However, flows of matter, energy and species will be modified, while habitats are degraded and de-stroyed, which affects the abundance, composition and the diversity of species. A massive shrinkage of habitat sizes has to be expected in regions around metropolitan core areas.
Goals and objectives
W hen considering the assessed future land use conversion for urban purposes, the associ-
ated extension of the infrastructure network, and the transformation of the land use composition, it is inevitable that further reduction will occur in eco-logical regulation, balancing capacity and biodiver-sity. These development trajectories are additionally particularly aggravated in the face of climate change,
Figure 34: Changes in landscape fragmentation caused by urbanisation
Scenario A12000-2025 in %
< = -50> -50 – -40> -40 – -30> -30 – -20> -20 – -10> -10 – 0no data
Changes in the effective mesh size, an indicator for the size of connected undisturbed habitats (negative values indicate increase of fragmentation and risk of habitat loss)Source: ZALF
1000
800
600
400
200
200
0 40 60 80 100
Share of Artificial Surface in %
Effective Mesh Size(km2)
Figure 35: Landscape fragmentation response to urbanisation
Source: ZALF

75
with its impacts in many European regions like the Mediterranean basin. There is a clear necessity to understand and sensibilise to the consequences of urban growth and to implement strategies if not to reduce it, but at least to come up with solutions that will marginalise its negative effects. In the land-scape context, several development objectives can be drawn from this requirement.
Efficient use of space and resources. Resource ef-ficiency embraces smart growth, landscape management concepts and solutions of densifi-cation in urban areas without reducing local en-vironmental quality by reusing derelict urban land for urban development or renaturation.
Preservation of valuable ecosystems and the maintenance of their continuity and connectiv-ity. Three ways of achieving this are, firstly, to bundle transportation infrastructure, secondly, to concentrate in the urban area, and thirdly, to extend the flora-fauna-habitat network. Human disturbance and urban growth in ecologically valuable landscapes should be reduced to an unavoidable minimum.
Policy challenges European Policies: It is highly advisable to review
the impact of policies on ecological functioning in existing and implemented European policy action, such as the Trans-European Network of
infrastructure, or the European Cohesion and Structural policy. Since environmental and land-scape issues and regional responsibility do con-tinuingly require attention in European spatial policy, it is recommended to both strengthen this perspective and to raise awareness of land-scape impacts in European policy wherever it is related to spatial development.
The regional focus: It is also advisable to inte-grate and commence dialogue with local and regional landscape initiatives, authorities and NGOs to make use of the endogenous knowl-edge of the regional conditions. This supports a more regional perspective, which is then increas-ingly able to take the large regional variability of landscape into account. Secondly, by shifting the decision making capacity and responsibility to regional and local authorities, it is suggested that funding (of the likes provided via the Euro-pean Structural Funds) should be distributed to the lower administrative level. More generally, the economic perspective of ecological and land-scape topics requires reformation, since both topics suffer from monetary undervaluation. Fi-nancial investments are necessary to comply with European legislation and directives on envi-ronmental quality (e.g. FFH, air quality, nitrate balancing or water supply). Moreover, payments for ecosystem services through the second pillar of the Common Agricultural Policy, as well as other sources, need to be expanded.
Landscape fragmentation by railway
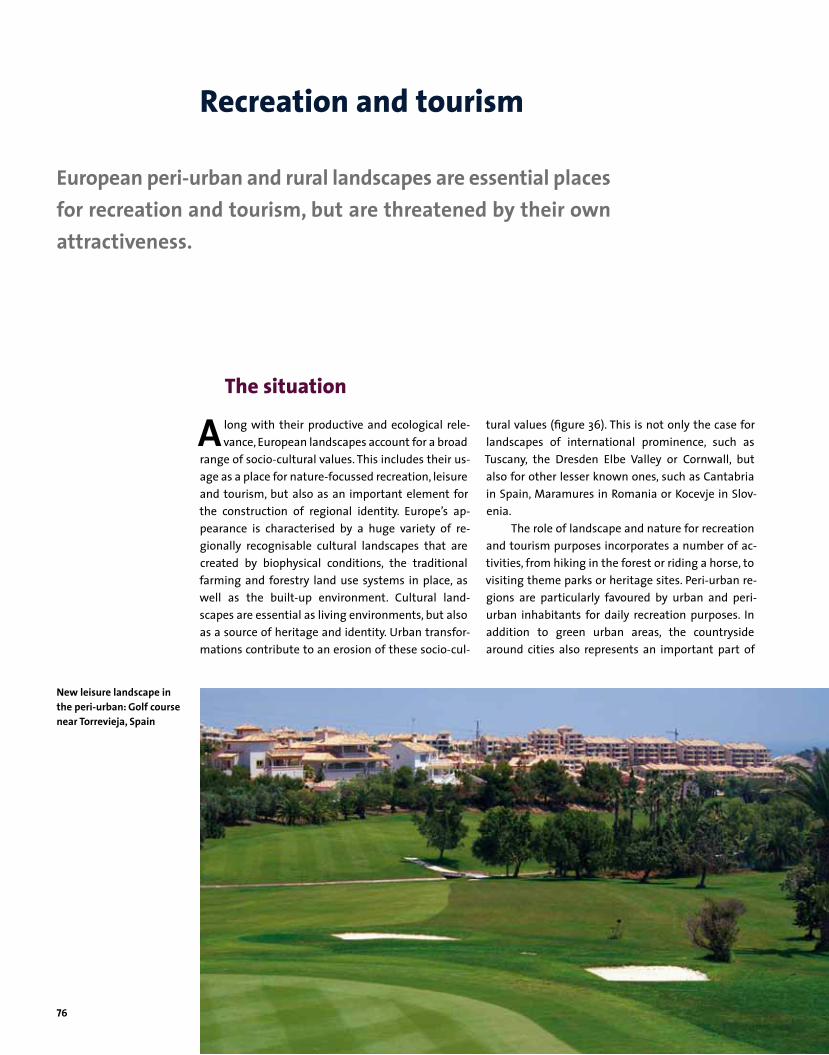
76
The situation
A long with their productive and ecological rele-vance, European landscapes account for a broad
range of socio-cultural values. This includes their us-age as a place for nature-focussed recreation, leisure and tourism, but also as an important element for the construction of regional identity. Europe’s ap-pearance is characterised by a huge variety of re-gionally recognisable cultural landscapes that are created by biophysical conditions, the traditional farming and forestry land use systems in place, as well as the built-up environment. Cultural land-scapes are essential as living environments, but also as a source of heritage and identity. Urban transfor-mations contribute to an erosion of these socio-cul-
tural values (figure 36). This is not only the case for landscapes of international prominence, such as Tuscany, the Dresden Elbe Valley or Cornwall, but also for other lesser known ones, such as Cantabria in Spain, Maramures in Romania or Kocevje in Slov-enia.
The role of landscape and nature for recreation and tourism purposes incorporates a number of ac-tivities, from hiking in the forest or riding a horse, to visiting theme parks or heritage sites. Peri-urban re-gions are particularly favoured by urban and peri-urban inhabitants for daily recreation purposes. In addition to green urban areas, the countryside around cities also represents an important part of
Recreation and tourism
European peri-urban and rural landscapes are essential places for recreation and tourism, but are threatened by their own attractiveness.
New leisure landscape in the peri-urban: Golf course near Torrevieja, Spain
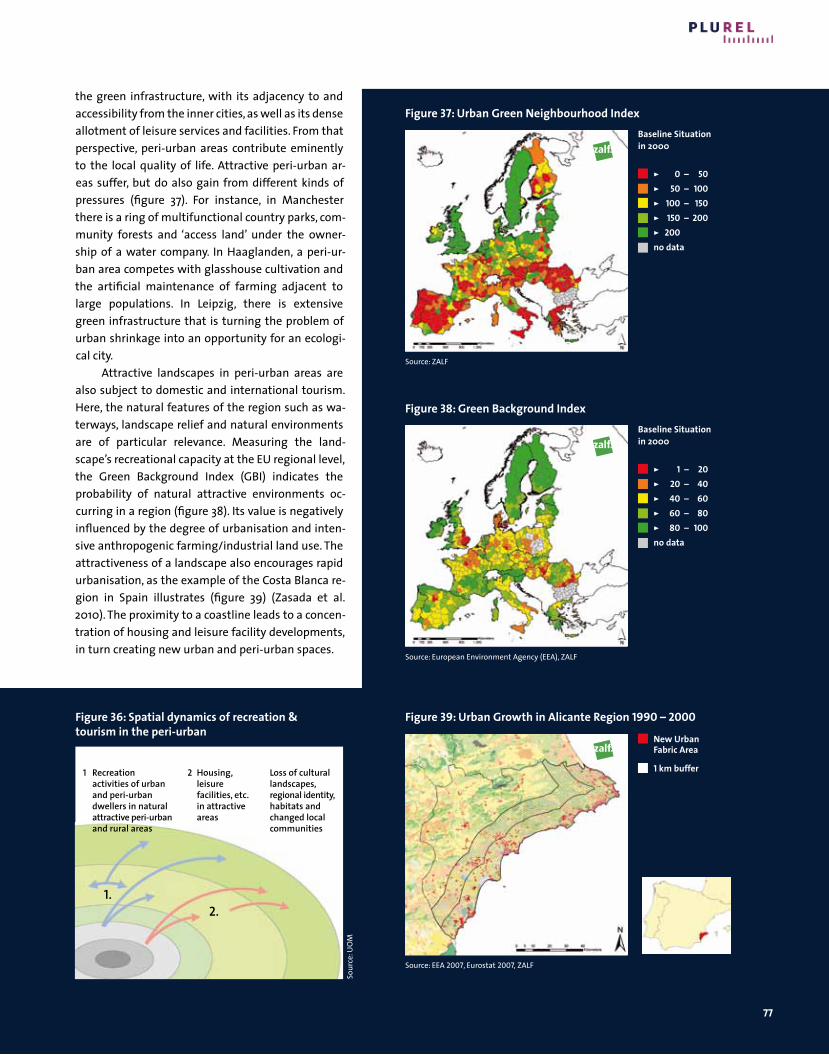
77
the green infrastructure, with its adjacency to and accessibility from the inner cities, as well as its dense allotment of leisure services and facilities. From that perspective, peri-urban areas contribute eminently to the local quality of life. Attractive peri-urban ar-eas suffer, but do also gain from different kinds of pressures (figure 37). For instance, in Manchester there is a ring of multifunctional country parks, com-munity forests and ‘access land’ under the owner-ship of a water company. In Haaglanden, a peri-ur-ban area competes with glasshouse cultivation and the artificial maintenance of farming adjacent to large populations. In Leipzig, there is extensive green infrastructure that is turning the problem of urban shrinkage into an opportunity for an ecologi-cal city.
Attractive landscapes in peri-urban areas are also subject to domestic and international tourism. Here, the natural features of the region such as wa-terways, landscape relief and natural environments are of particular relevance. Measuring the land-scape’s recreational capacity at the EU regional level, the Green Background Index (GBI) indicates the probability of natural attractive environments oc-curring in a region (figure 38). Its value is negatively influenced by the degree of urbanisation and inten-sive anthropogenic farming/industrial land use. The attractiveness of a landscape also encourages rapid urbanisation, as the example of the Costa Blanca re-gion in Spain illustrates (figure 39) (Zasada et al. 2010). The proximity to a coastline leads to a concen-tration of housing and leisure facility developments, in turn creating new urban and peri-urban spaces.
1 Recreation activities of urban and peri-urban dwellers in natural attractive peri-urban and rural areas
2 Housing, leisure facilities, etc. in attractive areas
Figure 36: Spatial dynamics of recreation & tourism in the peri-urban
Loss of cultural landscapes, regional identity, habitats and changed local communities
1.2.
Figure 37: Urban Green Neighbourhood IndexBaseline Situation in 2000
> 0 – 50> 50 – 100> 100 – 150> 150 – 200> 200 no data
Source: ZALF
Figure 38: Green Background IndexBaseline Situation in 2000
> 1 – 20> 20 – 40> 40 – 60> 60 – 80> 80 – 100no data
Source: European Environment Agency (EEA), ZALF
Figure 39: Urban Growth in Alicante Region 1990 – 2000
New Urban Fabric Area
1 km buffer
Source: EEA 2007, Eurostat 2007, ZALF
Sour
ce: U
OM

78
The future
A gricultural areas and natural habitats will tend to diminish in European peri-urban regions,
while the amount of sealed surface increases. This shows in a very clear manner the decreasing recrea-tional attractiveness associated with increasing ur-banisation. Nevertheless, higher incomes and demo-graphic change imply a higher need for recreation, as this is part of the supposed lifestyle of non-work-ing people, mainly of those in their retirement years.
If current economic, social and industry trends continue, tourism worldwide will grow at an aver-age rate of 4.1% a year (European Travel Commission, 2011; EEA, 2007). On the one hand, leisure and recrea-tion will become important drivers in land use change, urbanisation, economic development and social change, which can, for example, include the construction of golf courses, large indoor or semi-outdoor sport facilities and hotel complexes. On the other hand, the recreational capacity of cities and regions will be heavily affected by urbanisation as open space is lost through land conversion while transport emissions increase. Still further pressure is expected to be added to open spaces as the number of people rises. Urban sprawl and ex-urban develop-ment will continue to contribute to a shrinking di-
versity and homogenisation of landscapes. Both the appearance of cultural landscapes as well as the rec-reational capacity will be affected.
Goals and objectives To provide high quality and accessible open
spaces, which shall include the maintenance and development of the peri-urban green infrastruc-ture, the qualification and integration of peri-urban open spaces, and farmland or forests for urban recreation.
To provide suitable and accessible recreational open spaces for all kinds of social milieus – inde-pendent of their members’ age, income, ethnic-ity or educational background.
To develop sustainable tourism and the use of landscape amenities to encourage smart tourism, particularly in sensitive natural areas.
To preserve and develop cultural landscapes to conserve the cultural diversity and rural identity of European landscapes – not only of the rural ones, but also peri-urban and urban areas as re-quested by the European Landscape Convention.
Open space – space for recreation, outdoor activi-ties and cultural identity
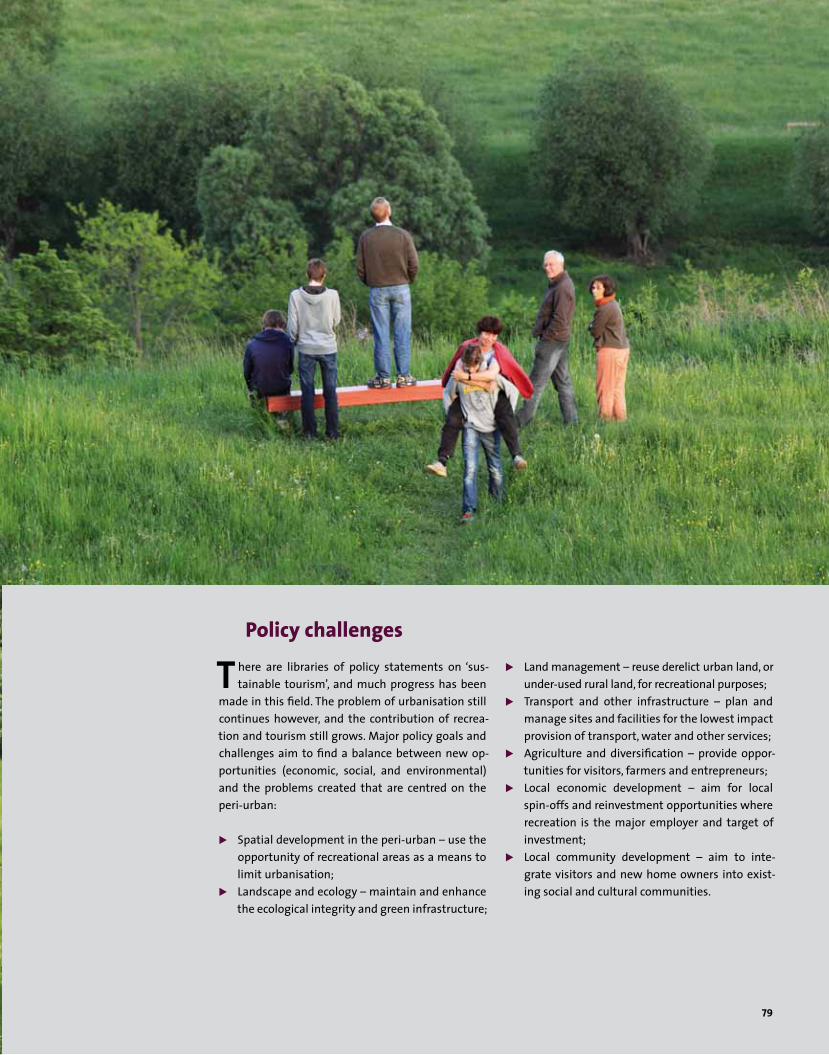
79
Policy challenges
T here are libraries of policy statements on ‘sus-tainable tourism’, and much progress has been
made in this field. The problem of urbanisation still continues however, and the contribution of recrea-tion and tourism still grows. Major policy goals and challenges aim to find a balance between new op-portunities (economic, social, and environmental) and the problems created that are centred on the peri-urban:
Spatial development in the peri-urban – use the opportunity of recreational areas as a means to limit urbanisation;
Landscape and ecology – maintain and enhance the ecological integrity and green infrastructure;
Land management – reuse derelict urban land, or under-used rural land, for recreational purposes;
Transport and other infrastructure – plan and manage sites and facilities for the lowest impact provision of transport, water and other services;
Agriculture and diversification – provide oppor-tunities for visitors, farmers and entrepreneurs;
Local economic development – aim for local spin-offs and reinvestment opportunities where recreation is the major employer and target of investment;
Local community development – aim to inte-grate visitors and new home owners into exist-ing social and cultural communities.

80
Managing Growth
T he public sector has strong role to play to en-sure sustainability in the rural-urban regions.
This chapter explores the various means to perform this role: through the formal government system and spatial planning policies; through financing and taxation systems and sectoral policies; with the help of regulatory tools; and finally by using informal governance type processes.
The analysis highlights the importance for ef-fective formal institutions, policies and regulations at the rural-urban region level, especially targeted at the peri-urban areas. Governance processes can be-come useful extensions, but cannot substitute for the non-performance of the formal institutions and policies in rural-urban regions.
The previous chapter gave an overview of how the different peri-urban agendas (economy and em-ployment, population and migration, housing and community, mobility and transport, food and farm-ing, environment and landscape, recreation and tourism) all relate to urban sprawl. Each of these agendas can be modified towards methods that could potentially constrain sprawl. Even so, the sus-tainable development of urban and rural areas is dif-ficult to achieve. The problem lies in the fact that the gains (returns) and the costs are not addressing the same actors. Moreover, the gains of sustainable de-
velopment are often abstract and lie in the future, while the costs are concrete, and are due in the present.
The sprawl of chaotic and uncoordinated ur-ban land use is the largest single threat to sustain-able peri-urban development. It can be character-ised by a conflict between private interests and common goods (values). This involves the striving of individuals for improved environmental quality and for low rise residential housing that can only be sat-isfied at the expense of public goods, such as high quality green areas and clean air. This situation, well known in game theory as the “Tragedy of the Com-mons” (Hardin, 1968), is one type of market problem that can only be handled by public interventions.
To ensure sustainability in the rural-urban re-gions – especially in the peri-urban areas – land use changes and new developments have to be controlled, managed, or in some way coordinated by the public sector. Various means of such control are analysed in this chapter: through the formal government system and spatial planning policies; through financing and taxation systems and sec-toral policies; with the help of regulatory tools; and finally, by using informal governance type proc-esses (the latter are discussed in more detail in the final chapter of this synthesis report).
This chapter analyses the role of the public sector to manage growth in peri-urban areas.
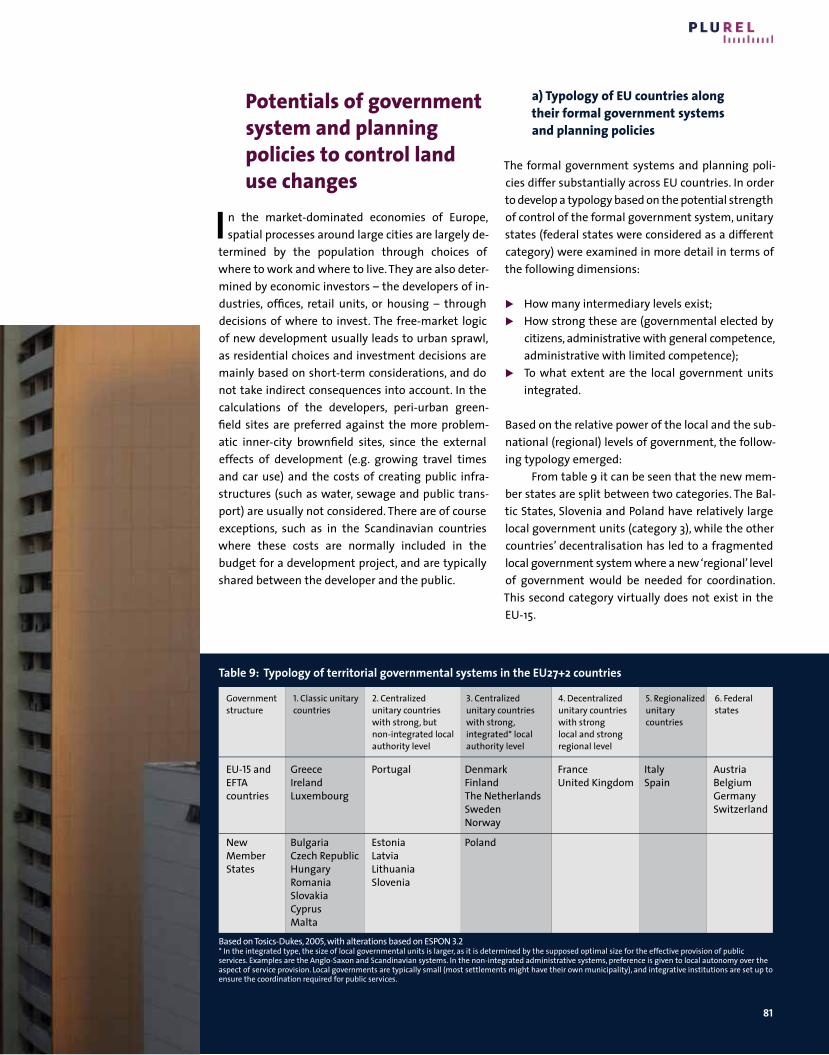
81
Potentials of government system and planning policies to control land use changes
I n the market-dominated economies of Europe, spatial processes around large cities are largely de-
termined by the population through choices of where to work and where to live. They are also deter-mined by economic investors – the developers of in-dustries, offices, retail units, or housing – through decisions of where to invest. The free-market logic of new development usually leads to urban sprawl, as residential choices and investment decisions are mainly based on short-term considerations, and do not take indirect consequences into account. In the calculations of the developers, peri-urban green-field sites are preferred against the more problem-atic inner-city brownfield sites, since the external effects of development (e.g. growing travel times and car use) and the costs of creating public infra-structures (such as water, sewage and public trans-port) are usually not considered. There are of course exceptions, such as in the Scandinavian countries where these costs are normally included in the budget for a development project, and are typically shared between the developer and the public.
a) Typology of EU countries along their formal government systems and planning policies
The formal government systems and planning poli-cies differ substantially across EU countries. In order to develop a typology based on the potential strength of control of the formal government system, unitary states (federal states were considered as a different category) were examined in more detail in terms of the following dimensions:
How many intermediary levels exist; How strong these are (governmental elected by
citizens, administrative with general competence, administrative with limited competence);
To what extent are the local government units integrated.
Based on the relative power of the local and the sub-national (regional) levels of government, the follow-ing typology emerged:
From table 9 it can be seen that the new mem-ber states are split between two categories. The Bal-tic States, Slovenia and Poland have relatively large local government units (category 3), while the other countries’ decentralisation has led to a fragmented local government system where a new ‘regional’ level of government would be needed for coordination. This second category virtually does not exist in the EU-15.
Table 9: Typology of territorial governmental systems in the EU27+2 countries
EU-15 and Greece Portugal Denmark France Italy Austria EFTA Ireland Finland United Kingdom Spain Belgium countries Luxembourg The Netherlands Germany Sweden Switzerland Norway
New Bulgaria Estonia Poland Member Czech Republic Latvia States Hungary Lithuania Romania Slovenia Slovakia Cyprus Malta
Based on Tosics-Dukes, 2005, with alterations based on ESPON 3.2* In the integrated type, the size of local governmental units is larger, as it is determined by the supposed optimal size for the effective provision of public services. Examples are the Anglo-Saxon and Scandinavian systems. In the non-integrated administrative systems, preference is given to local autonomy over the aspect of service provision. Local governments are typically small (most settlements might have their own municipality), and integrative institutions are set up to ensure the coordination required for public services.
Government structure
1. Classic unitary countries
2. Centralized unitary countries with strong, but non-integrated local authority level
3. Centralized unitary countries with strong, integrated* local authority level
4. Decentralized unitary countries with strong local and strong regional level
5. Regionalized unitary countries
6. Federal states
82
The typology has been used in PLUREL as a general framework for the further analysis of the govern-ment and planning dimensions. More detailed in-vestigations are performed in selected countries which cover all the categories of the typology.
b) Government and planning in the rural-urban regions
T he rural-urban regions cover large areas, gener-ally beyond the limits of the city and even the
functional urban area. Although different patterns can be found across European countries, usually no separate (supra-local level) administrative unit ex-ists for this area, which consists of many local gov-ernments. Under such circumstances, the public con-trol over the market processes in the peri-urban area can be ensured through special public administration arrangements (e.g. through the introduction or em-powerment of a metropolitan government structure or through the creation of compulsory associations of lower level administrative units) and/or through
planning policies that give control functions to higher level governments over the plans of the local govern-ments in the rural-urban region area.
The interplay of the government system and the overarching planning policies shows the potential of the public role to manage and control peri-urban de-velopment. This can range from no management and control (fragmented public administration and lais-sez faire planning policies) to the maximum potential for control (strong upper level government arrange-ments and strong planning control covering the rural-urban region).
Based on the results of country reports pre-pared in the PLUREL project, the countries under in-vestigation can be classified according to the two main dimensions of our analysis as follows (table 10).
According to table 11, the potential strength of public management and control over land use change (through the formal government system and planning policies) can be quantified in the fol-lowing way.
Table 10: Classification of countries according to the rural-urban region level systems
1 The 2007 reform abolished in Denmark the regional authorities, thus the country is on the way to move down in the hierarchy, towards less public control. The same applies to the United Kingdom, with regard to the 2010 termination of the Regional Development Agencies.2 While local governments in France are very fragmented, the Urban Communities cover most cities and their agglomerations.3 For Luxemburg and Malta the results may be misleading due to the small size of the country.
Strengths of control from supra-local levels of the planning system
Size of the most important supra-local level
(from land use change perspective)
Local level
(average size of local governments, ‘000 population)
Countries
C) strong, controlled spatial policies
Large (>1M) any -Medium-sized (0.5-1M) any Portugal
Small (<0.5M) any Cyprus, Greece, Lithuania
B) medium level of control
Large (>1M)
large (>30) Denmark1, The Netherlands, United Kingdom
Medium-sized (10-30) Belgium, France2, Germany
small (<10) Italy, Spain
Medium-sized (0.5-1M)
large (>30) Irelandmedium-sized (10-30)
small (<10) Austria
Small (<0.5M)
large (>30) Swedenmedium-sized (10-30) Finland
small (<10) Estonia, Latvia, Luxemburg, Malta3
A) weak level of control Any
large (>30) Bulgaria
medium-sized (10-30) Poland, Slovenia
small (<10) Czech Republic, Hungary, Romania, Slovakia

83
The rural-urban region level government and planning systems show the strongest potential pub-lic control over land use changes in the north west-ern European countries, mostly because of their con-solidated local government systems. On the other hand, southern European countries which show high potential, such as Cyprus, Greece or Portugal, have more fragmented local government systems, but stronger control by supra-local levels. Most new member states show a weak public control poten-tial, with the notable exception of Lithuania (where the tradition of strong planning is based on the presence of the former western Soviet planning in-stitutions) and Bulgaria (with a consolidated local government system).
The results indicate the strength of public con-trol in the different countries through the national government and planning systems. However, these values do not show the real strength of the public control over land use change, as in practice these powers can be implemented in different ways. Thus these values should only be seen as a potential re-sulting from the higher level government and plan-ning systems. Hypothetically, a weak potential con-trol is hard to overcome even if the willingness of the local partners is given, while a high potential may or may not be used entirely, depending on the intentions of the public bodies in power in the rural-urban region.
A more detailed analysis would highlight the developing complex multilevel governance and spa-tial planning practices. For example, in France the SCOT planning system ensures a relatively high level of public control. The UK practice was quite complex. The national government provided legal powers and guidance, the regional government coordinated and
allocated housing quotas and infrastructure, while the local government, in two tiers, made local ‘devel-opment frameworks’ and managed local decisions. This system is currently being altered.
Financial, regulatory and policy instruments for efficient publiccontrol over peri-urban development
T he formal government system and planning policies assign the framework and the potential
level of public management and control over market processes. Within this, the real strength of public control depends on specific factors influencing the motivations of the government actors towards the processes in the rural-urban region area:
The local government financing system (from where and according to which parameters the local governments receive their revenues, and what are the spatial consequences);
The taxation system (the different types of taxes local governments are allowed to levy, and the spatially relevant consequences of these taxes);
Sectoral (infrastructure, economic development, transport and housing) policies and subsidy sys-tems.
Among the regulatory tools, the public sector has to steer the land development process. The following deserve most attention:
Value Countries 7 - 6 Denmark, The Netherlands, Portugal, United Kingdom 5 Belgium, Cyprus, France, Germany, Greece, Ireland, Lithuania 4 Italy, Spain, Sweden 3 Austria, Bulgaria, Finland 2 Estonia, Latvia, Luxembourg, Malta, Poland, Slovenia 1 Czech Republic, Hungary, Romania, Slovakia
Table 11: Strength of rural-urban region level public control over land use changes
High density urban forms restrict further growth of city centres

84
Regulations applied on new land use changes and developments in general, such as sectoral requirements attached to permitting larger de-velopments (balance between jobs and homes, transport services, physical and social infrastruc-ture requirements) and financial regulations, such as taxes on green field investments and subsidies for brownfield redevelopment;
Rules applied in the case of concrete decisions on larger land developments. Possibilities for the
public sector to recapture some part of land value increase and require contribution from the private developer for infrastructure develop-ment when the rezoning of land is allowed, or at the moment when building permission has to be issued for the planned project.
The analysis of these factors requires more detailed investigations, which could only be performed for a limited number of countries (covering all categories
Table 12: Quantified answers by the regions
Haaglanden Manchester Montpellier Leipzig Koper Warsaw Thessaloniki Budapest Bologna
Financial transfer system 0.67 1.00 0.67 0.67 0.00 0.33 0.00 0.33 0.67 The local taxation system 0.67 0.67 0.67 0.33 1.00 0.67 0.67 0.33 1.00 Local government financing systems 0.67 0.83 0.67 0.50 0.50 0.50 0.33 0.33 0.83
Economic development and infrastructure 1.00 0.50 0.50 1.00 0.50 1.00 1.00 0.50 0.00
Transport 0.83 0.67 0.50 0.50 0.17 0.33 0.67 0.50 0.50 Housing 1.00 0.67 0.67 0.33 0.33 0.33 0.33 0.00 0.33 Sectoral policies 0.94 0.61 0.56 0.61 0.33 0.56 0.67 0.33 0.28 Tools to steer development 0.75 0.50 0.50 0.75 1.00 0.25 1.00 0.25 0.50
Central business district, The Hague, the Netherlands, a PLUREL case study
85
a high probability for a more effective level of control over peri-urban land use. Manchester, Montpellier, Leipzig and Bologna seem to be in a less favourable, but still manageable, situation.
Thessaloniki and Koper show a potentially strong hierarchical government and planning system, while the municipalities are strongly interested in expansion, which can lead to conflicts in the land use decisions. Warsaw and Budapest have a much weaker government and planning framework. These municipalities are interested in expanding urban land use, and most sectoral policies also lead in this direction. In these regions, the public control over land use does not seem to be efficient.
When comparing the results of the previous two analyses, a relatively strong connection can be seen be-tween the national and regional levels of analysis. In countries with weak institutional and planning sys-tems, the regions face financial and sectoral policies which usually create favourable conditions towards ur-ban sprawl. At the same time, local authorities in these regions (with the notable exception of Koper, Slovenia) have only very limited tools to control urban sprawl. Thus the public financial and sectoral policies are not able to counterbalance the deficiencies of the formal government system and planning framework, and all indicate the weakness of the public sector to control market processes, leading to urban sprawl.
On the other hand, regions in countries with high control potential show more diverse results. It
of the government typology) represented by the ad-ministrative regions. The information gained from selected regions through a questionnaire has been quantified, with the following results. Higher values mean less interest/motivation for urban sprawl and/or more public control over it (Table 12).
The results can be summarised and evaluated along the three main topics of analysis (the rows in bold) in the following way.
Regarding the local government financing sys-tem in some regions (Haaglanden, Manchester, Montpellier and Bologna), the system does not directly motivate the municipalities to increase their population. On the other hand, in other re-gions (Leipzig, Koper, Warsaw, Budapest and Thessaloniki) such motivations are created by the financing system.
Regarding sectoral policies, Haaglanden stands out, since very few of its analysed policies have a sprawl-oriented territorial impact.
Regarding the regulatory tools, in some regions (Koper, Thessaloniki, Haaglanden and Leipzig) the municipalities are equipped with a broad range of tools that they can use to steer private developments.
To summarise, in the case of Haaglanden, a strong po-tential control can be seen parallel to moderate mu-nicipal interests to increase population. This suggests
Connecting spaces, functions and people. Venice, Italy
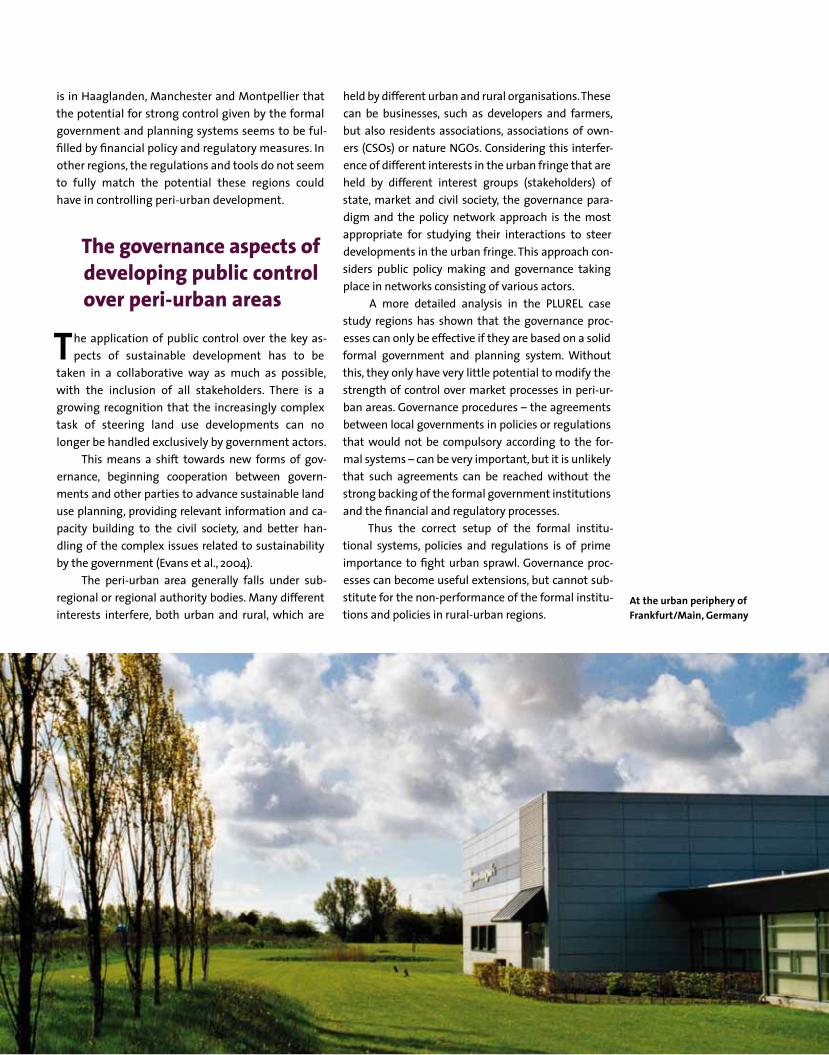
86
is in Haaglanden, Manchester and Montpellier that the potential for strong control given by the formal government and planning systems seems to be ful-filled by financial policy and regulatory measures. In other regions, the regulations and tools do not seem to fully match the potential these regions could have in controlling peri-urban development.
The governance aspects of developing public control over peri-urban areas
T he application of public control over the key as-pects of sustainable development has to be
taken in a collaborative way as much as possible, with the inclusion of all stakeholders. There is a growing recognition that the increasingly complex task of steering land use developments can no longer be handled exclusively by government actors.
This means a shift towards new forms of gov-ernance, beginning cooperation between govern-ments and other parties to advance sustainable land use planning, providing relevant information and ca-pacity building to the civil society, and better han-dling of the complex issues related to sustainability by the government (Evans et al., 2004).
The peri-urban area generally falls under sub-regional or regional authority bodies. Many different interests interfere, both urban and rural, which are
held by different urban and rural organisations. These can be businesses, such as developers and farmers, but also residents associations, associations of own-ers (CSOs) or nature NGOs. Considering this interfer-ence of different interests in the urban fringe that are held by different interest groups (stakeholders) of state, market and civil society, the governance para-digm and the policy network approach is the most appropriate for studying their interactions to steer developments in the urban fringe. This approach con-siders public policy making and governance taking place in networks consisting of various actors.
A more detailed analysis in the PLUREL case study regions has shown that the governance proc-esses can only be effective if they are based on a solid formal government and planning system. Without this, they only have very little potential to modify the strength of control over market processes in peri-ur-ban areas. Governance procedures – the agreements between local governments in policies or regulations that would not be compulsory according to the for-mal systems – can be very important, but it is unlikely that such agreements can be reached without the strong backing of the formal government institutions and the financial and regulatory processes.
Thus the correct setup of the formal institu-tional systems, policies and regulations is of prime importance to fight urban sprawl. Governance proc-esses can become useful extensions, but cannot sub-stitute for the non-performance of the formal institu-tions and policies in rural-urban regions.
At the urban periphery of Frankfurt/Main, Germany
87
Conclusions
T he results of the government and governance analysis underpin the hypothesis raised at the
end of the first section – that a weak level of poten-tial control by the formal government and planning systems over market processes is hard to overcome by regulations and policies (even if the willingness exists among the public actors) or by bottom-up governance policies. On the other hand, a high po-tential level for control by the formal systems may or may not be used entirely, depending on the inten-tions of the public bodies in power. In the case of a strong formal framework, the role of governance re-lationships might be larger to achieve changes to-wards more sustainable development.
The government and governance analysis ex-plored two extreme types of countries from the per-spective of public control over urban sprawl pro-cesses in peri-urban areas. On the one hand, there are a few countries (e.g. the Netherlands, France, UK and the Scandinavian countries) where the poten-tially strong control assured by the formal govern-ment system and planning policies over rural-urban region processes are underpinned by the regulatory tools and planning policies used in practice by re-gional and local governments. These countries have good chances to control peri-urban developments –
especially if informal governance agreements can also be reached among the partners.
The other extreme group consists mainly of the new EU member states from eastern central Europe, where the formal government system and planning policies are weak and do not allow sufficient control over the rural-urban region processes. In these coun-tries, neither the practically used regulatory tools and planning policies, nor governance processes can assure such a control. The public sector is therefore weak in all aspects to control peri-urban develop-ment. In these countries, the outcome can be accel-erating urban sprawl, depending on the specific market factors.
The government and governance analysis high-lighted the importance of effective formal institu-tions, policies and regulations at the rural-urban re-gion level, especially targeted at the peri-urban areas. The third chapter of this status report pro-poses some hypothetical models as to how the Eu-ropean level could contribute to the strengthening of these basic elements of the public control over peri-urban sprawl. European level initiatives would be important to achieve the integration of smart, sustainable and inclusive aspects of urban develop-ment, which is very much required to implement the EUROPE 2020 strategy (CEC2010a).
Socialist satellite town. Bratislava, Slovakia
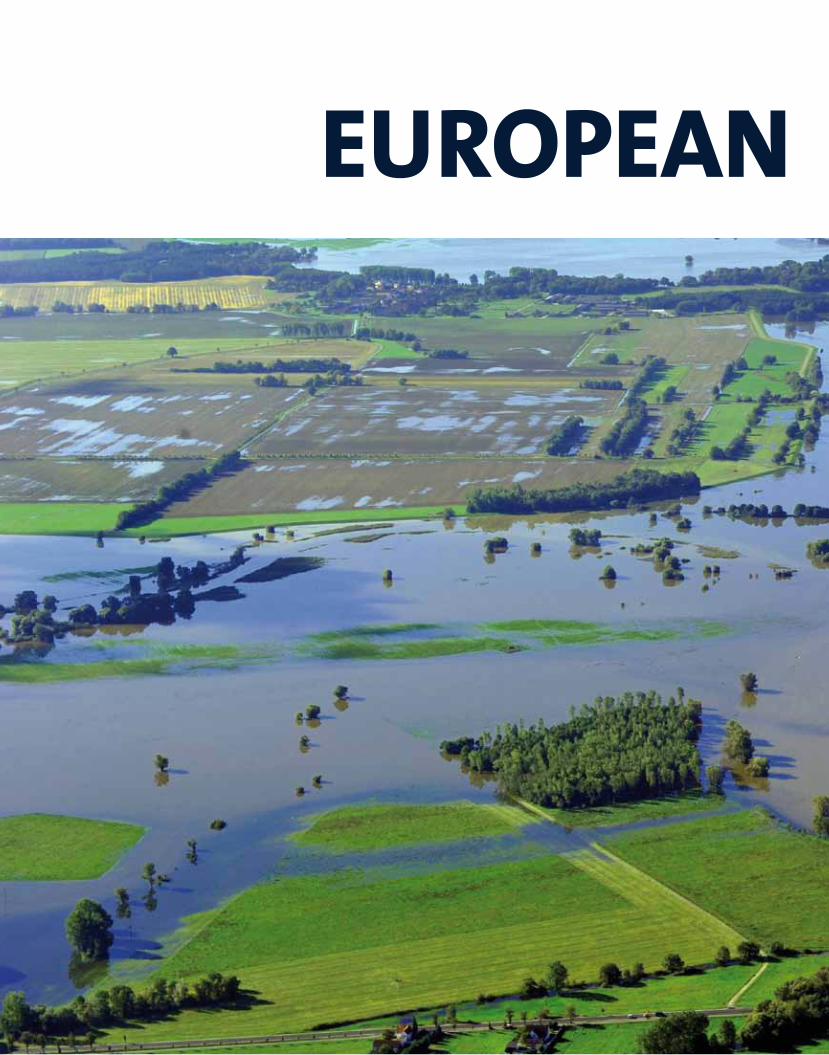
88
EUROPEAN

89
POLICY AGENDAS
90
Through an integrated approach, these programmes strengthen sustainable development of the regions and of the EU territory as a whole. The funding princi-ple builds on support of single projects with a strongly integrated character.
The European Fund for Regional Development (EFRD), the European Social Fund (ESF) and the Cohe-
Cohesion Policies
The targeting of territorial cohesion and regional policy pro-grammes involves taking more into account the urban-rural relationship and the specific role of peri-urban areas. PLUREL results underline the fact that within the territorial borders of eligibility regions, regional differences on a smaller scale are considerable.
T erritorial cohesion and regional policy seeks to reduce economic and social disparities within
the EU-27, and particularly addresses the less-fa-voured member states and regions. Tailored to the needs and potentials of the latter, programmes are co-financed by the Structural and Cohesion Funds, and support balanced growth and job creation.
What are the aims of Territorial Cohesion and regional policy?
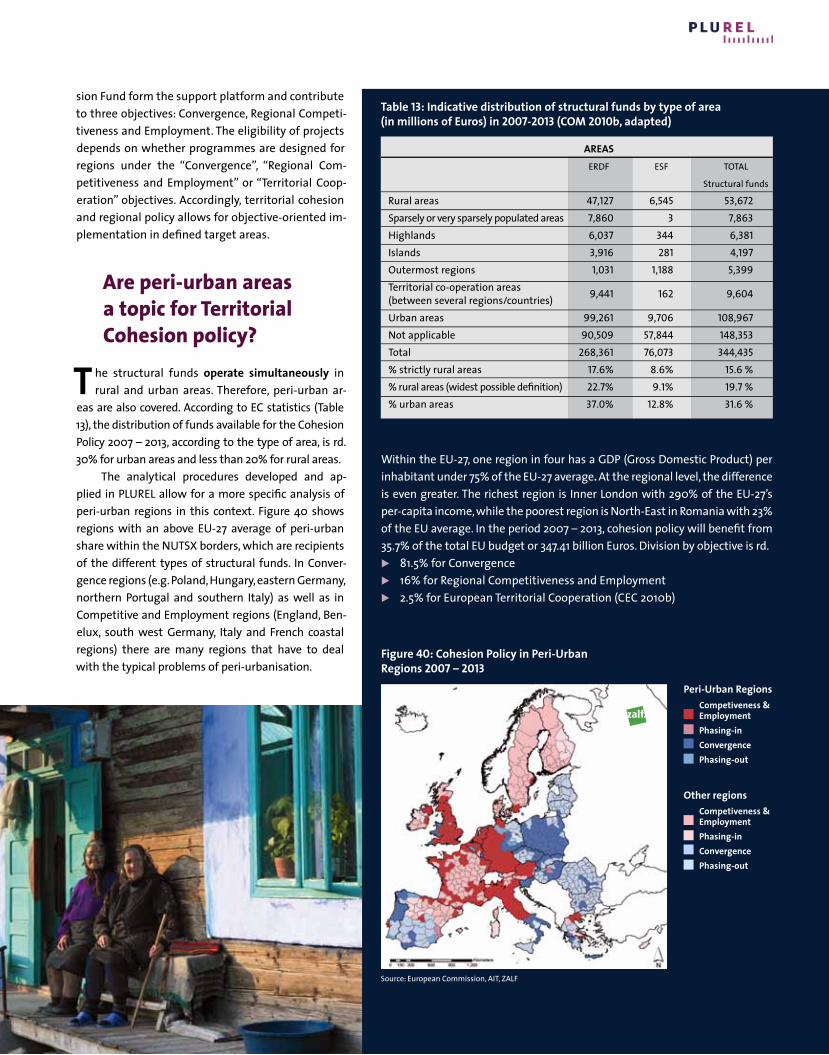
91
Table 13: Indicative distribution of structural funds by type of area (in millions of Euros) in 2007-2013 (COM 2010b, adapted)
AREAS ERDF ESF TOTAL
Structural funds
Rural areas 47,127 6,545 53,672 Sparsely or very sparsely populated areas 7,860 3 7,863 Highlands 6,037 344 6,381 Islands 3,916 281 4,197 Outermost regions 1,031 1,188 5,399 Territorial co-operation areas (between several regions/countries) 9,441 162 9,604
Urban areas 99,261 9,706 108,967 Not applicable 90,509 57,844 148,353 Total 268,361 76,073 344,435 % strictly rural areas 17.6% 8.6% 15.6 % % rural areas (widest possible definition) 22.7% 9.1% 19.7 % % urban areas 37.0% 12.8% 31.6 %
Figure 40: Cohesion Policy in Peri-Urban Regions 2007 – 2013
Peri-Urban RegionsCompetiveness & EmploymentPhasing-inConvergencePhasing-out
Other regionsCompetiveness & EmploymentPhasing-inConvergencePhasing-out
Source: European Commission, AIT, ZALF
sion Fund form the support platform and contribute to three objectives: Convergence, Regional Competi-tiveness and Employment. The eligibility of projects depends on whether programmes are designed for regions under the “Convergence”, “Regional Com-petitiveness and Employment” or “Territorial Coop-eration” objectives. Accordingly, territorial cohesion and regional policy allows for objective-oriented im-plementation in defined target areas.
Are peri-urban areas a topic for Territorial Cohesion policy?
T he structural funds operate simultaneously in rural and urban areas. Therefore, peri-urban ar-
eas are also covered. According to EC statistics (Table 13), the distribution of funds available for the Cohesion Policy 2007 – 2013, according to the type of area, is rd. 30% for urban areas and less than 20% for rural areas.
The analytical procedures developed and ap-plied in PLUREL allow for a more specific analysis of peri-urban regions in this context. Figure 40 shows regions with an above EU-27 average of peri-urban share within the NUTSX borders, which are recipients of the different types of structural funds. In Conver-gence regions (e.g. Poland, Hungary, eastern Germany, northern Portugal and southern Italy) as well as in Competitive and Employment regions (England, Ben-elux, south west Germany, Italy and French coastal regions) there are many regions that have to deal with the typical problems of peri-urbanisation.
Within the EU-27, one region in four has a GDP (Gross Domestic Product) per inhabitant under 75% of the EU-27 average. At the regional level, the difference is even greater. The richest region is Inner London with 290% of the EU-27’s per-capita income, while the poorest region is North-East in Romania with 23% of the EU average. In the period 2007 – 2013, cohesion policy will benefit from 35.7% of the total EU budget or 347.41 billion Euros. Division by objective is rd. 81.5% for Convergence 16% for Regional Competitiveness and Employment 2.5% for European Territorial Cooperation (CEC 2010b)
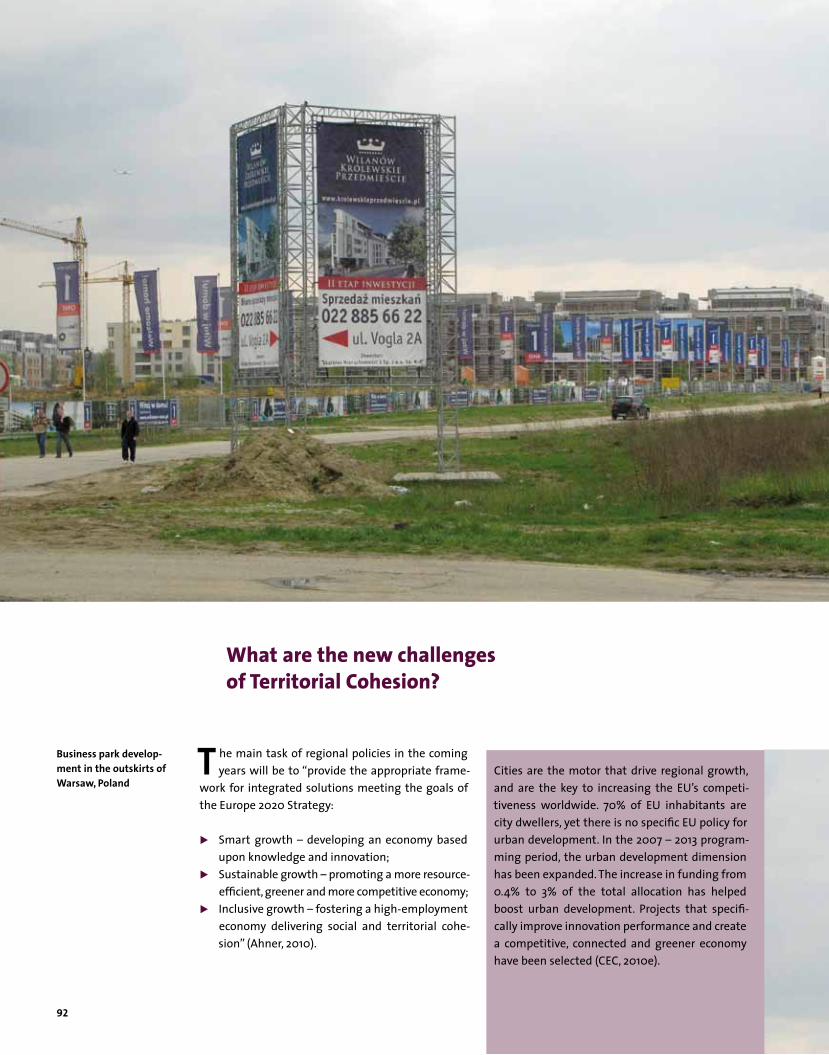
92
T he main task of regional policies in the coming years will be to “provide the appropriate frame-
work for integrated solutions meeting the goals of the Europe 2020 Strategy:
Smart growth – developing an economy based upon knowledge and innovation;
Sustainable growth – promoting a more resource-efficient, greener and more competitive economy;
Inclusive growth – fostering a high-employment economy delivering social and territorial cohe-sion” (Ahner, 2010).
Cities are the motor that drive regional growth, and are the key to increasing the EU’s competi-tiveness worldwide. 70% of EU inhabitants are city dwellers, yet there is no specific EU policy for urban development. In the 2007 – 2013 program-ming period, the urban development dimension has been expanded. The increase in funding from 0.4% to 3% of the total allocation has helped boost urban development. Projects that specifi-cally improve innovation performance and create a competitive, connected and greener economy have been selected (CEC, 2010e).
What are the new challenges of Territorial Cohesion?
Business park develop-ment in the outskirts of Warsaw, Poland
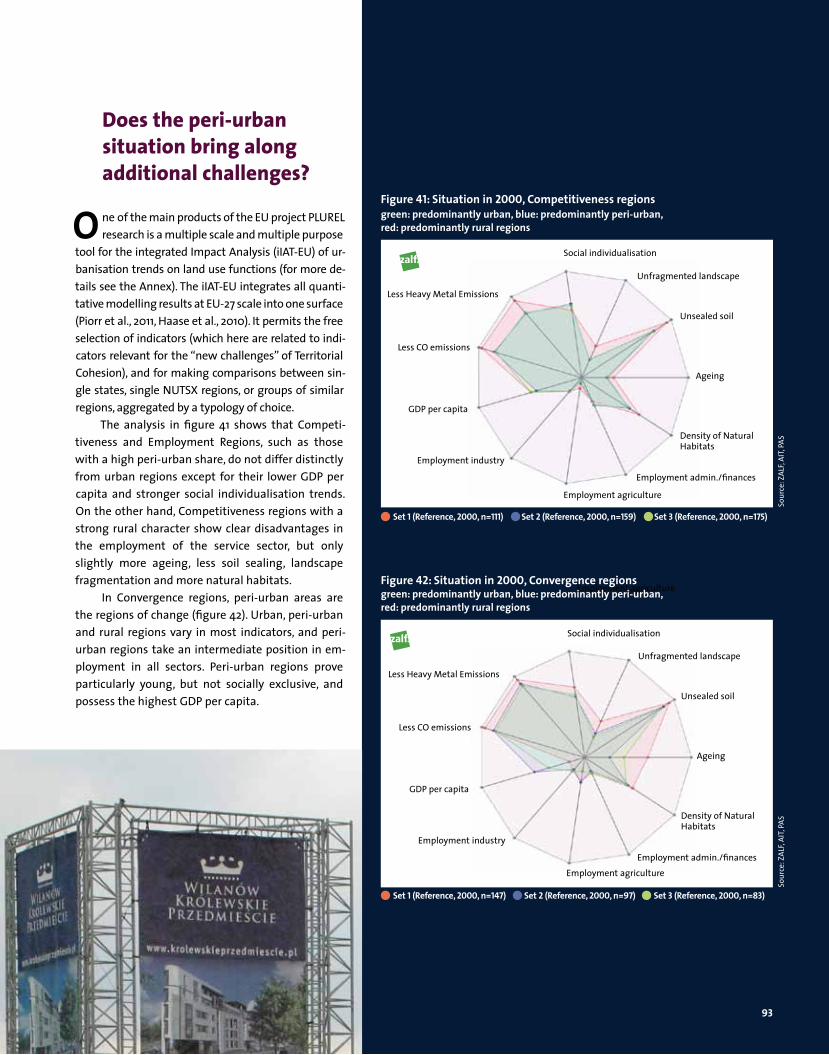
93
Does the peri-urban situation bring along additional challenges?
O ne of the main products of the EU project PLUREL research is a multiple scale and multiple purpose
tool for the integrated Impact Analysis (iIAT-EU) of ur-banisation trends on land use functions (for more de-tails see the Annex). The iIAT-EU integrates all quanti-tative modelling results at EU-27 scale into one surface (Piorr et al., 2011, Haase et al., 2010). It permits the free selection of indicators (which here are related to indi-cators relevant for the “new challenges” of Territorial Cohesion), and for making comparisons between sin-gle states, single NUTSX regions, or groups of similar regions, aggregated by a typology of choice.
The analysis in figure 41 shows that Competi-tiveness and Employment Regions, such as those with a high peri-urban share, do not differ distinctly from urban regions except for their lower GDP per capita and stronger social individualisation trends. On the other hand, Competitiveness regions with a strong rural character show clear disadvantages in the employment of the service sector, but only slightly more ageing, less soil sealing, landscape fragmentation and more natural habitats.
In Convergence regions, peri-urban areas are the regions of change (figure 42). Urban, peri-urban and rural regions vary in most indicators, and peri-urban regions take an intermediate position in em-ployment in all sectors. Peri-urban regions prove particularly young, but not socially exclusive, and possess the highest GDP per capita.
Employment agriculture
Social individualisationSource: ZALF
Unfragmented landscape
Unsealed soil
Ageing
Density of Natural Habitats
Employment admin./finances
Employment industry
GDP per capita
Less CO emissions
Less Heavy Metal Emissions
Set 1 (Reference, 2000, n=111) Set 2 (Reference, 2000, n=159) Set 3 (Reference, 2000, n=175)
Figure 41: Situation in 2000, Competitiveness regionsgreen: predominantly urban, blue: predominantly peri-urban, red: predominantly rural regions
Social individualisation
Unfragmented landscape
Unsealed soil
Ageing
Density of Natural Habitats
Employment admin./financesEmployment agriculture
Employment industry
GDP per capita
Less CO emissions
Less Heavy Metal Emissions
Set 1 (Reference, 2000, n=147) Set 2 (Reference, 2000, n=97) Set 3 (Reference, 2000, n=83)
Figure 42: Situation in 2000, Convergence regionsgreen: predominantly urban, blue: predominantly peri-urban, red: predominantly rural regions
Sour
ce: Z
ALF,
AIT,
PAS
Sour
ce: Z
ALF,
AIT,
PAS
Social individualisation
Social individualisation
Employment agriculture
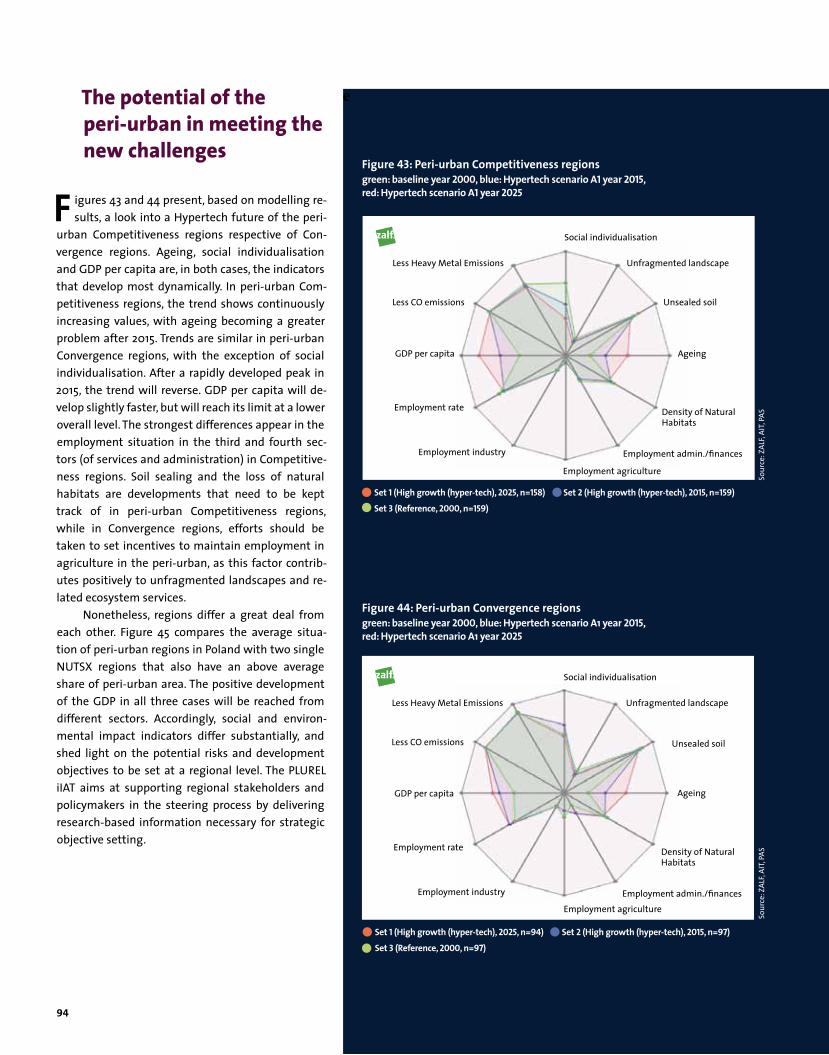
94
eThe potential of the peri-urban in meeting the new challenges
F igures 43 and 44 present, based on modelling re-sults, a look into a Hypertech future of the peri-
urban Competitiveness regions respective of Con-vergence regions. Ageing, social individualisation and GDP per capita are, in both cases, the indicators that develop most dynamically. In peri-urban Com-petitiveness regions, the trend shows continuously increasing values, with ageing becoming a greater problem after 2015. Trends are similar in peri-urban Convergence regions, with the exception of social individualisation. After a rapidly developed peak in 2015, the trend will reverse. GDP per capita will de-velop slightly faster, but will reach its limit at a lower overall level. The strongest differences appear in the employment situation in the third and fourth sec-tors (of services and administration) in Competitive-ness regions. Soil sealing and the loss of natural habitats are developments that need to be kept track of in peri-urban Competitiveness regions, while in Convergence regions, efforts should be taken to set incentives to maintain employment in agriculture in the peri-urban, as this factor contrib-utes positively to unfragmented landscapes and re-lated ecosystem services.
Nonetheless, regions differ a great deal from each other. Figure 45 compares the average situa-tion of peri-urban regions in Poland with two single NUTSX regions that also have an above average share of peri-urban area. The positive development of the GDP in all three cases will be reached from different sectors. Accordingly, social and environ-mental impact indicators differ substantially, and shed light on the potential risks and development objectives to be set at a regional level. The PLUREL iIAT aims at supporting regional stakeholders and policymakers in the steering process by delivering research-based information necessary for strategic objective setting.
Employment agriculture
Unfragmented landscape
Unsealed soil
Ageing
Density of Natural Habitats
Employment admin./finances
Social individualisation
Employment industry
Employment rate
GDP per capita
Less CO emissions
Less Heavy Metal Emissions
Set 1 (High growth (hyper-tech), 2025, n=158) Set 2 (High growth (hyper-tech), 2015, n=159)
Set 3 (Reference, 2000, n=159)
Figure 43: Peri-urban Competitiveness regionsgreen: baseline year 2000, blue: Hypertech scenario A1 year 2015, red: Hypertech scenario A1 year 2025
Unsealed soil
Aging
Unfragmented landscape
Density of Natural Habitats
Employment admin./financesEmployment agriculture
Social individualisation
Employment industry
Employment rate
GDP per capita
Less CO emissions
Less Heavy Metal Emissions
Set 1 (High growth (hyper-tech), 2025, n=94) Set 2 (High growth (hyper-tech), 2015, n=97)
Set 3 (Reference, 2000, n=97)
Figure 44: Peri-urban Convergence regionsgreen: baseline year 2000, blue: Hypertech scenario A1 year 2015, red: Hypertech scenario A1 year 2025
Sour
ce: Z
ALF,
AIT,
PAS
Sour
ce: Z
ALF,
AIT,
PAS
Ageing
Unsealed soil
Employment agriculture
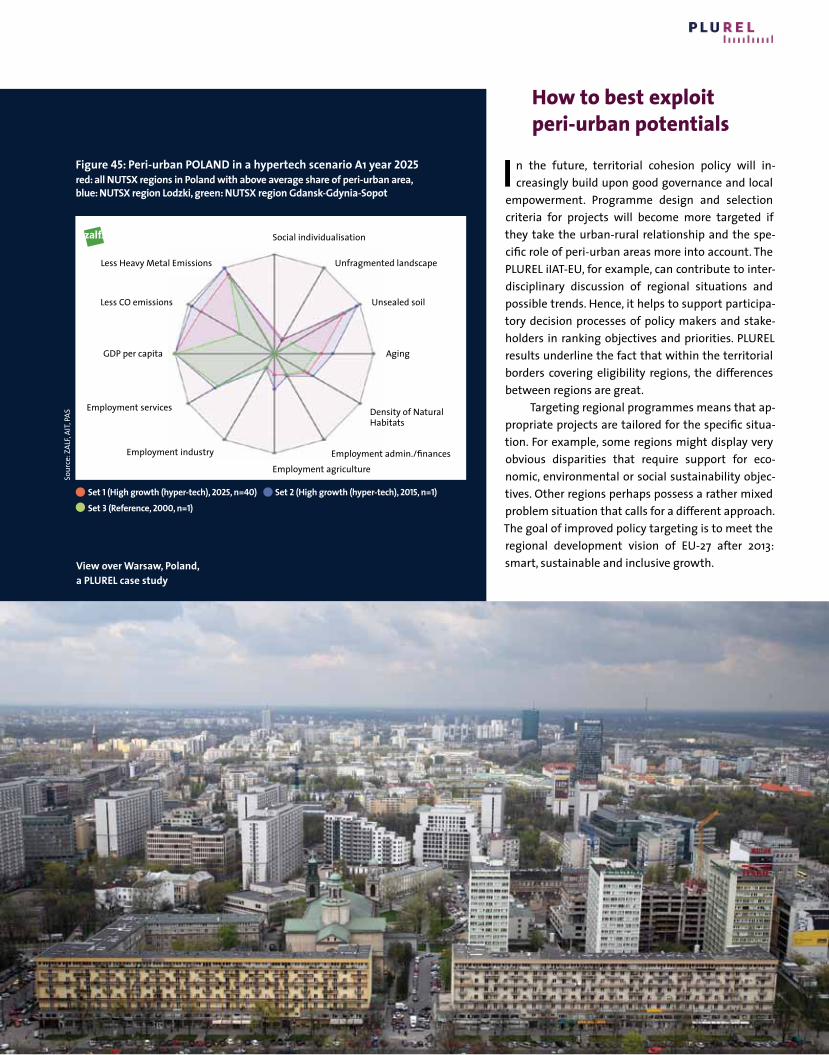
95
How to best exploit peri-urban potentials
I n the future, territorial cohesion policy will in-creasingly build upon good governance and local
empowerment. Programme design and selection criteria for projects will become more targeted if they take the urban-rural relationship and the spe-cific role of peri-urban areas more into account. The PLUREL iIAT-EU, for example, can contribute to inter-disciplinary discussion of regional situations and possible trends. Hence, it helps to support participa-tory decision processes of policy makers and stake-holders in ranking objectives and priorities. PLUREL results underline the fact that within the territorial borders covering eligibility regions, the differences between regions are great.
Targeting regional programmes means that ap-propriate projects are tailored for the specific situa-tion. For example, some regions might display very obvious disparities that require support for eco-nomic, environmental or social sustainability objec-tives. Other regions perhaps possess a rather mixed problem situation that calls for a different approach. The goal of improved policy targeting is to meet the regional development vision of EU-27 after 2013: smart, sustainable and inclusive growth.
Unfragmented landscape
Unsealed soil
Aging
Density of Natural Habitats
Employment admin./financesEmployment agriculture
Social individualisation
Employment industry
Employment services
GDP per capita
Less CO emissions
Less Heavy Metal Emissions
Figure 45: Peri-urban POLAND in a hypertech scenario A1 year 2025red: all NUTSX regions in Poland with above average share of peri-urban area, blue: NUTSX region Lodzki, green: NUTSX region Gdansk-Gdynia-Sopot
Set 1 (High growth (hyper-tech), 2025, n=40) Set 2 (High growth (hyper-tech), 2015, n=1)
Set 3 (Reference, 2000, n=1)
Sour
ce: Z
ALF,
AIT,
PAS
View over Warsaw, Poland, a PLUREL case study
96
What are the aims of the Common Agricultural Policy (CAP)?
O n average, more than 20% of the income of Eu-ropean farmers comes from payments received
from the EU. The existing Common Agricultural Pol-icy (CAP) provides a package of measures and poli-cies divided into three main types: market expendi-ture, direct aids and rural development. For decades, the CAP had been mainly oriented towards market support, and expended direct payments for in-creased market production. Also in the future, direct support (the first pillar of the CAP) will provide a rea-sonable level of income for farmers facing volatile market conditions or disasters. With improved tech-nologies, environmental awareness and changed consumer demands, the CAP has been decoupling payments from production since 2003, and aims for the stronger support of Rural Development (RD) measures (the second pillar of the CAP). A general trend towards extensification of agriculture is the result. This trend should be particularly strength-ened in areas of high environmental, landscape and recreational value, while in prime agricultural areas, the CAP should seek to set incentives for developing farms towards better competitiveness on global markets. The respective policy instruments of the
CAP are the Rural Development (RD) Programmes, funded by the European Agricultural Fund for Rural Development (EAFRD) for the period 2007 – 2013. Member states are free to distribute the funds within certain budget shares to four thematic axes that support those measures that best reinforce the development objectives of their region. These in-clude measures to improve competitiveness, agri-environmental measures, diversification measures, and LEADER. The rationale is to best exploit the po-tentials of target groups and target regions.
Figures on the CAPThe average proportion of EU payments and na-tional aid in total farm receipts stood at 16% for EU-25 in 2006 (CEC 2009a). Rural Development (RD) support in the EU-25 corresponds on average Euro 61/ha (EU and national part). The total direct support received by RD recipients corresponds to 60% of their Farm Net Value Added (FNVA). In comparison, the direct support received by non-recipients is only 26% of their FNVA (CEC 2009b).
Agricultural and Rural Development Policies
If key steps are taken, future CAP has the potential to replace the sprawl of artificial surfaces from the peri-urban into rural land areas with diversity of technical, social and environmen-tal innovation. In addition, greater biodiversity protection and resilience in resource-use can be achieved based on pow-erful urban-rural cooperation tailored to regional demands.
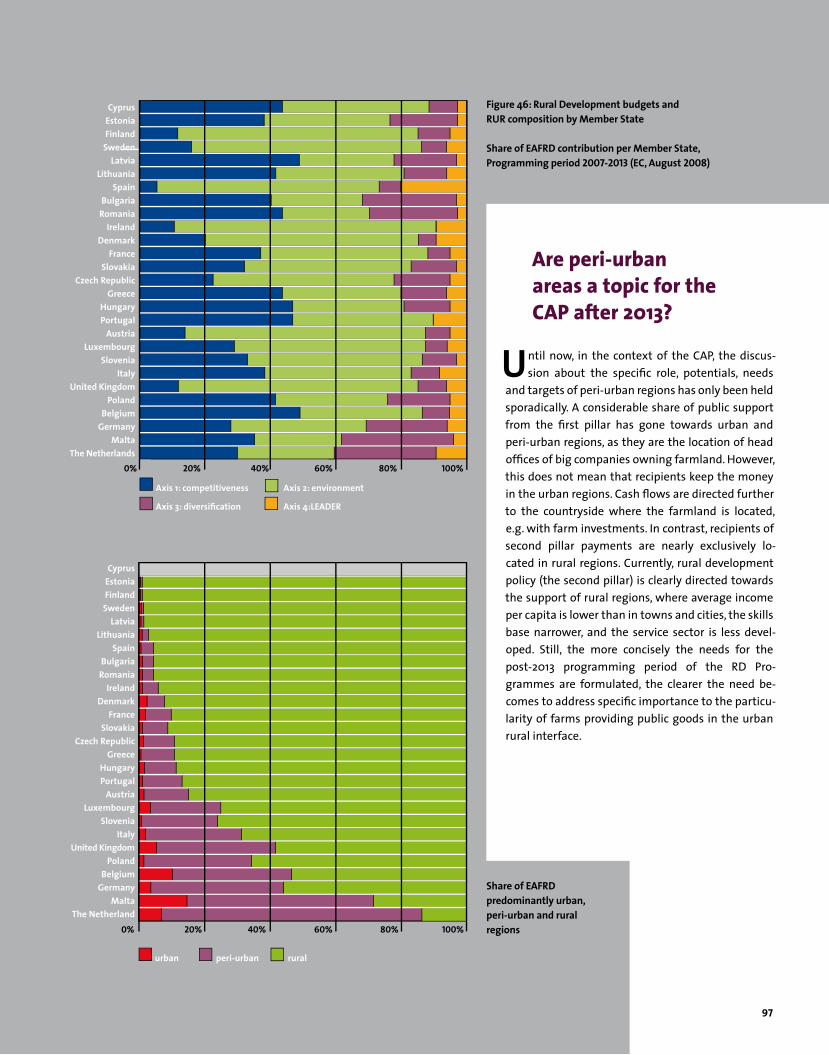
97
Share of EAFRD predominantly urban, peri-urban and rural regions
Are peri-urban areas a topic for the CAP after 2013?
U ntil now, in the context of the CAP, the discus-sion about the specific role, potentials, needs
and targets of peri-urban regions has only been held sporadically. A considerable share of public support from the first pillar has gone towards urban and peri-urban regions, as they are the location of head offices of big companies owning farmland. However, this does not mean that recipients keep the money in the urban regions. Cash flows are directed further to the countryside where the farmland is located, e.g. with farm investments. In contrast, recipients of second pillar payments are nearly exclusively lo-cated in rural regions. Currently, rural development policy (the second pillar) is clearly directed towards the support of rural regions, where average income per capita is lower than in towns and cities, the skills base narrower, and the service sector is less devel-oped. Still, the more concisely the needs for the post-2013 programming period of the RD Pro-grammes are formulated, the clearer the need be-comes to address specific importance to the particu-larity of farms providing public goods in the urban rural interface.
CyprusEstoniaFinland
SwedenLatvia
LithuaniaSpain
BulgariaRomania
IrelandDenmark
FranceSlovakia
Czech RepublicGreece
HungaryPortugal
AustriaLuxembourg
SloveniaItaly
United KingdomPoland
BelgiumGermany
MaltaThe Netherland
urban peri-urban rural
0% 20% 40% 60% 80% 100%
CyprusEstoniaFinland
SwedenLatvia
LithuaniaSpain
BulgariaRomania
IrelandDenmark
FranceSlovakia
Czech RepublicGreece
HungaryPortugal
AustriaLuxembourg
SloveniaItaly
United KingdomPoland
BelgiumGermany
MaltaThe Netherlands
0% 20% 40% 60% 80% 100%
Axis 1: competitiveness Axis 2: environment
Axis 3: diversification Axis 4:LEADER
Figure 46: Rural Development budgets and RUR composition by Member State
Share of EAFRD contribution per Member State, Programming period 2007-2013 (EC, August 2008)
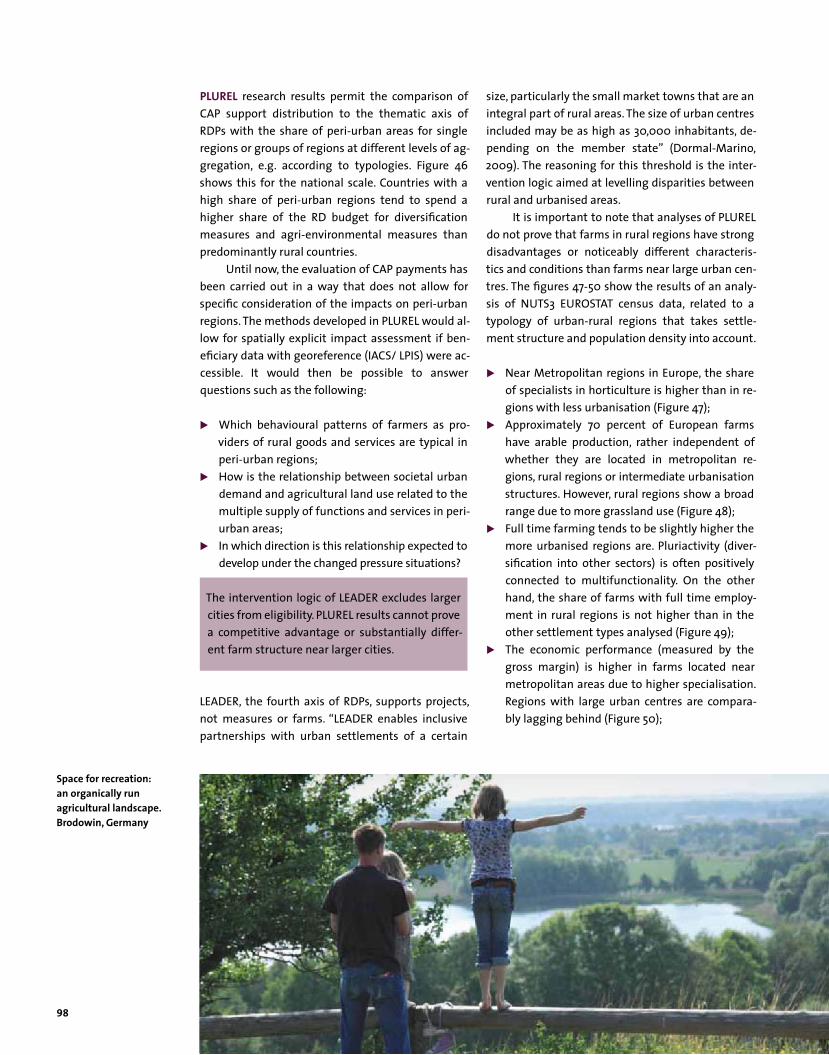
98
PLUREL research results permit the comparison of CAP support distribution to the thematic axis of RDPs with the share of peri-urban areas for single regions or groups of regions at different levels of ag-gregation, e.g. according to typologies. Figure 46 shows this for the national scale. Countries with a high share of peri-urban regions tend to spend a higher share of the RD budget for diversification measures and agri-environmental measures than predominantly rural countries.
Until now, the evaluation of CAP payments has been carried out in a way that does not allow for specific consideration of the impacts on peri-urban regions. The methods developed in PLUREL would al-low for spatially explicit impact assessment if ben-eficiary data with georeference (IACS/ LPIS) were ac-cessible. It would then be possible to answer questions such as the following:
Which behavioural patterns of farmers as pro-viders of rural goods and services are typical in peri-urban regions;
How is the relationship between societal urban demand and agricultural land use related to the multiple supply of functions and services in peri-urban areas;
In which direction is this relationship expected to develop under the changed pressure situations?
The intervention logic of LEADER excludes larger cities from eligibility. PLUREL results cannot prove a competitive advantage or substantially differ-ent farm structure near larger cities.
LEADER, the fourth axis of RDPs, supports projects, not measures or farms. “LEADER enables inclusive partnerships with urban settlements of a certain
size, particularly the small market towns that are an integral part of rural areas. The size of urban centres included may be as high as 30,000 inhabitants, de-pending on the member state” (Dormal-Marino, 2009). The reasoning for this threshold is the inter-vention logic aimed at levelling disparities between rural and urbanised areas.
It is important to note that analyses of PLUREL do not prove that farms in rural regions have strong disadvantages or noticeably different characteris-tics and conditions than farms near large urban cen-tres. The figures 47-50 show the results of an analy-sis of NUTS3 EUROSTAT census data, related to a typology of urban-rural regions that takes settle-ment structure and population density into account.
Near Metropolitan regions in Europe, the share of specialists in horticulture is higher than in re-gions with less urbanisation (Figure 47);
Approximately 70 percent of European farms have arable production, rather independent of whether they are located in metropolitan re-gions, rural regions or intermediate urbanisation structures. However, rural regions show a broad range due to more grassland use (Figure 48);
Full time farming tends to be slightly higher the more urbanised regions are. Pluriactivity (diver-sification into other sectors) is often positively connected to multifunctionality. On the other hand, the share of farms with full time employ-ment in rural regions is not higher than in the other settlement types analysed (Figure 49);
The economic performance (measured by the gross margin) is higher in farms located near metropolitan areas due to higher specialisation. Regions with large urban centres are compara-bly lagging behind (Figure 50);
Space for recreation: an organically run agricultural landscape. Brodowin, Germany
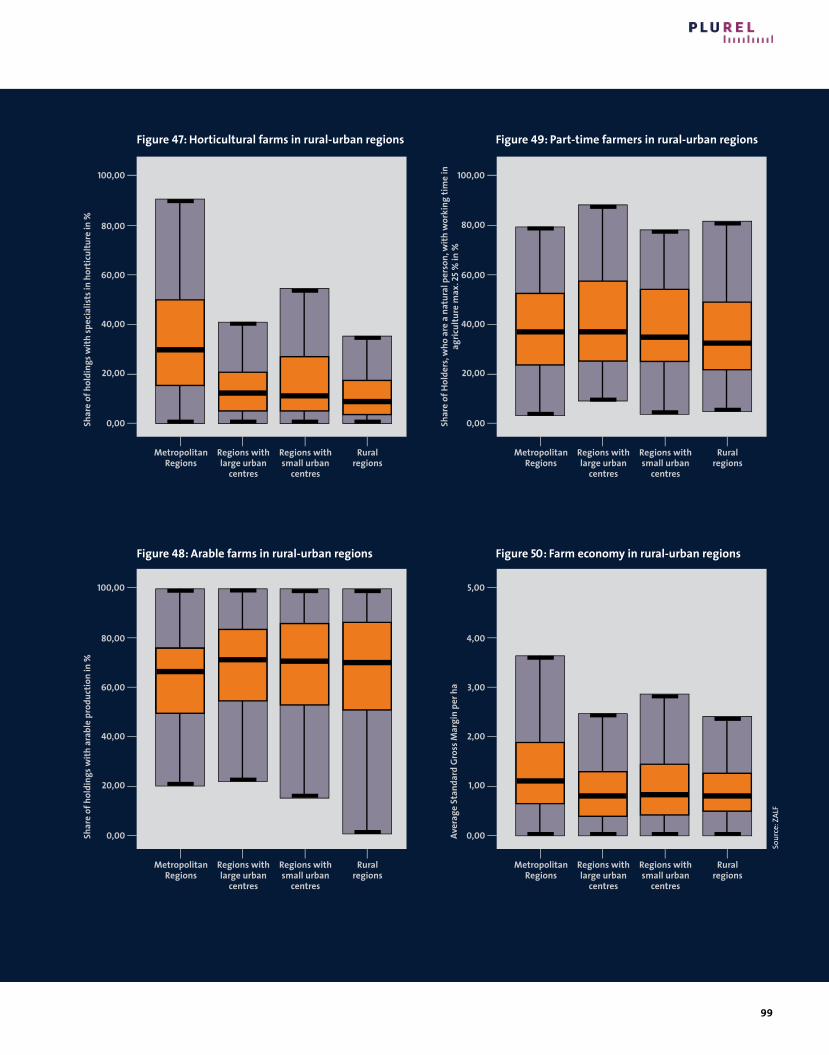
99
100,00
80,00
60,00
40,00
20,00
0,00Shar
e of
hol
ding
s with
spec
ialis
ts in
hor
ticul
ture
in %
Metropolitan Regions
Regions with large urban
centres
Regions with small urban
centres
Rural regions
5,00
4,00
3,00
2,00
1,00
0,00Aver
age
Stan
dard
Gro
ss M
argi
n pe
r ha
Metropolitan Regions
Regions with large urban
centres
Regions with small urban
centres
Rural regions
100,00
80,00
60,00
40,00
20,00
0,00Shar
e of
Hol
ders
, who
are
a n
atur
al p
erso
n, w
ith w
orki
ng ti
me
in
agric
ultu
re m
ax. 2
5 %
in %
Metropolitan Regions
Regions with large urban
centres
Regions with small urban
centres
Rural regions
100,00
80,00
60,00
40,00
20,00
0,00Shar
e of
hol
ding
s with
ara
ble
prod
uctio
n in
%
Metropolitan Regions
Regions with large urban
centres
Regions with small urban
centres
Rural regions
Figure 47: Horticultural farms in rural-urban regions
Figure 48: Arable farms in rural-urban regions
Figure 49: Part-time farmers in rural-urban regions
Figure 50: Farm economy in rural-urban regions
Sour
ce: Z
ALF
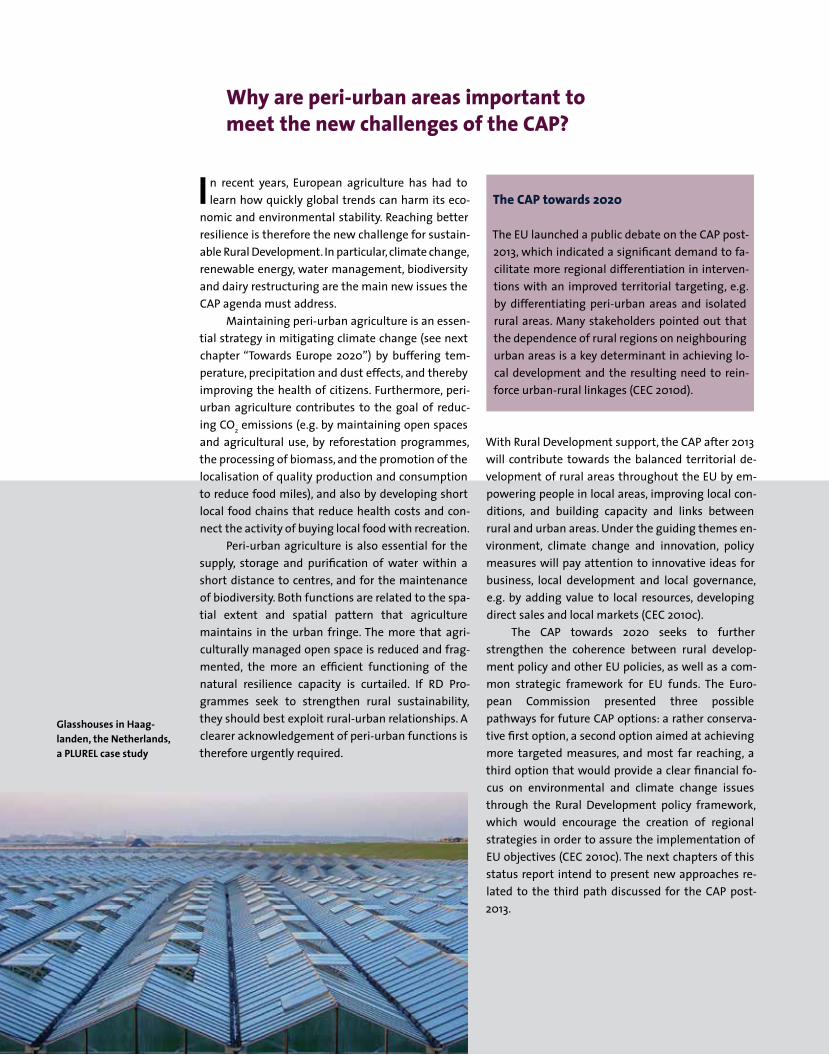
100
I n recent years, European agriculture has had to learn how quickly global trends can harm its eco-
nomic and environmental stability. Reaching better resilience is therefore the new challenge for sustain-able Rural Development. In particular, climate change, renewable energy, water management, biodiversity and dairy restructuring are the main new issues the CAP agenda must address.
Maintaining peri-urban agriculture is an essen-tial strategy in mitigating climate change (see next chapter “Towards Europe 2020”) by buffering tem-perature, precipitation and dust effects, and thereby improving the health of citizens. Furthermore, peri-urban agriculture contributes to the goal of reduc-ing CO2 emissions (e.g. by maintaining open spaces and agricultural use, by reforestation programmes, the processing of biomass, and the promotion of the localisation of quality production and consumption to reduce food miles), and also by developing short local food chains that reduce health costs and con-nect the activity of buying local food with recreation.
Peri-urban agriculture is also essential for the supply, storage and purification of water within a short distance to centres, and for the maintenance of biodiversity. Both functions are related to the spa-tial extent and spatial pattern that agriculture maintains in the urban fringe. The more that agri-culturally managed open space is reduced and frag-mented, the more an efficient functioning of the natural resilience capacity is curtailed. If RD Pro-grammes seek to strengthen rural sustainability, they should best exploit rural-urban relationships. A clearer acknowledgement of peri-urban functions is therefore urgently required.
The CAP towards 2020
The EU launched a public debate on the CAP post-2013, which indicated a significant demand to fa-cilitate more regional differentiation in interven-tions with an improved territorial targeting, e.g. by differentiating peri-urban areas and isolated rural areas. Many stakeholders pointed out that the dependence of rural regions on neighbouring urban areas is a key determinant in achieving lo-cal development and the resulting need to rein-force urban-rural linkages (CEC 2010d).
With Rural Development support, the CAP after 2013 will contribute towards the balanced territorial de-velopment of rural areas throughout the EU by em-powering people in local areas, improving local con-ditions, and building capacity and links between rural and urban areas. Under the guiding themes en-vironment, climate change and innovation, policy measures will pay attention to innovative ideas for business, local development and local governance, e.g. by adding value to local resources, developing direct sales and local markets (CEC 2010c).
The CAP towards 2020 seeks to further strengthen the coherence between rural develop-ment policy and other EU policies, as well as a com-mon strategic framework for EU funds. The Euro-pean Commission presented three possible pathways for future CAP options: a rather conserva-tive first option, a second option aimed at achieving more targeted measures, and most far reaching, a third option that would provide a clear financial fo-cus on environmental and climate change issues through the Rural Development policy framework, which would encourage the creation of regional strategies in order to assure the implementation of EU objectives (CEC 2010c). The next chapters of this status report intend to present new approaches re-lated to the third path discussed for the CAP post-2013.
Why are peri-urban areas important to meet the new challenges of the CAP?
Glasshouses in Haag-landen, the Netherlands, a PLUREL case study
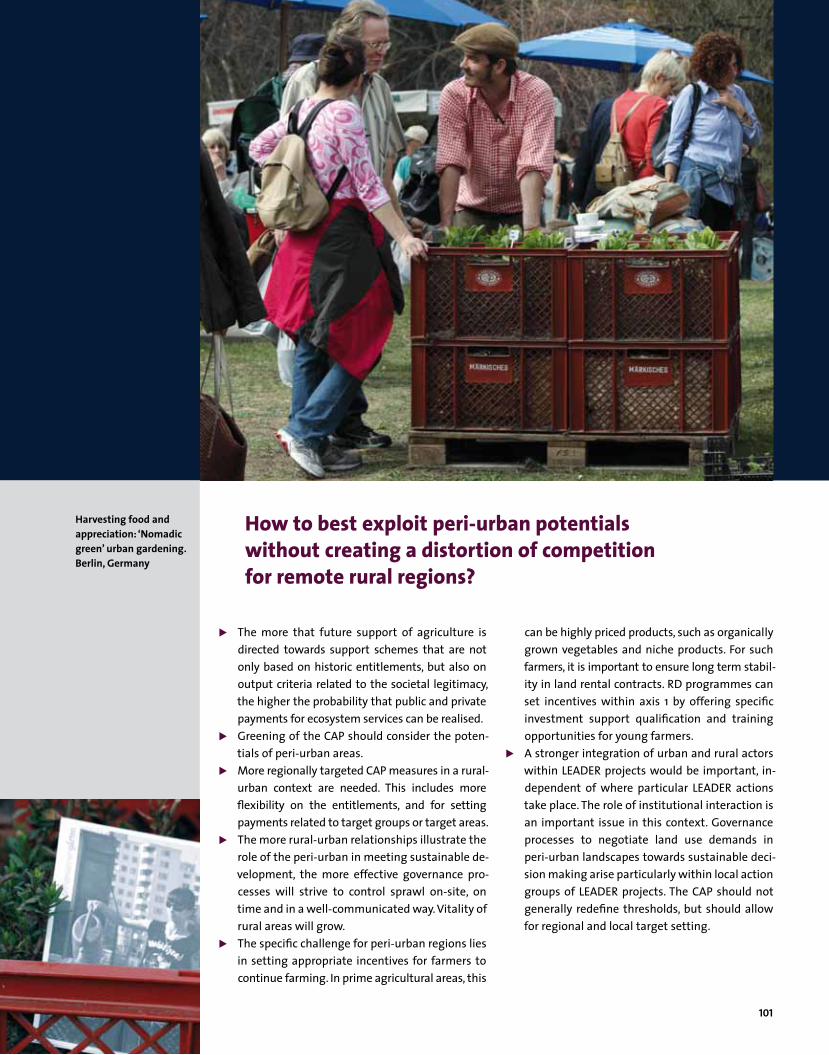
101
The more that future support of agriculture is directed towards support schemes that are not only based on historic entitlements, but also on output criteria related to the societal legitimacy, the higher the probability that public and private payments for ecosystem services can be realised.
Greening of the CAP should consider the poten-tials of peri-urban areas.
More regionally targeted CAP measures in a rural-urban context are needed. This includes more flexibility on the entitlements, and for setting payments related to target groups or target areas.
The more rural-urban relationships illustrate the role of the peri-urban in meeting sustainable de-velopment, the more effective governance pro-cesses will strive to control sprawl on-site, on time and in a well-communicated way. Vitality of rural areas will grow.
The specific challenge for peri-urban regions lies in setting appropriate incentives for farmers to continue farming. In prime agricultural areas, this
can be highly priced products, such as organically grown vegetables and niche products. For such farmers, it is important to ensure long term stabil-ity in land rental contracts. RD programmes can set incentives within axis 1 by offering specific investment support qualification and training opportunities for young farmers.
A stronger integration of urban and rural actors within LEADER projects would be important, in-dependent of where particular LEADER actions take place. The role of institutional interaction is an important issue in this context. Governance processes to negotiate land use demands in peri-urban landscapes towards sustainable deci-sion making arise particularly within local action groups of LEADER projects. The CAP should not generally redefine thresholds, but should allow for regional and local target setting.
How to best exploit peri-urban potentials without creating a distortion of competition for remote rural regions?
Harvesting food and appreciation: ‘Nomadic green’ urban gardening. Berlin, Germany
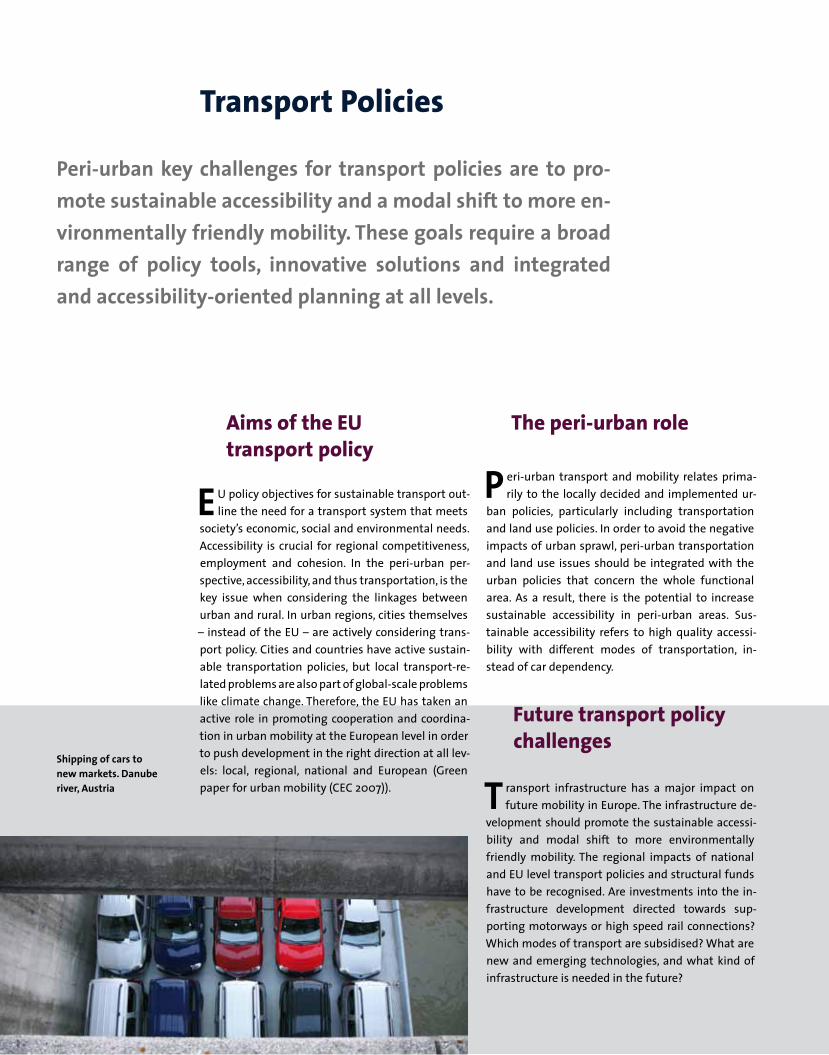
102
Aims of the EU transport policy
E U policy objectives for sustainable transport out-line the need for a transport system that meets
society’s economic, social and environmental needs. Accessibility is crucial for regional competitiveness, employment and cohesion. In the peri-urban per-spective, accessibility, and thus transportation, is the key issue when considering the linkages between urban and rural. In urban regions, cities themselves – instead of the EU – are actively considering trans-port policy. Cities and countries have active sustain-able transportation policies, but local transport-re-lated problems are also part of global-scale problems like climate change. Therefore, the EU has taken an active role in promoting cooperation and coordina-tion in urban mobility at the European level in order to push development in the right direction at all lev-els: local, regional, national and European (Green paper for urban mobility (CEC 2007)).
The peri-urban role
P eri-urban transport and mobility relates prima-rily to the locally decided and implemented ur-
ban policies, particularly including transportation and land use policies. In order to avoid the negative impacts of urban sprawl, peri-urban transportation and land use issues should be integrated with the urban policies that concern the whole functional area. As a result, there is the potential to increase sustainable accessibility in peri-urban areas. Sus-tainable accessibility refers to high quality accessi-bility with different modes of transportation, in-stead of car dependency.
Future transport policy challenges
T ransport infrastructure has a major impact on future mobility in Europe. The infrastructure de-
velopment should promote the sustainable accessi-bility and modal shift to more environmentally friendly mobility. The regional impacts of national and EU level transport policies and structural funds have to be recognised. Are investments into the in-frastructure development directed towards sup-porting motorways or high speed rail connections? Which modes of transport are subsidised? What are new and emerging technologies, and what kind of infrastructure is needed in the future?
Transport Policies
Peri-urban key challenges for transport policies are to pro-mote sustainable accessibility and a modal shift to more en-vironmentally friendly mobility. These goals require a broad range of policy tools, innovative solutions and integrated and accessibility-oriented planning at all levels.
Shipping of cars to new markets. Danube river, Austria
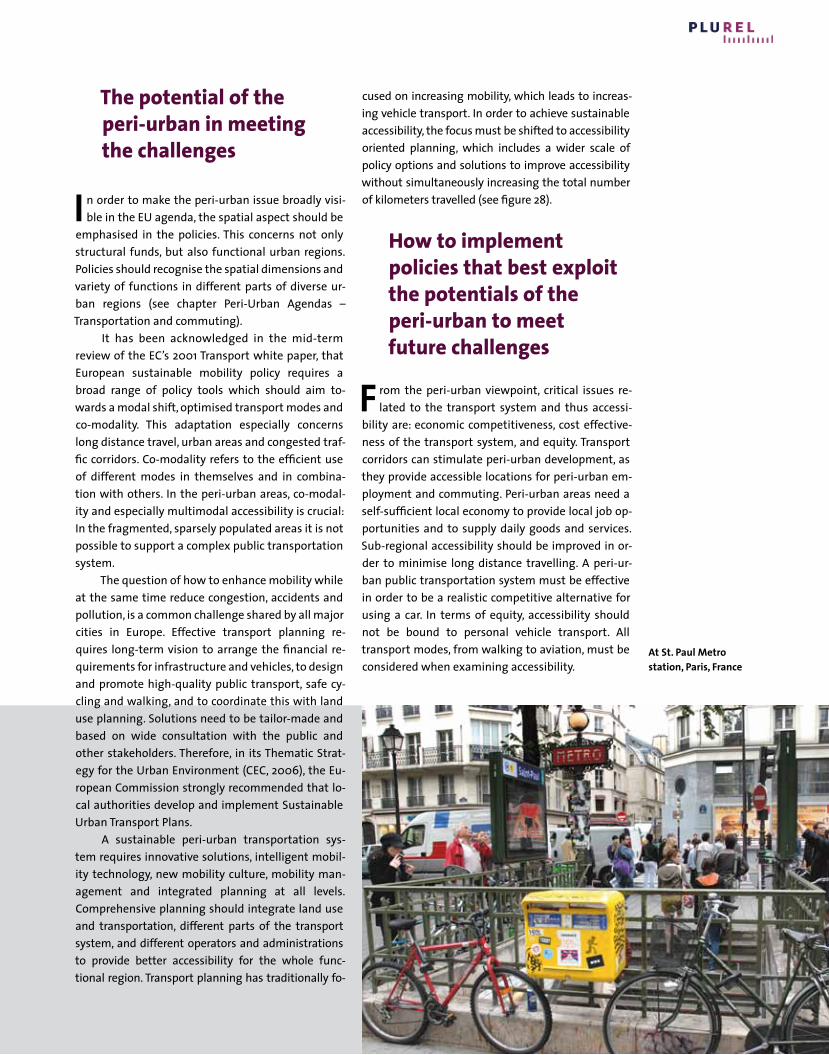
103
The potential of the peri-urban in meeting the challenges
I n order to make the peri-urban issue broadly visi-ble in the EU agenda, the spatial aspect should be
emphasised in the policies. This concerns not only structural funds, but also functional urban regions. Policies should recognise the spatial dimensions and variety of functions in different parts of diverse ur-ban regions (see chapter Peri-Urban Agendas – Transportation and commuting).
It has been acknowledged in the mid-term review of the EC’s 2001 Transport white paper, that European sustainable mobility policy requires a broad range of policy tools which should aim to-wards a modal shift, optimised transport modes and co-modality. This adaptation especially concerns long distance travel, urban areas and congested traf-fic corridors. Co-modality refers to the efficient use of different modes in themselves and in combina-tion with others. In the peri-urban areas, co-modal-ity and especially multimodal accessibility is crucial: In the fragmented, sparsely populated areas it is not possible to support a complex public transportation system.
The question of how to enhance mobility while at the same time reduce congestion, accidents and pollution, is a common challenge shared by all major cities in Europe. Effective transport planning re-quires long-term vision to arrange the financial re-quirements for infrastructure and vehicles, to design and promote high-quality public transport, safe cy-cling and walking, and to coordinate this with land use planning. Solutions need to be tailor-made and based on wide consultation with the public and other stakeholders. Therefore, in its Thematic Strat-egy for the Urban Environment (CEC, 2006), the Eu-ropean Commission strongly recommended that lo-cal authorities develop and implement Sustainable Urban Transport Plans.
A sustainable peri-urban transportation sys-tem requires innovative solutions, intelligent mobil-ity technology, new mobility culture, mobility man-agement and integrated planning at all levels. Comprehensive planning should integrate land use and transportation, different parts of the transport system, and different operators and administrations to provide better accessibility for the whole func-tional region. Transport planning has traditionally fo-
cused on increasing mobility, which leads to increas-ing vehicle transport. In order to achieve sustainable accessibility, the focus must be shifted to accessibility oriented planning, which includes a wider scale of policy options and solutions to improve accessibility without simultaneously increasing the total number of kilometers travelled (see figure 28).
How to implement policies that best exploit the potentials of the peri-urban to meet future challenges
F rom the peri-urban viewpoint, critical issues re-lated to the transport system and thus accessi-
bility are: economic competitiveness, cost effective-ness of the transport system, and equity. Transport corridors can stimulate peri-urban development, as they provide accessible locations for peri-urban em-ployment and commuting. Peri-urban areas need a self-sufficient local economy to provide local job op-portunities and to supply daily goods and services. Sub-regional accessibility should be improved in or-der to minimise long distance travelling. A peri-ur-ban public transportation system must be effective in order to be a realistic competitive alternative for using a car. In terms of equity, accessibility should not be bound to personal vehicle transport. All transport modes, from walking to aviation, must be considered when examining accessibility.
At St. Paul Metro station, Paris, France
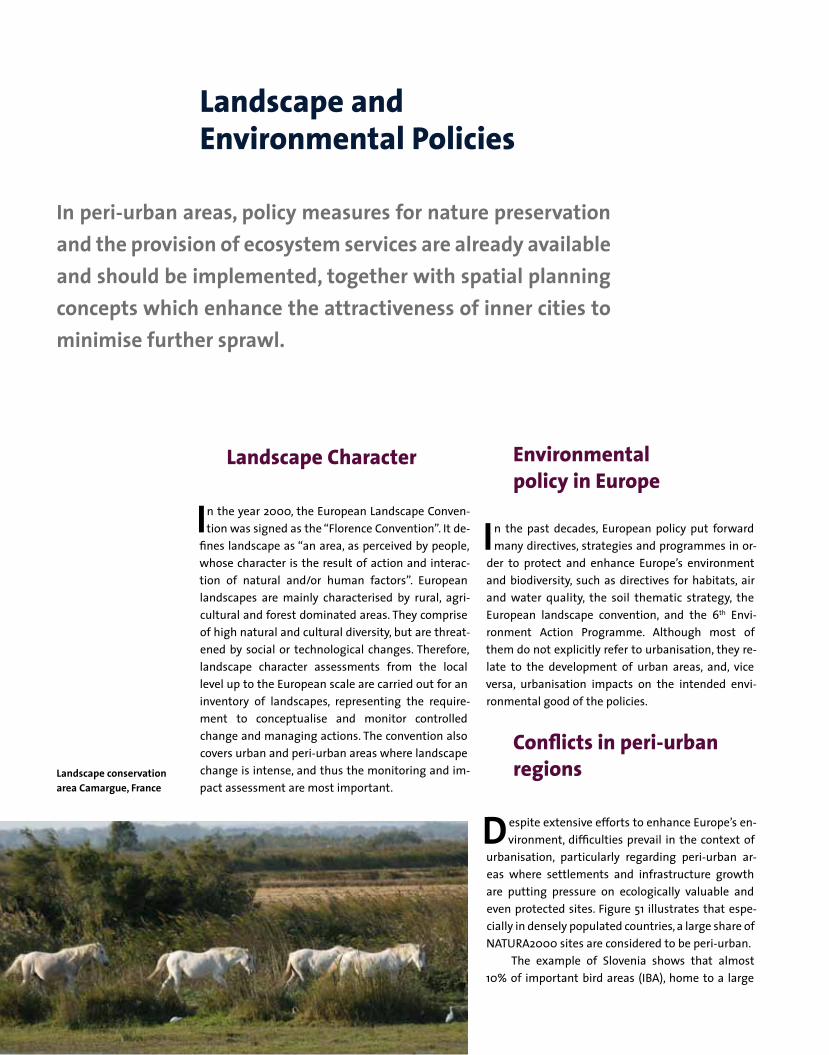
104
Landscape Character
I n the year 2000, the European Landscape Conven-tion was signed as the “Florence Convention”. It de-
fines landscape as “an area, as perceived by people, whose character is the result of action and interac-tion of natural and/or human factors”. European landscapes are mainly characterised by rural, agri-cultural and forest dominated areas. They comprise of high natural and cultural diversity, but are threat-ened by social or technological changes. Therefore, landscape character assessments from the local level up to the European scale are carried out for an inventory of landscapes, representing the require-ment to conceptualise and monitor controlled change and managing actions. The convention also covers urban and peri-urban areas where landscape change is intense, and thus the monitoring and im-pact assessment are most important.
Environmental policy in Europe
I n the past decades, European policy put forward many directives, strategies and programmes in or-
der to protect and enhance Europe’s environment and biodiversity, such as directives for habitats, air and water quality, the soil thematic strategy, the European landscape convention, and the 6th Envi-ronment Action Programme. Although most of them do not explicitly refer to urbanisation, they re-late to the development of urban areas, and, vice versa, urbanisation impacts on the intended envi-ronmental good of the policies.
Conflicts in peri-urban regions
D espite extensive efforts to enhance Europe’s en-vironment, difficulties prevail in the context of
urbanisation, particularly regarding peri-urban ar-eas where settlements and infrastructure growth are putting pressure on ecologically valuable and even protected sites. Figure 51 illustrates that espe-cially in densely populated countries, a large share of NATURA2000 sites are considered to be peri-urban.
The example of Slovenia shows that almost 10% of important bird areas (IBA), home to a large
Landscape and Environmental Policies
In peri-urban areas, policy measures for nature preservation and the provision of ecosystem services are already available and should be implemented, together with spatial planning concepts which enhance the attractiveness of inner cities to minimise further sprawl.
Landscape conservation area Camargue, France
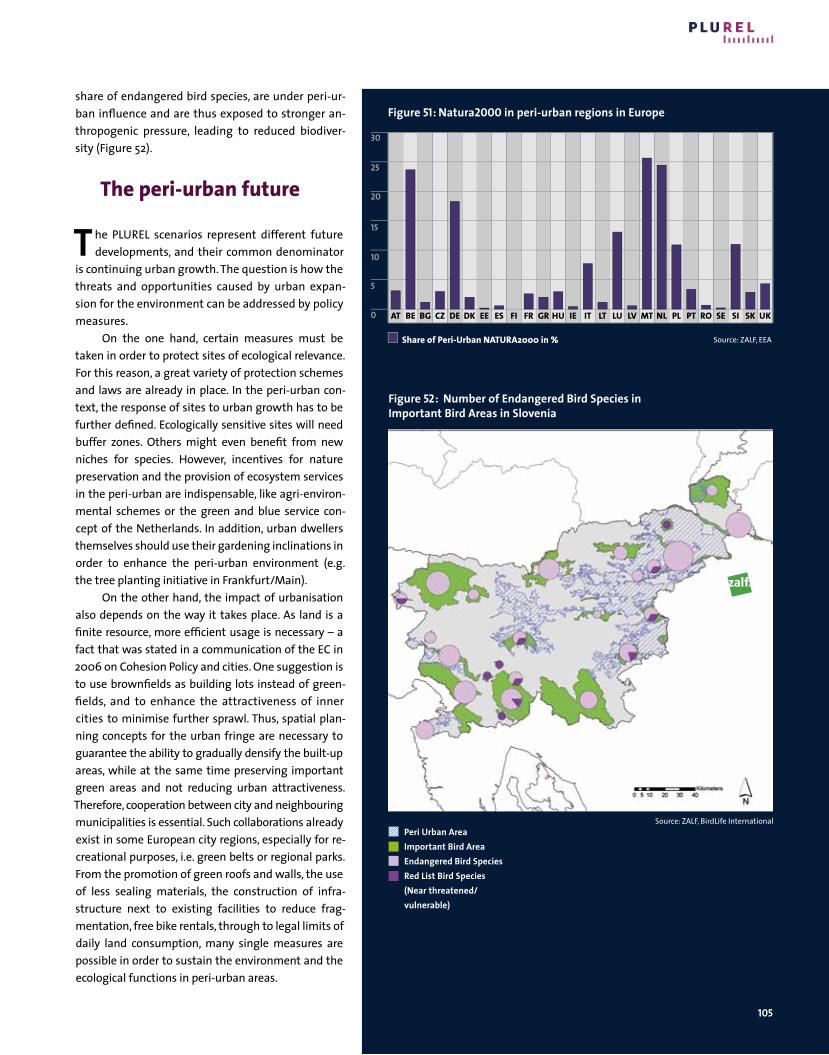
105
share of endangered bird species, are under peri-ur-ban influence and are thus exposed to stronger an-thropogenic pressure, leading to reduced biodiver-sity (Figure 52).
The peri-urban future
T he PLUREL scenarios represent different future developments, and their common denominator
is continuing urban growth. The question is how the threats and opportunities caused by urban expan-sion for the environment can be addressed by policy measures.
On the one hand, certain measures must be taken in order to protect sites of ecological relevance. For this reason, a great variety of protection schemes and laws are already in place. In the peri-urban con-text, the response of sites to urban growth has to be further defined. Ecologically sensitive sites will need buffer zones. Others might even benefit from new niches for species. However, incentives for nature preservation and the provision of ecosystem services in the peri-urban are indispensable, like agri-environ-mental schemes or the green and blue service con-cept of the Netherlands. In addition, urban dwellers themselves should use their gardening inclinations in order to enhance the peri-urban environment (e.g. the tree planting initiative in Frankfurt/Main).
On the other hand, the impact of urbanisation also depends on the way it takes place. As land is a finite resource, more efficient usage is necessary – a fact that was stated in a communication of the EC in 2006 on Cohesion Policy and cities. One suggestion is to use brownfields as building lots instead of green-fields, and to enhance the attractiveness of inner cities to minimise further sprawl. Thus, spatial plan-ning concepts for the urban fringe are necessary to guarantee the ability to gradually densify the built-up areas, while at the same time preserving important green areas and not reducing urban attractiveness. Therefore, cooperation between city and neighbouring municipalities is essential. Such collabo rations already exist in some European city regions, especially for re-creational purposes, i.e. green belts or regional parks. From the promotion of green roofs and walls, the use of less sealing materials, the construction of infra-structure next to existing facilities to reduce frag-mentation, free bike rentals, through to legal limits of daily land consumption, many single measures are possible in order to sustain the environment and the ecological functions in peri-urban areas.
Figure 52: Number of Endangered Bird Species in Important Bird Areas in Slovenia
Peri Urban AreaImportant Bird AreaEndangered Bird SpeciesRed List Bird Species (Near threatened/vulnerable)
AT BE BG CZ DE DK EE ES FI FR GR HU IE IT LT LU LV MT NL PL PT RO SE SI SK UK
30
25
20
15
10
5
0
Figure 51: Natura2000 in peri-urban regions in Europe
Share of Peri-Urban NATURA2000 in % Source: ZALF, EEA
Source: ZALF, BirdLife International
106
T he Lisbon Agenda sets a strategic direction for policy and the economic development path
across the EU. The Cohesion Funds from 2013 are now being designed around this. However, the PLUREL analysis and modelling suggests that this direction is likely to result in peri-urban expansion, and potentially urban sprawl, at a faster rate than ever before. So here we look at key challenges – cross cutting policy agendas which are powerful drivers of change in peri-urban areas.
Globalisation and innovation as the driver for economic development: The direct effect of this is peri-urban expansion for business parks, hous-ing, roads and other urban infrastructure;
Demographic change: The shrinking of some re-gions, the ageing of others, and the migration of people all bring challenges to the stability and cohesion of peri-urban areas;
Climate change and energy: This will bring physi-cal impacts and the need for adaptation in the peri-urban. Decarbonising energy sources will also require land for renewables, and may change peri-urban transport and settlement patterns.
If each of these challenges is addressed in isolation from the others, the situation could worsen. So to integrate and generate added value, we need to ex-plore ‘integrated development pathways’ for ‘peri-urban territorial cohesion’ (next chapter). Here, we review the trends and challenges, starting from the EUROPE 2020 (CEC 2010a) regional analysis followed by the implications for the peri-urban agenda.
Globalisation and innovation
T he benefits of globalisation are the goals of eco-nomic policy, businesses and consumers. There
is also a downside however, which is becoming in-creasingly topical in the economic situation post-2010. The downsides include restructuring and obso-lescence, redundancy of labour and skills, and the impacts on vulnerable industries and economies at the local and regional level.
In order to turn the challenges of globalisation into opportunities, the Lisbon Agenda requires Euro-
Towards EUROPE 2020:Pan-European challenges for the peri-urban
The EU policy goals of growth and development may meet the Lisbon goals, but at present, the problems of urban sprawl, environmental impact and social segregation appear to be attached. This chapter looks at the implications for the peri-urban agenda in light of the pan-European challenges of globalisation, demographic change, energy, and climate change.
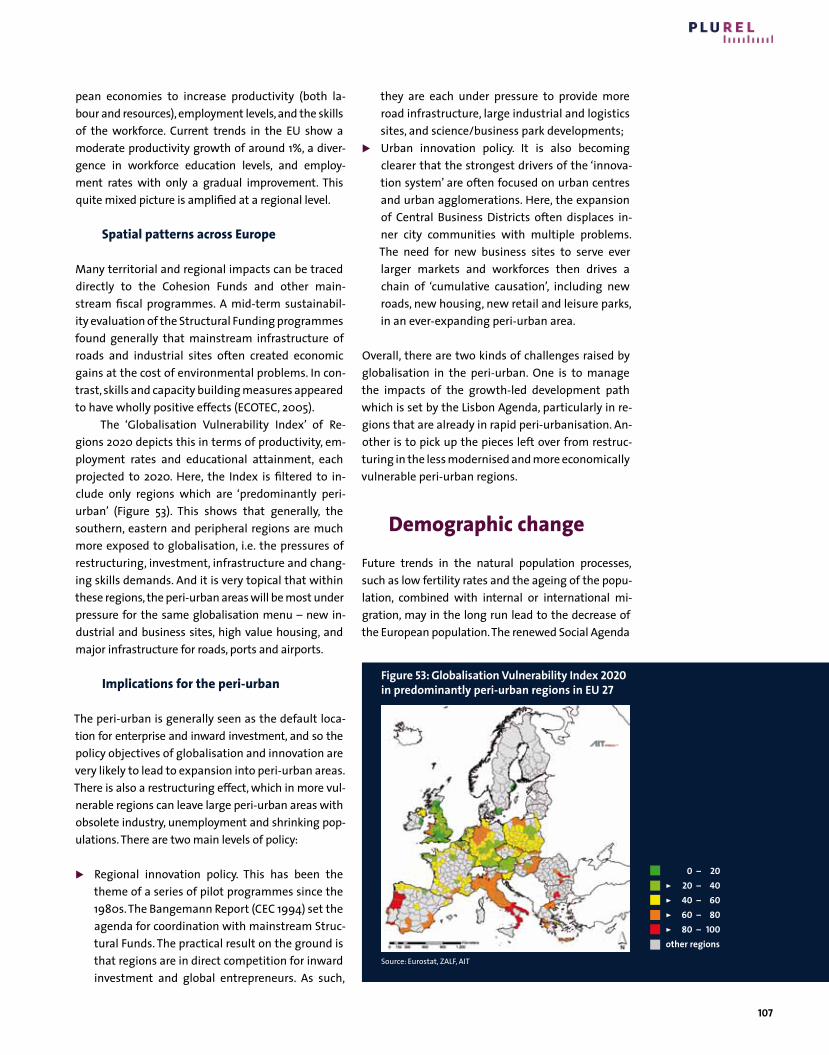
107
pean economies to increase productivity (both la-bour and resources), employment levels, and the skills of the workforce. Current trends in the EU show a moderate productivity growth of around 1%, a diver-gence in workforce education levels, and employ-ment rates with only a gradual improvement. This quite mixed picture is amplified at a regional level.
Spatial patterns across Europe
Many territorial and regional impacts can be traced directly to the Cohesion Funds and other main-stream fiscal programmes. A mid-term sustainabil-ity evaluation of the Structural Funding programmes found generally that mainstream infrastructure of roads and industrial sites often created economic gains at the cost of environmental problems. In con-trast, skills and capacity building measures appeared to have wholly positive effects (ECOTEC, 2005).
The ‘Globalisation Vulnerability Index’ of Re-gions 2020 depicts this in terms of productivity, em-ployment rates and educational attainment, each projected to 2020. Here, the Index is filtered to in-clude only regions which are ‘predominantly peri-urban’ (Figure 53). This shows that generally, the southern, eastern and peripheral regions are much more exposed to globalisation, i.e. the pressures of restructuring, investment, infrastructure and chang-ing skills demands. And it is very topical that within these regions, the peri-urban areas will be most under pressure for the same globalisation menu – new in-dustrial and business sites, high value housing, and major infrastructure for roads, ports and airports.
Implications for the peri-urban
The peri-urban is generally seen as the default loca-tion for enterprise and inward investment, and so the policy objectives of globalisation and innovation are very likely to lead to expansion into peri-urban areas. There is also a restructuring effect, which in more vul-nerable regions can leave large peri-urban areas with obsolete industry, unemployment and shrinking pop-ulations. There are two main levels of policy:
Regional innovation policy. This has been the theme of a series of pilot programmes since the 1980s. The Bangemann Report (CEC 1994) set the agenda for coordination with mainstream Struc-tural Funds. The practical result on the ground is that regions are in direct competition for inward investment and global entrepreneurs. As such,
they are each under pressure to provide more road infrastructure, large industrial and logistics sites, and science/business park developments;
Urban innovation policy. It is also becoming clearer that the strongest drivers of the ‘innova-tion system’ are often focused on urban centres and urban agglomerations. Here, the expansion of Central Business Districts often displaces in-ner city communities with multiple problems. The need for new business sites to serve ever larger markets and workforces then drives a chain of ‘cumulative causation’, including new roads, new housing, new retail and leisure parks, in an ever-expanding peri-urban area.
Overall, there are two kinds of challenges raised by globalisation in the peri-urban. One is to manage the impacts of the growth-led development path which is set by the Lisbon Agenda, particularly in re-gions that are already in rapid peri-urbanisation. An-other is to pick up the pieces left over from restruc-turing in the less modernised and more economically vulnerable peri-urban regions.
Demographic changeFuture trends in the natural population processes, such as low fertility rates and the ageing of the popu-lation, combined with internal or international mi-gration, may in the long run lead to the decrease of the European population. The renewed Social Agenda
Figure 53: Globalisation Vulnerability Index 2020in predominantly peri-urban regions in EU 27
> 0 – 20> 20 – 40> 40 – 60> 60 – 80> 80 – 100other regions
Source: Eurostat, ZALF, AIT

108
of the Commission of the European Union (2008) re-flects this conviction, as it identified population age-ing as one of the key factors in social change within the EU. Such demographic change is likely to trans-form European societies as we know them, and create a whole new economic and social environment.
In contrast to the relatively slow-changing nat-ural population trends, migration patterns can change and fluctuate more rapidly, and are more sensitive to difficult policy decisions. Three forms of migration, i.e. within the country, within the EU and from third countries, have to be differentiated. The ‘nationals’ (coming to the city from other parts of the same country), the ‘other EU nationals’ and the ‘non-EU nationals’ differ substantially in all aspects, from the regulations which influence their numbers, to the way they integrate into the labour and hous-ing market of the city.
Spatial patterns across Europe
The ‘Demographic Vulnerability peri-urban region Index’ is based on the share of people aged over 65, population decline and the share of the working age population in 2020, with each factor projected to 2020 (Figure 54). These three factors show different territorial patterns across Europe. Population de-
cline will hit mainly central and eastern European regions, while ageing will be delayed in these re-gions due to the lower life expectancy. The decline in the working age population will be the highest in Scandinavian countries and Germany.
The distribution shows that most major EU na-tions contain a range of conditions, with a patch-work-like character. There are rural or more remote areas with a high vulnerability index, a combination of ageing, population decline and working age pop-ulation. There are also peri-urban regions close to the ‘core’, with similar problems of ageing and de-pendency. In contrast, some capital regions like Ma-drid, Paris or Warsaw appear to have a higher growth and turnover, and so a relatively low vulnerability.
The demographic division of Europe generally follows the line of its economic division. Countries with stronger economies have relatively high fertil-ity levels, and their population growth is also aided by migration. The extension of current trends to a longer time horizon, beyond 2020, suggests that de-mographic challenges will accelerate the existing interregional differences, reducing the chance of more peripheral EU regions ever catching up. On the basis of fertility rates and migratory patterns, three major areas of demographic change within the Eu-ropean Union can be defined:
Building the know- ledge society. Saint Etienne, France
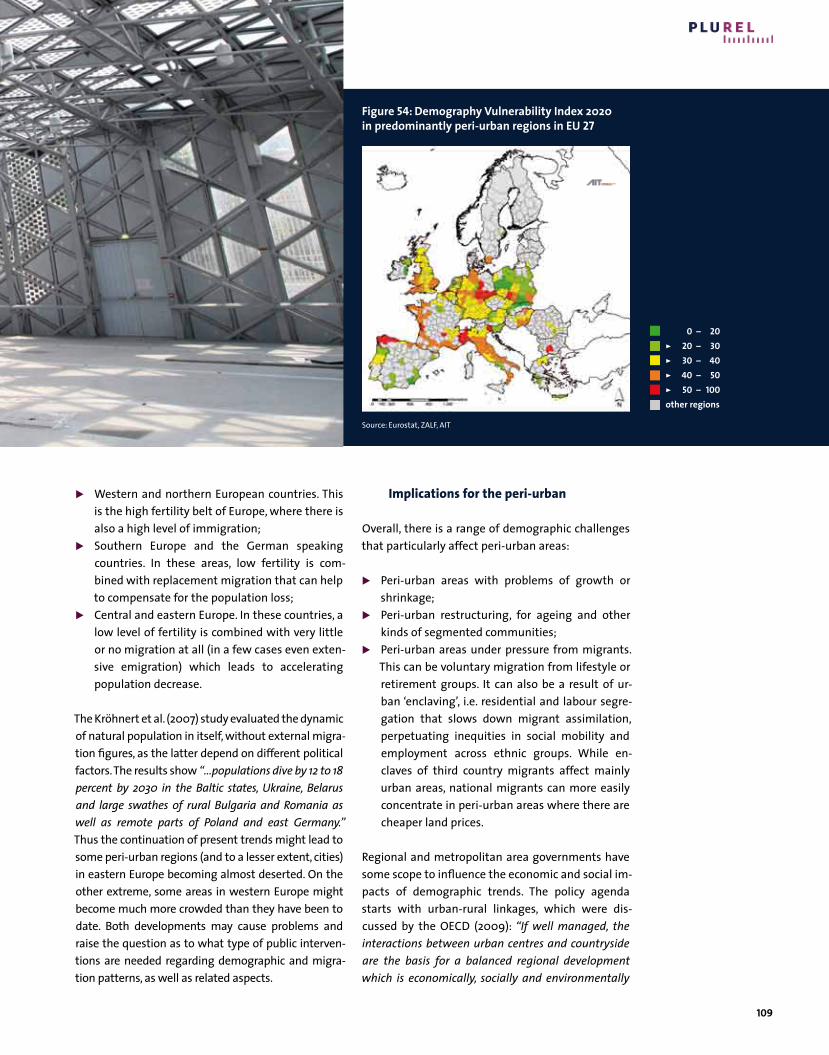
109
Western and northern European countries. This is the high fertility belt of Europe, where there is also a high level of immigration;
Southern Europe and the German speaking countries. In these areas, low fertility is com-bined with replacement migration that can help to compensate for the population loss;
Central and eastern Europe. In these countries, a low level of fertility is combined with very little or no migration at all (in a few cases even exten-sive emigration) which leads to accelerating population decrease.
The Kröhnert et al. (2007) study evaluated the dynamic of natural population in itself, without external migra-tion figures, as the latter depend on different political factors. The results show “…populations dive by 12 to 18 percent by 2030 in the Baltic states, Ukraine, Belarus and large swathes of rural Bulgaria and Romania as well as remote parts of Poland and east Germany.” Thus the continuation of present trends might lead to some peri-urban regions (and to a lesser extent, cities) in eastern Europe becoming almost deserted. On the other extreme, some areas in western Europe might become much more crowded than they have been to date. Both developments may cause problems and raise the question as to what type of public interven-tions are needed regarding demographic and migra-tion patterns, as well as related aspects.
Implications for the peri-urban
Overall, there is a range of demographic challenges that particularly affect peri-urban areas:
Peri-urban areas with problems of growth or shrinkage;
Peri-urban restructuring, for ageing and other kinds of segmented communities;
Peri-urban areas under pressure from migrants. This can be voluntary migration from lifestyle or retirement groups. It can also be a result of ur-ban ‘enclaving’, i.e. residential and labour segre-gation that slows down migrant assimilation, perpetuating inequities in social mobility and employment across ethnic groups. While en-claves of third country migrants affect mainly urban areas, national migrants can more easily concentrate in peri-urban areas where there are cheaper land prices.
Regional and metropolitan area governments have some scope to influence the economic and social im-pacts of demographic trends. The policy agenda starts with urban-rural linkages, which were dis-cussed by the OECD (2009): “If well managed, the interactions between urban centres and countryside are the basis for a balanced regional development which is economically, socially and environmentally
Figure 54: Demography Vulnerability Index 2020 in predominantly peri-urban regions in EU 27
> 0 – 20> 20 – 30> 30 – 40> 40 – 50> 50 – 100other regions
Source: Eurostat, ZALF, AIT
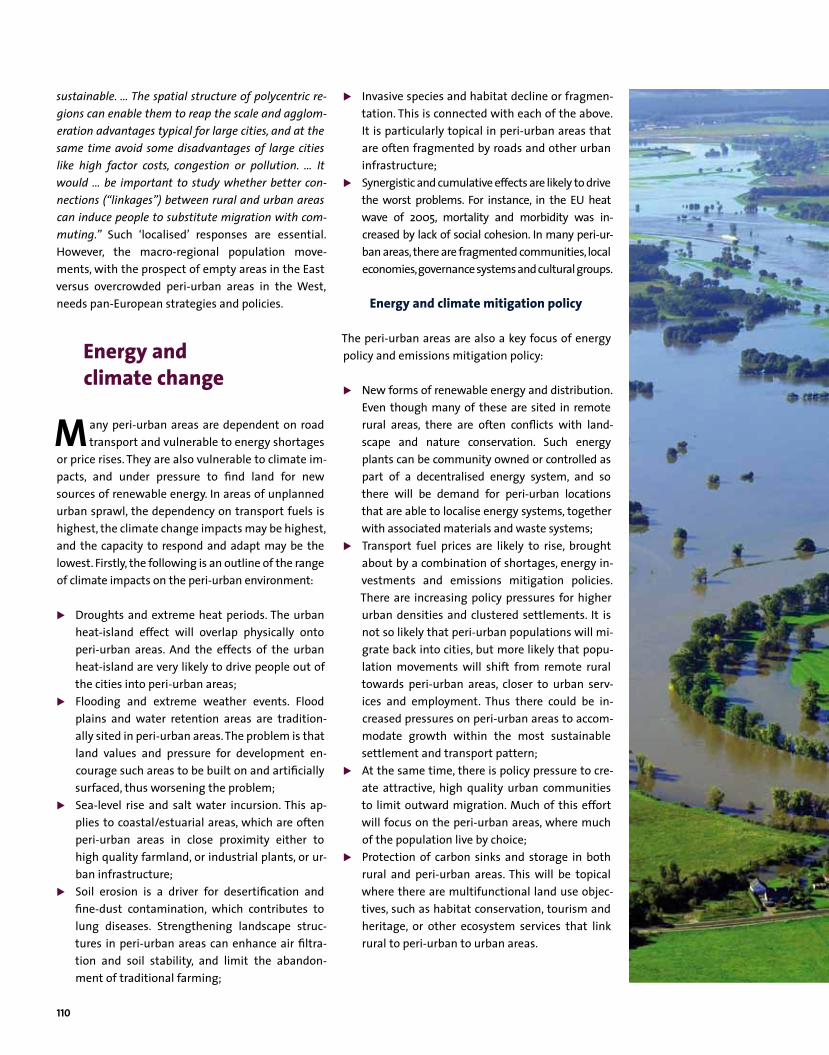
110
sustainable. … The spatial structure of polycentric re-gions can enable them to reap the scale and agglom-eration advantages typical for large cities, and at the same time avoid some disadvantages of large cities like high factor costs, congestion or pollution. … It would … be important to study whether better con-nections (“linkages”) between rural and urban areas can induce people to substitute migration with com-muting.” Such ‘localised’ responses are essential. However, the macro-regional population move-ments, with the prospect of empty areas in the East versus overcrowded peri-urban areas in the West, needs pan-European strategies and policies.
Energy and climate change
M any peri-urban areas are dependent on road transport and vulnerable to energy shortages
or price rises. They are also vulnerable to climate im-pacts, and under pressure to find land for new sources of renewable energy. In areas of unplanned urban sprawl, the dependency on transport fuels is highest, the climate change impacts may be highest, and the capacity to respond and adapt may be the lowest. Firstly, the following is an outline of the range of climate impacts on the peri-urban environment:
Droughts and extreme heat periods. The urban heat-island effect will overlap physically onto peri-urban areas. And the effects of the urban heat-island are very likely to drive people out of the cities into peri-urban areas;
Flooding and extreme weather events. Flood plains and water retention areas are tradition-ally sited in peri-urban areas. The problem is that land values and pressure for development en-courage such areas to be built on and artificially surfaced, thus worsening the problem;
Sea-level rise and salt water incursion. This ap-plies to coastal/estuarial areas, which are often peri-urban areas in close proximity either to high quality farmland, or industrial plants, or ur-ban infrastructure;
Soil erosion is a driver for desertification and fine-dust contamination, which contributes to lung diseases. Strengthening landscape struc-tures in peri-urban areas can enhance air filtra-tion and soil stability, and limit the abandon-ment of traditional farming;
Invasive species and habitat decline or fragmen-tation. This is connected with each of the above. It is particularly topical in peri-urban areas that are often fragmented by roads and other urban infrastructure;
Synergistic and cumulative effects are likely to drive the worst problems. For instance, in the EU heat wave of 2005, mortality and morbidity was in-creased by lack of social cohesion. In many peri-ur-ban areas, there are fragmented communities, local economies, governance systems and cultural groups.
Energy and climate mitigation policy
The peri-urban areas are also a key focus of energy policy and emissions mitigation policy:
New forms of renewable energy and distribution. Even though many of these are sited in remote rural areas, there are often conflicts with land-scape and nature conservation. Such energy plants can be community owned or controlled as part of a decentralised energy system, and so there will be demand for peri-urban locations that are able to localise energy systems, together with associated materials and waste systems;
Transport fuel prices are likely to rise, brought about by a combination of shortages, energy in-vestments and emissions mitigation policies. There are increasing policy pressures for higher urban densities and clustered settlements. It is not so likely that peri-urban populations will mi-grate back into cities, but more likely that popu-lation movements will shift from remote rural towards peri-urban areas, closer to urban serv-ices and employment. Thus there could be in-creased pressures on peri-urban areas to accom-modate growth within the most sustainable settlement and transport pattern;
At the same time, there is policy pressure to cre-ate attractive, high quality urban communities to limit outward migration. Much of this effort will focus on the peri-urban areas, where much of the population live by choice;
Protection of carbon sinks and storage in both rural and peri-urban areas. This will be topical where there are multifunctional land use objec-tives, such as habitat conservation, tourism and heritage, or other ecosystem services that link rural to peri-urban to urban areas.

111
Spatial patterns and challenges
T he peri-urban Climate Vulnerability Index (Figure 55) shows quite a clear picture. The arid Mediter-
ranean regions face multiple challenges of rising temperatures and water stress, leading to soil erosion and rural abandonment. Northern coastal regions such as the Netherlands and Belgium are also at in-creasing risk of sea-level rise and storms. Other low lying areas in western France, northern Italy and Po-land are also at risk from river flooding, soil erosion and ecological disruption. However, there are still in-land peri-urban areas in the core regions which are relatively low risk at present.
Overall, the policy challenges from energy and climate change are manifold. If peri-urban areas were carefully planned, and strategically governed, these challenges would be a more straightforward problem. But at present, there is fragmentation of governance, conflict between market and state, ar-guments over the allocation of costs and benefits, and uncertainty over the economic and technologi-cal trajectory. So there is a very topical agenda to be followed up on for each of the main policy themes in the peri-urban areas:
Built environment planning and design (particu-larly transport infrastructure) for emissions re-ductions;
Peri-urban land use change, both for climate adaptation, and for development of renewable energy sources;
Protection of infrastructure in the peri-urban areas that is at risk, such as waste, minerals and communications;
Developing other sectors, such as local food pro-duction, which can strengthen each of the above, while adding to employment and diversification;
Encouraging business innovation, social enter-prise and community resilience to cope with such changes.
This overview of climate and energy issues shows many links with other sectors, such as housing, transport, economic development, agriculture and forestry. There is also the wider challenge of coordi-nating climate change action with the challenges of globalisation and demographic change. As in the next chapter, this suggests the need for new ways of putting it together, i.e. multilevel, multi-sectoral, multifunctional ‘integrated governance for peri-ur-ban territorial cohesion’.
Figure 55: Climate Change Vulnerability Index in predominantly peri-urban regions in EU 27
> 0 – 20> 20 – 30> 30 – 40> 40 – 50> 50 – 100other regions
Source: Eurostat, JRC, DG Regio, ZALF, AIT
Flooding at the Elbe river in Lower Saxony, Germany, 2010

112
INTEGRATED DEvElopmENT
113
AND EU polICY opTIoNS
INTEGRATED DEvElopmENT
114
T his chapter takes an overview of the ‘peri-urban agenda’ from many sectors. In particular, it takes
on board the EUROPE 2020 challenges and their im-plications for peri-urban areas. From this it is clear that there are widespread conflicts between differ-ent sectors: between the needs of city and country; between the growth and conservation agendas; be-tween wealth and poverty; and between local and regional agendas. We can therefore raise some more strategic questions (Ravetz, forthcoming):
How can the policies for different sectors be in-tegrated to avoid conflict and enhance opportu-nities? This calls for a multi-sectoral governance.
How can different types of actors and stakehold-ers be brought together to address complex ter-ritorial problems? This calls for multilateral gov-ernance.
How can physical, social and economic develop-ment in the peri-urban area be governed, often with fragmented units and boundaries? This calls for a system of multilevel governance in the most suitable territorial units.
The starting points are very important:
Peri-urban problems and opportunities need to be managed in their context at the wider level of the rural-urban region. Otherwise the peri-urban will continue as a resource cupboard and dumping ground for the urban system.
The rural-urban region is the optimum unit for strategic governance and integrated develop-ment planning. But in reality the administrative, economic, social or environmental units are of-ten different. So the rural-urban region is a policy framework and a way of working for managing problems and opportunities more than a fixed boundary.
Integrated Development for peri-Urban Territorial Cohesion:The agenda for integration
The challenge of managing peri-urban areas calls for multi-level, multi-sectoral, multifunctional ‘integrated governance for peri-urban territorial cohesion’. But this is easier said than done. So this chapter sets out solutions and opportunities, firstly for the territory of the rural-urban region, and then for the governance system itself.
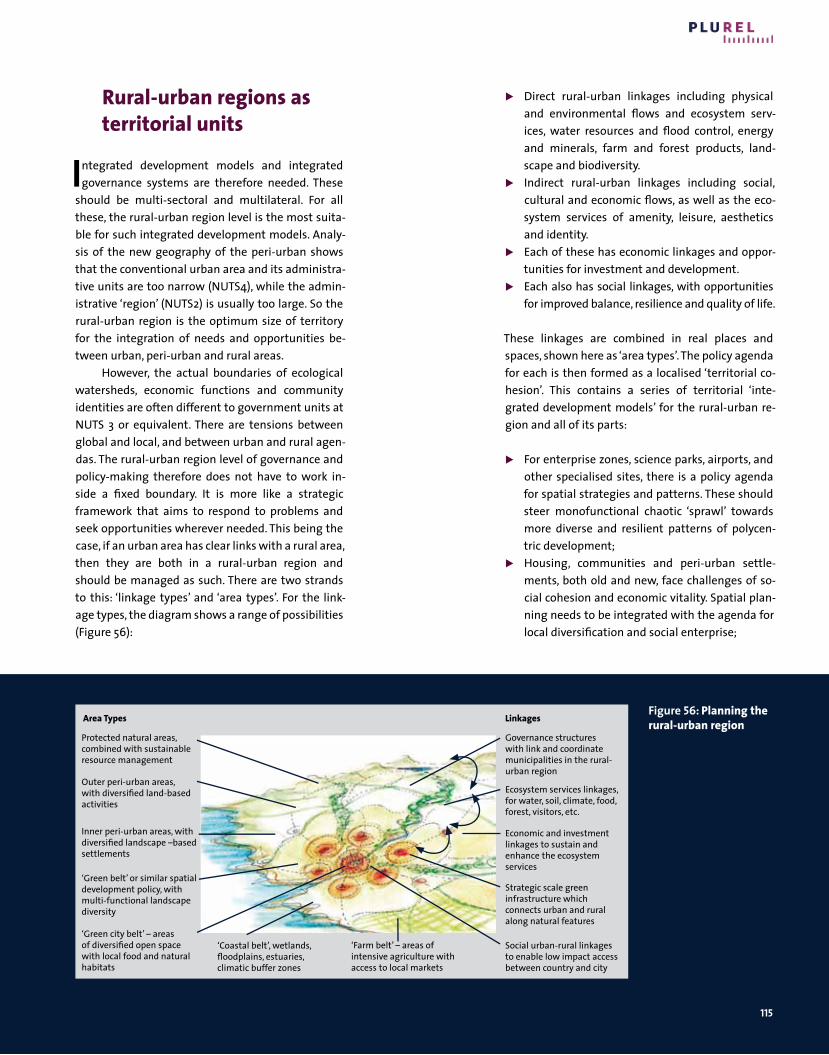
115
Rural-urban regions as territorial units
I ntegrated development models and integrated governance systems are therefore needed. These
should be multi-sectoral and multilateral. For all these, the rural-urban region level is the most suita-ble for such integrated development models. Analy-sis of the new geography of the peri-urban shows that the conventional urban area and its administra-tive units are too narrow (NUTS4), while the admin-istrative ‘region’ (NUTS2) is usually too large. So the rural-urban region is the optimum size of territory for the integration of needs and opportunities be-tween urban, peri-urban and rural areas.
However, the actual boundaries of ecological watersheds, economic functions and community identities are often different to government units at NUTS 3 or equivalent. There are tensions between global and local, and between urban and rural agen-das. The rural-urban region level of governance and policy-making therefore does not have to work in-side a fixed boundary. It is more like a strategic framework that aims to respond to problems and seek opportunities wherever needed. This being the case, if an urban area has clear links with a rural area, then they are both in a rural-urban region and should be managed as such. There are two strands to this: ‘linkage types’ and ‘area types’. For the link-age types, the diagram shows a range of possibilities (Figure 56):
Direct rural-urban linkages including physical and environmental flows and ecosystem serv-ices, water resources and flood control, energy and minerals, farm and forest products, land-scape and biodiversity.
Indirect rural-urban linkages including social, cultural and economic flows, as well as the eco-system services of amenity, leisure, aesthetics and identity.
Each of these has economic linkages and oppor-tunities for investment and development.
Each also has social linkages, with opportunities for improved balance, resilience and quality of life.
These linkages are combined in real places and spaces, shown here as ‘area types’. The policy agenda for each is then formed as a localised ‘territorial co-hesion’. This contains a series of territorial ‘inte-grated development models’ for the rural-urban re-gion and all of its parts:
For enterprise zones, science parks, airports, and other specialised sites, there is a policy agenda for spatial strategies and patterns. These should steer monofunctional chaotic ‘sprawl’ towards more diverse and resilient patterns of polycen-tric development;
Housing, communities and peri-urban settle-ments, both old and new, face challenges of so-cial cohesion and economic vitality. Spatial plan-ning needs to be integrated with the agenda for local diversification and social enterprise;
Protected natural areas, combined with sustainable resource management
Outer peri-urban areas, with diversified land-based activities
Inner peri-urban areas, with diversified landscape –based settlements
‘Green belt’ or similar spatial development policy, with multi-functional landscape diversity
‘Green city belt’ – areas of diversified open space with local food and natural habitats
Governance structures with link and coordinate municipalities in the rural- urban region
Ecosystem services linkages, for water, soil, climate, food, forest, visitors, etc.
Economic and investment linkages to sustain and enhance the ecosystem services
Strategic scale green infrastructure which connects urban and rural along natural features
Social urban-rural linkages to enable low impact access between country and city
‘Coastal belt’, wetlands, floodplains, estuaries, climatic buffer zones
‘Farm belt’ – areas of intensive agriculture with access to local markets
Area Types linkagesFigure 56: planning the rural-urban region
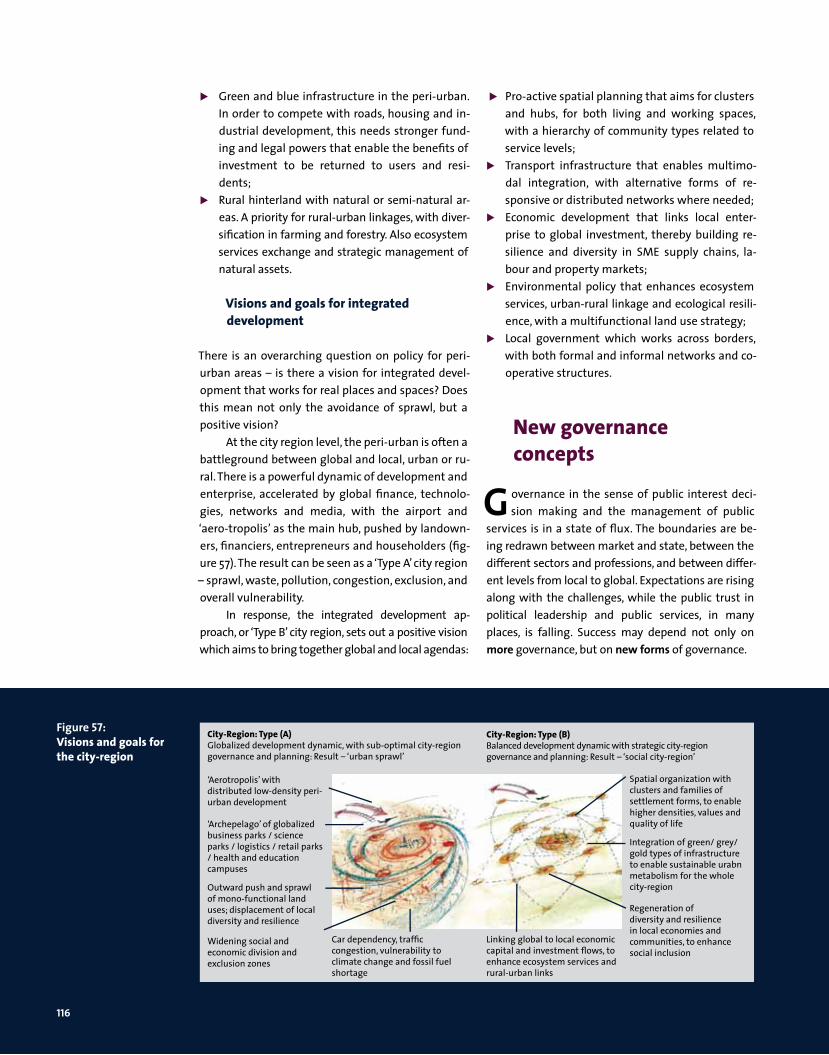
116
Green and blue infrastructure in the peri-urban. In order to compete with roads, housing and in-dustrial development, this needs stronger fund-ing and legal powers that enable the benefits of investment to be returned to users and resi-dents;
Rural hinterland with natural or semi-natural ar-eas. A priority for rural-urban linkages, with diver-sification in farming and forestry. Also ecosystem services exchange and strategic management of natural assets.
visions and goals for integrated development
There is an overarching question on policy for peri-urban areas – is there a vision for integrated devel-opment that works for real places and spaces? Does this mean not only the avoidance of sprawl, but a positive vision?
At the city region level, the peri-urban is often a battleground between global and local, urban or ru-ral. There is a powerful dynamic of development and enterprise, accelerated by global finance, technolo-gies, networks and media, with the airport and ‘aero-tropolis’ as the main hub, pushed by landown-ers, financiers, entrepreneurs and householders (fig-ure 57). The result can be seen as a ‘Type A’ city region – sprawl, waste, pollution, congestion, exclusion, and overall vulnerability.
In response, the integrated development ap-proach, or ‘Type B’ city region, sets out a positive vision which aims to bring together global and local agendas:
Pro-active spatial planning that aims for clusters and hubs, for both living and working spaces, with a hierarchy of community types related to service levels;
Transport infrastructure that enables multimo-dal integration, with alternative forms of re-sponsive or distributed networks where needed;
Economic development that links local enter-prise to global investment, thereby building re-silience and diversity in SME supply chains, la-bour and property markets;
Environmental policy that enhances ecosystem services, urban-rural linkage and ecological resili-ence, with a multifunctional land use strategy;
Local government which works across borders, with both formal and informal networks and co-operative structures.
New governance concepts
G overnance in the sense of public interest deci-sion making and the management of public
services is in a state of flux. The boundaries are be-ing redrawn between market and state, between the different sectors and professions, and between differ-ent levels from local to global. Expectations are rising along with the challenges, while the public trust in political leadership and public services, in many places, is falling. Success may depend not only on more governance, but on new forms of governance.
‘Aerotropolis’ with distributed low-density peri-urban development
‘Archepelago’ of globalized business parks / science parks / logistics / retail parks / health and education campuses
Outward push and sprawl of mono-functional land uses; displacement of local diversity and resilience
Widening social and economic division and exclusion zones
Spatial organization with clusters and families of settlement forms, to enable higher densities, values and quality of life
Integration of green/ grey/ gold types of infrastructure to enable sustainable urabn metabolism for the whole city-region
Regeneration of diversity and resilience in local economies and communities, to enhance social inclusion
Car dependency, traffic congestion, vulnerability to climate change and fossil fuel shortage
Linking global to local economic capital and investment flows, to enhance ecosystem services and rural-urban links
City-Region: Type (B)Balanced development dynamic with strategic city-region governance and planning: Result – ‘social city-region’
City-Region: Type (A)Globalized development dynamic, with sub-optimal city-region governance and planning: Result – ‘urban sprawl’
Figure 57: visions and goals for the city-region
117
The comparison of regional case studies in PLUREL brought this agenda to the fore (Aalbers and Eckerberg, 2010). There were four main fields of in-vestigation related to the application of recent thinking on multilevel governance:
‘Rules of the game’, i.e. the formal structures of government and spatial planning. In some cases, these were quite fixed and detailed. In others they were quite fluid. And in yet further cases, there was a kind of dual governance that com-bined elaborate rules with a parallel low level of corruption, favouritism and nepotism. The policy recommendation is clearly for extended strate-gic governance at the rural-urban region level. However, this is politically difficult in many cases;
‘Control of resources’, particularly ownership or control of land, utilities and finance by the public sector. In most EU regions, there is a shift away from social democratic states towards neo-liber-alised modes of privatisation, franchising and deregulation. Therefore, effective control of re-sources is more concerned with the mobilisation of a wider community or coalition by the govern-ment;
Coalition and the process of forming wider so-cial and ideological partnerships is a key theme. Each of the peri-urban cases was driven by some kind of partnership or social contract between public sector agencies, landowners, financiers, farmers, utilities and so on. Conflicts over land use and resources can be understood as ideo-logical coalition conflicts as much as the actual case;
‘Discourses’ or ideological narratives. This is per-haps the most powerful and the least under-stood of dynamics related to peri-urban change. Certainly the discourse of polluted, dangerous cities versus clean and safe countryside is re-sponsible for much peri-urban change. Public discourses feed coalitions, coalitions grab re-sources, and with resources they can shape the rules of the game. In this sense, a discourse of peri-urban change does not have to be negative, except that it can focus and magnify existing di-visions and conflicts in society, as formed in land use patterns.
Governance in the peri-urban context
The implications of this are interesting. Firstly, the peri-urban territory is a new and fluid kind of geo-graphical space, where conventional ‘governance’ is often lacking. By its nature, the peri-urban crosses administrative boundaries, with changes driven by local and global forces. It is often the site of conflict between wealthy and poor, city and country, immi-grants and natives, or new and old. Such conflicts are brought into focus by questions such as: Whose is this territory? Who decides what happens? And who gets the costs or benefits? In general, there are new challenges for governance in the peri-urban situa-tion:
Linking territories to networks which cross mul-tiple boundaries, with sometimes highly mobile and globalised social-economic groups;
Multifunctional policy agendas for the peri-ur-ban landscape relating to energy and carbon, food, leisure, ecology, business park, retail park etc.;
Multilevel decision making where strategic and local objectives need to be coordinated;
Multi-sector working, which aims to realise the potential and added value from a wide range of stakeholders and ‘communities of interest’.
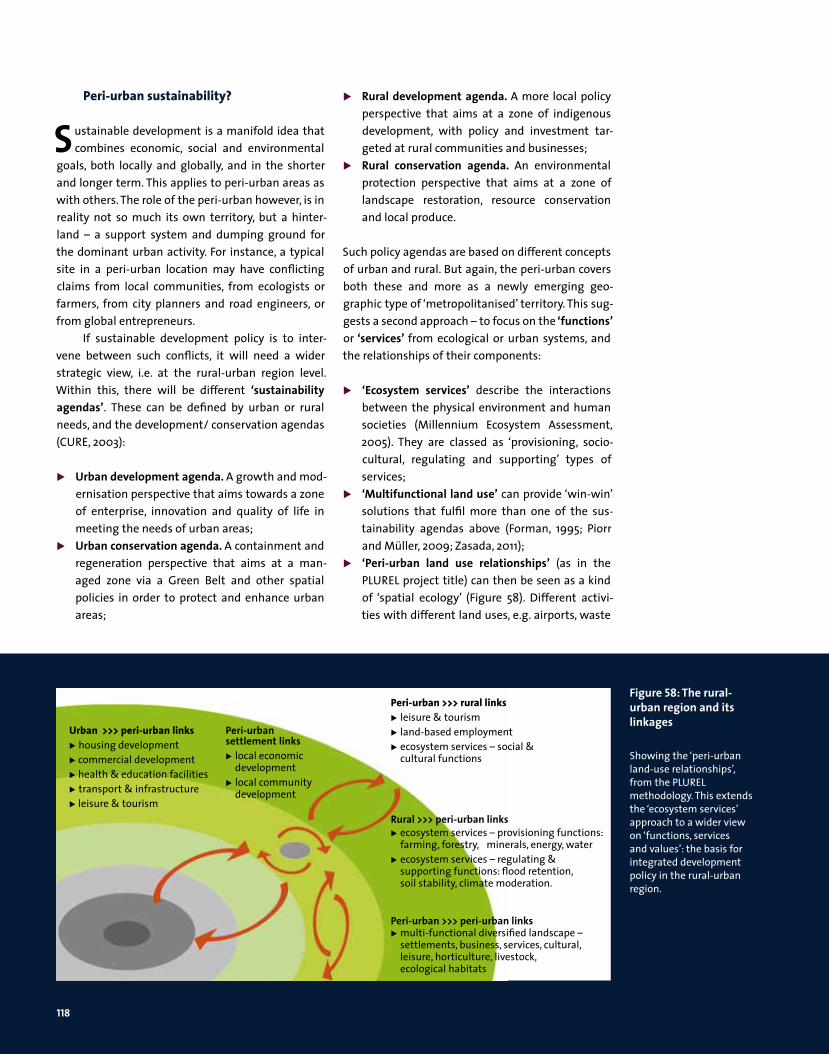
118
peri-urban sustainability?
S ustainable development is a manifold idea that combines economic, social and environmental
goals, both locally and globally, and in the shorter and longer term. This applies to peri-urban areas as with others. The role of the peri-urban however, is in reality not so much its own territory, but a hinter-land – a support system and dumping ground for the dominant urban activity. For instance, a typical site in a peri-urban location may have conflicting claims from local communities, from ecologists or farmers, from city planners and road engineers, or from global entrepreneurs.
If sustainable development policy is to inter-vene between such conflicts, it will need a wider strategic view, i.e. at the rural-urban region level. Within this, there will be different ‘sustainability agendas’. These can be defined by urban or rural needs, and the development/ conservation agendas (CURE, 2003):
Urban development agenda. A growth and mod-ernisation perspective that aims towards a zone of enterprise, innovation and quality of life in meeting the needs of urban areas;
Urban conservation agenda. A containment and regeneration perspective that aims at a man-aged zone via a Green Belt and other spatial policies in order to protect and enhance urban areas;
Rural development agenda. A more local policy perspective that aims at a zone of indigenous development, with policy and investment tar-geted at rural communities and businesses;
Rural conservation agenda. An environmental protection perspective that aims at a zone of landscape restoration, resource conservation and local produce.
Such policy agendas are based on different concepts of urban and rural. But again, the peri-urban covers both these and more as a newly emerging geo-graphic type of ‘metropolitanised’ territory. This sug-gests a second approach – to focus on the ‘functions’ or ‘services’ from ecological or urban systems, and the relationships of their components:
‘Ecosystem services’ describe the interactions between the physical environment and human societies (Millennium Ecosystem Assessment, 2005). They are classed as ‘provisioning, socio-cultural, regulating and supporting’ types of services;
‘Multifunctional land use’ can provide ‘win-win’ solutions that fulfil more than one of the sus-tainability agendas above (Forman, 1995; Piorr and Müller, 2009; Zasada, 2011);
‘Peri-urban land use relationships’ (as in the PLUREL project title) can then be seen as a kind of ‘spatial ecology’ (Figure 58). Different activi-ties with different land uses, e.g. airports, waste
Figure 58: The rural-urban region and its linkages
Showing the ‘peri-urban land-use relationships’, from the PLUREL metho dology. This extends the ‘ecosystem services’ approach to a wider view on ‘functions, services and values’: the basis for integrated development policy in the rural-urban region.
Urban >>> peri-urban links housing development commercial development health & education facilities transport & infrastructure leisure & tourism
Peri-urban settlement links local economic development local community development
Rural >>> peri-urban links ecosystem services – provisioning functions: farming, forestry, minerals, energy, water ecosystem services – regulating & supporting functions: flood retention, soil stability, climate moderation.
peri-urban >>> rural links leisure & tourism land-based employment ecosystem services – social & cultural functions
Peri-urban >>> peri-urban links multi-functional diversified landscape – settlements, business, services, cultural, leisure, horticulture, livestock, ecological habitats
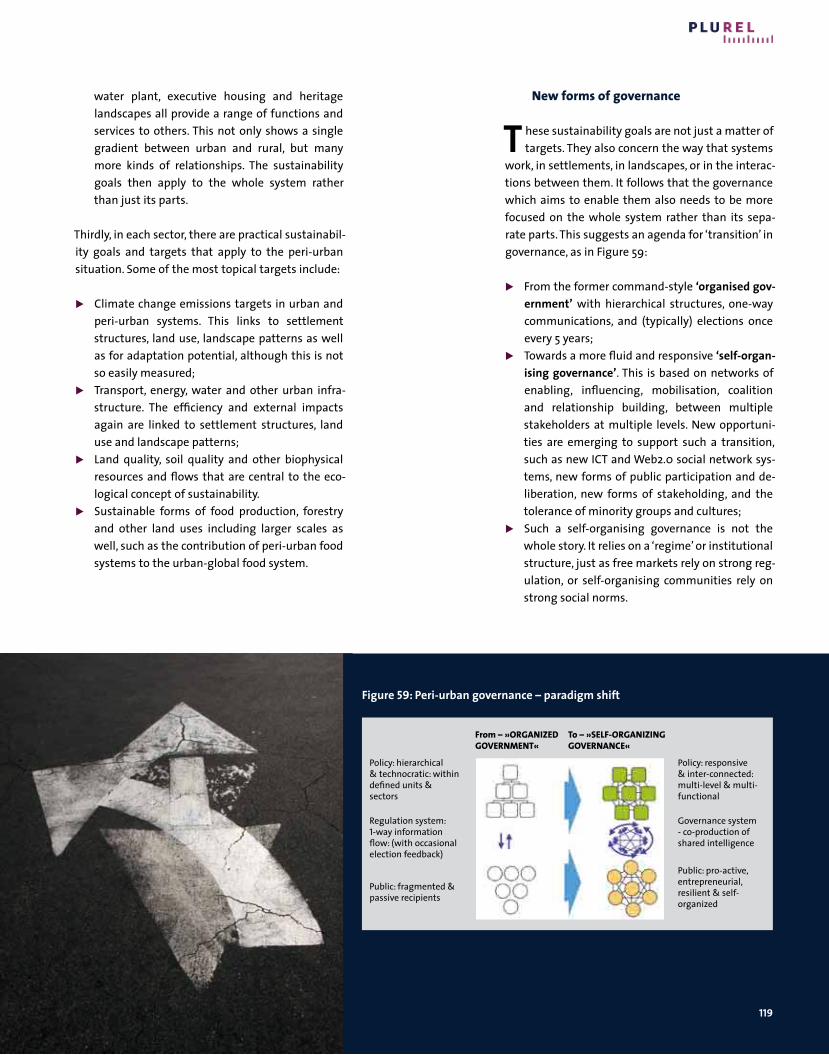
119
water plant, executive housing and heritage landscapes all provide a range of functions and services to others. This not only shows a single gradient between urban and rural, but many more kinds of relationships. The sustainability goals then apply to the whole system rather than just its parts.
Thirdly, in each sector, there are practical sustainabil-ity goals and targets that apply to the peri-urban situation. Some of the most topical targets include:
Climate change emissions targets in urban and peri-urban systems. This links to settlement structures, land use, landscape patterns as well as for adaptation potential, although this is not so easily measured;
Transport, energy, water and other urban infra-structure. The efficiency and external impacts again are linked to settlement structures, land use and landscape patterns;
Land quality, soil quality and other biophysical resources and flows that are central to the eco-logical concept of sustainability.
Sustainable forms of food production, forestry and other land uses including larger scales as well, such as the contribution of peri-urban food systems to the urban-global food system.
New forms of governance
T hese sustainability goals are not just a matter of targets. They also concern the way that systems
work, in settlements, in landscapes, or in the interac-tions between them. It follows that the governance which aims to enable them also needs to be more focused on the whole system rather than its sepa-rate parts. This suggests an agenda for ‘transition’ in governance, as in Figure 59:
From the former command-style ‘organised gov-ernment’ with hierarchical structures, one-way communications, and (typically) elections once every 5 years;
Towards a more fluid and responsive ‘self-organ-ising governance’. This is based on networks of enabling, influencing, mobilisation, coalition and relationship building, between multiple stakeholders at multiple levels. New opportuni-ties are emerging to support such a transition, such as new ICT and Web2.0 social network sys-tems, new forms of public participation and de-liberation, new forms of stakeholding, and the tolerance of minority groups and cultures;
Such a self-organising governance is not the whole story. It relies on a ‘regime’ or institutional structure, just as free markets rely on strong reg-ulation, or self-organising communities rely on strong social norms.
Figure 59: Peri-urban governance – paradigm shift
Policy: hierarchical & technocratic: within defined units & sectors
Regulation system: 1-way information flow: (with occasional election feedback)
Public: fragmented & passive recipients
From – »oRGANIZED GovERNmENT«
To – »SElF-oRGANIZING GovERNANCE«
Policy: responsive & inter-connected: multi-level & multi-functional
Governance system - co-production of shared intelligence
Public: pro-active, entrepreneurial, resilient & self-organized
120
New institutional models
N ew forms of institutions and partnerships can also be seen at work in the peri-urban. Where
there is overlap between public, private and ‘third’ sectors, the results can combine the innovation of the private sector, the security of the public sector, and the ethical values of the third sector (Figure 60). We can classify these partnerships and linkages into three basic combinations – public-private, private-community and public-community – where each sector has certain strengths, weaknesses, opportu-nities and threats.
Public-private linkages include various partner-ships and consortiums, ethical procurement, supply chain initiatives, and much of main-stream economic development activity.
Private-community sector linkages include local business or regeneration partnerships, social in-vestment funds, ‘mutual’ or cooperative finance firms, corporate trusts and companies, consumer clubs and networks, cooperatives, community development trusts and other forms of social enterprise.
Community-public sector linkages include vol-untary sector compacts, neighbourhood part-nerships, customer charters, intermediate labour markets, social trading, and other forms of com-munity enterprise.
Each of these can have a role to play in a typical mul-tifunctional peri-urban project. For instance, many peri-urban country parks in the UK are owned by non-profit organisations, with a public-private part-nership for infrastructure investment, a business-community section for commercial tourism and a public sector-community ‘land trust’ with education and training programmes.
private sectorFarmersLandownersDevelopersOperators
3rd sector: Community groupsConservation groupsSocial enterprise groups Social landlords etc.
public sectorLocal authoritiesRegional authorities Public servicesPublic landholders
Development obligations Access agreementsStewardship schemes
Farmers marketsTourism / heritage partnershipsVillage business forums
Area forumsCountryside partnershipsConservation compacts
Figure 60: peri-urban institutions & partnershipsshowing typical examples from the peri-urban case studies
To square the circle …new challenges ask for new institutional integra-tion. Melbourne, Australia
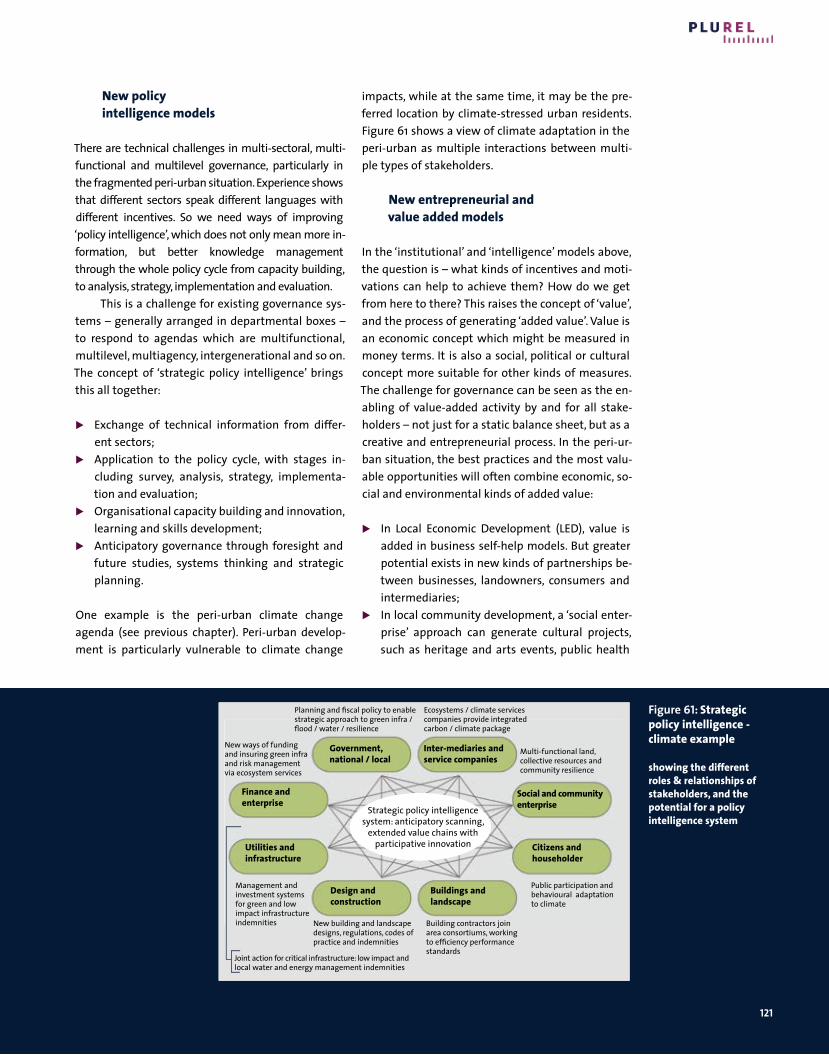
121
New policy intelligence models
There are technical challenges in multi-sectoral, multi-functional and multilevel governance, particularly in the fragmented peri-urban situation. Experience shows that different sectors speak different languages with different incentives. So we need ways of improving ‘policy intelligence’, which does not only mean more in-formation, but better knowledge management through the whole policy cycle from capacity building, to analysis, strategy, implementation and evaluation.
This is a challenge for existing governance sys-tems – generally arranged in departmental boxes – to respond to agendas which are multifunctional, multilevel, multiagency, intergenerational and so on. The concept of ‘strategic policy intelligence’ brings this all together:
Exchange of technical information from differ-ent sectors;
Application to the policy cycle, with stages in-cluding survey, analysis, strategy, implementa-tion and evaluation;
Organisational capacity building and innovation, learning and skills development;
Anticipatory governance through foresight and future studies, systems thinking and strategic planning.
One example is the peri-urban climate change agenda (see previous chapter). Peri-urban develop-ment is particularly vulnerable to climate change
impacts, while at the same time, it may be the pre-ferred location by climate-stressed urban residents. Figure 61 shows a view of climate adaptation in the peri-urban as multiple interactions between multi-ple types of stakeholders.
New entrepreneurial and value added models
In the ‘institutional’ and ‘intelligence’ models above, the question is – what kinds of incentives and moti-vations can help to achieve them? How do we get from here to there? This raises the concept of ‘value’, and the process of generating ‘added value’. Value is an economic concept which might be measured in money terms. It is also a social, political or cultural concept more suitable for other kinds of measures. The challenge for governance can be seen as the en-abling of value-added activity by and for all stake-holders – not just for a static balance sheet, but as a creative and entrepreneurial process. In the peri-ur-ban situation, the best practices and the most valu-able opportunities will often combine economic, so-cial and environmental kinds of added value: In Local Economic Development (LED), value is
added in business self-help models. But greater potential exists in new kinds of partnerships be-tween businesses, landowners, consumers and intermediaries;
In local community development, a ‘social enter-prise’ approach can generate cultural projects, such as heritage and arts events, public health
Figure 61: Strategic policy intelligence - climate example
showing the different roles & relationships of stakeholders, and the potential for a policy intelligence system
Inter-mediaries and service companies
Social and community enterprise
Citizens and householder
Buildings and landscape
Design and construction
Finance and enterprise
Government, national / local
Utilities and infrastructure
Ecosystems / climate services companies provide integrated carbon / climate package
Multi-functional land, collective resources and community resilience
Public participation and behavioural adaptation to climate
Building contractors join area consortiums, working to efficiency performance standards
New building and landscape designs, regulations, codes of practice and indemnities
Management and investment systems for green and low impact infrastructure indemnities
New ways of funding and insuring green infra and risk management via ecosystem services
Planning and fiscal policy to enable strategic approach to green infra / flood / water / resilience
Joint action for critical infrastructure: low impact and local water and energy management indemnities
Strategic policy intelligence system: anticipatory scanning,
extended value chains with participative innovation
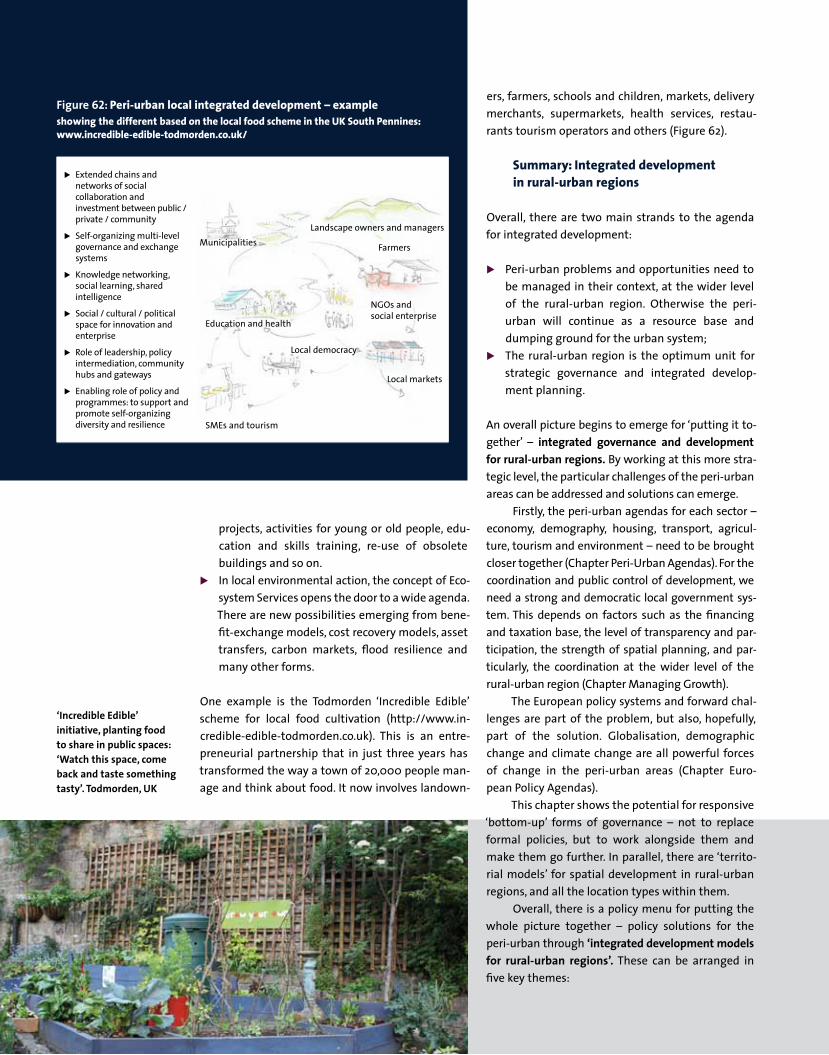
122
projects, activities for young or old people, edu-cation and skills training, re-use of obsolete buildings and so on.
In local environmental action, the concept of Eco-system Services opens the door to a wide agenda. There are new possibilities emerging from bene-fit-exchange models, cost recovery models, asset transfers, carbon markets, flood resilience and many other forms.
One example is the Todmorden ‘Incredible Edible’ scheme for local food cultivation (http://www.in-credible-edible-todmorden.co.uk). This is an entre-preneurial partnership that in just three years has transformed the way a town of 20,000 people man-age and think about food. It now involves landown-
ers, farmers, schools and children, markets, delivery merchants, supermarkets, health services, restau-rants tourism operators and others (Figure 62).
Summary: Integrated development in rural-urban regions
Overall, there are two main strands to the agenda for integrated development:
Peri-urban problems and opportunities need to be managed in their context, at the wider level of the rural-urban region. Otherwise the peri-urban will continue as a resource base and dumping ground for the urban system;
The rural-urban region is the optimum unit for strategic governance and integrated develop-ment planning.
An overall picture begins to emerge for ‘putting it to-gether’ – integrated governance and development for rural-urban regions. By working at this more stra-tegic level, the particular challenges of the peri-urban areas can be addressed and solutions can emerge.
Firstly, the peri-urban agendas for each sector – economy, demography, housing, transport, agricul-ture, tourism and environment – need to be brought closer together (Chapter Peri-Urban Agendas). For the coordination and public control of development, we need a strong and democratic local government sys-tem. This depends on factors such as the financing and taxation base, the level of transparency and par-ticipation, the strength of spatial planning, and par-ticularly, the coordination at the wider level of the rural-urban region (Chapter Managing Growth).
The European policy systems and forward chal-lenges are part of the problem, but also, hopefully, part of the solution. Globalisation, demographic change and climate change are all powerful forces of change in the peri-urban areas (Chapter Euro-pean Policy Agendas).
This chapter shows the potential for responsive ‘bottom-up’ forms of governance – not to replace formal policies, but to work alongside them and make them go further. In parallel, there are ‘territo-rial models’ for spatial development in rural-urban regions, and all the location types within them.
Overall, there is a policy menu for putting the whole picture together – policy solutions for the peri-urban through ‘integrated development models for rural-urban regions’. These can be arranged in five key themes:
Figure 62: peri-urban local integrated development – exampleshowing the different based on the local food scheme in the UK South pennines: www.incredible-edible-todmorden.co.uk/
Extended chains and networks of social collaboration and investment between public / private / community
Self-organizing multi-level governance and exchange systems
Knowledge networking, social learning, shared intelligence
Social / cultural / political space for innovation and enterprise
Role of leadership, policy intermediation, community hubs and gateways
Enabling role of policy and programmes: to support and promote self-organizing diversity and resilience
Landscape owners and managers
Farmers
NGOs and social enterprise
Local markets
Local democracy
SMEs and tourism
Municipalities
Education and health
‘Incredible Edible’ initiative, planting food to share in public spaces: ‘Watch this space, come back and taste something tasty’. Todmorden, UK
123
Spatial strategy. This involves a policy frame-work at the level of the rural-urban region, co-ordinating peri-urban development and low-impact infrastructure and setting up controls and incentives to avoid sprawl. The focus is on the peri-urban as a priority agenda together with its rural-urban linkages and relation-ships;
Economic strategy. This involves peri-urban di-versification and resilience of local economies and employment, rural diversification, urban regeneration with improved urban-rural links, property ownership with social and environ-mental responsibility and public access. The focus is on the social economy and social enter-prise in the peri-urban;
Social strategy. This involves housing and service provision to encourage balanced, inclusive and resilient communities, leisure and tourism that is open and accessible, value, and a safe-guarded social and cultural heritage. The focus lies on the needs and opportunities in different settlement types in the peri-urban;
Environmental strategy. This involves ecosys-tem-services policy and investment systems, climate change mitigation and adaptation, landscape and habitat conservation, and multi-level green-blue infrastructure. The focus is on the agenda for diversified, multifunctional agriculture and forestry;
Governance strategy. This involves strong and democratic municipal government, healthy fi-nances and an active role in the local economy, along with transparency among public and stakeholder participation. The focus is on the ca-pacity for strategic and cross-border coordina-tion at the level of the rural-urban region, as well as on a sustainable development that ca-ters for the needs of all stakeholders, and does not simply reproduce existing structures of wealth and power.
Application to multilevel governance
I is easy to call for multilevel and multi-sectoral governance, but not as simple to make it a reality.
It is therefore a good reason to work at a number of levels, from local to regional, national and EU level. There are also good reasons to work with both for-mal and informal governance, in the event of gov-ernance gaps or policy failures at one or another level. So the ‘integrated development model’ above is designed to work directly at the rural-urban re-gion level, and also above or below this level:
A community-led ‘bottom-up’ approach. This looks for added value at a more local level includ-ing self-organising communities of interest, with residents, landowners, infrastructure firms, businesses, social enterprises, health and educa-tion, NGOs and community organisations;
The rural-urban region itself is a policy-driven concept. Where an urban area has clear links with a rural area, then they are de facto part of a rural-urban region, and need to be managed as such;
EU-initiated top-down approach. The next chapter sets out strategic options for the contribution of EU policy. Some of these rely on a strong EU com-mitment by national governments, and strong public finances that are presently scarce. Others mark more flexible ways for the EU level to support and enable other levels of activity towards the re-quired sustainable and integrated direction.
EU countries are very different regarding the chances of these three types of organising governance ap-proaches. Reality may prove the need for a mixed ap-proach, for which an EU level framework, as in the next chapter, should enable and encourage. Overall, these new models of peri-urban governance are in many ways old models. They need to be reinvented for the new challenges of globalising networked peri-urban territories in the 21st century.
Land art: mirrors near Linz, Austria
124
NEW EURopEAN DIRECTIoNS
policy integration: the need for EU level coordination frameworks
There is a growing urban sprawl problem across the EU, but also an integrated peri-urban development opportunity and agenda. Both problems and opportunities need to be ad-dressed by all EU policy and funding programmes that have implications for spatial development and territorial cohesion. To cope with the problems and make the most of the oppor-tunities, territorial ‘integrated development’ models for ru-ral-urban regions should become a requirement across all EU countries. To implement this step, we have identified five possible options for EU-level policy and/or financial interven-tion. The advantages and possible drawbacks of these op-tions are discussed, so that EU policy makers and stakehold-ers can take the agenda forward.
125
T he PLUREL research shows that EU policy goals – as in the Lisbon Agenda – are very likely to ac-
celerate urban sprawl in light of current trends. The highest growth scenario, which is mostly driven by global enterprise and innovation, leads to the highest increase in artificial surfaces. Within all scenarios, it is the peri-urban areas of the regions where this change will be the most intense – on av-erage, an increase of between 1.4 – 2.5% per year. On the European spatial scale, it is the most developed Central or ‘Pentagon’ peri-urban regions that will re-ceive the highest increase in urban development, possibly doubling their existing area by 2040.
These results clearly show the threat of fur-ther increases to existing disparities within Europe. The pressure for increased urbanisation is most in-tense in areas which are already mainly peri-urban and in many aspects over-densified. Given that fur-ther urbanisation is more or less inevitable, there is a policy choice which depends on the level of pub-lic control over land use changes: urban sprawl or more concentrated (compact/polycentric) urban development.
The analysis of the main future challenges of European development (ageing, climate change, globalisation, energy shortages) has highlighted the problems of narrow sectoral approaches. For instance, zero-emission houses can be too expen-
sive, affordable housing often encourages car use, and compact development might exclude low in-come earners. Tackling any one challenge sepa-rately usually creates additional problems for others. These conflicts are especially significant in the peri-urban areas. Economy- and housing-induced sprawl is in conflict with land for agriculture and recreation. There is also competition for water be-tween agriculture, industry and domestic use etc. Overall, there is a range of spatial problems at dif-ferent scales that are often most challenging in peri-urban areas:
Urban-rural balance. Urban sprawl can easily destroy the viability of both urban and rural areas;
Interregional balance. Many peri-urban areas are either depopulated or over-pressured by commuter settlements;
Cross border effects. Many agglomerations and functional rural-urban regions cross national borders and need integrated forms of plan-ning;
Pan-EU balance. For example, there are imbal-ances between shrinking eastern regions and the over-heated Pentagon area, or from remote Nordic areas to the sprawl on the Mediterra-nean coast.
The problem at the pan-EU level
126
T he recent Europe 2020 strategy seeks to integrate the economic, environmental and social aspects
of development. To achieve the new smart, sustaina-ble and inclusive development path, strategic coordi-nation of both policy goals and market processes are needed as summarised by the Leipzig Charter:
Transversal – coordination across sectoral de-partments;
Vertical – a multilevel governance system where each level contributes to the integration of sec-toral policies;
Horizontal – multi-territorial coordination be-tween cities, urban/rural linkages and metropol-itan agglomerations;
Multilateral coordination involving citizens and all actors concerned.
The limited results so far of the Lisbon Agenda show that EU-wide strategies cannot succeed without the sharing of responsibility at the sub-national level. Similarly, one of the main weaknesses of the Europe 2020 strategy is the lack of a territorial dimension. The PLUREL results show how the Europe 2020 poli-cies depend on the territorial level of integrated planning to assure the green and social aspects of economic development strategies. They also under-line this should focus on the rural-urban region unit that brings together functional urban regions with their peri-urban and rural surroundings.
PLUREL analysis has shown that the public steering of market processes towards sustainable de-velopment presupposes strong formal government institutions and planning systems, as well as coordi-nated functioning of financial and sectoral policies. The bottom-up, more informal governance aspects are also crucial for integrated development at the ru-ral-urban region level. While these cannot replace the formal structures, they can help where formal struc-tures are weak or missing to a given extent.
Territorial Cohesion and the peri-urban agenda
T he European Union, without being directly re-sponsible, nonetheless has a role to play in the
shaping of future European territorial development, with special regard to the peri-urban agenda. This is a multilevel agenda which demands cooperation between the EU, national, regional and local levels. At the EU level, the theme of ‘Territorial Cohesion’ (TC) focuses on the spatial implications of the Lisbon Agenda “to assist in improving the governance of co-hesion policy, making it more flexible, more capable of adapting to the most appropriate territorial scale, more responsive to local preferences and needs, and better coordinated with other policies, with the prin-ciple of subsidiarity” (CEC 2008). The TC themes and objectives are very relevant to the peri-urban agenda:
Cooperation between territories involves cross border coordination and strategic policy at mul-tiple scales. This works with the peri-urban as an interface between urban/rural areas, or between different urban and regional systems. Policy also needs to look at the peri-urban as an area type in its own right, with its particular needs and op-portunities;
Territorial programming uses the territory rather than the sector as the base for policies and pro-grammes. Functional rural-urban regions need to be considered as integrated systems. Until now, it has often been the case that the peri-ur-ban territory has not been the object of policy discussions;
Coordination of policies with territorial impact. This is very relevant to the peri-urban, which is often an area of conflict or competition between different policy regimes – particularly the urban and rural. The obvious example is regional devel-opment funding, which helps to produce urban sprawl in the peri-urban area;
Evidence based policy. Here it is clear that tradi-tional forms of evidence in urban or rural ‘units of analysis’ may not reflect the reality of peri-urban spaces within functional rural- urban re-gions. There is a need for new forms of research and evidence based on the new spaces of the peri-urban (of which the PLUREL project is one contribution).

127
Alternative policy options
On the basis of PLUREL results, it is clear that the EU faces a new challenge in playing a role initiating better public steer-ing of peri-urban development processes. Otherwise, the economic development and growth-oriented policies will lead to unacceptable urban sprawl mainly in the peri-urban areas. This challenge can be approached through different types of EU policy frameworks aimed at more integrated de-velopment at the rural-urban region level. Five main options can be drafted for such a policy framework for the post-2013 period:
Option (a) – EU Integrated Development Framework Directive Option (b) – EU Integrated Development Conditionality Option (c) – EU Integrated Development Community Initiative Option (d) – Open Method of Coordination for Integrated Development in Functional Regions Option (e) – EU Reference Framework for Integrated Development in Functional Regions
Each of these options, which are ranked from the strongest down to the weakest, have benefits and disadvantages, and can be summarised as follows.

128
option (a): EU Integrated Development Framework Directive
T he ‘Integrated Development Framework Direc-tive’ would aim at setting the agenda and the
standard for integrated territorial development pol-icy. It would strive to provide a legal basis for regula-tory reform including guidance for regional funding and infrastructure development at several levels, and a framework for negotiation and assessment that is built into the policy process.
Similar existing tools are mainly in the environ-mental sector, e.g. the Environmental Assessment Directive and Water Framework Directive. Both of these initiatives are world-leading demonstrations of integrated and proactive policy and regulation. From the history of these directives, it could be learnt that (a) they can be complex and lengthy to transpose to the national level, (b) new tools and methods are needed together with definitions, boundaries, practices and professional skills etc.
It must be emphasised that such an Integrated Development Framework Directive does not have to define exactly, and with pan-European relevance, the content of the required sustainable and inte-grated development policy. Rather, it can concen-trate on procedural questions.
Pre-assumptions for this option: member states accept the extension of Commission competences.
Similar tools already existing: Environmental As-sessment Directive, Water Framework Directive.
Advantages of this option: the scope is not only focused on European financing, but other forms of development in general.
Potential barriers or risks: the process (steps) to reach the broad aims of European rural-urban de-velopment has to be precisely defined in legal terms with overall relevance to all member states.
option (b): EU Integrated Development Conditionality
T o access European funding, integrated develop-ment plans would have to be prepared on the
functional rural-urban region level and be approved by relevant political bodies. This proposal is already under discussion as a possible ‘mandatory territorial dimension’ in National Strategic Reference Frame-works and their Operational Programmes for the 2014 – 2020 period.
Pre-assumptions for this option: member states accept the extension of EU competences over EU funding, and functional rural-urban regions are accepted as a practical basis for planning.
Similar tools already existing: all other condi-tions placed on Structural Funds to be used (e.g. equal opportunities and gender criteria).
Advantages of this option: it would be a power-ful tool given to the Commission to promote in-tegrated territorial planning.
Potential barriers or risks: the main criteria (not the precise borders) for functional regions have to be given with pan-European relevance. Inte-grated development planning has to be phrased very precisely, and the monitoring of the fulfill-ment of the conditions requires capacities in the Commission. Also, this option will have less in-fluence on countries and regions which receive less EU funding, which include most of the Pen-tagon areas that have the highest pressure on the peri-urban.
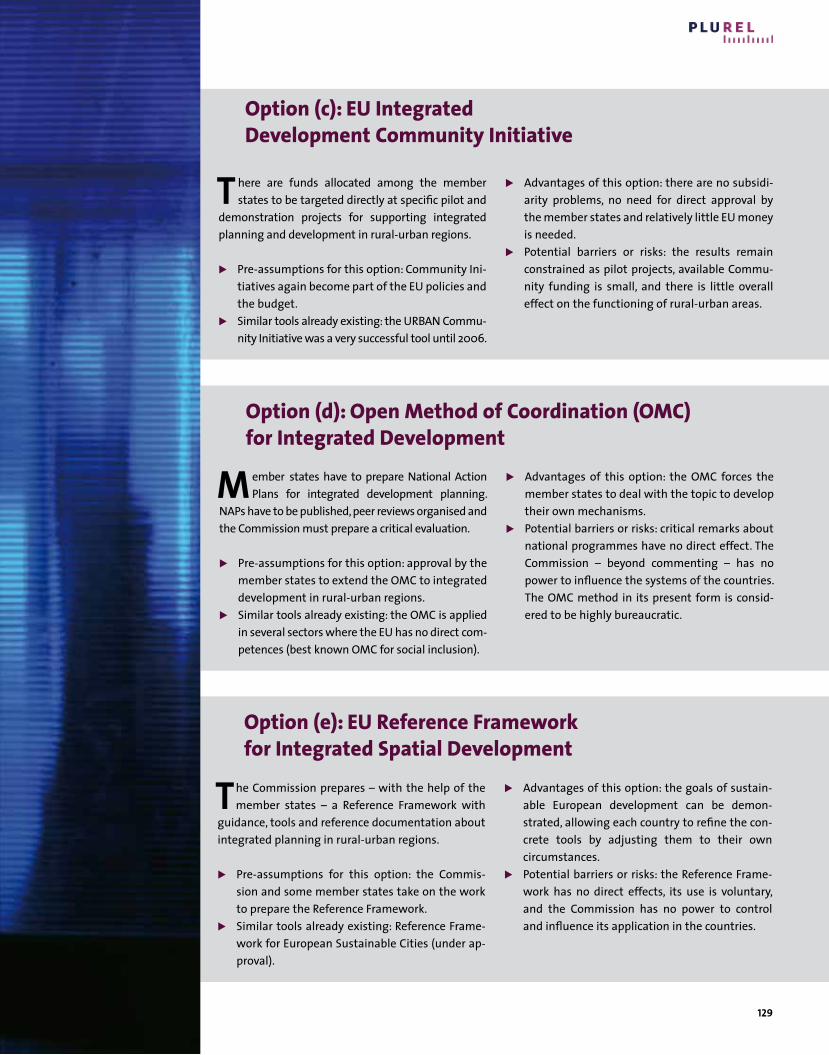
129
option (c): EU Integrated Development Community Initiative
T here are funds allocated among the member states to be targeted directly at specific pilot and
demonstration projects for supporting integrated planning and development in rural-urban regions.
Pre-assumptions for this option: Community Ini-tiatives again become part of the EU policies and the budget.
Similar tools already existing: the URBAN Commu-nity Initiative was a very successful tool until 2006.
Advantages of this option: there are no subsidi-arity problems, no need for direct approval by the member states and relatively little EU money is needed.
Potential barriers or risks: the results remain constrained as pilot projects, available Commu-nity funding is small, and there is little overall effect on the functioning of rural-urban areas.
option (d): open method of Coordination (omC)for Integrated Development
option (e): EU Reference Frameworkfor Integrated Spatial Development
M ember states have to prepare National Action Plans for integrated development planning.
NAPs have to be published, peer reviews organised and the Commission must prepare a critical evaluation.
Pre-assumptions for this option: approval by the member states to extend the OMC to integrated development in rural-urban regions.
Similar tools already existing: the OMC is applied in several sectors where the EU has no direct com-petences (best known OMC for social inclusion).
T he Commission prepares – with the help of the member states – a Reference Framework with
guidance, tools and reference documentation about integrated planning in rural-urban regions.
Pre-assumptions for this option: the Commis-sion and some member states take on the work to prepare the Reference Framework.
Similar tools already existing: Reference Frame-work for European Sustainable Cities (under ap-proval).
Advantages of this option: the OMC forces the member states to deal with the topic to develop their own mechanisms.
Potential barriers or risks: critical remarks about national programmes have no direct effect. The Commission – beyond commenting – has no power to influence the systems of the countries. The OMC method in its present form is consid-ered to be highly bureaucratic.
Advantages of this option: the goals of sustain-able European development can be demon-strated, allowing each country to refine the con-crete tools by adjusting them to their own circumstances.
Potential barriers or risks: the Reference Frame-work has no direct effects, its use is voluntary, and the Commission has no power to control and influence its application in the countries.

130
The clash between conditionality and the subsidiarity principle
A s with all new EU initiatives – also in the case of the above policy options – the subsidiarity
question has to be addressed. There are some coun-tries where integrated thinking is already applied (at least in principle). They might argue that there is no need at all for the EU to intervene into government and spatial planning issues with the goal of requir-ing integrated planning. In many other countries however, integrated thinking is still lacking and sec-toral, mainly economic development-oriented poli-cies dominate the agenda. The uncoordinated sectoral policies create many externalities and contradic-tions, affecting the living conditions, the sustainabil-ity of development and the level of social inclusion on the local level. In a unified Europe, with the free movement of people and labour becoming full real-ity from May 2011 onward, this will create large mi-gration patterns towards those (richer) countries which apply integrated policies.
From this argument it follows that in a unified Europe, a certain minimum of integrated territorial planning should be made compulsory either as a di-rective or as a condition to obtain EU money from any of the available funds. Integrated cross-sectoral and cross-territorial planning on the rural-urban re-gion level has to be applied everywhere.
Without the compulsory requirement of inte-grated territorial planning, the countries that will suffer the most will be those that already apply this approach, and simply reject the directive or condi-tionality due to the subsidiarity principle. In the long term, it is in the common interest of all countries in the EU to make integrated planning a compulsory requirement.
EU policy at a time of public deficit
F ollowing the economic crisis and recession, there may be some years of public sector financial defi-
cit and a shift from public sector towards private sector investment. It is therefore relevant that inte-grated spatial development of the peri-urban be very important to the private sector from both the business and financial perspective. The inclusion of the private sector is:
A) a top-down agenda. EU policies should aim to secure the asset values and investments of major institutions that are often in public-private owner-ship combinations, e.g. municipal funds, infrastruc-ture firms, pension funds, large landowners and large investors etc. These are the organisations which can take a longer term view rather than a quick profit from uncoordinated development;
B) a bottom-up agenda. Individual firms, devel-opers, entrepreneurs and landowners need to look beyond short-term gains from property sales and development towards more long term asset value.
131
EU intervention in content or process?
T he strong concept of subsidiarity prevents the EU from precisely defining either the delimita-
tion of the rural-urban regions or the content of in-tegrated development. Furthermore, the topic of sustainable and inclusive development is a con-tested political issue, for which only multilevel sys-tems of targets can be satisfactory.
Thus the EU can only aim for the assessment of plans prepared for functional rural-urban re-gions in terms of the Territorial Cohesion agenda above: (1) cross-border cooperation, (2) territorial pro-gramming, (3) policy coordination and (4) the evi-dence base.
In each of these areas, there is some kind of balance between ‘content’ and ‘process’. As found with the Environmental Assessment Directive, it is not always practical to set fixed standards and ‘blue-prints’ for these objectives. Instead, the procedures, techniques, participation and evidence bases should be focused upon.
The five briefly discussed options differ from each other not only in their strength, but also re-garding their emphasis on the content or procedural side of the regulation. In table 14 the number of “+” signs indicate the strengths of the given aspect.
Of course, it is easier to require procedural than topical sectoral factors as conditions. Further discus-sions are necessary to analyse to what extent hard factors, such as local taxation and public subsidies, can be influenced in this way from the supra-local (especially European) level. It is also an open question as to what extent country-specific soft factors, such as relational thinking in the UK and compromise cul-ture in the Netherlands, can play a role in environ-mentally and socially sustainable urban development.
Table 14: Strengths of different policy options for improved steering of peri-urban development processes
Target of policies
Policy options Content Procedure
1. Framework Directive ++ +++ 2. Conditionality +++ ++ 3. Community Initiative ++ + 4. Open Method of Coordination ++ 5. Reference Framework + +
Conclusion and next steps
O verall, there is an urgent need for the EU to ad-dress the territorial problem of development,
especially the rapid change and controversial devel-opment in peri-urban areas.
Addressing this issue is urgent and necessary, but will certainly not be simple. As with other spa-tial and territorial policy questions, the EU is not the body with the relevant legislative jurisdiction. There-fore, a range of options regarding policy needs to be explored and tested for various levels of the prob-lem and multiple kinds of governance. In addition, it has emerged that ‘soft’ informal modes of govern-ance need to work in combination with formal structures and regulations. The peri-urban areas in between urban and rural policy regimes may be es-pecially suitable for this kind of approach.
One way to enable both soft and hard ap-proaches is to build up the evidence base, particu-larly on the peri-urban as a new form of territory with special problems and opportunities.
We hope that the PLUREL project has made a contribution to this evidence base, which can sup-port further debate on the most beneficial type of policy responses.

132
133
Annex PLUReL Models and Tools for Rural-Urban Relationships at eU – 27 scale
134
Scenario modelling
D ata related to artificial surface area, GDP and population density have been used as the indi-
cators for urban growth or shrinkage, and were taken as the starting point of the modelling chain (Figure A1). The data source for artificial surfaces is the Corine Land Cover data (CLC2000 (EEA 2010)) on different land use and urban fabric classes, while data on GDP as the economic indicator and popula-tion density are derived from EUROSTAT. Time-series analyses of these data provide evidence on the trends of urbanisation from the commencement year of 2000. Four scenarios of future trends have been defined (see page 37). Accordingly, expected changes in demography, migration, oil price devel-opment and world demand for various commodities referenced to EU policy assumptions have been en-tered into specific models for demographic change projections (Scherbov and Mamolo, 2007) and into the macro-econometric NEMESIS model on eco-nomic change (Zagamé et al., 2002; Boitier et al., 2008). Simulations were run for the development of 32 production sectors and 27 consumption goods for
each country of the EU-27. They result in projections on changes in the key variables for urbanisation: an increase or growth of artificial surface, GDP and population density for the years 2015 and 2025. The projections have been downscaled, and take the specific situation of each NUTSX region into consid-eration.
Downscaling
T he downscaling procedure was carried out with the RUG (Rural-Urban Growth) model. This is a
cellular automata model that distributes land use changes driven by urbanisation. It considers the sen-sitivity of regions to climate change – for example, by defining particular spatial allocation rules for ar-eas at risk of flooding. The allocation approach con-siders planning preferences (e.g. housing concentra-tion and avoidance of flooding risk zones) and household preferences (e.g. accessibility of cities and distance to the coast), whereas an index for the accessibility of cities takes into account both the probability of commuting to the city of that size, and the travel time-cost along the transport net-work (Rickebusch and Rounsevell, 2009).
This chapter briefly explains the scientific modelling procedure applied to generate the maps and diagrams shown in this synthesis report.
Modelling the impacts of urbanisation: The methods behind the process

135
Sub-regional delineation
I n the next step, the RUR (Rural-Urban Regions) ty-pology was used for the spatial allocation into pre-
dominantly urban, peri-urban and rural regions (Loibl and Köstl, 2009; Zasada et al., 2011).
Sustainability analysis
F or the analysis of impacts of urbanisation trends, the EUI (European Urbanisation Impacts) model
has been developed within PLUREL. It comprises a series of “response function models” developed by different researcher teams, and follows a similar methodology as follows: It analyses the impacts of urbanisation trends starting with the analysis of data from European databases for each NUTSX re-gion, and uses variables like employment rate, emis-sions, loss of agricultural area or recreational value. By regression analysis and similar statistical me-thods, EUROSTAT data series have been related to the key trends of urbanisation, either by share of ar-tificial surface and population density, or by GDP, depending on the driver-impact relationship (see
figure 35). The regression analysis resulted in “re-sponse models” on specific impacts of urbanisation. These models enable the assessment of the impact in future scenario situations for each NUTSX region, as the change of the endogenous variable (artificial surface, population density or GDP) for each respec-tive NUTSX region is known from the other part of the modelling chain.
Result retrieval and presentation
T he final point of the modelling chain is the visu-alisation and result extraction tool iIAT-EU (inte-
grated Impact Analysis Tool). After a normalisation procedure, all baseline and scenario-modelling re-sults from the EUI model are transferred into the iIAT database. The iIAT-EU is freely accessible on the internet via the PLUREL XPlorer, and allows for result retrieval in the form of spidergrams and maps at various scales, according to user demands.
Figure A1: Modelling impacts of urbanisation
PLUREL methodological approach for EU-27 at NUTSX scale
• Artificialsurface• GDP• Populationdensity
H
e.g.• Employmentrate• Emissions• Lossofagriculturalarea• Recreationalvalue
H
Existing databasesNUTSXVariables /indicators for urban growth
Existing databasesNUTSXVariables for impacts of urban growth
Particularity of peri-urban trends
• ∆Artificialsurface• ∆GDP• ∆Populationdensity
Scenario ModellingGDP and pop2015, 2025
Response FunctionModellingof ImpactsE
E
RUR-typology iIAT webtoolE
G
• model relationships of urban- rural functions and sprawl • model impacts for each NUTSX• normalise results for integrated analysis (iIAT)• aggregate by typologies
• model future trends• downscale to NUTSX • allocate to urban, peri urban and rural areas
FScenario situationsNUTSXGDP and pop2015, 2025
Urbanisation Impacts on sustainabilityNUTSX2015, 2025
H
data (maps)
136
The PLUReL xplorer
An information platform for rural-urban land use relationships
Access to the PLUReL xPlorer
Visit the Xplorer at http://plurel.ait.ac.at/plurel/xplorer and explore processes, patterns and places of peri-urbanisation! No software installa-tion is necessary.
H ow might climate change affect land uses in the urban-rural interface? What might be the fu-
ture pressures of peri-urbanisation? How might people value agricultural farming in the rural hinter-land? Will there be enough water for growing urban agglomerations? What about biodiversity and eco-system services? Are there example cases for sus-tainable peri-urbanisation?
Online information platform about peri-urbanisation
A useful platform addressing these and other fore-sight questions is the PLUREL Xplorer, a web-based online information platform. The PLUREL Xplorer condensates and configures the knowledge and products of PLUREL to support planning and policy discussions on rural-urban land use interactions at European and regional level. It provides information for planners, practitioners and professionals on processes, problems and places of peri-urbanisation in Europe and its regions (Figure A2).
Features of the PLUReL xPlorer
The PLUREL Xplorer front door (user entry) features a modular design similar to the apps system. Here, short and illustrated fact sheets guide the user through the knowledge bits and allow for the im-mediate download of sophisticated background in-formation in the form of reports, figures, maps or sketches. Interactive design elements support the intuitive comprehension of causal interrelations be-tween the knowledge bits. The user entry offers three different perspectives on peri-urbanisation. Principles and Processes is the holistic approach com-prising all products, interlinked in an analytical chain. The Problems category is the thematic per-spective, while Places displays spatially explicit re-sults of PLUREL from the European down to the case study level (Figure A3).
The back door (supplier entry) is constructed in the form of a web-based fact sheet and file upload system that collects content and meta-information of knowledge produced in PLUREL in a consistent and standardised form. This standardisation also al-lows for the extension to other knowledge sources of rural-urban interactions in Europe, its sub-regions or abroad.
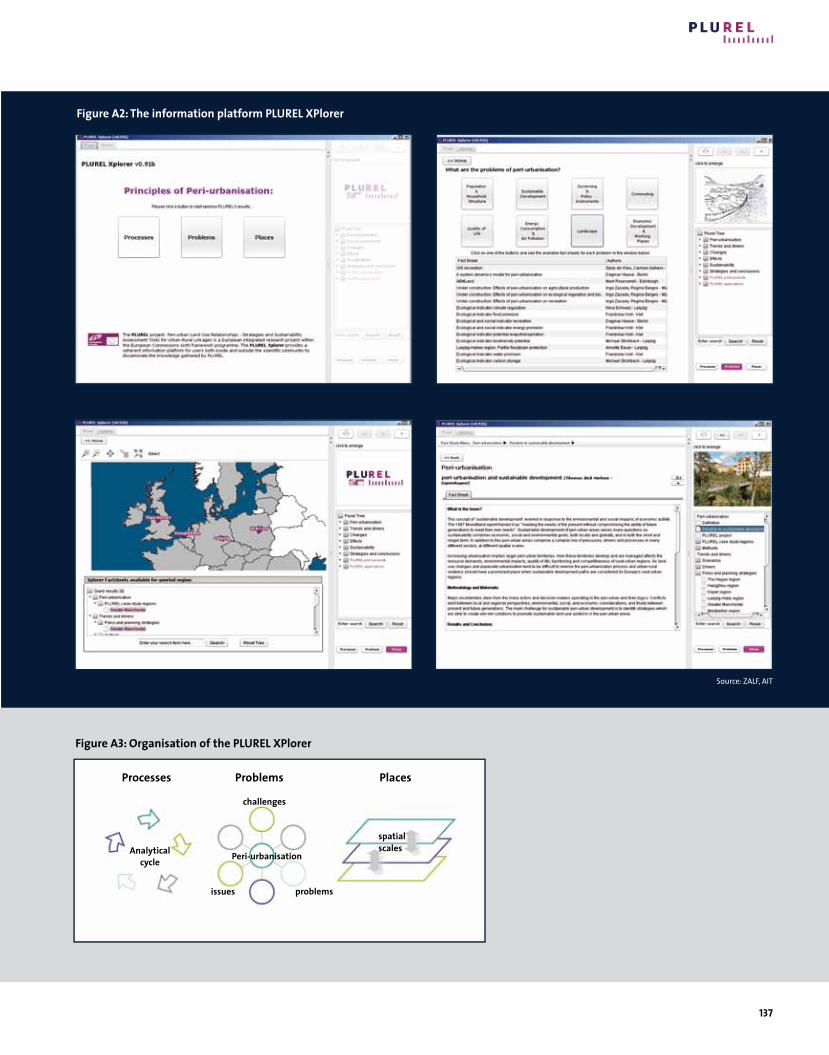
137
Processes Problems Places
Analytical cycle
challenges
problems
Peri-urbanisation
issues
spatial scales
Figure A2:TheinformationplatformPLURELXPlorer
Figure A3:OrganisationofthePLURELXPlorer
Source: ZALF, AIT

138
The european integrated Impact Analysis Tool (iIAT-eU)
This chapter introduces the new freely accessible web tool to assessimpactsofurbanisationinEuropeonthesustainabil-ityofregions–theintegratedImpactAnalysisTool(iIAT-EU).It is an easily accessible and applicable tool for decision support inthecontextofspatialdevelopmentpoliticsandplanning.
T he PLUREL integrated Impact Analysis Tool (iIAT-EU) synthesises the results from the PLUREL mod-
elling of urbanisation and its impacts on various functions into a multipurpose and interactive web tool, the iIAT-EU and the iIAT-region (Piorr et al. 2010; Haase et al. 2010). The iIAT EU has been developed to make comprehensive and complex scientific model-ling accessible and understandable for a broad range of end-users, such as regional planners, European policy-makers and stakeholders of all kinds. Users can extract thematically and spatially targeted informa-tion for different scales and for different types of re-gions, and can carry out comparisons which are de-
scenario
target year
indicator selection
pdf export
scenario selection
regional typology selection
regional typology name
region type name (withmapviewfunction)
spider graph diagram (with mapviewva-riablevalue)
minimum value(0)
maximum value(1)
parameter display
variablevalue(withvaluedisplayfunction)
Figure A4:FunctionalityandgraphicaluserinterfaceofthePLURELiIAT-EU
picted in spidergrams and can be downloaded as pdf files. Selection between sustainability indica-tors, scenarios and different spatial units at different scales is the main application principle (Figure A 4) (Piorr et al., 2011).
Selection of indicators, scenarios and spatial units
U sers can select a fixed list of sustainability indi-cators or choose up to 12 indicators out of 28
(Table A1). Integrated result presentation is dis-played in spidergrams, while maps can also be pro-duced for individual indicators.
Users can choose the baseline situation based on EUROSTAT time series data or modelled future situations that are affected by urbanisation projec-tions for the four PLUREL scenarios for the time steps 2015 and 2025.
The iIAT-EU covers 543 NUTSX regions of the EU-27. Users can query indicator values for single NUTSX regions, or average values relating to selected groups of regions, or national or EU-27 averages. To allow for thematic comparisons, the iIAT offers eleven typolo-gies. These act as a filter for the generation of grouped average indicator values of regions with similar at-tributes, for example, rural-urban-region type, spa-tial-planning type, or the level of natural hazard vul-nerability, innovation and accessibility. So
urce
: ZAL
F, AI
T, PA
S
139
Table A1
IndicatorsoftheiIAT-EUEnvironmental Density of Natural Habitats Endangered Bird Species Landscape Interspersion Landscape Patchiness Landscape Fragmentation Soil sealing CO Emissions HC Emissions NOx Emissions Heavy Metal EmissionsEconomic Agricultural Area Farm Productivity Part-time farming Gross Domestic Product per Capita High Education Share of Active PopulationSocial Aging Employment Agricultural Sector Employment Administration/ Finances Sector Employment Industrial Sector Employment Service Sector Employment Total Large Family Children and Adolescence Social Individualisation
Thematic integration
A ll indicator values for all variables and all regions in all projections have been normalised to make
them comparable, so that users can compare inten-sity and dynamics of response to urbanisation, even if they address different spatial units in their compari-sons. Each European region has a specific profile that determines its response to global drivers, urbanisa-tion trends, related land use changes and the impacts of these. Therefore, it is important not only to allow a broad view over various sustainability indicators, but also to permit a better insight into the combined trends and their effects that differ, depending on which spatial scale is considered. A tool-tip function supports users in their selection procedure. It pro-vides a map visualisation of the value distribution of indicators and typologies across the EU-27 (see figure A5). By applying the three selection steps, users can conduct an integrated analysis. Up to three analyses can be compared and visualised in one output pres-entation as spidergrams.
A novel interface between science and policy-making
T he application principles, the functionality and the graphical user interface of the iIAT-EU have
been developed in close collaboration with planners, administration, policy makers and stakeholders. Combining thematic broadness of projections with spatial flexibility is the new quality of the iIAT-EU, thereby facilitating knowledge integration for dis-cussions and decision making towards sustainable solutions for urban-rural relationships.
Access to the PLUReL iIAT-eU
Visit the PLUREL iIAT-EU at http://plurel.ait.ac.at/plurel/iiat. It is easily accessible without any re-strictions and no software installation is necessary. You only require an available internet connection and a JAVA runtime environment (freeware) to be installed on the client computer.
Figure A5:Selectionofindicatorsandmapviewer
Sour
ce: Z
ALF,
AIT,
PAS
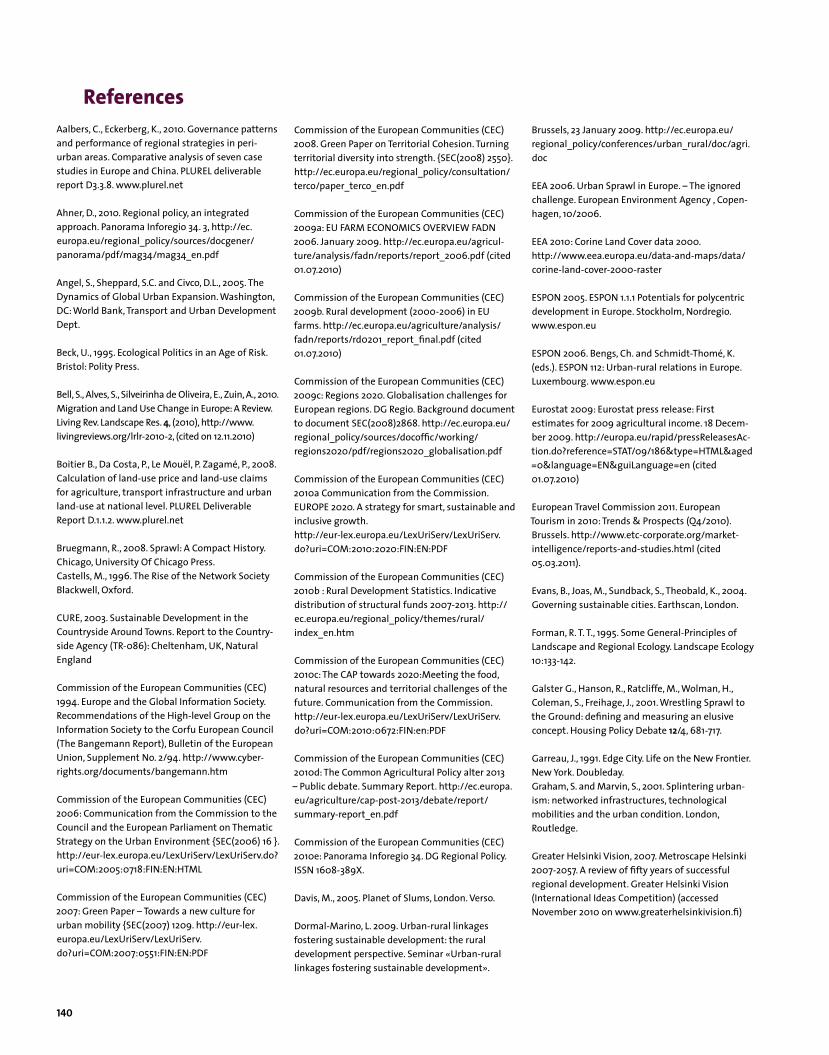
140
ReferencesAalbers, C., Eckerberg, K., 2010. Governance patterns and performance of regional strategies in peri-urban areas. Comparative analysis of seven case studies in Europe and China. PLUREL deliverable report D3.3.8. www.plurel.net
Ahner, D., 2010. Regional policy, an integrated approach. Panorama Inforegio 34. 3, http://ec.europa.eu/regional_policy/sources/docgener/panorama/pdf/mag34/mag34_en.pdf
Angel, S., Sheppard, S.C. and Civco, D.L., 2005. The Dynamics of Global Urban Expansion. Washington, DC: World Bank, Transport and Urban Development Dept.
Beck, U., 1995. Ecological Politics in an Age of Risk. Bristol: Polity Press.
Bell, S., Alves, S., Silveirinha de Oliveira, E., Zuin, A., 2010. Migration and Land Use Change in Europe: A Review. Living Rev. Landscape Res. 4, (2010), http://www.livingreviews.org/lrlr-2010-2, (cited on 12.11.2010)
Boitier B., Da Costa, P., Le Mouël, P. Zagamé, P., 2008. Calculation of land-use price and land-use claims for agriculture, transport infrastructure and urban land-use at national level. PLUREL Deliverable Report D.1.1.2. www.plurel.net
Bruegmann, R., 2008. Sprawl: A Compact History. Chicago, University Of Chicago Press.Castells, M., 1996. The Rise of the Network Society Blackwell, Oxford.
CURE, 2003. Sustainable Development in the Countryside Around Towns. Report to the Country-side Agency (TR-086): Cheltenham, UK, Natural England
Commission of the European Communities (CEC) 1994. Europe and the Global Information Society. Recommendations of the High-level Group on the Information Society to the Corfu European Council (The Bangemann Report), Bulletin of the European Union, Supplement No. 2/94. http://www.cyber-rights.org/documents/bangemann.htm
Commission of the European Communities (CEC) 2006: Communication from the Commission to the Council and the European Parliament on Thematic Strategy on the Urban Environment {SEC(2006) 16 }. http://eur-lex.europa.eu/LexUriServ/LexUriServ.do?uri=COM:2005:0718:FIN:EN:HTML
Commission of the European Communities (CEC) 2007: Green Paper – Towards a new culture for urban mobility {SEC(2007) 1209. http://eur-lex.europa.eu/LexUriServ/LexUriServ.do?uri=COM:2007:0551:FIN:EN:PDF
Commission of the European Communities (CEC) 2008. Green Paper on Territorial Cohesion. Turning territorial diversity into strength. {SEC(2008) 2550}. http://ec.europa.eu/regional_policy/consultation/terco/paper_terco_en.pdf
Commission of the European Communities (CEC) 2009a: EU FARM ECONOMICS OVERVIEW FADN 2006. January 2009. http://ec.europa.eu/agricul-ture/analysis/fadn/reports/report_2006.pdf (cited 01.07.2010)
Commission of the European Communities (CEC) 2009b. Rural development (2000-2006) in EU farms. http://ec.europa.eu/agriculture/analysis/fadn/reports/rd0201_report_final.pdf (cited 01.07.2010)
Commission of the European Communities (CEC) 2009c: Regions 2020. Globalisation challenges for European regions. DG Regio. Background document to document SEC(2008)2868. http://ec.europa.eu/regional_policy/sources/docoffic/working/regions2020/pdf/regions2020_globalisation.pdf
Commission of the European Communities (CEC) 2010a Communication from the Commission. EUROPE 2020. A strategy for smart, sustainable and inclusive growth. http://eur-lex.europa.eu/LexUriServ/LexUriServ.do?uri=COM:2010:2020:FIN:EN:PDF
Commission of the European Communities (CEC) 2010b : Rural Development Statistics. Indicative distribution of structural funds 2007-2013. http://ec.europa.eu/regional_policy/themes/rural/index_en.htm
Commission of the European Communities (CEC) 2010c: The CAP towards 2020:Meeting the food, natural resources and territorial challenges of the future. Communication from the Commission. http://eur-lex.europa.eu/LexUriServ/LexUriServ.do?uri=COM:2010:0672:FIN:en:PDF
Commission of the European Communities (CEC) 2010d: The Common Agricultural Policy alter 2013 – Public debate. Summary Report. http://ec.europa.eu/agriculture/cap-post-2013/debate/report/summary-report_en.pdf
Commission of the European Communities (CEC) 2010e: Panorama Inforegio 34. DG Regional Policy.ISSN 1608-389X.
Davis, M., 2005. Planet of Slums, London. Verso.
Dormal-Marino, L. 2009. Urban-rural linkages fostering sustainable development: the rural development perspective. Seminar «Urban-rural linkages fostering sustainable development».
Brussels, 23 January 2009. http://ec.europa.eu/regional_policy/conferences/urban_rural/doc/agri.doc
EEA 2006. Urban Sprawl in Europe. – The ignored challenge. European Environment Agency , Copen-hagen, 10/2006.
EEA 2010: Corine Land Cover data 2000. http://www.eea.europa.eu/data-and-maps/data/corine-land-cover-2000-raster
ESPON 2005. ESPON 1.1.1 Potentials for polycentric development in Europe. Stockholm, Nordregio. www.espon.eu
ESPON 2006. Bengs, Ch. and Schmidt-Thomé, K. (eds.). ESPON 112: Urban-rural relations in Europe. Luxembourg. www.espon.eu
Eurostat 2009: Eurostat press release: First estimates for 2009 agricultural income. 18 Decem-ber 2009. http://europa.eu/rapid/pressReleasesAc-tion.do?reference=STAT/09/186&type=HTML&aged=0&language=EN&guiLanguage=en (cited 01.07.2010)
European Travel Commission 2011. European Tourism in 2010: Trends & Prospects (Q4/2010). Brussels. http://www.etc-corporate.org/market-intelligence/reports-and-studies.html (cited 05.03.2011).
Evans, B., Joas, M., Sundback, S., Theobald, K., 2004. Governing sustainable cities. Earthscan, London.
Forman, R. T. T., 1995. Some General-Principles of Landscape and Regional Ecology. Landscape Ecology 10:133-142.
Galster G., Hanson, R., Ratcliffe, M., Wolman, H., Coleman, S., Freihage, J., 2001. Wrestling Sprawl to the Ground: defining and measuring an elusive concept. Housing Policy Debate 12/4, 681-717.
Garreau, J., 1991. Edge City. Life on the New Frontier. New York. Doubleday.Graham, S. and Marvin, S., 2001. Splintering urban-ism: networked infrastructures, technological mobilities and the urban condition. London, Routledge.
Greater Helsinki Vision, 2007. Metroscape Helsinki 2007-2057. A review of fifty years of successful regional development. Greater Helsinki Vision (International Ideas Competition) (accessed November 2010 on www.greaterhelsinkivision.fi)
141
Haase, D., Piorr, A., Schwarz, N. and Zasada, I.,2010. A new tool for integrated and interactive sustain-ability impact assessment of urban land use changes: the PLUREL iIAT. Proceedings of the International Congress on Environmental Modelling and Software. Modelling for Environment’s Sake. Ottawa, 5-7-2010. International Environmental Modelling and Software Society.Hardin, G., 1968 The Tragedy of the Commons, Science, Vol 162, 3859, 1243-1248.
Howard, E., 1898. (reprinted 1985). Garden cities of tomorrow: a peaceful path to real reform, East-bourne, Attic.
IPCC 2001. Special report on emissions scenarios. Geneva, IPCC. http://www.grida.no/publications/other/ipcc_sr/?src=/climate/ipcc/emission/
Korcelli, P. and Kozubek, E., 2010. Scenario maps on working places and economy. PLUREL deliverable report D2.3.12. www.plurel.net
Kraffczyk, D., 2004. The MetroScape: a geography of the contemporary city. Cambridge MA, Harvard University, Graduate School of Design.
Kröhnert, S., Hossmann, I., Klingholz, R., 2007: Europe’s demographic future: Growing imbalances. Berlin Institute for Population and Development.
Loibl, W., Köstl, M., 2008. Report on a methodology to delineate RUR sub-regions. PLUREL Deliverable Report D2.14. www.plurel.net
Mcrit 2010. Urban-rural partnership in a polycentric territory: The State of the Question. Synthetic Report, March 16 2010. Mcrit Sl, Barcelona.
Millennium Ecosystem Assessment 2005. Ecosys-tems and Human Well-being: General Synthesis. Millennium assessment. http://www.maweb.org/en/Synthesis.aspx
Nilsson, K., Nielsen, T. S., 2010. Towards green urban planning. In: European Commission. World and European sustainable cities. Brussels, 25-30.
OECD, 2009. Migration and regional development: a project proposal. OECD, Working Party on Territorial Indicators. GOV/TPDC/TI (2009)7.
Pauleit, S., Bell, S., Aalbers, C., Nilsson, K., (eds.), 2011. Peri-urban futures. Scenarios and models for land use change in Europe. Springer. In press.
Piorr, A. [Hrsg.] ; Müller, K. [Hrsg.] (2009): Rural landscapes and agricultural policies in Europe: 313 S. ; Berlin (Springer Piorr, A.., Zasada, I., Berges, R., Pohle, D., Haase, D. and Schwarz, N., 2010. Sustainable urbanisation: New tool for impact analysis. PLUREL Newsletter (7), 1-3.
Piorr, A., Zasada, I., Berges, R., Pohle, D., 2011. Description of methodology of the PLUREL inte-grated Impact Analysis Tool (iIAT) at pan-European level. Deliverable report D5.2.1.
PLUREL 2009. Description of Work. Internal document.
Ravetz J, 2000. ‘City-Region 2020: integrated planning for a sustainable environment’, London, Earthscan.
Ravetz, J., Fertner, C., Nielsen, T., 2011. The Dynamics of Peri-Urbanization: In: Pauleit, S, Bell, S, Aalbers, C., Nilsson, K (eds.): Peri-urban futures: Scenarios and models for land use change in Europe. Springer. In press.
Ravetz, J, 2011. Peri-urban ecology: green infrastruc-ture in the 21st century metro-scape: In Douglas, I (Ed) Handbook of Urban Ecology, Oxford, Routledge.
Ravetz, J., (forthcoming). Synergy-city: pathways towards shared intelligence for the urban century: London, Earthscan
Reckien, D and Karecha, J, 2007. Sprawl in European Cities: the comparitive background: In: Couch, C, Leontidou, L and Petschel-Held, G (Eds); Urban Sprawl in Europe: landscapes, landuse change and policy: Oxford, Blackwell.
Renetzeder Ch, van Eupen M, Mücher S, Wrbka T, Wascher T, Kienast F.,2006. Spatial Regional Reference Framework, Methodology and Report. In: Helming K, Wiggering H (eds.): SENSOR Report Series 2006/04, www.sensor-ip.eu, ZALF, Germany. http://www.zalf.de/home_ip-sensor/products/Reporting%20Series/SENSOR_rep_2006_4_SRRF.pdf
Rickebusch, S. and Rounsevell, M.D.A.,, 2009. Where will European live in the future? PLUREL Newsletter (6), 1-3.
Roberts, P.R, Ravetz, J, and George, C., 2009. Environ-ment and the City: Critical Perspectives on the Urban Environment around the world. Abingdon, Routledge.
Sandercock, L., 2003. Cosmopolis II : mongrel cities of the 21st century. London, New York, Continuum.
SCATTER, 2004: Sprawling Cities and Transport: from Evaluation to Recommendation. www.casa.ucl.ac.uk/scatter/
Scherbov, S., Mamolo, M., 2007. Probabilistic Population Projections for 27 EU Countries and Three Relevant World Regions. PLUREL Deliverable Report D1.2.2. www.plurel.net
Scott, A.J., 2000. The Cultural Economy of Cities: Essays on the Geography of Image-Producing Industries. New York: Sage.
Shoard, M., 1983. This Land is Our Land, London: Paladin.
Soja, E., 2000. Postmetropolis: Critical Studies of Cities and Regions: Malden, MA, Oxford, UK, Blackwell.
Tosics, I., Dukes, Th., 2005: Urban development programmes in the context of public administra-tion and urban policy. In: TESG – Tijdschrift voor Economische en Sociale Geografie, Journal of Economic and Social Geography, Vol. 96 (2005), No. 4 pp.390-408.
UN Population Fund (UNFPA) 200. State of the World Population 2007; Unleashing the Potential of Urban Growth, New York, UNFPA.
URBS PANDENS 2005. Urban Sprawl: European Patterns, Environmental Degradation and Sustain-able Development, Final Report, 2005. Brussels, Commission of the European Communities. www.pik-potsdam.de/urbs
World Resources Institute, 2001. Earthtrends: The environmental information portal. World Resources Institute, Washington DC. http://earthtrends.wri.org
Zagamé, P., Fougeyrollas, A., Le Mouël, P., 2002. An innovative detailed macro-sectoral econometric model: NEMESIS. ECOMOD International Confer-ence, 4-6 July 2002, Brussels, Belgium. [online] URL: http://www.ecomod.net/conferences/ecomod2002/papers/zagame-nemesis.pdf
Zasada, I., 2011. Multifunctional peri-urban areas – A Review of societal demands and agricultural provision of goods and services. Land Use Policy in press.
Zasada, I., Alves, S., Müller, F.C., Piorr, A., Berges, R. and Bell, S., 2010. International retirement migra-tion in the Alicante region, Spain: process, spatial pattern and environmental impacts. Journal of Environmental Planning and Management 53(1), 125-141.
Zasada, I.; Loibl, W; Berges, R; Steinnocher, K; Köstl, M; Piorr, A; Werner, A., 2011. Rural-Urban-Regions – A spatial approach to represent urban-rural relationships in Europe. In: Pauleit, S, Bell, S, Aalbers, C., Nilsson, K (eds.): Peri-urban futures: Scenarios and models for land use change in Europe. Springer. In press.
Zukin, S., 1998. Urban lifestyles: diversity and standardisation in spaces of consumption. Urban Studies 35(5-6) p825-839.
142
Dr. Simon Bell OPENspaceEdinburgh College of ArtLauriston PlaceEdinburgh EH3 9DFUnited KingdomEmail: [email protected]
RegineBergesZALF Leibniz-Centre for Agricultural Landscape Research e.V.Institute of Socio-EconomicsEberswalder Str. 8415374 MünchebergGermanyEmail: [email protected]
Dr. Katharina HelmingZALF Leibniz-Centre for Agricultural Landscape Research e.V.DirectorateEberswalder Str. 8415374 MünchebergGermanyEmail: [email protected]
Prof.Dr.PiotrKorcelliPAS Polish Academy of SciencesStanisław Leszczycki Institute of Geography and Spatial OrganizationTwarda 51/55 0018 WarszawaPolandEmail: [email protected]
Dr.WolfgangLoiblAIT Austrian Institute of Technology GmbH Donau-City-Straße 1 1220 Vienna Austria Email: [email protected]
Dr. Kjell NilssonKU University of CopenhagenDanish Centre for Forest, Landscape and PlanningRolighedsvej 23DK-1958 Frederiksberg CDenmarkEmail: [email protected]
Dr.AnnettePiorrZALF Leibniz-Centre for Agricultural Landscape Research e.V.Institute of Socio-Economics; Institute of Land Use SystemsEberswalder Str. 8415374 MünchebergGermanyEmail: [email protected]
Dr.JoeRavetzUOM University of Manchester Centre for Urban and Regional Ecology Manchester, M13 9PLUnited KingdomEmail: [email protected]
MikaRistimäkiSYKE The Finnish Environment InstituteMechelininkatu 34 A PO Box 140 00251 HelsinkiFinland Email: [email protected]
Dr.IvanTosicsMRI Metropolitan Research InstituteLónyay Street 341093 BudapestHungaryEmail: [email protected]
Ingo Zasada ZALF Leibniz-Centre for Agricultural Landscape Research e.V.Institute of Socio-Economics; Institute of Land Use SystemsEberswalder Str. 8415374 MünchebergGermanyEmail: [email protected]
List of Authors
143
Imprint
Peri-urbanisation in Europe: Towards a European Policy to Sustain Urban-Rural Futures A Synthesis Report
EditorsandresponsibleauthorsAnnette Piorr, Leibniz-Centre for Agricultural Landscape Research (ZALF), Muencheberg, Germany. Email: [email protected]
Joe Ravetz, University of Manchester, United Kingdom. Email: [email protected]
Ivan Tosics, Metropolitan Research Institute, Budapest, Hungary. Email: [email protected]
LegalnoticeThe contents of this report is based on the results of the EU FP6 Integrated Project PLUREL by researchers listed in the Annex. The views expressed in this publication are the sole responsibility of the authors/ publishers and do not necessarily reflect the views of the funding bodies. Neither the Editors nor the Project Coordinator are responsible for the use that may be made of the information contained in this report.
Copyright notice© PLUREL consortium, Copenhagen, 2011 and the partners mentioned. Reproduction is authorised, provided the source is acknowledged by referring to
PiorrA,RavetzJ,TosicsI(2011)Peri-urbanisationinEurope:TowardsaEuropeanPolicytosustainUrban-RuralFutures.UniversityofCopenhagen/AcademicBooksLifeSciences.144p.ISBN:978-87-7903-534-8and a copy is sent to the PLUREL project coordinator and the editors of this synthesis report
PLURELProjectCoordinationKjell Nilsson (project coordinator)Danish Centre for Forest, Landscape and PlanningUniversity of CopenhagenRolighedsvej 23DK-1958 Frederiksberg CTel.: +45 2120 5153E-mail: [email protected]
PublisherForest & Landscape University of Copenhagen Rolighedsvej 23 DK-1958 Frederiksberg C Tel. +45 3533 1500 [email protected] ISBN: 978-87-7903-534-8 (paper)ISSN: 978-87-7903-535-5 (electronic version) ThebookisavailablefromAcademic Books, Life SciencesThorvaldsensvej 40 DK-1871 Frederiksberg C Tel. +45 3535 7622 [email protected]
Coverdesign,LayoutandProductionDorén + Koester, Berlinwww.doren-koester.de
LanguageproofreadingTint Linguistic Services, Berlin
PrintingH. Heenemann, Berlin
EnvironmentalproductionThis publication is printed according to high environmental standards (FSC certified)Printed in Berlin, March 2011
PLUREL is an Integrated Project partially funded by the European Union under the theme “Sustainable Development, Global Change and Ecosystems” of the Sixth Framework Programme (Grant Agreement number 036921). http://www.plurel.net

145
Picturecredits
Regine Berges – 121 dpa-Bernd Settnik – 45dpa-Jens Büttner – 37dpa-Celik Erkul – 108Reinhard Köster – Cover, 2, 6, 7, 12, 16, 23, 35 bottom, 42, 54, 56, 57, 60, 67, 69, 72, 73, 78, 80, 83, 87, 89, 90, 98, 102, 112, 117, 119, 122, 124, 126, 127, 128, 130, 143, C3, C4Piotr Korcelli – 48 Thomas Sick Nielsen – 84, 86, 92, 93, C4Kjell Nilsson – 94, C4picture alliance-Paul Mayall – 71picture alliance-Patrick Pleul – 14, 88, 110picture alliance-Simon Shepheard – 64picture alliance-Therin-Weise – 51picture alliance – 10, 18, 19, 26, 31, 32, 39, 41, 103Annette Piorr – 2, 22, 35 top, 70, 101, 120, 132Ingo Zasada – 2, 8, 75, 76, 85

The peri-urban – the space around urban areas which merges into the rural landscape – is growing across Europe. The peri-urban is a zone of innovation, know-ledge based and globalized enterprise. It is also the place which attracts new types of housing, transport infra-structure and multifunctional agriculture, with a diverse range of recreation sites and ecosystem services.
Urban development, by far the most rapidly expan-ding land use type in Europe, puts peri-urban areas under particular pressure: the growth of built develop-ment in peri-urban areas is likely to be up to four times as fast as in urban areas. The risk is urban sprawl, with its many societal and environmental problems.
A more balanced and sustainable pattern of deve-lopment needs a better policy focus, not only on peri-urban areas, but on the wider rural-urban region which surrounds them. A more integrated EU level policy and funding system can enable and encourage integrated development at the local, regional and national levels.
This synthesis report, based on new research from the EU Integrated Project PLUREL, quantifies the trends, risks and opportunities for peri-urban areas, sets out new concepts for urban- rural linkages, and provides recommendations for targeted policies for rural-urban regions across Europe.