peripheral neuropathy in hypertension - etheses …etheses.bham.ac.uk/1610/1/branch11mphil.pdf ·...
TRANSCRIPT
PERIPHERAL NEUROPATHY
IN HYPERTENSION
by
REBECCA LOUISE BRANCH
A thesis submitted to
The University of Birmingham
For the degree of
MASTER OF PHILOSOPHY
School of Clinical & Experimental Medicine
College of Medical & Dental Sciences
The University of Birmingham
September 2010

University of Birmingham Research Archive
e-theses repository This unpublished thesis/dissertation is copyright of the author and/or third parties. The intellectual property rights of the author or third parties in respect of this work are as defined by The Copyright Designs and Patents Act 1988 or as modified by any successor legislation. Any use made of information contained in this thesis/dissertation must be in accordance with that legislation and must be properly acknowledged. Further distribution or reproduction in any format is prohibited without the permission of the copyright holder.

i
ABSTRACT
Patients with essential hypertension have higher pain thresholds than individuals with normal
blood pressure and may show evidence of subclinical peripheral neuropathy. Hypertension is
strongly associated with diabetic neuropathy and the observed sensory loss may be aggravated by
hypertension-induced nerve ischaemia and hypoxia. Two studies are presented in this thesis.
First, 20 hypertensives and 25 normotensives had vibration, cooling, warming and heat-pain
thresholds measured using the “CASE IV” system to assess evidence of subclinical peripheral
neuropathy. Higher vibration thresholds were demonstrated in the feet of the hypertensives,
which were significantly correlated with SBP and DBP. Conversely, a significant negative
correlation between SBP and DBP with cooling and warming thresholds in the hand was found.
Second, in a separate database analysis, cardiovascular risk, including metabolic profile and
ambulatory arterial stiffness index, was compared in 83 confirmed and 154 borderline
hypertensives. Cardiovascular risk factors of the borderline group suggested that these patients
necessitate intervention with lifestyle measures at the very least. Further studies are needed to
prove causality between hypertension and subclinical peripheral neuropathy. If such an
association is found across all grades of hypertension, earlier intervention with antihypertensive
medication might be appropriate, even in patients with low cardiovascular risk.

-ii-
ACKNOWLEDGEMENTS
First and foremost I would like to say a very special thank you to my primary supervisor Una
Martin, without whom I would not have been able to start this M.Phil. let alone finish it. I
couldn‟t have asked for a better supervisor and am extremely grateful for her enthusiasm,
unfailing support and guidance and continued commitment to my research. I would like to also
thank my second supervisor Chris Ring for his contribution to my research.
Further thanks go to Charles Ferro and John Winer for contributing their medical knowledge and
expertise to my research and to Louisa Edwards for her helpful advice throughout my M.Phil.
Thanks also go to Peter Nightingale, Syeed Haque and Deborah Stocken for their invaluable
statistical advice when I needed it most. I am also very grateful to Sarah Bowden for allowing me
use of the Cancer Research UK Clinical Trials Unit computer and printing facilities.
A big, „thank you‟ goes out to Louise Beesley and Karen Boardman for their support during
recruitment and testing of patients, for teaching me the ropes of the Hypertension Database, for
helping me to decipher medical notes and for digging out old research files. Thanks also go to
Margaret Webster for requesting and supplying medical notes so efficiently.
Particular thanks go to Tehreem Butt and Jaspreet Babrah, two colleagues/friends for their
valuable support, advice, encouragement and reassurance, especially during the later stages of my
research. Having them there to talk to was an enormous help.

-iii-
Thanks also go to my parents for their encouragement and to my housemates Amy, Rachel,
Sophie and Eva for their social support and for keeping me fed and watered.
Finally, particular thanks go to my boyfriend David for being a calming influence and for his
continuous support, patience, understanding and encouragement throughout my M.Phil.

-iv-
CONTENTS
CHAPTER 1: INTRODUCTION AND AIMS ........................................................................ 1
1.1 Hypertension ........................................................................................................................ 1 1.1.1 Background and Epidemiology ....................................................................................... 1
1.1.2 Pathophysiology of Hypertension ................................................................................... 2
1.1.3 Grades of Hypertension ................................................................................................... 2
1.1.4 Hypertension and Cardiovascular Disease Risk .............................................................. 3
1.1.5 Hypertension Management .............................................................................................. 5
1.1.5.1 ESHC 2003 .............................................................................................................. 5
1.1.5.2 ESHC 2007 .............................................................................................................. 7
1.1.5.3 JNC 7 ....................................................................................................................... 7
1.1.5.4 BHS IV .................................................................................................................... 8
1.2 High-Normal Blood Pressure/Prehypertension ................................................................ 9 1.2.1 Prevalence of High-Normal BP/Prehypertension ............................................................ 9
1.2.2 High Normal BP/Prehypertension and Rate of Progression to Hypertension ............... 10
1.2.3 Association of High-Normal BP/Prehypertension with Other CVD Risk
Factors ........................................................................................................................... 11
1.2.4 High-Normal BP/Prehypertension and Risk of Mortality or Developing CVD ........... 12
1.2.5 Treating High-Normal BP/Prehypertension with Lifestyle Approaches to
Prevent Hypertension or CVD...................................................................................... 13
1.2.6 Management of High-Normal BP/Prehypertension ...................................................... 15
1.2.7 Treating High-Normal BP/Prehypertension with Antihypertensive
Medication to Prevent Hypertension or CVD .............................................................. 16
1.3 Additional Ways to Assess Cardiovascular Risk ............................................................ 20 1.3.1 Arterial Stiffness ............................................................................................................ 20
1.3.1.1 Definition and Mechanisms Underlying Arterial Stiffness ................................... 20
1.3.1.2 Arterial Stiffness and Cardiovascular Risk ........................................................... 21
1.3.1.3 Methods of Measuring Arterial Stiffness .............................................................. 23
1.3.1.3.1 Ambulatory Arterial Stiffness Index (AASI) ................................................. 24
1.3.2 Metabolic Syndrome ..................................................................................................... 26
1.4 Peripheral Neuropathy ..................................................................................................... 27
1.5 Hypertension and Diabetic Neuropathy .......................................................................... 29
1.6 Hypertension and Hypoalgesia ......................................................................................... 32
1.7 Hypertension and Peripheral Neuropathy ...................................................................... 35
1.8 Hypotheses .......................................................................................................................... 38 1.8.1 Study One: Peripheral Neuropathy in Hypertension ..................................................... 38
1.8.2 Study Two: Retrospective Database Analysis of Cardiovascular Risk
in Confirmed and Borderline Hypertensive Patients .................................................... 38
1.9 Aims .................................................................................................................................... 39 1.9.1 Study One: Peripheral Neuropathy in Hypertension ..................................................... 39
1.9.2 Study Two: Retrospective Database Analysis of Cardiovascular Risk
in Confirmed and Borderline Hypertensive Patients ................................................... 39

-v-
CHAPTER 2: STUDY ONE - PERIPHERAL NEUROPATHY IN HYPERTENSION .. 40
2.1 Introduction and Aims ...................................................................................................... 40
2.2 Methods and Analysis ....................................................................................................... 41 2.2.1 Participants .................................................................................................................... 41
2.2.2 Establishment of Blood Pressure Status ........................................................................ 42
2.2.3 Exclusion Criteria .......................................................................................................... 43
2.2.4 Apparatus and Physiological Measurements ................................................................. 45
2.2.5 Computer Aided Sensory Evaluator (CASE) IV ........................................................... 45
2.2.6 Procedure ....................................................................................................................... 47
2.2.6.1 Quantitative Sensory Testing (QST) of Vibratory Perception .............................. 48
2.2.6.1.1 Vibratory Testing in the Hand and Foot ......................................................... 48
2.2.6.2 QST of Cooling, Warming and Heat-Pain Perception .......................................... 49
2.2.6.2.1 Cooling, Warming and Heat-Pain Testing of the Right Foot ......................... 49
2.2.6.2.2 Cooling, Warming and Heat-Pain Testing of the Right Hand ........................ 50
2.2.7 Statistical Analysis ........................................................................................................ 53
2.2.8 Power Calculations ........................................................................................................ 53
2.3 Results and Brief Discussion ............................................................................................. 54 2.3.1 Group Characteristics and Risk Factors of Each Blood Pressure Group ...................... 54
2.3.2 Analysis of Co-Variance and Spearman‟s Correlation Coefficients on
Sensory Threshold Data Obtained from CASE IV ...................................................... 60
2.3.3 Brief Discussion ............................................................................................................ 68
CHAPTER 3: STUDY TWO - RETROSPECTIVE DATABASE ANALYSIS
OF CARDIOVASCULAR RISK IN CONFIRMED AND
BORDERLINE HYPERTENSIVE PATIENTS ........................................... 71
3.1 Introduction ....................................................................................................................... 71 3.1.1 The Hypertension Database ........................................................................................... 72
3.2 Methods .............................................................................................................................. 73 3.2.1 Establishment of Blood Pressure Status ........................................................................ 73
3.2.2 Exclusion Criteria .......................................................................................................... 73
3.2.3 Database Analysis ......................................................................................................... 74
3.2.4 Statistical Analysis ........................................................................................................ 75
3.3 Results and Brief Discussion ............................................................................................. 76
3.3.1 Group Characteristics and Cardiovascular Risk Factors of Each Blood Pressure
Group ............................................................................................................................. 76
3.3.2 Brief Discussion ............................................................................................................ 82
CHAPTER 4: OVERALL DISCUSSION AND CONCLUSIONS ......................................... 83
4.1 Overall Discussion ............................................................................................................. 83 4.1.1 Summary of Main Findings ........................................................................................... 83
4.1.2 Detailed Discussion of Main Findings .......................................................................... 84
4.1.2.1 Study One .............................................................................................................. 84
4.2.1.2 Study Two ............................................................................................................. 89
4.1.3 Study One-Limitations .................................................................................................. 90
4.1.4 Study One-Recommendations for Future Research ...................................................... 93
4.1.5 Study Two-Limitations and Recommended Future Directions ..................................... 94
4.2 Conclusions ........................................................................................................................ 95

-vi-
APPENDICES .............................................................................................................................. I
Appendix A .................................................................................................................................. I
Appendix B ................................................................................................................................ II
Appendix C ............................................................................................................................... III
LIST OF REFERENCES ............................................................................................................ IV

-vii-
LIST OF ILLUSTRATIONS
Figure 1. Summary of the Multiple Causes and Locations of Arterial Stiffness ........................ 21 Figure 2. Consequences of Increased Arterial Stiffness ............................................................. 22 Figure 3. Scatter Graph Showing 24-hour SBP Readings (x) Plotted Against 24-hour
DBP Readings (y) ........................................................................................................ 25 Figure 4. Measurement of Vibration Threshold in the Right Hand ............................................ 51 Figure 5. Measurement of Thermal and Heat-Pain Thresholds in the Right Foot ..................... 52 Figure 6. Unadjusted Mean and Standard Deviation of all Continuous Variables of
the Hypertensive Males and the Normotensive Males ............................................... 57 Figure 7. Unadjusted Mean and Standard Deviation of all Continuous Variables of
the Hypertensive Females and the Normotensive Females ........................................ 58
Figure 8. Unadjusted Mean and Standard Deviation of all Sensory Thresholds of
the Hypertensive and Normotensive Groups .............................................................. 63 Figure 9. Scatter Graph Showing Vibration Threshold in the Foot (x) against Systolic
and Diastolic Blood Pressure (y) ................................................................................ 65 Figure 10. Scatter Graph Showing Cooling Threshold in the Hand (x) against Systolic
and Diastolic Blood Pressure (y) ................................................................................ 66 Figure 11. Scatter Graph Showing Warming Threshold in the Hand (x) against Systolic
and Diastolic Blood Pressure (y) ................................................................................ 67

-viii-
LIST OF TABLES
Table 1. Classification of BP Levels (mmHg) in the ESHC and JNC 7 2003 Guidelines ........... 3 Table 2. ESHC 2003 Guidelines for the Stratification of Cardiovascular Risk in Order
to Quantify Prognosis .................................................................................................... 5
Table 3. Rate of Progression of Optimal, Normal and High-Normal BP to Hypertension
(≥140/90 mmHg) in Individuals Aged 35-64 Years and Those Aged 65-94 Years .... 10
Table 4. Lifestyle Interventions for Blood Pressure Reduction in Prehypertensives ................ 14 Table 5. Unadjusted Mean [Standard Deviation (SD)], Blood Pressures, Age, Height,
Weight, BMI and Alcohol Consumption of the Hypertensive and Normotensive
Males as well as the Degrees of Freedom, t-Values and Statistical Significance
Level of the Group Effects .......................................................................................... 55
Table 6. Unadjusted Mean (SD), Blood Pressures, Age, Height, Weight, BMI and
Alcohol Consumption of the Hypertensive and Normotensive Males as well as
the Degrees of Freedom, t-Values and Statistical Significance Level of the
Group Effects ............................................................................................................... 56
Table 7. Number of Males and Females and Number and Percentage of Cardiovascular
Risk Factors in the Hypertensive and Normotensive Group as well as the Degrees
of Freedom, Chi-square Values and Statistical Significance Levels of the Group
Effects .......................................................................................................................... 59 Table 8. ANOVA. Unadjusted Mead (SD) Sensory Thresholds of the Hypertensive
and Normotensive Group, as well as the Degrees of Freedom, F Values,
Statistical Significance Level of the Group Effects and Associated Effect Size......... 61 Table 9. ANCOVA. Unadjusted Mean (SD) Sensory Thresholds of the Hypertensive
and Normotensive Group, as well as the Degrees of Freedom, F Values,
Statistical Significance Level of the Group Effects
(Adjusted for Age, Sex and BMI) and Associated Effect Size .................................... 62 Table 10. Spearman‟s Correlation Coefficients for all Sensory Thresholds against Mean
Systolic and Diastolic Blood Pressure Measurements ................................................ 64 Table 11. Independent-Samples T Test. Unadjusted Mean (SD), Blood Pressures
and Demographics of the Confirmed Hypertensive and Borderline
Hypertensive Group as well as the Degrees of Freedom, t-Values and
Statistical Significance Level of the Group Effects..................................................... 77 Table 12. Number of Males and Females and Number and Percentage of Cardiovascular
Risk Factors in the Confirmed and Borderline Hypertensive Groups as well as
Degrees of Freedom, Chi-Square and Statistical Significance Levels of the
Group Effects ............................................................................................................... 79 Table 13. Unadjusted Mean (SD), Biochemical Values of the Confirmed Hypertensive
and Borderline Hypertensive Group as well as Degrees of Freedom, t Values
and Statistical Significance Levels of the Groups Effects ........................................... 80 Table 14. Unadjusted Mean (SD), AASI, 10 Year Coronary Risk and 10 Year CVD Risk for
the Confirmed Hypertensive and Borderline Hypertensive Group as well as
Degrees of Freedom, t Values and Statistical Significance Level of the Group
Effects .......................................................................................................................... 81

-ix-
ABBREVIATIONS
AASI: Ambulatory Arterial Stiffness Index
ABCD: The Appropriate Blood Pressure Control in Diabetes Trial
ABPM: Ambulatory Blood Pressure Monitoring
ACC: Associated Clinical Condition
ACE: Angiotensin Converting Enzyme
AGEs: Advanced Glycation End products
AIx: Augmentation Index
ANCOVA: Analysis of Co-Variance
ANOVA: Analysis of Variance
ARBs: Angiotensin II Receptor Antagonists
BHS: British Hypertension Society
BMI: Body Mass Index
BNF: British National Formulary
BP: Blood Pressure
CASE IV: Computer Aided Sensory Evaluator IV
CHD: Chronic Heart Disease
CI: Confidence Interval
CIAP: Chronic Idiopathic Axonal Polyneuropathy
cm: centimetres
CNS: Central Nervous System
CPT: Current Perception Threshold
CSP: Chronic Symmetric Polyneuropathy
CVD: Cardiovascular Disease
DASH: Dietary Approaches to Stop Hypertension
DBP: Diastolic Blood Pressure
df: degrees of freedom
dl: decilitres
DSSP: Distal Symmetrical Sensory Polyneuropathy
ECG: Electrocardiogram
ESC: European Society of Cardiology
ESH: European Society of Hypertension
ESHC: European Society of Hypertension-European Society of Cardiology
FPG: Fasting Plasma Glucose
g: grams
HDL: High-Density Lipoprotein
HIV: Human Immunodeficiency Virus
HP: Heat-Pain
HT: Hypertension
I-CAM: Inter-Cellular Adhesion Molecule
IDF: International Diabetes Federation
ISH: International Society of Hypertension

-x-
JNC 7: Joint National Committee on Prevention, Detection, Evaluation, and Treatment of
High Blood Pressure
JNDs: Just Noticeable Differences
kg: Kilograms
L: Litres
LVH: Left Ventricular Hypertrophy
m: Meters
mg: milligrams
mmHg: Millimeters of mercury
mmol: millimoles
MMP: matrix metalloprotease
MФ: MMP-7
NaCl: Sodium Chloride
NCEP: National Cholesterol Education Program
NHANES: National Health and Nutrition Examination Survey
NT: Normotensive
OR: Odds Ratio
oz: ounces
PHARAO: The Prevention of Hypertension with ACE-inhibitor Ramipril in Patients with
High Normal Blood Pressure trial
PNS: Peripheral Nervous System
PSN: Peripheral Sensory Neuropathy
PVD: Peripheral Vascular Disease
PWV: Pulse Wave Velocity
QEH: Queen Elizabeth Hospital
QST: Qualitative Sensory Testing
ROS: Reactive Oxygen Species
SBP: Systolic Blood Pressure
SD: Standard Deviation
SHR: Spontaneously Hypertensive Rats
SMPN: Sensorymotor Peripheral Neuropathy
TGF-β: Transforming Growth Factor
TOD: Target Organ Damage
TROPHY: Trial of Preventing Hypertension study
US: United States
VSMC: Vascular Smooth Muscle Cell
WHO: World Health Organisation
WTCRF: Wellcome Trust Clinical Research Facility

-1-
CHAPTER 1: INTRODUCTION AND AIMS
1.1 Hypertension
1.1.1 Background and Epidemiology
Hypertension is defined as repeatedly raised clinic blood pressure (BP) ≥140/90 mmHg (Table
1).1-3
Nearly 1 in 3 adults has high blood pressure and the prevalence of high blood pressure in
England in 2007 was 31% among men and 29% among women.4;5
Hypertension is a highly
prevalent risk factor for cardiovascular disease (CVD) throughout the developed world.6
Cardiovascular disease [including coronary heart disease (CHD) and stroke] has been the most
common cause of death in England and Wales for nearly a century in both males and females.7
For example, in 2003 CHD caused 21.6% and 15.8% respectively of all male and female deaths;
cerebrovascular disease was a close second.8 The World Health Organisation (WHO) estimates
that high blood pressure related illness causes 1 in 8 deaths making hypertension the third leading
killer in the world.9 Hypertension is therefore an important area of medical research.
-2-
1.1.2 Pathophysiology of Hypertension
The pathophysiology of hypertension remains uncertain. Two to five percent of hypertensives
have an underlying renal or adrenal cause for their raised blood pressure, known as secondary
hypertension. However, the majority have no single identifiable cause and their condition is
termed essential hypertension.10
Even though there are no direct causes for essential hypertension
there are many risk factors that contribute towards its development the most important of which
are: excess body weight, excess dietary sodium intake, reduced physical activity, inadequate
intake of fruits and vegetables, and excess alcohol.2
1.1.3 Grades of Hypertension
Two major guidelines for the assessment and treatment of hypertension were published in 2003,
from the European Society of Hypertension-European Society of Cardiology guidelines for the
management of arterial hypertension (ESHC) and the Seventh report of the Joint National
Committee on Prevention, Detection, Evaluation, and Treatment of High Blood Pressure (JNC
7).1;2
The recommendations in the two guidelines are similar in some ways. However, the two
guidelines classify blood pressure differently (Table 1). The ESHC guidelines grade hypertension
as mild, moderate or severe, whereas the JNC 7 guidelines grade hypertension as either Stage 1
or Stage 2.

-3-
Table 1. Classification of BP Levels (mmHg) in the ESHC and JNC 7 2003 Guidelines1;2
ESHC JNC 7
Category Systolic Diastolic Category Systolic Diastolic
Optimal <120 <80 Normal <120 <80
Normal 120-129 81-84 Prehypertension 120-139 80-89
High-Normal 130-139 85-89
Grade 1 HT (mild) 140-159 90-99 Stage 1 HT 140-159 90-99
Grade 2 HT (moderate) 160-179 100-109 Stage 2 HT ≥160 ≥100
Grade 3 HT (severe) ≥180 ≥110
HT, Hypertension
The British Hypertension Society (BHS) IV classification of blood pressure equates to that of the
ESHC and that of The World Health Organization/International Society of Hypertension
(WHO/ISH),11
and is based on clinic blood pressure values [ABPM readings should be adjusted
upwards (e.g. by 10/5mmHg)]. If systolic blood pressure and diastolic blood pressure fall into
different categories, the higher value should be taken for classification.1;3;11
1.1.4 Hypertension and Cardiovascular Disease Risk
Increasing blood pressure has been shown to be positively correlated with risk of coronary heart
disease (CHD) and stroke, together termed cardiovascular disease (CVD).12
However, the
coexistence of other risk factors such as age, smoking and cholesterol have been shown to result
in dramatic increases in CVD risk associated with any blood pressure level.13;14
Estimates of
cardiovascular and/or coronary risk can be easily calculated using computer programmes or
charts such as the risk prediction charts, which are located at the back of the British National
Formulary (BNF). Some of these computer programmes/charts are derived from complex
equations based on data from the Framingham Heart Study.15
The so-called, „Framingham

-4-
equation‟ has been shown to apply to Northern European populations including Britain, although
it may not be applicable to all patient populations.13;16
The BHS IV guidelines base risk
prediction on the Framingham equation as it is the only method of estimating the risk of
cardiovascular morbidity and mortality in both men and women, which includes most of the risk
factors routinely available to the clinician, including:
- Age (years)
- Female (1, woman; 0, man)
- Systolic blood pressure (SBP) [average of 2 office measurements (mmHg)]
- Diastolic blood pressure (DBP) [average of 2 office measurements (mmHg)]
- Cholesterol [total serum cholesterol measured by the Abell-Kendall method (mg/dl)]
- HDL cholesterol [determined after heparin-manganese precipitation (mg/dl)]
- Smoking (1, cigarette smoking or quit within past year; 0, otherwise)
- Diabetes [1, diabetes; 0, otherwise (conservative definition is treatment with insulin or
oral agents or having a fasting glucose of 7.7mmol/L or above)]
- ECG-LVH (1, definite; 0, otherwise).3;15

-5-
1.1.5 Hypertension Management
The ESHC 2003, ESHC 2007, JNC 7 and BHS IV guidelines differ slightly when it comes to the
management of hypertension.
1.1.5.1 ESHC 2003
The ESHC 2003 guidelines base the decision to initiate antihypertensive medication on the total
level of cardiovascular risk (Table 2) as well as the level of systolic and diastolic blood pressure
(Table 1).1
Table 2. ESHC 2003 Guidelines for the Stratification of Cardiovascular Risk in Order to
Quantify Prognosis1
Blood pressure (mmHg)
Other risk factors and disease history Normal
SBP 120-129
or DBP 80-84
High normal
SBP 130-139
or DBP 85-89
Grade 1 HT
SBP 140-159
or DBP 90-99
Grade 2 HT
SBP 160-179
or DBP 100-109
Grade 3 HT
SBP ≥180
or DBP ≥110
No other risk factors Average risk Average risk Low
added risk
Moderate
added risk
High
added risk
1-2 risk factors Low
added risk
Low
added risk
Moderate
added risk
Moderate
added risk
Very high
added risk
≥3 risk factors or TOD or diabetes Moderate
added risk
High
added risk
High
added risk
High
added risk
Very high
added risk
ACC High
added risk
Very high
added risk
Very high
added risk
Very high
added risk
Very high
added risk
ACC, associated clinical conditions; TOD, target organ damage
-6-
According to the ESHC 2003 guidelines, if an individual has Grade 1 or 2 hypertension clinicians
should: (i) assess other risk factors, target organ damage (TOD), diabetes, and associated clinical
conditions (ACC), (ii) initiate lifestyle measures and correction of other risk factors or disease
and (iii) stratify absolute risk (Table 2). If absolute risk is „very high‟ or „high‟ begin drug
treatment promptly, if „moderate‟ monitor BP and other risk factors for at least 3 months. If after
3 months SBP ≥140 mmHg or DBP ≥90 mmHg then begin drug treatment but if after 3 months
SBP <140 mmHg and DBP <90 mmHg then continue to monitor. If absolute risk is „low‟
monitor BP and other risk factors for 3-12 months. If after 3-12 months SBP ≥140-159 mmHg or
DBP ≥90-99 mmHg then consider drug treatment and elicit patient‟s preference but if after 3-12
months SBP <140 mmHg and DBP <90 mmHg then continue to monitor.1
If an individual has Grade 3 hypertension clinicians should: (i) begin drug treatment immediately,
(ii) assess other risk factors, TOD, diabetes and ACC and (iii) add lifestyle measures and
correction of other risk factors or disease.1

-7-
1.1.5.2 ESHC 2007
The ESHC 2007 guidelines are very similar to the 2003 guidelines with respect to the
management of Grade 1-3 hypertension. The differences in the most recent guidelines are: (i)
individuals with Grade 1 hypertension with no other risk factors (low added risk) should practice
lifestyle changes for several months (as opposed to 3-12 months) and then start drug treatment if
BP remains uncontrolled, (ii) individuals with Grade 1 hypertension with 1-2 risk factors and
individuals with Grade 2 hypertension with no other risk factors or 1-2 risk factors (moderate
added risk) should practice lifestyle changes for several weeks (as opposed to at least 3 months)
and then start drug treatment if BP remains uncontrolled.17
1.1.5.3 JNC 7
In contrast to the ESHC guidelines, the JNC 7 guidelines do not take cardiovascular risk or target
organ damage into account when making treatment decisions. Rather, all individuals with Stage 1
hypertension (SBP 140-159 mmHg or DBP 90-99 mmHg) or Stage 2 hypertension (SBP ≥160
mmHg or DBP ≥100 mmHg) should initiate lifestyle modification and drug therapy.2

-8-
1.1.5.4 BHS IV
The BHS IV guidelines recommend the following management of hypertension:
- Provide lifestyle advice for all people with high BP and those with borderline (Grade 1) or
high-normal BP.
- Start drug therapy in all patients with sustained SBP ≥160 mmHg or sustained DBP ≥100
mmHg despite non-pharmacological measures.
- Drug treatment is also indicated in patients with sustained SBP 140-159 mmHg or DBP
90-99 mmHg if TOD is present, or there is evidence of established CVD, or diabetes, or
the 10-year CVD risk is ≥20%, according to the Joint British Societies CVD risk
assessment programme/risk chart.3

-9-
1.2 High-Normal Blood Pressure/Prehypertension
Normal blood pressure is 120-129/81-89 mmHg according to the 2003 ESHC guidelines or
≤120/80 mmHg according to the JNC 7 guidelines (Table 1).1;2
Hypertension is defined as BP
≥140/90 mmHg.1-3
There is a grey area in between these two thresholds where BP cannot be
regarded as either normal or hypertensive. Such BP levels are now regarded as „high-normal‟ in
Europe (130-139/85-89 mmHg) or „prehypertension‟ in the United States (US) (120-139/80-89
mmHg) (Table 1).1;2
The latter has raised some controversy as it means that many people
previously considered entirely normal according to ESHC guidelines will now be labeled with a
medical condition.
1.2.1 Prevalence of High-Normal BP/Prehypertension
Data from the 1999 and 2000 National Health and Nutrition Examination Survey (NHANES III)
estimated that the prevalence of prehypertension among adults in the US was approximately
31%.18;19
The prevalence was higher among men than women (39% and 23% respectively) and
higher in obese than normal weight individuals.19;20
NHANES 2005-2006 reported that an
estimated 25% of the US population aged 20 years or older has prehypertension, including over
32 million men and 21 million women.21;22

-10-
1.2.2 High Normal BP/Prehypertension and Rate of Progression to Hypertension
Prehypertension is likely to progress to hypertension fairly rapidly in the absence of lifestyle
changes, particularly in the elderly and in individuals whose blood pressures lie in the upper
portion of the prehypertensive range i.e. 130-139/85-89 mmHg.13
Vasan RS et al., 2001 assessed
the development of hypertension in normotensive participants in the Framingham Heart Study
and found a stepwise increase across three non-hypertensive BP categories (optimal, normal and
high-normal BP) over a period of four years (Table 3). This increase was more prominent in
individuals aged 65-94 years compared to those aged 35-64 years.23
Similar findings were
reported in the Trial of Preventing Hypertension (TROPHY) study where 63% of prehypertensive
individuals (BP 130-139/85-89 mmHg) aged 30-65 years, receiving a placebo, developed
hypertension over four years of follow-up.24
In 2008 Falkner B et al., found that among
adolescents aged 13-17 years the progression from prehypertension to hypertension was
significantly greater than the progression from normotension to hypertension. 15% of boys and
14% of girls with prehypertension had hypertension four years later whereas only 5% of boys and
6% of girls with normotension had hypertension four years later.20
Table 3. Rate of Progression of Optimal, Normal and High-Normal BP to Hypertension (≥140/90
mmHg) in Individuals Aged 35-64 Years and Those Aged 65-94 Years23
Optimal BP
(<120/80 mmHg)
Normal BP
(120-129/80-84 mmHg)
High-Normal BP
(130-139/85-89 mmHg)
35-64 years old 5.3% 17.6% 37.3%
65-94 years old 16% 25.5% 49.5%

-11-
1.2.3 Association of High-Normal BP/Prehypertension with Other CVD Risk Factors
In a study of the 1999 to 2000 National Health and Nutrition Examination Survey (NHANES) III
data, Greenlund et al., 2004 found that occurrence of CVD risk factors including: above-normal
cholesterol levels, excess weight/obesity, and diabetes mellitus, were greater in individuals with
prehypertension after adjusting for age, sex and ethnicity. Surprisingly, these individuals were
less likely to smoke than their normotensive counterparts.19
Prehypertensives were 1.65 times
more likely to have at least 1 other CVD risk factor than normotensives.19
Similarly, in the
Women‟s Health Initiative, age, body mass index (BMI), and prevalence of diabetes mellitus and
hypercholesterolaemia increased across blood pressure categories (normal, prehypertension and
hypertension), whereas smoking decreased.25
In a study of the NHANES II and NHANES II
Mortality Study, Mainous III et al., found that 90% of patients with prehypertension had other
CVD risk factors.26
Risk ratios for specific risk factors including obesity, dyslipidaemia, insulin resistance, metabolic
syndrome, and diabetes are all greater in prehypertensives than normotensives but fewer in
prehypertensives than hypertensives.13;27-30
Furthermore, microalbuminuria is more common in
prehypertensives than normotensives as are abnormalities in circulating markers of inflammation,
such as C-reactive proteins, interleukin 6, and tumour necrosis factor-.13;31-33
In the studies referenced above, blood pressure was categorised according to the JNC 7
guidelines i.e. individuals were classed as having prehypertension if they were not taking
antihypertensive medication and if they had SBP 120-139 mmHg or DBP 80-89 mmHg.2
-12-
1.2.4 High-Normal BP/Prehypertension and Risk of Mortality or Developing CVD
Prehypertension appears to be associated with an increased incidence of CVD, especially in those
individuals with BP between 130-139/85-89 mmHg and/or a history of diabetes or glucose
intolerance.30;34-36
Qureshi et al., 2005 examined existing data from the Framingham study and
found that a prehypertensive person is more than 3 times more likely to have a myocardial
infarction and 1.7 times more likely to have heart disease than a person with normal BP: the risk
of stroke was not increased.37
Similarly, in a different study, mortality from CVD was found to be
significantly greater in prehypertensive than normotensive individuals but the differences
disappeared once adjustments were made for presence of other CVD risk factors.26
In a longitudinal population-based, US cohort, prehypertension was associated with increased
risk of major cardiovascular events (including stroke, myocardial infarction and heart failure)
independently of other cardiovascular risk factors.35
These findings, along with the presence of
cardiovascular risk factors in 93% of the participant sample, support recommendations for
clinicians to actively target lifestyle modifications and multiple risk factor reduction in their
prehypertensive patients.35

-13-
1.2.5 Treating High-Normal BP/Prehypertension with Lifestyle Approaches to Prevent
Hypertension or CVD
Dietary approaches, either alone or with other lifestyle modifications, have been shown to reduce
blood pressure in prehypertensives as well as hypertensives.38-42
The results of the DASH
(Dietary Approaches to Stop Hypertension) study in 1997 revealed that a diet rich in fruits,
vegetables, and low-fat dairy foods and with reduced saturated and total fat can substantially
lower blood pressure, especially when implemented in conjunction with weight control (BMI 20-
25kg/m2), adequate potassium intake [>90mmol (2500mg) per day], low salt diet (<100mmol/day
or <6g sodium/day or <2.4g sodium chloride/day) and limited alcohol consumption (no more
than 3 units/day in men and no more than 2 units/day in women).3;38;39;43
Since 1997 it has
become evident that a diet higher in protein and unsaturated fat and lower in carbohydrate can
reduce blood pressure even further than the DASH diet alone.3;40
In addition, physical activity (30
minutes 3-5 times each week) is known to reduce blood pressure further still.3;44;45
Interestingly,
cigarette smoking, (except when chronic and heavy) does not appear to be associated with
hypertension.46;47
However, smoking does increase risk of cardiovascular disease considerably,
therefore smoking cessation is recommended.3
Lifestyle changes can lower blood pressure in prehypertensives and thus reduce the likelihood of
developing hypertension with its associated CVD risk (Table 4).2;48
Unfortunately, in order for
lifestyle modifications to substantially lower blood pressure they need to be adhered to and
sustained, which many people find difficult.1

-14-
Table 4. Lifestyle Interventions for Blood Pressure Reduction in Prehypertensives48
Strategy Recommendation SBP Effect in
Prehypertension
Effect on Incidence of
Prevalence of
Hypertension
DASH dietary pattern 4-5 fruits/day
4-5 vegetables/day
2-3 low-fat dairy/day
<25% fat
3.5 mmHg
Decreased by 62%
(prevalence)
Weight loss Effective BP lowering
even without attaining
normal BMI
1 mmHg/kg weight loss Decreased by 42%
(incidence)
Reduced sodium intake <2400 mg/day 2 mmHg per 76 mmol/L
per day decrease
Decreased by 38%
(incidence)
Physical activity Moderate exercise ≥30
minutes most days
3-4 mmHg Not Available
Moderation of alcohol
intake
≤2 oz/day (men); ≤1
oz/day (women)
3.5 mmHg Not Available
In order to prevent or delay the onset of hypertension in the population as a whole, a public health
strategy that complements the hypertension treatment strategy is warranted.2 Such a strategy
would require a multipronged approach directed to communities, schools, worksites, and the food
industry.2 For example, in 2002 the American Public Health Association and the National High
Blood Pressure Education Program Coordinating Committee recommended that the food
industry, including manufacturers and restaurants, reduce sodium in the food supply by 50% over
the next 10 years.2 More public health initiatives like this need to be implemented in order to
reduce BP in the general population.2

-15-
As mentioned previously, Qureshi et al., 2005 found that prehypertension is associated with
increased risk of myocardial infarction and coronary artery disease. This raises the question of
whether we should treat prehypertensive patients more aggressively i.e. with antihypertensive
medication.37
1.2.6 Management of High-Normal BP/Prehypertension
Unsurprisingly, there is much controversy about how individuals with high-normal
BP/prehypertension should be managed.
The JNC 7 guidelines focus on BP values as the main variables determining the need for
treatment and the type of treatment.17
JNC 7 recommends that individuals with prehypertension
(BP in the range 120-139/80-89 mmHg) should be firmly advised to practice lifestyle
modification and those who also have diabetes or kidney disease should be considered for
appropriate drug therapy if lifestyle modification fails to reduce their BP to 130/80 mmHg or
less.2
The ESHC guidelines emphasise the importance of overall (or global) cardiovascular risk
assessment, rather than a strict focus on hypertension, when making treatment decisions.1;17
The
ESHC guidelines recommend that people with high-normal BP (130-139/85-89 mmHg) that have
average (no other risk factors) or low added (1-2 risk factors) cardiovascular risk should have no
BP intervention or lifestyle changes, respectively.1;17
Individuals with high added cardiovascular
risk (3 or more risk factors, metabolic syndrome, subclinical organ damage or diabetes) should
initiate lifestyle changes and either consider drug treatment (if not diabetic) or start drug

-16-
treatment (if diabetic) and those with very high added cardiovascular risk (established
cardiovascular or renal disease) should initiate lifestyle changes and start immediate drug
treatment.17
The BHS IV guidelines differ from both JNC 7 and the European guidelines in that
they do not mention intervention with antihypertensive medication at blood pressures
<140/90mmHg.3
1.2.7 Treating High-Normal BP/Prehypertension with Antihypertensive Medication to
Prevent Hypertension or CVD
A handful of trials have investigated the effects of antihypertensive medication in individuals
with prehypertension/high normal blood pressure.
The TROPHY trial was a large trial to assess the feasibility of treating prehypertension (130-
139/85-89 mmHg) with the angiotensin-receptor blocker candesartan in order to prevent or delay
the onset of hypertension.24
Participants were randomised to receive two years of candesartan or
placebo, followed by two years of placebo for both groups. After two years the blood pressure in
the candesartan group decreased more rapidly than in the placebo group resulting in a relative
risk reduction in the risk of new-onset hypertension of 66.3% in the candesartan group. After four
years (two years after discontinuation of candesartan) blood pressure rose more rapidly in the
candesartan group resulting in a relative risk reduction in the candesartan group of 15.6%. Thus,
candesartan reduced blood pressure and delayed the onset of hypertension during treatment but
the benefits were not sustained once treatment was withdrawn. Notably, rates of serious adverse
events during candesartan treatment were low and were similar in the two groups.24

-17-
The Prevention of Hypertension with ACE-inhibitor Ramipril in Patients with High Normal
Blood Pressure (PHARAO) trial investigated the capacity of ramipril (an angiotensin-converting
enzyme inhibitor) to prevent or delay the onset of hypertension in patients with high-normal
blood pressure.49
Hypertension and high-normal blood pressure were defined in accordance with
JNC 7/ESHC.1;2
Participants were randomised to the ramipril treatment group or the control
group. 30.7% of subjects in the ramipril group, and 42.9% in the control group developed
hypertension over a period of three years. Treatment with ramipril significantly reduced the
progression to hypertension by 34.4% compared with the control group. These results are in line
with those of the TROPHY trial.49
Interestingly, multivariate analysis revealed that the risk of
progression to hypertension rises by 5% with each mmHg of office SBP. Although a clear-cut fall
in BP was observed in the initial treatment phase with ramipril, the subsequent BP difference
between the two groups was minimal (SBP 1-2 mmHg lower in the ramipril group), suggesting
that treatment of high-normal blood pressure with ramipril may not be beneficial in the long-
term. There was no difference in the frequency and type of adverse events between the treatment
and control group. However, there was a higher incidence of cough in the ramipril group.49
In 2007, Skov et al., performed a small study to investigating whether early treatment with an
candesartan in young (18-20 years old) normotensive offspring of hypertensive parents
persistently lowered blood pressure after treatment withdrawal. Participants were randomised to
receive either candesartan or placebo. The intervention period was 12 months, with 24 months of
follow-up. Findings of this study showed that although candesartan significantly reduced blood
pressure, renal vascular resistance and left ventricular mass during treatment, at 12 and 24
months follow-up mean ambulatory blood pressure monitoring (ABPM) was no different

-18-
between subjects who received candesartan and those who received a placebo. Thus, temporary
treatment of subjects at high familial risk of future hypertension with an angiotensin receptor
blocker is feasible, but the treatment had no persistent effect on blood pressure when treatment
was withdrawn. There were no significant differences in adverse events between the two
groups.50
It might be difficult to know if long term antihypertensive therapy in pre-hypertensive patients
has any effect. In addition, it is difficult to justify treatment with antihypertensive drugs that may
result in adverse events and will have considerable cost implications. Further outcome trials are
needed to determine i) the effects of pharmacological treatment on target organ damage and
cardiovascular morbidity and mortality ii) whether they are safe when administered over many
decades, as would be required to treat young individuals with prehypertension and iii) whether
they are cost-effective for the treatment of patients with such low absolute risk of CVD.22
In the
meantime a more attractive strategy would be to improve lifestyle in the population for example
by reducing “hidden” salts in processed foods such as bread (1 slice contains 0.5g of salt),
breakfast cereals, ready-made meals and flavour enhancers such as stock cubes or manufactured
sauces to reduce daily intake to <6 g.3 Other population-based strategies might be to increase
attention to health education by general practitioners, increase access to places to engage in
physical activity, reduce servings of food in restaurants, increase availability of healthy food
choices in schools, worksites and restaurants, increase exercise programs in schools and decrease
the cost of low-sodium/low calorie food products.2

-19-
In summary, available guidelines recognise that high-normal or pre-hypertension may progress to
established hypertension and is associated with an increased risk of cardiovascular disease. The
management advice differs depending on the guidelines used but mostly suggests that lifestyle
intervention is appropriate to reduce blood pressure. More accurate ways of establishing which
individuals are at risk of developing cardiovascular disease include standard risk assessment as
well as novel methods outlined in the next section.

-20-
1.3 Additional Ways to Assess Cardiovascular Risk
1.3.1 Arterial Stiffness
1.3.1.1 Definition and Mechanisms Underlying Arterial Stiffness
Arterial stiffness (arteriosclerosis) refers to stiffening of the arteries, particularly the more
compliant and distensible central arteries e.g. the aorta and its branches.51
Arterial stiffening
occurs due to a complex interaction between stable and dynamic changes involving structural
(e.g. collagen and elastin) and cellular elements (e.g. endothelial cell signalling and vascular
smooth muscle cell tone) of the vessel wall.52
For example, stimulation of an inflammatory
environment causes overproduction of abnormal, cross-linked collagen and diminished quantities
of normal elastin in the vessel wall, increasing arterial stiffness. These vascular alterations i.e.
changes in the extracellular matrix and endothelial cell dysfunction, are influenced by
haemodynamic forces such as shear stress and mechanical stretch as well as by “extrinsic factors”
such as hormones (e.g. angiotensin II and aldosterone), advanced glycation end products (AGEs),
chronic inflammation, vascular calcification, high sodium intake, and glucose regulation (Figure
1).52;53
Aging is the dominant process altering vascular stiffness.51
However, diseases such as
hypertension, diabetes mellitus and chronic kidney disease amplify the vascular changes that
result in arterial stiffening.52;53

-21-
Figure 1. Summary of the Multiple Causes and Locations of Arterial Stiffness52
AGE‟s, advanced glycation end products; MΦ, MMP-7 (an elastase); I-CAM, Inter-Cellular Adhesion Molecule;
MMP, matrix metalloproteases; TGF-β, transforming growth factor; VSMC, vascular smooth muscle cell; NaCl,
sodium chloride
1.3.1.2 Arterial Stiffness and Cardiovascular Risk
Arterial stiffening increases systolic blood pressure and pulse pressure causing myocyte
hypertrophy, increased left ventricular after load and reduced coronary perfusion, resulting in
diastolic and systolic dysfunction and ultimately congestive heart failure.53
Raised systolic and
pulse pressures also promote further vascular damage increasing risk of stroke and progressive
loss of kidney function (Figure 2).53
It is now well accepted that aortic stiffness is an intermediate endpoint for cardiovascular events,
either fatal or non-fatal.54
In addition, large-artery stiffness has proved to be an independent
predictor of adverse cardiovascular outcomes in the general population as well as in patients with

-22-
primary hypertension, diabetes, or end-stage renal disease.55
Its prognostic value has been shown
to extend even beyond classic cardiovascular risk factors entering various types of risk score.54;55
Arterial stiffness is therefore important, not only for assessing cardiovascular risk but also for
predicting cardiovascular outcomes.54
Arterial stiffening also provides direct evidence of target
organ damage, which is of major importance in determining the overall cardiovascular risk of
hypertensive patients.54
Arterial stiffness should therefore be considered as a recommended test
for the evaluation of cardiovascular risk, particularly in patients in whom target organ damage is
not discovered by routine investigations.54
With this in mind it is important to be able to measure
arterial stiffness accurately and easily in order to predict an individual‟s cardiovascular risk.
However, the widespread measurement of arterial stiffness in clinical practice is limited by the
need for specific technical equipment and trained personnel.55;56
Figure 2. Consequences of Increased Arterial Stiffness53

-23-
1.3.1.3 Methods of Measuring Arterial Stiffness
Non-invasive measures of arterial stiffness fall into three broad groups: i) measuring pulse wave
velocity (PWV), ii) using ultrasound to relate the change in diameter (or area) of an artery to
distending pressure in order to measure arterial distensibility/compliance, and iii) assessing
peripheral arterial pressure waveforms (e.g. augmentation index [AIx]) by applanation
tonometry.57;58
The most common method for evaluating arterial stiffness is based on the study of PWV i.e. the
velocity of the BP propagation wave along a given conduit artery, for example, the aorta.59
Measurements involve applanation tonometry, mechanotransducer or Doppler probes and are
regarded as the gold standard for determining arterial stiffness, independent of wave activity: the
higher PWV, the higher arterial stiffness.59
In parallel, the technique of applanation tonometry is
widely used to evaluate central pressure and mostly wave reflections through the non-invasive
use of the parameter called augmentation index (AIx). AIx is an indirect measure of carotid
stiffness, but mainly a direct measure of central wave reflection.59
There are many commercial devices available that use different methods to measure arterial
stiffness.57
Unfortunately, these devices can be expensive and are often complicated to use and
are thus operator-dependent. This means measurement of arterial stiffness cannot be performed
easily in daily clinical practice. Consequently, there is a need for a more simple measure of
arterial stiffness, which may have recently been identified in the form of the ambulatory arterial
stiffness index (AASI).

-24-
1.3.1.3.1 Ambulatory Arterial Stiffness Index (AASI)
The Ambulatory Arterial Stiffness Index (AASI) is a new, easy-to-obtain index of arterial
stiffness.55;56
Ambulatory arterial stiffness index has been shown to strongly correlate with classic
measures of arterial stiffness, such as PWV and AIx, and has been identified as an independent
marker for target organ damage, cognitive function and cardiovascular and renal outcomes.60
AASI is derived from 24-hour ABPM recordings. The theory behind this method is that the
dynamic relation between diastolic and systolic blood pressure over 24 hours provides insight
into the stiffness of the arterial wall.61
The regression slope of diastolic against systolic blood
pressure is calculated and AASI is defined as 1 minus the regression slope (Figure 3). The stiffer
the arterial tree, the closer the regression slope and AASI are to 0 and 1 respectively.61

-25-
50
55
60
65
70
75
80
85
90
95
100
105
110
115
120
90 100 110 120 130 140 150 160 170 180 190 200
Dia
sto
lic B
P (m
mH
g)
Systolic BP (mmHg)
Figure 3. Scatter Graph Showing 24-hour SBP Readings (x) Plotted Against 24-hour DBP
Readings (y). The regression slope of diastolic against systolic blood pressure is calculated and
AASI is defined as 1 minus the regression slope.
Mean 24-hour BP (mmHg): 150/89
Regression Slope: 0.77 units
AASI: 0.23 units
-26-
1.3.2 Metabolic Syndrome
Metabolic syndrome is the name given to a cluster of closely related cardiovascular risk factors
namely: visceral obesity, dyslipidaemia, hyperglycaemia, and hypertension.62
The most recent
diagnostic criteria for metabolic syndrome, from the International Diabetes Federation (IDF) is:
central obesity (waist circumference ≥94 cm in males, ≥80cm in females or BMI >30 kg/m2
) plus
any two of the following four factors: raised triglycerides (≥1.7 mmol/L or specific treatment for
this lipid abnormality), reduced HDL cholesterol (<1.03 mmol/L in males, <1.29 mmol/L in
females or specific treatment for this lipid abnormality), raised blood pressure (SBP ≥130 mmHg
or DBP ≥85 mmHg or treatment of previously diagnosed hypertension) and/or raised fasting
plasma glucose (FPG ≥5.6 mmol/L, or previously diagnosed type II diabetes).62
The cause of metabolic syndrome is unknown, which leads some people to question whether it is
a syndrome at all. However, it remains useful to be able to identify individuals with metabolic
syndrome because it is a risk factor for both cardiovascular disease and diabetes mellitus. In
2005, the population-attributable fraction due to the metabolic syndrome, [as defined by the
National Cholesterol Education Program (NCEP) and WHO] was found to be ~12-17% for CVD
and ~30-52% for diabetes.63
More recently, Lorenzo et al., 2007 found that the IDF definition of
metabolic syndrome predicted incident CVD risk (OR 1.69 [95% CI 1.13-2.54]) and diabetes risk
(OR 5.76 [95% CI 4.11-9.07]) independently of other risk factors.64
-27-
1.4 Peripheral Neuropathy
Hypertension is associated with reduced ability to feel pain, and there is some evidence that
hypertensive individuals may have peripheral neuropathy.65-71
Peripheral neuropathy infers damage or central inhibition of impulses to nerves of the peripheral
nervous system (PNS). The PNS consists of the nerves that lie outside the central nervous system
(the brain and spinal cord) and that innervate the limbs and organs. The PNS is divided into the
somatic nervous system (voluntary) and the autonomic nervous system (involuntary). Population
prevalence of peripheral neuropathy is around 2.4%, rising with age to 8%.72
There are many
causes of peripheral neuropathy. The most common causes are diabetes mellitus, alcohol, certain
drugs, and infections such as HIV (human immunodeficiency virus). Diabetes mellitus is the
most common cause of peripheral neuropathy in the western world with a prevalence of 22.7% in
Type I diabetics and 32% in Type II diabetics in the UK.73;74
Patients with peripheral neuropathy
may experience altered sensation, pain, weakness or autonomic symptoms.72
Clinical features
vary widely depending on the nerves affected, class and level of axon affected, age of onset, rate,
course and severity of the pathologic process and degree of regeneration and sprouting, among
other factors.75
The symptoms typically begin distally in the toes and fingers. They commonly
appear in the toes before the fingers and spread proximally.72
Peripheral neuropathy is a long-
term, degenerative, disabling condition for which there is currently no treatment other than
symptomatic relief, therefore research in this area is paramount.

-28-
It is known that hypertension is strongly associated with the development of diabetic neuropathy
(a form of peripheral neuropathy specific to diabetes) and that unmedicated hypertensives have
higher pain thresholds than normotensives.65;66;76-84
These findings lead us to hypothesise that
hypertension may be associated with peripheral neuropathy i.e. increased thresholds of other
sensory modalities as well as pain, and that this sensory loss may be a direct result of
hypertension even when diabetes is not present.

-29-
1.5 Hypertension and Diabetic Neuropathy
A link between peripheral neuropathy and hypertension can be seen in diabetes mellitus where
many studies have found hypertension to be strongly associated with the development of diabetic
neuropathy. Diabetic neuropathy is a multifactorial process but hypertension has been found to be
the most important predisposing cardiovascular risk factor.76-81
Harris et al., 1993 in a cross-
sectional study, concluded that hypertension and hyperglycaemia predispose to symptoms of
sensory neuropathy. In logistic regression, factors independently related to symptoms of sensory
neuropathy in people with Type II diabetes included duration of diabetes, hypertension,
hyperglycaemia and glycosuria. In fact, hypertension was associated with a 60% higher
likelihood of symptoms.76
Forrest et al., 1997 in a prospective cohort study, found that
hypertension had the greatest impact on the development of distal symmetrical sensory
polyneuropathy (DSSP) (the most common type of diabetic neuropathy) in individuals with both
short or long-term Type I diabetes.77
Cohen et al., 1998 analysed data from The Appropriate
Blood Pressure Control in Diabetes (ABCD) Trial (a cross-sectional study) and found that
diabetic sensory peripheral neuropathy is independently associated with diabetes duration, body
weight, age, retinopathy, overt albuminuria, height, duration of hypertension, insulin use, and
race/ethnicity.78
More recently Tesfaye et al., 2005 in a prospective cohort study, demonstrated
that in addition to glycaemic control, the incidence of neuropathy is associated with potentially
modifiable cardiovascular risk factors, including raised triglyceride levels, body mass index,
smoking and hypertension.79
Jarmuzewska et al., 2005 in a cross-sectional study, concluded that
pulse pressure (an indicator of arterial stiffness) is independently and negatively associated with
nerve function i.e. as pulse pressure increases, nerve function decreases, and in a subsequent
-30-
cross-sectional study in 2007 concluded that there is a strong association between hypertension
and development of SMPN (sensorimotor peripheral neuropathy) in patients with relatively short-
term Type II diabetes.80;81
More recently, Balducci et al., 2006 found that long-term aerobic
exercise training can prevent or modify the natural history of diabetic peripheral neuropathy.
Interestingly, systolic and diastolic blood pressure in the exercise group decreased by 4 mmHg
and 5 mmHg respectively over four years, potentially providing further evidence for a role of
blood pressure in diabetic neuropathy.82
The foregoing studies indicate that hypertension is a risk factor for diabetic neuropathy. The
precise mechanisms underlying the development of diabetic neuropathy are unknown. Studies
have found reduced nerve oxygenation and impaired blood flow in human diabetic neuropathy
suggesting a key role for microvascular disease in its pathogenesis.85;86
There is evidence that
diabetes-induced metabolic and vascular disturbances lead to abnormalities in the peripheral
nerve microvasculature.87
These abnormalities are thought to cause ischaemia and hypoxia in
peripheral nerves, causing peripheral nerve damage, resulting in peripheral neuropathy.88
Ischaemia from peripheral vascular disease (PVD), (for which hypertension is a risk factor)
brings about oxidative stress and injury to nerves via increased production of reactive oxygen
species (ROS) as reinforced by the finding that glutathione (a free radical scavenger) can be
partially effective at preventing experimental diabetic neuropathy, possibly by improving
oxygenation.89-91
In this context, hypertension may contribute to the peripheral nerve damage
seen in diabetic neuropathy. Interestingly, there is evidence of greater degrees of neuronal
function impairment in painless than in painful neuropathy, with nerve blood flow impaired to a
greater extent and oxygen saturation lower in individuals with painless than those with painful

-31-
neuropathy.92;93
Acute painful neuropathy occurring in the setting of normalisation of glycaemia
may be associated with new vessel formation on the surface of the nerve, further suggesting
important differences between painful and painless neuropathy.92
In experimental studies on diabetic rats, antihypertensive agents have been shown to improve
oxygenation, nerve blood flow, nerve abnormalities and nerve conduction as well as preventing
nerve damage and dysfunction.94-98
Similarly, in studies of human diabetes, antihypertensives
have been found to significantly improve motor and sensory nerve conduction velocity, warming
and vibratory detection thresholds and diabetic neuropathy.99;100
These findings reinforce the
possible deleterious effects of hypertension on peripheral nerve function in diabetics.
Hypertension may be a risk factor for peripheral neuropathy, even in the absence of diabetes, a
postulation that has been supported in a number of studies on spontaneously hypertensive rats
(SHR). These studies demonstrated impaired vascular supply to peripheral nerves and
morphological changes and decreased nerve function in the sciatic nerve, all of which were
improved with antihypertensive medication.101-103

-32-
1.6 Hypertension and Hypoalgesia
For nearly 30 years researchers have demonstrated that there is an association between decreased
perception of pain (hypoalgesia) and hypertension. However, the mechanisms involved in this
relationship are poorly understood.104
There is still doubt as to whether, in human essential
hypertension, hypoalgesia is secondary to raised blood pressure or whether both depend on some
common mechanism.105
Another uncertainty is whether there is a central cause for the
hypoalgesia or damage to the peripheral nerves themselves. Based on the existing evidence, the
baroreceptor reflex may coordinate cardiovascular and pain regulatory responses and opioid
peptides may also be implicated.
Activation of baroreceptor afferents via increases in blood pressure may play an important part in
hypertension-associated hypoalgesia. This relationship can be observed in numerous
experimental studies on hypertensive rats, in which hypoalgesia is brought about by baroreceptor
activation and can be alleviated by carotid sinus baroreceptor denervation or by decreasing the
cardiopulmonary baroreceptor afferent input.106
In addition, resection of the right cervical vagus,
which reduces cardiopulmonary vasoreceptor afferent input, has been shown to markedly reduce
hypoalgesic behaviour in SHR.66
It has been postulated that cardiovascular and pain regulatory
responses may be coordinated as part of an adaptive mechanism, helping the body to face
stressful events.83;107
A role for endogenous opioids in hypertension-associated hypoalgesia is suggested as a result of
the finding that, in rats, this type of hypoalgesia is successfully suppressed by the opiate
-33-
antagonist naloxone. Furthermore, hypertensive rats were found to have increased opioid activity
in several areas of the central nervous system (CNS).66;105
Interestingly, in a study on humans
Ring et al., 2008 observed that hypertensives experienced less pain than normotensives during
their assessment of pain tolerance but that this manifestation of hypertensive hypoalgesia was not
moderated by naltrexone.108
The existence of an association between increased arterial blood pressure and hypoalgesia has
been repeatedly shown in experimental hypertension and confirmed in humans using various
form of noxious stimuli, including electrical tooth pulp, thermal and electrocutaneous
stimulation. Induction of hypertension in rats by different methods (mineralocorticoid treatment,
phenylephrine administration, occlusion of abdominal aorta, renal artery clipping,
deoxycorticoesterone acetate salt administration, social deprivation and hypothalamic grafts from
SHR) is associated with reduced responsiveness to noxious stimuli (hot-plate, electric shock and
mechanical force applied to a limb).66;105;107
The interaction between hypertension and pain
perception has also been supported by the finding that experimental interventions acting to lower
blood pressure also reduce hypoalgesia.107
Increased tolerance to pain has also been observed in hypertensive humans. The first to report on
hypertension-associated hypoalgesia in humans were Zamir and Shuber, 1980 who found a
higher pain threshold during non-invasive tooth pulp stimulation in unmedicated essential
hypertensives compared with normotensives.65
These results were confirmed using the same
technique by Ghione et al., in 1988.109
Sheps et al., 1992 found that the average mean arterial
-34-
pressure in all participants (hypertensives and normotensives) was significantly related to both
thermal pain threshold and tolerance.84
More recently, Rosa et al., 1994 found significantly higher electrocutaneous perceptive, pain and
tolerance thresholds in hypertensives compared with normotensives as well as significantly
higher tooth pulp pain and tolerance thresholds.66
In addition, the thresholds of two components
(R2 and R3) of the blink reflex to electrical stimulation of the supraorbitalis nerve were
significantly higher in hypertensives and a significant correlation was found between R3
threshold (nociceptive component of the blink reflex) and diastolic pressure. Together, these
results confirm that hypertension is associated with hypoalgesia in humans.66
Even among
normotensive humans, resting systolic blood pressure has been found to correlate negatively with
pain ratings and in addition, normotensives at risk for developing hypertension have
demonstrated decreased pain sensitivity compared with low risk individuals.110
From a clinical perspective, hypertension-associated hypoalgesia is important since there is
evidence that asymptomatic (silent) myocardial ischemia and unrecognised, presumably painless,
myocardial infarction are more common in people with elevated blood pressure.66;105;111

-35-
1.7 Hypertension and Peripheral Neuropathy
There have been few studies investigating the relationship between hypertension and peripheral
neuropathy. The results of these have been inconclusive but some have shown a possible positive
association between the two variables.
Zamir and Shuber, 1980 found that sensory threshold as well as pain thresholds differed between
normotensive and hypertensive subjects.65
Rosa et al., 1994 observed that other thresholds, which
cannot easily be related to pain sensation (i.e. perceptive cutaneous threshold and the R2
component of the blink reflex), are significantly increased in human hypertension. These findings
may suggest that other sensations besides pain are reduced in arterial hypertension, but this
proposal warrants further investigation.66
Zarrelli et al., 2001 concluded that arterial hypertension
might be an independent risk factor for chronic symmetric polyneuropathy (CSP) in the elderly.67
Legrady et al., 2006 found higher current perception threshold (CPT) values in the peroneal
nerve of both diabetic and non-diabetic hypertensives compared to controls, indicating sensory
loss. Duration of hypertension and diabetes mellitus both correlated positively with CPT's
measured on the lower extremities in the diabetic hypertensive group. This study concluded that
the severity of peripheral sensory neuropathy (PSN) was similar in non-diabetic and diabetic
hypertensive patients although, in the latter, the PSN can involve more types of nerve fibres.
Hypertension should thus be considered in the pathogenesis of peripheral nerve dysfunction.68
Rivero Luis et al., 2006 found that peripheral and autonomic nerve function are often altered in
obese people without diabetes and thus hypertension might contribute to peripheral nerve

-36-
dysfunction.69
Edwards et al., 2008 found that although hypertension did not affect sensory nerve
conduction velocity, unmedicated essential hypertensives demonstrated sensory loss and
significantly lower amplitude sensory nerve action potentials compared to normotensives.70
These preliminary findings suggest that unmedicated hypertensives may have a reduced number
of active nerve fibres, possibly resulting in mild subclinical peripheral neuropathy.70
In a
subsequent study investigating the effects of essential hypertension on short latency human
somatosensory-evoked potentials, Edwards et al., 2010 found unaltered peripheral nerve
conduction velocities but reduced amplitude sensory nerve action potentials in unmedicated
hypertensives compared to nomortensives, thus reinforcing their earlier findings and
demonstrating that hypertension may affect the peripheral nervous system by causing axonal loss
without affecting myelination.71
Results from these two recent studies oppose those of Viskoper
et al., 1971 who showed reduced motor nerve conduction velocities in the upper extremities of
medicated hypertensives compared to normotensives and that conduction velocities were
inversely related to diastolic blood pressure.112
The foregoing studies suggest that essential hypertension is characterised by sensory loss.
However, the mechanisms underlying these sensory deficits remain unclear. The pathological
process may be similar to that in diabetic neuropathy, whereby metabolic and vascular
disturbances lead to structural and functional changes in blood vessels supplying the peripheral
nerves, resulting in ischaemia and hypoxia and ultimately peripheral neuropathy.87;88;101-103
This
is feasible since hypertension is a risk factor for peripheral vascular disease, which causes
ischaemia leading to oxidative stress and injury to nerves via increase production of reactive
oxygen species.89-91
In fact, studies on non-diabetic spontaneously hypertensive rats have
-37-
demonstrated impaired vascular supply to peripheral nerves and morphological changes and
decreased nerve function in the sciatic nerve, all of which improved with antihypertensive
medication.101-103
Furthermore, peripheral nerves are susceptible to ischaemia and hypoxia
because they lack the ability to autoregulate (maintain a constant blood flow despite changes in
perfusion pressure). Thus, they rely on a profuse blood supply to maintain oxygenation.113
In sum, hypertension is a known risk factor for diabetic neuropathy and unmedicated essential
hypertensives have a reduced ability to feel pain compared to normotensives. There is also some
evidence that hypertension may cause peripheral neuropathy. However, the mechanisms
underlying these associations remain unclear.

-38-
1.8 Hypotheses
Two studies are presented in this thesis:
1.8.1 Study One: Peripheral Neuropathy in Hypertension
The evidence suggests an association between hypertension and peripheral neuropathy. It was
therefore hypothesised that individuals with newly diagnosed unmedicated essential hypertension
would show more sensory deficits in response to peripheral nerve stimulation than individuals
with normal blood pressure.
1.8.2 Study Two: Retrospective Database Analysis of Cardiovascular Risk in Confirmed
and Borderline Hypertensive Patients
Patients with hypertension often have other risk factors for cardiovascular disease which help
clinicians decide whether to treat them with antihypertensive medications and/or lifestyle
interventions. Cardiovascular risk profiles of patients with unmedicated confirmed hypertension
or unmedicated borderline hypertension, selected from our Hypertension Database, were
determined. It was hypothesised that the borderline hypertensives, who would not normally be
started on antihypertensive medication in the absence of other risk factors, would have similar
cardiovascular risk profiles to the confirmed hypertensives.

-39-
1.9 Aims
1.9.1 Study One: Peripheral Neuropathy in Hypertension
The primary aim of this thesis was to look at the influence of unmedicated essential hypertension
(SBP ≥140 or DBP ≥90 mmHg) on a range of sensory thresholds to investigate the possibility
that hypertension may cause subclinical peripheral neuropathy.
1.9.2 Study Two: Retrospective Database Analysis of Cardiovascular Risk in Confirmed
and Borderline Hypertensive Patients
The secondary aim of this thesis was to compare cardiovascular risk factors, including
ambulatory arterial stiffness index (AASI) and features consistent with the metabolic syndrome,
in a larger number of patients with unmedicated confirmed hypertension (SBP ≥160 mmHg or
DBP ≥100 mmHg) or unmedicated borderline hypertension (SBP 140-159 mmHg or DBP 90-99
mmHg), selected from our Hypertension Database.

-40-
CHAPTER 2: STUDY ONE - PERIPHERAL NEUROPATHY IN
HYPERTENSION
2.1 Introduction and Aims
It is known that hypertension is strongly associated with the development of diabetic neuropathy
and that unmedicated hypertensives have higher pain thresholds than normotensives. There is
also some evidence that hypertension may be positively associated with peripheral neuropathy.
The present study will look at the influence of newly diagnosed unmedicated essential
hypertension on a range of sensory thresholds (not just heat-pain) to investigate the possibility
that hypertension may cause subclinical peripheral neuropathy across an array of sensory
modalities.
To our knowledge, no previous study has examined peripheral nerve function using a range of
quantitative sensory tests, to assess a range of sensory nerve fibres and modalities in the upper
and lower limbs of newly diagnosed unmedicated essential hypertensives.

-41-
2.2 Methods and Analysis
2.2.1 Participants
20 newly diagnosed unmedicated essential hypertensives (12 men, 8 women) and 25
normotensive controls (9 men, 16 women) were investigated for subclinical peripheral
neuropathy. Table 5 and 6 show the characteristics of the participants in the hypertensive and
normotensive groups. Newly diagnosed unmedicated essential hypertensives (SBP ≥140 or DBP
≥90 mmHg) were recruited from a hypertension clinic at the Wellcome Trust Clinical Research
Facility (WTCRF), Queen Elizabeth Hospital (QEH), Birmingham, United Kingdom.
Normotensive controls were recruited via email-sent out to all Queen Elizabeth and Selly Oak
Hospital staff. Controls were paid £15 for their time. Participants gave written consent after
reading an information sheet explaining the procedures involved. The local ethics advisory
committee approved this study.

-42-
2.2.2 Establishment of Blood Pressure Status
Patients with newly diagnosed unmedicated essential hypertension were recruited from a
hypertension clinic. All patients underwent 24-hour ambulatory blood pressure monitoring
(ABPM) (SpaceLabs, Model 90217) and 3 clinic BP measurements taken with an OMRON Mi-5.
These monitors have been validated according to the protocols of the Association for the
Advancement of Medical Instrumentation and the British Hypertension Society. Account was
taken of the differences between ABPM measurements and clinic measurements as per BHS IV
guidelines.3 Hypertension was defined as sustained systolic blood pressure at referral of
≥140mmHg or a diastolic blood pressure of ≥90mmHg, which was confirmed at clinic and on
ABPM. Normal blood pressure was defined as mean clinic blood pressure, on the day of
testing, of <140mmHg systolic and <90mmHg diastolic.

-43-
2.2.3 Exclusion Criteria
Participants were excluded for the following:
Age younger than 18 years or older than 50 years (the latter were excluded because there
is evidence that risk of peripheral neuropathy increases with age).114;115
BP >180/110mmHg confirmed on ABPM with or without evidence of accelerated phase
hypertension (blood pressure must be treated without delay)
Pregnancy or menstrual period over 1 month ago
Major psychiatric disorder
Current use of prescription medication (excluding contraceptives)
Excess alcohol intake (>21 units/week in men, or >14 units/week in women)
Thyroid disease
Chronic liver disease
Cerebrovascular disease
Angina
Myocardial infarction
Peripheral vascular disease
Chronic neurological disease
Rheumatoid or osteoarthritis
Acromegaly or gout
Any chronic disease or any condition predisposing to carpal tunnel syndrome or
peripheral neuropathy including diabetes mellitus (either pre-existing or diagnosed on
random blood sugar sample)

-44-
Other causes of peripheral neuropathy (hereditary neuropathy, B12 deficiency,
cryoglobulinaemia etc.)
Neck or back surgery
Cardiac pacemaker
Consumption of alcoholic or caffeinated drinks 2 hours before the start of the study.
If clinically indicated the patients in the hypertensive group had appropriate investigations to
exclude secondary causes of hypertension before taking part in the study. On the basis of these
investigations patients were excluded if there was evidence of underlying renal or adrenal
pathology including acute or chronic renal failure, renal artery stenosis, glomerulonephritis,
pyelonephritis, Conn‟s syndrome, or phaeochromocytoma. Any person with a poor understanding
of English was also excluded from the study to ensure that informed consent was obtained and
that tasks were followed correctly.

-45-
2.2.4 Apparatus and Physiological Measurements
Height (m), weight (kg), waist (cm) and hip (cm) measurements were determined using standard
methods. Blood pressure measurements were taken at rest in an upright sitting position. Systolic
blood pressure (SBP) and diastolic blood pressure (DBP) were obtained using an oscillometric
sphygmomanometer and brachial cuff (Omron IC, Omron Health Care Ltd.) attached to the
participant‟s upper right arm (the right arm was used for logistical reasons). Three consecutive
readings were obtained before starting the sensory tests. These three readings were averaged to
give measures of mean resting systolic and diastolic pressure. The following sensory nerve
function tests and database analyses then commenced.
2.2.5 Computer Aided Sensory Evaluator (CASE) IV
The CASE IV system (WR Medical Electronic Co., USA) attached to a laptop (Toshiba) was
used to administer stimuli and record threshold data. This system has been shown to be useful in
conjunction with clinical examination for diagnosing diabetic neuropathy.116
For vibration, cooling, warming and heat-pain detection thresholds, a cue device (WR Medical
Electronics Co., USA) was used to denote the time period in which the stimuli were
administered. For all these tests, except heat-pain, a response device (WR Medical Electronics
Co., USA) with buttons marked „yes‟ and „no‟ was used to register the participant‟s response.
Vibration detection threshold was measured using a vibration stimulator (WR Medical
Electronics Co., USA). The vibration stimulator was placed on the participant‟s right index finger
or big toe, in the midline between the base of the nail and the most distal knuckle (Figure 4).

-46-
Vibration was delivered at 125 cycles per second and was variable between 0 and 576
micrometers.
Thermal sensation and heat-pain detection thresholds were measured using a thermal stimulator
(WR Medical Electronics Co., USA). The thermal stimulator was strapped to the dorsal surface
of the participant‟s right hand or foot (Figure 5). During operation the thermal stimulator
produced a specified temperature on a 9.0-square-centimeter stimulating surface. The stimulating
surface temperature could be varied from 8.0°C to 50.0°C with accuracy of 1.25°C to 0.25°C
depending on the temperature.
Participants sat upright in a chair. During the sensory threshold assessment on the hand the right
hand rested, palm down on the vibration board, on a table (Figure 4). During the sensory
threshold assessment on the foot the right foot was rested, sole down, on the vibration board on
the floor (Figure 5). The vibration board was a ceramic board with a foam base designed to
dampen any unwanted vibrations transmitted through the table or the floor. Skin surface
temperature was measured prior to the thermal test on the hand and foot using an infrared
thermometer (C-500 C, Linear Laboratories, CA).
Units of stimulus intensity used were JND's (Just Noticeable Differences). Vibration, cooling and
warming stimuli were increased and decreased using the 4, 2 and 1 stepping method devised by
Dyck.117
This method was chosen for its accuracy and speed. Heat-pain was increased and
decreased using the heat pain non-repeating ascending with null stimuli method.118
Using this

-47-
method it was possible to compare the heat-pain detection threshold (HP:0.5) and the
intermediate heat-pain response (HP:5.0).118
2.2.6 Procedure
Testing was carried out in the Wellcome Trust Clinical Research Facility at the Queen Elizabeth
Hospital, Birmingham, United Kingdom. The testing room was quiet, had sufficient light and air
circulation and was at a comfortable temperature, free from drafts. Each participant attended a
single 1 hour session.
On arrival at the clinic, participants were introduced and briefed on the experiment before signing
a consent form. Their height (m), weight (kg), waist (cm) and hips (cm) were then measured.
Participants sat comfortably in a chair next to a table and any questions they had were answered.
Participant‟s risk factors and family history were then obtained by means of a questionnaire. This
included questions about ethnicity, smoking, drinking habits, salt intake, exercise and family
history of heart disease, diabetes and hypertension. Three resting blood pressure measurements
were then obtained from the right upper arm before commencing the sensory tests.
During the session vibration, cooling, warming and heat-pain thresholds of the right hand and
foot were determined using the CASE IV system (WR Medical Electronics Co., USA).

-48-
2.2.6.1 Quantitative Sensory Testing (QST) of Vibratory Perception
Vibration sensation assesses myelinated Aβ fibre function. Vibratory perception was measured
on the dorsal surface of the right index finger followed by the right big toe, in the midline
between the nail bed and the most distal knuckle. Normative data has been obtained at these body
sites in healthy individuals (aged 3-79 years).119
2.2.6.1.1 Vibratory Testing in the Hand and Foot
Participants placed their right hand/foot (plantar surface down) onto the vibration board. The
vibration stimulator was placed on the participant‟s right index finger/big toe in the midline
between the base of the nail and the most distal knuckle. The stimulator was adjusted so that its
body was horizontal using a knob, checking the level bubble. Instructions for the vibration test
were read out and any questions were answered. Instructions were read from a pre-prepared sheet
to ensure that all participants were given identical information. The need for the participants to
wear headphones for this test was explained (the headphones played noise to block out any
external noises) and the headphones were placed on the participant. Participants were required to
press „yes‟ or „no‟ on the response device as to whether they felt a stimulus during the display of
the number „1‟ on the cue device. Practice tests were performed to estimate the threshold then the
vibration test was performed. If two positive responses were given to null stimuli the test was
repeated.

-49-
2.2.6.2 QST of Cooling, Warming and Heat-Pain Perception
Cooling sensation assesses thinly myelinated Aδ fibre function and warming and heat-pain
sensations assess unmyelinated C fibres. Thermal and heat-pain perception were measured on the
dorsal surface of the participant‟s right foot followed by the right hand.
2.2.6.2.1 Cooling, Warming and Heat-Pain Testing of the Right Foot
Participants put a sock on into which a hole had been cut. The purpose of the sock was to insulate
the foot. The temperature of the participant‟s foot was measured. The thermal stimulator was
placed on the dorsal surface of the participant‟s right foot through the hole, ensuring the surface
was flat against the skin and was in contact with the skin at all four corners. Instructions were
read out for the cooling test and any questions were answered. Participants were required to
respond „yes‟ or „no‟ on the response device as to whether they felt a stimulus during the display
of the number „1‟ on the cue device. Practice tests were performed to estimate the threshold and
the cooling test was performed. If two positive responses were given to null stimuli the test was
repeated.
Instructions for the warming test were read out and any questions were answered. Participants
were required to respond „yes‟ or „no‟ on the response device as to whether they felt a stimulus
during the display of the number „1‟ on the cue-device. Practice tests were performed to estimate
the threshold and then the warming test was performed. If two positive responses were given to
null stimuli the test was repeated.

-50-
Instructions for the heat-pain test were read out and any questions were answered. Participants
were reassured that we would be testing them only at low discomfort and pain levels and were
told that they should inform us if the stimuli got too high and they did not wish to continue.
Participants were required to verbally rate any discomfort or pain felt during the display of the
number „1‟ on the patient cue device on a scale from 0-10 (0=nothing or warm or hot, 1=lowest
level of discomfort or pain, 10=most severe pain). These responses were typed into the laptop. As
soon as participants rated the pain as 5 or above the test stopped. A pain rating of „1‟
corresponded to the heat-pain detection threshold (HP: 0.5) and a rating of 5 or above
corresponded to the intermediate heat pain response (HP: 5.0). It was explained to the
participants that there was no practice for this test. Then the heat-pain test was performed. If a
positive result was given to null stimuli the test was repeated.
2.2.6.2.2 Cooling, Warming and Heat-Pain Testing of the Right Hand
The same thermal and heat pain tests were performed on the participant‟s right hand.
The temperature of the participant‟s hand was measured. The thermal stimulator was positioned
on the dorsal surface of the participant‟s right hand ensuring all four corners were in contact with
the skin. Cooling, warming and heat-pain tests were performed as on the foot.
In several instances the participants did not report notable pain or warming even at the highest
stimulus intensity of the instrument. For these participants in whom the pain and/warming
threshold was not measurable since it was above the upper range of stimulation, the highest
available value of 25 JND (Just Noticeable Difference) was assigned.

-51-
Participants were free to withdraw at any time. All information obtained from the study was kept
confidential and anonymous and participants were identified by subject number only.
Figure 4. Measurement of Vibration Threshold in the Right Hand. The right hand rested on the
vibration board and the vibration stimulator was placed on the index finger, in the midline
between the base of the nail and the most distal knuckle.

-52-
Figure 5. Measurement of Thermal and Heat-Pain Thresholds in the Right Foot. Participants
wore a sock with a hole in its dorsal surface. The thermal stimulator was strapped onto the dorsal
surface of the foot, through the hole, so that all four corners of the stimulator were in contact with
the skin.

-53-
2.2.7 Statistical Analysis
Results were analysed using statistical software (PASW Statistics 18, SPSS Inc., Chicago). The
two groups (hypertensive and normotensive) were compared using various statistical tests. First,
an independent-samples T Test was used to determine differences in continuous variables
between the hypertensive males and normotensive males, and between the hypertensive females
and normotensive females. Second, Chi-square analysis was used to determine differences in
categorical variables between the hypertensive and normotensive group. Third, the sensory
thresholds of the hypertensive and normotensive group were compared using one-way analyses
of variance (ANOVA). Fourth, the sensory thresholds of the hypertensive and normotensive
group were compared using univariate analysis of covariance (ANCOVA), which allowed
adjustment for the influence of potential confounders such as age, sex and BMI. This was
necessary because age, sex and BMI are known to influence peripheral nerve
dysfunction.114;115;120;121
Finally, Spearman‟s correlation coefficients were calculated for all
sensory thresholds against mean systolic and diastolic blood pressure measurements. A
significance level of .05 was adopted for all the above analyses.
2.2.8 Power Calculations
We assessed each individual‟s peripheral nerve function using a battery of sensory tests. In the
initial analyses, for each outcome measure yielded by these tests, we compared the scores among
the hypertensives and normotensive group. With alpha at 0.05 and a total sample size of 45, the
study is powered at 0.80 to detect a group difference by ANCOVA corresponding to an effect
size of f=0.43, which corresponds to a large effect size.122
-54-
2.3 Results and Brief Discussion
2.3.1 Group Characteristics and Risk Factors of Each Blood Pressure Group
Continuous variables of the hypertensive and normotensive males are presented in Table 5 and
Figure 6. An independent-sample T Test confirmed that, compared to the normotensive males the
hypertensive males exhibited significantly higher SBP, DBP, age, weight and BMI but the groups
did not differ in terms of height or alcohol consumption (Table 5).
Continuous variables of hypertensive and normotensive females are presented in Table 6 and
Figure 7. An independent-sample T Test confirmed that, compared to the normotensive females
the hypertensive females exhibited significantly higher SBP and DBP but the groups did not
differ in terms of age, height, weight, BMI or alcohol consumption (Table 6).

-55-
Table 5. Unadjusted Mean [Standard Deviation (SD)], Blood Pressures, Age, Height, Weight, BMI and Alcohol Consumption of the
Hypertensive and Normotensive Males as well as the Degrees of Freedom, t-Values and Statistical Significance Level of the Group
Effects
Variable Mean (SD)
Hypertensive
Males
n=12
Mean (SD)
Normotensive
Males
n=9
F Sig. t
df Sig.
(2-tailed)
Mean
Difference
Standard
Error
Difference
95% Confidence
Interval of the
Difference
Lower Upper
SBP (mmHg)
156.25 (16.64)
122.89 (11.92)
0.60
0.45
5.10
19
<0.001**
33.36
6.54
19.67
47.06
DBP (mmHg) 98.83 (11.04) 73.78 (6.40) 2.81 0.11 6.06 19 <0.001** 25.06 4.13 16.40 33.71
Age (years) 36.00 (7.70) 28 (4.18) 2.00 0.17 2.81 19 <0.05* 8.00 2.85 2.04 13.96
Height (m) 1.81 (0.10) 1.79 (0.06) 2.75 0.11 0.57 19 0.57 0.02 0.04 -0.06 0.10
Weight (kg) 99.80 (18.42) 73.24 (13.05) 0.85 0.37 3.68 19 <0.05* 26.56 7.22 11.44 41.67
BMI (kg/m2) 30.58 (4.56) 22.89 (3.30) 1.25 0.28 4.28 19 <0.001** 7.69 1.80 3.93 11.46
Alcohol
(units/week)
6.63 (7.00) 3.03 (4.84) 3.34 0.08 1.32 19 0.20 3.60 2.73 -2.11 9.30
*= significant group difference at 0.05 level **=significant group difference at 0.001 level

-56-
Table 6. Unadjusted Mean (SD), Blood Pressures, Age, Height, Weight, BMI and Alcohol Consumption of the Hypertensive and
Normotensive Males as well as the Degrees of Freedom, t-Values and Statistical Significance Level of the Group Effects
Variable Mean (SD)
Hypertensive
Females
n=8
Mean (SD)
Normotensive
Females
n=16
F Sig. t
df Sig.
(2-tailed)
Mean
Difference
Standard
Error
Difference
95% Confidence
Interval of the
Difference
Lower Upper
SBP (mmHg)
148.38 (8.45)
113 (15.44)
1.48
0.24
6.00
22
<0.001**
35.38
5.89
23.15
47.60
DBP (mmHg) 96.50 (6.41) 71.81 (11.31) 2.22 0.15 5.69 22 <0.001** 24.69 4.34 15.69 33.68
Age (years) 36.38 (10.62) 34.31 (10.35) 0.14 0.71 0.46 22 0.65 2.06 4.52 -7.31 11.44
Height (m) 1.66 (0.06) 1.63 (0.06) 0.00 0.97 1.09 22 0.29 0.03 0.03 -0.03 0.08
Weight (kg) 73.28 (18.52) 63.22 (12.11) 2.50 0.13 1.61 22 0.12 10.06 6.26 -2.93 23.04
BMI (kg/m2) 26.75 (5.65) 23.88 (4.21) 1.18 0.29 1.41 22 0.17 2.88 2.04 -1.36 7.11
Alcohol
(units/week)
3.75 (3.81) 2.58 (4.20) 0.30 0.59 0.66 22 0.51 1.17 1.77 -2.49 4.84
*= significant group difference at 0.05 level **=significant group difference at 0.001 level

-57-
05
101520253035404550556065707580859095
100105110115120125130135140145150155160165170175180
SBP (mmHg) DBP (mmHg) Age (years) Height (m) Weight (kg) BMI (kg/m2) Alcohol (units/week)
Un
its
Continuous Variables (units)
Hypertensive Males
Normotensive Males
Figure 6. Unadjusted Mean and Standard Deviation of all Continuous Variables of the
Hypertensive Males and the Normotensive Males * Denotes a Significant Difference at the 0.05
Level.
*
*
*
*
*

-58-
05
101520253035404550556065707580859095
100105110115120125130135140145150155160165170175
SBP (mmHg) DBP (mmHg) Age (years) Height (m) Weight (kg) BMI (kg/m2) Alcohol (units/week)
Un
its
Continuous Variables (units)
Hypertensive Females
Normotensive Females
Figure 7. Unadjusted Mean and Standard Deviation of all Continuous Variables of the
Hypertensive Females and the Normotensive Females * Denotes a Significant Difference at the
0.05 Level.
Categorical variables are presented in Table 7. Chi-square analysis revealed that the hypertensive
and normotensive group did not differ significantly in terms of sex, smoking status, exercise or
salt intake. However, there was a significantly higher incidence of family history of hypertension
in the hypertensive group.
*
*

-59-
Table 7. Number of Males and Females and Number and Percentage of Cardiovascular Risk
Factors in the Hypertensive and Normotensive Group as well as the Degrees of Freedom, Chi-
square Values and Statistical Significance Levels of the Group Effects
n=20
Hypertensives
n=25
Normotensives
df
χ2
p
Number of
participants
% Number of
participants
%
Sex Male
Female
12
8
9
16
1 2.57 0.11
Family history of HT Yes
No
14
5
74 6
18
25 1 10.10 <0.001**
Smoker/Ex-smoker Yes
No
8
12
40 4
21
16 1 3.27 0.07
Exercise <5x30mins/week Yes
No
7
8
47 14
10
58 1 0.04 0.84
Excess salt Yes
No
7
13
35 12
13
48 1 1.97 0.16
Features consistent with the
metabolic syndrome
Yes
No
11
6
65 NK NK
*= significant group difference at 0.05 level **=significant group difference at 0.001 level NK, Not Known

-60-
2.3.2 Analysis of Co-Variance and Spearman’s Correlation Coefficients on Sensory
Threshold Data Obtained from CASE IV
Because age, sex and BMI are known to influence peripheral nerve function and were different
between blood pressure groups, these variables were adjusted for in the univariate analysis of co-
variance (ANCOVAs) that follow.114;115;120;121
A series of one-way analysis of variance (ANOVAs) were performed on vibration, cooling,
warming and heat-pain thresholds in the right hand and foot (Table 8). These analyses revealed a
significant group difference for vibration threshold in the foot, cooling threshold in the hand, and
vibration threshold in the hand. The hypertensive group exhibited higher vibration thresholds in
the hand and foot than the normotensive group but lower cooling thresholds in the hand.
A series of univariate analysis of co-variance (ANCOVAs), adjusted for age, sex and BMI were
performed on vibration, cooling, warming and heat-pain thresholds in the right hand and foot
(Table 9). These analyses revealed a significant group difference for vibration threshold in the
foot. The hypertensive group exhibited higher vibration thresholds in the foot than the
normotensive group. Unadjusted mean sensory thresholds of the hypertensive and normotensive
group are presented in Figure 8.
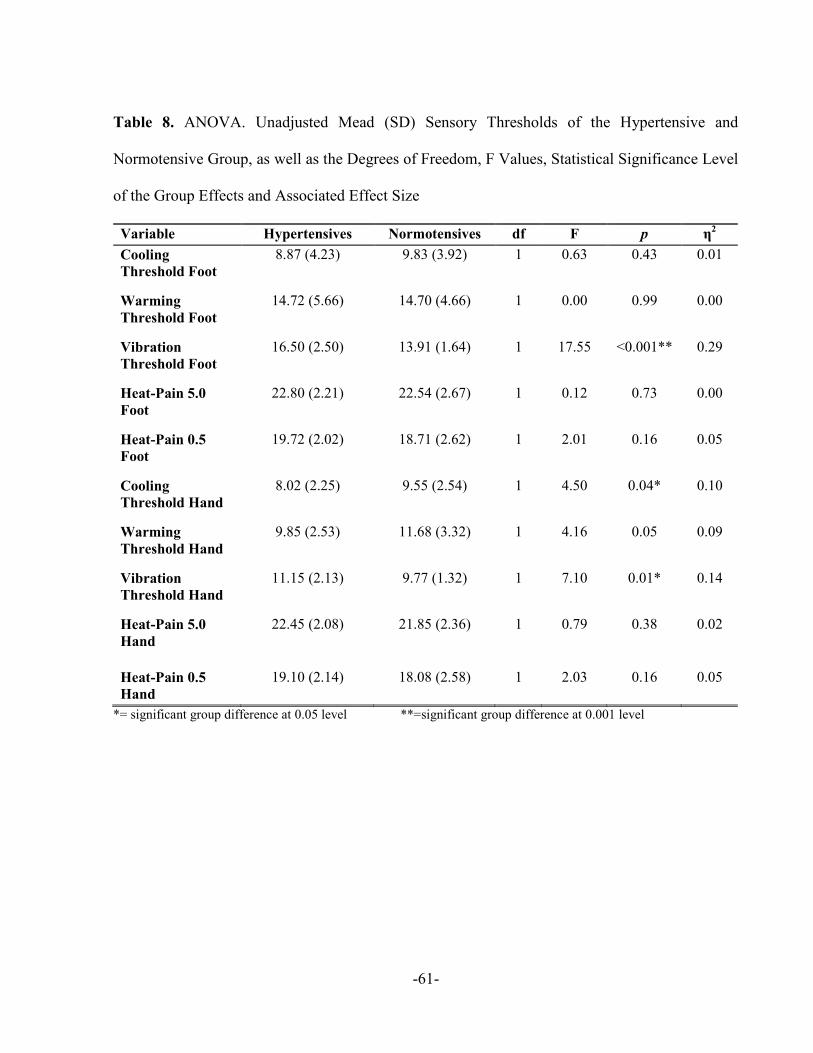
-61-
Table 8. ANOVA. Unadjusted Mead (SD) Sensory Thresholds of the Hypertensive and
Normotensive Group, as well as the Degrees of Freedom, F Values, Statistical Significance Level
of the Group Effects and Associated Effect Size
Variable Hypertensives Normotensives df F p η2
Cooling
Threshold Foot
8.87 (4.23) 9.83 (3.92) 1 0.63 0.43 0.01
Warming
Threshold Foot
14.72 (5.66) 14.70 (4.66) 1 0.00 0.99 0.00
Vibration
Threshold Foot
16.50 (2.50) 13.91 (1.64) 1 17.55 <0.001** 0.29
Heat-Pain 5.0
Foot
22.80 (2.21) 22.54 (2.67) 1 0.12 0.73 0.00
Heat-Pain 0.5
Foot
19.72 (2.02) 18.71 (2.62) 1 2.01 0.16 0.05
Cooling
Threshold Hand
8.02 (2.25) 9.55 (2.54) 1 4.50 0.04* 0.10
Warming
Threshold Hand
9.85 (2.53) 11.68 (3.32) 1 4.16 0.05 0.09
Vibration
Threshold Hand
11.15 (2.13) 9.77 (1.32) 1 7.10 0.01* 0.14
Heat-Pain 5.0
Hand
22.45 (2.08) 21.85 (2.36) 1 0.79 0.38 0.02
Heat-Pain 0.5
Hand
19.10 (2.14) 18.08 (2.58) 1 2.03 0.16 0.05
*= significant group difference at 0.05 level **=significant group difference at 0.001 level
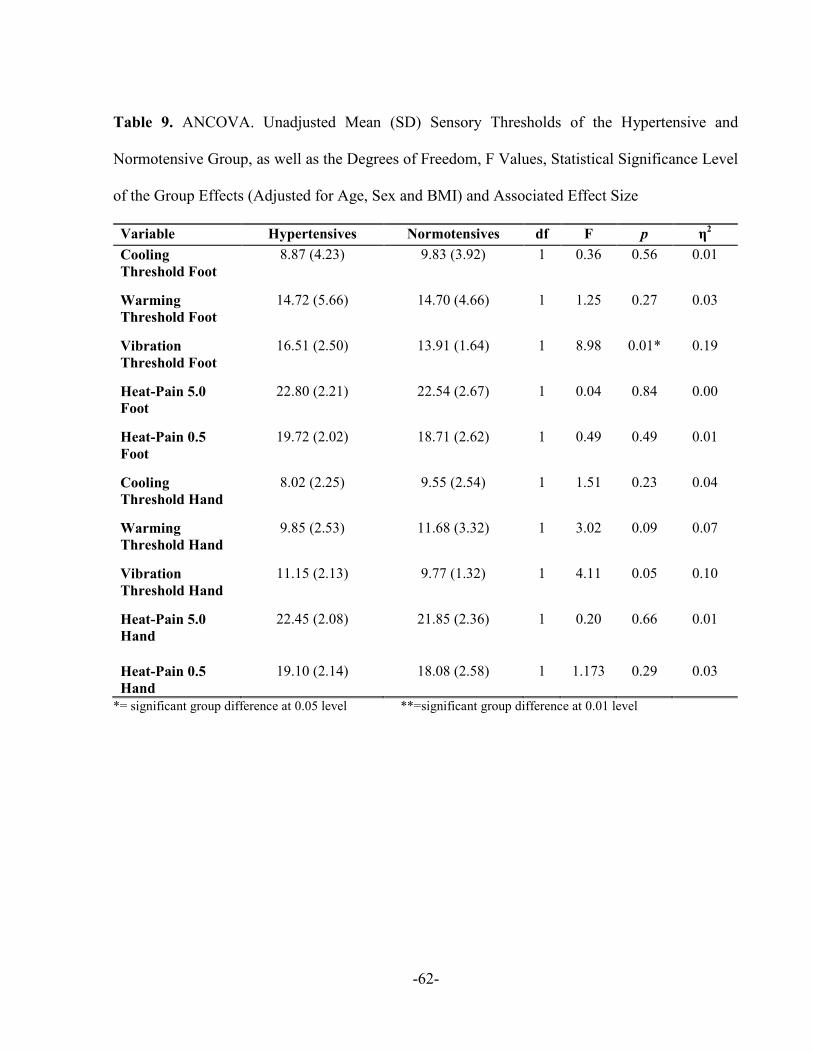
-62-
Table 9. ANCOVA. Unadjusted Mean (SD) Sensory Thresholds of the Hypertensive and
Normotensive Group, as well as the Degrees of Freedom, F Values, Statistical Significance Level
of the Group Effects (Adjusted for Age, Sex and BMI) and Associated Effect Size
Variable Hypertensives Normotensives df F p η2
Cooling
Threshold Foot
8.87 (4.23) 9.83 (3.92) 1 0.36 0.56 0.01
Warming
Threshold Foot
14.72 (5.66) 14.70 (4.66) 1 1.25 0.27 0.03
Vibration
Threshold Foot
16.51 (2.50) 13.91 (1.64) 1 8.98 0.01* 0.19
Heat-Pain 5.0
Foot
22.80 (2.21) 22.54 (2.67) 1 0.04 0.84 0.00
Heat-Pain 0.5
Foot
19.72 (2.02) 18.71 (2.62) 1 0.49 0.49 0.01
Cooling
Threshold Hand
8.02 (2.25) 9.55 (2.54) 1 1.51 0.23 0.04
Warming
Threshold Hand
9.85 (2.53) 11.68 (3.32) 1 3.02 0.09 0.07
Vibration
Threshold Hand
11.15 (2.13) 9.77 (1.32) 1 4.11 0.05 0.10
Heat-Pain 5.0
Hand
22.45 (2.08) 21.85 (2.36) 1 0.20 0.66 0.01
Heat-Pain 0.5
Hand
19.10 (2.14) 18.08 (2.58) 1 1.173 0.29 0.03
*= significant group difference at 0.05 level **=significant group difference at 0.01 level
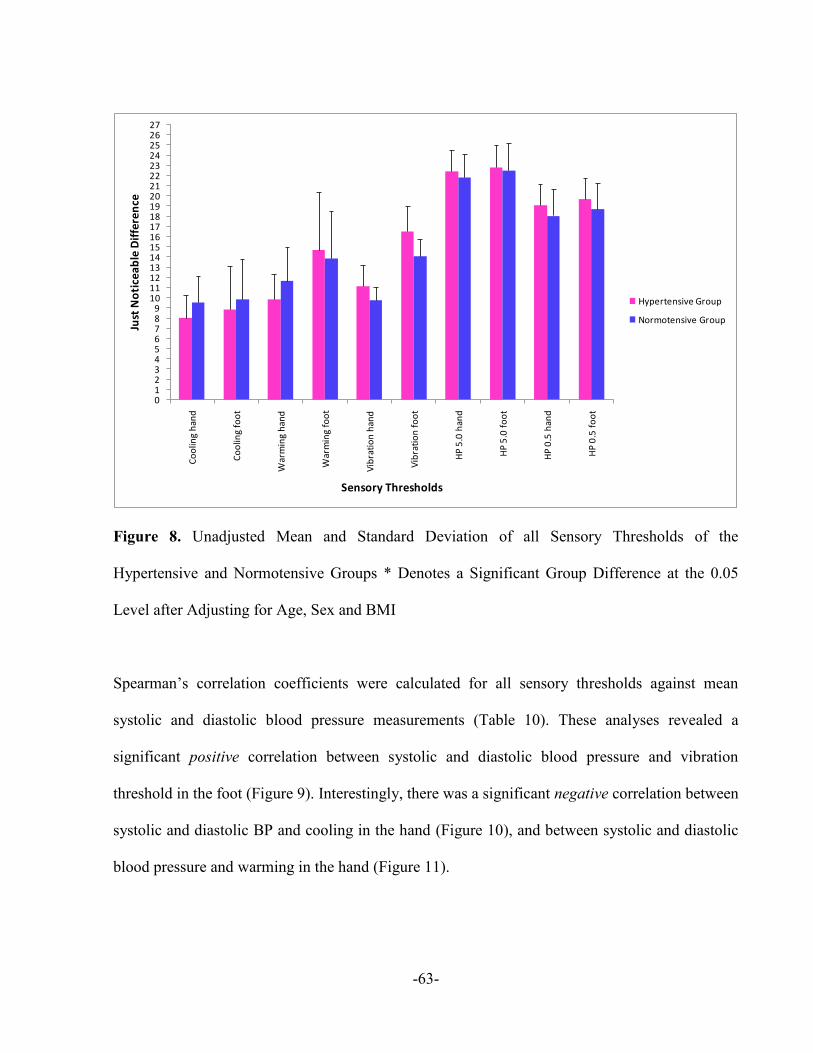
-63-
0123456789
101112131415161718192021222324252627
Co
olin
g h
and
Co
olin
g fo
ot
War
min
g h
and
War
min
g fo
ot
Vib
rati
on
han
d
Vib
rati
on
fo
ot
HP
5.0
han
d
HP
5.0
fo
ot
HP
0.5
han
d
HP
0.5
fo
ot
Just
No
tice
able
Dif
fere
nce
Sensory Thresholds
Hypertensive Group
Normotensive Group
Figure 8. Unadjusted Mean and Standard Deviation of all Sensory Thresholds of the
Hypertensive and Normotensive Groups * Denotes a Significant Group Difference at the 0.05
Level after Adjusting for Age, Sex and BMI
Spearman‟s correlation coefficients were calculated for all sensory thresholds against mean
systolic and diastolic blood pressure measurements (Table 10). These analyses revealed a
significant positive correlation between systolic and diastolic blood pressure and vibration
threshold in the foot (Figure 9). Interestingly, there was a significant negative correlation between
systolic and diastolic BP and cooling in the hand (Figure 10), and between systolic and diastolic
blood pressure and warming in the hand (Figure 11).
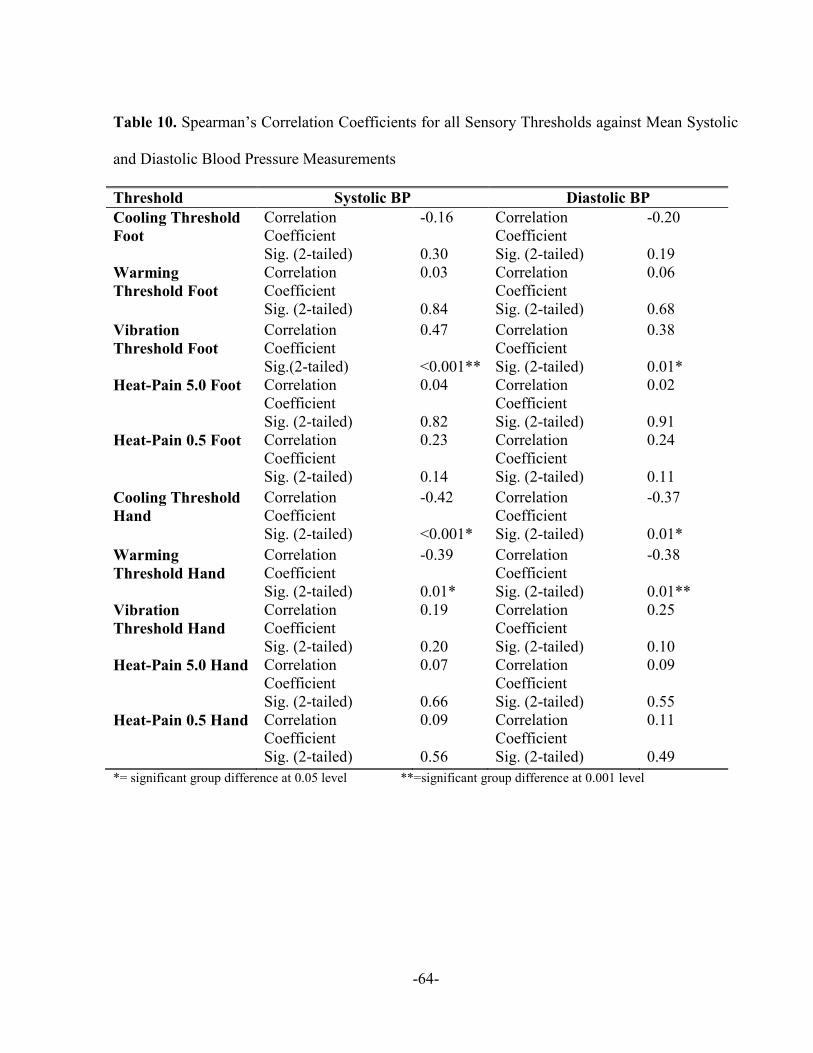
-64-
Table 10. Spearman‟s Correlation Coefficients for all Sensory Thresholds against Mean Systolic
and Diastolic Blood Pressure Measurements
Threshold Systolic BP Diastolic BP
Cooling Threshold
Foot
Correlation
Coefficient
Sig. (2-tailed)
-0.16
0.30
Correlation
Coefficient
Sig. (2-tailed)
-0.20
0.19
Warming
Threshold Foot
Correlation
Coefficient
Sig. (2-tailed)
0.03
0.84
Correlation
Coefficient
Sig. (2-tailed)
0.06
0.68
Vibration
Threshold Foot
Correlation
Coefficient
Sig.(2-tailed)
0.47
<0.001**
Correlation
Coefficient
Sig. (2-tailed)
0.38
0.01*
Heat-Pain 5.0 Foot Correlation
Coefficient
Sig. (2-tailed)
0.04
0.82
Correlation
Coefficient
Sig. (2-tailed)
0.02
0.91
Heat-Pain 0.5 Foot Correlation
Coefficient
Sig. (2-tailed)
0.23
0.14
Correlation
Coefficient
Sig. (2-tailed)
0.24
0.11
Cooling Threshold
Hand
Correlation
Coefficient
Sig. (2-tailed)
-0.42
<0.001*
Correlation
Coefficient
Sig. (2-tailed)
-0.37
0.01*
Warming
Threshold Hand
Correlation
Coefficient
Sig. (2-tailed)
-0.39
0.01*
Correlation
Coefficient
Sig. (2-tailed)
-0.38
0.01**
Vibration
Threshold Hand
Correlation
Coefficient
Sig. (2-tailed)
0.19
0.20
Correlation
Coefficient
Sig. (2-tailed)
0.25
0.10
Heat-Pain 5.0 Hand Correlation
Coefficient
Sig. (2-tailed)
0.07
0.66
Correlation
Coefficient
Sig. (2-tailed)
0.09
0.55
Heat-Pain 0.5 Hand Correlation
Coefficient
Sig. (2-tailed)
0.09
0.56
Correlation
Coefficient
Sig. (2-tailed)
0.11
0.49
*= significant group difference at 0.05 level **=significant group difference at 0.001 level

-65-
0
20
40
60
80
100
120
140
160
180
200
0 5 10 15 20 25
Blo
od
Pre
ssu
re
Vibration Threshold Foot
Systolic BP Diastolic BP Linear (Systolic BP) Linear (Diastolic BP)
Figure 9. Scatter Graph Showing Vibration Threshold in the Foot (x) against Systolic and
Diastolic Blood Pressure (y)

-66-
0
20
40
60
80
100
120
140
160
180
200
0 2 4 6 8 10 12 14 16 18
Blo
od
Pre
ssu
re
Cooling Threshold Hand
Systolic BP Diastolic BP Linear (Systolic BP) Linear (Diastolic BP)
Figure 10. Scatter Graph Showing Cooling Threshold in the Hand (x) against Systolic and
Diastolic Blood Pressure (y)
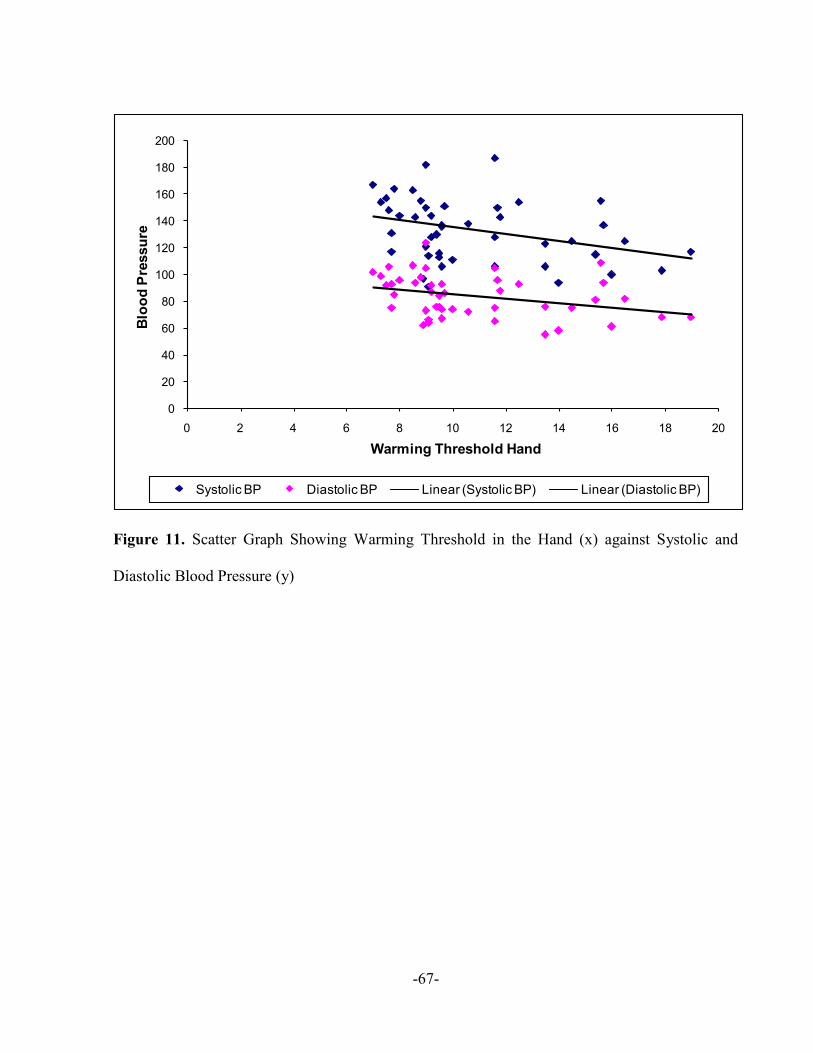
-67-
0
20
40
60
80
100
120
140
160
180
200
0 2 4 6 8 10 12 14 16 18 20
Blo
od
Pre
ssu
re
Warming Threshold Hand
Systolic BP Diastolic BP Linear (Systolic BP) Linear (Diastolic BP)
Figure 11. Scatter Graph Showing Warming Threshold in the Hand (x) against Systolic and
Diastolic Blood Pressure (y)

-68-
2.3.3 Brief Discussion
To our knowledge, the current study was the first to use quantitative sensory testing (QST) to
investigate different sensory thresholds in order to assess different nerve fibres (small as well as
large) in a group of newly diagnosed unmedicated essential hypertensives as well as in a group of
normotensive controls to investigate whether hypertensives have subclinical peripheral
neuropathy. In previous studies cutaneous detection thresholds, current perception thresholds,
sensory nerve conduction velocities and sensory action potentials were used to measure nerve
function in general.65;66;68;70
Earlier studies investigating peripheral nerve function in
hypertensives did not measure specific senses, and measured pain by other means but not by the
heat-pain method used in this study.65-70;83;84
The hypertensive males exhibited more risk factors for hypertension and cardiovascular disease
than the normotensive males including significantly higher SBP, DBP, weight and BMI. The
hypertensive females had significantly higher SBP and DBP than the normotensive females. The
hypertensive group had significantly higher incidence of family history of hypertension than the
normotensive group. It is important to note that the significantly higher weight and BMI of the
hypertensive males may be confounding variables in this study. In addition, 65% of the
hypertensive group had features consistent with the metabolic syndrome, which may be
contributing to peripheral neuropathy rather than hypertension alone. Other possible confounders
such as age, sex and alcohol consumption, however, were not significantly different between the
hypertensive and normotensive group.
*

-69-
The major findings of this study were as follows. 1) The hypertensive group had significantly
higher vibration thresholds in the foot than the normotensive group, even after accounting for
age, sex and BMI. 2) There was a significant positive correlation between SBP and DBP with
vibration threshold in the foot. 3) There was a significant negative correlation between SBP and
DBP with both cooling and warming thresholds in the hand.
The findings of increased vibration thresholds in the foot in the hypertensive group and of a
positive correlation between SBP and DBP with vibration threshold support our hypothesis and
some previous evidence of peripheral neuropathy in hypertension.
It is worth mentioning that vibration threshold in the hand was significantly higher in the
hypertensive group before age, sex and BMI were accounted for. However, after accounting for
these confounding variables the significance diminished, indicating that age, sex and/or BMI
were contributing to the significant difference between groups rather than blood pressure alone.
This supports evidence that age, sex and BMI influence peripheral nerve function.114;115;120;121
Similarly, the significant group difference for cooling threshold in the hand diminished once age,
sex and BMI were accounted for. With this in mind, it is possible that the significant negative
correlation between SBP and DBP with cooling threshold in the hand may also disappear once
these confounding factors are accounted for. This may also be the case for the significant
negative correlation for warming in the hand. However, hierarchical linear regression analyses
would have to be performed to investigate this.

-70-
Notably, all warming thresholds in the foot and heat-pain thresholds were higher in the
hypertensive group even after adjusting for age, sex and BMI but not to a significant degree.
However, these may become more significant with a larger sample size.
-71-
CHAPTER 3: STUDY TWO - RETROSPECTIVE DATABASE
ANALYSIS OF CARDIOVASCULAR RISK IN CONFIRMED AND
BORDERLINE HYPERTENSIVE PATIENTS
3.1 Introduction
Chapter two demonstrated some evidence of subclinical peripheral neuropathy, which may
suggest damage to peripheral nerve vasculature in unmedicated hypertensives. The sample size
was not large enough to determine whether these changes were happening in all grades of
hypertension. However, vibration threshold was particularly affected and this appeared to be
correlated with the level of blood pressure. This chapter will use information from our
Hypertension Database to compare cardiovascular risk factors including features consistent with
the metabolic syndrome and ambulatory arterial stiffness index (AASI) in a much larger group of
confirmed hypertensives (n=83) and borderline hypertensives (n=154).

-72-
3.1.1 The Hypertension Database
The Hypertension Database (Microsoft Access 2002) contains extensive information on all new
referrals to the Hypertension Clinic since May 2006. The database is updated every week at clinic
from the patient‟s medical notes. Recorded information includes: hospital ID, initials, gender,
date of birth, ethnicity, family history of hypertension, gestational hypertension, co-morbidities,
current medications, risk factors (smoking, salt, exercise and alcohol consumption), reason for
referral, clinic variables including waist, height, weight, BMI, mean clinic blood pressures,
urinalysis results, fasting blood results including sugar, electrolytes, renal function, lipid profiles
etc., electrocardiogram findings, ABPM findings including mean daytime and mean night time
blood pressures, dipper status (i.e. whether or not the blood pressure is lower when the patient is
asleep), clinical diagnosis based on ABPM results, record of any secondary investigations
undertaken e.g. renal ultrasound, renin:aldosterone ratio etc., any changes to medications
recommended to the general practitioner and further management plans e.g. lifestyle advice,
repeat ABPM, discharge.

-73-
3.2 Methods
3.2.1 Establishment of Blood Pressure Status
Patients were categorised as having either confirmed or borderline hypertension depending on
their mean clinic blood pressure readings and their mean daytime ABPM reading, which were
available from the Hypertension Database. Account was taken of the 10/5 mmHg adjustment of
ambulatory readings recommended by the BHS.3 However, it is worth mentioning that the use of
this adjustment is controversial and is not uniform across blood pressure levels. Confirmed
hypertension was defined as sustained systolic blood pressure at referral of ≥160 mmHg or a
diastolic blood pressure of ≥100mmHg, which was confirmed at clinic and on ABPM.
Borderline hypertension was defined as sustained systolic blood pressure at referral of 140-159
mmHg or a diastolic blood pressure of 90-99 mmHg, which was confirmed at clinic and on
ABPM.
3.2.2 Exclusion Criteria
Patients were excluded if they were taking any prescription medications, if there was evidence of
secondary hypertension (renal or adrenal causes) or if they had any disease/disorder other than
hypertension.

-74-
3.2.3 Database Analysis
1. Patient demographics (age, height, weight and BMI) and blood pressures (clinic and
ABPM) were compared between the confirmed hypertensive group and the borderline
hypertensive group.
2. Cardiovascular and/or hypertension risk factor profiles (sex, family history of
hypertension, smoking, salt intake, exercise, alcohol intake and electrolytes) of the two
groups were then compared. These analyses included a calculation of the 10 year
coronary and CVD risk score in both groups calculated using the Framingham equation,
which takes into account age, sex, SBP, DBP, cholesterol, HDL cholesterol, smoking,
diabetes, and ECG-LVH.15
3. Ambulatory Arterial Stiffness Index (AASI) for each individual was calculated from their
ABPM readings. The mean AASI of each group was compared. AASI was defined as 1
minus the regression slope of diastolic over systolic blood pressure readings obtained
from 24-hour ABPM recordings. AASI gives a measure of arterial stiffness and thus
cardiovascular risk.55
The closer the AASI to 1, the stiffer the arteries.61
4. Body Mass Index (BMI), triglycerides, HDL cholesterol, blood pressure and fasting
plasma glucose were used to determine the number of patients with features consistent
with the metabolic syndrome.62
Please note that waist measurements were not available
for all patients so BMI was used to calculate metabolic syndrome. According to Alberti et
al., 2005, „if body-mass index is over 30 kg/m2, central obesity can be assumed and waist
circumference does not need to be measured.‟62

-75-
3.2.4 Statistical Analysis
Results were analysed using statistical software (PASW Statistics 18, SPSS Inc., Chicago). The
two groups (confirmed hypertensive and borderline hypertensive) were compared using various
statistical tests. First, an independent-samples T Test was used to determine differences in
continuous variables between the confirmed hypertensive and borderline hypertensive group.
Second, Chi-square analysis was used to determine differences in categorical variables between
the confirmed hypertensive and borderline hypertensive group. Finally, the continuous variables
were compared using univariate analysis of covariance (ANCOVA), which allowed adjustment
for the influence of potential confounders such as age and sex. This was necessary because age
and sex are known cardiovascular risk factors. A significance level of 0.05 was adopted for all
the above analyses.
This was a retrospective analysis of a large database. It was not a prospective study so did not
require a power calculation. The maximum number of patients that fulfilled the study criteria
were pulled from the database for analysis.

-76-
3.3 Results and Brief Discussion
3.3.1 Group Characteristics and Cardiovascular Risk Factors of Each Blood Pressure
Group
Group blood pressures and participant characteristics are presented in Table 11. An independent-
sample T Test was performed on the patient demographics and blood pressures (Table 11). These
analyses confirmed that, compared to the borderline group the confirmed hypertensive group
exhibited significantly higher mean clinic SBP in the right arm, mean clinic DBP in the right
arm, mean clinic SBP in the left arm, mean clinic DBP in the left arm, ABPM daytime SBP,
ABPM daytime DBP, ABPM nighttime SBP, ABPM nighttime DBP and age. However, the
groups did not differ in terms of height, weight or BMI (Table 11).
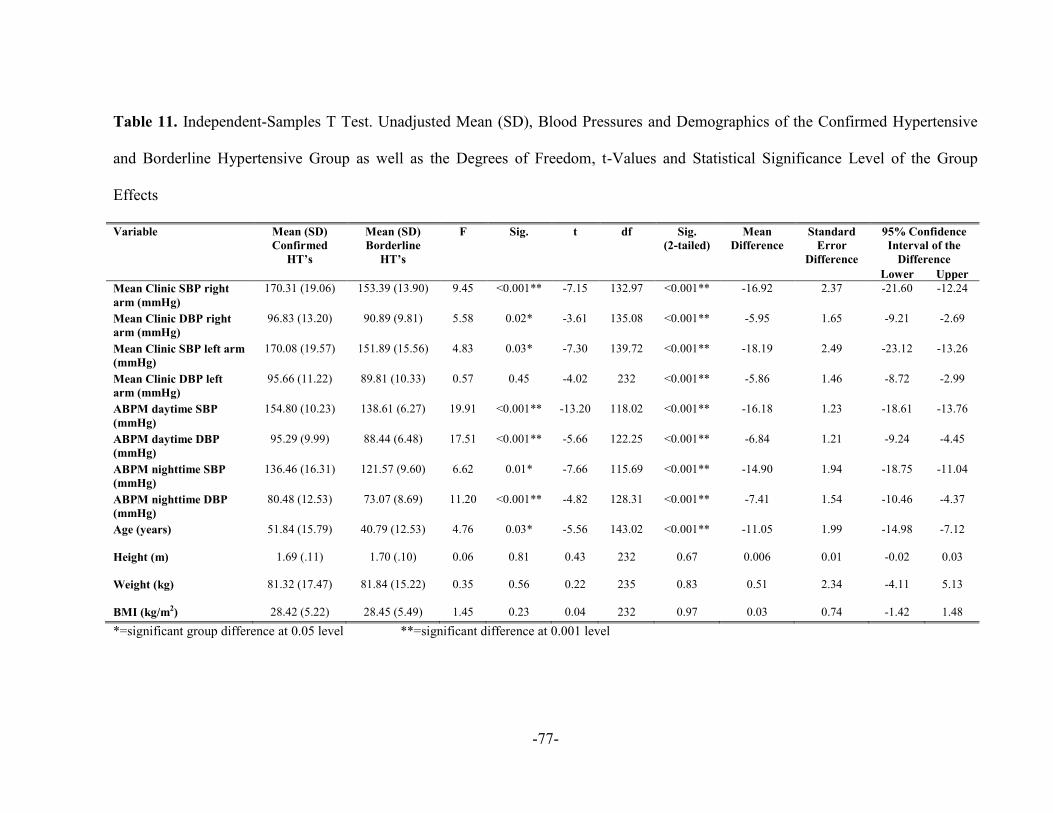
-77-
Table 11. Independent-Samples T Test. Unadjusted Mean (SD), Blood Pressures and Demographics of the Confirmed Hypertensive
and Borderline Hypertensive Group as well as the Degrees of Freedom, t-Values and Statistical Significance Level of the Group
Effects
Variable Mean (SD)
Confirmed
HT’s
Mean (SD)
Borderline
HT’s
F Sig. t
df Sig.
(2-tailed)
Mean
Difference
Standard
Error
Difference
95% Confidence
Interval of the
Difference
Lower Upper
Mean Clinic SBP right
arm (mmHg)
170.31 (19.06) 153.39 (13.90) 9.45 <0.001** -7.15 132.97 <0.001** -16.92 2.37 -21.60 -12.24
Mean Clinic DBP right
arm (mmHg)
96.83 (13.20) 90.89 (9.81) 5.58 0.02* -3.61 135.08 <0.001** -5.95 1.65 -9.21 -2.69
Mean Clinic SBP left arm
(mmHg)
170.08 (19.57) 151.89 (15.56) 4.83 0.03* -7.30 139.72 <0.001** -18.19 2.49 -23.12 -13.26
Mean Clinic DBP left
arm (mmHg)
95.66 (11.22) 89.81 (10.33) 0.57 0.45 -4.02 232 <0.001** -5.86 1.46 -8.72 -2.99
ABPM daytime SBP
(mmHg)
154.80 (10.23) 138.61 (6.27) 19.91 <0.001** -13.20 118.02 <0.001** -16.18 1.23 -18.61 -13.76
ABPM daytime DBP
(mmHg)
95.29 (9.99) 88.44 (6.48) 17.51 <0.001** -5.66 122.25 <0.001** -6.84 1.21 -9.24 -4.45
ABPM nighttime SBP
(mmHg)
136.46 (16.31) 121.57 (9.60) 6.62 0.01* -7.66 115.69 <0.001** -14.90 1.94 -18.75 -11.04
ABPM nighttime DBP
(mmHg)
80.48 (12.53) 73.07 (8.69) 11.20 <0.001** -4.82 128.31 <0.001** -7.41 1.54 -10.46 -4.37
Age (years)
51.84 (15.79) 40.79 (12.53) 4.76 0.03* -5.56 143.02 <0.001** -11.05 1.99 -14.98 -7.12
Height (m)
1.69 (.11) 1.70 (.10) 0.06 0.81 0.43 232 0.67 0.006 0.01 -0.02 0.03
Weight (kg)
81.32 (17.47) 81.84 (15.22) 0.35 0.56 0.22 235 0.83 0.51 2.34 -4.11 5.13
BMI (kg/m2) 28.42 (5.22) 28.45 (5.49) 1.45 0.23 0.04 232 0.97 0.03 0.74 -1.42 1.48
*=significant group difference at 0.05 level **=significant difference at 0.001 level

-78-
ANCOVA demonstrated that all blood pressures (mean clinic SBP in the right arm, mean clinic
DBP in the right arm, mean clinic SBP in the left arm, mean clinic DBP in the left arm, ABPM
daytime SBP, ABPM daytime DBP, ABPM nighttime SBP and ABPM nighttime DBP) remained
significantly higher in the confirmed hypertensive group even after accounting for age and sex, F
(1) = 36.39, p = <0.001, F (1) = 18.24, p = <0.001, F (1) = 37.77, p = <0.001, F (1) = 17.82, p =
<0.001, F (1) = 180.49, p = <0.001, F (1) = 52.74, p = <0.001, F (1) = 64.90, p = <0.001 and F
(1) = 30.04, p = <0.001 respectively.
Similarly, height, weight and BMI remained insignificantly different between groups once age
and sex were accounted for, F (1) = 0.95, p = 0.33, F (1) = 0.01, p = 0.93 and F (1) = 0.04, p =
0.84 respectively.
Patient cardiovascular risk factors are presented in Table 12. The confirmed hypertensive group
had more male patients (46% vs 42%, p<0.03). Most patients had a positive family history of
hypertension (65% of the hypertensive group vs 69% of the borderline group), about a quarter of
both groups were smokers/ex-smokers (24% vs 26%), over a third had self reported excess salt in
their diet (39% vs 44%), over 50% in each group did less than the recommended amount of
exercise each week and over 15% of each group drank in excess of the recommended weekly
allowance of alcohol. Finally, over a quarter of patients in each group had a profile compatible
with the metabolic syndrome. There were statistically significant differences between the two
groups: the borderline group was more likely to have a family history of hypertension, smoke,
take excess salt, drink over the recommended limit and were less likely to have features
consistent with the metabolic syndrome. It was not clear why the two groups had different risk

-79-
factors. Some of the differences might suggest that the borderline patients were less aware of
modifiable risks and lifestyle interventions, possibly because their diagnosis was more recent.
Clinically, however, both groups presented with a similar profile of modifiable and non-
modifiable risk factors.
Table 12. Number of Males and Females and Number and Percentage of Cardiovascular Risk
Factors in the Confirmed and Borderline Hypertensive Groups as well as Degrees of Freedom,
Chi-Square and Statistical Significance Levels of the Group Effects
n=83
Confirmed
Hypertensives
n=154
Borderline
Hypertensives
df
χ2
p
Number of
particpants
% Number of
particpants
%
Sex Male
Female
38
45
44
54
65
89
42
58
1 4.56 0.03*
Family History of HT Yes
No
55
30
65 106
47
69 1 29.65 <0.001**
Smoker/Ex smoker<5 years Yes
No
20
64
24 40
114
26 1 294.13 <0.001**
Excess Salt Yes
No
33
51
39 67
87
44 1 6.07 0.01*
Exercise <5x30mins/week Yes
No
47
37
56 87
67
57 1 3.78 0.05
Drink > recommended
weekly allowance of alcohol
Yes
No
14
69
17 29
125
19 1 96.21 <0.001**
Features consistent with the
metabolic syndrome
Yes
No
25
60
29 38
116
25 1 53.43 <0.001**
*=significant group difference at 0.05 level **=significant difference at 0.001 level
Patient biochemical values are presented in Table 13. An independent-sample T Test was
performed on electrolyte values (Appendix A). These analyses confirmed that, compared to the
borderline group the confirmed hypertensive group exhibited significantly higher urea and blood
glucose. These differences were not clinically significant.

-80-
Table 13. Unadjusted Mean (SD), Biochemical Values of the Confirmed Hypertensive and
Borderline Hypertensive Group as well as Degrees of Freedom, t Values and Statistical
Significance Levels of the Groups Effects
Electrolyte Confirmed
Hypertensives
Borderline
Hypertensives
df t p
Sodium 141.24 (2.53) 140.40 (5.38) 231 -1.33 0.18
Potassium 4.24 (0.35) 4.20 (0.34) 231 -0.99 0.32
Urea 5.25 (1.23) 4.70 (0.96) 140.84 -3.51 <0.001**
Creatinine 94.13 (13.63) 93.15 (15.13) 231 -0.49 0.63
Total Cholesterol 5.19 (1.06) 5.20 (1.00) 234 0.11 0.91
HDL Cholesterol 1.55 (0.51) 1.53 (0.45) 224 -0.34 0.73
Triglycerides 1.69 (0.96) 1.52 (1.13) 231 -1.15 0.25
GGT 34.78 (26.89) 37.67 (41.01) 228 0.58 0.57
Calcium 2.31 (0.10) 2.32 (0.10) 229 0.07 0.95
Glucose 5.44 (1.28) 5.07 (0.89) 126.16 -2.35 0.02*
Urate 322.68 (81.54) 324.80 (92.79) 227 0.17 0.86
*=significant group difference at 0.05 level **=significant difference at 0.001 level
ANCOVA demonstrated that urea remained significantly higher in the confirmed hypertensive
group even after accounting for age and sex, F (1) = 4.46, p = 0.04 but this is of no clinical
significance. However, the small difference in blood glucose was no longer significantly different
between groups once age and sex were accounted for, F (1) = 1.88, p = 0.17. Interestingly, once
age and sex were accounted for a group difference became apparent for total cholesterol, F (1) =
4.37, p = 0.04, with total cholesterol being significantly higher in the confirmed hypertensive
group. However, this difference was not clinically significant.
Group AASI, 10 year coronary risk and 10 year CVD risk are presented in Table 14. An
independent-sample T Test was performed on AASI, 10 year coronary risk and 10 year CVD risk
(Appendix B). These analyses confirmed that, compared to the borderline group the confirmed

-81-
hypertensive group exhibited significantly higher AASI, significantly higher 10 year coronary
risk, and significantly higher 10 year CVD risk.
Table 14. Unadjusted Mean (SD), AASI, 10 Year Coronary Risk and 10 Year CVD Risk for the
Confirmed Hypertensive and Borderline Hypertensive Group as well as Degrees of Freedom, t
Values and Statistical Significance Level of the Group Effects
Confirmed
Hypertensives
Borderline
Hypertensives
df t p
AASI 0.39 (0.16) 0.31 (0.16) 214 -3.85 <0.001**
10 Year Coronary Risk 9.35 (8.14) 5.4 (6.21) 222 -4.04 <0.001**
10 Year CVD Risk 17.8 (13.15) 9.38 (10.19) 134.91 -5.01 <0.001**
*=significant group difference at 0.05 level **=significant difference at 0.001 level
ANCOVA demonstrated that the group difference for AASI remained significant even after
accounting for age and sex, F (1) = 5.41, p = 0.02. However, 10 year coronary and
Cardiovascular risk were no longer significantly different between groups once age and sex were
accounted for, F (1) = 0.09, p = 0.76 and F (1) = 1.07, p = 0.30 respectively.

-82-
3.3.2 Brief Discussion
The confirmed hypertensives were significantly older and were more likely to have features
consistent with the metabolic syndrome and stiffer arteries (as measured by AASI) than the
borderline hypertensives. However, the borderline hypertensives had similar height, weight, BMI,
amount of exercise, biochemical profile and 10 year coronary and CVD risk (once age and sex
were accounted for) as the confirmed hypertensives. Both groups had a clinically similar pattern
of smoking, excess salt and higher than recommended amounts of alcohol and had a positive
family history of hypertension in over 60% of cases. It is therefore apparent that all of these
patients, including the borderline group, require intensive lifestyle advice at the very least.
Metabolic syndrome and arterial stiffness are less standard cardiovascular risk factors but are
important to take into consideration when assessing cardiovascular risk since individuals with
metabolic syndrome are 1.69 times more likely to develop CVD than those without, and arterial
stiffness is important for assessing cardiovascular risk as well as for predicting cardiovascular
outcomes.54;64
One quarter of the borderline group had features consistent with the metabolic
syndrome, which again suggests that these individuals should have aggressive lifestyle
intervention. Although the AASI was significantly higher in the confirmed hypertensive group
the values were still within the normal range possibly because the mean age in this group was
fairly young.

-83-
CHAPTER 4: OVERALL DISCUSSION AND CONCLUSIONS
4.1 Overall Discussion
4.1.1 Summary of Main Findings
Study One examined vibratory, cooling, warming and heat-pain thresholds in the right hand and
foot of a group of newly diagnosed unmedicated essential hypertensives (BP ≥140/90 mmHg) as
well as a group of normotensive controls, who were free from pre-existing peripheral neuropathy
and associated symptoms. Study Two compared cardiovascular risk factors in a larger group of
confirmed and borderline hypertensive patients selected from our Hypertension Database.
The major findings from Study One were as follows. 1) The hypertensive group had significantly
higher vibration thresholds in the foot than the normotensive group, even after accounting for
age, sex and BMI. 2) There was a significant positive correlation between SBP and DBP with
vibration threshold in the foot. 3) There was a significant negative correlation between systolic
and diastolic blood pressure with both cooling and warming thresholds in the hand.
The major finding from Study Two was that the borderline hypertensives had similar modifiable
cardiovascular risk factors as the confirmed hypertensives, suggesting that lifestyle intervention
is appropriate for reducing blood pressure and improving health in all grades of hypertension.

-84-
4.1.2 Detailed Discussion of Main Findings
4.1.2.1 Study One
Vibration threshold in the foot was significantly higher in the hypertensive group when compared
to the normotensive group even after accounting for age, sex and BMI and there was a significant
positive correlation between both systolic and diastolic BP and vibration threshold in the foot,
supporting some existing evidence for peripheral neuropathy in hypertension.65-70
Conversely, there was a significant negative correlation between systolic and diastolic BP and
both cooling and warming thresholds in the hand. These unexpected contradictory findings
oppose our hypothesis and some previous research but support other counter evidence suggesting
that hypertension is in fact protective against peripheral neuropathy.123;124
The reasons for a
possible negative association between hypertension and peripheral neuropathy remain
unexplained.123
These significant negative correlations should be interpreted with some caution
since we cannot exclude the possibility that confounding variables such as age, sex and BMI may
be playing a part. It may be that when age, sex and BMI are accounted for using hierarchical
linear regression analysis that the significance diminishes.
The findings of significantly higher vibration thresholds in the foot of the hypertensive group and
a significant positive correlation between both systolic and diastolic BP and vibration threshold in
the foot supports some existing evidence for peripheral neuropathy in hypertension using a novel
form of stimulation (QST). These findings suggests that peripheral nerve fibres, specifically large
-85-
myelinated A fibres that conduct vibration sensation, may be preferentially affected in
hypertensives, particularly in their feet.
Myelin degeneration might explain why vibration sensation (myelinated A fibres) rather than
cooling (thinly myelinated Aδ fibres), warming or heat-pain (unmyelinated C fibres) sensations
were preferentially affected. However, nerve conduction studies and/or nerve biopsies would
have to be performed to confirm this. Still, if found to be true, this would support findings of
Viskoper et al., 1971 who found a reduction in motor nerve conduction velocities in the upper
extremities in hypertensives compared to normotensives as well as an inverse relationship
between nerve conduction velocity and DBP.112
This theory is also supported, albeit indirectly,
by the finding that in patients with vasculitic neuropathy, myelinated fibres are more vulnerable
to ischaemia than unmyelinated fibres and large myelinated axons are affected before smaller
ones.125
In contrast, Edwards et al., 2008 found that although cutaneous sensory thresholds were
~30% higher and sensory action potentials were ~20% lower in hypertensives than
normotensives, sensory nerve conduction velocity did not differ between groups suggesting that
hypertension may cause axonal rather than demyelinating neuropathy.70
Also in contrast, in most
neuropathies, including the most common type of diabetic neuropathy [Distal Symmetrical
Sensory Polyneuropathy (DSSP)], it is the small nerve fibres (myelinated and unmyelinated) that
detect temperature that are affected first followed by the large nerve fibres (myelinated) that
detect vibration.126;127
Having said this, DSSP can be categorised into sub-types: small-fibre type,
large-fibre type and mixed. The mixed sub-type is the most common but the small-fibre and

-86-
large-fibre types can occur independently. Large-fibre DSSP was often seen in the past when
there was no treatment for diabetes, but is less common today.127
The mechanisms underlying a possible hypertension-related axonal or demyelinating neuropathy
are not known.65-70;107
Evidence suggests that the pathological process may be similar to that in
diabetic neuropathy, whereby metabolic and vascular disturbances lead to structural and
functional changes in blood vessels supplying peripheral nerves, resulting in ischaemia and
hypoxia, which induces oxidative stress and injury to peripheral nerves possibly via an increase
in production of reactive oxygen species (ROS).87-91;101-103
Reactive oxygen species can damage the lipids, proteins, nucleic acids and mitochondria of cells,
potentially causing cell death.128
Oligodendrocytes (brain cells that produce myelin) are more
sensitive to oxidative stress in vitro than astrocytes and microglia, possibly due to their reduced
glutathione (antioxidant) content, their higher iron content and their higher dependency on
oxidative phosphorylation.128
Oxidative stress might therefore result in vivo in selective
oligodendrocyte death and consequent demyelination. The ROS may also damage the myelin
sheath, promoting its attack by macrophages.128
Schwann cells are the peripheral nervous system
equivalent of oligodendrocytes, thus it seems reasonable to assume that Schwann cells may be
similarly affected when under oxidative stress i.e. in preference to other nerve cells. In fact, Iida
et al., 2004 found that Schwann cells are a specific target of oxidative injury and that there is
some susceptibility of Schwann cells to even mild degrees of ischaemia.129
Furthermore,
ischaemia can affect Schwann cells when not intense enough to cause axonal degeneration and
chronic ischaemia is known to induce demyelination in addition to axonal loss.130-133
This would

-87-
perhaps go some way to explaining why loss of vibration sensation (myelinated A fibres)
preceded loss of warming and heat-pain (small unmyelinated C-fibres) in the present study.
However, at this stage this theory is somewhat fabricated and is based on rather scanty evidence.
If the findings of the present study were replicated and causality was proven, laboratory studies
would then be necessary in order to investigate the pathological mechanisms involved.
The group difference for vibration threshold was significant in the foot (p =0.01) but not quite in
the hand (p =0.05). This may be due to the fact that the hands are generally more sensitive than
the feet because of their larger distribution on the homunculus. Consequently, the hands may be
more effective than the feet at discriminating between vibration and non-vibration stimuli leading
to a less significant difference between groups. Another, more simplistic explanation is that
circulation is often better in the hands than the feet. Therefore, if poor blood supply to peripheral
nerves does indeed contribute towards peripheral neuropathy, then the feet would be more
noticeably affected. In addition, peripheral neuropathy usually occurs in a length dependent
fashion i.e. the longest nerves (to the feet) are affected first.126
In fact, vibration threshold
increases with age and is often first lost in the feet.134
Only vibration threshold in the foot demonstrated a significant group difference once age, sex and
BMI were accounted for. However, it is useful to note the trend between groups of all other
sensory thresholds, despite them not reaching significance. Vibration threshold in the hand,
warming threshold in the foot, heat-pain 5.0 in the hand and foot and heat-pain 0.5 in the hand
and foot were higher in the hypertensive group after accounting for age, sex and BMI.
-88-
Conversely, cooling threshold in the hand and foot and warming threshold in the foot were lower
in the hypertensive group after accounting for age, sex and BMI.
Heat-pain and warming are both conducted by the same nerve fibres (unmyelinated C-fibres).
Therefore, one might expect warming thresholds to also be higher in the hypertensive group.
However, this was only true for warming threshold in the foot. These discrepancies between
sensory thresholds introduce the prospect that hypertension may affect different peripheral nerve
fibres differently; a possibility that warrants further investigation but that could be particularly
true for heat-pain since there is evidence that hypertension-associated hypoalgesia may be caused
by a central rather than peripheral mechanism, which may explain the inverse group difference
for heat-pain and warming hand. However, in the present study it is more than likely that these
discrepancies are due to the small sample size and that with a larger sample the results may have
been more consistent and significant. In such a small sample the opposing results for cooling
threshold in the hand and foot and warming threshold in the hand might reflect the large variation
in heat sensitivity among individuals, which QST is not very effective at accounting for.116
Similarly, the insignificant group difference for heat-pain thresholds might reflect the subjectivity
of the heat-pain methodology and the large variation in pain thresholds among individuals.
Hence, QST may not be the best methodology for detecting group differences in thermal and
heat-pain thresholds.
The findings of this small preliminary study indicate that newly diagnosed unmedicated essential
hypertensives may have subclinical peripheral neuropathy in the form of reduced sensibility to
vibration in their feet. However, this finding was not consistent across other sensory modalities or

-89-
in the upper limb. Due to the small sample and many other limitations of this study further
studies with much larger sample sizes are needed in order to prove causality across all grades of
hypertension and to look into the pathogenesis.
4.2.1.2 Study Two
Findings from the retrospective database analysis of cardiovascular risk demonstrated that
unmedicated borderline hypertensives with no other medical conditions had similar
cardiovascular risk factors and profiles as their confirmed hypertensive counterparts, suggesting
that borderline hypertensives necessitate lifestyle advice at the very least. Most patients had a
positive family history of hypertension (65% of the hypertensive group vs 69% of the borderline
group), about a quarter of both groups were smokers/ex-smokers (24% vs 26%), over a third had
self reported excess salt in their diet (39% vs 44%), over 50% in each group did less than the
recommended amount of exercise each week and over 15% of each group drank in excess of the
recommended weekly allowance of alcohol. Finally, over a quarter of patients in each group had
a profile compatible with the metabolic syndrome, which would improve with lifestyle
intervention. In conclusion, both groups had a similar pattern of modifiable risk factors
suggesting that intensive lifestyle intervention is appropriate and necessary in all hypertensives
even if medication is not indicated immediately.
The two studies were done separately and the small numbers, particularly in Study One make it
difficult to link the findings. Nonetheless, the borderline hypertensives had similar cardiovascular
risk profiles and risk factors to the confirmed hypertensives (Study Two) and there was some
evidence of vascular damage in the form of subclinical peripheral neuropathy (Study One) in the
-90-
newly diagnosed unmedicated essential hypertensives, many of whom (n=14) had a mean blood
pressure in the borderline range (140-159/90-99 mmHg). Taken together, this may suggest that
earlier initiation of antihypertensive medications in borderline patients with low cardiovascular
risk might be appropriate, especially if these patients are showing signs of early vascular damage
in the form of subclinical peripheral neuropathy (a potential surrogate of TOD). However, due to
the small sample size of this preliminary study, it is not possible to determine whether subclinical
peripheral neuropathy was present across all grades of hypertension. Much larger studies would
be needed to establish this.
4.1.3 Study One-Limitations
With regard to peripheral neuropathy in hypertension, the results (at least for vibration sensation
in the feet), agree with a small number of previous studies. However, there are some limitations
that should be considered. These limitations may be contributing to the lack of statistical
significance between groups and the opposing findings for cooling thresholds in the hand and
foot and warming thresholds in the hand.
The main limitation of this study was the small sample size, which reduced the power to detect
differences in thresholds between the two groups. ANCOVA was only powered to detect a large
effect size and for all sensory thresholds the effect size was either small or medium.
Consequently, the results can only be regarded as preliminary. Furthermore, the hypertensive and
normotensive groups were not matched for confounding variables such as age, sex, weight or
BMI. The mean age of the hypertensive and normotensive groups were 36 years and 32 years
respectively. There were more men in the hypertensive group than women (12, 8) and more

-91-
women in the normotensive group than men (16, 9), the mean weight of the hypertensive and
normotensive groups were 69kg and 67kg respectively and the mean BMI of the hypertensive
and normotensive groups were 29kg/m2 and 23.5 kg/m
2 respectively. Although differences in
age, sex and BMI were accounted for in the analyses and group differences for age and sex were
not significant, statistical adjustment may not fully address the potential confounding effects of
these variables in this study, thus it is always preferable to match study groups for confounding
variables when possible.135
Patients had varying durations of hypertension, which may be having an effect on presence or
severity of neuropathy. Diabetic sensory neuropathy has been found to be independently
associated with duration of hypertension.78
Conversely, hypoalgesia is evident even after acute
increases in blood pressure in spontaneously hypertensive rats.107
Over half (65%) of the hypertensive patients had a cardiovascular risk profile compatible with
metabolic syndrome i.e. BMI >30 kg/m2 plus raised triglycerides, reduced HDL cholesterol
and/or raised fasting plasma glucose. It is therefore difficult to ascertain, which risk factor(s) (if
any) contributed to the sensory loss observed in the hypertensive group.
Many factors influence sensory detection thresholds. As well as sex, age and body location and
possibly blood pressure, variability of threshold may be explained by differences in thickness of
tissue overlying receptor, skin temperature, spacial distribution of receptors or impulse
transmission, none of which were accounted for in the current study.117
Central processing can
also influence sensory detection threshold. Quantitative sensory testing cannot distinguish
-92-
between peripheral nerve damage and central nervous system (CNS) damage therefore this is
another limitation. However, participants were not selected to take part if they had any condition
predisposing to peripheral neuropathy, including CNS damage. Another limitation of QST is that
it is not very effective at accounting for large variations in heat and pain sensitivity among
individuals and although it can detect changes in sensory thresholds it does not provide any clues
to the reasons for these changes such as axonal loss/demyelination. Sensory action potential
amplitudes and sensory nerve conduction velocities would provide this additional information.
Finally, although Spearman‟s correlation showed significant differences, this statistical test is not
as accurate hierarchical linear regression analysis, which can account for confounding variables.
Overall, concrete conclusions regarding hypertension and peripheral neuropathy cannot be drawn
from this study. Further studies are needed in order to expand on these exciting but preliminary
findings.

-93-
4.1.4 Study One-Recommendations for Future Research
In light of these limitations, future studies would recruit more participants in order to achieve
more significant results. Hypertensives would be categorised into those with Grade 1 (borderline)
hypertension and those with Grade 2 hypertension, in order to see whether subclinical peripheral
neuropathy is present across all grades of hypertension. The hypertensive and normotensive
groups would be matched for age, sex, weight and BMI. If future research finds more established
differences between hypertensives and normotensives, subsequent research might involve
investigating mechanisms underlying these differences, using skin biopsies. Further studies might
follow-up the hypertensive group, after the initiation of antihypertensive medication in any
confirmed hypertensives (BP ≥160/100 mmHg), to see whether antihypertensive medications
delay or prevent the onset of subclinical peripheral neuropathy or indeed prevent or delay its
progression. Further studies might also follow up any borderline hypertensives (SBP 140-159
and/or DBP 90-99 mmHg) to observe whether peripheral neuropathy worsens as their blood
pressure rises. The management of hypertension might then be tailored to prevent or treat
subclinical peripheral neuropathy as well as hypertension. In addition, future findings may be
used to validate the use of antihypertensive drugs to prevent or treat other forms of neuropathy
including diabetic neuropathy. Future studies should include metabolic syndrome in the exclusion
criteria and carry out ambulatory blood pressure measurements on all participants, as well as
sensory nerve conduction velocities and sensory action potentials to investigate the type of
peripheral nerve damage e.g. demyelination and/or axonal damage. Future studies should also
endeavor to adequately control for variations in skin temperature and perform hierarchical linear
regression analyses in addition to Spearman‟s correlation in order to account for confounding
variables.

-94-
4.1.5 Study Two-Limitations and Recommended Future Directions
The main limitations of this study were the unbalanced numbers of patients in the confirmed and
borderline group and the fact that outcome data was not available from the database. Future
research might therefore follow-up all confirmed hypertensive and borderline hypertensive
patients to investigate outcomes, in terms of blood pressure and cardiovascular events, using
medical notes.
-95-
4.2 Conclusions
The results of Study One demonstrated some evidence of subclinical peripheral neuropathy, in
the form of reduced vibration sensation in the feet of patients with newly diagnosed unmedicated
essential hypertension. However, due to the small sample size it was not possible to determine
whether this finding was true across all grades of hypertension. Interrogation of the Hypertension
Database revealed that unmedicated borderline hypertensives have similar cardiovascular risk
profiles and similar modifiable cardiovascular risk factors to their confirmed hypertensive
counterparts, suggesting that borderline patients necessitate intensive lifestyle advice at the very
least.
If the preliminary findings of Study One were replicated across all grades of hypertension in a
much larger sample, this, in conjunction with the findings of Study Two may indicate the need
for antihypertensive medications in borderline hypertensives, at otherwise low cardiovascular
risk, who currently only receive lifestyle advice.
If we assume the hypertensive patients from Study One had subclinical peripheral neuropathy,
this might be due to metabolic syndrome, differences in age, sex, weight and/or BMI rather than
BP alone. As a result of this and because of the many limitations in this preliminary study much
further research is needed to expand on these promising early findings, prove their significance
across all grades of hypertension, and determine underlying mechanisms before any definitive
conclusions are reached, which may then ultimately be applied to clinical medicine.

-I-
APPENDICES
Appendix A. Independent-Samples T Test. Unadjusted Mean (SD), Electrolyte Values of the Confirmed Hypertensive and
Borderline Hypertensive Group as well as the Degrees of Freedom, t-Values and Statistical Significance Level of the Group Effects
Variable Mean (SD)
Confirmed
HT’s
Mean (SD)
Borderline
HT’s
F Sig. t
df Sig.
(2-tailed)
Mean
Difference
Standard
Error
Difference
95% Confidence
Interval of the
Difference
Lower Upper
Sodium 141.24 (2.53) 140.40 (5.38) 0.04 0.84 -1.33 231 0.18 -0.83 0.62 -2.06 0.40
Potassium 4.24 (.35) 4.20 (.34) 0.08 0.78 -0.99 231 0.32 -0.05 0.05 -0.14 0.05
Urea 5.25 (1.23) 4.70 (.96) 4.73 0.03* -3.51 140.84 <0.001** -0.54 0.16 -0.85 -0.24
Creatinine 94.13 (13.63) 93.15 (15.13) 1.38 0.24 -0.49 231 0.63 -0.98 2.0 -4.92 2.96
Total Cholesterol 5.19 (1.06) 5.20 (1.00) 0.12 0.12 0.11 234 0.91 0.02 0.14 -0.26 0.29
HDL Cholesterol 1.55 (.51) 1.53 (.45) 1.0 0.99 -0.34 224 0.73 -0.02 0.07 -0.15 0.11
Triglycerides 1.69 (.96) 1.52 (1.13) 0.03 0.03* -1.15 231 0.25 -0.17 0.15 -0.46 0.12
GGT 34.78 (26.89) 37.67 (41.01) 2.25 2.25 0.58 228 0.57 2.89 5.02 -7.00 12.78
Calcium 2.31 (.10) 2.32 (.10) 0.44 0.44 0.07 229 0.95 0.00 0.01 -0.03 0.03
Glucose 5.44 (1.28) 5.07 (.89) 5.47 5.47 -2.35 126.16 0.02* -0.37 0.16 -0.68 -0.06
Urate 322.68 (81.54) 324.80 (92.79) 2.25 2.25 0.17 227 0.86 2.12 12.26 -22.04 26.28
*=significant group difference at 0.05 level **=significant difference at 0.001 level
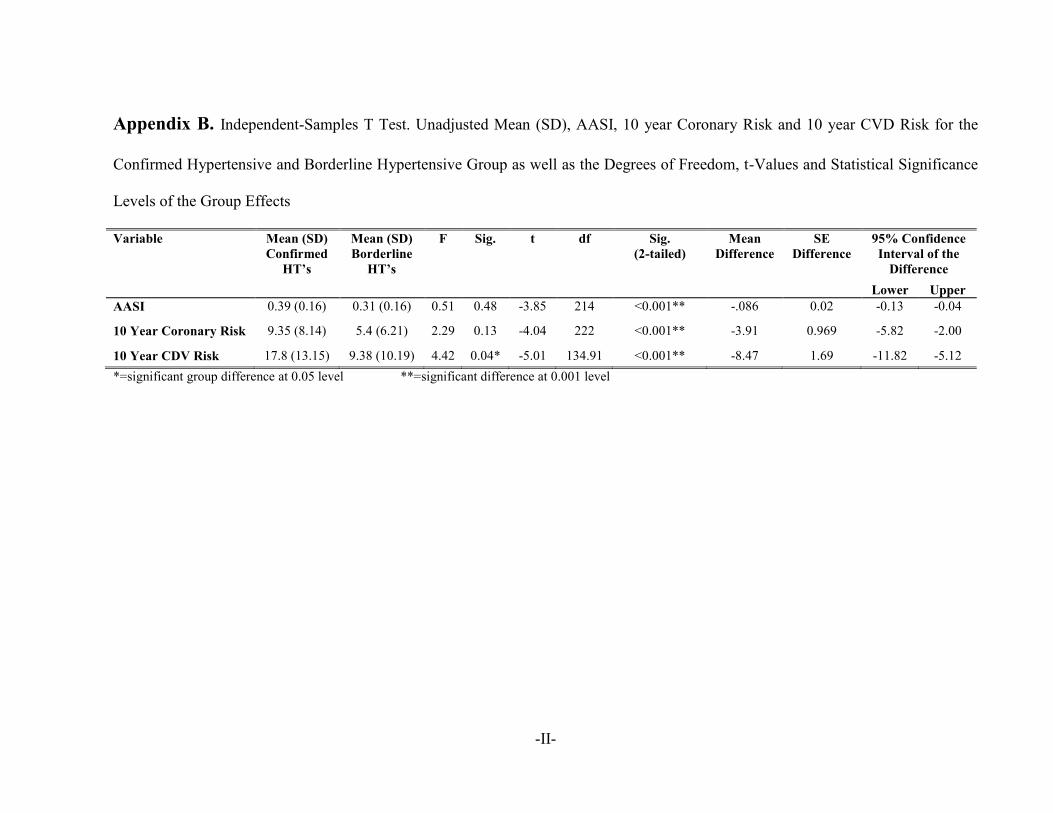
-II-
Appendix B. Independent-Samples T Test. Unadjusted Mean (SD), AASI, 10 year Coronary Risk and 10 year CVD Risk for the
Confirmed Hypertensive and Borderline Hypertensive Group as well as the Degrees of Freedom, t-Values and Statistical Significance
Levels of the Group Effects
Variable Mean (SD)
Confirmed
HT’s
Mean (SD)
Borderline
HT’s
F Sig. t
df Sig.
(2-tailed)
Mean
Difference
SE
Difference
95% Confidence
Interval of the
Difference
Lower Upper
AASI 0.39 (0.16) 0.31 (0.16) 0.51 0.48 -3.85 214 <0.001** -.086 0.02 -0.13 -0.04
10 Year Coronary Risk 9.35 (8.14) 5.4 (6.21) 2.29 0.13 -4.04 222 <0.001** -3.91 0.969 -5.82 -2.00
10 Year CDV Risk 17.8 (13.15) 9.38 (10.19) 4.42 0.04* -5.01 134.91 <0.001** -8.47 1.69 -11.82 -5.12
*=significant group difference at 0.05 level **=significant difference at 0.001 level

-III -
Appendix C. Presentations, Posters and Abstracts Arising From This Thesis
Presentations
Branch RL. Peripheral Neuropathy In Hypertension. Clinical Pharmacology Colloquium. 14th
Nov 2009
Posters
Branch RL. Evidence of Peripheral Neuropathy in Unmedicated Hypertensives. British
Pharmacological Society Winter Meeting. 2009
Abstracts
Branch R, Ali S, Ring C, Winer J, Martin U. Evidence of Peripheral Neuropathy in Unmedicated
Hypertensives. Br J Clin Pharmacol. 2010; 70(2): 293

-IV -
LIST OF REFERENCES
(1) 2003 European Society of Hypertension-European Society of Cardiology guidelines for
the management of arterial hypertension. J Hypertens 2003;21(6):1011-53.
(2) Chobanian AV, Bakris GL, Black HR, Cushman WC, Green LA, Izzo JL, Jr., et al.
Seventh report of the Joint National Committee on Prevention, Detection, Evaluation,
and Treatment of High Blood Pressure. Hypertension 2003;42(6):1206-52.
(3) Williams B, Poulter NR, Brown MJ, Davis M, McInnes GT, Potter JF, et al. Guidelines
for management of hypertension: report of the fourth working party of the British
Hypertension Society, 2004-BHS IV. J Hum Hypertens 2004;18(3):139-85.
(4) American Heart Association. High Blood Pressure Statistics 2007.
http://www americanheart org/presenter jhtml?identifier=4621 (accessed 10th
September
2010)
(5) Craig RaMJ. Health Survey for England-Latest Trends, 2006.
http://www ic nhs uk/pubs/hse06trends (accessed 10th
September 2010)
(6) Whitworth JA. World Health Organisation/International Society of Hypertension
Writing Group. 2003 World Health Organisation (WHO)/International Society of
Hypertension (ISH) statement on management of hypertension. J Hypertens
2003;21(11):1983-92.
(7) National Statistics. Leading causes of death in England and Wales-how should we
group causes? 2005. http://www statistics gov uk/CCI/article
asp?ID=1301&Pos=2&ColRank=2&Rank=224 (accessed 10th
September 2010)
(8) National Statistics. Circulatory diseases-leading cause group, 2006. http://www
statistics gov uk/CCI/nugget asp?ID=1337&Pos=&ColRank=2&Rank=896 (accessed
10th
September 2010)
(9) World Health Organization, Regional Office for the Eastern Mediterranean. Clinical
guidelines for the management of hypertension. World Health Organization. Regional
Office for the Eastern Mediterranean. 2005
(10) Beevers G, Lip GY, O'Brien E. ABC of hypertension: The pathophysiology of
hypertension. BMJ 2001;322(7291):912-6.
(11) 1999 World Health Organization-International Society of Hypertension Guidelines for
the Management of Hypertension. Guidelines Subcommittee. J Hypertens
1999;17(2):151-83.

-V -
(12) Lewington S, Clarke R, Qizilbash N, Peto R, Collins R. Age-specific relevance of usual
blood pressure to vascular mortality: a meta-analysis of individual data for one million
adults in 61 prospective studies. Lancet 2002;360(9349):1903-13.
(13) Chobanian AV. Prehypertension revisited. Hypertension 2006;48(5):812-4.
(14) Third Report of the National Cholesterol Education Program (NCEP) Expert Panel on
Detection, Evaluation, and Treatment of High Blood Cholesterol in Adults (Adult
Treatment Panel III) final report. Circulation 2002;106(25):3143-421.
(15) Anderson KM, Wilson PW, Odell PM, Kannel WB. An updated coronary risk profile. A
statement for health professionals. Circulation 1991;83(1):356-62.
(16) Haq IU, Ramsay LE, Yeo WW, Jackson PR, Wallis EJ. Is the Framingham risk function
valid for northern European populations? A comparison of methods for estimating
absolute coronary risk in high risk men. Heart 1999;81(1):40-6.
(17) Mancia G, De BG, Dominiczak A, Cifkova R, Fagard R, Germano G, et al. 2007
Guidelines for the management of arterial hypertension: The Task Force for the
Management of Arterial Hypertension of the European Society of Hypertension (ESH)
and of the European Society of Cardiology (ESC). Eur Heart J 2007;28(12):1462-536.
(18) Wang Y, Wang QJ. The prevalence of prehypertension and hypertension among US
adults according to the new joint national committee guidelines: new challenges of the
old problem. Arch Intern Med 2004;164(19):2126-34.
(19) Greenlund KJ, Croft JB, Mensah GA. Prevalence of heart disease and stroke risk factors
in persons with prehypertension in the United States, 1999-2000. Arch Intern Med
2004;164(19):2113-8.
(20) Falkner B, Gidding SS, Portman R, Rosner B. Blood pressure variability and
classification of prehypertension and hypertension in adolescence. Pediatrics
2008;122(2):238-42.
(21) Lloyd-Jones D, Adams R, Carnethon M, De SG, Ferguson TB, Flegal K, et al. Heart
disease and stroke statistics--2009 update: a report from the American Heart
Association Statistics Committee and Stroke Statistics Subcommittee. Circulation
2009;119(3):480-6.
(22) Pimenta E, Oparil S. Prehypertension: epidemiology, consequences and treatment. Nat
Rev Nephrol 2010;6(1):21-30.

-VI -
(23) Vasan RS, Larson MG, Leip EP, Kannel WB, Levy D. Assessment of frequency of
progression to hypertension in non-hypertensive participants in the Framingham Heart
Study: a cohort study. Lancet 2001;358(9294):1682-6.
(24) Julius S, Nesbitt SD, Egan BM, Weber MA, Michelson EL, Kaciroti N, et al. Feasibility
of treating prehypertension with an angiotensin-receptor blocker. N Engl J Med
2006;354(16):1685-97.
(25) Hsia J, Margolis KL, Eaton CB, Wenger NK, Allison M, Wu L, et al. Prehypertension
and cardiovascular disease risk in the Women's Health Initiative. Circulation
2007;115(7):855-60.
(26) Mainous AG, III, Everett CJ, Liszka H, King DE, Egan BM. Prehypertension and
mortality in a nationally representative cohort. Am J Cardiol 2004;94(12):1496-500.
(27) Okosun IS, Boltri JM, Anochie LK, Chandra KM. Racial/ethnic differences in
prehypertension in American adults: population and relative attributable risks of
abdominal obesity. J Hum Hypertens 2004;18(12):849-55.
(28) Tsai PS, Ke TL, Huang CJ, Tsai JC, Chen PL, Wang SY, et al. Prevalence and
determinants of prehypertension status in the Taiwanese general population. J
Hypertens 2005;23(7):1355-60.
(29) Cordero A, Laclaustra M, Leon M, Grima A, Casasnovas JA, Luengo E, et al.
Prehypertension is associated with insulin resistance state and not with an initial renal
function impairment. A Metabolic Syndrome in Active Subjects in Spain (MESYAS)
Registry substudy. Am J Hypertens 2006;19(2):189-96.
(30) Zhang Y, Lee ET, Devereux RB, Yeh J, Best LG, Fabsitz RR, et al. Prehypertension,
diabetes, and cardiovascular disease risk in a population-based sample: the Strong Heart
Study. Hypertension 2006;47(3):410-4.
(31) Lee JE, Kim YG, Choi YH, Huh W, Kim DJ, Oh HY. Serum uric acid is associated
with microalbuminuria in prehypertension. Hypertension 2006;47(5):962-7.
(32) King DE, Egan BM, Mainous AG, III, Geesey ME. Elevation of C-reactive protein in
people with prehypertension. J Clin Hypertens 2004;6(10):562-8.
(33) Chrysohoou C, Pitsavos C, Panagiotakos DB, Skoumas J, Stefanadis C. Association
between prehypertension status and inflammatory markers related to atherosclerotic
disease: The ATTICA Study. Am J Hypertens 2004;17(7):568-73.
(34) Vasan RS, Larson MG, Leip EP, Evans JC, O'Donnell CJ, Kannel WB, et al. Impact of
high-normal blood pressure on the risk of cardiovascular disease. N Engl J Med
2001;345(18):1291-7.

-VII -
(35) Liszka HA, Mainous AG, III, King DE, Everett CJ, Egan BM. Prehypertension and
cardiovascular morbidity. Ann Fam Med 2005;3(4):294-9.
(36) Kshirsagar AV, Carpenter M, Bang H, Wyatt SB, Colindres RE. Blood pressure usually
considered normal is associated with an elevated risk of cardiovascular disease. Am J
Med 2006;119(2):133-41.
(37) Qureshi AI, Suri MF, Kirmani JF, Divani AA, Mohammad Y. Is prehypertension a risk
factor for cardiovascular diseases? Stroke 2005;36(9):1859-63.
(38) Appel LJ, Moore TJ, Obarzanek E, Vollmer WM, Svetkey LP, Sacks FM, et al. A
clinical trial of the effects of dietary patterns on blood pressure. DASH Collaborative
Research Group. N Engl J Med 1997;336(16):1117-24.
(39) Sacks FM, Svetkey LP, Vollmer WM, Appel LJ, Bray GA, Harsha D, et al. Effects on
blood pressure of reduced dietary sodium and the Dietary Approaches to Stop
Hypertension (DASH) diet. DASH-Sodium Collaborative Research Group. N Engl J
Med 2001;344(1):3-10.
(40) Appel LJ, Sacks FM, Carey VJ, Obarzanek E, Swain JF, Miller ER, III, et al. Effects of
protein, monounsaturated fat, and carbohydrate intake on blood pressure and serum
lipids: results of the OmniHeart randomized trial. JAMA 2005;294(19):2455-64.
(41) Appel LJ, Champagne CM, Harsha DW, Cooper LS, Obarzanek E, Elmer PJ, et al.
Effects of comprehensive lifestyle modification on blood pressure control: main results
of the PREMIER clinical trial. JAMA 2003;289(16):2083-93.
(42) Elmer PJ, Obarzanek E, Vollmer WM, Simons-Morton D, Stevens VJ, Young DR, et al.
Effects of comprehensive lifestyle modification on diet, weight, physical fitness, and
blood pressure control: 18-month results of a randomized trial. Ann Intern Med
2006;144(7):485-95.
(43) Whelton PK, He J, Appel LJ, Cutler JA, Havas S, Kotchen TA, et al. Primary
prevention of hypertension: clinical and public health advisory from The National High
Blood Pressure Education Program. JAMA 2002;288(15):1882-8.
(44) Kelley GA, Kelley KS. Progressive resistance exercise and resting blood pressure : A
meta-analysis of randomized controlled trials. Hypertension 2000;35(3):838-43.
(45) Whelton SP, Chin A, Xin X, He J. Effect of aerobic exercise on blood pressure: a meta-
analysis of randomized, controlled trials. Ann Intern Med 2002;136(7):493-503.
(46) Omvik P. How smoking affects blood pressure. Blood Press 1996;5(2):71-7.

-VIII -
(47) Primatesta P, Falaschetti E, Gupta S, Marmot MG, Poulter NR. Association between
smoking and blood pressure: evidence from the health survey for England.
Hypertension 2001;37(2):187-93.
(48) Svetkey LP. Management of prehypertension. Hypertension 2005;45(6):1056-61.
(49) Luders S, Schrader J, Berger J, Unger T, Zidek W, Bohm M, et al. The PHARAO study:
prevention of hypertension with the angiotensin-converting enzyme inhibitor ramipril in
patients with high-normal blood pressure: a prospective, randomized, controlled
prevention trial of the German Hypertension League. J Hypertens 2008;26(7):1487-96.
(50) Skov K, Eiskjaer H, Hansen HE, Madsen JK, Kvist S, Mulvany MJ. Treatment of
young subjects at high familial risk of future hypertension with an angiotensin-receptor
blocker. Hypertension 2007;50(1):89-95.
(51) Safar ME, Levy BI, Struijker-Boudier H. Current perspectives on arterial stiffness and
pulse pressure in hypertension and cardiovascular diseases. Circulation
2003;107(22):2864-9.
(52) Zieman SJ, Melenovsky V, Kass DA. Mechanisms, pathophysiology, and therapy of
arterial stiffness. Arterioscler Thromb Vasc Biol 2005;25(5):932-43.
(53) Chue CD, Townend JN, Steeds RP, Ferro CJ. Arterial stiffness in chronic kidney
disease: causes and consequences. Heart 2010;96(11):817-23.
(54) Laurent S, Cockcroft J, Van BL, Boutouyrie P, Giannattasio C, Hayoz D, et al. Expert
consensus document on arterial stiffness: methodological issues and clinical
applications. Eur Heart J 2006;27(21):2588-605.
(55) Leoncini G, Ratto E, Viazzi F, Vaccaro V, Parodi A, Falqui V, et al. Increased
ambulatory arterial stiffness index is associated with target organ damage in primary
hypertension. Hypertension 2006;48(3):397-403.
(56) Li Y, Wang JG, Dolan E, Gao PJ, Guo HF, Nawrot T, et al. Ambulatory arterial
stiffness index derived from 24-hour ambulatory blood pressure monitoring.
Hypertension 2006;47(3):359-64.
(57) DeLoach SS, Townsend RR. Vascular stiffness: its measurement and significance for
epidemiologic and outcome studies. Clin J Am Soc Nephrol 2008;3(1):184-92.
(58) Oliver JJ, Webb DJ. Noninvasive assessment of arterial stiffness and risk of
atherosclerotic events. Arterioscler Thromb Vasc Biol 2003;23(4):554-66.

-IX -
(59) Safar ME. Pulse pressure, arterial stiffness and wave reflections (augmentation index)
as cardiovascular risk factors in hypertension. Ther Adv Cardiovasc Dis 2008;2(1):13-
24.
(60) Williams B. The year in hypertension. J Am Coll Cardiol 2008;51(18):1803-17.
(61) Dolan E, Thijs L, Li Y, Atkins N, McCormack P, McClory S, et al. Ambulatory arterial
stiffness index as a predictor of cardiovascular mortality in the Dublin Outcome Study.
Hypertension 2006;47(3):365-70.
(62) Alberti KG, Zimmet P, Shaw J. The metabolic syndrome--a new worldwide definition.
Lancet 2005;366(9491):1059-62.
(63) Ford ES. Risks for all-cause mortality, cardiovascular disease, and diabetes associated
with the metabolic syndrome: a summary of the evidence. Diabetes Care
2005;28(7):1769-78.
(64) Lorenzo C, Williams K, Hunt KJ, Haffner SM. The National Cholesterol Education
Program - Adult Treatment Panel III, International Diabetes Federation, and World
Health Organization definitions of the metabolic syndrome as predictors of incident
cardiovascular disease and diabetes. Diabetes Care 2007;30(1):8-13.
(65) Zamir N, Shuber E. Altered pain perception in hypertensive humans. Brain Res
1980;201(2):471-4.
(66) Rosa C, Vignocchi G, Panattoni E, Rossi B, Ghione S. Relationship between increased
blood pressure and hypoalgesia: additional evidence for the existence of an abnormality
of pain perception in arterial hypertension in humans. J Hum Hypertens 1994;8(2):119-
26.
(67) Zarrelli MM, Amoruso L, Beghi E, Apollo F, Di VP, Simone P. Arterial hypertension
as a risk factor for chronic symmetric polyneuropathy. J Epidemiol Biostat
2001;6(5):409-13.
(68) Legrady P et al. Investigation of cardiac autonomic and peripheral sensory neuropathy
in long-standing hypertension with and without type 2 diabetes mellitus. Diabetologia
2006;49:630-1.
(69) Rivero Luis M et al. Impairement of peripheral nerve function in obese subjects without
diabetes. Influence of hypertension. Diabetologia 2006;49:613.
(70) Edwards L, Ring C, McIntyre D, Winer JB, Martin U. Cutaneous sensibility and
peripheral nerve function in patients with unmedicated essential hypertension.
Psychophysiology 2008;45(1):141-7.
-X -
(71) Edwards L, Ring C, McIntyre D, Winer JB, Martin U. Effects of essential hypertension
on short latency human somatosensory-evoked potentials. Psychophysiology.
2010;47(2):323-31.
(72) Hughes RA. Peripheral neuropathy. BMJ 2002;324(7335):466-9.
(73) Jude EB, Boulton AJ. Peripheral neuropathy. Clin Podiatr Med Surg 1999 ;16(1):81-96.
(74) Young MJ. A multicentre study of the prevalence of diabetics peripheral neuropathy in
the United Kingdom hospital clinic population. Diabetologia 1993;36(2):150-4.
(75) Dyck PJ. Detection, characterization, and staging of polyneuropathy: assessed in
diabetics. Muscle & Nerve 1988;11:21-32.
(76) Harris M, Eastman R, Cowie C. Symptoms of sensory neuropathy in adults with
NIDDM in the U.S. population. Diabetes Care 1993;16(11):1446-52.
(77) Forrest KY, Maser RE, Pambianco G, Becker DJ, Orchard TJ. Hypertension as a risk
factor for diabetic neuropathy: a prospective study. Diabetes 1997;46(4):665-70.
(78) Cohen JA, Jeffers BW, Faldut D, Marcoux M, Schrier RW. Risks for sensorimotor
peripheral neuropathy and autonomic neuropathy in non-insulin-dependent diabetes
mellitus (NIDDM). Muscle Nerve 1998;21(1):72-80.
(79) Tesfaye S, Chaturvedi N, Eaton SE, Ward JD, Manes C, Ionescu-Tirgoviste C, et al.
Vascular risk factors and diabetic neuropathy. N Engl J Med 2005;352(4):341-50.
(80) Jarmuzewska EA, Mangoni AA. Pulse pressure is independently associated with
sensorimotor peripheral neuropathy in patients with type 2 diabetes. J Intern Med
2005;258(1):38-44.
(81) Jarmuzewska EA, Ghidoni A, Mangoni AA. Hypertension and sensorimotor peripheral
neuropathy in type 2 diabetes. Eur Neurol 2007;57(2):91-5.
(82) Balducci S, Iacobellis G, Parisi L, Di BN, Calandriello E, Leonetti F, et al. Exercise
training can modify the natural history of diabetic peripheral neuropathy. J Diabetes
Complications 2006;20(4):216-23.
(83) Ghione S, Rosa C, Mezzasalma L, Panattoni E. Arterial hypertension is associated with
hypalgesia in humans. Hypertension 1988;12(5):491-7.
(84) Sheps DS, Bragdon EE, Gray TF, III, Ballenger M, Usedom JE, Maixner W. Relation
between systemic hypertension and pain perception. Am J Cardiol 1992;70(16):3F-5F.

-XI -
(85) Ibrahim S, Harris ND, Radatz M, Selmi F, Rajbhandari S, Brady L, et al. A new
minimally invasive technique to show nerve ischaemia in diabetic neuropathy.
Diabetologia 1999;42(6):737-42.
(86) Tesfaye S, Malik R, Ward JD. Vascular factors in diabetic neuropathy. Diabetologia
1994;37(9):847-54.
(87) Cameron NE, Eaton SE, Cotter MA, Tesfaye S. Vascular factors and metabolic
interactions in the pathogenesis of diabetic neuropathy. Diabetologia 2001;44(11):1973-
88.
(88) Teunissen LL, Franssen H, Wokke JH, van der GY, Linssen WH, Banga JD, et al. Is
cardiovascular disease a risk factor in the development of axonal polyneuropathy? J
Neurol Neurosurg Psychiatry 2002;72(5):590-5.
(89) Makin A, Lip GY, Silverman S, Beevers DG. Peripheral vascular disease and
hypertension: a forgotten association? J Hum Hypertens 2001;15(7):447-54.
(90) Bravenboer B, Kappelle AC, Hamers FP, van BT, Erkelens DW, Gispen WH. Potential
use of glutathione for the prevention and treatment of diabetic neuropathy in the
streptozotocin-induced diabetic rat. Diabetologia 1992;35(9):813-7.
(91) Mourad JJ, Laville M. Is hypertension a tissue perfusion disorder? Implications for renal
and myocardial perfusion. J Hypertens Suppl 2006;24(5):S10-S16.
(92) Bloomgarden ZT. Diabetic retinopathy and diabetic neuropathy. Diabetes Care
2007;30(3):760-5.
(93) Eaton SE, Harris ND, Ibrahim S, Patel KA, Selmi F, Radatz M, et al. Increased sural
nerve epineurial blood flow in human subjects with painful diabetic neuropathy.
Diabetologia 2003;46(7):934-9.
(94) Cameron NE, Cotter MA, Robertson S. Angiotensin converting enzyme inhibition
prevents development of muscle and nerve dysfunction and stimulates angiogenesis in
streptozotocin-diabetic rats. Diabetologia 1992;35(1):12-8.
(95) Maxfield EK, Cameron NE, Cotter MA, Dines KC. Angiotensin II receptor blockade
improves nerve function, modulates nerve blood flow and stimulates endoneurial
angiogenesis in streptozotocin-diabetic rats and nerve function. Diabetologia
1993;36(12):1230-7.
(96) Cameron NE, Cotter MA, Robertson S. Rapid reversal of a motor nerve conduction
deficit in streptozotocin-diabetic rats by the angiotensin converting enzyme inhibitor
lisinopril. Acta Diabetol 1993;30(1):46-8.
-XII -
(97) Aggarwal M, Singh J, Sood S, Arora B. Effects of lisinopril on streptozotocin-induced
diabetic neuropathy in rats. Methods Find Exp Clin Pharmacol 2001;23(3):131-4.
(98) Coppey LJ, Davidson EP, Rinehart TW, Gellett JS, Oltman CL, Lund DD, et al. ACE
inhibitor or angiotensin II receptor antagonist attenuates diabetic neuropathy in
streptozotocin-induced diabetic rats. Diabetes 2006;55(2):341-8.
(99) Reja A, Tesfaye S, Harris ND, Ward JD. Is ACE inhibition with lisinopril helpful in
diabetic neuropathy? Diabet Med 1995;12(4):307-9.
(100) Malik RA, Williamson S, Abbott C, Carrington AL, Iqbal J, Schady W, et al. Effect of
angiotensin-converting-enzyme (ACE) inhibitor trandolapril on human diabetic
neuropathy: randomised double-blind controlled trial. Lancet 1998;352(9145):1978-81.
(101) Sabbatini M, Vega JA, Amenta F. Peripheral nerve vascular changes in spontaneously
hypertensive rats. Neurosci Lett 1996;217(2-3):85-8.
(102) Sabbatini M, Bellagamba G, Vega JA, Amenta F. Effect of antihypertensive treatment
on peripheral nerve vasculature in spontaneously hypertensive rats. Clin Exp Hypertens
2001;23(1-2):157-66.
(103) Tomassoni D, Traini E, Vitaioli L, Amenta F. Morphological and conduction changes in
the sciatic nerve of spontaneously hypertensive rats. Neurosci Lett 2004;362(2):131-5.
(104) Guasti L, Zanotta D, Mainardi LT, Petrozzino MR, Grimoldi P, Garganico D, et al.
Hypertension-related hypoalgesia, autonomic function and spontaneous baroreflex
sensitivity. Auton Neurosci 2002;99(2):127-33.
(105) Ghione S. Hypertension-associated hypalgesia. Evidence in experimental animals and
humans, pathophysiological mechanisms, and potential clinical consequences.
Hypertension 1996;28(3):494-504.
(106) Ghione S, Rosa C, Mezzasalma L, Panattoni E. Arterial hypertension is associated with
hypalgesia in humans. Hypertension 1988;12(5):491-7.
(107) Zamir N, Maixner W. The relationship between cardiovascular and pain regulatory
systems. Ann N Y Acad Sci 1986;467:371-84.
(108) Ring C, France CR, al'Absi M, Edwards L, McIntyre D, Carroll D, et al. Effects of
naltrexone on electrocutaneous pain in patients with hypertension compared to
normotensive individuals. Biol Psychol 2008;77(2):191-6.
(109) Ghione S, Rosa C, Mezzasalma L, Panattoni E. Arterial hypertension is associated with
hypalgesia in humans. Hypertension 1988;12(5):491-7.
-XIII -
(110) Fillingim RB, Maixner W. The influence of resting blood pressure and gender on pain
responses. Psychosom Med 1996;58(4):326-32.
(111) Kannel WB, Dannenberg AL, Abbott RD. Unrecognized myocardial infarction and
hypertension: the Framingham Study. Am Heart J 1985;109(3 Pt 1):581-5.
(112) Viskoper RJ, Chaco J, Aviram A. Nerve conduction velocity in the assessment of
hypertension. Arch Intern Med 197;128(4):574-5.
(113) Smith DR, Kobrine AI, Rizzoli HV. Absence of autoregulation in peripheral nerve
blood flow. J Neurol Sci 1977;33(3):347-52.
(114) Verdu E, Ceballos D, Vilches JJ, Navarro X. Influence of aging on peripheral nerve
function and regeneration. J Peripher Nerv Syst 2000;5(4):191-208.
(115) Lin YH, Hsieh SC, Chao CC, Chang YC, Hsieh ST. Influence of aging on thermal and
vibratory thresholds of quantitative sensory testing. J Peripher Nerv Syst
2005;10(3):269-81.
(116) Arezzo JC. New developments in the diagnosis of diabetic neuropathy. Am J Med
1999;107(2B):9S-16S.
(117) Dyck PJ, O'Brien PC, Kosanke JL, Gillen DA, Karnes JL. A 4, 2, and 1 stepping
algorithm for quick and accurate estimation of cutaneous sensation threshold.
Neurology 1993;43(8):1508-12.
(118) Dyck PJ, Zimmerman IR, Johnson DM, Gillen D, Hokanson JL, Karnes JL, et al. A
standard test of heat-pain responses using CASE IV. J Neurol Sci 1996;136(1-2):54-63.
(119) Hilz MJ. Assessment and evaluation of hereditary sensory and autonomic neuropathies
with autonomic and neurophysiological examinations. Clin Auton Res 2002;12 Suppl
1:I33-I43.
(120) Bolton CF, Carter KM. Human sensory nerve compound action potential amplitude:
variation with sex and finger circumference. J Neurol Neurosurg Psychiatry
1980;43(10):925-8.
(121) Buschbacher RM. Body mass index effect on common nerve conduction study
measurements. Muscle Nerve 1998;21(11):1398-404.
(122) Cohen J. A power primer. Psychol Bull 1992;112(1):155-9.

-XIV -
(123) Cho DY, Mold JW, Roberts M. Further investigation of the negative association
between hypertension and peripheral neuropathy in the elderly: an Oklahoma Physicians
Resource/Research Network (OKPRN) Study. J Am Board Fam Med 2006;19(3):240-
50.
(124) Mold JW, Vesely SK, Keyl BA, Schenk JB, Roberts M. The prevalence, predictors, and
consequences of peripheral sensory neuropathy in older patients. J Am Board Fam
Pract 2004;17(5):309-18.
(125) Fujimura H, Lacroix C, Said G. Vulnerability of nerve fibres to ischaemia. A
quantitative light and electron microscope study. Brain 1991;114 (Pt 4):1929-42.
(126) Said G. Diabetic neuropathy--a review. Nat Clin Pract Neurol 2007;3(6):331-40.
(127) Said G. Diabetic Neuropathy. Advanced Studies in Medicine 2001;1(11):457-9.
(128) Smith KJ. Demyelination: The Role of Reactive Oxygen and Nitrogen Species. Brain
Pathology 1999;9:69-92.
(129) Iida H, Schmeichel AM, Wang Y, Schmelzer JD, Low PA. Schwann cell is a target in
ischemia-reperfusion injury to peripheral nerve. Muscle Nerve 2004;30(6):761-6.
(130) Farinon AM, Marbini A, Gemignani F, Govoni E, Bragaglia MM, Sianesi M, et al.
Skeletal muscle and peripheral nerve changes caused by chronic arterial insufficiency--
significance and clinical correlations--histological, histochemical and ultrastructural
study. Clin Neuropathol 1984;3(6):240-52.
(131) Nukada H, McMorran PD. Perivascular demyelination and intramyelinic oedema in
reperfusion nerve injury. J Anat 1994;185 (Pt 2):259-66.
(132) Nukada H, van Rij AM, Packer SG, McMorran PD. Pathology of acute and chronic
ischaemic neuropathy in atherosclerotic peripheral vascular disease. Brain 1996;119 (Pt
5):1449-60.
(133) Weber F, Ziegler A. Axonal neuropathy in chronic peripheral arterial occlusive disease.
Muscle Nerve 2002;26(4):471-6.
(134) Martina IS, van KR, Schmitz PI, van der Meche FG, van Doorn PA. Measuring
vibration threshold with a graduated tuning fork in normal aging and in patients with
polyneuropathy. European Inflammatory Neuropathy Cause and Treatment (INCAT)
group. J Neurol Neurosurg Psychiatry 1998;65(5):743-7.
(135) Christenfeld NJ, Sloan RP, Carroll D, Greenland S. Risk factors, confounding, and the
illusion of statistical control. Psychosom Med 2004;66(6):868-75.

-XV -