permeability testing of radiation shielding concrete manufactured … · 2018-06-25 ·...
TRANSCRIPT
ORIGINAL ARTICLE
Permeability testing of radiation shielding concretemanufactured at industrial scale
Wojciech Kubissa . Michał A. Glinicki . Mariusz Dabrowski
Received: 15 December 2017 / Accepted: 13 June 2018
� The Author(s) 2018
Abstract The effect of the composition of industrial
concrete designed for radiation shielding structures on
the air permeability and the diffusion of moisture was
studied. The mix design for heavyweight concrete of
bulk density 3168–3317 kg/m3 was developed using
barite and magnetite aggregate and cements blended
with fly ash and blastfurnace slag. Structural elements,
like columns of a height of 4 m and massive blocks
made of mixtures with different cements were man-
ufactured using ready mixed concrete pumped into the
formwork. Core specimens were taken from the
elements at different locations. The air permeability
index was tested using Autoclam device. Evaluation of
the quality of concrete on the basis of API results
varied from ‘‘very good’’ to ‘‘good’’. The moisture
distribution inside concrete specimens was equili-
brated to RH = 60 ± 5%. Observation of RH changes
allowed to determine the moisture diffusion coeffi-
cient. Significant differences of the permeability and
moisture diffusion coefficient depending on the loca-
tion of the core specimens drilling and mix design of
concrete were found. The D coefficient provided a
good reflection of the different quality of heavyweight
concrete in structural elements.
Keywords Air permeability � Autoclam � Barite �Blended cement � Cracking � Heavyweight aggregate �Magnetite � Moisture diffusion � Radiation shielding
concrete � Relative humidity
1 Introduction
The criteria for selection of ingredients and concrete
mix design for radiation shielding structures include
both mechanical and physical properties, the shielding
against ionizing radiation, and also the impermeability
to liquids and gases [1, 2]. The concrete in the cover of
the nuclear reactor should be impermeable to poten-
tially radioactively contaminated air and water (due to,
for example, the leakage of the reactor cooling
system). A low permeability concrete can also prevent
the penetration of harmful substances to the inside of
the structure. This reduces the risk of corrosion of the
reinforcement or the destruction of the concrete. It is
important for example in the storage pools for spent
fuel [3]. For the design and production of radiation
shielding concrete usually the special heavy aggre-
gates are used, such as barite, magnetite, hematite [4].
The significance of cement selection for radiation
M. A. Glinicki � M. Dabrowski
Institute of Fundamental Technological Research, Polish
Academy of Sciences, Pawinskiego 5B, 02-106 Warsaw,
Poland
W. Kubissa (&)
Faculty of Civil Engineering, Mechanics and
Petrochemistry, Warsaw University of Technology, 17
Łukasiewicza St., 09-400 Plock, Poland
e-mail: [email protected]
Materials and Structures (2018) 51:83
https://doi.org/10.1617/s11527-018-1213-0
shielding concrete was discussed by Baran et al. [5].
Therefore there is a risk of segregation of the
components of the mixture with inadequate produc-
tion, transport or compaction of the mixture [6–8].
Abnormal heterogeneity of concrete can lead to local
radiation surges and such cases should be effectively
prevented.
The measurement of permeability of shielding
concrete used in nuclear power plants is carried out
by various methods. Three methods of determining the
air permeability of concrete are recommended by
IAEA [9], i.e. the Torrent method, the Autoclam
method and the surface airflow method. The air
permeability depends on the pore system but also
largely on the water content in pores [10, 11].
Therefore, coefficients or correction charts are used
to determine approximately the surface moisture of
concrete based on the measurement of electrical
resistance [12]. The relationship is difficult to establish
because of the presence near-surface moisture gradi-
ents [13]. The electrical resistivity measurement is less
accurate and the scatter of results is greater in
comparison to the direct RH measurement. It is also
highly sensitive to the cement type as a result of the
variance in electrical conductivity of the pore solution,
caused by the clinker phase composition, addition of
supplementary cementitious materials like blastfur-
nace slag [14].
The air permeability determination of concrete at
partial water saturation conditions corresponds to the
operating conditions of radiation shielding structures.
As Oxfall demonstrated [15], the representative envi-
ronmental conditions are determined by the temper-
ature of concrete from 50 to 65 �C and the relative
humidity RH from 40 to 60%. The RH of concrete is
maintained at this level even after many years of
operation of nuclear reactor. An exception is the
concrete layer in the immediate vicinity of the reactor.
The air permeability of laboratory specimens of
shielding concrete in a specific moisture state was
investigated in [16]. Using the Autoclam method both
significant effects of type of cement and aggregate
type were demonstrated. Also the essential effects of
equalization of the humidity distribution in the cross
section of specimens were shown. Similar method-
ological observations resulted from [17], although
related to the normal weight concrete. The method of
preparation of 100 mm cylindrical specimens with
uniformly distributed RH, using the surface RH
measurement, is also shown in [18].
In the undamaged zones of a structure the low
permeability of concrete allows to prevent any signif-
icant leakage through containment building walls [19].
However, the permeability can be significantly influ-
enced by cracks [20], therefore the effects of micro
cracking on the air permeability of concrete are
relevant to the integrity of containment [21]. Such
effects can be experimentally studied only in the
industrial scale, not on small laboratory-manufactured
specimens.
The moisture movement in concrete can cause
different types of volume changes. The drying
shrinkage is especially important in radiation-shield-
ing concrete because it results in tensile stresses which
can cause cracking. Large cracks could reduce the
performance of radiation shields [22, 23]. Excessive
moisture diffusion coefficients are unfavourable, they
can lead to faster drying of concrete. This may have an
adverse effect on the shielding performance.
Moisture movement phenomena in cement-based
porous materials are quite complex because of both
physical and chemical interactions between water
molecules and solid phases. The development of a
holistic model of the transport phenomena is a serious
challenge [24]. The transport of water is generally
dominated by the molecular water diffusion. Theoret-
ical models of moisture movement in porous media are
usually based on the Fick’s law [25]. New calculation
models are developed for the analysis of movement of
moisture in concrete [25, 26]. Magnetic resonance
imaging (MRI) and other modern testing techniques
allow for a better understanding of the occurring
phenomena. Experimental data is used as a proof of
conformity of theoretical models with the actual
moisture movement in concrete [27].
The moisture diffusion coefficient in concrete is
highly variable and depends on many factors. Bazant
[28] draws attention to the relationship between the
coefficient D and the RH gradients, not specifying the
resulting differences. Depending on the age of
concrete the coefficient D can vary by up to two
orders of magnitude [29]. The influence of tempera-
ture is also very important [30]. The assumed compu-
tational model and its parameters can also cause
significant differences in D coefficient calculated from
the same experimental data.
83 Page 2 of 15 Materials and Structures (2018) 51:83

The purpose of the research undertaken by the
authors is to evaluate the effects of mix design of
heavyweight concrete manufactured in industrial
scale, intended for radiation shields, on the air
permeability and the diffusion of moisture through
concrete. The investigation was carried out on the
specimens cut from structural elements made of
concrete manufactured at a ready-mix concrete plant.
2 Experimental
2.1 Materials and preparation of structural
elements
Concrete mixes were made in a Stetter concrete
mixing plant with a filling capacity 0.75 m3. Using the
truck mixer the mix was transported to the place of
concreting. Concrete columns with a diameter of
400 mm and a height of about 4.0 m in the steel
formwork were cast. Concrete mix was fed using a
pump vehicle, the compaction was achieved using a
poke vibrator. Large concrete blocks
1.0 9 1.0 9 0.8 m were cast in prepared molds with
thermal insulation on the side walls and at the bottom.
Concrete mixture was fed directly from the hopper of
truck mixer and compacted using a poke vibrator. The
composition of the concrete mixtures used for making
the columns and the blocks is given in Tables 1 and 2.
Two types of heavyweight aggregates were applied
for concrete mixes: crushed magnetite (the density of
4.80 kg/dm3, the content of Fe3O4 of about 89.7%)
supplied in two fractions 0/5 and 0/16 mm, and
crushed barite aggregate (the density of 4.20 kg/dm3,
the content of BaSO4 of about 92%) supplied as
0/16 mm fraction. Common cements, manufactured
according to the European standard PN-EN 197-1,
were used, both Portland cement and blended cements.
The basic properties of cements are given in Table 3.
European standard methods were used to test fresh
concrete properties: the consistency, the bulk density
and the temperature. Fresh mix properties are also
given in Tables 1 and 2. No signs of mixture
segregation were observed during mixing and fresh
concrete testing. Companion standard specimens were
manufactured for the compressive strength determi-
nation and for the drying shrinkage evaluation. The
150 mm cube specimens and prismatic
100 9 100 9 500 mm specimens were manufactured
and cured following the respective procedures.
2.2 Specimens and test methods
Basic concrete properties were determined using
European standard procedures. The compressive
strength of concrete was determined on 150 mm
cubes in accordance with PN-EN 12390-3. The
specimens were stored in the high moisture temper-
ature controlled cabinet (20 ± 2 �C, RH[ 95%) until
Table 1 The composition
(kg/m3) and properties of
fresh concrete mixes used to
make of the columns with a
height of 4 m
Components and properties Mixture ID
B A
Cement CEM II/B-S 32.5 R 314
Cement CEM III/A 42.5N-HSR/NA 342
Sand 0/2 mm 567 363
Crushed magnetite 0/5 mm 786 –
Crushed magnetite 0/16 mm 1437 –
Crushed barite 0/16 mm – 2298
Water 194 164
Plasticizer 2.35
Lubet C
0.61
Fluid optima 100
Bulk density (kg/m3) 3300 3168
Slump (cm) 21.0 11.0
Temperature (�C) 12 19
w/c ratio 0.62 0.48
Materials and Structures (2018) 51:83 Page 3 of 15 83
testing. The compressive strength of concrete was
determined at the age of 28 and 90 days (Table 4).
Only for the series T49, T50 and T51 the compressive
strength was also determined at the age of 630 days.
The shrinkage tests were performed in accordance
with ISO 1920-8 modified following prEN 12390-16.
Specimens were demoulded at 24 h after casting and
placed in the drying room at the temperature of
20 ± 2 �C and the relative humidity of 60 ± 5%. The
length change was recorded until 90 days (Table 5).
A significant strength increase was noted at the age
of almost 2 years for concrete specimens manufac-
tured with CEM II/B-V and CEM II/B-S cements and
magnetite aggregate. The observed drying shrinkage
results are consistent with the trends presented in [31].
A larger shrinkage was observed in concrete with
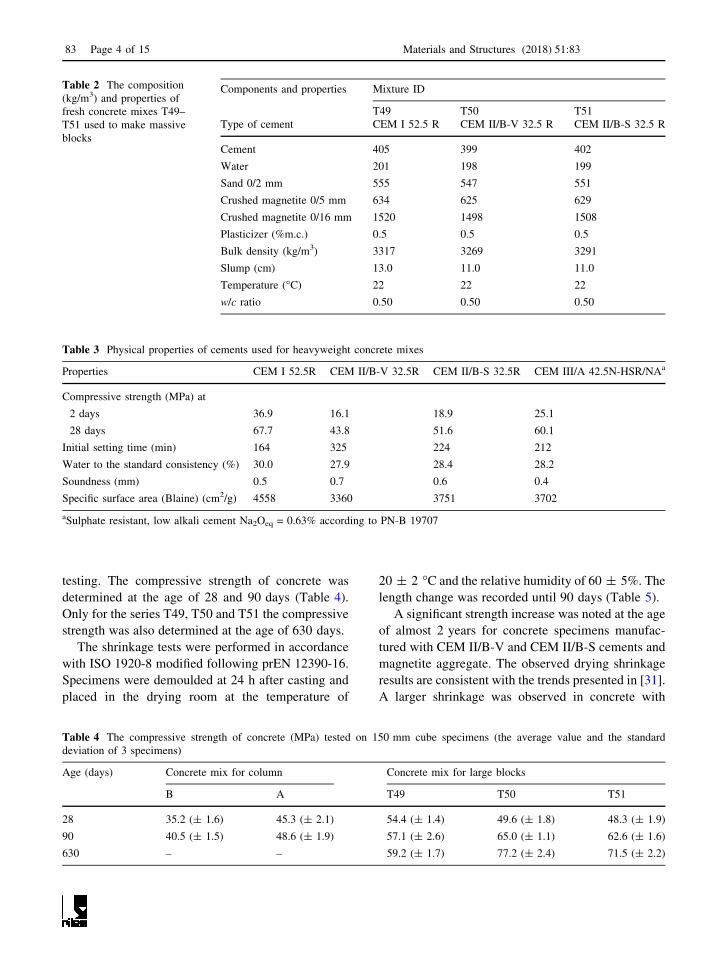
Table 2 The composition
(kg/m3) and properties of
fresh concrete mixes T49–
T51 used to make massive
blocks
Components and properties Mixture ID
T49 T50 T51
Type of cement CEM I 52.5 R CEM II/B-V 32.5 R CEM II/B-S 32.5 R
Cement 405 399 402
Water 201 198 199
Sand 0/2 mm 555 547 551
Crushed magnetite 0/5 mm 634 625 629
Crushed magnetite 0/16 mm 1520 1498 1508
Plasticizer (%m.c.) 0.5 0.5 0.5
Bulk density (kg/m3) 3317 3269 3291
Slump (cm) 13.0 11.0 11.0
Temperature (�C) 22 22 22
w/c ratio 0.50 0.50 0.50
Table 3 Physical properties of cements used for heavyweight concrete mixes
Properties CEM I 52.5R CEM II/B-V 32.5R CEM II/B-S 32.5R CEM III/A 42.5N-HSR/NAa
Compressive strength (MPa) at
2 days 36.9 16.1 18.9 25.1
28 days 67.7 43.8 51.6 60.1
Initial setting time (min) 164 325 224 212
Water to the standard consistency (%) 30.0 27.9 28.4 28.2
Soundness (mm) 0.5 0.7 0.6 0.4
Specific surface area (Blaine) (cm2/g) 4558 3360 3751 3702
aSulphate resistant, low alkali cement Na2Oeq = 0.63% according to PN-B 19707
Table 4 The compressive strength of concrete (MPa) tested on 150 mm cube specimens (the average value and the standard
deviation of 3 specimens)
Age (days) Concrete mix for column Concrete mix for large blocks
B A T49 T50 T51
28 35.2 (± 1.6) 45.3 (± 2.1) 54.4 (± 1.4) 49.6 (± 1.8) 48.3 (± 1.9)
90 40.5 (± 1.5) 48.6 (± 1.9) 57.1 (± 2.6) 65.0 (± 1.1) 62.6 (± 1.6)
630 – – 59.2 (± 1.7) 77.2 (± 2.4) 71.5 (± 2.2)
83 Page 4 of 15 Materials and Structures (2018) 51:83

barite aggregate as compared to shrinkage of concrete
with magnetite aggregate.
Specimens for air permeability testing were taken
as drilled cores from manufactured structural mem-
bers made of ready mix concrete. The concrete
columns were first laid down and sliced to obtain
two thick disks /400 by 170 mm from the top and the
bottom part of a column. The location of the disks
along the column height was at the distance of about
3.4 m. The specimens A and B were drilled from these
slices at the top and the bottom of manufactured
columns. The companion cores drilled form these
thick concrete slices were taken to make polished
plane sections for aggregate grain distribution evalu-
ation. The specimens T49, T50 and T51 were cored
from three large blocks perpendicular to the top
surface. The cores of 150 mm in diameter and about
450 mm in height were sectioned to obtain two
cylindrical specimens of 150 mm high out of each
core rejecting about 30 mm upper layer of the core All
the core specimens were trimmed using water-lubri-
cated diamond saw to obtain flat ends.
The relative humidity (RH) in concrete was mea-
sured using Vaisala HMP44 probes with HM40
indicator. Autoclam device from Amphora Company
was used to measure the Air Permeability Index (API)
[32]. The modification of the API test procedure
involves applying of an annular seal, between the base
ring and the concrete surface, made of microgum with
a thickness of 8 mm, and also clamping a steel ring
with G-clamps instead of using expansion anchors in
the bored holes. The side surfaces of cylindrical core
specimens were covered with a resin layer, which was
impermeable to water and air. The indices API were
determined at the center of each opposite, non-isolated
specimen end surface. The RH and temperature probes
were inserted in plastic tubes placed into drilled holes
with a diameter of 16 mm at a certain depth from the
specimen surface: 30 and 75 mm below the non-
isolated surface of the specimens. The assumed
specimen preparation procedure and the unidirectional
moisture movement ensured the uniformity of spec-
imen drying on both sides. For the analysis and
calculations a symmetrical distribution of RH was
assumed with respect to the plane passing through the
center of the specimen parallel to the unprotected
walls. This permitted a determination of the RH
distribution in a specimen based on measurements at
three points.
2.3 Specimen conditioning and API, RH
measurements
In comparison to the research described in [16], a
modified specimen preparation procedure was applied
with a specified target RH, uniformly distributed in
specimens. The specimen conditioning and API, RH
measurements were performed in several steps,
including:
a. the hole drilling for placing the tubes for RH probe
insertion,
b. the placement of moisture barrier on lateral sides
of cylindrical specimens,
c. the initial measurement of API and RH of
concrete before drying,
Table 5 Drying shrinkage
of concrete (mm/m) in time
(the average value and the
standard deviation of 3
specimens)
Concrete designation Drying time (days)
7 14 21 28 35 42 56 90
B 0.167 0.27 0.33 0.389 0.426 0.434 0.463 0.513
0.021 0.046 0.045 0.043 0.047 0.051 0.054 0.053
A 0.212 0.298 0.353 0.426 0.461 0.491 0.517 0.612
0.062 0.059 0.053 0.061 0.063 0.042 0.049 0.077
T49 0.117 0.211 0.289 0.342 0.371 0.388 0.415 0.471
0.039 0.057 0.053 0.078 0.084 0.079 0.077 0.084
T50 0.151 0.239 0.291 0.311 0.357 0.357 0.494 0.537
0.045 0.049 0.042 0.048 0.051 0.040 0.084 0.092
T51 0.200 0.346 0.383 0.412 0.422 0.446 0.461 0.510
0.020 0.039 0.031 0.024 0.020 0.008 0.006 0.013
Materials and Structures (2018) 51:83 Page 5 of 15 83

d. the drying of specimens in the thermostatic
chamber with weekly RH measurements, until
the target RH achieved,
e. the placement of moisture barrier around speci-
mens and storage of moisture-insulated specimens
at controlled laboratory conditions until the
moisture equilibrium achieved,
f. the measurement of API at stabilized target RH of
concrete,
g. the oven drying of specimens at 105 �C and
subsequent measurements of API.
The side surface of the specimens was secured by an
impermeable resin in order to provide an unidirec-
tional transport of moisture during the drying and
stabilization. The measurements of RH at the speci-
men surface were carried out using the device shown
in Fig. 1a. The instrument consisted of a plastic plate
of dimensions 100 9 100 9 10 mm and an embed-
ded tube of 12 mm internal diameter for the insertion
of the Vaisala probe. The plate was fixed to the surface
of concrete by blu tack mass. The area of specimen
surface covered with RH measurement device was
approximately 80 cm2. The distance between the plate
surface and the specimen surface was 3 mm and the
volume of air in the measuring chamber was about
24 cm3. The ratio of the volume of the measuring
chamber to the test area of concrete specimen is
0.30 cm and it is close to the ratio of 0.25 cm that is
characteristic when using the Vaisala instrument in a
hole of 16 mm diameter, according to the manufac-
turer guidelines. In comparison to the surface RH test
described in [16], the increased surface of concrete
specimen covered with RH measurement and the
reduced volume of the measuring chamber improve
the precision of concrete RH representation and
reduce the effect of external air access during the
assembly/removal of the probe.
The continuous monitoring of the surface RH of the
specimen during the stabilization process was applied.
It allows for a precise determination of time needed to
reach the assumed level of RH alignment in the
specimen volume. It has been assumed that the
stabilization of RH continues until the RH difference
between the surface and 30 mm below the surface is
less than 5%. If the stabilization time was 1.5 times
longer than the drying period, the difference limit in
RH was increased to 10%.
Drying of concrete specimens in fixed temperature
of 65 �C was conducted in a laboratory thermostatic
chamber with a forced air flow. The relative humidity
of air inside the thermostatic chamber was below 10%.
Before start of drying the RH measurements in
concrete specimens at different depths were made.
During the drying process RH was recorded in weekly
intervals. Before the weekly RH measurements the
specimens were cooled down in the laboratory for
24 h to the temperature of 20 ± 2 �C.
At the time of achieving the target RH below 65%
in concrete at a depth of 30 mm from the surface the
drying was terminated. After cooling to room temper-
ature of 20 ± 2 �C the specimens were tightly
wrapped in three layers of aluminium foil and
additional layer of stretch film. The humidity stabi-
lization process in the specimens was carried out in a
laboratory at the air temperature of 20 ± 2 �C and RH
50 ± 10%. After API measurements in stabilized
moisture state, the specimens were dried to a constant
mass at a temperature of 105 �C. Measurements of the
API in heavyweight concrete were carried out in
natural RH state, after RH stabilization period and
after drying at 105 �C.
3 Test results
3.1 Results of measurement of RH distribution
in concrete
The evolution of RH distribution in the specimen B
during concrete drying and RH stabilization period is
shown in Figs. 2 and 3. The data obtained at three
locations are presented assuming the symmetrical
drying conditions at two ends of cylindrical
specimens.
During the drying period, a rapid reduction of RH in
the concrete surface layer by about 30% can be seen,
followed by a gradual decrease of RH in the remaining
part of the specimen. During the moisture stabilization
period it can be observed that the rate of RH change in
different specimen layers is well correlated with RH
gradients. With larger RH differences in the initial
stabilization period, the movement of moisture is
much faster than in the later period when the gradients
are lower.
Figure 4 shows the distribution of RH in specimens
B and T49 before the drying period, just after the
83 Page 6 of 15 Materials and Structures (2018) 51:83

drying and after the moisture stabilization period. It
can be seen that after the full procedure of specimen
conditioning, the RH decreased evenly by approxi-
mately 25% across the specimen.
3.2 API measurement results
Figure 5 shows the air permeability index of concrete
specimens from the top and the bottom of columns A
Fig. 1 The set of devices for RH measurement during concrete drying and moisture stabilization: a RH measurement at the specimen
surface, b set of tubes at prescribed locations for insertion of Vaisala probes
Materials and Structures (2018) 51:83 Page 7 of 15 83

and B and from the massive blocks. The average
values and the standard deviation of 4 measurements
are shown for each heavyweight concrete series. The
data were obtained at natural RH (approx. 90%), after
the moisture stabilization at the level of RH 60 ± 5%
and after the oven drying at 105 �C. For both columns
a higher air permeability was observed in the upper
parts than in the lower parts of the column. Such a
difference at the state of stabilized RH was 31.5% for
column A and 21.2% for column B. After oven drying
at 105 �C such differences were 10.4 and 39.9%,
respectively. In the case of massive concrete blocks,
similar API values were obtained in both elements
with CEM II cement. The air permeability index of
concrete specimens in the block manufactured using
CEM I 52.5R cement was much higher. Such an
increase was 136.8 and 113.2% compared to the
blocks T50 and T51 at the stabilized RH. After oven
drying at 105 �C the air permeability index of the
Fig. 2 Change of the RH distribution in the specimen B during
the drying period at the temperature 65 �C
Fig. 3 Change of the RH distribution in the specimen B during
the moisture stabilization period
Fig. 4 RH distribution in the specimen before drying (natural
state), after drying and after stabilization—the specimens B and
T49
83 Page 8 of 15 Materials and Structures (2018) 51:83
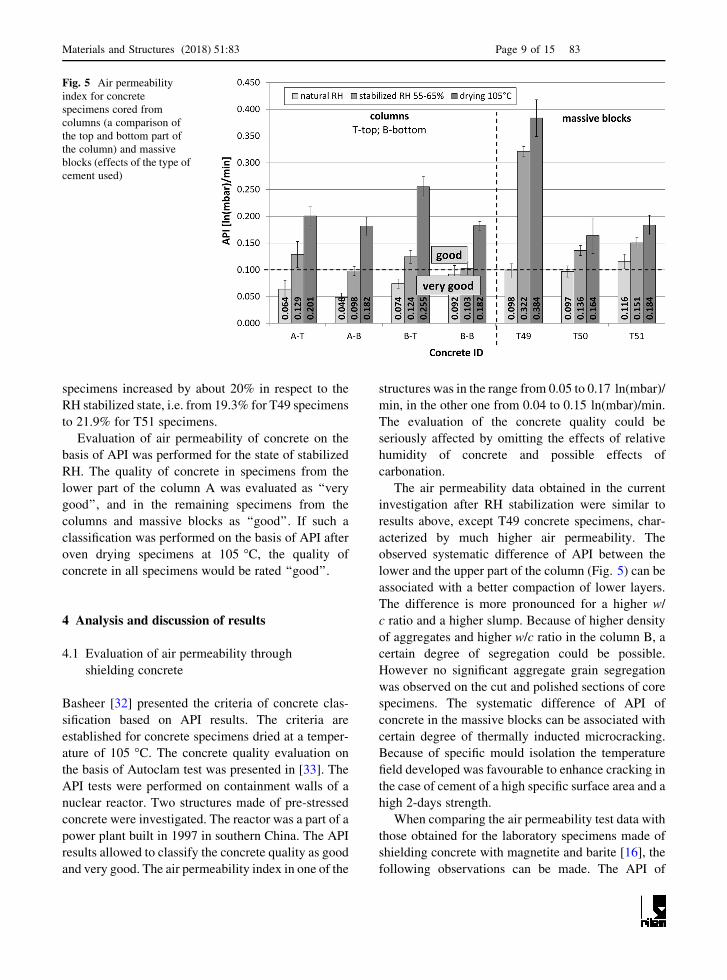
specimens increased by about 20% in respect to the
RH stabilized state, i.e. from 19.3% for T49 specimens
to 21.9% for T51 specimens.
Evaluation of air permeability of concrete on the
basis of API was performed for the state of stabilized
RH. The quality of concrete in specimens from the
lower part of the column A was evaluated as ‘‘very
good’’, and in the remaining specimens from the
columns and massive blocks as ‘‘good’’. If such a
classification was performed on the basis of API after
oven drying specimens at 105 �C, the quality of
concrete in all specimens would be rated ‘‘good’’.
4 Analysis and discussion of results
4.1 Evaluation of air permeability through
shielding concrete
Basheer [32] presented the criteria of concrete clas-
sification based on API results. The criteria are
established for concrete specimens dried at a temper-
ature of 105 �C. The concrete quality evaluation on
the basis of Autoclam test was presented in [33]. The
API tests were performed on containment walls of a
nuclear reactor. Two structures made of pre-stressed
concrete were investigated. The reactor was a part of a
power plant built in 1997 in southern China. The API
results allowed to classify the concrete quality as good
and very good. The air permeability index in one of the
structures was in the range from 0.05 to 0.17 ln(mbar)/
min, in the other one from 0.04 to 0.15 ln(mbar)/min.
The evaluation of the concrete quality could be
seriously affected by omitting the effects of relative
humidity of concrete and possible effects of
carbonation.
The air permeability data obtained in the current
investigation after RH stabilization were similar to
results above, except T49 concrete specimens, char-
acterized by much higher air permeability. The
observed systematic difference of API between the
lower and the upper part of the column (Fig. 5) can be
associated with a better compaction of lower layers.
The difference is more pronounced for a higher w/
c ratio and a higher slump. Because of higher density
of aggregates and higher w/c ratio in the column B, a
certain degree of segregation could be possible.
However no significant aggregate grain segregation
was observed on the cut and polished sections of core
specimens. The systematic difference of API of
concrete in the massive blocks can be associated with
certain degree of thermally inducted microcracking.
Because of specific mould isolation the temperature
field developed was favourable to enhance cracking in
the case of cement of a high specific surface area and a
high 2-days strength.
When comparing the air permeability test data with
those obtained for the laboratory specimens made of
shielding concrete with magnetite and barite [16], the
following observations can be made. The API of
Fig. 5 Air permeability
index for concrete
specimens cored from
columns (a comparison of
the top and bottom part of
the column) and massive
blocks (effects of the type of
cement used)
Materials and Structures (2018) 51:83 Page 9 of 15 83

concrete in the column B is significantly higher than in
the lab-made concrete specimens of similar composi-
tion but 23% lower w/c ratio; the difference amounted
to 45.9 and 21.1% in the upper part and in the lower
part of column B, respectively. The air permeability
index of concrete in the upper part of column A was
very similar to the API of laboratory concrete B16
[0.129 and 0.130 ln(mbar)/min], while the API in the
lower part of column A was 24.6% lower when
compared to the result of laboratory concrete B16. The
similar concrete mix behave as less air permeable
when manufactured at an industrial scale, in particular
when cast at the bottom of the column.
4.2 Calculation of moisture diffusion coefficient
Prediction of movement of moisture in porous media
such as concrete is a complex matter, because the
cementitious materials are known to have a wide range
of pore sizes [34]. The pore dimensions, if assumed to
be cylindrical, vary from radiuses 10-10 m (gel pores)
to radiuses 10-2 m (air voids/capillary pores) [35].
The complex microstructure of pores is associated
with their connectivity [36]. Depending on the pore
size, the moisture movement takes place by diffusion,
laminar flow and free molecular diffusion (Knudsen
diffusion). In the case of greater RH when a part of the
capillary system is filled with water there is an
additional capillary transport. For the experimental
determination of the moisture transport in concrete, it
is usual to adopt simplified models in which one
diffusion factor is used. Researchers point out that the
diffusion coefficient is dependent on the RH of
concrete [28, 37–39].
Currently, the model proposed by Bazant and
Najjar [28], adopted in Model Code 2010 is in
common use [40–42]. It embraces a specific model
for the corresponding diffusivity coefficient Dh. The
corresponding field equation is presented in Eq. 1.
oh=ot ¼ divDh � grad(RH) ð1Þ
where Dh (cm2/day) is the diffusion coefficient
(dependent on RH of concrete); RH is the relative
humidity of concrete (%) (defined as the relative
humidity (RH) of the gaseous phase in equilibrium
with the interstitial liquid phase in the pore network of
the material [43]) and t is time (days).
For the diffusion coefficient in isothermal condi-
tions, it can be expressed as a function of the pore
relative humidity 0\RH\ 1
Dh ¼ D1 aþ 1 � a1 þ 1 � RHð Þ= 1 � RHCð Þ½ �n
� �ð2Þ
where D1 (cm2/day) is the maximum value of Dh for
RH = 1; D0 (cm2/day) is the minimum Dh for RH = 0,
a = D0/D1, RHc the relative pore humidity at Dh
(RH) = 0.5D1 and n is an exponent. Three important
parameters in the formula: a (= 0.05), RHc (= 0.80)
and n (= 15) are arbitrary assumed constants, given in
MC2010 [44]. Assuming that in the RH range below
75% (and this is in our specimens), the relative
humidity effect on the diffusivity coefficient is min-
imal. In our calculations we adopted the modified
parameters values: a = 0.10 and RHc = 0.65. Simpli-
fied calculations with a constant D coefficient in the
range of RH 20–75% were also performed.
oh=ot ¼ D� grad(RH) ð3Þ
when calculating the D coefficient, a one-directional
distribution and movement of moisture and constant
temperature 20 �C were assumed. It was assumed that
the distribution and flow of moisture in the specimen is
symmetric with respect to the plane passing through
the center of the specimen, parallel to its unprotected
sides. Calculations were made for the half of a
specimen. The least squares method was used to
determine the moisture distribution function, in the
form of a polynomial of 4th degree, at the beginning
and the end of the stabilization of RH (Fig. 4). An
iteration number is set equal to the number of days
corresponding to the moisture stabilization period in
the specimen. The half of the specimen was divided
into eight slices of 10 mm thickness. For each slice,
the RH was calculated before and after stabilization.
The RH gradients were calculated on each day
between the individual slices grad(RH)n,day = RHn,-
day–RHn-1,day (n from 2 to 8; day from 0 to the number
of stabilization days-1, in this case day = 0.21). In
each iteration a further moisture distribution was
calculated assuming that the moisture flowed from the
element of higher RH to the neighbouring one.
n = 1 RHn¼1; day þ 1 ¼ RHn ¼1ð Þ;day
þD�grad RHð Þnþ1 ¼2ð Þ;day
n = 2 do 7 RHn;dayþ1 ¼ RHn;day
þD�grad RHð Þnþ1;day�D�grad RHð Þn;day
83 Page 10 of 15 Materials and Structures (2018) 51:83

n = 8 RHn¼8;dayþ1 ¼ RHn ¼8ð Þ;day
�D�grad RHð Þn ¼8ð Þ;day
The D coefficient was determined, minimizing the
sum of the squared differences of the RH values after
the stabilization determined from the matched func-
tion to the post-stabilization measurement (RHstab)
and the iteratively calculated (RH distribution day 22).
Calculations were made using Microsoft Office
Solver. An example of calculation of D shown in
Table 6.
The calculation of D1 was carried out in the similar
way, however, taking into account the effect of RH on
the result, using the formulas Eqs. 1 and 2. An
iteration number was equal to the number of days
corresponding to the moisture stabilization period.
The D1 coefficient was determined using the RH
values after the stabilization, determined from the
matched function and the post-stabilization measure-
ments. The sum of squared differences between the
above mentioned values was minimized in an iterative
procedure. Calculations were also made using Micro-
soft Office Solver.
4.3 Comparison of moisture diffusion coefficients
A large compliance was found between the moisture
diffusion coefficients determined on the basis of RH
measurements and the distribution functions obtained
from the iterations. The sum of squares of the
difference in experimental and calculated values was
from 0.8 in series B to 43.8 in series T51. The moisture
diffusion coefficients D and D1 are presented in
Table 7. The maximum RH values and RH differences
between the measured values in the 75 mm hole and
the concrete surface, prior to the start of moisture
stabilization in the specimens were also given. The D1
coefficient is approximately 109 higher than D. In the
RH range of 20–75%, which occurs at the beginning of
moisture stabilization, the impact of the maximum RH
and RH gradient on the D1/D ratio is small. This ratio
is largely influenced by the assumed coefficient a. The
difference in moisture diffusion coefficients of the
concrete in A and B specimens was pronounced. The
D coefficient for concrete A (w/c = 0.48) was
0.094 cm2/day. For concrete B (w/c = 0.63), the
D coefficient was 315% higher. Evaluation of concrete
quality A and B, based on the API and D, is
incompatible. The API differentiation in these
concretes (Fig. 5) was much lower. In the case of
concrete specimens T49, T50 and T51, the API
differentiation is larger (about 29 the difference
between the concrete T49 with CEM I 52.5R, and
T50, T51 concrete with CEM II), however, differences
of D coefficient are greater (more than 49). The
lowest value of D coefficient occurred in the concrete
with CEM II/B-V 32.5R. For concrete with CEM II/B-
S 32.5R and CEM I 52.5R, the D coefficients were 39
and 320% higher respectively. The D coefficient better
reflects the different quality of concrete resulting from
a different w/c ratio and probable microcracks than the
API.
5 Conclusions
The performed investigation on radiation shielding
concrete cast in structural elements resulted in the
following conclusions:
The mix design for heavyweight concrete of bulk
density 3168–3317 kg/m3 was developed using barite
and magnetite aggregate and cements blended with fly
ash and blastfurnace slag. The use of CEM II/B-V and
CEM II/B-S cements and w/c ratio of 0.5 resulted in
the concrete compressive strength of 48–50 MPa at
28 days and its significant increase at the age of about
2 years, up to 72–77 MPa.
An original way of measuring the RH distribution
in core specimens from concrete structural elements
was developed, including both measurements inside of
a specimen and on its surface. The method was used to
determine the RH distribution in specimens subjected
to accelerated, unidirectional drying at 65 �C and to
observe changes in the RH distribution during storage
of the specimens in sealed conditions.
The developed procedure for specimens condition-
ing to achieve the target RH using the surface
measurement during moisture stabilization period
allowed the specimen preparation time to be mini-
mized. It was ensured by precisely determining the
moment of decrease of the RH difference between the
surface and the interior of the specimen to the assumed
value.
The air permeability index determined on speci-
mens with stabilized RH = 60 ± 5% showed a dif-
ference in the permeability of bottom and top part of
the 4 m columns: the upper part of the columns
Materials and Structures (2018) 51:83 Page 11 of 15 83
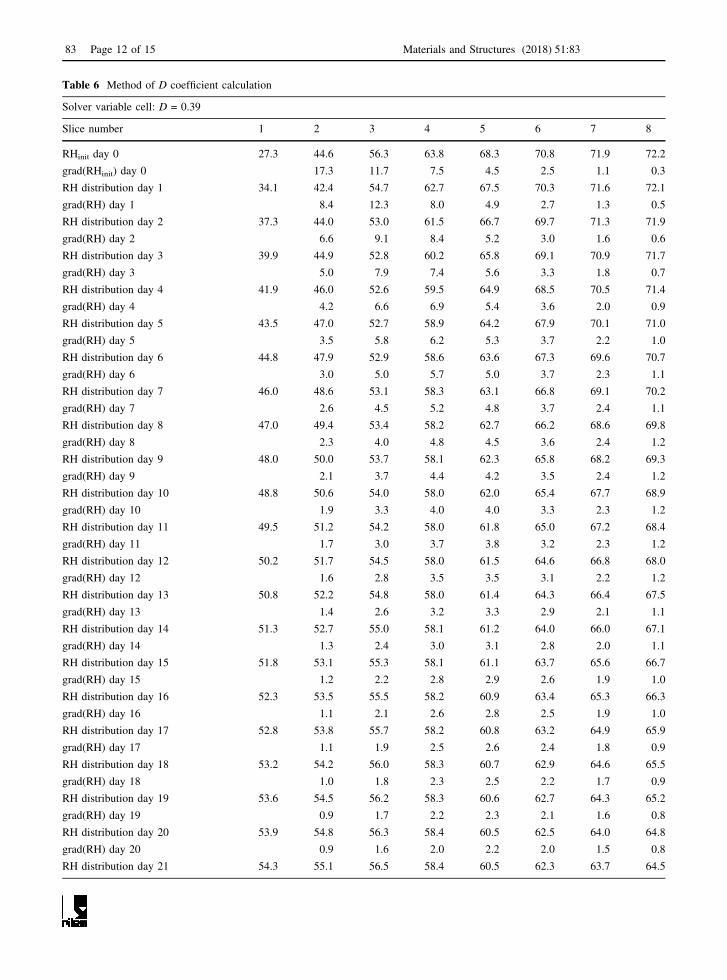
Table 6 Method of D coefficient calculation
Solver variable cell: D = 0.39
Slice number 1 2 3 4 5 6 7 8
RHinit day 0 27.3 44.6 56.3 63.8 68.3 70.8 71.9 72.2
grad(RHinit) day 0 17.3 11.7 7.5 4.5 2.5 1.1 0.3
RH distribution day 1 34.1 42.4 54.7 62.7 67.5 70.3 71.6 72.1
grad(RH) day 1 8.4 12.3 8.0 4.9 2.7 1.3 0.5
RH distribution day 2 37.3 44.0 53.0 61.5 66.7 69.7 71.3 71.9
grad(RH) day 2 6.6 9.1 8.4 5.2 3.0 1.6 0.6
RH distribution day 3 39.9 44.9 52.8 60.2 65.8 69.1 70.9 71.7
grad(RH) day 3 5.0 7.9 7.4 5.6 3.3 1.8 0.7
RH distribution day 4 41.9 46.0 52.6 59.5 64.9 68.5 70.5 71.4
grad(RH) day 4 4.2 6.6 6.9 5.4 3.6 2.0 0.9
RH distribution day 5 43.5 47.0 52.7 58.9 64.2 67.9 70.1 71.0
grad(RH) day 5 3.5 5.8 6.2 5.3 3.7 2.2 1.0
RH distribution day 6 44.8 47.9 52.9 58.6 63.6 67.3 69.6 70.7
grad(RH) day 6 3.0 5.0 5.7 5.0 3.7 2.3 1.1
RH distribution day 7 46.0 48.6 53.1 58.3 63.1 66.8 69.1 70.2
grad(RH) day 7 2.6 4.5 5.2 4.8 3.7 2.4 1.1
RH distribution day 8 47.0 49.4 53.4 58.2 62.7 66.2 68.6 69.8
grad(RH) day 8 2.3 4.0 4.8 4.5 3.6 2.4 1.2
RH distribution day 9 48.0 50.0 53.7 58.1 62.3 65.8 68.2 69.3
grad(RH) day 9 2.1 3.7 4.4 4.2 3.5 2.4 1.2
RH distribution day 10 48.8 50.6 54.0 58.0 62.0 65.4 67.7 68.9
grad(RH) day 10 1.9 3.3 4.0 4.0 3.3 2.3 1.2
RH distribution day 11 49.5 51.2 54.2 58.0 61.8 65.0 67.2 68.4
grad(RH) day 11 1.7 3.0 3.7 3.8 3.2 2.3 1.2
RH distribution day 12 50.2 51.7 54.5 58.0 61.5 64.6 66.8 68.0
grad(RH) day 12 1.6 2.8 3.5 3.5 3.1 2.2 1.2
RH distribution day 13 50.8 52.2 54.8 58.0 61.4 64.3 66.4 67.5
grad(RH) day 13 1.4 2.6 3.2 3.3 2.9 2.1 1.1
RH distribution day 14 51.3 52.7 55.0 58.1 61.2 64.0 66.0 67.1
grad(RH) day 14 1.3 2.4 3.0 3.1 2.8 2.0 1.1
RH distribution day 15 51.8 53.1 55.3 58.1 61.1 63.7 65.6 66.7
grad(RH) day 15 1.2 2.2 2.8 2.9 2.6 1.9 1.0
RH distribution day 16 52.3 53.5 55.5 58.2 60.9 63.4 65.3 66.3
grad(RH) day 16 1.1 2.1 2.6 2.8 2.5 1.9 1.0
RH distribution day 17 52.8 53.8 55.7 58.2 60.8 63.2 64.9 65.9
grad(RH) day 17 1.1 1.9 2.5 2.6 2.4 1.8 0.9
RH distribution day 18 53.2 54.2 56.0 58.3 60.7 62.9 64.6 65.5
grad(RH) day 18 1.0 1.8 2.3 2.5 2.2 1.7 0.9
RH distribution day 19 53.6 54.5 56.2 58.3 60.6 62.7 64.3 65.2
grad(RH) day 19 0.9 1.7 2.2 2.3 2.1 1.6 0.8
RH distribution day 20 53.9 54.8 56.3 58.4 60.5 62.5 64.0 64.8
grad(RH) day 20 0.9 1.6 2.0 2.2 2.0 1.5 0.8
RH distribution day 21 54.3 55.1 56.5 58.4 60.5 62.3 63.7 64.5
83 Page 12 of 15 Materials and Structures (2018) 51:83

exhibited a greater air permeability than the bottom
part by about 20–40%.
The concrete quality evaluation based on the air
permeability index API, determined on specimens
with uniform distribution of RH = 60 ± 5% and after
drying at 105 �C, was dependent on the location of the
core in element and the mix design; the concrete mixes
were qualified from ‘‘very good’’ to ‘‘good’’.
A moisture diffusion model in heavyweight con-
crete during the stage of equalization of RH distribu-
tion in concrete specimens, developed using Microsoft
Office Solver, allowed for estimation of the moisture
diffusion coefficients D and D1.
The evaluation of concrete quality, based on the
API and D coefficient, is found incompatible. The
D coefficient reflects in a better way the different
quality of concrete resulting from a different w/c ratio
and probable microcracks.
The air permeability testing on cores from massive
blocks revealed significant differences in API due to
the change of cement composition: more than 100%
increase was found for CEM I 52.5R in comparison
with CEM II 32.5R. That could support a relationship
with possible microcracking induced by high thermal
gradients.
Acknowledgements The financial support from the National
Center for Research and Development in Poland is gratefully
acknowledged (Project PBSII/A2/15/2014 ‘‘Durability and
efficiency of concrete shields against ionizing radiation in
nuclear power structures’’).
Compliance with ethical standards
Conflict of interest The authors declare that they have no
conflict of interest.
Open Access This article is distributed under the terms of the
Creative Commons Attribution 4.0 International License (http://
creativecommons.org/licenses/by/4.0/), which permits unrest-
ricted use, distribution, and reproduction in any medium, pro-
vided you give appropriate credit to the original author(s) and
the source, provide a link to the Creative Commons license, and
indicate if changes were made.
References
1. Bamonte P, Gambarova PG (2014) Properties of concrete
required in nuclear power plants. In: Infrastructure systems
for nuclear energy. Wiley, Chichester, pp 409–438
2. Kurtis KE, Xi Y, Glinicki MA et al (2017) Can we design
concrete to survive nuclear environments? Concr Int
39:29–35
3. Remec I, Field KG, Naus DJ, Busby JT (2014) Concrete
aging and degradation in NPPs: LWRS program R&D
progress report. Trans Am Nucl Soc 109:403–406
4. Brandt AM (2013) Application of concrete as a material for
anti-radiation shielding—a review. Cem Wapno Beton
18:115–132
5. Baran T, Glinicki MA, Jozwiak-Niedzwiedzka D (2016)
The properties of special cements for shielding
Table 6 continued
Solver variable cell: D = 0.39
Slice number 1 2 3 4 5 6 7 8
grad(RH) day 21 0.8 1.5 1.9 2.0 1.9 1.4 0.8
RH distribution day 22 54.6 55.3 56.7 58.5 60.4 62.2 63.5 64.2
RHstab 54.0 55.0 56.6 58.4 60.2 61.8 63.1 63.9
[(RH distribution day 22)–RHstab]2 0.3 0.1 0.0 0.0 0.0 0.1 0.2 0.1
Solver target cell: sum of [(RH distribution day 22)–RHstab]2 0.8
The example—concrete specimens from column B
Table 7 Calculated
moisture diffusion
coefficients D and D1
Concrete ID D (cm2/day) D1 (cm2/day) D1/D Max RH (%) RH difference (%)
A 0.094 0.938 9.98 65.2 45.4
B 0.390 3.895 9.99 73.0 45.7
T49 0.470 4.717 10.04 69.9 44.0
T50 0.112 0.935 8.35 76.5 55.0
T51 0.156 1.417 9.08 74.7 48.3
Materials and Structures (2018) 51:83 Page 13 of 15 83

constructions in nuclear power plants. Cem Wapno Beton
21:207–215
6. ACI 221R-96 (2001) Guide for use of normal weight and
heavyweight aggregates in concrete reported by ACI
Committee 221. Detroit, MI
7. ACI 304.3R-96 (2004) Heavyweight concrete: measuring,
mixing, transporting, and placing reported by ACI Com-
mittee 304. Detroit, MI
8. Glinicki MA (2015) Długotrwała Funkcjonalnosc Betonu w
Konstrukcjach Osłonowych Elektrowni Jadrowych (Long-
term Performance of Concrete in Shielding Structures of
Nuclear Power Plants). IPPT PAN, Warszawa
9. IAEA (2016) Ageing management of concrete structures in
nuclear power plants. IAEA Nucl Energy Ser NP-T-
3.5:1–372
10. RILEM (1999) Tests for gas permeability of concrete, TC
116-PCD: permeability of concrete as criterion of its dura-
bility. Mater Struct 32:174–179. https://doi.org/10.1007/
BF02481509
11. Liu J, Agostini F, Skoczylas F (2013) From relative gas
permeability to in situ saturation measurements. Constr
Build Mater. https://doi.org/10.1016/j.conbuildmat.2012.
11.092
12. Romer M (2005) Effect of moisture and concrete compo-
sition on the Torrent permeability measurement. Mater
Struct 38:541–547. https://doi.org/10.1617/14321
13. Basheer P, Nolan E (2001) Near-surface moisture gradients
and in situ permeation tests. Constr Build Mater
15:105–114. https://doi.org/10.1016/S0950-
0618(00)00059-3
14. Starck S, Beushausen H, Alexander M, Torrent R (2017)
Complementarity of in situ and laboratory-based concrete
permeability measurements. Mater Struct 50:177. https://
doi.org/10.1617/s11527-017-1037-3
15. Oxfall M, Johansson P, Hassanzadeh M (2016) Long-term
hygrothermal performance of nuclear reactor concrete
containments–laboratory evaluations of measurement
setup, in situ sampling, and moisture flux calculations. Cem
Concr Compos. https://doi.org/10.1016/j.cemconcomp.
2015.10.012
16. Kubissa W, Glinicki MA (2017) Influence of internal rela-
tive humidity and mix design of radiation shielding concrete
on air permeability index. Constr Build Mater 147:352–361.
https://doi.org/10.1016/j.conbuildmat.2017.04.177
17. Anton C, Climent MA, de Vera G et al (2013) An improved
procedure for obtaining and maintaining well characterized
partial water saturation states on concrete samples to be
used for mass transport tests. Mater Struct 46:1389–1400.
https://doi.org/10.1617/s11527-012-9981-4
18. Ahs M, Nilsson L, Haha M (2013) A method to determine
the critical moisture level for unsaturated transport of ions.
Mater Struct 48:53–65. https://doi.org/10.1617/s11527-
013-0167-5
19. Agostini F, Skoczylas F, Masson B (2015) Sealing of con-
crete confining structures of French nuclear reactors. In:
International symposium in brittle matrix composites IPPT
PAN, Warsaw, pp 343–352
20. Jason L, Masson B (2014) Comparison between continuous
and localized methods to evaluate the flow rate through
containment concrete structures. Nucl Eng Des. https://doi.
org/10.1016/j.nucengdes.2014.06.010
21. Wu Z, Wong HS, Buenfeld NR (2015) Influence of drying-
induced microcracking and related size effects on mass
transport properties of concrete. Cem Concr Res. https://doi.
org/10.1016/j.cemconres.2014.10.018
22. Kaplan MF (1989) Concrete radiation shielding: nuclear
physics, concrete properties, design and construction.
Longman Scientific & Technical, New York
23. Gencel O, Brostow W, Ozel C, Filiz M (2010) Concretes
containing hematite for use as shielding barriers. Mater Sci
16:249–256
24. Gustavsson C, Piculell L (2016) Isotherms and kinetics of
water vapor sorption/desorption for surface films of poly-
ion–surfactant ion complex salts. J Phys Chem B
120:6778–6790. https://doi.org/10.1021/acs.jpcb.6b02983
25. Zeng Q, Xu S (2017) A two-parameter stretched exponential
function for dynamic water vapor sorption of cement-based
porous materials. Mater Struct Constr 50:1–13. https://doi.
org/10.1617/s11527-017-0997-7
26. Dong H, Gao P, Ye G (2017) Characterization and com-
parison of capillary pore structures of digital cement pastes.
Mater Struct 50:154. https://doi.org/10.1617/s11527-017-
1023-9
27. Enjilela R, Cano-Barrita PFJ, Komar A et al (2017) Moni-
toring steady state moisture distribution during wick action
in mortar by magnetic resonance imaging (MRI). Mater
Struct. https://doi.org/10.1617/s11527-017-1017-7
28. Bazant ZP, Najjar LJ (1972) Nonlinear water diffusion in
nonsaturated concrete. Cem Concr Res 5:3–20. https://doi.
org/10.1007/BF02479073
29. Zhang J, Hou D, Gao Y, Wei S (2011) Determination of
moisture diffusion coefficient of concrete at early age from
interior humidity measurements. Dry Technol 29:689–696.
https://doi.org/10.1080/07373937.2010.528106
30. Kang ST, Kim JS, Lee Y et al (2012) Moisture diffusivity of
early age concrete considering temperature and porosity.
KSCE J Civ Eng 16:179–188. https://doi.org/10.1007/
s12205-012-1445-4
31. Bazant ZP, Donmez A (2016) Extrapolation of short-time
drying shrinkage tests based on measured diffusion size
effect: concept and reality. Mater Struct 49:411–420.
https://doi.org/10.1617/s11527-014-0507-0
32. Basheer PAM (2001) Permeation analysis. Handb Anal
Tech Concr Sci Technol Princ Tech Appl. https://doi.org/
10.1016/B978-081551437-4.50019-9
33. Zheng Y, Li H (2011) Evaluation of protective quality of
prestressed concrete containment buildings of nuclear
power plants. J Cent South Univ Technol 18:238–243.
https://doi.org/10.1007/s11771
34. Oliveira M, Azenha M, Lourenco PB (2016) Numerical
simulation of humidity fields in concrete. In: International
RILEM conference on materials, systems and structures in
civil engineering. Conference segment on moisture in
materials and structures, Lyngby, Denmark, pp 213–222
35. Jennings HM, Bullard JW, Thomas JJ et al (2008) Charac-
terization and Modeling of pores and surfaces in cement
paste: correlations to processing and properties. J Adv
Concr Technol 6:5–29
36. Zhang Z (2014) Modelling of sorption hysteresis and its
effect on moisture transport within cementitious materials.
Ecole Doctorale Sciences, Ingenierie et Environnement,
Paris Est, Paris
83 Page 14 of 15 Materials and Structures (2018) 51:83
37. Pihlajavaara SE (1968) Studies of the effect of gravitation
on drying with special reference to concrete. J Eng Phys
Thermophys 14:208–217
38. Hedenblad G (1997) Use of mercury intrusion porosimetry
or helium porosity to predict the moisture transport prop-
erties of hardened cement paste. Adv Cem Based Mater
6:123–129. https://doi.org/10.1016/S1065-7355(97)
81595-7
39. Huisman JA, Sperl C, Bouten W, Verstraten JM (2001) Soil
water content measurements at different scales: accuracy of
time domain reflectometry and ground-penetrating radar.
J Hydrol 245:48–58
40. Holmes N, West RP (2013) Enhanced accelerated drying of
concrete floor slabs. Mag Concr Res 65:1187–1198. https://
doi.org/10.1680/macr.13.00142
41. Vinkler M, Vıtek JL (2014) Drying concrete: experimental
and numerical modeling. J Mater Civ Eng 28:1–8. https://
doi.org/10.1061/(ASCE)MT.1943-5533.0001577
42. Zhang X, Zhao H (2015) Characterization of moisture dif-
fusion in cured concrete slabs at early ages. Adv Mater Sci
Eng 2015:1–10. https://doi.org/10.1155/2015/154394
43. Baroghel-Bouny V, Mainguy M, Lassabatere T, Coussy O
(1999) Characterization and identification of equilibrium
and transfer moisture properties for ordinary and high-per-
formance cementitious materials. Cem Concr Res
29:1225–1238. https://doi.org/10.1016/S0008-8846(99)
00102-7
44. Fib (2013) Fib model code for concrete structures 2010.
https://doi.org/10.1002/9783433604090
Materials and Structures (2018) 51:83 Page 15 of 15 83