permian basin - encana · permian basin *estimated inventory based on 450-660 ft spacing ... •...
TRANSCRIPT
ENCANA CORPORATION
Permian Basin
Jeff Balmer, PhDVice-President & General Manager, Southern Operations
2
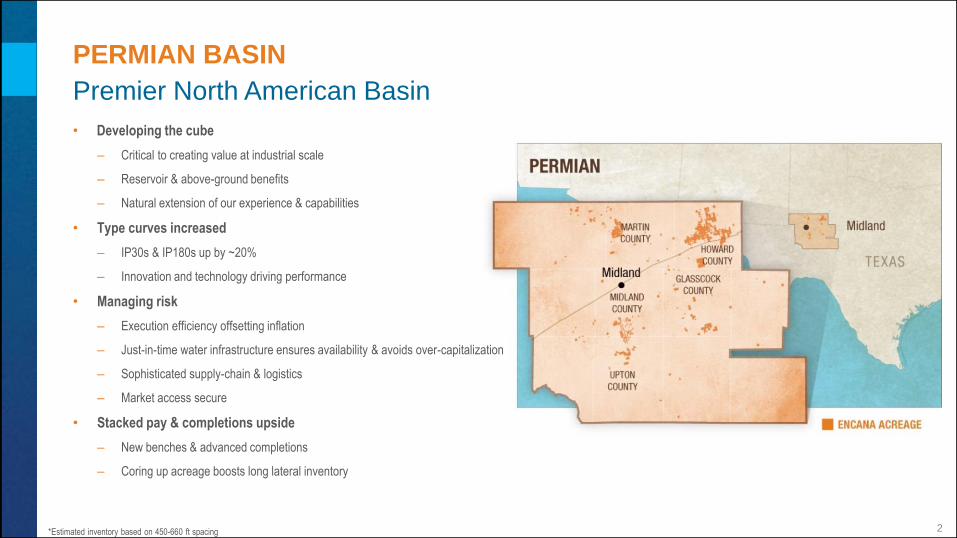
Premier North American Basin
PERMIAN BASIN
*Estimated inventory based on 450-660 ft spacing
• Developing the cube
– Critical to creating value at industrial scale
– Reservoir & above-ground benefits
– Natural extension of our experience & capabilities
• Type curves increased
– IP30s & IP180s up by ~20%
– Innovation and technology driving performance
• Managing risk
– Execution efficiency offsetting inflation
– Just-in-time water infrastructure ensures availability & avoids over-capitalization
– Sophisticated supply-chain & logistics
– Market access secure
• Stacked pay & completions upside
– New benches & advanced completions
– Coring up acreage boosts long lateral inventory

3
ENCANA’S PERMIAN ACREAGE
Core Position in Midland Basin
Martin
Midland
Howard
Glasscock
Upton Reagan
Active ECA Rigs
Encana Land
Basin Core
• In the Permian, execution efficiency at industrial
scale is going to be critical
• Industry leader in driving efficiency at scale
Cowden Pad Multi-Spread Operations
4
0
20,000
40,000
60,000
80,000
PXD ECA FANG XOM CXO EGN RSPP OXY END CVX CPE LPI QEP APA PE
Gro
ss O
pe
rate
d P
rod
uct
ion
(B
OE/
d)
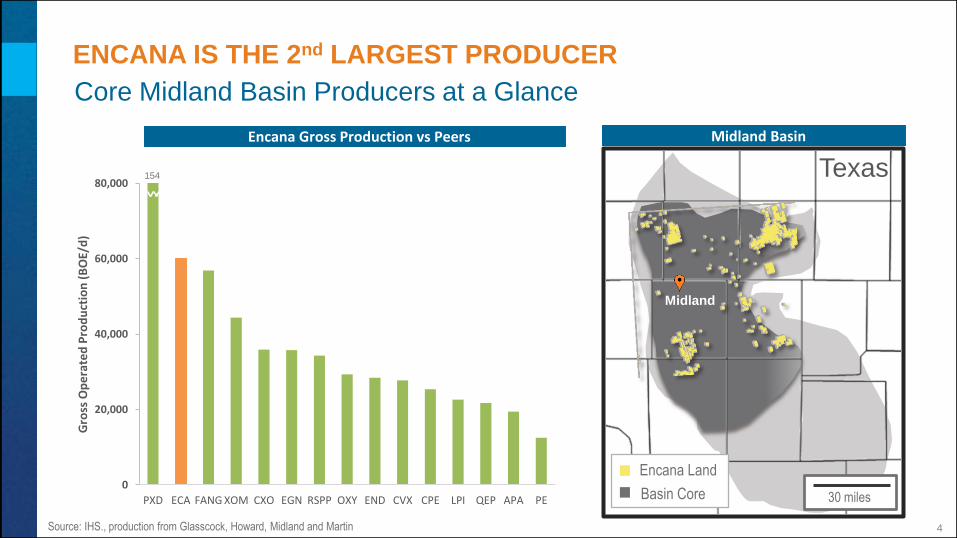
ENCANA IS THE 2nd LARGEST PRODUCER
Core Midland Basin Producers at a Glance
Source: IHS., production from Glasscock, Howard, Midland and Martin
Midland BasinEncana Gross Production vs Peers
154
30 miles
Midland
Texas
Encana Land
Basin Core

5
CUBE DEVELOPMENT ABOVE-GROUND BENEFITS
Development at Industrial Scale
• Highly efficient, agile development
• Multi-well pads
– Higher utilization of services & infrastructure
• Multiple drilling rigs and frac spreads on a pad
– Rapid cycle times
– Accelerated learnings
• Integrated supply chain
– Leveraging economies of scale
– Centralized planning and logistics
Cube Development
Above Ground Benefits
Multi-well Pads
Multi-rig, Multi-
spread
Integrated Supply Chain
Re-occupied facilities
Reliable market access
Water Manage-
ment

6
• Re-occupied infrastructure
– Multiple wells sharing infrastructure yields
scale efficiency
– Continued high utilization of wellsite
facilities through re-occupation
• Reliable market access
– Pipe based gathering through Medallion
– Provides access diversity of markets
CUBE DEVELOPMENT ABOVE-GROUND BENEFITS
Practical Infrastructure Solutions
RAB Davidson Re-occupied Facilities
7
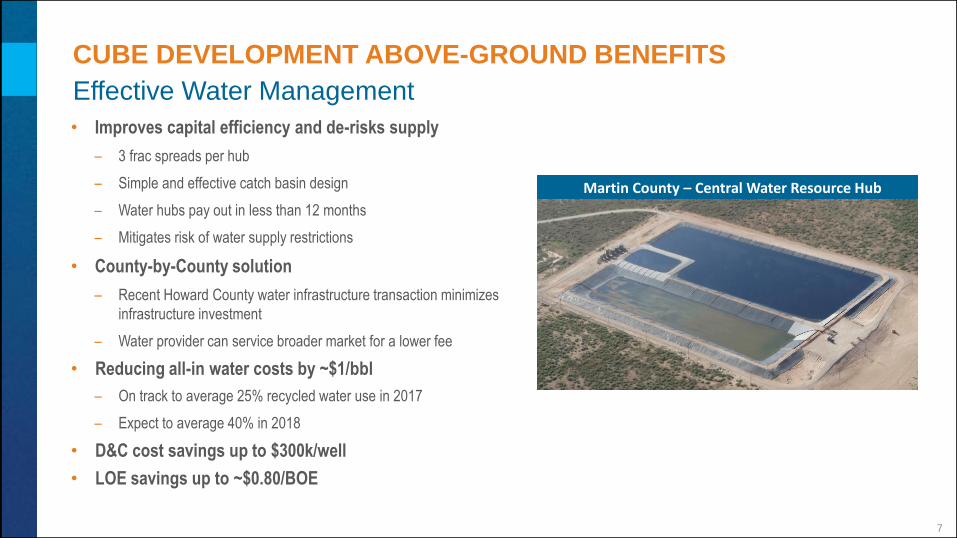
• Improves capital efficiency and de-risks supply
– 3 frac spreads per hub
– Simple and effective catch basin design
– Water hubs pay out in less than 12 months
– Mitigates risk of water supply restrictions
• County-by-County solution
– Recent Howard County water infrastructure transaction minimizes
infrastructure investment
– Water provider can service broader market for a lower fee
• Reducing all-in water costs by ~$1/bbl
– On track to average 25% recycled water use in 2017
– Expect to average 40% in 2018
• D&C cost savings up to $300k/well
• LOE savings up to ~$0.80/BOE
CUBE DEVELOPMENT ABOVE-GROUND BENEFITS
Effective Water Management
Martin County – Central Water Resource Hub

8
INNOVATION SUCCESS
Identifying Optimal Completion Design and Geometry
• Applying advanced completions to high-
density, stacked development
• Key principles:
– Tight cluster spacing and optimal hydraulics
maximize fracture surface area
– Clean, non-guar based fluids lead to better
fracture conductivity
– Fine grained proppant maximizes fracture
complexity
• Improved recovery from stacked pay reservoir
– Effective draw-down within cube
• Continued evolution and data-driven refinement

9
CUBE DEVELOPMENT RESULTS
• Accelerated learning
– Each pad producing stronger wells
– Abbie Laine outperforming RAB Davidson Phase 1 by 22% after
180 days
– RAB Davidson 2 outperforming RAB Davidson Phase 1 by 28%
after 170 days
• 45 ECA cube wells on production
– Abbie Laine and RAB Davidson Phase 2 continue to lead industry
– RAB Davidson Phase 1 among the best results
– 20 additional cube wells scheduled to be on production early Q4
• Industry dataset is all wells at >10 total wells per
section
– ~930 wells, 17 operators, 7 counties
Boosting Permian Productivity
*Well results normalized to 7500' lateral
Large Scale Development Performance Comparison
Abbie Laine RAB Davidson Phase 1
RAB Davidson Phase 2Peer Large Pads
ECA leading performance in
large scale development
0
20
40
60
80
100
120
140
0 30 60 90 120 150 180 210 240 270
Ave
rag
e C
um
ula
tive
Pro
du
cti
on
/we
ll (
MB
OE
)*
Days

10
0
25
50
75
Peer 1 Peer 2 ECA Peer 3 Peer 4 Peer 5 Peer 6 Peer 7 Peer 8 Peer 9 Peer 10 Peer 11 Peer 12 Peer 13 Peer 14 Peer 15 Peer 16
Oil P
rod
ucti
on
IP
180/1
,000ft
(b
bls
/d)
WELL PRODUCTIVITY
Encana Wells Outpacing Peer Results
Data sourced from IHS, includes Midland Basin data from 2014 onward. Peers include APA, AREX, CPE, CVX, CXO, EGN, END, EPE, FANG, LPI, OXY, PXD, QEP, RSPP, SM and XOM
Producers with high density stack development

11
• D&C well costs held flat countering inflation
– 20% increase in service cost offset with efficiencies
– Performing amongst the top operators on days and cost
– Managing shallow flow zones with 3 string design
• 52% reduction in drilling days
– Limiter approach to maximize footage per day
– High performance water based mud
– Advanced survey tools and mud motors
PERMIAN CAPITAL EFFICIENCY
Leading Operator
Normalized D&C Cost/1,000’ vs Peers**
Drilling Days vs Depth
*Normalized to 7,500’. **Data sourced from latest peer IR presentations. Peers include APA, CPE, FANG, LPI, OXY, PE, PXD, QEP, and SM
0
5,000
10,000
15,000
20,000
0 5 10 15 20 25 30
Measu
red
Dep
th (
ft)
Days
2014 Average
2015 Average
2016 Average
2017 Average YTD
Pacesetter
0.0
0.2
0.4
0.6
0.8
1.0
Peer 1 ECA Peer 2 Peer 3 Peer 4 Peer 5 Peer 6 Peer 7 Peer 8 Peer 9
MM
$/1
000’

12
0
25
50
75
100
0 30 60 90
Cu
mu
lati
ve P
rod
ucti
on
(M
BO
E)
Producing Days
Advanced Completion Pad Average
Pre-2017 Wells
2017 Wells
2017 UPDATED Type Curve
2017 ORIGINAL Type Curve
WOLFCAMP
Midland/Upton County
Midland/Upton WCA/WCB Type Curve
IP180 = 800 BOE/d
EUR = 1,100 MBOE
D&C = $5.6 MM (incl. advanced completions scope)
Lateral Length = 7,500’
All metrics based on $50/bbl WTI, $3.00/MMBtu NYMEX
Type Well Metrics – ECA Net
Atax IRR (%) 35-47%
Operating Margin ($/BOE) $30
WCA
ECA Leases
WCBWCC

13
0
20
40
60
80
100
120
140
160
180
0 30 60 90 120 150 180
Cu
mm
ula
tive P
rod
ucti
on
(M
BO
E)
Producing Days
2017 Average Well 2017 UPDATED Type Curve
LOWER SPRABERRY
Martin, Midland/Upton, Glasscock
Martin Lower Spraberry Type Curve
IP180 = 650 BOE/d
EUR = 1,020 MBOE
D&C = $5.4 MM (incl. advanced completions scope)
Lateral Length = 7,500 ft
Type Well Metrics – ECA Net
Atax IRR (%) 39-54%
Operating Margin ($/BOE) $30
All metrics based on $50/bbl WTI, $3.00/MMBtu NYMEX

14
EXPANDING MARGINS
Reducing Operating Costs
• Improving efficiencies
– Company-wide effort
– Accountability at the operator level
• Working smarter
– >80% of produced water on pipe
– >70% of production on remote monitoring and control
• Negotiating the best price
~30%Improvement in
operating costs
Permian Direct Operating Cost Reductions
$/BOE
$0
$2
$4
$6
$8
$10
$12
2015 2016 2017F

15
Permian
MIDSTREAM AND MARKETING OVERVIEW
Gathering system links production to
pipeline hubs
Permian
• Majority of oil production gathered via
pipeline with access to multiple physical
markets
• Firm gas gathering and NGL processing
with access to Waha and Mt. Bellvieu
markets
• Secured firm, low-cost pipeline capacity
to Gulf Coast refining/export markets
(Enterprise Echo Pipeline 2018)
• No take or pay commitments
Colorado
City
Midland
Crane
Pipelines connect to
Cushing and Gulf Coast
Permian: Proximity to market and environment
of responsive infrastructure development
Secured capacity on Enterprise (Echo
Pipeline) adds market diversity and reduces physical risk
(2018)

16
PERMIAN
5 Year Growth Profile
-
40
80
120
160
200
240
2017F 2018F 2019F 2020F 2021F 2022FM
BO
E/d
• >50% of Encana’s capital directed to the
Permian in 2018
• Permian production expected to grow 3x
‒ 5 year CAGR 25%
• Quality inventory with scale
• No infrastructure or midstream limitations
• Minimal vertical program
Five Year Production Profile