permian basin flaring outlook - news and blogs
TRANSCRIPT

PERMIAN BASIN FLARING OUTLOOK
JANUARY 2021
CONDENSED REPORT
JANUARY 2021
I. Summary of findings
II. Review of historic flaring trends and drivers
III. Base case outlook to 2025
IV. Evaluation of alternative policy scenarios
Index
2
JANUARY 2021
I. Summary of findings
II. Review of historic flaring trends and drivers
III. Base case outlook to 2025
IV. Evaluation of alternative policy scenarios
Index
3

JANUARY 20214
Mandate and purpose Methodology and data
• The Environmental Defense Fund has hired
Rystad Energy to assess upstream flaring in the
Permian basin, focusing on the state of Texas.
• The purpose of the project is to understand the
effect of regulatory policies seeking to reduce
overall flaring.
• Rystad Energy conducted this analysis during
July and August 2020.
• The project is divided into three pieces:
• Evaluating the historic flaring taking place in
the Permian in order to understand the
underlying drivers of flaring.
• Evaluate the effect of policies (provided by
EDF) on flaring intensities and total flared
volumes towards 2025.
• Evaluate the economic impact of the
aforementioned policy alternatives as it
pertains to stakeholders (companies, royalty
owners, and governments).
• Rystad Energy has built a comprehensive
database on global upstream production and
flaring.
• For most US states, this database is based on
operator reported data, published by regulatory
agencies (RRC in the case of Texas).
• Rystad Energy quality checks this data, e.g. by
comparing them to other sources (satellite data),
mathematical quality checks and consistency
checks. In addition, we adjust data for reporting
delays and lack of reporting.
• Flaring from gathering, processing and transport
(midstream) facilities is not included in this report.
• Analysis in this report is based on the resulting
dataset, provided on a lease level with a monthly
resolution.
• We have excluded year-to-date 2020 from our
analysis as we believe shut-ins and extraordinary
circumstances have created noise in the data set.
• This report focuses on the Permian Basin in
Texas, but some references are made to the
entire basin (including the New Mexico portion).
Project parameters and purpose
Source: Rystad Energy research and analysis

JANUARY 20215
Findings – Drivers of flaring
• Flaring of gas in the Permian is not distributed
equally across leases but concentrated on a
subset of leases with high flaring intensities1.
More than half of Permian oil-producing leases
had a flaring intensity below 2% over the period
2015 to 2019.
• To identify the drivers of flaring in the basin, we
have classified flaring among four groups:
• The level proven possible by the best leases
(“Top performers operational flaring”),
defined as the average of leases with less
than 2% cumulative flaring intensity.
• Event-driven flaring: Events resulting in
temporary increases in flaring intensity.
• Long-term routine flaring: Flaring
consistently higher than the Top performers.
• Short-term routine flaring: Wells where
flaring converges to Top performers levels
within 12 months.
• Of these four groups, event-driven flaring makes
up 56% of total flaring, temporary routine flaring
26%, long-term routine flaring 11%, and top
performers the remaining 7%2.
• Consequently, most flaring stems from wellsite or
midstream issues. These events were naturally
exaggerated when overall gas infrastructure was
running at or near maximum capacity (Q3’18 –
Q3’19).
• Large events (e.g. midstream outages in Martin
and Howard county in 2018) had outsized impact
on the basin’s overall flaring intensity in recent
years.
• Small events are seen regularly for certain
operators where gathering infrastructure is
unreliable or takeaway capacity is not secured.
• Temporary routine flaring tends to follow
completion activity, as even the best wells tend to
flare more in the initial months’ production.
Temporary routine flaring has fluctuated in line
with changes in activity. The Midland basin
particularly has seen growth in temporary routine
flaring intensity over the last few years.
• Most of the long-term routine flaring in the
Permian is taking place on a small subset of
leases. 60 leases make up about 50% of long-
term routine flaring.
Event-driven and temporary routine are flaring key drivers
1: Flared gas as a percentage of gross gas production 2: For calendar year 2019Source: Rystad Energy research and analysis

JANUARY 2021
Baseline flaring outlook1
• An oil price (WTI) of $45/bbl and gas price (Henry
Hub) of $3/MMBtu is forecast to result in about 340
wells started in the Texas Permian per month. This
compares to a 2019 average of about 420 wells per
month.
• This activity level is sufficient for rich gas production
to increase from a 2019 average of 11.4 Bcf/d to a
2025 average of 13.7 Bcf/d.
• Under a no-policy change assumption, total flaring
is forecast to revert to 2019 volumes by 2025
(yearly average of about 460 MMcf/d). 2020 flaring
volumes are down significantly from 2019 volumes
due to impact of shut-ins and reduced activity
catalyzed by a global supply-demand imbalance
that was exacerbated by the COVID-19 pandemic.
• The lower activity means that the average well age
will increase towards 2025. This results in a slight
decline in flaring intensity, from 4.1% on average in
2019 to 3.4% on average in 2025.
• Top performers flaring volume remains at around 50
MMcf/d through the period, implying that it is likely
feasible to reduce Permian Texas flaring from the
baseline outlook by some 90%2.
6
Flaring expected to increase towards 2025 in a $45/bbl scenario
1: Represents business as usual scenario; 2: A 90% reduction in flaring assumes all leases meet top performers operational flaring benchmark, which results in a long-term basin intensity of 0.3%-0.4% (2025 baseline 3.4%). Source: Rystad Energy research and analysis
0
100
200
300
400
500
600Forecast period: 2020-2025
WTI: $45 / bbl
Henry hub: $3 / mcf
Texas Permian flared gas by category
Million cubic feet per day
Event driven flaring
Routine flaring
Top performers operational flaring

JANUARY 2021
Baseline flaring outlook1
• An oil price (WTI) of $45/bbl and gas price (Henry
Hub) of $3/MMBtu is forecast to result in about 340
wells started in the Texas Permian per month. This
compares to a 2019 average of about 420 wells per
month.
• This activity level is sufficient for rich gas production
to increase from a 2019 average of 11.4 Bcf/d to a
2025 average of 13.7 Bcf/d.
• Under a no-policy change assumption, total flaring
is forecast to revert to 2019 volumes by 2025
(yearly average of about 460 MMcf/d). 2020 flaring
volumes are down significantly from 2019 volumes
due to impact of shut-ins and reduced activity
catalyzed by a global supply-demand imbalance
that was exacerbated by the COVID-19 pandemic.
• The lower activity means that the average well age
will increase towards 2025. This results in a slight
decline in flaring intensity, from 4.1% on average in
2019 to 3.4% on average in 2025.
• Top performers flaring volume remains at around 50
MMcf/d through the period, implying that it is likely
feasible to reduce Permian Texas flaring from the
baseline outlook by some 90%2.
7
Flaring has dropped significantly in 2020, driven by global supply-demand shocks
1: Represents business as usual scenario; 2: A 90% reduction in flaring assumes all leases meet top performers operational flaring benchmark, which results in a long-term basin intensity of 0.3%-0.4% (2025 baseline 3.4%). 3: Through July 2020. Source: Rystad Energy research and analysis
Jan-20
Mar-20
May-20
Jul-20
0
100
200
300
400
500
600
Texas Permian flared gas by category
Million cubic feet per day
Event driven flaring
Routine flaring
Top performers operational flaring
Flaring
actuals
20203
Forecast period: 2020-2025
WTI: $45 / bbl
Henry hub: $3 / mcf

JANUARY 2021
Effect of Policy 1: RRC Data Sheet Effect of Policy 2: Gas Capture Targets
• On Nov. 4th, 2020 the Texas Railroad Commission enacted a new
reporting form (“Statewide Rule 32 Exception Data Sheet”), seeking to
address flaring. The form potentially shortens the time exclusion period in
some instances and requires operators to provide more details and
analysis on their reasons for flaring.
• The new form is not prescriptive, and as such its effect is expected to
stem from changes in operator choices and actions. These changes are
driven by an increased availability of information and analysis, as
required by the form. The soft nature of this proposal also means that
there is considerable uncertainty as to its effect over time.
• If operators move to capture the assumed zero-cost flaring reductions
(and realizing 50% of this potential) we expect 2025 flaring intensity to be
2.7%, 0.7% lower than baseline, approximately 92 million cubic feet per
day less than expected baseline volumes.
• Reductions are limited by factors including higher levels of routine flaring
in the early months of a well’s life and the soft nature of the policy.
• In addition to the baseline estimates and the changes to the form
implemented by the RRC, we have evaluated the effect of a potential gas
capture statute. The policy assumes a gradual implementation,
culminating in a 98% gas capture requirement from 2024 onwards.
• The policy would have greatest effect from 2023 onwards, reducing
flaring in 2023, 2024 and 2025 compared to our baseline outlook by 13%,
42% and 42%, respectively.
• Assuming a strict adoption of the policy, this is likely a conservative
estimate. Most companies would likely prefer to have a buffer between
the requirement and their measured flaring intensity.
• A gas capture requirement of 98% will largely eliminate routine flaring
and cut event-driven flaring by about a quarter.
• Overall, the gas capture plan achieves a basin-wide 1.8% flaring
intensity, realizing approximately half of the reduction potential between
the business-as-usual outlook flaring intensity (3.4%) and the forecasted
top performers benchmark intensity (0.4%).
8
A gas capture rule would significantly reduce flaring, with limited cost
Source: Rystad Energy research and analysis
Flared gas with and without Policy 2 Gas Capture Regulations
Million cubic feet per day
200
250
300
350
400
450
500
2021 2022 2023 2024 2025
Flared gas baseline Flared gas from Texas RRC Data Sheet
Flared gas with and without Policy 1 Texas RRC proposal
Million cubic feet per day
-3%
-8%-20%-15%
-11%
200
250
300
350
400
450
500
2021 2022 2023 2024 2025
Flared gas baseline Flared gas with gas capture targets met
90% 94% 96% 98% 98%
Capture Targets
-4%
-5%-42%
-42%
-13%

JANUARY 2021
Economic impact of regulation
• Soft policies will inherently not result in significant
costs for the operator. The volume potential for
Policy 1 assumes zero abatement cost.
• For Policy 2, the picture is more complicated. A
significant part of flaring is assumed zero-cost to
avoid, while the remaining part is assumed to cost
$3/MMBtu to avoid. This abatement cost is
considered a representative average, with the
purpose of providing a reasonable policy cost
estimate. More detailed economic impact
assessment is outside the scope of this report.
• Such a cost level would result in considerable value
creation relative to the baseline with the 98%
capture rule: About 440 MUSD of wellhead revenue
from increased production, at a cost of about 50
MUSD totaling approximately $390 MUSD of value
creation captured in 2025.
• This cost would not be equally distributed amongst
operators. Most of the companies incurring costs
are smaller operators.
• In 2025, fewer than 20% of the affected operators
would incur costs above $100,000 per year.
9
Policy 2 offers more than double the potential value as Policy 1 by 2025
Source: Rystad Energy research and analysis
Annual wellhead value creation by policy relative to baseline
Million USD
-
50
100
150
200
250
300
350
400
450
2021 2022 2023 2024 2025
Policy 1 (Texas RRC Proposal)
Policy 2 (Gas capture targets)

JANUARY 202110
Interpretation of findings
• The finding that most of oil production in the Permian has
a low (sub-2%) flaring intensity indicates that considerable
cuts are possible. Top performers’ flaring intensity (~0.4%)
is achievable long-term with the right set of policies,
incentives and collaboration across the value chain. Note
that neither of the policy alternatives analyzed in this
report achieve a basin-wide level in line with top
performers (0.4%).
• The high pace of development seen in 2019 resulted in
high levels of flaring, as operators and midstream
providers were not been able to keep up with the growth in
gas production.
• A slower pace of development and increased focus on
flaring has had an effect, but the 2020 drop is likely
temporary.
• Event-driven flaring is an issue with many underlying
drivers. It is our understanding that interface issues
between operators and midstream companies is a key
issue along with more tangible examples such as
equipment reliability, system design and robustness. This
also means that addressing it would require additional
investments.
• The relatively ease at which routine flaring can be reduced
means that event-driven flaring is not pushed lower to the
same extent. This does not imply that event-driven flaring
is not addressable. Stricter operator policies and
regulations could further reduce event-driven flaring with
minimal investment.
• Hub-prices and the fundamental cost of gathering and
processing implies that gas at the wellhead is valuable
(around $2/MMBtu). Operators may see much lower
prices over the short term. We assume over the long-term
that operators will be able to close this gap.
• This implies that gas is fundamentally valuable, and
operators are incentivized to increase capture.
• Despite being valuable per unit of gas, the value of flared
gas is still often immaterial relative to the overall
hydrocarbon stream including liquids. Without additional
external incentives or regulation, some operators may
choose to continue to flare despite the potential for value
creation through gas capture simply because it is not a
large value driver.
• Negative effects of prescriptive regulations relate primarily
to smaller operators. Given the number of companies
involved and the limited overall effect on the larger
system, this should be a solvable problem.
• The forecast outlines a scenario with moderate production
growth, which is significantly easier to manage compared
to historical growth rates. The impact on flaring if oil prices
go higher is a key concern. Also given the large share of
event-driven flaring, the system would likely benefit from
some buffer capacity to compensate for unforeseen
events or developments.
Rystad Energy comments: Solving the interface issue key enabler of lower flaring
Source: Rystad Energy research and analysis

JANUARY 2021
I. Summary of findings
II. Review of historic flaring trends and drivers
III. Base case outlook to 2025
IV. Evaluation of alternative policy scenarios
Index
11

JANUARY 2021
Permian has experienced tremendous growth in production of associated gas
Permian gross wellhead gas volumes by end-useBillion cubic feet per day
• Permian gas production grew significantly during the last 5 years, with volumes of rich gas produced rising from approximately 5.5 bcf per day in early 2015 to over 16 bcfper day by the end of 2019, growing 3-fold over the 5-year period.
• Volumes of flared gas have varied over the period. In the last 5 years, flared gas peaked at ~670 mmcfd in December 2018, nearly double the period average.
• The variations in flaring have been driven by a number of factors including but not limited to operator economic considerations, insufficient midstream infrastructure, macro-environmental effects on prices, and varying regulations.
1: Other Gas includes volumetric loss at wellhead due to lease condensate separation and removal of non-hydrocarbon components, gas consumed at the wellsite, and some reinjected volumes.Source: Rystad Energy ShaleWellCube
12
0
2
4
6
8
10
12
14
16
18
Jan-15 Jul-15 Jan-16 Jul-16 Jan-17 Jul-17 Jan-18 Jul-18 Jan-19 Jul-19
Sold Gas
Flared Gas
Other Gas1
Entire Permian

JANUARY 2021
Recent vintages account for the majority of flared volumes
Flared volumes by well vintage1 (production start year)Million cubic feet per day
• Overall gas volumes flared increased dramatically starting in 2018 and extending into 2019; however, flared volumes has declined since mid-2019.
• The 2018 and 2019 well vintages account for a large majority of flared volumes, totaling in excess of 400 MMcfd of flared volumes in certain months in 2019.
• Generally, across the last six years, the most recent vintages flare the largest volumes, meaning that new production flares a significant amount.
1: Flared gas is grouped by the year of each well’s completion to show flaring contributions by year of activity.Source: Rystad Energy research analysis, ShaleWellCube
13
0
100
200
300
400
500
600
700
800
Jan-1
5
Ma
r-1
5
Ma
y-1
5
Jul-1
5
Sep-1
5
No
v-1
5
Jan-1
6
Ma
r-1
6
Ma
y-1
6
Jul-1
6
Sep-1
6
No
v-1
6
Jan-1
7
Ma
r-1
7
Ma
y-1
7
Jul-1
7
Sep-1
7
No
v-1
7
Jan-1
8
Ma
r-1
8
Ma
y-1
8
Jul-1
8
Sep-1
8
No
v-1
8
Jan-1
9
Ma
r-1
9
Ma
y-1
9
Jul-1
9
Sep-1
9
No
v-1
9
pre-2015 2015 2016 2017 2018 2019
Entire Permian

JANUARY 2021
Permian flaring intensity on the decline after spikes in 2018 -2019
Permian flaring intensity, 2015 - 2019Ratio of flared gas to gross wellhead gas production
• Flaring intensity is calculatedas the ratio of flared gasvolumes to gross gasproduced.
• After falling below 2% in 2017,flaring intensity went on tosurpass the 5% threshold forthe first time in approximately3 years.
• Average flaring intensity in thePermian fell to 2.8% at the endof 2019, a year after peakingat 5.2%.
• The increase in flaringintensity was largely driven byinsufficient gas gathering andtakeaway infrastructure for therising production levels withinthe Permian.
Source: Rystad Energy ShaleWellCube
14
4.4%
3.3%
2.7%
4.0%3.8%
0%
1%
2%
3%
4%
5%
6%
7%
8%
Jan-15 Jan-16 Jan-17 Jan-18 Jan-19
Annual average
Monthly flaring intensity
Entire Permian
JANUARY 2021
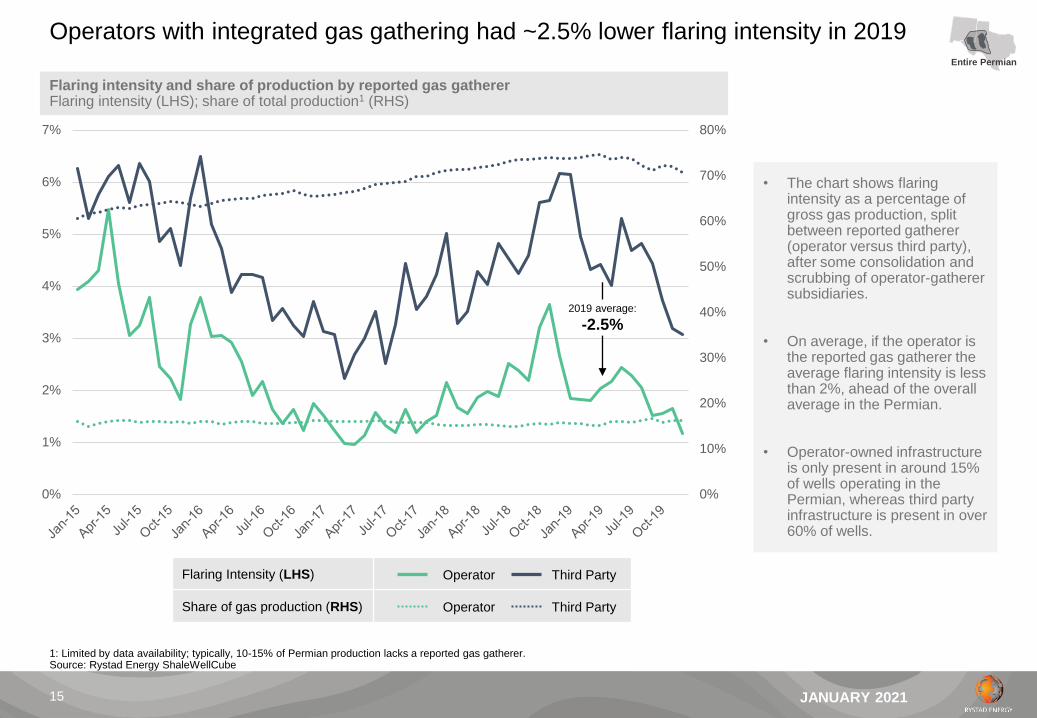
Operators with integrated gas gathering had ~2.5% lower flaring intensity in 2019
Flaring intensity and share of production by reported gas gathererFlaring intensity (LHS); share of total production1 (RHS)
• The chart shows flaring intensity as a percentage of gross gas production, split between reported gatherer (operator versus third party), after some consolidation and scrubbing of operator-gatherer subsidiaries.
• On average, if the operator is the reported gas gatherer the average flaring intensity is less than 2%, ahead of the overall average in the Permian.
• Operator-owned infrastructure is only present in around 15% of wells operating in the Permian, whereas third party infrastructure is present in over 60% of wells.
1: Limited by data availability; typically, 10-15% of Permian production lacks a reported gas gatherer.Source: Rystad Energy ShaleWellCube
15
0%
10%
20%
30%
40%
50%
60%
70%
80%
0%
1%
2%
3%
4%
5%
6%
7%
Flaring Intensity (LHS)
Share of gas production (RHS)
Operator Third Party
Operator Third Party
Entire Permian
2019 average:
-2.5%

JANUARY 202116
Flaring intensity tends to decrease over a well’s lifetime
1: Data shown based on leases with one well has been drilled to date, indicative of well-level flaring and flaring intensity. 2: Month 1 is the first full month of productionSource: Rystad Energy ShaleWellCube
0
400
800
1200
1600
0 1 2 3 4 5 6 7 8 9 10 11 12
Not Flared
Flared
0%
5%
10%
15%
20%
25%
30%
0 1 2 3 4 5 6 7 8 9 10 11 12
2015 2016 2017 2018 2019
• Average total gas production tends
to peak in the second cumulative
month. Average non-flared gas
production also peaks in the
second cumulative month while
average flared gas volumes tends
to peak in month 02.
• In general, after six months the
average amount of flared gas
begins to flatten as total gas
production continues to gradually
decrease.
• Across the last five years average
flaring intensity in cumulative
month zero has decreased
substantially from a high of 25% in
2015 to 10% in 2019. This is
remarkable given that single-well
leases often lack nearby
infrastructure.
• Other than in 2015, average flaring
intensity across years converged
about 5% by month four and
stayed around the same intensity
with a few fluctuations for the next
eight cumulative months.
Average gas production by end use, average for completions 2015-2019
Thousand cubic feet per day
Average flaring intensity per production month by completion year
Percentage
Months producing2
Months producing2
Single well leases only1
Single well leases only1
Entire Permian

JANUARY 2021
10% of gross gas production accounted for 57% of flaring the past five years
Lease production and flaring ranked by flaring intensity1
Flaring intensity (x-axis) versus cumulative share of production and flaring (y-axis)
51%
90%
44%
86%
3%
43%
0.5% 5% 50%20%2%
0%
10%
20%
30%
40%
50%
60%
70%
80%
90%
100%
0% 1% 10% 100%
Share of production
Flaring intensity (flared gas / total gas)
Gross gas production
Oil production
Flared gas production
• The plot shows flaring intensity (flared gas divided by gross gas production) against cumulative production (gas, oil, and flared volumes broken out separately), calculated over the period 2015-2019.
• 51% of produced gross gas came from leases with flaring intensity below 1% on average over the period, accounting for only 3% of total flaring in the basin.
• Conversely, the last 10% of gas production and 14% of oil production accounted for approximately 57% of flared gas during the period.
• This indicates that the majority of flaring comes from a relatively small number of leases, generally flaring over 10% of produced gas.
• 3% of leases flared 100% of produced gas during the period.
1: Each point represents a leaseSource: Rystad Energy research and analysis; ShaleWellCube
17
Entire Permian
10% and 14% of gross
gas and oil production
respectively
contributed 57% of
total flared volumes the
last five years
Poor performance

JANUARY 202118
Leases with low flaring used as a benchmark for top performers’ operational flaring
1: Each point represents a lease2: Average well level monthly flaring intensity. Includes wells completed during 2015-2019Source: Rystad Energy research and analysis
62%
7%
0.5% 5% 50%20%2%0%
10%
20%
30%
40%
50%
60%
70%
80%
90%
100%
0% 1% 10% 100%
Flaring intensity (flared gas / total gas)
Gross gas production
Flared gas production
Other leases
2%flaring intensity
Top performing leases
Share of production
Lease production and flaring ranked by flaring intensity1
Flaring intensity (x-axis) versus cumulative share of production and flaring (y-axis)Average flaring intensity per well2
Months from production start, flaring intensity (percent)
3.0%
1.1% 0.7% 0.7% 0.6% 0.6% 0.4% 0.4% 0.4% 0.4% 0.4% 0.3%
26.3%
18.6%
14.0%
11.9%10.7%
10.0%
7.8% 7.6% 7.4%6.8% 6.5% 6.4%
0 1 2 3 4 5 6 7 8 9 10 11
Months on production
Top performing leases
Other leases
Using leases that have flared less than 2% cumulatively the past five years, we establish a ‘top performers’ benchmark. We further use this
benchmark to compare observed flaring against what could be achieved if all wells in the basin performed in line with these top performers.
Well-level flaring intensity (%)
Entire Permian

JANUARY 202119
Flared volumes are categorized on three levels based on their typical cause
Source: Rystad Energy research and analysis
Categorization of flaring types Well level flaring categorization (indicative)
Top
performers
operational
flaring
• Top performers flaring level is applied to each well across the basin
to establish an achievable flaring intensity if all wells reduced their
flaring to levels seen among the best leases (those with <2% flaring).
• This establishes a baseline flaring level achievable today given
regulatory and technological status quo, with only high-grading of
operational performance.
• The top performers flaring level could also be reduced further from
current levels, mainly by reducing flaring intensity in initial months of
production.
Event-driven
flaring
• Event-driven flaring occurs when flaring intensity increases on a well
level compared to previous periods. These increases are attributable
to well-, lease-, or infrastructure-level events which necessitate
higher flaring for a period.
• Smaller events are localized geographically (only impact one
lease/operator and temporally (~0.5-2 months) and typically result in
small increases is in flaring intensity.
• Larger events like basin- or county-wide midstream outages can
have a significant impact on many wells across operators and time.
Routine flaring
• Routine flaring represents all flaring above the top performers’
operational flaring benchmark that is not attributable to non-routine
(event) flaring.
• Main reasons for this routine element of flaring is mis-timing or lack
of gathering or midstream capacity and low/negative expected value
of gas commercialization.
• Most wells with routine flaring eventually reduce flaring intensity to
top performers’ level, meaning the routine element is mostly driven
by new well startups with high initial flaring.
I
III
II
0 1 2 3 4 5 6 7 8 9 10 11
0 1 2 3 4 5 6 7 8 9 10 11
0 1 2 3 4 5 6 7 8 9 10 11
I
II
III
Months on production
Flaring intensity (%)
Flaring intensity (%)
Flaring intensity (%)
Months on production
Months on production
Typical well
Top performers
I
Event-driven
flaring
Routine
flaring
II
JANUARY 2021
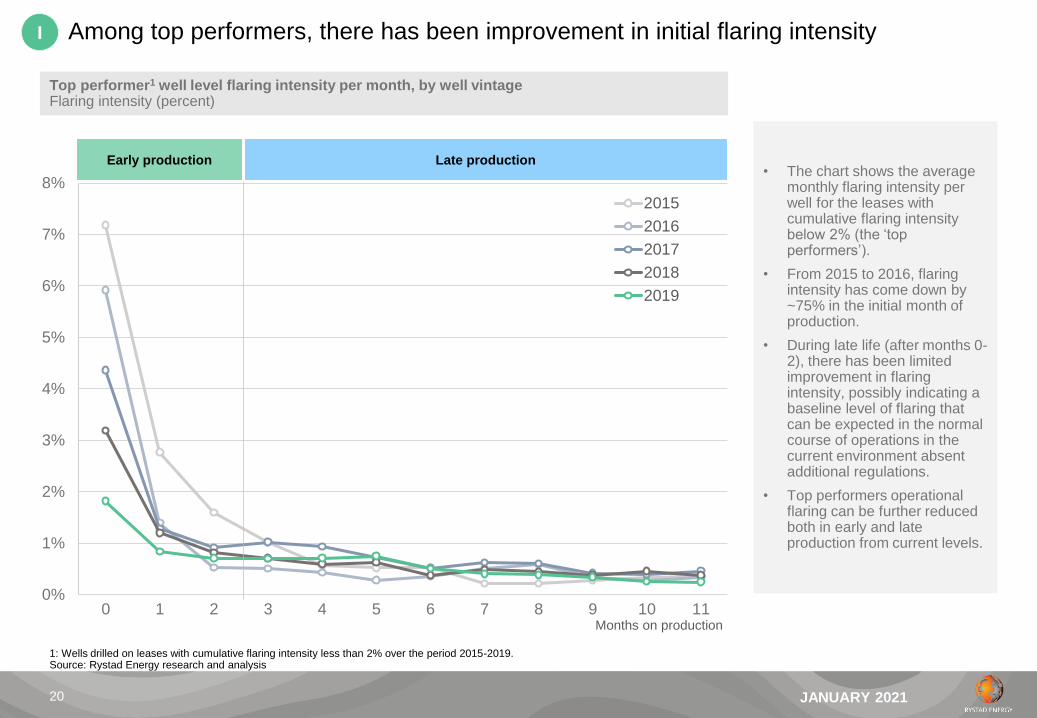
Among top performers, there has been improvement in initial flaring intensity
Top performer1 well level flaring intensity per month, by well vintageFlaring intensity (percent)
• The chart shows the average monthly flaring intensity per well for the leases with cumulative flaring intensity below 2% (the ‘top performers’).
• From 2015 to 2016, flaring intensity has come down by ~75% in the initial month of production.
• During late life (after months 0-2), there has been limited improvement in flaring intensity, possibly indicating a baseline level of flaring that can be expected in the normal course of operations in the current environment absent additional regulations.
• Top performers operational flaring can be further reduced both in early and late production from current levels.
1: Wells drilled on leases with cumulative flaring intensity less than 2% over the period 2015-2019.Source: Rystad Energy research and analysis
20
0%
1%
2%
3%
4%
5%
6%
7%
8%
0 1 2 3 4 5 6 7 8 9 10 11Months on production
2015
2016
2017
2018
2019
I
Early production Late production

JANUARY 2021
Event-driven flaring is detected after accounting for ‘routine’ variations in flaring intensity
Flaring intensity by month from first production month, illustrative profilePercent of gross production
• Event-driven flaring is calculated after first establishing each well’s baseline flaring intensity. Baseline flaring intensity is calculated in each month as the minimum intensity achieved in all months up to and including the current month.
• Variations of up to 2% above baseline are considered routine and not categorized as event-driven flaring.
• The size of these events vary significantly, consequently the changes are analyzed separately based on their magnitude. Large occurrences of non-routine flaring are tied back to known events where possible to understand the typical root causes (localized versus systemic).
1: Baseline calculated monthly for each well as the minimum intensity achieved in all months up to and including the current month. Variations up to 2% above baseline are considered routineSource: Rystad Energy research and analysis
21
0%
2%
4%
6%
8%
10%
12%
14%
0 1 2 3 4 5 6 7 8 9 10 11
Well flaring
intensity
Well flaring
intensity
baseline1
Fluctuations up to 2%
above baseline are
considered routine
Event-
driven
flaring
+2%
+2%
II

JANUARY 2021
Routine flaring is the residual after accounting for events and top performance baseline
Flaring intensity by month from first production month, illustrative profilePercent of gross production
• After categorizing event-driven and top operational performance baseline flaring, the remainder is categorized as routine– that is, flaring above the ‘best performers’ category that is not attributable to events.
• Routine flaring varies widely across operators, geographies and over time. This portion is likely due in part to decisions taken by operators from an operational and economic standpoint to flare instead of commercializing gas.
• Understanding the persistence of routine flaring throughout a well’s lifetime (temporary versus long term routine flaring) is key in understanding the underlying drivers.
1: Baseline calculated monthly for each well as the minimum intensity achieved in all months up to and including the current month. Variations up to 2% above baseline are considered routineSource: Rystad Energy research and analysis
22
0%
2%
4%
6%
8%
10%
12%
14%
0 1 2 3 4 5 6 7 8 9 10 11
Well flaring
intensity
Fluctuations up to 2%
above baseline are
considered routine
+2%
+2%
III
Event-
driven
flaring
Flaring attributable to top performance
Routine flaring

JANUARY 2021
Wells are categorized on whether the routine flaring converges to zero or not
Routine flaring intensity by month from first production month, illustrative profilePercent of gross production
• In order to understand the different impact from wells where routine flaring varies over time, we have categorized wells based on whether routine flaring intensity converges to zero within the first 12 months (temporary) or persists beyond this time frame (long-term).
• For the wells where we find long-term routine flaring, it is more likely that the flaring is a result of economic decisions or a persistent lack of infrastructure.
Share of wells per category1
1: Wells in the 2018 completion vintage shownSource: Rystad Energy research and analysis
23
0.0%
2.0%
4.0%
6.0%
8.0%
10.0%
12.0%
14.0%
16.0%
0 1 2 3 4 5 6 7 8 9 10 11 12 13 14 15 16 17 18
Long term routine flaring
Temporary routine flaring
III
Temporary routine flaring Long-term routine flaring
Temporary88%
Long term12%

JANUARY 202124
Event-driven and temporary routine are the largest contributors to flaring
Source: Rystad Energy research and analysis
Main drivers of flaring 2019
56%
26%
11%
7%
Event-driven flaring is the estimated
amount of flaring resulting directly from
events which cause large increases in
percentage of gas flared compared
with historical periods.
The expected flaring level if all leases
were to flare at the level of the best
leases today, given current technology
and regulatory regime.
Temporary routine flaring is extraneous
flaring that is temporary during the first
12 months of a well’s life.
I
III
II
Temporary routine flaring
Top performers operational
flaringEvent-driven flaring
34million cubic feet
per day
0.3% of gross gas
production
119million cubic feet
per day
1.1% Share of gross
gas production
256million cubic feet
per day
2.3% of gross gas
production
Long term routine flaring comes from
wells that do not reduce flaring intensity
to top performers’ levels of flaring
within the first 12 months of production.
IIILong term routine flaring
48million cubic feet
per day
0.4% Share of gross
gas production
Permian Texas

JANUARY 2021
Over time, event-driven spiked as systems neared capacity and outages occurred
Flared gas by flaring categoryMillion cubic feet per day
0
100
200
300
400
500
600
Jan-16 Jan-17 Jan-18 Jan-19
Top performers operational flaring
Temporary routine flaring
Long term routine flaring
Event-driven flaring
• The chart shows each flaring driver’s contribution to total flaring for the Texas portion of the Permian basin.
• All types of flaring increased during the recovery in activity experienced during 2017-2018, with significant spikes in routine and event-driven flaring.
• Long term routine flaring has increased gradually as the share of wells flaring for more than 12 months increased.
• All types of flaring stabilized or declined during the second half of 2019 as activity pace slowed and various midstream outages / bottlenecks were resolved.
Source: Rystad Energy research and analysis, ShaleWellCube
25
Permian Texas

JANUARY 2021
Event-driven flaring segment has highest intensity within Texas-Permian
Flaring intensity by flaring categoryPercent of gross production
0.0%
0.5%
1.0%
1.5%
2.0%
2.5%
3.0%
3.5%
Jan-16 Jan-17 Jan-18 Jan-19
Event-driven flaring
Temporary routine flaring
Long term routine flaring
Top performers operational flaring • The chart shows each flaring driver’s contribution to total flaring intensity for the Texas portion of the Permian basin
• All types of flaring increased during the recovery in activity experienced during 2017-2018, with significant spikes in routine and event-driven flaring.
• All types of flaring stabilized or declined during the second half of 2019 as activity pace slowed and various midstream outages / bottlenecks were resolved.
Source: Rystad Energy research and analysis, ShaleWellCube
26
Permian Texas

JANUARY 2021
I. Summary of findings
II. Review of historic flaring trends and drivers
III. Base case outlook to 2025
IV. Evaluation of alternative policy scenarios
Index
27

JANUARY 2021
Permian Basin, TX activity levels expected to rebound from 2H 2021
Rich gas production, Permian TX Number of started wells per monthBillion cubic ft per day Wells
• The chart shows gross gas production (in billion cubic feet per day) and activity levels (number of started wells per month, RHS) for the Permian basin in Texas.
• The Permian has historically experienced two large upcycles in terms of unconventional (horizontal) drilling, first in 2011-2014 period, and secondly during the oil price recovery in 2016-2018. During late 2019, activity levels had already begun to fall as fundamentals weakened and investor pressure led to operators shifting focus away from production growth.
• Going forward, activity is expected to trough in Q2 2020 due to COVID and weak fundamentals. However, a strong growth in number of started wells is expected to come near the end of 2020, as a number of wells were fracked in 1H 2020 that never entered production.
• Based on a price assumption of $45 WTI going forward, activity should see a rebound in 2H 2022 but will not return to levels last seen during 2018-19 without higher prices.
*Including vertical and directional wellsSource: Rystad Energy research and analysis, ShaleWellCube
28
0
100
200
300
400
500
600
700
800
0
2
4
6
8
10
12
14
16
Jan
Jun
No
v
Apr
Sep
Fe
b
Jul
De
c
Ma
y
Oct
Ma
r
Aug
Jan
Jun
No
v
Apr
Sep
Feb
Jul
De
c
Ma
y
Oct
Ma
r
Aug
Jan
Jun
No
v
Apr
Sep
Feb
Jul
De
c
Ma
y
Oct
Ma
r
Aug
Jan
Jun
No
v
2010 2011 2012 2013 2014 2015 2016 2017 2018 2019 2020 2021 2022 2023 2024 2025
Horizontal Vertical* Rich gas production
WTI: $45 / bbl
Henry hub: $3 / mcf
Permian Texas

JANUARY 202129
Routine flaring is driven by production from new wells in early production months
Source: Rystad Energy research and analysis; ShaleWellCube
Permian Texas routine flared gas by well vintage, including top performersMillion cubic feet per day
Permian Texas flaring intensity by well vintagePercent of gross gas production
• The upper chart shows forecasted routine flaring by well vintage. For the oldest wells (more than 12 months old at January 2020), routine flaring intensity has reached a low level relative to what is typically observed historically. Future routine flaring from these wells is estimated at the operator-county level and assumes constant routine flaring intensity going forward
• For future and newer wells, the forecast applies historic trends on the well level to estimate how routine flaring develops as wells mature- typically declining as production matures, resulting in lower flaring intensity for a given vintage over time. Future flaring intensity is forecast at an operator-county-vintage level using historic flaring intensity profiles observed from wells completed from 2018 to present.
0
100
200
300
400
500
600
700
1 3 5 7 9 11 1 3 5 7 9 11 1 3 5 7 9 11 1 3 5 7 9 11 1 3 5 7 9 11 1 3 5 7 9 11
2020 2021 2022 2023 2024 2025
0.5%
2.6%
8.5%
1.1%
12.0%
5.0%
14.7%
3.8%
14.7%
2.8%
14.7%
2.8%
14.7%
3.8%
0%
5%
10%
15%
1 3 5 7 9 11 1 3 5 7 9 11 1 3 5 7 9 11 1 3 5 7 9 11 1 3 5 7 9 11 1 3 5 7 9 11
2020 2021 2022 2023 2024 2025
2019 startups
Legacy
2020
startups
2021
startups
2022
startups
2023
startups
2024
startups
2025
startups
Permian Texas

JANUARY 2021
Event-driven flaring assumes continuation of trends seen on the past 7 months1
Permian Texas event-driven flaring intensity Percentage
0%
1%
2%
3%
4%
5%
6%
7%
8%
9%
10%
Jan-15 Jan-16 Jan-17 Jan-18 Jan-19 Jan-20 Jan-21 Jan-22
Midland
Martin
Howard
Reeves
Culberson
Loving
Rest of PermianTX
• The forecast for event-drivenflaring intensity is done at thecounty level to capture thelocalized infrastructurechallenges present in eachcounty.
• Outages or infrastructureconstraints affect each countyin the short term, resulting inincreased levels of the event-driven flaring. In the long term,however, these issues areresolved.
• It is important, then, to forecastevent-driven flaring basedupon recent flaring levels tobetter capture the currentinfrastructure situation anddilute one-off outages.
• Consequently, the forecast isbased upon the average of theprevious seven months of non-routine flaring intensity, pre-COVID-19.
1: October 2019 through April 2020Source: Rystad Energy research and analysis
30
Jan-25
11%
3.7%
3.5%
1.8%
1.2%
1.2%
1.1%
Forecast
25% 14%
Delaware
Midland
1.1%
Permian Texas

JANUARY 2021
Baseline flared gas to reach ~475 mmcfd by year end 2025
Flared gas by flaring categoryMillion cubic feet per day
0
100
200
300
400
500
600
Jan-16 Jan-17 Jan-18 Jan-19 Jan-20 Jan-21 Jan-22 Jan-23 Jan-24 Jan-25
Top performers operational flaring
Routine flaring
Event-driven flaring
• The chart shows each flaring driver’s contribution to total flaring for the Texas portion of the Permian basin.
• All types of flaring increased during the recovery in activity experienced during 2017-2018, with significant spikes in routine and event-driven flaring.
• Long term routine flaring has increased gradually as the share of wells flaring for more than 12 months increased.
• All types of flaring stabilized or declined during the second half of 2019 as activity pace slowed and various midstream outages / bottlenecks were resolved.
Source: Rystad Energy research and analysis, ShaleWellCube
31
WTI: $45 / bbl
Henry hub: $3 / mcf
Permian Texas
JANUARY 2021
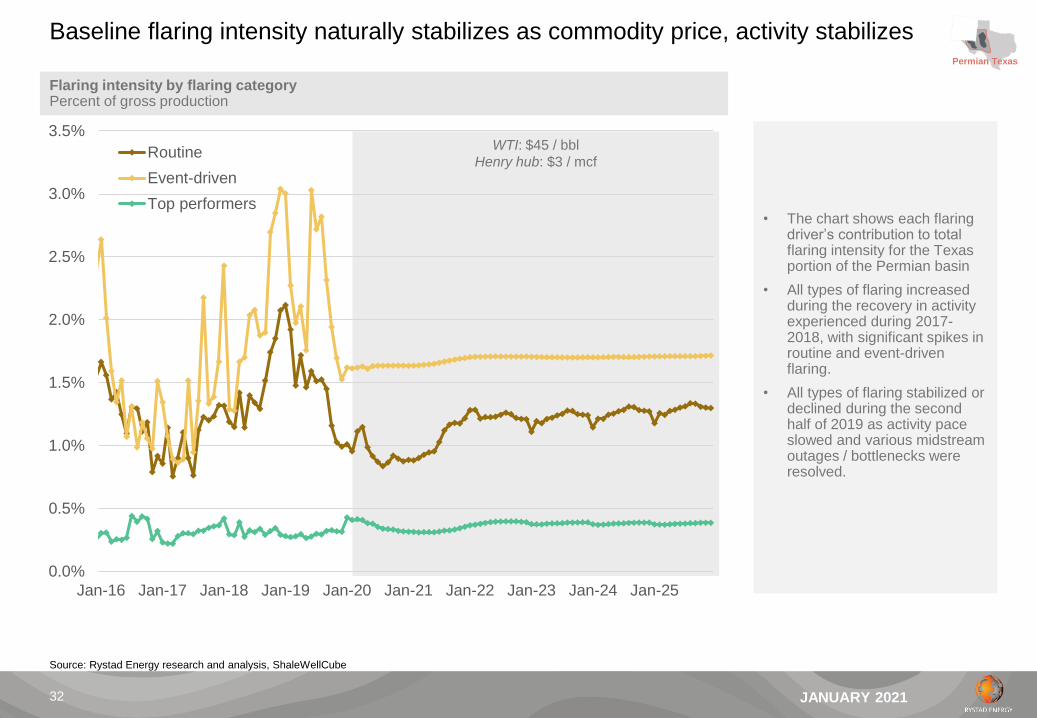
Baseline flaring intensity naturally stabilizes as commodity price, activity stabilizes
Flaring intensity by flaring categoryPercent of gross production
0.0%
0.5%
1.0%
1.5%
2.0%
2.5%
3.0%
3.5%
Jan-16 Jan-17 Jan-18 Jan-19 Jan-20 Jan-21 Jan-22 Jan-23 Jan-24 Jan-25
Routine
Event-driven
Top performers• The chart shows each flaring
driver’s contribution to total flaring intensity for the Texas portion of the Permian basin
• All types of flaring increased during the recovery in activity experienced during 2017-2018, with significant spikes in routine and event-driven flaring.
• All types of flaring stabilized or declined during the second half of 2019 as activity pace slowed and various midstream outages / bottlenecks were resolved.
Source: Rystad Energy research and analysis, ShaleWellCube
32
WTI: $45 / bbl
Henry hub: $3 / mcf
Permian Texas

JANUARY 2021
I. Summary of findings
II. Review of historic flaring trends and drivers
III. Base case outlook to 2025
IV. Evaluation of alternative policy scenarios
Index
33

JANUARY 202134
Flaring dynamics are analyzed for three potential future policy environments
Source: Rystad Energy research and analysis, Environmental Defense Fund
Policy Proposals Forecast approach
Baseline:
Continuation of
current trends
In this scenario no new policy proposals are introduced;
consequently, the previously detailed operator and
geographic trends continue in the Permian. The level of
routine flaring in the Permian will not be influenced by
regulation and the only reductions in flaring will be the
result of operator choice.
• Routine flaring intensity forecasted using latest
trends for each operator-county combination; varies
over life of each well
• Event-driven flaring intensity forecasted using latest
county level trends while adjusting for extraordinary
outages where necessary. Actual event-driven
flaring likely to be more volatile than forecasted
Policy
alternative 1:
RRC Data
Sheet
As of Nov 4th 2020, the Texas Railroad Commission (RRC)
enacted a new rule which requires more detailed
disclosures by operators around flaring exception requests.
According to the RRC, this form “greatly enhances
collection of critical data points and in some cases
significantly reduces flare duration”, without giving specific
targets or requirements for the supposed reductions.
• The new data sheet has potential to reduce flaring
primarily through increased availability of
information and voluntary operator changes.
• We base our outlook on potential flaring reductions
on the potential for zero- and negative-cost flaring
that is occurring, assuming operators will aim to
capture this economic activity over time.
Policy
alternative 2:
Gas Capture
Targets
The key component of this proposal is escalating gas
capture targets starting in 2021. Under this plan, flaring of
gas above the respective thresholds would not be allowed,
regardless of cause. The gas capture target would be 90%
in 2021 and increase each year through 2024 when it
would reach a target of 98%.
• Assumes basin-wide compliance with gas capture
requirements that escalate towards 2025.
• Gas capture compliance is ringfenced to the
operator level, does not include additional gas
production (and possibly flaring) coming from other
areas in Texas.
B
P2
P1

JANUARY 2021
Scenario flaring intensity
35
Changes in the production mix, in addition to new policies will influence flaring
*As flaring intensity on a well level declines over time, a shift in the share of legacy production will change the flaring intensity over time, as will a shift in operator mixSource: Rystad Energy research and analysis
Flaring intensity, Permian TexasMillion cubic feet per day
0.2% 0.3% 0.2%0.4%
0.3% 0.3%
4.4%
4.1%
2.4%
4.0%
5.4%
2.9% 3.4%
2.7%
1.8%
0.0%
1.0%
2.0%
3.0%
4.0%
5.0%
6.0%
2015 2016 2017 2018 2019 2020 2021 2022 2023 2024 2025
Top performers all
wells
Permian
flaring (actual)
Policy 1RRC Data Sheet
BaselineContinuation of
current trendsB
P1
Policy 2Gas
Capture TargetsP2
Permian Texas

JANUARY 2021
RRC’s new Data Sheet expected to primarily impact routine flaring
Texas Permian flaring intensity by categoryPercent of gross production
0.0%
0.5%
1.0%
1.5%
2.0%
2.5%
3.0%
3.5%
Jan-16 Jan-17 Jan-18 Jan-19 Jan-20 Jan-21 Jan-22 Jan-23 Jan-24 Jan-25
Top performers
Routine (baseline)
Event-driven (baseline)
Routine
Event-driven
• As part of the new RRC Data Sheet implemented in November 2020, we base our forecast on the assumption that zero- or negative-cost flaring is gradually reduced through changes in operator behavior over time.
• This manifests through reductions in routine flaring, as operators aim to capture more gas that is flared typically in the early life of a well.
• This type of behavior change has already been seen in the largest operators, who have reduced routine flaring significantly in the past 12-36 months.
Source: Rystad Energy research and analysis, ShaleWellCube
36
P1
WTI: $45 / bbl
Henry hub: $3 / mcf
Permian Texas

JANUARY 2021
Gas capture requirements would largely remove routine, reduce event-driven flaring
Texas Permian flaring intensity by categoryPercent of gross production
0.0%
0.5%
1.0%
1.5%
2.0%
2.5%
3.0%
3.5%
Jan-16 Jan-17 Jan-18 Jan-19 Jan-20 Jan-21 Jan-22 Jan-23 Jan-24 Jan-25
Top performers
Routine (baseline)
Event-driven (baseline)
Routine
Event-driven
• The gas capture targets scenario sees annual decreases in flaring intensity among routine and eventually event-driven flaring.
• Routine flaring intensity starts to decline relative to the baseline rate in 2021 and at each successive gas capture target. At a 98% gas capture requirement, routine flaring would account for only 0.2% relative to gross production, down from over 2% in late 2018.
• Key in achieving the gas capture targets is a reduction in event-driven flaring, which would begin to occur from 2024 onwards. Portions of event-driven flaring will likely occur abatement costs as the up- and mid-stream industry will require additional investments in local and regional infrastructure to reduce event-driven flaring.
Source: Rystad Energy research and analysis, ShaleWellCube
37
P2
WTI: $45 / bbl
Henry hub: $3 / mcf
Permian Texas

JANUARY 202138
Approximately 40% of flaring in 2025 is avoidable at no cost to operators
1: Adjusted metric to reflect combined abatement potential of temporary and long-term routine flaringSource: Rystad Energy research and analysis
Baseline flaring forecast by flaring type and abatement cost category, 2021 - 2025
Billion cubic feet
0
20
40
60
80
100
120
140
160
180
2021 2022 2023 2024 2025
Top performers Event-driven Routine Event-driven (zero cost) Routine (zero cost)
• Total baseline flared volumes are expected to rise 7% per year on average from approximately 130 bcf in 2021 to approximately 170 bcf in
2025.
• We estimate approximately 16% of event-driven flaring and 84% of routine flaring1 can be abated at zero cost.
• If this potential is fully captured each year, approximately 50% of total flared volumes would be mitigated.
• Most of the zero-cost potential falls under routine flaring. Given this category is largely driven by issues around planning, communication, and
other operational circumstances within the control of the operator. Most volumes that are avoidable with an abatement cost are considered
event-driven, as this segment is naturally unpredictable and would require additional investments to improve reliability of infrastructure.
• Flaring volumes that can be abated at zero-cost would result in a economic windfall to operators through increased gas sales revenue.

JANUARY 202139
Capturing volumes with no abatement costs results in increased sales gas revenues
1: Zero abatement costs expected under Policy 1 scenarioSource: Rystad Energy research and analysis
RRC Data Sheet scenario wellhead value of gas captured1
Million USD
-200
-100
0
100
200
300
400
500
2021 2022 2023 2024 2025
• Under Policy 1, operators may limit flaring reductions to those achievable with zero abatement cost— volumes that can largely be avoided with
improved communication and planning that would require no additional capital investments to achieve.
• In this scenario it is assumed that routine flaring is reduced by 42% and event-driven flaring is reduced by 8% by 2025. Operators are
expected to increase abatement gradually over the period achieving 10% of zero cost potential per year.
• If issues of timing and communication are effectively mitigated, Policy 1 reductions would likely result in millions of dollars in value capture per
year by commercializing gas that would otherwise have been flared under a business-as-usual scenario.
P1

JANUARY 202140
Wellhead value of avoided flaring under Policy 2 greater than expected cost of reductions
Source: Rystad Energy research and analysis
Gas capture targets scenario wellhead value of gas captured and abatement cost
Million USD
-200
-100
0
100
200
300
400
500
2021 2022 2023 2024 2025
Wellhead value Abatement cost
• The wellhead value of the gas requiring capture under the gas capture targets scenario is expected to exceed the costs to abate said volumes,
suggesting that even with more stringent regulations, most operators are still likely to gain from improved flaring procedures.
• Policy 2 wellhead value includes all volumes requiring abatement to reach gas capture rules— this includes both volumes that have zero
abatement costs and volumes with an expected cost to abate.
• In this scenario, a capture target of 98% would be the first threshold where significant abatement costs would likely be incurred by the industry,
as there would then be a need to capture a larger portion of event-driven flaring to meet this target.
P2
90% 94% 96% 98% 98%Capture
Targets
JANUARY 2021
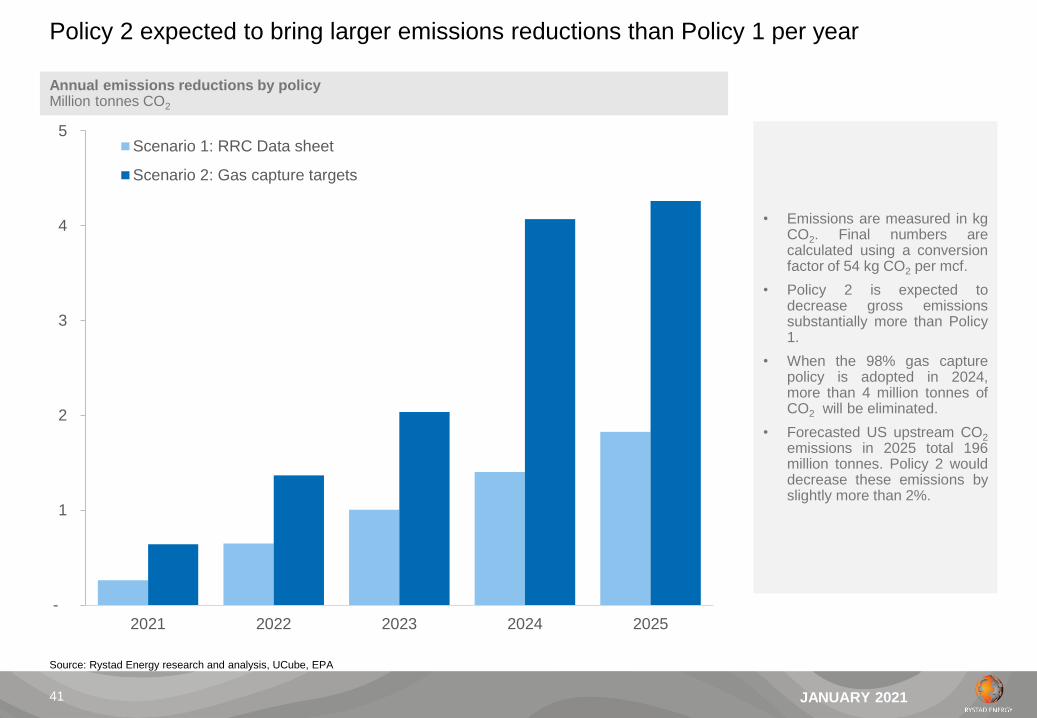
Policy 2 expected to bring larger emissions reductions than Policy 1 per year
Annual emissions reductions by policy Million tonnes CO2
-
1
2
3
4
5
2021 2022 2023 2024 2025
Scenario 1: RRC Data sheet
Scenario 2: Gas capture targets
• Emissions are measured in kgCO2. Final numbers arecalculated using a conversionfactor of 54 kg CO2 per mcf.
• Policy 2 is expected todecrease gross emissionssubstantially more than Policy1.
• When the 98% gas capturepolicy is adopted in 2024,more than 4 million tonnes ofCO2 will be eliminated.
• Forecasted US upstream CO2
emissions in 2025 total 196million tonnes. Policy 2 woulddecrease these emissions byslightly more than 2%.
Source: Rystad Energy research and analysis, UCube, EPA
41
JANUARY 2021
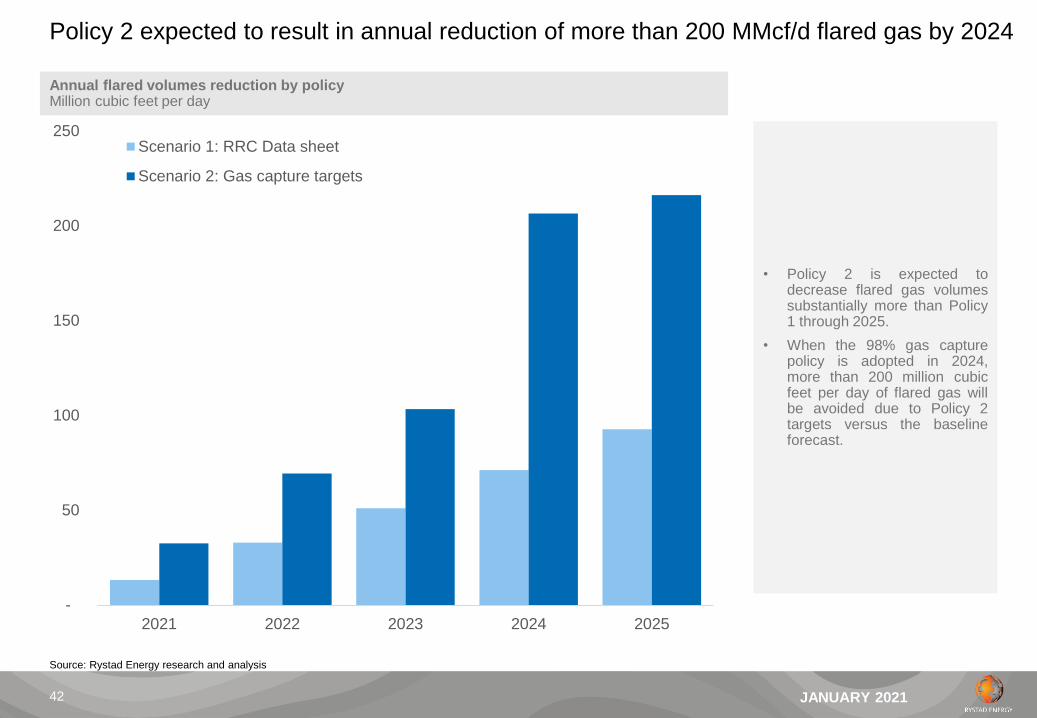
Policy 2 expected to result in annual reduction of more than 200 MMcf/d flared gas by 2024
Annual flared volumes reduction by policy Million cubic feet per day
-
50
100
150
200
250
2021 2022 2023 2024 2025
Scenario 1: RRC Data sheet
Scenario 2: Gas capture targets
• Policy 2 is expected todecrease flared gas volumessubstantially more than Policy1 through 2025.
• When the 98% gas capturepolicy is adopted in 2024,more than 200 million cubicfeet per day of flared gas willbe avoided due to Policy 2targets versus the baselineforecast.
Source: Rystad Energy research and analysis
42