perry county, indiana fis
TRANSCRIPT

Perry County
PERRY COUNTY, INDIANA AND INCORPORATED AREAS
COMMUNITY COMMUNITY NAME NUMBER CANNELTON, CITY OF 180196 PERRY COUNTY
(Unincorporated Areas) 180195 TELL CITY, CITY OF 180197 TROY, TOWN OF 180198
Federal Emergency Management Agency
FLOOD INSURANCE STUDY NUMBER
18123CV000A

NOTICE TO FLOOD INSURANCE STUDY USERS
Communities participating in the National Flood Insurance Program have established repositories of
flood hazard data for floodplain management and flood insurance purposes. This Flood Insurance
Study (FIS) report may not contain all data available within the Community Map Repository. Please
contact the Community Map Repository for any additional data.
The Federal Emergency Management Agency (FEMA) may revise and republish part or all of this
FIS report at any time. In addition, FEMA may revise part of this FIS report by the Letter of Map
Revision process, which does not involve republication or redistribution of the FIS report. Therefore,
users should consult with community officials and check the Community Map Repository to obtain
the most current FIS report components.
Selected Flood Insurance Rate Map panels for this community contain information that was
previously shown separately on the corresponding Flood Boundary and Floodway Map panels (e.g.,
floodways, cross sections). In addition, former flood hazard zone designations have been changed as
follows:
Old Zone: New Zone:
A1 through A30 AE
B X (shaded)
C X
Initial Countywide FIS Effective Date:

i
TABLE OF CONTENTS
Page
1.0 INTRODUCTION 1
1.1 Purpose of Study 1
1.2 Authority and Acknowledgments 2
1.3 Coordination 3
2.0 AREA STUDIED 4
2.1 Scope of Study 4
2.2 Community Description 5
2.3 Principal Flood Problems 6
2.4 Flood Protection Measures 7
3.0 ENGINEERING METHODS 7
3.1 Hydrologic Analyses 8
3.2 Hydraulic Analyses 10
3.3 Vertical Datum 11
4.0 FLOODPLAIN MANAGEMENT APPLICATIONS 12
4.1 Floodplain Boundaries 12
4.2 Floodways 13
5.0 INSURANCE APPLICATION 17
6.0 FLOOD INSURANCE RATE MAP 18
7.0 OTHER STUDIES 18
8.0 LOCATION OF DATA 18
9.0 BIBLIOGRAPHY AND REFERENCES 20

ii
FIGURES
Figure 1 - Floodway Schematic 14
TABLES
Table 1 - CCO Meeting Dates 3
Table 2 – Streams Studied By Detailed Methods 4
Table 3 – Streams Studied By Approximate Methods 4
Table 4 – Scope of Study 5
Table 5 – Population of Incorporated Cities and Towns in Perry County 5
Table 6 – Flood Crest Elevations (Ohio River at the Cannelton Dam) 6
Table 7 – Flood Crest Elevations (Sigler Creek Tributary at Uniontown) 6
Table 8 – Flood Crest Elevations (Middle Fork Anderson River at Bristow) 7
Table 9 – Summary of Discharges 8
Table 10 – Channel and Overbank Roughness Factors 11
Table 11 – Floodway Data Table 15
Table 12 – Community Map History 19
EXHIBITS
Exhibit 1 - Flood Profiles Panel #s
Ohio River 01P-04P
Windy Creek 05P-06P
Exhibit 2 - Flood Insurance Rate Map Index
Flood Insurance Rate Map
1
FLOOD INSURANCE STUDY
PERRY COUNTY, INDIANA AND INCORPORATED AREAS
1.0 INTRODUCTION
1.1 Purpose of Study
This Flood Insurance Study (FIS) revises and supersedes the FIS reports and Flood
Insurance Rate Maps (FIRMs) in the geographic area of Perry County, Indiana,
including the City of Cannelton and Tell City, the Town of Troy, and the
unincorporated areas of Perry County (hereinafter referred to collectively as Perry
County), and aids in the administration of the National Flood Insurance Act of 1968
and the Flood Disaster Protection Act of 1973. This study has developed flood risk
data for various areas of the community that will be used to establish actuarial flood
insurance rates and to assist the community in its efforts to promote sound floodplain
management. This information will also be used by Perry County to update existing
floodplain regulations as part of the Regular Phase of the National Flood Insurance
Program (NFIP), and by local and regional planners to further promote sound land
use and floodplain development. Minimum floodplain management requirements for
participation in the National Flood Insurance Program (NFIP) are set forth in the
Code of Federal Regulations at 44 CFR, 60.3.
In some states or communities, floodplain management criteria or regulations may
exist that are more restrictive or comprehensive than the minimum Federal
requirements. In such cases, the more restrictive criteria take precedence and the
State (or other jurisdictional agency) will be able to explain them.
The Digital Flood Insurance Rate Map (DFIRM) and FIS report for this countywide
study have been produced in digital format. Flood hazard information was converted
to meet the Federal Emergency Management Agency (FEMA) DFIRM database
specifications and Geographic Information System (GIS) format requirements. The
flood hazard information was created and is provided in a digital format so that it can
be incorporated into local GIS and be accessed more easily by the community.

2
1.2 Authority and Acknowledgments
The sources of authority for this Flood Insurance Study are the National Flood
Insurance Act of 1968 and the Flood Disaster Protection Act of 1973.
Information of the authority and acknowledgements for each of the new studies and
previously printed FIS reports and Flood Insurance Rate Maps (FIRMs) for
communities within Perry County was compiled and is shown below:
Perry County
(Unincorporated Areas) No previous FIS.
Cannelton, City of: The hydrologic and hydraulic analyses for this study
were prepared by the U.S. Army Corps of Engineers, as
reported in “Ohio River Profiles” for the Federal
Emergency Management Agency (FEMA). This study,
which was completed in January 1981, covered all
significant flooding sources affecting the City of
Cannelton.
Tell City, City of: The hydrologic and hydraulic analyses for this study
were prepared by the U.S. Army Corps of Engineers, as
reported in “Ohio River Profiles” for the Federal
Emergency Management Agency (FEMA). This study,
which was completed in January 1981, covered all
significant flooding sources affecting the City of Tell
City.
Troy, Town of: The hydrologic and hydraulic analyses for this study
were prepared by the U.S. Army Corps of Engineers, as
reported in “Ohio River Profiles” for the Federal
Emergency Management Agency (FEMA). This study,
which was completed in January 1981, covered all
significant flooding sources affecting the Town of Troy.
New Studies: The hydrologic and hydraulic analyses for approximate
stream reaches of Perry County were performed by
Morley and Associates, Inc., on behalf of the Indiana
Department of Natural Resources, under Indiana Public
Works Project Number E060020. The Indiana
Department of Natural Resources managed the
production of this study as part of their Cooperating
Technical Partner agreement with the Federal
Emergency Management Agency dated April 29, 2004,
which was defined by the Indiana DNR Mapping

3
Activity Statement 08-01 dated July 7, 2008 and funded
under agreement number EMC-2005-GR-7022.
Redelineation of the previously effective flood hazard information for this FIS report,
correction to the North American Vertical Datum of 1988, and conversion of the
unincorporated and incorporated areas of Perry County into the Countywide format
was performed by Morley and Associates, Inc., on behalf of the Indiana Department
of Natural Resources, under Indiana Public Works Project Number E060020. The
Indiana Department of Natural Resources managed the production of this study as
part of their Cooperating Technical Partner agreement with the Federal Emergency
Management Agency dated April 29, 2004, which was defined by the Indiana DNR
Mapping Activity Statement 08-01 dated July 7, 2008 and funded under agreement
number EMC-2005-GR-7022.
1.3 Coordination
The purpose of an initial Consultation Coordinated Officer’s (CCOs) meeting is to
discuss the scope of the FIS. A final CCO meeting is held to review the results of the
study. The dates of the initial and final CCO meetings held for the previously
effective FIS reports covering the geographic area of Perry County, Indiana are
shown in Table 1. The initial and final CCO meetings were attended by the study
contractor, FEMA (or the Federal Insurance Administration), the Indiana Department
of Natural Resources (IDNR), and the affected communities.
Table 1: CCO Meeting Dates for Pre-Countywide FIS
Community Name Initial CCO Date Final CCO Date
Cannelton, City of * September 7, 1982
Tell City, City of * *
Troy, Town of * August 18, 1982
*No dates given in previous FIS.
For this countywide FIS, an initial CCO meeting was held on July 20, 2005, and was
attended by IDNR, NRCS, the Perry County Plan Commission, the Perry County
Surveyor, the Perry County Engineer, the Perry County SWCD, Perry County
Emergency Management Agency, the Town of Cannelton and the City of Troy.
The results of the countywide study were reviewed at the final CCO meeting held on
--, and attended by representatives of FEMA, IDNR and________. All problems
raised at that meeting have been addressed.

4
2.0 AREA STUDIED
2.1 Scope of Study
This FIS covers the geographic area of Perry County, Indiana, including the
incorporated communities listed in Section 1.1.
All FIRM panels for Perry County have been revised, updated, and republished in
countywide format as a part of this FIS. The FIRM panel index, provided as Exhibit
2, illustrates the revised FIRM panel layout.
Approximate methods of analysis were used to study those areas having a low
development potential or minimal flood hazards as identified during the initial CCO
meeting. For this study, twelve new stream reaches were studied using approximate
methods (Table 4). The scope and methods of new approximate studies were
proposed and agreed upon by FEMA, the IDNR, and Perry County.
The areas studied by detailed methods were selected with priority given to all known
flood hazards areas and areas of projected development of proposed construction.
This study incorporates detailed studies of Ohio River and Windy Creek, performed
for and approved by IDNR (Table 2).
This FIS update also incorporates the determination of letters issued by FEMA
resulting in map changes (Letters of Map Change, or LOMCs). No LOMCs have
been incorporated into the mapped changes. No Letters of Map Revision (LOMRs)
have been issued for Perry County. Letters of Map Amendment (LOMAs) revalidated
for this study are summarized in the Summary of Map Actions (SOMA) included in
the Technical Support Data Notebook (TSDN) associated with this FIS update.
Copies of the TSDN may be obtained from the Community Map Repository.
Table 2: Streams Studied by Detailed Methods
Ohio River Windy Creek
Table 3: Streams Studied by Approximate Methods
Anderson River Little Deer Creek
Bear Creek Little Oil Creek
Brushy Fork Little Windy Creek
Deer Creek Middle Fork Anderson River
Hurricane Creek Oil Creek
Kraus Creek Poison Creek

5
Table 4: Scope of Study
Stream Limits of Approximate Study
Anderson River Mouth to Dubois County Line
Bear Creek Mouth to Tumbler Road
Brushy Fork Mouth to Sagebrush Road
Deer Creek Mouth to Thistle Road
Hurricane Creek Spencer Co. Line to Dubois Co. Line
Krauss Creek Mouth to Abbott Road
Little Deer Creek Mouth to Shellflower Road
Little Oil Creek Mouth to Mount Pleasant Road
Little Windy Creek Mouth to State Road 37
Middle Fork Anderson River Mouth to Crawford County Line
Oil Creek Mouth to Orchid Road
Poison Creek Mouth to Urban Road
Stream Limits of Detailed Study
Ohio River Spencer Co. Line to Crawford Co. Line
2.2 Community Description
Perry County is located in southern Indiana and is bordered by Dubois County to the
northwest, Crawford County to the northeast, Meade County, Kentucky to the east,
Breckinridge County, Kentucky to the southeast, Hancock County, Kentucky to the
southwest, and Spencer County to the west. The total land area within the county is
approximately 381.4 square miles. The largest city and the county seat is Tell City
which is located approximately 130 miles south of Indianapolis and 55 miles north of
Louisville Kentucky. Perry County is served by Interstate 64, US Highway 50, and
State Routes 37, 62, 66, 70, 145, 166 and 237.
The climate in Perry County ranges from hot and humid in the summertime to cold
during the winter season. Average daytime temperatures during the summer fall
around 75.8ºF, while winter temperatures average at approximately 34.5ºF.
Precipitation for Perry County totals an annual amount of 47.82 inches.
According to U.S. Census Data from the year 2000, the population of Perry County
was reported to be 18,899. Table 5 lists the population of the incorporated areas in
Perry County.
Table 5: Population of incorporated cities and towns in Perry County 2000 Census
Community Population
Cannelton, City of 1,209
Tell City, City of 7,845
Troy, Town of 392

6
2.3 Principal Flood Problems
Major flooding in Perry County primarily occurs along the Ohio River, Windy Creek,
and the tributaries to those streams. The flood of January-February 1937 was the
most disastrous for the Ohio River Basin. Excessive and almost continuous rainfall
most of January caused the river to swell to maximum recorded stages. This flood
interrupted communications and transportation for up to a month. The flood of 1913
was the second largest in the area, due to large storms following each other very
closely. Floods principally occur during the winter and spring months, but can occur
during any season. Generally, two types of storm events cause flooding. During the
winter and spring, storms of moderate intensity and long duration, coupled with
frozen ground, cause flooding to occur. During the summer, thunderstorms which
have high intensities and relatively short durations can cause floods. Localized flood
problems in the incorporated areas are summarized below:
Cannelton, City of: Subject to flooding from the Ohio River. The
discharges and frequencies of the river are as follows:
Table 6: Flood Crest Elevations
USGS gage for the Ohio River at the Cannelton Dam
Discharge Elevation
Date Cubic Feet per Second (CFS) (feet, gage datum)
March 8, 1997 735,000 52.42
December 15, 1978 617,000 23.84
January 13, 2005 588,000 46.05
February 22, 2000 572,000 46.85
January 27, 1996 566,000 44.69
February 21, 1989 555,000 46.03
Tell City, City of: Subject to flooding from the Ohio River, Windy Creek,
and the backwater to the Ohio River.
Troy, Town of: Subject to flooding from the Ohio River.
Table 7: Flood Crest Elevations
USGS gage for Sigler Creek Tributary at Uniontown
Discharge Elevation
Date Cubic Feet per Second (CFS) (feet, gage datum)
July 26, 1979 170 10.68
April 30, 1983 130 9.05

7
Table 7: Flood Crest Elevations
USGS gage for Sigler Creek Tributary at Uniontown Continued
March 16, 1984 130 9.07
May 30, 1974 125 9.05
September 1, 1982 110 8.59
July 13, 1987 96 8.11
Table 8: Flood Crest Elevations
USGS gage for the Middle Fork Anderson River at Bristow
Discharge Elevation
Date Cubic Feet per Second (CFS) (feet, gage datum)
January 21, 1959 15,000 20.00
March 9, 1964 6,360 19.18
April 3, 1989 4,290 17.98
April 28, 1970 4,120 18.87
January 22, 1962 3,400 16.84
March 17, 1963 3,110 16.65
2.4 Flood Protection Measures
The cities of Cannelton and Tell City both have levees that protect the cities against
flooding. Please refer to the corresponding Flood Insurance Rate Map panels for the
protection status of this levee system. In addition to a levee, Tell City also has a
pumping station. The town of Troy does not have any flood control measures.
The state of Indiana has also set regulations concerning development in a flood plain.
The Indiana Flood Control Act of 1945, as amending, requires that the channels and
that portion of the flood plain known as the floodway be kept free and clear of
interference or obstructions which could restrict the flow rate in a significant manner.
The Act stipulates that the Indiana Flood Plain Management Act of 1973 further
requires that flood plain management regulations adopted after July 1, 1974, meet a
minimum set of standards for the delineation and regulation of flood hazard areas.
3.0 ENGINEERING METHODS
For the flooding sources studied by detailed methods in Perry County, standard hydrologic
and hydraulic study methods were used to determine the flood hazard data required for this
study. Flood events of a magnitude that are expected to be equaled or exceeded once on the
average during any 10-, 50-, 100-, or 500-year period (recurrence interval) have been
selected as having special significance for floodplain management and for flood insurance
rates. These events, commonly termed the 10-, 50-, 100-, and 500-year floods, have a 10-, 2-

8
, 1-, and 0.2-percent chance, respectively, of being equaled or exceeded during any year.
Although the recurrence interval represents the long-term, average period between floods of
a specific magnitude, rare floods could occur at short intervals or even within the same year.
The risk of experiencing a rare flood increases when periods greater than 1 year are
considered. For example, the risk of having a flood that equals or exceeds the 1-percent-
annual-chance flood in any 50-year period is approximately 40 percent (4 in 10); for any 90-
year period, the risk increases to approximately 60 percent (6 in 10). The analyses reported
herein reflect flooding potentials based on conditions existing in the community at the time
of completion of this study. Maps and flood elevations will be amended periodically to
reflect future changes.
3.1 Hydrologic Analyses
Hydrologic analyses were carried out to establish peak discharge-frequency
relationships for each flooding source studied by detailed methods affecting Perry
County. Table 9 contains a summary of peak discharges for the 10-, 2-, 1-, and 0.2-
percent annual chance floods, where applicable, for each flooding source studied in
detail in Perry County. Peak discharges for Windy Creek in the table were compiled
from previously effective FIS reports for Perry County and incorporated areas. Peak
dischares for the Ohio River are from the new detailed study.
Table 9: Summary of Discharges
Peak Discharge (CFS)
10% 2% 1% 0.2%
Flooding Source Drainage Area Annual Annual Annual Annual
And Location (Square Miles) Chance Chance Chance Chance
OHIO RIVER
Cannelton Lock & Dam
(River Mile 720.5) 96,700 640,000 800,000 865,000 1,010,000
WINDY CREEK
Washington Street Bridge
(River Mile 4.425) 1.01 1390 1540 1680 3320
19th
Street Bridge
(River Mile 3.30) 4.0 2570 2850 3120 6330
Standard and accepted hydrologic methods were used to develop discharge data on
the study streams in Perry County. These data were coordinated with the Indiana
Department of Natural Resources, the Natural Resources Conservation Service
(formally the Soil Conservation Service), the U. S. Geological Survey and the
Louisville District of the U. S. Army Corps of Engineers, through a Memorandum Of
Understanding dated May 6, 1976. Discharge curves for the 10%, 2%, 1%, and 0.2%
annual chance floods were developed for each study stream using several different
procedures and compared for consistency.

9
The hydrologic analyses for the Ohio River were performed by the U.S. Army Corps
of Engineers. Frequency discharge data for the entire length of the Ohio River are
available based on an analysis conducted by the Ohio River Division of the Corps of
Engineers in Cincinnati, Ohio. Natural discharge-frequency curves for the Ohio
River were developed in accordance with methods presented in papers by Leo R.
Beard, Statistical Methods in Hydrology. Modified discharge-frequency curves, for
the Ohio River, resulted from routing twelve representative floods for the Ohio River
modified by an upstream Corps of Engineers reservoir system. That system included
reservoirs completed or near completion in 1976 and is considered current in 2002.
Data were plotted opposite original flood data on a grid containing a referenced flow
reduction of natural flow and a new best-fit curve drawn. Total reductions were read
from the new curve at selected natural flow frequencies, and subtracted from natural
flows at those frequencies to obtain new modified-flow values.
For Windy Creek a one hour unit hydrograph was developed at a power substation
near the end of Twelfth Street, Windy Creek mile 1.9, for a drainage area of 5.3
square miles. The one hour unit hydrograph was developed by synthetic methods due
to the absence of observed flow records on Windy Creek. Unit hydrograph values
thus derived were for peak discharge, time of peak, the discharge at twice the time of
peak, and base time. These values were related to the slope of the valley and the size
of the area for the conditions of uniform distribution of rainfall.
Rainfall data for the 10%, 2%, 1%, and 0.2% annual chance floods were developed
for Windy Creek. Rainfall data for the Windy Creek watershed were taken from
Technical Paper No. 40, “Rainfall Frequency Atlas of the United States,” dated May
1961. The 0.2% annual chance frequency rainfall data were determined by the
method outlined in Civil Engineer Bulletin No. 52-8, Corps of Engineers, dated 26
March 1952.
Discharge-frequency data on Windy Creek were based on applications of rainfall-
excess to the one hour unit hydrograph mentioned previously. A curve of drainage
area versus stream mileage was plotted from the mouth of Windy Creek to State
Route 66 (mile 5.3). Flow distribution along Windy Creek was by drainage area
proportion.
The equations used to determine the discharges in the majority of the cases are taken
from Estimation of Peak Discharges of Indiana Streams by using log Pearson (iii)
distribution. The equations presented in the report are also included in the latest
version of the National Flood Frequency (NFF) program by the USGS, and are
included in the USGS StreamStats application. In some cases, the discharges for a
stream have been coordinated with the Indiana Department of Natural Resources, the
Natural Resources Conservation Service (formally the Soil Conservation Service), the
U.S. Geological Survey and the U.S. Army Corps of Engineers, through a
Memorandum of Understanding dated May 6, 1976.

10
3.2 Hydraulic Analyses
Analyses of the hydraulic characteristics of flooding from the sources studied were
carried out to provide estimates of the elevations of floods of the selected recurrence
intervals. Users should be aware that flood elevations shown on the Flood Insurance
Rate Map (FIRM) represent rounded whole-foot elevations and may not exactly
reflect the elevations shown on the Flood Profiles or in the Floodway Data table in
the FIS report. Flood elevations shown on the FIRM are primarily intended for flood
insurance rating purposes. For construction and/or floodplain management purposes,
users are cautioned to use the flood elevation data presented in this FIS report in
conjunction with the data shown on the FIRM.
Cross sections for the backwater analyses were obtained from a variety of sources
including: physical survey data, IDNR contour mapping, USGS topographic mapping
and local contour mapping. Locations of selected cross sections used in the hydraulic
analyses are shown on the Flood Profiles (Exhibit 1). For stream segments for which
a floodway was computed (Section 4.2), selected cross section locations are also
shown on the FIRM. Cross sections for the Ohio River were determined from detailed
mapping with bathymetry (1” = 600’ with 5-foot contour intervals), developed for
Corps of Engineers - Ohio River navigation studies.
Water-surface elevations for floods of the selected recurrence intervals were
computed through use of the USACE HEC-2 step-backwater computer program. For
the new approximate study reaches, the USACE HEC-RAS program was used. HEC-
RAS is an updated version of the HEC-2 program used to perform step-backwater
analyses. Water-surface elevations of floods of the selected recurrence intervals were
computed in April 1984 through the use of the USACE HEC-2 step-backwater
computer program. For the new approximate study reaches and the Ohio River, the
USACE HEC-RAS (Version 3.1.3 & 3.1.1, respectively) program was used. The
Windy Creek detailed study was computed using the USACE HEC-2 program.
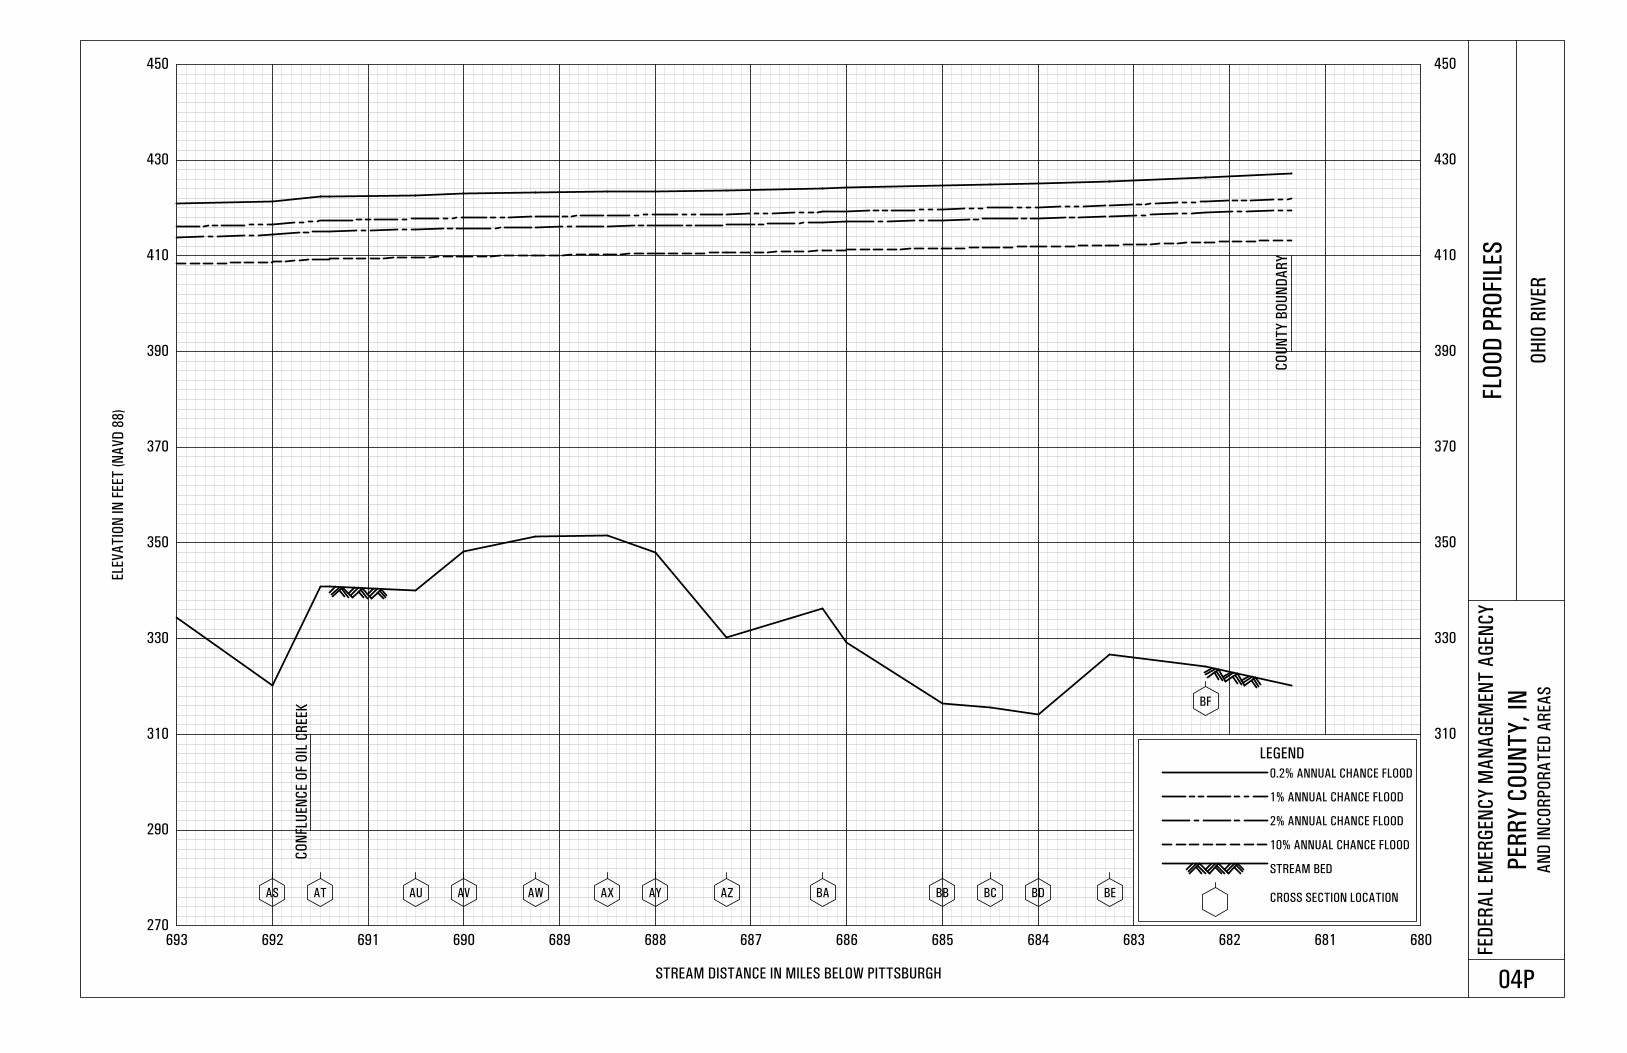
Flood profiles were prepared for all streams studied by detailed methods and show
computed water-surface elevations to an accuracy of 0.5 feet for floods of the selected
recurrence intervals. For this countywide FIS, flood profiles and approved LOMRs
have been consolidated into continuous stream reaches and adjusted to reflect the
current vertical datum as described in Section 3.3. New profiles have been prepared
for the new detailed studies and for the purposes of incorporating the LOMRs
described in Section 2.1 above.
Channel and overbank roughness factors (Manning’s “n” values) used in the
hydraulic computations were chosen by engineering judgment and were based on
field observations of the stream and floodplain areas. Factors were estimated by field
inspection with the aid of “n” value tables and equations. Channel and overbank
roughness factors used in the detailed studies are summarized by stream in Table 10.

11
Table 10: Channel and Overbank Roughness Factors
Roughness Coefficients
Stream Main Channel Left Overbank Right Overbank
Ohio River 0.023-0.034 0.050-0.055 0.050-0.055
Windy Creek 0.020-0.040 0.030-0.150 0.030-0.100
For new approximate study areas, analyses were based on field inspection and
modeling of the stream reaches using simplified HEC-RAS models. Structural
measurements or field surveying was not performed. Cross section geometry was
derived from topographic mapping from the 2005 statewide orthophotography
project. Starting elevations were assumed to be normal depth. Starting water-surface
elevations for the Ohio River were obtained using gaged data and known elevation-
discharge relationships at those locations.
The hydraulic analyses for this study were based on unobstructed flow. The flood
elevations shown on the Flood Profiles (Exhibit 1) are thus considered valid only if
hydraulic structures remain unobstructed, operate properly, and do not fail.
3.3 Vertical Datum
All FIS reports and FIRMs are referenced to a specific vertical datum. The vertical
datum provides a starting point against which flood, ground, and structure elevations
can be referenced and compared. Until recently, the standard vertical datum in use
for newly created or revised FIS reports and FIRMs was the National Geodetic
Vertical Datum of 1929 (NGVD29). With the finalization of the North American
Vertical Datum of 1988 (NAVD88), many FIS reports and FIRMs are being prepared
using NAVD88 as the referenced vertical datum.
All flood elevations shown in this FIS report and on the FIRM are referenced to
NAVD88. Structure and ground elevations in the community must, therefore, be
referenced to NAVD88. It is important to note that adjacent communities may be
referenced to NGVD29. This may result in differences in Base Flood Elevations
(BFEs) across the corporate limits between the communities.
In this revision, a vertical datum conversion of -0.33 feet was calculated at the
centroid of the county and used to convert all elevations in Perry county from
NGVD29 to NAVD88 using the National Geologic Survey’s VERTCON online
utility (VERTCON, 2005).
(NGVD29 – 0.33 = NAVD88)
For more information on NAVD88, see the FEMA publication entitled Converting
the National Flood Insurance Program to the North American Vertical Datum of 1988
(FEMA, June 1992), or contact the Vertical Network Branch, National Geodetic

12
Survey, Coast and Geodetic Survey, National Oceanic and Atmospheric
Administration, Rockville, Maryland 20910 (Internet address
http://www.ngs.noaa.gov).
Temporary vertical monuments are often established during the preparation of a flood
hazard analysis for the purpose of establishing local vertical control. Although these
monuments are not shown on the FIRM, they may be found in the Technical Support
Data Notebook associated with the FIS report and FIRM for this community.
Interested individuals may contact FEMA to access these data.
The horizontal coordinate system used for the production of the digital FIRMs is the
Transverse Mercator projection, Indiana State Plane coordinate system, referenced to
the North American Datum of 1983 and the GRS 1980 spheroid.
4.0 FLOODPLAIN MANAGEMENT APPLICATIONS
The NFIP encourages State and local governments to adopt sound floodplain management
programs. Therefore, each FIS provides 1-percent-annual-chance flood elevations and
delineations of the 1- and 0.2-percent-annual-chance floodplain boundaries and 1-percent-
annual-chance floodway to assist communities in developing floodplain management
measures. This information is presented on the FIRM and in many components of the FIS
report, including Flood Profiles, and the Floodway Data table. Users should reference the
data presented in the FIS report as well as additional information that may be available at the
local map repository before making flood elevation and/or floodplain boundary
determinations.
4.1 Floodplain Boundaries
To provide a national standard without regional discrimination, the 1-percent-annual-
chance flood has been adopted by FEMA as the base flood for floodplain
management purposes. The 0.2-percent-annual-chance flood is employed to indicate
additional areas of flood risk in the community. For each stream studied by detailed
methods, the 1- and 0.2-percent-annual-chance floodplain boundaries have been
delineated using the flood elevations determined at each cross section. Between cross
sections, the boundaries were interpolated using topographic mapping from the 2005
statewide orthophotography flight.
The 1- and 0.2-percent-annual-chance floodplain boundaries are shown on the FIRM
(Exhibit 2). On this map, the 1-percent-annual-chance floodplain boundary
corresponds to the boundary of the areas of special flood hazards (Zones A, AE, V,
and VE); and the 0.2-percent-annual-chance floodplain boundary corresponds to the
boundary of areas of moderate flood hazards. In cases where the 1- and 0.2-percent-
annual-chance floodplain boundaries are close together, only the 1-percent-annual-
chance floodplain boundary has been shown. Small areas within the floodplain
13
boundaries may lie above the flood elevations but cannot be shown due to limitations
of the map scale and/or lack of detailed topographic data.
For the streams studied by approximate methods, only the 1-percent-annual chance
floodplain boundary is shown on the FIRM (Exhibit 2).
4.2 Floodways
Encroachment on floodplains, such as structures and fill, reduces flood-carrying
capacity, increases flood heights and velocities, and increases flood hazards in areas
beyond the encroachment itself. One aspect of floodplain management involves
balancing the economic gain from floodplain development against the resulting
increase in flood hazard. For purposes of the NFIP, a floodway is used as a tool to
assist local communities in this aspect of floodplain management. Under this
concept, the area of the 1-percent-annual-chance floodplain is divided into a floodway
and a floodway fringe. The floodway is the channel of a stream, plus any adjacent
floodplain areas, that must be kept free of encroachment so that the 1-percent-annual-
chance flood can be carried without substantial increases in flood heights. Minimum
Federal standards limit such increases to 1.0 foot, provided that hazardous velocities
are not produced. The floodways in this study are presented to local agencies as
minimum standards that can be adopted directly or that can be used as a basis for
additional floodway studies.
The State of Indiana, however, per Indiana Code IC 14-28-1 and Indiana
Administrative Code 312 IAC 10, has designated that encroachment in the floodplain
is limited to that which will cause no significant increase in flood height. As a result,
floodways for this study are delineated based on a flood surcharge of less than 0.15
feet. The floodways in this study were approved by the IDNR, and are presented to
local agencies as minimum standards that can be adopted directly or that can be used
as a basis for additional floodway studies.
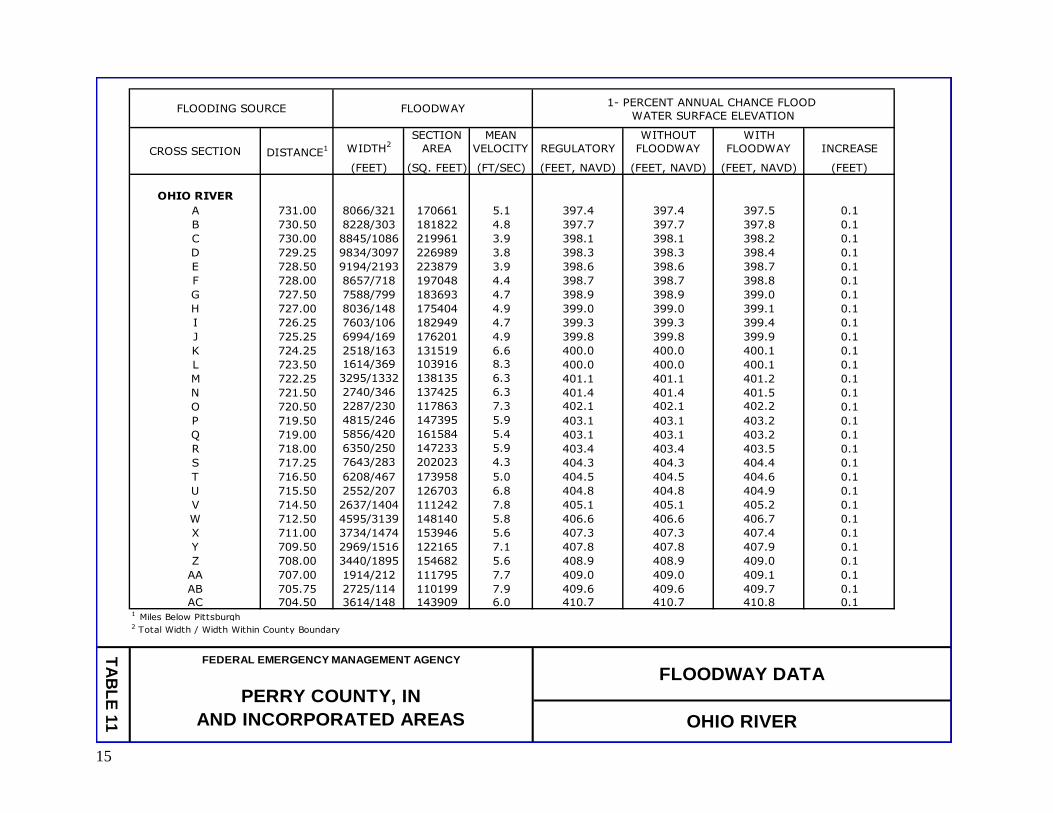
The floodway presented in this FIS report and on the FIRM was computed for certain
stream segments on the basis of equal conveyance reduction from each side of the
floodplain. Floodway widths were computed at cross sections. Between cross
sections, the floodway boundaries were interpolated. The results of the floodway
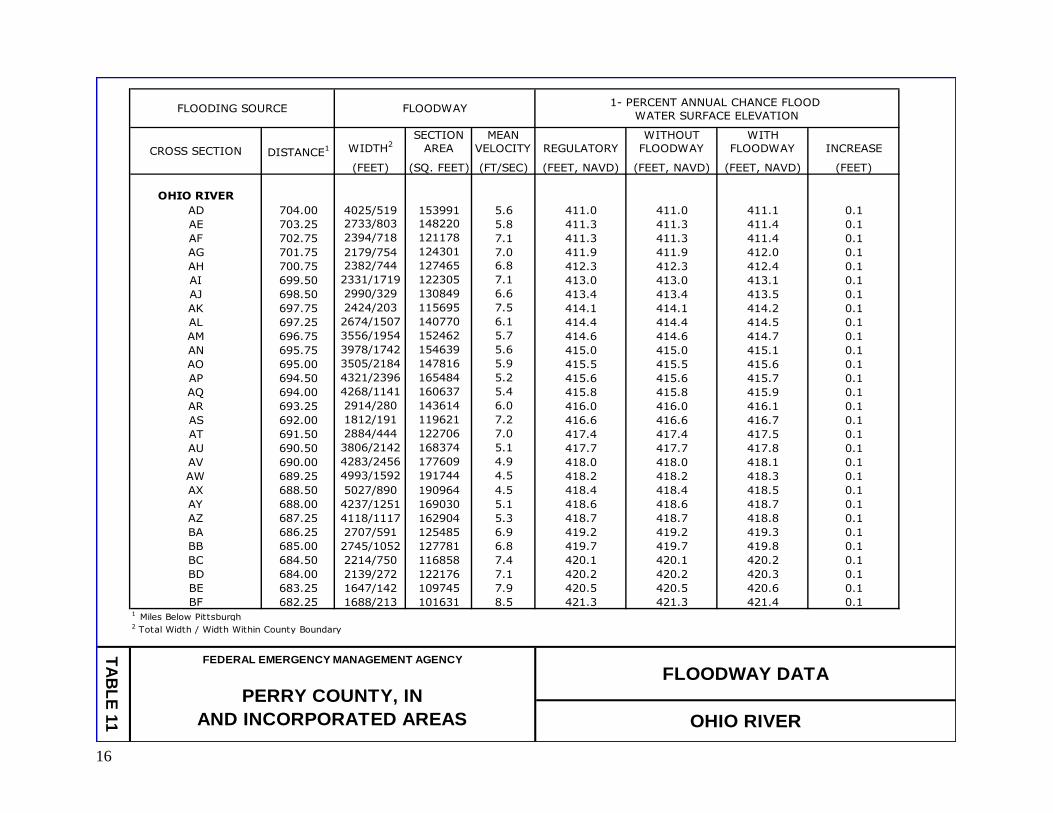
computations have been tabulated for selected cross sections (Table 11). In cases
where the floodway and 1-percent-annual-chance floodplain boundaries are either
close together or collinear, only the floodway boundary has been shown.
The area between the floodway and 1-percent-annual-chance floodplain boundaries is
termed the floodway fringe. The floodway fringe encompasses the portion of the
floodplain that could be completely obstructed without increasing the water-surface
elevation of the 1-percent-annual-chance flood more than 0.14 feet at any point.
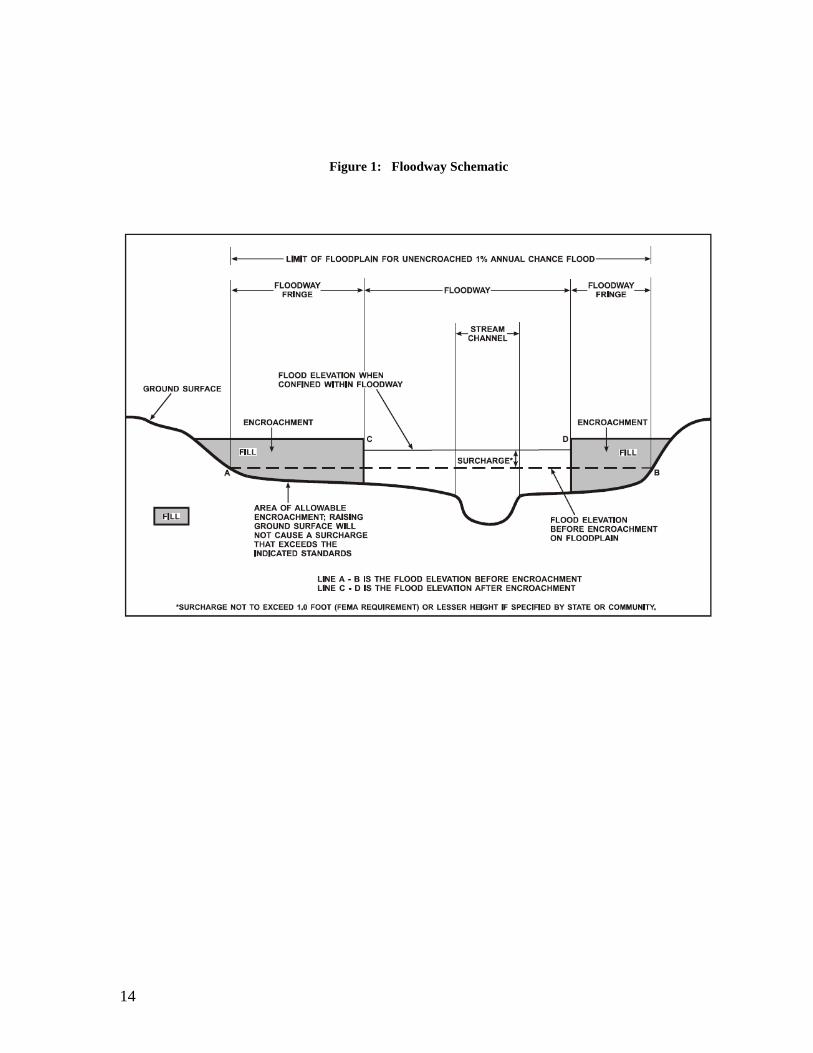
Typical relationships between the floodway and the floodway fringe and their
significance to floodplain development are shown in Figure 1.
14
Figure 1: Floodway Schematic
15
WIDTH2
SECTION
AREA
MEAN
VELOCITY REGULATORY
WITHOUT
FLOODWAY
WITH
FLOODWAY INCREASE
(FEET) (SQ. FEET) (FT/SEC) (FEET, NAVD) (FEET, NAVD) (FEET, NAVD) (FEET)
OHIO RIVER
A 731.00 8066/321 170661 5.1 397.4 397.4 397.5 0.1
B 730.50 8228/303 181822 4.8 397.7 397.7 397.8 0.1
C 730.00 8845/1086 219961 3.9 398.1 398.1 398.2 0.1
D 729.25 9834/3097 226989 3.8 398.3 398.3 398.4 0.1
E 728.50 9194/2193 223879 3.9 398.6 398.6 398.7 0.1
F 728.00 8657/718 197048 4.4 398.7 398.7 398.8 0.1
G 727.50 7588/799 183693 4.7 398.9 398.9 399.0 0.1
H 727.00 8036/148 175404 4.9 399.0 399.0 399.1 0.1
I 726.25 7603/106 182949 4.7 399.3 399.3 399.4 0.1
J 725.25 6994/169 176201 4.9 399.8 399.8 399.9 0.1
K 724.25 2518/163 131519 6.6 400.0 400.0 400.1 0.1
L 723.50 1614/369 103916 8.3 400.0 400.0 400.1 0.1
M 722.25 3295/1332 138135 6.3 401.1 401.1 401.2 0.1
N 721.50 2740/346 137425 6.3 401.4 401.4 401.5 0.1
O 720.50 2287/230 117863 7.3 402.1 402.1 402.2 0.1
P 719.50 4815/246 147395 5.9 403.1 403.1 403.2 0.1
Q 719.00 5856/420 161584 5.4 403.1 403.1 403.2 0.1
R 718.00 6350/250 147233 5.9 403.4 403.4 403.5 0.1
S 717.25 7643/283 202023 4.3 404.3 404.3 404.4 0.1
T 716.50 6208/467 173958 5.0 404.5 404.5 404.6 0.1
U 715.50 2552/207 126703 6.8 404.8 404.8 404.9 0.1
V 714.50 2637/1404 111242 7.8 405.1 405.1 405.2 0.1
W 712.50 4595/3139 148140 5.8 406.6 406.6 406.7 0.1
X 711.00 3734/1474 153946 5.6 407.3 407.3 407.4 0.1
Y 709.50 2969/1516 122165 7.1 407.8 407.8 407.9 0.1
Z 708.00 3440/1895 154682 5.6 408.9 408.9 409.0 0.1
AA 707.00 1914/212 111795 7.7 409.0 409.0 409.1 0.1
AB 705.75 2725/114 110199 7.9 409.6 409.6 409.7 0.1
AC 704.50 3614/148 143909 6.0 410.7 410.7 410.8 0.11 Miles Below Pittsburgh2 Total Width / Width Within County Boundary
OHIO RIVER
WATER SURFACE ELEVATION
TA
BL
E 1
1
FLOODWAY DATAFEDERAL EMERGENCY MANAGEMENT AGENCY
PERRY COUNTY, IN
AND INCORPORATED AREAS
FLOODING SOURCE FLOODWAY
CROSS SECTION DISTANCE1
1- PERCENT ANNUAL CHANCE FLOOD
16
WIDTH2
SECTION
AREA
MEAN
VELOCITY REGULATORY
WITHOUT
FLOODWAY
WITH
FLOODWAY INCREASE
(FEET) (SQ. FEET) (FT/SEC) (FEET, NAVD) (FEET, NAVD) (FEET, NAVD) (FEET)
OHIO RIVER
AD 704.00 4025/519 153991 5.6 411.0 411.0 411.1 0.1
AE 703.25 2733/803 148220 5.8 411.3 411.3 411.4 0.1
AF 702.75 2394/718 121178 7.1 411.3 411.3 411.4 0.1
AG 701.75 2179/754 124301 7.0 411.9 411.9 412.0 0.1
AH 700.75 2382/744 127465 6.8 412.3 412.3 412.4 0.1
AI 699.50 2331/1719 122305 7.1 413.0 413.0 413.1 0.1
AJ 698.50 2990/329 130849 6.6 413.4 413.4 413.5 0.1
AK 697.75 2424/203 115695 7.5 414.1 414.1 414.2 0.1
AL 697.25 2674/1507 140770 6.1 414.4 414.4 414.5 0.1
AM 696.75 3556/1954 152462 5.7 414.6 414.6 414.7 0.1
AN 695.75 3978/1742 154639 5.6 415.0 415.0 415.1 0.1
AO 695.00 3505/2184 147816 5.9 415.5 415.5 415.6 0.1
AP 694.50 4321/2396 165484 5.2 415.6 415.6 415.7 0.1
AQ 694.00 4268/1141 160637 5.4 415.8 415.8 415.9 0.1
AR 693.25 2914/280 143614 6.0 416.0 416.0 416.1 0.1
AS 692.00 1812/191 119621 7.2 416.6 416.6 416.7 0.1
AT 691.50 2884/444 122706 7.0 417.4 417.4 417.5 0.1
AU 690.50 3806/2142 168374 5.1 417.7 417.7 417.8 0.1
AV 690.00 4283/2456 177609 4.9 418.0 418.0 418.1 0.1
AW 689.25 4993/1592 191744 4.5 418.2 418.2 418.3 0.1
AX 688.50 5027/890 190964 4.5 418.4 418.4 418.5 0.1
AY 688.00 4237/1251 169030 5.1 418.6 418.6 418.7 0.1
AZ 687.25 4118/1117 162904 5.3 418.7 418.7 418.8 0.1
BA 686.25 2707/591 125485 6.9 419.2 419.2 419.3 0.1
BB 685.00 2745/1052 127781 6.8 419.7 419.7 419.8 0.1
BC 684.50 2214/750 116858 7.4 420.1 420.1 420.2 0.1
BD 684.00 2139/272 122176 7.1 420.2 420.2 420.3 0.1
BE 683.25 1647/142 109745 7.9 420.5 420.5 420.6 0.1
BF 682.25 1688/213 101631 8.5 421.3 421.3 421.4 0.11 Miles Below Pittsburgh2 Total Width / Width Within County Boundary
TA
BL
E 1
1
FLOODWAY DATA
PERRY COUNTY, IN
AND INCORPORATED AREAS OHIO RIVER
WATER SURFACE ELEVATION
CROSS SECTION DISTANCE1
FEDERAL EMERGENCY MANAGEMENT AGENCY
FLOODING SOURCE FLOODWAY1- PERCENT ANNUAL CHANCE FLOOD
17
5.0 INSURANCE APPLICATIONS
For flood insurance rating purposes, flood insurance zone designations are assigned to a
community based on the results of the engineering analyses. These zones are as follows:
Zone A
Zone A is the flood insurance risk zone that corresponds to the 1-percent-annual-chance
floodplains that are determined in the FIS by approximate methods. Because detailed
hydraulic analyses are not performed for such areas, no BFEs or base flood depths are shown
within this zone.
Zone AE
Zone AE is the flood insurance risk zone that corresponds to the 1-percent-annual-chance
floodplains that are determined in the FIS by detailed methods. In most instances, whole-
foot BFEs derived from the detailed hydraulic analyses are shown at selected intervals within
this zone.
Zone X
Zone X is the flood insurance risk zone that corresponds to areas outside the 0.2-percent-
annual-chance floodplain, areas within the 0.2-percent-annual-chance floodplain, and areas
of 1-percent-annual-chance flooding where average depths are less
than 1 foot, areas of 1-percent-annual-chance flooding where the contributing drainage area
is less than 1 square mile, and areas protected from the 1-percent-annual-chance flood by
levees. No BFEs or base flood depths are shown within this zone.
Zone X (Future Base Flood)
Zone X (Future Base Flood) is the flood insurance risk zone that corresponds to the 1-
percent-annual-chance floodplains that are determined based on future-conditions hydrology.
No BFEs or base flood depths are shown within this zone.

18
6.0 FLOOD INSURANCE RATE MAP
The FIRM is designed for flood insurance and floodplain management applications.
For flood insurance applications, the map designates flood insurance risk zones as described
in Section 5.0 and, in the 1-percent-annual-chance floodplains that were studied by detailed
methods, shows selected whole-foot BFEs or average depths. Insurance agents use the zones
and BFEs in conjunction with information on structures and their contents to assign premium
rates for flood insurance policies.
For floodplain management applications, the map shows by tints, screens, and symbols, the 1-
and 0.2-percent-annual-chance floodplains, floodways, and the locations of selected cross
sections used in the hydraulic analyses and floodway computations.
The current FIRM presents flooding information for the entire geographic area of Perry
County. Previously, separate FIRMs were prepared for each identified flood prone
incorporated community and for the unincorporated areas of the county. Historical data
relating to the maps prepared for each community are presented in Table 12.
7.0 OTHER STUDIES
This FIS report either supersedes or is compatible with all previous studies on streams studied
in this report and should be considered authoritative for purposes of the NFIP.
8.0 LOCATION OF DATA
Information concerning the pertinent data used in the preparation of this study can be
obtained by contacting the Flood Insurance and Mitigation Division, Federal Emergency
Management Agency, Region V, 536 S. Clark Street, 6th
Floor, Chicago, IL 60605

19
Cannelton, City of November 30, 1973 October 18, 1974 July 18, 1983 None
June 25, 1976
Perry County April 24, 1981 None November 1, 1995 None
(Unincorporated Areas)
Tell City, City of January 16, 1974 None March 1, 1977 None
Troy, Town of May 31, 1974 August 29, 1975 July 5, 1983 None
January 14, 1977
FIRM REVISIONS
DATE
COMMUNITY MAP HISTORY
FEDERAL EMERGENCY MANAGEMENT AGENCY
PERRY COUNTY, IN
(AND INCORPORATED AREAS)
TA
BLE
12
COMMUNITY NAME INITIAL IDENTIFICATION
FLOOD HAZARD
BOUNDARY MAP
REVISIONS DATE
FIRM EFFECTIVE DATE

20
9.0 BIBLIORAPHY AND REFERENCES
1. Federal Emergency Management Agency, Flood Insurance Study, Town of Troy, Indiana, July
5, 1983. Washington, D.C.
2. Federal Emergency Management Agency, Flood Insurance Study, City of Cannelton, Indiana,
January 18, 1983. Washington, D.C.
3. Federal Emergency Management Agency, Flood Insurance Study, City of Tell City, Indiana,
September 1976. Washington, D.C.
4. Geobytes City Distance Tool. Accessed at http://www.geobytes.com/CityDistanceTool.htm.
5. “Historic Census Counts for Indiana Counties, 1900-2000” STATS Indiana, Indiana Business
Research Center, Indiana University Kelley School of Business, accessed at
http://www.stats.indiana.edu/population/PopTotals/historic_counts_counties.asp.
6. “Historic Census for Indiana Incorporated and Census Designated Places from 1900 to 2000”
STATS Indiana, Indiana Business Research Center, Indiana University Kelley School of
Business, accessed at
http://www.stats.indiana.edu/population/PopTotals/historic_counts_cities.asp
7. Indiana Administrative Code 310 IAC 10 Flood Plain Management accessed at
http://www.in.gov/legislative/iac/T03120/A00100.PDF
8. Indiana Code IC 14-28-1, Flood Control Act, accessed at
http://www.in.gov/legislative/ic/code/title14/ar28/ch1.html
9. Indiana Department of Natural Resources, Division of Water, Coordinated Discharges of
Selected Streams in Indiana, accessed at
http://www.in.gov/dnr/water/surface_water/coordinated_discharges/index.html
10. Indiana Department of Natural Resources, Division of Water, General Guidelines For The
Hydrologic-Hydraulic Assessment Of Floodplains In Indiana, December 2002.
11. Indiana Flood Control Act of 1973, Chapter 318, Acts 1945 as found in IC-1971-13-2-22 and
amended by PL 122 Act 1973 and HEA 1156 Acts of 1976.
12. Knipe, David, and Rao, A. R. Estimation of Peak Discharges of Indiana Streams by Using the
Log Pearson III Distribution, Purdue University, School of Civil Engineering, Joint
Transportation Research Program, Project No. C-36-620, File No. 9-8-15, 2005.
13. National Oceanic and Atmospheric Administration, National Climatic Data Center, Monthly
Station Normals of Temperature, Precipitation, and Heating and Cooling Days, 1971-2000,
Climatography of the United States No. 81, 2002.
14. U.S. Army Corps of Engineers, “Civil Engineer Bulletin No. 52-8,” U.S. Army Corp of
Engineers, Washington, D. C., 26 March 1952
15. U.S. Army Corps of Engineers, HEC-2 Water-Surface Profiles Computer Program 723-X6,
L202A, Davis, California, November 1976.
16. U.S Army Crops of Engineers, Statistical Methods in Hydrology, Leo R. Beard, Sacramento,
California, January 1962.
17. U.S. Department of Commerce, “Rainfall Frequency Atlas of the United States,” Technical
Paper Number 40, Weather Bureau, U.S. Department of Comerce, Washington, D. C., May
1961, Reprinted January 1963
18. U.S. Department of the Interior, Geological Survey, Water Resources Investigation 35-75,
Statistical Summaries of Indiana Streamflow Data, February 1976.
19. U.S. Geological Survey, Surface-Water Data for Indiana, Peak-Flow Data for Perry County.
http://nwis.waterdata.usgs.gov/in/nwis/peak.

260
280
300 300
320 320
340 340
360 360
380 380
400 400
420 420
440 440
732 731 730 729 728 727 726 725 724 723 722 721 720 719
ELE
VA
TIO
N IN
FEET
(N
AV
D 8
8)
STREAM DISTANCE IN MILES BELOW PITTSBURGH
FED
ER
AL
EM
ER
GEN
CY
MA
NA
GEM
EN
T A
GEN
CY
PER
RY
CO
UN
TY
, IN
AN
D IN
CO
RP
OR
AT
ED
AR
EA
S
FLO
OD
PR
OFI
LES
OH
IO R
IVER
01P
A B C D E F G H I J K L M
N OP
LIN
CO
LN T
RA
ILS
CI T
Y O
F C
AN
NELT
ON
CA
NN
ELT
ON
DA
M
LEGEND
0.2% ANNUAL CHANCE FLOOD
1% ANNUAL CHANCE FLOOD
2% ANNUAL CHANCE FLOOD
10% ANNUAL CHANCE FLOOD
STREAM BED
CROSS SECTION LOCATION
CO
RP
OR
AT
E L
IMIT
S
HIG
HW
AY
BR
IDG
E
CO
UN
TY
BO
UN
DA
RY
CO
NFLU
EN
CE O
F A
ND
ER
SO
N R
IVER
CI T
Y O
F C
AN
NELT
ON
CO
RP
OR
AT
E L
IMIT
S
CO
RP
OR
AT
E L
IMIT
S
CO
RP
OR
AT
E L
IMIT
S
CO
RP
OR
AT
E L
IMIT
S
CO
RP
OR
AT
E L
IMIT
S
TELL
CIT
Y
TELL
CIT
Y
TO
WN
OF T
RO
Y
TO
WN
OF T
RO
Y
CO
NFLU
EN
CE O
F C
AS
SELB
UR
Y C
REEK
CO
NFLU
EN
CE O
F W
IND
Y C
REEK

260
280
300 300
320 320
340 340
360 360
380 380
400 400
420 420
440 440
719 718 717 716 715 714 713 712 711 710 709 708 707 706
ELE
VA
TIO
N IN
FEET
(N
AV
D 8
8)
STREAM DISTANCE IN MILES BELOW PITTSBURGH
FED
ER
AL
EM
ER
GEN
CY
MA
NA
GEM
EN
T A
GEN
CY
PER
RY
CO
UN
TY
, IN
AN
D IN
CO
RP
OR
AT
ED
AR
EA
S
FLO
OD
PR
OFI
LES
OH
IO R
IVER
02P
Q R S T U V W X Y
Z AA
CO
NFLU
EN
CE O
F C
LOV
ER
CR
EEK
LEGEND
0.2% ANNUAL CHANCE FLOOD
1% ANNUAL CHANCE FLOOD
2% ANNUAL CHANCE FLOOD
10% ANNUAL CHANCE FLOOD
STREAM BED
CROSS SECTION LOCATION
CO
NFLU
EN
CE O
F
CLO
VER
CR
EEK

280
300
320 320
340 340
360 360
380 380
400 400
420 420
440 440
460 460
706 705 704 703 702 701 700 699 698 697 696 695 694 693
ELE
VA
TIO
N IN
FEET
(N
AV
D 8
8)
STREAM DISTANCE IN MILES BELOW PITTSBURGH
FED
ER
AL
EM
ER
GEN
CY
MA
NA
GEM
EN
T A
GEN
CY
PER
RY
CO
UN
TY
, IN
AN
D IN
CO
RP
OR
AT
ED
AR
EA
S
FLO
OD
PR
OFI
LES
OH
IO R
IVER
03P
AB AC AD AE AF AG AH AI AJ AK AL AM
AN AO AP AQ AR
CO
NFL
UEN
CE O
F P
OIS
ON
CR
EEK
LEGEND
0.2% ANNUAL CHANCE FLOOD
1% ANNUAL CHANCE FLOOD
2% ANNUAL CHANCE FLOOD
10% ANNUAL CHANCE FLOOD
STREAM BED
CROSS SECTION LOCATION
CO
NFL U
EN
CE O
F B
EA
R C
REEK
270
290
310 310
330 330
350 350
370 370
390 390
410 410
430 430
450 450
693 692 691 690 689 688 687 686 685 684 683 682 681 680
ELE
VA
TIO
N IN
FEET
(N
AV
D 8
8)
STREAM DISTANCE IN MILES BELOW PITTSBURGH
FED
ER
AL
EM
ER
GEN
CY
MA
NA
GEM
EN
T A
GEN
CY
PER
RY
CO
UN
TY
, IN
AN
D IN
CO
RP
OR
AT
ED
AR
EA
S
FLO
OD
PR
OFI
LES
OH
IO R
IVER
04P
AS AT AU AV AW AX AY AZ BA BB BC BD BE
BF
CO
NF L
UEN
CE O
F O
IL C
REEK
CO
UN
TY
BO
UN
DA
RY
LEGEND
0.2% ANNUAL CHANCE FLOOD
1% ANNUAL CHANCE FLOOD
2% ANNUAL CHANCE FLOOD
10% ANNUAL CHANCE FLOOD
STREAM BED
CROSS SECTION LOCATION

350
360
370 370
380 380
390 390
400 400
410 410
420 420
430 430
440 440
1.00 1.25 1.50 1.75 2.00 2.25 2.50 2.75 3.00 3.25 3.50 3.75 4.00 4.25
ELE
VA
TIO
N IN
FEET
(N
AV
D 8
8)
STREAM DISTANCE IN MILES ABOVE MOUTH
FED
ER
AL
EM
ER
GEN
CY
MA
NA
GEM
EN
T A
GEN
CY
PER
RY
CO
UN
TY
, IN
AN
D IN
CO
RP
OR
AT
ED
AR
EA
S
FLO
OD
PR
OFI
LES
WIN
DY
CR
EEK
05P
ST
AT
E H
IGH
WA
Y 6
6
UN
IMP
RO
VED
RO
AD
14
TH
ST
REET
CO
RP
OR
AT
E L
IMIT
S
CO
RP
OR
AT
E L
IMIT
S
CO
RP
OR
AT
E L
IMIT
S
ST
AT
E H
IGH
WA
Y 3
7
19
TH
ST
REET
TELL
ST
REET
F RA
NK
LIN
ST
REET
LEGEND
0.2% ANNUAL CHANCE FLOOD
1% ANNUAL CHANCE FLOOD
2% ANNUAL CHANCE FLOOD
10% ANNUAL CHANCE FLOOD
STREAM BED
CROSS SECTION LOCATION
LIM
IT O
F D
ET
AIL
ED
ST
UD
Y

390
400
410 410
420 420
430 430
440 440
450 450
460 460
470 470
480 480
4.25 4.50 4.75 5.00 5.25 5.50 5.75 6.00 6.25 6.50 6.75 7.00 7.25 7.50
ELE
VA
TIO
N IN
FEET
(N
AV
D 8
8)
STREAM DISTANCE IN MILES ABOVE MOUTH
FED
ER
AL
EM
ER
GEN
CY
MA
NA
GEM
EN
T A
GEN
CY
PER
RY
CO
UN
TY
, IN
AN
D IN
CO
RP
OR
AT
ED
AR
EA
S
FLO
OD
PR
OFI
LES
WIN
DY
CR
EEK
06P
PES
TA
LOZ
ZI S
TR
EET
WA
SH
ING
TO
N S
TR
EET
ST
AT
E H
IGH
WA
Y 6
6
AC
CES
S R
OA
D
AC
ES
SS
RO
AD
ST
AT
E H
IGH
WA
Y 6
6
CO
RP
OR
AT
E L
IMIT
S
LEGEND
0.2% ANNUAL CHANCE FLOOD
1% ANNUAL CHANCE FLOOD
2% ANNUAL CHANCE FLOOD
10% ANNUAL CHANCE FLOOD
STREAM BED
CROSS SECTION LOCATION
LIM
IT O
F D
ET
AIL
ED
ST
UD
Y