persistance and change in the food security of families with
TRANSCRIPT

Abstract
This report uses data from the Panel Study of Income Dynamics to examine the prevalence of and changes in food security between 1997 and 1999 among individual families with children younger than 13. About half of the families that were food insecure in 1997 became food secure by 1999, with the rest remaining food insecure. Meanwhile, about 7 percent of the families who were food secure in 1997 became food insecure in 1999. Although the food security status for individual families changed substantially, the prevalence of food insecurity was relatively stable: In both years, about 1 family in 10 was food insecure. The report also examines families’ characteristics, income, and Food Stamp Program participation.
Acknowledgment
The programming and research assistance of Huiyan Yeats Ye is gratefully acknowledged.
By Sandra L. Hofferth, Department of Family Studies, University of Maryland
Persistance and Change in the Food Security of Families With Children, 1997-99E-FAN-04-001March 2004
This study was conducted by the University of Maryland under a cooperative research contract with USDA’s Economic Research Service (ERS) Food Assis-tance and Nutrition Research Program (FANRP) (ERS project representative: Parke Wilde). The views expressed are those of the author and not necessarily those of ERS or USDA.

ii
Contents Summary ................................................................................................................................ iii Introduction ............................................................................................................................ 1 Food Insecurity With Hunger................................................................................................ 3 Data and Measurement........................................................................................................... 5 Data...................................................................................................................................... 5 Measurement of Persistence and Entry Into Food Insecurity ................................................. 5 Results ..................................................................................................................................... 7 PSID Estimates of Food Insecurity in 1997 and 1999............................................................ 7 Analysis of Food Insecurity and Food Insecurity Dynamics.................................................. 7 Summary and Conclusions ....................................................................................................23 References ..............................................................................................................................25 Appendix A: The Panel Study of Income Dynamics and the 1997 Child Development Supplement ...............................................................................27

iii
Summary
On average, about 90 percent of families with children younger than 13 were food secure in 1997 and 1999, and about 10 percent were insecure. Although the food security of these families, on average, changed only slightly between 1997 and 1999, food security changed substantially for individual families. This report presents the results of a study on the prevalence of and changes in food security between 1997 and 1999 among individual families with children younger than 13. The study also examined how family characteristics and changes in the characteristics were associated with changes in food security status of the same families over time. Food security means that all household members have access at all times to enough food for an active, healthy life. Using data from the Panel Study of Income Dynamics, a nationally representative study of families that began in 1968, this first examination of the dynamic interdependence of food assistance, food insecurity and a variety of family characteristics over time demonstrates the critical contribution of changing family circumstances to food insecurity. Other findings on the prevalence of and changes in food security are as follows:
♦ Food security changed little over the 2-year period. About 83 percent of families were food secure in both years, 5 percent were insecure in both years, 5.4 percent were food insecure in 1997 but not in 1999 (exited food insecurity), and 6.5 percent were food insecure in 1999 but not 1997 (entered food insecurity).
♦ Food insecurity increased slightly. The share of food-insecure families in 1999 only
(families that entered food insecurity) exceeded the share of food-insecure families in 1997 only (families that exited).
♦ A small share (7 percent) of the families that were food secure in 1997 became food
insecure by 1999.
♦ About half of the families that were food insecure in 1997, however, became food secure by 1999, with the rest remaining food insecure.
Major findings on the influence of family characteristics on food insecurity prevalence and change are as follows:
♦ Family composition and structure were linked to the prevalence of food insecurity. Families with young, single heads and a large number of young children tended either to be food insecure in 1997 or to become food insecure by 1999. Immigrant families were also more likely than nonimmigrant families to be food insecure or to become food insecure, as were families headed by individuals who were less educated or disabled.
♦ Families with low incomes in both years were likely either to be food insecure in both
years or to become food insecure by 1999.

iv
♦ Changes in economic conditions were linked to persistence in food insecurity. Food-
secure families that moved into low-income status between 1997 and 1999 were more likely to remain food insecure than those that were in low-income status in both years.
♦ Changes in family structure were linked to whether or not food-secure families
became food insecure. Families that went from having two parents to one parent between 1997 and 1999 were more likely to become food insecure than those that had one parent in both years. Food-insecure families with two parents in at least one year were less likely to remain food insecure than those with one parent in both years.
♦ Families that were food insecure and receiving food stamps in 1997 were more likely
to remain food insecure if they left the Food Stamp Program. Likewise, families that were food secure and receiving food stamps in 1997 were more likely to become food insecure if they left the program.

1
Persistence and Change in the Food Security of Families
With Children, 1997-99
Sandra L. Hofferth
Introduction
Having sufficient food is a necessary condition for children’s normal growth and development. The academic achievement of children who grow up under insecure conditions has been shown to suffer (Reid, 2001). Consequently, food security is an important condition to examine in the context of children’s well-being. Families with children are more likely to be insecure than all families because parents are younger and family sizes are larger; additional resources are needed if these families are to have a standard of living equal to an average family (Andrews, et al., 2000; Nord, Andrews, and Carlson, 2002). This report focuses on variation in food security and food insecurity among family households with children younger than 13, an important subgroup of the U.S. population. The report first examines changes in food security and insecurity between 1997 and 1999 among individual families with children under age 13. Food security means that all family members had access at all times to enough food for an active, healthy life. The report then examines how characteristics and changes in characteristics are associated with changes in families’ food insecurity status. Food insecurity is measured here using data from the Panel Study of Income Dynamics (PSID), a large-scale survey. Families are screened by asking whether, in the past 12 months, they sometimes or often did not have enough to eat because they did not have enough money for food. If the answer is yes, they then answer a set of 18 questions that will identify whether the family has consistently had access to enough food in the past 12 months (Hamilton et al., 1997). (See box for examples of the 18 questions.) Families that answer the first three questions (see box) as sometimes or often in the previous year are said to be food insecure. The questions further distinguish among food-insecure families those that have had food insecurity with hunger, family members went without food or were hungry because they did not have enough food, and food insecurity without hunger. For four out of five food-insecure families, food insecurity is not a chronic problem. Families that experience only one severe episode of food insecurity or hunger during the year are considered to be food insecure. Because of a single severe episode, for example, some families with annual incomes considerably above poverty may still be considered food insecure for the year. To be classified as food insecure with hunger requires recurring

2
episodes of food insecurity (Nord, Andrews, and Carlson, 2002). Families that answered affirmatively to whether adults cut the size of meals or skipped meals three or more times in the last year as well as to less severe conditions are considered food insecure with hunger.1 This report is based primarily upon the dichotomous measure of family food insecurity; in the data used here, the number of families that experienced hunger in either 1997 or 1999 is too small to estimate changes over time in the proportion of families that are food insecure with hunger. The prevalence of food security and food insecurity for national samples is well known. According to national data from the Current Population Survey (CPS), 87 out of 100 households with children under age 18 were food secure in 1997 and 85 out of 100 were food secure in 1999 (table 1, panel A) (Andrews et al., 2000; Bickel, Carlson, and Nord, 1999). This means that the vast majority of households in the United States reported that they were able to acquire adequate food to meet the basic needs of their households throughout the year. However, 13-15 percent reported that they had more serious concerns about their ability to feed their families adequately. Although the results in table 1 are reported separately for children and for their families, the results differ little whether the unit of analysis is families with children or just children. In this report, the family household is the unit because we focus upon family characteristics and discuss our findings with reference to all families in the U.S. Food insecurity is also measured for the family, not the individual.
1 Although USDA also provides a measure of hunger among children, this report focuses on the food security and hunger of the entire household and does not use the measure of food insecurity with hunger among children. The focus of the study is household food insecurity. Not all individuals are necessarily food insecure; we cannot identify the specific individuals to which food insecurity applies.
Examples of Questions From the PSID Food Security Supplement
“We worried whether our food would run out before we got money to buy more. Was that often, sometimes, or never true for your household in the last 12 months?” “The food that we bought just didn’t last, and we didn’t have money to get more. Was that often, sometimes, or never true for your household in the last 12 months?” “We couldn’t afford to eat balanced meals. Was that often, sometimes, or never true for your household in the last 12 months?” “In the last 12 months did you (or other adults in your household) ever cut the size of your meals or skip meals because there wasn’t enough money for food?” If yes, “How often did this happen – almost every month, some months but not every month, or in only 1 or 2 months?”

3
Table 1: Food security of children and their families, 1997 and 1999
Panel A: Current Population Survey
Category Year Food secure Food insecure without hunger
Food insecure with hunger Total (%)
Population estimates
Families with children under age 18
1997 87.2 9.1 3.7 100.0 37,497,000
Families with children under age 18
1999 85.2 11.5 3.3 100.0 37,884,000
Children under age 18 1997 85.4 10.5 4.1 100.0 70,948,000
Children under age 18 1999 85.1 11.2 3.7 100.0 71,493,000
Panel B: Panel Study of Income Dynamics
Category Year Food secure Food insecure without hunger
Food insecure with hunger Total (%)
Sample size
Families with children under age 13
1997 89.6 8.2 2.2 100.0 2,258
Families with children under age 13
1999 88.6 9.2 2.3 100.0 2,267
Children under age 13 1997 89.0 8.9 2.2 100.0 3,380
Children under age 13 1999 87.4 10.0 2.6 100.0 3,391
Food Insecurity With Hunger According to CPS data, fewer than 15 percent of families with children under age 18 were food insecure in 1997 or 1999. Of those, fewer than one-third, specifically, 3.7 percent in 1997 and 3.3 percent in 1999, were food insecure with hunger (table 1, panel A). Between 1997 and 1999, the share of families that were food insecure with hunger fell slightly and the share that were food insecure without hunger rose slightly. The first objective of this report is to understand changes in food insecurity over time. Although the average proportion of families with children that were insecure may not have increased, some families that were secure may have become insecure and others that were insecure may have become secure. The overall stability of the mean masks changes in individual families’ well-being. Food insecurity could be stable because the same families are food insecure year after year with little change. Or, it could be that there is considerable movement of families in and out of food insecurity, but that entries balance exits. While the CPS provides excellent data on food security at one point in time, it cannot show patterns of entry and exit. The PSID has been widely used to examine trends in family experiences with poverty and with welfare participation (Duncan, 1991; Duncan, Hill, and Hoffman, 1988; Hofferth, Stanhope, and Harris, 2002).

4
Additionally, while previous research has analyzed changes in food insufficiency over time using a single-item measure (Ribar and Hamrick, 2003), it has not examined food insecurity. This report improves upon previous research by using the 18-item index of food security designed by USDA for this purpose (Nord, Andrews, and Carlson, 2002). Thus, this report is the first to provide information on changes in the food security status of the same families over time. The second objective of the report is to understand how characteristics and changes in characteristics are associated with changes in food security status. Looking at the same families over time helps explain the sources of change. Because food insecurity is likely to be episodic rather than chronic, changes in family circumstances, including changing family size and composition (marital separation, divorce, remarriage, having a baby), and in economic resources (unemployment, job changes) will likely be associated with entry into or exit from food insecurity. Research using cross-sectional data shows a strong inverse correlation between either annual household income or income relative to the poverty line and food insecurity (Hamilton et al., 1997). For example, 36.5 percent of households with poverty ratios of under 1.0 are food insecure compared with 18.9 percent of households with incomes under 185 percent of poverty and 4.9 percent of families with incomes over 185 percent of poverty (Nord, Andrews, and Carlson, 2002:Table 2). A substantial proportion of families lose income (Duncan 1991) and may also experience food insecurity. In addition, although economic resources and family structure are likely to be critical, changes in disability may also occasion food-insecure periods. Finally, receipt of food assistance in the form of food stamps may be associated with food insecurity. At any one point in time, those who receive food stamps are also the most needy and therefore the most food insecure (Gundersen and Oliveira 2001). Thus, on the one hand, we expect food insecurity and receipt of food stamps to go together. On the other hand, participating in the Food Stamp Program may reduce food insecurity while leaving the program may increase the risk of becoming food insecure. Research shows that receipt of a high level of food assistance is associated with a significantly higher probability of a family obtaining sufficient food, defined by a level slightly above the thrifty food plan, than not obtaining it (Daponte, Haviland, and Kadane, 2002). This report shows how characteristics of the family and changes in family composition and size, receipt of food stamps, disability, and financial resources are associated with changes in food security status.

5
Data and Measurement Data The data for this report are drawn from the Panel Study of Income Dynamics (PSID), a nationally representative longitudinal study of families that began in 1968.2 Data on income, cash and noncash transfers, and marital and fertility behavior have been collected annually through 1997 and biennially thereafter. When appropriate weights are used, as was the case here, the data are representative of the population of the United States in each year. See appendix A for more information on this study. Comparable data on food security were collected from families with children under age 13 interviewed in 1997 and from all families interviewed in 1999. The subset of children’s families interviewed in 1997 was matched to their families in 1999 to form the longitudinal data for this study. Measurement of Persistence and Entry Into Food Insecurity In order to examine changes in food security of children’s families, we first categorized families as (a) food secure in both 1997 and 1999, (b) food insecure in both years, (c) food insecure in 1997 but not in 1999, and (d) food insecure in 1999 but not in 1997. Categories (a) and (b) indicate continuation of the 1997 food security status from 1997 to 1999, while categories (c) and (d) indicate a change in food security status. We examine these four categories according to family demographic and economic characteristics, such as age of child, age of head, race, education, family size, family structure, having low family income (under 185 percent of the poverty line), disability, immigrant/citizen status, and receipt of food stamps. These characteristics have been shown to be associated with food insufficiency or food insecurity in other studies (Borjas, 2002; Gundersen and Oliveira, 2001; Nord, Andrews, and Carlson, 2002; Ribar and Hamrick, 2003). Our variables include not only the characteristics of families in 1997, but also changes in them between 1997 and 1999. We examine changes in family size, family structure, low income, receipt of food stamps, and disability. Thus, this report describes not only how levels of these characteristics (e.g., the amount of family income in a year) but also how changes in family characteristics (e.g., the amount by which income changed between 1997 and 1999) are related to the level and change in food insecurity status between 1997 and 1999. To better describe the dynamics of food insecurity over the period, we calculated two additional statistics: persistence and entry. Persistence is the proportion of food-insecure families with children in 1997 that were still food insecure in 1999, calculated as the number of food insecure families in both years divided by the number of food insecure families in both years plus the number of food insecure families in 1997 only. Subtracting the proportion that persists from 1 equals the proportion that became food secure, “exiters.” Because the fraction of food insecure families is small, changes comprise a large proportion of the base. Entry is the proportion of families who were not food insecure in 1997 but became food insecure by 1999, calculated as the
2 The PSID is a study of families. Because cohabiting partners are treated as married partners and included in the family and all our families have children, the PSID family is equivalent to the Census Bureau’s “family household.” A small number of subfamilies are counted as separate families in the PSID instead of being counted as part of the household in which they reside.

6
number of food insecure families in 1999 only, divided by the number of food secure families in both years plus the number of food secure families in 1999 only. The fraction that is food secure is large and includes high- as well as low-income households; entrants, therefore, constitute only a small fraction of the food-secure group from year to year. Even if entrants are equal in number to persisters, entrants can still comprise only a small fraction of those families eligible to enter. If entrants and exiters are similar in absolute numbers, the total number of food-insecure/food-secure families remains stable from year to year. If, as we show here, entrants exceed exiters, food insecurity rises. We report how each of the demographic and economic characteristics is related to the four categories of food insecurity in 1997 and 1999 and then to persistence and to entry between the two time points. This model assumes that food insecurity persistence and entry result from economic and family circumstances in 1997 and changes in those circumstances between 1997 and 1999. First, each characteristic alone is examined. In bivariate analyses, however, the separate impacts of each variable cannot be estimated because many of these characteristics co-occur. Consequently, using logistic regression, persistence (and, then, entry) is regressed on all of these family characteristics and circumstances simultaneously.3 The coefficients in this model indicate the influence of a single variable on persistence or entry net of all the other variables. Because the model is not linear, coefficients are not as easily interpreted as in ordinary least squares regression. We have transformed each coefficient into an odds ratio by exponentiating. If the independent variable is categorical, the result is the risk ratio or odds ratio of each category relative to the omitted category (table 3, columns 3 and 6). Subtracting 1 from the odds ratio and multiplying by 100 represents the percentage increase or decrease in the adjusted odds of persisting in or becoming food insecure associated with the category of interest relative to the comparison category. If the variable is continuous, the difference between the odds ratio and 1 multiplied by 100 represents the percentage increase or decrease in the adjusted odds of a 1-unit change in the independent variable.
3 ititzixiitit ezxPP +++=− ββα))1/(ln(
where:
itP is a probability of a particular transition, either entry or persistence.
xi is a vector of time-invariant explanatory variables for family i.
zit is a vector of time-varying explanatory variables for family i in year t.
ite is an error term for family i in year t.

7
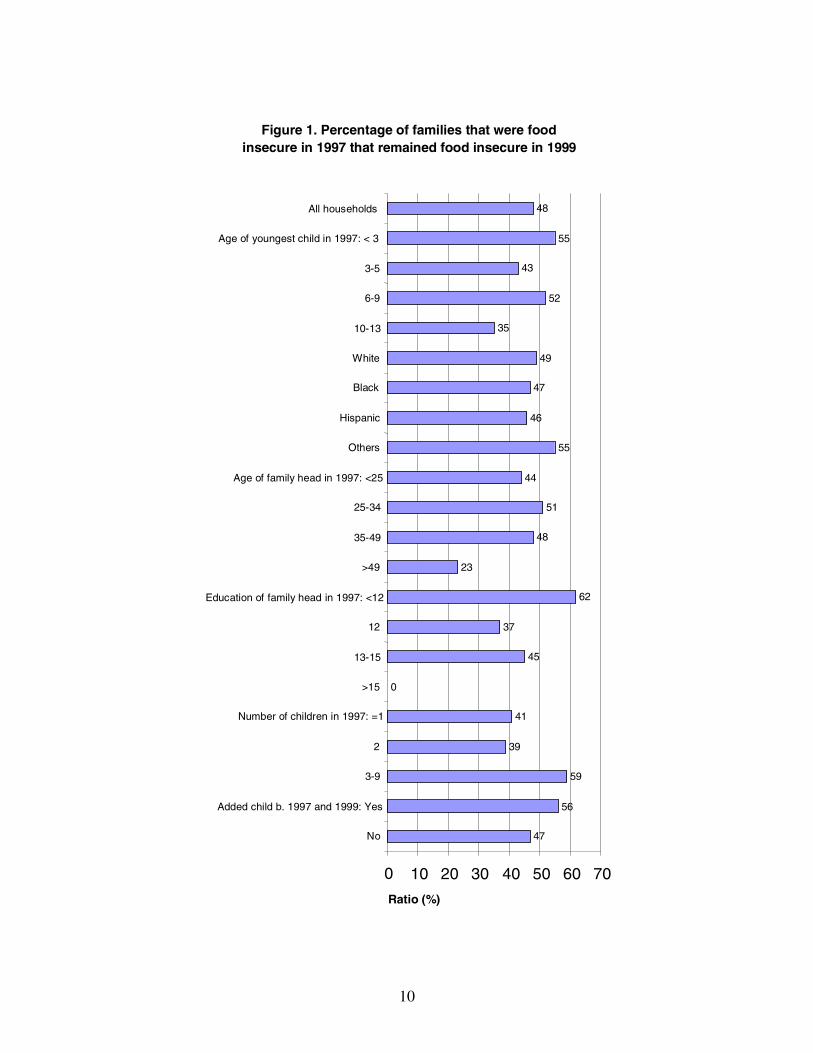
Results First, we examine the overall levels of food insecurity of families with children in 1997 and 1999 as reported in the PSID and compare them with data from the CPS to demonstrate how the smaller sample survey compares with larger national data on the same food security scale. Second, we examine the relationship between each of the demographic and economic variables and food insecurity, both separately and in a multivariate context controlling for other factors. PSID Estimates of Food Insecurity in 1997 and 1999 Table 1, panel B, shows the proportion of families with children under age 13 that were food secure and food insecure with and without hunger in 1997 and 1999, according to the PSID. The food security of children’s families declined from 89.6 percent to 88.6 percent, and food insecurity rose from 10.4 percent to 11.5 percent. Food insecurity with hunger stayed the same over the period, about 2.2 percent, while food insecurity without hunger rose from 8.2 percent to 9.2 percent. The proportion of PSID families that were food secure is slightly higher in these data than in comparable CPS figures for families with children. In 1999, 88.6 percent were food secure, according to the PSID, and 85.2 percent were food secure, according to the CPS. This difference could result from differences in the population covered, because the PSID includes only families with children under 13 in 1997 whereas the CPS includes households with any children under age 18. In addition, the proportion of children that are in food-secure families is higher in the PSID data than in the CPS. In 1999, 87.4 percent of children were in food-secure families in the PSID and 85.1 percent of children under age 18 were in food-secure families in the CPS. The discrepancy may be due to the difference in ages of children included. In this report, the focus is on children’s families because we lack information on food security for individual children. Analysis of Food Insecurity and Food Insecurity Dynamics The top row, “All,” of table 2 shows the prevalence of food security in families in 1997 and 1999. Overall, 83.2 percent of American families with children were food secure in both 1997 and 1999, 5 percent were food insecure in both years, 5.4 percent were food insecure in 1997 but secure by 1999, and 6.5 percent were secure in 1997 but insecure by 1999. A higher proportion entered food insecurity (6.5 percent) than exited (5.4 percent), leading to a decline in food security (table 1). Food insecurity is low but persistent over the 2-year period. Only 10.4 percent were food insecure in 1997 (obtained by summing the 5.0 percent food insecure in both years and the 5.4 percent food insecure in 1997 only). The “Persistence” column of table 2, and the top row, “All households,” of figure 1 show the persistence in food insecurity between 1997 and 1999. About half (48 percent) of those families who were food insecure in 1997 were still food insecure in 1999. The other half (52 percent, not shown) became food secure--that is, they “exited” the status of food insecure and became food secure.

8
Table 2: Food security of families with children under 13, 1997 and 1999
Category
Food secure
in both years(%)a
Food
insecure in both
years(%)
Food
insecure in 1997
only(%)
Food
insecure in 1999
only(%)
Total(%) Persistenceb
(%)
Entryc
(%)
Sample
size
All 83.2 5.0 5.4 6.5 100.0 48 7 2,258
Age of youngest child, 1997
< 3 80.8 5.6 4.6 9.0 100.0 55 10 762
3-5 81.5 4.6 6.1 7.9 100.0 43 9 575
6-9 83.8 5.9 5.5 4.7 * 100.0 52 5 532
10-13 88.6 ** 3.0 5.7 2.8 *** 100.0 35 3 389
Total number 1,826 119 143 170 2,258
Race
White 88.1 3.4 3.6 4.8 100.0 49 5 1,086
Black 77.5 *** 6.2 * 6.9 * 9.4 ** 100.0 47 11 928
Hispanic 59.8 *** 12.3 *** 14.4 *** 13.5 *** 100.0 46 18 144
Other 75.4 ** 9.0 * 7.4 8.2 100.0 55 10 81
Total n 1,812 118 142 167 2,239
Age of family head in 1997
<25 67.6 8.2 10.4 13.8 100.0 44 17 202
25-34 80.1 ** 6.5 6.1 7.3 * 100.0 51 8 736
35-49 85.9 *** 4.1 4.3 * 5.7 ** 100.0 48 6 1,171
>49 90.2 *** 1.7 * 5.7 2.4 ** 100.0 23 3 149
Total n 1,826 119 143 170 2,258
Education of family head in 1997
<12 64.9 13.5 8.5 13.1 100.0 62 17 546
12 81.1 *** 4.2 *** 7.1 7.6 ** 100.0 37 9 688
13-15 88.6 *** 3.8 *** 4.6 * 3.0 *** 100.0 45 3 502
>15 96.0 *** 0.0 *** 1.8 *** 2.2 *** 100.0 0 2 412
Total n 1,741 114 136 157 2,148
Number of children, 1997
1 87.2 3.2 4.5 5.1 100.0 41 6 706
2 86.3 3.4 5.1 5.3 100.0 39 6 914
3-9 74.1 *** 9.4 *** 6.6 9.9 *** 100.0 59 12 638
Total n 1,826 119 143 170 2,258
Added child between 1997 and 1999
Yes 76.9 6.0 4.8 12.3 100.0 56 14 326
No 84.1 ** 4.8 5.5 5.6 *** 100.0 47 6 1932
Total n 1,826 119 143 170 2,258
Family status
Become single parent 72.7 3.1 * 11.7 12.6 100.0 21 15 137
Become two parents 73.8 3.9 * 8.4 14.0 100.0 32 16 118
Two parents in both years 87.9 *** 3.2 *** 4.0 ** 5.0 * 100.0 44 5 1,390
Single parent in both years 71.7 12.3 7.7 8.4 100.0 61 10 613
Total n 1,826 119 143 170 2,258
Low income, 1997-1999
Low income in 1997 only 79.6 *** 3.2 12.2 *** 5.0 100.0 21 6 273
Low income in 1999 only 84.1 ** 5.0 * 3.5 7.4 100.0 59 8 150
Low income in both years 54.9 *** 16.9 *** 12.0 *** 16.2 *** 100.0 59 23 609
Low income in neither year 93.1 1.4 2.1 3.4 100.0 40 4 1,209
Total n 1,815 119 142 165 2,241
See footnotes at end of table. Continued—

9
Table 2: Food security of families with children under 13, 1997 and 1999—Continued
Category
Food secure
in both years(%)a
Food
insecure in both
years(%)
Food
insecure in 1997
only(%)
Food
insecure in 1999
only(%)
Total(%) Persistenceb
(%)
Entryc
(%)
Sample
size
Citizenship
Citizen 85.8 3.8 4.8 5.6 100.0 44 6 2,127
Noncitizen 55.0 *** 17.8 *** 11.3 ** 15.9 *** 100.0 61 22 131
Total n 1,826 119 143 170 2,258
Immigrant status
Immigrant 61.4 *** 14.4 *** 9.5 14.7 *** 100.0 60 19 183
Nonimmigrant 86.1 3.7 4.8 * 5.4 100.0 43 6 2075
Total n 1,826 119 143 170 2,258
Food stamps received
Leave food stamps 52.6 *** 14.1 *** 14.9 *** 18.5 *** 100.0 49 26 213
Start food stamps 55.1 *** 7.8 ** 20.3 *** 16.8 *** 100.0 28 23 88
Food stamps received in both years 53.4 *** 26.8 *** 7.8 * 12.0 *** 100.0 77 18 264 Food stamps received
in neither year 90.1 1.8 3.7 4.4 100.0 33 5 1,689
Total n 1,824 119 143 168 2,254
Family head disabled
Head disabled in 1997 only 73.5 * 3.4 10.0 13.1 * 100.0 25 15 93
Head disabled in 1999 only 75.8 * 13.5 *** 4.4 6.2 100.0 75 8 129
Head disabled in both years 66.8 *** 12.7 *** 9.0 11.6 * 100.0 59 15 126
Head disabled in neither year 85.0 4.0 5.1 5.9 100.0 44 7 1,878
Total n 1,800 118 142 166 2,226
aThe comparison category for statistical tests is italicized. bPersistence = Insecure in both years/(insecure in both years+insecure in 1997 only). cEntry = Insecure in 1999 only/(secure in both years+insecure in 1999 only). * = p<0.05, ** = p<0.01, *** = p<0.001.
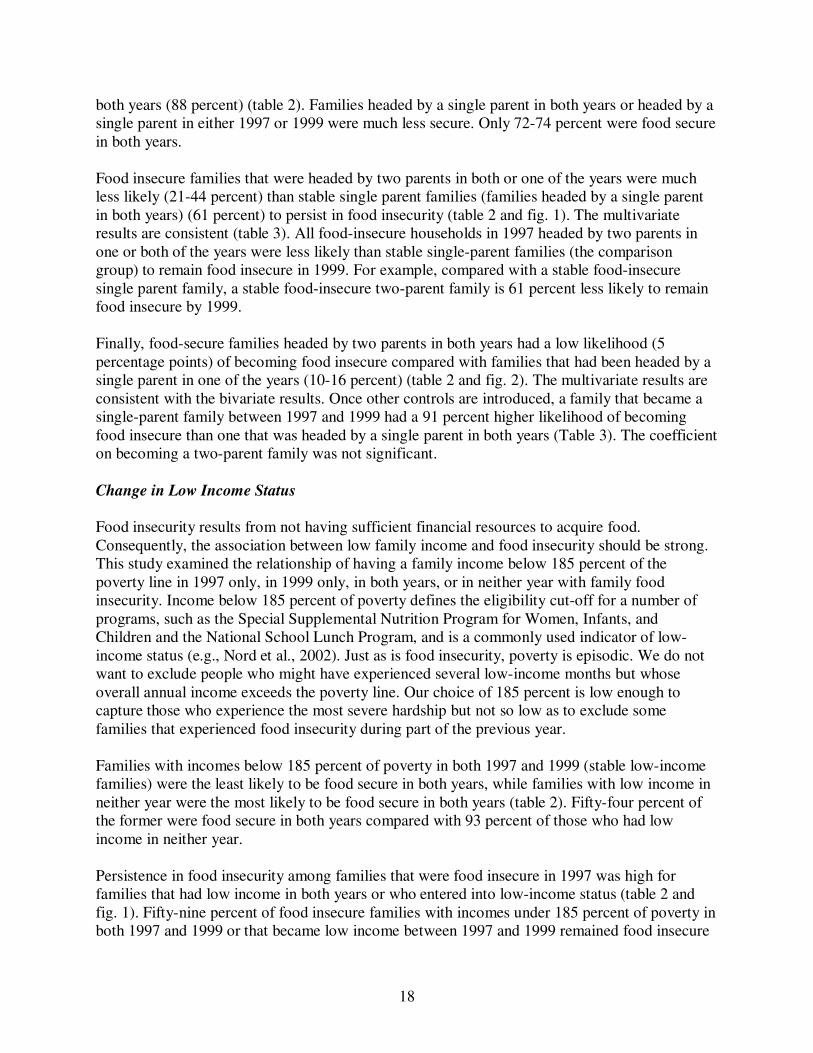
Almost 9 out of 10 families were food secure in 1997 (sum of 83.2 percent and 6.5 percent). Among those who were food secure in 1997, about 7 percent became food insecure by 1999 (Table 2, “Entry” column and fig. 2, top row, “All households”). A person who was food insecure in 1997 was almost seven times (48 percent vs. 7 percent) as likely to be food insecure in 1999 as a person who was food secure in 1997. These data summarize trends over all families with children under age 13. Food insecurity levels, persistence, and entry rates differ by family characteristics. Next, we examine how each of these family and socioeconomic characteristics is related to food insecurity prevalence, persistence, and entry. Age of Youngest Child Adults in families with young children are likely to be young and financially insecure because they are just starting their careers. We expect them to be less food secure as well. According to the data, 80.8 percent of families with the youngest child under age 3 were food secure in both
10
Figure 1. Percentage of families that were food insecure in 1997 that remained food insecure in 1999
47
56
59
39
41
0
45
37
62
23
48
51
44
55
46
47
49
35
52
43
55
48
0 10 20 30 40 50 60 70
No
Added child b. 1997 and 1999: Yes
3-9
2
Number of children in 1997: =1
>15
13-15
12
Education of family head in 1997: <12
>49
35-49
25-34
Age of family head in 1997: <25
Others
Hispanic
Black
White
10-13
6-9
3-5
Age of youngest child in 1997: < 3
All households
Ratio (%)

11
Figure 1. Percentage of families that were food insecure in 1997 that remained food insecure in 1999—Continued
44
59
75
25
33
77
28
49
43
60
61
44
40
59
59
21
61
44
32
21
0 20 40 60 80
Family head disabled in neither year
Family head disabled in both years
Family head disabled 1999 only
Family head disabled 1997 only
Food stamps in neither year
Food stamps in both years
Start food stamps
Leave food stamps
Nonimmigrant
Immigrant
Noncitizen
Citizen
Low income in neither year
Low income in both years
Low income in 1999 only
Low income in 1997 only
Single parent in both years
Two parents in both years
Become two parents
Become single parent
Ratio (%)

12
Figure 2. Percentage of food secure families in 1997 that became food insecure in 1999
6
14
12
6
6
2
3
9
17
3
6
8
17
10
18
11
5
3
5
9
10
7
0 5 10 15 20
No
Added child b. 1997 and 1999: Yes
3-9
2
Number of children in 1997: =1
>15
13-15
12
Education of family head in 1997: <12
>49
35-49
25-34
Age of family head in 1997: <25
Others
Hispanic
Black
White
10-13
6-9
3-5
Age of youngest child in 1997: < 3
All households
Ratio (%)

13
Figure 2. Percentage of food secure families in 1997 who became food insecure in 1999—Continued
7
15
8
15
5
18
23
26
5
19
22
6
4
23
8
6
10
5
16
15
0 5 10 15 20 25 30
Family head disabled in neither year
Family head disabled in both years
Family head disabled 1999 only
Family head disabled 1997 only
Food stamps in neither year
Food stamps in both years
Start food stamps
Leave food stamps
Nonimmigrant
Immigrant
Noncitizen
Citizen
Low income in neither year
Low income in both years
Low income in 1999 only
Low income in 1997 only
Single parent in both years
Two parents in both years
Become two parents
Become single parent
Ratio (%)
14
1997 and 1999, compared with 88.6 percent of families with children ages 10-13, a significant difference (table 2). Persistence in food insecurity between 1997 and 1999 is high (table 2, “Persistence” column and fig. 1). If families were food insecure in 1997, they were likely to remain food insecure in 1999. However, food-insecure families with children ages 10-13 were least likely to remain insecure. Only 35 percent remained food insecure between 1997 and 1999. In contrast, 55 percent of families with a youngest child under age 3 remained food insecure. When other factors are controlled (table 3, “Persistence” columns), the age of the youngest child in 1997 is no longer related to food insecurity. This is likely because we have controlled for the kinds of income differences that distinguish between families with younger and with only older children. Food-secure families with young children under age 3 or between ages 3 and 5 are also more likely to enter food insecurity than families with children age 6 and older and none younger. About 10 percent of the former become food insecure compared with 3-5 percent of families with only older children (table 2, “Entry” column and fig. 2). The multivariate analysis (table 3, “Entry”) shows that the risk of food-secure families becoming food insecure declines about 6 percent for each year of age of the youngest child, even after controlling for income and other factors. Having younger children reflects not just lower income but a less secure life-cycle stage. Race/Ethnicity Black families, Hispanic families, and families of other races/ethnicities are less likely to be food secure than White families, 88 percent of whom were food secure in both 1997 and 1999, with Hispanic families least likely to be food secure (table 2). Although the proportion of Hispanic families that were food secure in both 1997 and 1999 (60 percent) is considerably lower than the other groups, it is not unreasonable. The proportion of Hispanic families with children in the PSID that were food secure in 1999 (73.3 percent, obtained by summing the proportion that were food secure in both years and food insecure in 1997 only) is about the same as the proportion of Hispanic children’s families in the CPS who were food secure in 2001 (71.4 percent) (Nord, Andrews, and Carlson, 2002, table 6). Among food insecure families in 1997, persistence varies little across race/ethnic groups (table 2 and fig. 1). There are no large differences in persistence by race/ethnicity, which is borne out in the multivariate models (table 3). The persistence coefficients for Black, Hispanic, and other families are not statistically significant. In contrast, ethnic groups differ in entry into food insecurity. In the bivariate analysis (Table 2 and fig. 2), Hispanic families were more likely to become food insecure between 1997 and 1999 than other families. However, differences in food insecurity between Hispanic and White families (table 2) are likely to result from different financial resources since Hispanic families were 75 percent less likely to enter food insecurity in the multivariate analysis that controlled for such income differences (table 3). Families of other race/ethnicities are also less likely to become food insecure, net of other factors.

15
Table 3: Logistic regression estimates of persistence and entry
into food insecurity of families with children Entry
(Becomes food insecure) Persistence
(Remains food insecure)
β Std.
Error Risk
Ratio β Std.
Error Risk
Ratio
Intercept 0.192 0.613 1.943 1.224
Age of head -0.046 *** 0.013 0.955 -0.017 0.026 0.984
Education of head -0.078 ** 0.027 0.925 -0.184 ** 0.064 0.832
White omitted omitted
Black 0.190 0.282 1.209 -0.638 0.477 0.528
Latino -1.388 * 0.578 0.250 -0.759 0.721 0.468
Other -1.523 * 0.682 0.218 -0.825 0.851 0.438
Age of youngest in 97 -0.063 + 0.034 0.939 -0.056 0.056 0.946
Added child 1997-99 0.425 0.263 1.530 0.435 0.557 1.545
Number of children in 1997 0.281 ** 0.099 1.325 0.295 + 0.173 1.343
Received food stamps in 1997 only 0.594 + 0.324 1.811 0.833 + 0.471 2.300
Received food stamps in 1999 only 0.178 0.415 1.195 0.720 0.718 2.055
Received food stamps in both years -0.053 0.351 0.948 1.809 *** 0.543 6.107
Received food stamps in neither year omitted omitted
Low income in 1997 only -1.229 ** 0.372 0.293 -0.139 0.552 0.870
Low income in 1999 only -0.832 * 0.386 0.435 1.471 + 0.809 4.351
Low income in neither year -1.242 *** 0.292 0.289 1.287 * 0.533 3.623
Low income in both years omitted omitted
Two parents only in 1997 0.649 + 0.366 1.914 -2.092 ** 0.778 0.123
Two parents only in 1999 0.268 0.424 1.308 -1.688 * 0.820 0.185
Two parents in both years -0.253 0.293 0.776 -0.936 * 0.440 0.392
Single parent in both years omitted omitted
Immigrant 2.238 *** 0.497 9.378 0.932 0.676 2.538
Disabled only in 1997 0.178 0.490 1.195 -1.069 0.835 0.343
Disabled only in 1999 0.036 0.435 1.036 -0.071 0.604 0.931
Disabled in both years 0.880 * 0.355 2.410 -0.005 0.577 0.995
Disabled in neither year omitted omitted
- 2 Log Likelihood 760.112
238.932
p-value <.0001 <.0001
Number of cases 1,855
247
* = p<0.05, ** = p<0.01, *** = p<0.001, + = p<0.10.

16
Age of Head Older heads are more mature and may be better experienced in obtaining the types of resources they need for food security. Overall, families with older heads are more likely to be food secure than those with younger heads (table 2). In both years, 90 percent of families with heads age 50 or older reported being food secure, compared with 67.6 percent of families with heads under age 25. When we examine persistence, we find that families with the oldest heads (age 50 plus) that were food insecure in 1997 were less likely to be insecure in 1999 than food insecure families with heads under age 50 (table 2 and fig. 1). However, when controls are introduced for income and other factors (table 3), the age difference in persistence disappears. Given two families who are food insecure initially, the age of the head per se does not predict which one will remain insecure 2 years later. However, the age and, therefore, the maturity of head are important in entry into food insecurity. In the bivariate analysis, families with the youngest heads (under age 25) are the most likely to become food insecure (table 2 and fig. 2). Between 1997 and 1999, 17 percent of families with a head under age 25 became food insecure, compared with only 3 percent of families with a head 50 and older. This negative relationship between age of head and entry remains even after controlling for income, education and other factors (table 3). Each additional year the head is older is associated with a 4.5-percent reduction in the chance of a food-secure family entering food insecurity. Education of Head Less-educated heads may have trouble getting or adequately managing the resources of the family. In the bivariate analysis, we see that children’s families were more likely to be food secure in both years if the head had completed high school or some college than if the head had completed fewer than 12 years of school (table 2). Families in which the head had completed fewer than 12 years of school were also very likely to remain food insecure, once in that state. Between 1997 and 1999 62 percent remained food insecure (table 2 and fig. 1). In contrast, none of the families that were insecure in 1997 but headed by an individual with a college degree or higher remained insecure. The multivariate analysis shows a significant negative relationship between a family head’s education and persistence in food insecurity even after controlling for family income (table 3), suggesting that a low level of education does not lead to food insecurity through lower income but through unmeasured factors, such as the ability to manage resources. Families headed by a poorly educated head were also highly likely to enter food insecurity between 1997 and 1999 (table 2 and fig. 2). The multivariate results, which show a significant negative relationship between head’s education and entry into food insecurity, after controlling for other factors, are consistent with the bivariate findings (table 3). Each additional year of schooling is associated with a 2.5-percent decline in entry into food insecurity.

17
Number of Children in the Family Unit The number of children the family supports is a critical determinant of its well-being because large families require more resources. Consistent with this expectation, we see that large families were less likely than small families to be food secure in both 1997 and 1999 (Table 2). Once large families become food insecure, they are more likely to remain that way; 59 percent of families with three or more children that were food insecure in 1997 were still food insecure in 1999 compared with only 39-41 percent of families with one or two children (table 2 and Fig. 1). However, in the multivariate analysis, the positive association between family size and food insecurity is no longer significant (table 3), suggesting that factors other than family composition, such as income and education, explain the bivariate association of family size with persistence. Large families were more likely to become food insecure compared with small families (table 2 and fig. 2). Between 1997 and 1999, 12 percent of food-secure families with three or more children became food insecure, compared with 6 percent of food-secure families with one or two children. The results hold up in the multivariate results (table 3). Each additional child in the family in 1997 raises the chance of a food-secure family becoming food insecure between 1997 and 1999 by 32 percent, controlling for income and other factors. Added a Child between 1997 and 1999 Because children increase the financial resources needed to be food secure, families that added a child between 1997 and 1999 were at higher risk of being food insecure in both years than those who did not (table 2). As expected, food insecure families that had a child between 1997 and 1999 were more likely to remain food insecure than those that did not have a child (table 2 and fig. 1); 56 percent remained food insecure compared with 47 percent of those who did not have a child. However, this result does not hold up in the multivariate analysis (table 3). After controlling for other factors, there is no longer a difference in persistence by whether families had a child or not. Additionally, food-secure families who had a child were more likely to become food insecure compared with those who did not have a child; 14 percent became food insecure, compared with 6 percent of those who did not have a child (table 2; fig. 2). The multivariate results (table 3), however, do not confirm that families that added a child are more likely to enter food insecurity than those that did not (table 3). Total number of children appears to be more important than the birth of a child, net of other factors. Change in Family Structure Between 1997 and 1999 Both stability, that is, no change between 1997 and 1999, and change in family structure are important to food insecurity. Families headed by only one parent are at greater risk of food insecurity than families with two parents to share the financial support of the family and care of children. Families headed by two parents in both years were more likely to be food secure in
18
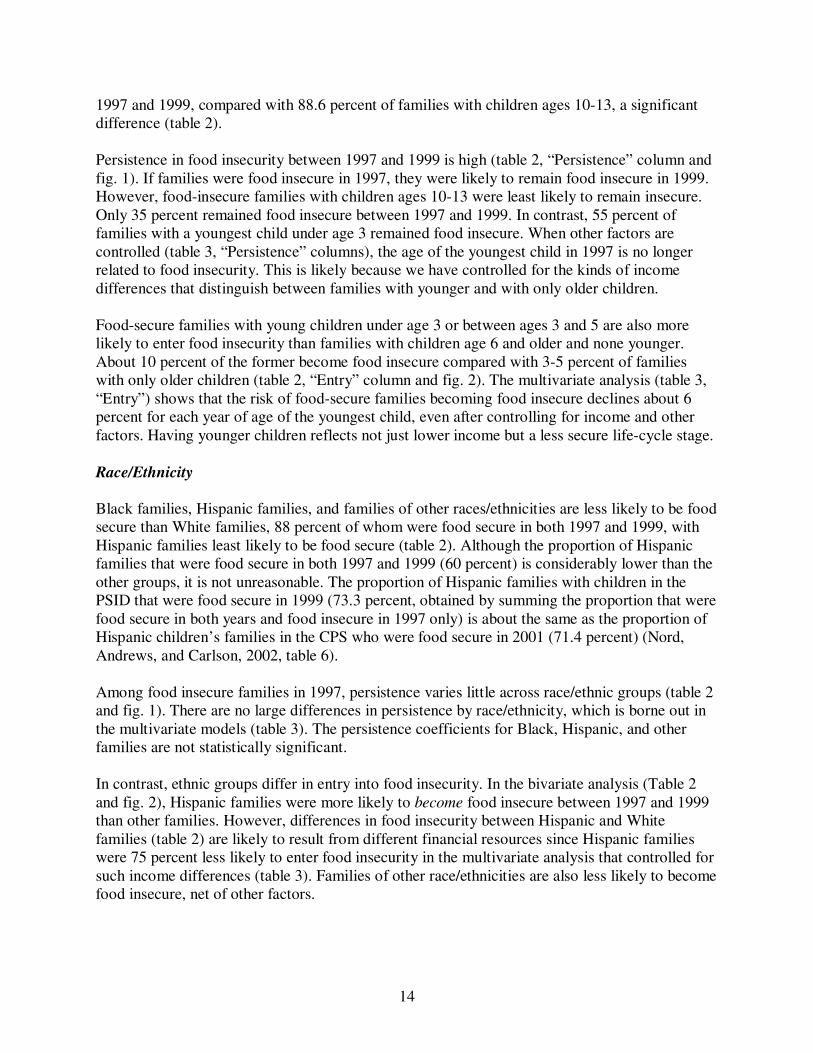
both years (88 percent) (table 2). Families headed by a single parent in both years or headed by a single parent in either 1997 or 1999 were much less secure. Only 72-74 percent were food secure in both years. Food insecure families that were headed by two parents in both or one of the years were much less likely (21-44 percent) than stable single parent families (families headed by a single parent in both years) (61 percent) to persist in food insecurity (table 2 and fig. 1). The multivariate results are consistent (table 3). All food-insecure households in 1997 headed by two parents in one or both of the years were less likely than stable single-parent families (the comparison group) to remain food insecure in 1999. For example, compared with a stable food-insecure single parent family, a stable food-insecure two-parent family is 61 percent less likely to remain food insecure by 1999. Finally, food-secure families headed by two parents in both years had a low likelihood (5 percentage points) of becoming food insecure compared with families that had been headed by a single parent in one of the years (10-16 percent) (table 2 and fig. 2). The multivariate results are consistent with the bivariate results. Once other controls are introduced, a family that became a single-parent family between 1997 and 1999 had a 91 percent higher likelihood of becoming food insecure than one that was headed by a single parent in both years (Table 3). The coefficient on becoming a two-parent family was not significant. Change in Low Income Status Food insecurity results from not having sufficient financial resources to acquire food. Consequently, the association between low family income and food insecurity should be strong. This study examined the relationship of having a family income below 185 percent of the poverty line in 1997 only, in 1999 only, in both years, or in neither year with family food insecurity. Income below 185 percent of poverty defines the eligibility cut-off for a number of programs, such as the Special Supplemental Nutrition Program for Women, Infants, and Children and the National School Lunch Program, and is a commonly used indicator of low-income status (e.g., Nord et al., 2002). Just as is food insecurity, poverty is episodic. We do not want to exclude people who might have experienced several low-income months but whose overall annual income exceeds the poverty line. Our choice of 185 percent is low enough to capture those who experience the most severe hardship but not so low as to exclude some families that experienced food insecurity during part of the previous year. Families with incomes below 185 percent of poverty in both 1997 and 1999 (stable low-income families) were the least likely to be food secure in both years, while families with low income in neither year were the most likely to be food secure in both years (table 2). Fifty-four percent of the former were food secure in both years compared with 93 percent of those who had low income in neither year. Persistence in food insecurity among families that were food insecure in 1997 was high for families that had low income in both years or who entered into low-income status (table 2 and fig. 1). Fifty-nine percent of food insecure families with incomes under 185 percent of poverty in both 1997 and 1999 or that became low income between 1997 and 1999 remained food insecure

19
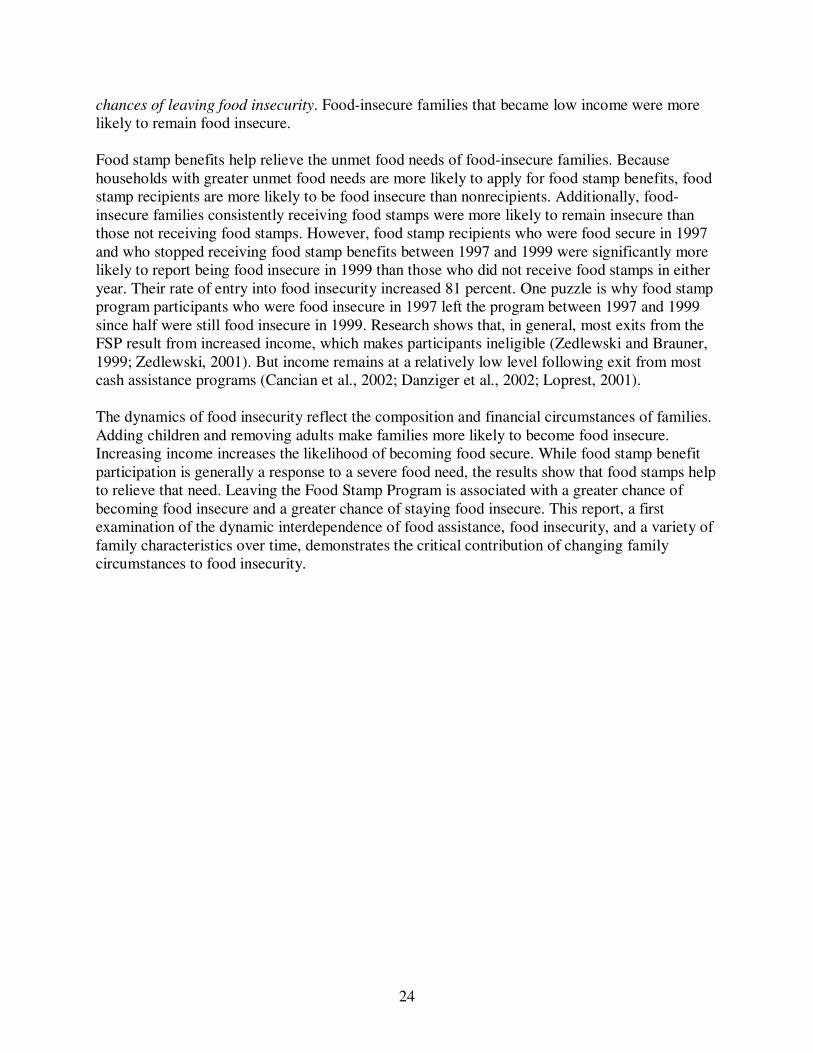
in 1999 (fig. 1). Moving out of low-income status is associated with a lower chance of remaining food insecure. Only 21 percent of food-insecure families that experienced an increase in income from below to above 185 percent of the poverty line between 1997 and 1999 remained food insecure. Living in a family with an income below 185 percent of the poverty line continues to be associated with food insecurity in the multivariate analysis (Table 3). For food-insecure families in 1997, when simultaneous controls are included for other demographic and economic characteristics and circumstances, the association between entering low-income status between 1997 and 1999 and remaining food insecure is statistically significant and important. Families that became low income were 4.3 times as likely to remain food insecure as those that were low income in both years. Surprisingly, food insecure families who were low income in neither year (e.g., moderate to high incomes) were also likely to remain food insecure by 1999 compared with families poor in both years, the comparison category. Food insecure families with moderate to high incomes comprise a small group, only 1.4 percent of families in 1997 and 1999. Their food security must be explained by factors other than income changes.4 Being low income over two consecutive years is associated with becoming food insecure. Of those low income in both years but were food secure in 1997, almost one-quarter became food insecure by 1999 (table 2 and fig. 2). Only 4-8 percent of the other groups became food insecure over the period. The multivariate results are consistent (table 3). Relative to being low income in both years (the comparison category) and being food secure in 1997, being low income in only one of the years 1997 or 1999, or being low income in neither year is associated with a lower probability of becoming food insecure in the multivariate analyses. Immigrant Status and Citizenship Changes in Federal rules in 1996 have made recent immigrants ineligible for receiving cash assistance until they have lived in the United States for 5 years or have become citizens. Without this safety net, noncitizens should be more likely to be food insecure. Our data show that 86 percent of citizens were food secure in both years, compared with 55 percent of noncitizens. Since most immigrants in the PSID (and in the population as a whole) are not citizens (Fix and Passel, 1994), the results are similar for immigrants and for noncitizens: 86 percent of nonimmigrants were food secure in both years compared with 61 percent of immigrants. Persistence in food insecurity is high among noncitizens. More than half of families that were food insecure initially remained food insecure over the two-year period between 1997 and 1999 (table 2 and fig. 1). Similarly, food-insecure immigrants were more likely to remain so than nonimmigrants. The regression analysis used the immigrant/nonimmigrant distinction. After controlling for education, income, family size, and other factors, there was no longer a difference in persistence in food insecurity between immigrants and nonimmigrants (table 3). Thus, the difference we saw in the bivariate analysis is due to these other differences between immigrants and nonimmigrants.
4 The median annual income of families that reported being food insecure and who are not low income by our measure is $20,000 per year, about half of the median income of all families. Families may have had a period of low income over the course of the previous year but total annual income was above 185 percent of the poverty line.

20
Food-secure noncitizens were more likely than citizens to become food insecure between 1997 and 1999 (table 2 and fig. 2). Similarly, food-secure immigrants were more likely than nonimmigrants to become food insecure. The results of the multivariate analyses show that, even after controlling for other factors, immigrants were more likely to become food insecure than nonimmigrants between 1997 and 1999 (table 3). Changes in family income cannot explain this finding since income was held constant. Reduced access to cash and noncash transfer programs from changes in policies may have played a part. Change in Food Stamp Status We compare households that received food stamps in the previous year with households that did not, even if were not eligible to receive them. To be eligible for the Food Stamp Program (FSP), a family’s gross income cannot exceed 130 percent of poverty and its net income (gross income minus a set of deductions, such as deductions for housing, employment expenses, and a share of earnings) cannot exceed the poverty line. There is also a limit on assets other than a home, such as the value of a vehicle. Like most studies of food insecurity (Gundersen and Oliveira 2001; Winicki, Jolliffe and Gundersen 2002), this study finds that families receiving food stamps tend to be food insecure. Only about 53-55 percent of families receiving food stamps in either 1997 or 1999 or in both years were food secure in both years compared with 90 percent of those families not receiving food stamps in either year (table 2). Almost 27 percent of families receiving food stamps in both years were food insecure in both years compared with 1.8 percent of families not receiving food stamps in either year (table 2). High rates of food insecurity among food stamp recipients reflect who enrolls in the program rather than effects of the program. Households with greater unmet food needs are more likely to apply for food stamps and to receive them. There are several approaches for assessing the effectiveness of food assistance programs in improving the well-being of low income families (Winicki, Jolliffe and Gundersen 2002). One way to obtain a statistically unbiased measure of effectiveness is to conduct a fully-controlled experiment in which income-eligible families are randomly assigned to receive or not receive food stamps. Such an experiment has not been conducted. A second approach uses statistical techniques to take into account selection factors explaining both participation in the FSP and food insecurity. Gundersen and Oliveira (2001) used this approach. According to them, once controls for selection are in place, food stamp recipients have the same probability of food insufficiency as nonrecipients do. We use a third approach here. Because food stamp program participation and food security change over time, we can theoretically view the change in food insecurity associated with families either entering or leaving the FSP.5 The picture drawn from examining FSP participation persistence and food insecurity persistence is consistent with the argument that both reflect families’ unmet needs for food. Seventy-seven
5 The difficulty with sorting out the causal effect of changes in food security associated with program changes is that we do not know exactly when the episode or episodes of food insecurity occurred. We know only whether the family reported being food insecure or food secure over the previous year. The results can be seen as consistent or inconsistent only with the expectation that leaving the FSP may increase and entering the FSP may reduce a family’s chances of remaining or becoming food insecure.

21
percent of families that received food stamps in both years and were food insecure in 1997 were very likely to continue to be food insecure in 1999 (table 2 and fig. 1). In the multivariate analysis (Table 3), food-insecure families in 1997 receiving food stamps in both years were 6 times as likely to remain food insecure in 1999 as food insecure families in 1997 not receiving food stamps in either year (the comparison group). Food insecurity is often temporary and episodic. Thus it is not surprising that of those families who did not receive food stamps in either year but were food insecure in 1997, only 33 percent continued to be food insecure in 1999 (table 2 and fig. 1). We argued earlier that a family entering the FSP can reduce its chances of remaining food insecure and leaving the FSP can increase its chances of remaining food insecure. When we examine changes in food stamp program participation, we now see the expected positive effect: food stamps reducing the chances that a food-insecure family remains so over a 2-year period. Only 28 percent of families that were food insecure in 1997 and that started receiving food stamps between 1997 and 1999 remained food insecure in 1999 (table 2; fig. 1). In contrast, 49 percent of food-insecure families that received food stamps in 1997 but stopped food stamps between 1997 and 1999 remained food insecure in 1999. In the multivariate analysis, the coefficient for leaving the FSP (receiving food stamps in 1997 only) is significant at p<0.10 (table 3). The odds ratio shows that families leaving the Food Stamp Program (“received food stamps in 1997 only”) are 2.3 times as likely to remain food-insecure as food-insecure families that did not receive food stamps in either year. The effect of entering the FSP (“received food stamps in 1999 only”) on persistence in food insecurity is not significant, controlling for other factors. Table 3 (“persistence” columns) provides the best examination of the effect of the FSP, since the entire sample was food insecure in 1997 and a variety of confounding factors are controlled. Leaving the FSP can also increase the chances of becoming food insecure. In the bivariate analyses, the highest likelihood of becoming food insecure was among food-secure families that received food stamps in 1997 but left the FSP between 1997 and 1999; 26 percent became food insecure (table 2 and fig. 2). Only 5 percent of families not receiving food stamps in either year became food insecure. Few of these non-food-stamp-receiving families had low incomes. Therefore, it is important to see whether the findings hold when controlling for income and other differences among families. The multivariate results show that, net of other factors, families enrolled in the FSP in 1997 but who left the program between 1997 and 1999 were 81 percent more likely to become food insecure by 1999 than those not participating in the FSP in either year (table 3). While this cannot prove a causal relationship, it is consistent with a positive role of the FSP in preventing food insecurity. Change in Disability Status Finally, we examined the relationship between having a disability and the prevalence, persistence, and entry into food insecurity. Disability is a self-reported physical or nervous condition that limits the type or amount of work a person can do. Families with heads who were disabled in both years were much less likely to be food secure in both years than those with heads who were not disabled in either year (67 percent compared with 85 percent) (table 2).

22
Food-insecure families in 1997 with a family head who became disabled between 1997 and 1999 or who was disabled in both years were much more likely to persist in being food insecure than families with a head who was not disabled in either year (75 versus 44 percent) (Table 2 and fig. 1). However, once other factors were controlled, neither disability status nor change in disability status was associated with persistence in food insecurity (table 3). Families with a head who was disabled in 1997 only or in both years were more likely to become food insecure than families with a head who was not disabled in either year (16 percent vs. 6 percent) (table 2 and fig. 2). The multivariate results (Table 3) support the conclusion that families with a disabled head are more likely to get food assistance if the family member was disabled in both years. Families with a head who was disabled in both years were 2.4 times as likely to become food insecure as families with a head who was not disabled in either year.

23
Summary and Conclusions In 1997 and 1999, about 10 percent of families with children under age 13 were food insecure and 90 percent were food secure, according to estimates from the Panel Study of Income Dynamics. Although the average food insecurity of American families with children under age 13 changed only slightly between 1997 and 1999, the food security status of individual families did change substantially. This report has focused on factors found to be associated with the prevalence of food insecurity, whether food-insecure families persisted in being food insecure, and whether food-secure families became food insecure during the 2-year period. In contrast to other research, this research examines how changes in family situations over time affect changes in reported food insecurity, using a large, representative national data base of families with children under age 13. The report has two limitations. First, the data set was not large enough to also examine changes in the incidence of hunger. Second, the report focuses solely on families with children under age 13. The findings should not be generalized to all families or to individuals. Nine out of 10 families were food secure in 1997. Indicators of family structure and composition were consistently linked to families with children under age 13 being food secure in 1997 and 1999 and to food-secure families becoming food insecure over the 2-year period. These indicators held up, even when adjusting for other household characteristics simultaneously. In particular, families with older, more educated heads, two parents, and fewer and older children were more likely to be food secure initially and less likely to become food insecure. These families have more potential wage earners, experience, and human capital with which to earn income and fewer children who depend upon that income. Families headed by a disabled parent were less likely to be food secure and more likely to become food insecure between 1997 and 1999. Their sources of income are greatly restricted. The food security status of immigrant families is precarious. Immigrants are much less likely to be food secure and are more likely to become food insecure than nonimmigrants, even after adjusting for differences in social and economic characteristics. About 1 out of 10 families was food insecure in 1997. About half remained food insecure in 1999, presumably because the conditions that led them to be insecure in the first place had not changed. Only three demographic factors were linked to becoming secure after we simultaneously controlled for all the factors we measured: educational level of family head, number of children, and single-parent status. Food-insecure families headed by a better educated head were significantly less likely to remain food insecure between 1997 and 1999. Food-insecure families headed by a single parent in both 1997 and 1999 were very likely to remain insecure. Larger families were also likely to remain insecure. One of the key economic variables that affects food insecurity is low income. Changed economic circumstances allow families to escape food insecurity. The multivariate results showed that families with low incomes in only one year or in neither year were less likely to become food insecure by 1999 than families with low incomes in both years. In fact, families with low income in neither year or only in 1997 were 71 percent less likely to become food insecure than families that reported low income in both years. Changed economic circumstances can also reduce the
24
chances of leaving food insecurity. Food-insecure families that became low income were more likely to remain food insecure. Food stamp benefits help relieve the unmet food needs of food-insecure families. Because households with greater unmet food needs are more likely to apply for food stamp benefits, food stamp recipients are more likely to be food insecure than nonrecipients. Additionally, food-insecure families consistently receiving food stamps were more likely to remain insecure than those not receiving food stamps. However, food stamp recipients who were food secure in 1997 and who stopped receiving food stamp benefits between 1997 and 1999 were significantly more likely to report being food insecure in 1999 than those who did not receive food stamps in either year. Their rate of entry into food insecurity increased 81 percent. One puzzle is why food stamp program participants who were food insecure in 1997 left the program between 1997 and 1999 since half were still food insecure in 1999. Research shows that, in general, most exits from the FSP result from increased income, which makes participants ineligible (Zedlewski and Brauner, 1999; Zedlewski, 2001). But income remains at a relatively low level following exit from most cash assistance programs (Cancian et al., 2002; Danziger et al., 2002; Loprest, 2001). The dynamics of food insecurity reflect the composition and financial circumstances of families. Adding children and removing adults make families more likely to become food insecure. Increasing income increases the likelihood of becoming food secure. While food stamp benefit participation is generally a response to a severe food need, the results show that food stamps help to relieve that need. Leaving the Food Stamp Program is associated with a greater chance of becoming food insecure and a greater chance of staying food insecure. This report, a first examination of the dynamic interdependence of food assistance, food insecurity, and a variety of family characteristics over time, demonstrates the critical contribution of changing family circumstances to food insecurity.
25
References Andrews, Margaret, Mark Nord, Gary Bickel, and Steven Carlson. 2000. Household Food
Security in the United States, 1999. Food Assistance and Nutrition Research Report No. 8. U.S. Department of Agriculture, Economic Research Service.
Bickel, Gary, Steven Carlson, and Mark Nord. 1999. Household Food Security in the United States, 1995-1998: Advance Report. Washington, DC: U.S. Department of Agriculture, Economic Research Service.
Borjas, George J. 2002. Food Insecurity and Public Assistance. Technical Report No. Working Paper 9236. Cambridge, MA: National Bureau of Economic Research.
Cancian, Maria, Robert Haveman, Daniel Meyer, and Barbara Wolfe. 2002. "The Economic Well-Being of Women Leaving Welfare," La Follette Policy Report 13(1):11-17.
Danziger, Sheldon, Colleen Heflin, Mary Corcoran, Elizabeth Oltmans, and Hui-Chen Wang. 2002. "Does It Pay to Move from Welfare to Work?" Journal of Policy Analysis and Management 21(4):671-92.
Daponte, Beth Osborne, Amelia Haviland, and Joseph B. Kadane. 2002. "To What Degree Does Food Assistance Help Poor Households Acquire Enough Food?" Presented at the Census Bureau User Conference, Suitland, MD.
Duncan, Greg J. 1991. "The Economic Environment of Childhood." A. C. Huston (ed.), Children in Poverty; Child Development and Public Policy, edited by. New York, NY: Cambridge UP, Pp. 23-50.
Duncan, Greg J., Martha S. Hill, and Saul D. Hoffman. 1988. "Welfare Dependence Within and Across Generations," Science 239:467-71.
Fitzgerald, John, Peter Gottschalk, and Robert Moffitt. 1998a. "An Analysis of Sample Attrition in Panel Data: The Michigan Panel Study of Income Dynamics," Journal of Human Resources 33(2):251-99.
Fix, M., and J. Passel. 1994. Immigration and Immigrants: Setting the Record Straight. Washington, DC: Urban Institute.
Gundersen, Craig, and Victor Oliveira. 2001. "The Food Stamp Program and Food Insufficiency," American Journal of Agricultural Economics, 875-87.
Hamilton, W.L., J.T. Cook, W.W. Thompson, L.F. Buron, E.A. Frongillo, Jr., C.M. Olson, and C.A. Wehler. 1997. Household Food Security in the United States in 1995: Summary Report of the Food Security Measurement Project. U.S. Department of Agriculture, Food and Nutrition Service.
Hofferth, Sandra, Pamela Davis-Kean, Jean Davis, and Jonathan Finkelstein. 1999. 1997 User Guide: The Child Development Supplement to the Panel Study of Income Dynamics. Ann Arbor, MI: Institute for Social Research, The University of Michigan.
Hofferth, Sandra L., Stephen Stanhope, and Kathleen Mullan Harris. 2002. "Exiting Welfare in the 1990s: Did Public Policy Influence Recipients' Behavior?" Population Research and Policy Review 21:433-72.
Loprest, Pamela. 2001. "How Are Families That Left Welfare Doing? A Comparison of Early and Recent Welfare Leavers," New Federalism B(36, April):1-7.
Nord, Mark, Margaret Andrews, and Steven Carlson. 2002. Household Food Security in the United States, 2001. Food Assistance and Nutrition Research Report No. 29. U.S. Department of Agriculture, Economic Research Service.
26
Reid, Lori L. 2001. "The Consequences of Food Insecurity for Child Well-Being: An Analysis of Children's School Achievement, Psychological Well-Being, and Health," Department of Sociology, Florida State University.
Ribar, David, and Karen Hamrick. 2003. An Analysis of Poverty and Food Sufficiency Dynamics. Forthcoming Food Assistance and Nutrition Research Report. U.S. Department of Agriculture, Economic Research Service.
Winicki, Joshua, Dean Jolliffe, and Craig Gundersen. 2002. "How Do Food Assistance Programs Improve the Well-Being of Low-Income Families?" Food Assistance and Nutrition Research Report, No. 26-9. U.S. Department of Agriculture, Economic Research Service.
Zedlewski, Sheila R., and Sarah Brauner. 1999. "Are the Steep Declines in Food Stamp Participation Linked to Falling Welfare Caseloads?" Assessing the New Federalism B(B-3):1-5.
Zedlewski, Sheila. 2001. "Former Welfare Families and the Food Stamp Program: The Exodus Continues," Assessing the New Federalism B(B-33).

27
Appendix A: The Panel Study of Income Dynamics and the 1997 Child Development Supplement
The study sample comes from the Panel Study of Income Dynamics (PSID), a nationally representative sample of U.S. men, women, children, and the families in which they reside which has been followed for more than 30 years. Data on employment, income, wealth, housing, food expenditures, transfer income, and marital and fertility behavior have been collected annually since 1968 and biennially since 1997. From 5,000 families in 1968, the study grew to over 9,000 core families in 1996 since children and other sample members become respondents in their own right when they leave the original household. In 1997 the PSID reduced its core sample to 6,700 and added a refresher sample of 450 immigrant families so that the sample represents the U.S. population. Until 1997, measures were collected annually from interviews with one adult respondent about all family members, but only limited information was available on children and parental interaction. During spring and fall 1997, information on up to two randomly selected 0-12-year-old children of PSID respondents was collected from the primary caregivers, from other caregivers, and from the children themselves (Hofferth et al., 1999). The Child Development Supplement (CDS) completed interviews with 2,394 child households and about 3,600 children. The response rate was 90 percent for those families regularly interviewed in the core PSID and 84 percent for those contacted the first time in 1997 for an immigrant refresher to the sample, with a combined response rate for both groups of 88 percent. The 18-item food security survey instrument was included in 1997 Child Development Supplement and again for the full PSID in 1999. A sample of children under age 13 in 1997 was matched to the 1999 sample and families in which these children were residing in both years were selected for this comparison. For children who are siblings living in the same family, their families are represented only once. Therefore, this study is a study of the families of children under age 13 in 1997 and in 1999. Attrition averages only about 4 percent between waves. When weights are used, as is done throughout this report, the results have been found to be representative of U.S. individuals and their families (Fitzgerald, Gottschalk, and Moffitt, 1998). Case counts represent actual sample sizes. Statistics are calculated based upon actual sample sizes. The unit of analysis in the PSID is the family, not the household. A small fraction of families that share households are treated as separate family units in the PSID. The Current Population Survey, in contrast, is a household-based survey. This difference in sampling unit could lead to some differences in estimates of the incidence of food insecurity in the United States. However, this is unlikely to affect our estimates of food security dynamics.