persistent political engagement: social interactions and ... · persistent political engagement:...
TRANSCRIPT

Persistent Political Engagement:Social Interactions and the Dynamics of Protest Movements
Leonardo BursztynDavide CantoniDavid Y. Yang
Noam YuchtmanY. Jane Zhang*
June 2019
Abstract
We test whether participation in one protest within a political movement increases subsequentprotest attendance, and why. To identify an effect of protest participation, we randomly, in-directly incentivize Hong Kong university students into participation in an antiauthoritarianprotest. To identify the effects of social interactions, we randomize the intensity of this treat-ment across major-cohort cells. We find that experimentally-induced protest participation issignificantly associated with protest attendance one year later, though political beliefs andpreferences are unaffected. Persistent political engagement is greatest among individuals inthe cells with highest treatment intensity, suggesting that social interactions sustained persis-tent political engagement.
Keywords: Political movements, social interactionsJEL Classification: D74, P0
*Bursztyn: University of Chicago and NBER. Email: [email protected]. Cantoni: Ludwig-Maximilians-Universitat Munich, CEPR, and CESifo. Email: [email protected]. Yang: Harvard University and J-PAL. Email:[email protected]. Yuchtman: LSE, NBER, and CESifo. Email: [email protected]. Zhang: Hong KongUniversity of Science and Technology. Email: [email protected]. Helpful and much appreciated suggestions, critiquesand encouragement were provided by Dan Berkowitz, Andrei Shleifer, seminar participants at Cambridge, Harvard,Heidelberg, Imperial, INSEAD, Northeastern, NUS, Oxford, Pompeu Fabra, Sussex, Yale, Zurich, and conference par-ticipants in Munich and Atlanta (ASSA). Raymond Han, Moritz Leitner, Glen Ng, Aakaash Rao, and Meggy Wanprovided excellent research assistance. Cantoni acknowledges financial support from the European Research Council(ERC) under the European Union’s Horizon 2020 research and innovation programme (grant agreement n. 716837).The research described in this article was approved by the University of Munich IRB, protocol 2017-04; by the Stan-ford University Institutional Review Board, Protocol 38481; by the University of California-Berkeley Committee forProtection of Human Subjects, Protocol ID 2015-05-7571; and by the Hong Kong University of Science and TechnologyHuman Participants Research Panel, submission 147. The experiment is registered on the AEA RCT registry with IDAEARCTR-0002301.
1

1 Introduction
Protests demanding political rights have been a critical driver of economic, social, and politicalchange for centuries (e.g., Acemoglu and Robinson, 2000, 2012; Aidt and Franck, 2015). While dra-matic, one-shot events capture public attention (e.g., the Hungarian Revolution of 1956, Tianan-men Square in 1989, or Tahrir Square in 2011), political rights have historically often arisen fromsuccessful, long-running movements: sequences of events in which sustained political engagementis important. Historically important instances include the women’s suffrage movements in the US(1869–1920) and UK (1903–1918), the US Civil Rights movement (1954–1964), the anti-Apartheidmovement in South Africa (1960–1994), the Indian Independence movement (1857–1947), and theSouth Korean pro-democracy movement (1980–1987).1
Political economists have studied political protests in dynamic settings (e.g., Barbera and Jack-son, 2017; Enikolopov et al., 2016), yet there exists very little empirical, individual-level evidenceon the causes of sustained engagement in protest movements. Up to now, political economistshave identified causal factors explaining the dynamics of political behavior in the aggregate (Biggs,2005, on labor unrest; Madestam et al., 2013, on protests; Fujiwara et al., 2016, on voting). Or, theyhave studied the causes of political engagement as a one-shot action: (Perez-Truglia and Cruces,2017, on campaign contributions; Hensel et al., 2018, on political mobilization; Gerber et al., 2017,on voter turnout; Gonzalez, 2018 and Cantoni et al., 2019, on protest turnout). There also existssome empirical evidence on persistence in voting behavior at the individual level (Coppock andGreen, 2016). Our paper provides the first causal, individual-level evidence on persistence of po-litical behavior in the context of protest movements. In addition, we shed light on the mechanismsunderlying such persistence.
To do so, we conduct a field experiment isolating one potential driver of sustained political en-gagement: past participation in protests causing future participation. We also explore mechanismsthat may generate path-dependence. Models of protest participation typically emphasize prefer-ences and beliefs (beliefs about the world or others’ beliefs about individuals’ types) in drivingprotest turnout.2 In addition to considering changed preferences and beliefs as mechanisms link-ing past and future protest participation, we specifically focus on the causal role of changed socialinteractions, given that protests are inherently group events that require participants to simultane-ously show up at the same location (see, e.g., Passarelli and Tabellini, 2017). We ask two research
1Dates for the US movement for women’s suffrage span from the establishment of the National Woman SuffrageAssociation (1869) until the passage of the 19th amendment in 1920. Dates for the UK movement for women’s suffragespan from the establishment of the Women’s Social and Political Union (1903) until the Representation of the PeopleAct (1918). The US Civil Rights movement spans from the date of Brown v. Board of Education (1954) until the CivilRights Act (1964). The anti-Apartheid movement dates span from the ban on the African National Congress (ANC)until the first free election in 1994. The Indian Independence Movement dates span from the Revolution of 1857 untilIndependence in 1947. The South Korean pro-democracy movement dates span from the Gwangju Uprising in 1980until the June Struggle in 1987.
2See, for example, Tullock (1971), Palfrey and Rosenthal (1984), Bueno de Mesquita (2010), Shadmehr and Bernhardt(2011), Edmond (2013), Enikolopov et al. (2016), or Cantoni et al. (2019).
1

questions: first, is there persistence in protest activity at the individual level — namely, does par-ticipation in a previous protest make one more likely to participate in a subsequent protest? Sec-ond, if so, through which channels — changed beliefs, preferences, or social interactions — doesthe persistence work?
Our context is Hong Kong’s ongoing anti-authoritarian movement, demanding political rightsfrom the Chinese Communist Party (CCP). We study participation in the July 1 marches, yearlyprotests that represent an important component of Hong Kong’s ongoing anti-authoritarian move-ment (epitomized by the Umbrella Revolution). These marches share essential characteristics withantiauthoritarian protest movements across time and space: participants aim both to achieve pol-icy concessions and to signal the strength of a movement to potential future participants. Likeother protest movements, larger turnout is desired by protest organizers, but is also more likely tolead to government crackdown.3
Such a study faces three identification challenges: first, identifying the causal effect of pastprotest participation on subsequent action is complicated by the endogeneity of protest participa-tion. Second, individuals’ beliefs and preferences before and after a protest are difficult to observe,preventing an analysis of these mechanisms. Third, variation in social interactions is also typicallyendogenous, whether driven by political behavior or other factors.
We design a field experiment to overcome these challenges, leveraging our ongoing onlinesurveys with students at Hong Kong University of Science and Technology (HKUST; see Cantoniet al., 2016, 2019). The experiment, detailed in Section 3, involves two dimensions of randomiza-tion: first, at the individual level, we randomly assign subjects to a condition in which they wereindirectly incentivized to participate in the 2017 march.4 Second, to generate exogenous variationin social interactions, our design also randomly varies the proportion of the treated individualsacross major×cohort cells between 0% and 75%.5 The randomization in treatment intensity acrossthese cells might shape social interactions — and thus protest participation — in 2017, or later. Itis important to note that these were the only two dimensions of randomization implemented, andthat both were pre-registered.
Following our experimental intervention, we examine: (i) protest turnout in the 2017 march;(ii) changes in beliefs and preferences both immediately after the 2017 march, as well as in June2018, right before the subsequent 2018 march; (iii) turnout in the 2018 march; and (iv) changes
3It is important to emphasize that some characteristics of the protests studied here will likely not be relevant inone-shot mass events, which will either topple a regime or be crushed.
4This dimension of randomization included three treatment arms (all discussed further in the text below): first, thetreatment of interest — indirect incentive to protest; second, pure control; third, a placebo treatment arm with randomassignment of subjects to a condition in which they were indirectly incentivized to travel to central Hong Kong on adate different from the protest date. This third arm was designed to account for any income effects that might arisein the treatment of interest. In practice we focus on a pooled control group, as the latter two groups exhibit nearlyidentical political behavior and preferences.
5To obtain cells of appropriate size, in some cases we split large major×cohort cells by gender, in other cases wemerged small cells across majors. This division occurred ex ante, before the assignment of treatment. Cell constructionis discussed in more detail in the text below.
2

in subjects’ social interactions. The primary outcome of interest is students’ turnout in the 2018march. While treated students were directly incentivized to participate in the march in 2017, nostudents faced differentiated incentives to turn out on July 1, 2018. Thus, to the extent that treatedstudents who turned out in the 2017 march are also more likely to participate in the march in 2018,one can causally attribute such behaviors to persistence of protest participation.6
We find five main results. First, we find a strong short-run, “first stage effect” — our indirectincentive generated a 10 percentage point increase in protest turnout in 2017. Second, we identifya strong, significant reduced-form persistence result — our indirect incentive in 2017 generatesa 5 percentage point greater turnout rate in July 2018. Third, we observe very small treatmenteffects on political beliefs, preferences and attitudes in the short run and no statistically significanteffects a year after our initial intervention. Fourth, we find substantial heterogeneity in our treat-ment effect on protest participation in 2018: significant persistence is found specifically amongtreated individuals in cells assigned to higher treatment intensity (50% or 75% of a cell treated).Fifth, matching the heterogeneous treatment effects on persistent political engagement, signifi-cantly more new political friendships are reported among treated individuals in cells assigned tohigher treatment intensity.
We thus find that individual participation in political movements is path-dependent. Whilewe cannot rule out some role for changes in beliefs and preferences in driving persistent engage-ment in political movements, we find no significant evidence of these mechanisms. We do findevidence that persistent engagement is causally shaped by changes in social interactions. In par-ticular, persistence arises when individuals were not only incentivized to participate in a previousprotest themselves, but also surrounded by many others in their social networks who were alsoincentivized.
The importance of social interactions in motivating persistent political engagement in our set-ting contrasts with canonical models’ focus on (typically Bayesian) belief updating in drivingmovement dynamics. Our findings also differ from behavioral models that emphasize changedpreferences (e.g., models of habit formation). It is important to note that we cannot disentangledifferent channels through which social interactions may shape behavior. Protesters in our settingmay simply derive greater social utility from “jointly consuming” protest participation with theirpolitically-active friends (much like people jointly enjoy consuming other activities, from concerts,to sporting events). Protesters may form a political identity that they need to maintain by attend-ing a protest that they expect their politically-active friends to attend. Or, politically-active friendsmay help protesters coordinate to attend a protests, effectively lowering the cost of attendance.
As noted above, these results directly contribute to the literature on protest participation (andpolitical behavior more generally) by providing causal, individual-level evidence on the persis-tent engagement in political movements. Our findings of an important role played by social in-teractions complement empirical work identifying social influence on an individual’s one-time
6We discuss the implied exclusion restriction in Section 4.4.2 below.
3

choice to turnout to protest.7 Several recent articles have provided causal evidence on a bundle of“social” influences on protest participation: Enikolopov et al. (2016) present evidence that the dif-fusion of an online social network increased protest turnout in Russia; Gonzalez (2018) providesevidence that peers’ participation in Chilean student protests increased one’s own; and, Mana-corda and Tesei (2016) provide evidence that mobile phones’ diffusion increased protest turnoutin Africa.8
Our own previous work (Cantoni et al., 2019) finds that protest participation in the same HongKong setting (although a previous protest) is a game of strategic substitutes. Our finding of strate-gic substitutability holds within a single protest when beliefs about the turnout of the broaderHKUST student body and the entire Hong Kong population are updated. In contrast to that work,we now study social influence of peers with whom one has relatively strong ties — quite plausiblyamong individuals who are friends — in a dynamic setting. Strong and weak ties may functiondifferently (Granovetter, 1973): changes in the participation of the population at large will affecta subject’s beliefs about the likelihood a discrete public good is produced, or that governmentcrackdown may occur, potentially generating strategic substitutability. In contrast, friends’ par-ticipation will have a large effect on the social utility derived from protest participation; on thecoordination costs of attending; and on social image considerations, potentially generating strate-gic complementarity.
Our results more generally contribute to the literature studying authoritarian regimes, move-ments opposed to them, and the consequences of constraints on rulers, which typically considersaggregate behavior, rather than individual behavior, as we do.9 Our work also contributes toa growing empirical literature on the political economy of popular dissent in the Greater Chinaregion: for example, Lorentzen (2013) and Qin et al. (2017) highlight the central government’s tol-erance of certain types of protests; King et al. (2013) study information control policies that aim atsuppressing collective action.
In what follows, we first briefly describe Hong Kong’s Anti-Authoritarian Movement and theJuly 1 marches in Section 2. We then detail our experimental design in Section 3. We present ourresults in Section 4. Finally, we offer concluding thoughts in Section 5.
7Our results also complement an important recent literature on the impact of social incentives on voter turnout(Gerber et al., 2008, Funk, 2010, Gerber et al., 2013, and DellaVigna et al., 2016).
8Other recent empirical work on the causes and consequences of mass political movements includes Madestam etal. (2013); Yanagizawa-Drott (2014); DellaVigna et al. (2014); Acemoglu et al. (2014).
9A large literature has studied the consequences of political constraints for economic growth (e.g., DeLong andShleifer, 1993; Przeworski and Limongi, 1993; Rodrik and Wacziarg, 2005; Persson and Tabellini, 2006; Papaioannouand Siourounis, 2008; Meyersson, 2016; Acemoglu et al., 2015). Relatedly, a growing theoretical and empirical literaturestudies the extension of the franchise (e.g., Acemoglu and Robinson, 2000; Lizzeri and Persico, 2004; Llavador andOxoby, 2005; Acemoglu and Robinson, 2006; Aidt and Franck, 2012, 2015).
4

2 Hong Kong’s antiauthoritarian movement and the July 1 marches
In the July 1, 1997, “handover”, Hong Kong was transferred from its status as a British colony,with limited democratic political rights but strong protections of civil liberties and respect for therule of law, to being a Special Administrative Region within the People’s Republic of China.10 Thepolitical institutions of Hong Kong are defined by its quasi-constitution — the “Basic Law” — andfollow a policy known as “one country, two systems.”
The Basic Law left ambiguous several important dimensions that have been bargained andbattled over between the so-called “pan-democracy” and “pro-Beijing” camps since the handover.Every year, the political confrontation between Hong Kong citizens and the Chinese governmentculminates in a protest march held on the anniversary of the “handover” on July 1. Those marcheshave achieved major policy changes and even constitutional concessions, although turnout hasvaried significantly across years, from less than 20,000 to over 500,000.11
Two contentious issues have been particularly prominent. First was the definition of sedition,an issue which came to a head in the proposal of the “National Security Bill” of 2002, seen by manyHong Kong citizens and international observers as threatening civil liberties. Half a million HongKong citizens turned out in the subsequent July 1, 2003, march to demand the withdrawal of theBill, which was achieved. Second was the method of selection of the territory’s Chief Executive (itshead of government), historically and until now chosen by a narrow Election Committee. Protestsdemanding direct citizen nomination of candidates and elections by universal suffrage led to themassive “Umbrella Revolution” of 2014 which saw hundreds of thousands of people take to thestreets.
Each year’s march is part of a broader antiauthoritarian, democratic movement, yet is orga-nized around a specific set of issues and policy aims. The marches are a continual reminder of thevigilance of the Hong Kong citizenry in their protection of civil and legal rights, vis-a-vis increas-ing encroachments by mainland Chinese authorities.
The repeated nature of the July 1 marches — and their organizers’ interest in keeping up highrates of repeated participation — is a feature that the Hong Kong antiauthoritarian protests sharewith many other movements demanding political rights or institutional change. Examples rangefrom the instances mentioned in the previous section (the women’s suffrage and the Civil Rightsmovements) to many contemporary expressions of political grievances: from cacerolazos in SouthAmerica, to the yellow vests in France, or the Women’s Marches in the US. Moreover, it is also acommon feature of protests in authoritarian regimes, from Eastern Europe before 1989 to present-day Venezuela or Russia.
Our experiment is embedded in the July 1 marches of 2017 and 2018. Following the “Umbrella
10In Online Appendix A, we provide a richer description of the political background, the characteristics of HongKong’s antiauthoritarian movement and its goals.
11A time series of turnout in July 1 marches is reported in Online Appendix Figure B.1.
5

Revolution” of 2014, the democratic movement in Hong Kong has become more radicalized, in-cluding the creation of new political parties calling for self-determination. The 2017 march wasintended to build support for these recently-formed parties; protesters also called for the releaseof Nobel Peace Prize winner Liu Xiaobo, and criticized Hong Kong’s Chief Executive C.Y. Leung.One year later, the defining themes of the march were opposition to the granting of mainlandChinese jurisdiction on Hong Kong territory in the new high-speed rail station, and a call for therelease of human rights activist Liu Xia. In both years, protest participation (around 50,000) wasmodest by historical standards.
3 Experimental design
3.1 Overview
Our experimental sample is drawn from among the undergraduate student body at Hong KongUniversity of Science and Technology (HKUST). Studying the protest participation of universitystudents is of particular interest given students’ historical engagement in movements for politicalrights around the world (Glaeser et al., 2007), and in Hong Kong specifically. Students dispro-portionately involve in Hong Kong’s movement for political rights — for example, in the broaderHong Kong population, participation in the Umbrella Revolution was under 5%, while amongstudents in our sample it is around 45%. We recruit subjects to participate in a survey on stu-dents’ preferences, waves of which have been collected since 2015 (see Cantoni et al., 2016, 2019for more details). A recruitment email is sent to the entire HKUST undergraduate student body,and typically between 10% and 20% of undergraduates participate.
The current experiment is embedded within the survey wave conducted in June 2017, whichincluded around 1,100 subjects (a discussion of ethical considerations, as well as all experimentalmaterials, from the June 2017 recruitment email to the final set of survey questions in July 2018,are provided in Online Appendix C).12 Follow-up emails were subsequently sent to experimentalsubjects between July 2017 and July 2018.
The timeline of the experiment is summarized in the following figure:
12Students graduating in 2018 are not eligible to participate in this study, since we aim to follow these subjects beyondJuly 2018.
6

Control Treatment
2017/06 Baseline survey Baseline survey
Treatment (protest) Placebo (subway)
2017/07 July 1, 2017 march + survey July 1, 2017 march + survey
2018/06 Pre 2018 march survey Pre 2018 march survey
2018/07 July 1, 2018 march + survey July 1, 2018 march + survey
• June 2017: Baseline survey and assignment of treatment. As part of our regular panelsurvey module with the HKUST students, we elicited subjects’ preferences, beliefs, attitudes,and planned and past political behavior. Importantly, subjects were assigned and exposedto the experimental treatments in this survey (full text: see Online Appendix C.3).
• July 2017: First stage effects on protests and short-run impacts on beliefs and preferences.We elicited participation in the 2017 march as well as political preferences and beliefs. Thisallows us to test for a first-stage effect (whether our experimental treatment successfullyincentivized protest turnout) and to estimate short-run treatment effects on political beliefsand preferences (full text: see Online Appendix C.4)
• June 2018: Long-run impacts on beliefs and preferences. We again elicited political pref-erences and beliefs. This allows us to estimate long-run treatment effects on political be-liefs and preferences immediately before the July 1, 2018, march (full text: see Online Ap-pendix C.5).
• July 2018: Persistent effects on protests and social interactions. We elicited participation inthe 2018 march, as well as information on changed social interactions, i.e. new friendshipsformed with politically active peers. (full text: see Online Appendix C.6).
In our study we focus on the 849 subjects for whom we have complete data. Fortunately, theattrition rate was quite low, with over 90% retention rates across the multiple waves of the study.In Online Appendix Table B.1, we present evidence that the sample of 849 subjects who completeall of the study waves looks very similar to the sample of individuals who selected out of thestudy. In the Online Appendix we also present all of our analyses re-weighting our experimentalsample of 849 subjects to match the full sample of subjects before attrition, and this has essentiallyno effect on any of our findings.
7

3.2 Treatment design details
We aimed to encourage protest participation without explicitly paying for turnout — directly pay-ing for turnout could potentially generate a set of compliers very different from the typical protestparticipants we hoped to study.13 To generate a strong first stage without paying directly forturnout, we paid for behavior conditional on turnout: providing us with information that wouldhelp us estimate crowd sizes at the protest.14
Specifically, within the online survey, individuals randomly selected to be in the indirect protestincentive treatment group were presented with the following prompt (full text can be found in On-line Appendix C.7):
Because many students attend the events of July 1, we are asking a subset of surveyparticipants to help us get a better estimate of the July 1 March attendance. . . . Wewould like to ask you to participate in this scientific endeavor. This should take only 5minutes of your time while you are at the March. . . . Once you have uploaded all theinformation, we will pay you additional HK$350 for your time and effort.
Subjects in the treatment group received an email the night before the July 1, 2017, marchwith detailed instructions on how to complete the task. In particular, treated subjects would beable to use a secure link to upload the information we requested during the march. Subjects whouploaded all requested information and completed the protest participation reporting modulewould be eligible to receive the bonus payment, and we consider them to have taken up thetreatment. The full protest participation reporting module can be found in Online Appendix C.8.
We also wanted to control for income effects that might arise from our payment in the treat-ment condition, perhaps generating feelings of reciprocity or otherwise distorting subsequent sur-vey responses in the treatment group. To do so in a politically neutral way, we designed a “placebotreatment” that indirectly incentivized subjects to engage in a very similar activity — traveling tocentral Hong Kong — for a similar amount of money, but engaging in an activity unrelated topolitics (and on the weekend after the July 1 march). Rather than paying subjects for helping usestimate crowd size conditional on march attendance, we pay subjects for helping us estimateHong Kong metro station crowding conditional on visiting a metro station in central Hong Kong.By doing so, we aim to create a comparison group with identical income effects but no exposureto a political treatment.
Specifically, within the online survey, individuals randomly selected to be in the placebo treat-ment group were presented with the following prompt (full text can be found in Online Ap-
13In Online Appendix Table B.2, we present evidence suggesting that the “compliers” in our experiment do notsignificantly differ from individuals in our sample who had participated in previous protests.
14Estimates of crowd sizes are highly contentious in Hong Kong, as in many other political settings. See: “Researchon Mass Gatherings and Rallies”, https://www.hkupop.hku.hk/english/features/rallies/summary.html (last ac-cessed April 10, 2019), and Lin (2018). We plan to use the data collected in this experiment to estimate crowd sizes in aseparate project.
8

pendix C.9):
Because many students go to MTR [Hong Kong metro] stations in downtown HongKong, we are asking a subset of survey participants to help us get a better estimate ofthe size of crowds at these stations. . . . We would like to ask you to participate in thisscientific endeavor. This should take only 5 minutes of your time while you are at adowntown MTR station. . . . Once you have uploaded all the information, we will payyou additional HK$350 for your time and effort.
Analogous to the protest treatment condition, subjects in the placebo treatment group also re-ceived an email on the night before the task took place. Subjects would be able to use a secure linkto upload the information we requested while at the MTR station. Subjects who uploaded the re-quested information and completed the subway participation reporting module would be eligibleto receive the bonus payment, and we consider them to have taken up the placebo treatment. Thefull subway participation reporting module can be found in Online Appendix C.10.
Income effects will be comparable between the protest treatment and placebo treatment groupsonly if the take-up rates are similar. As intended, take-up rates in our treatment and placebotreatments were very similar, differing by only around 2 percentage points (see Online AppendixFigure B.2; the p-value from a test of equality of take-up rates is 0.399). This suggests that theplacebo treatment group can usefully be compared to the pure control group to determine whetherpotential income effects in our study meaningfully affect subjects’ reported preferences, beliefs,and behavior.
In addition to the random assignment of the treatment (and the placebo treatment) at the indi-vidual level, we also randomize treatment intensity across relevant social networks. Specifically,we randomly vary the proportion of study participants receiving the treatment (and placebo treat-ment) across major×cohort cells.15 At the cell level, the (protest incentive) treatment was assignedat a level of 0% of a cell in approximately 15% of cells; 1% of subjects were to be treated in around20% cells; 50% were to be treated in 30% cells; and, 75% were to be treated in the remaining 35%cells.16 The placebo treatment was assigned at the cell level as follows: 0% in approximately 40%of cells; 1% to be treated in 30% of cells; 50% to be treated in 25% of cells; and 75% to be treated in5% of cells. The cell-level intensity of the placebo treatment is cross-randomized with the cell-levelintensity of the protest treatment, subject to satisfying the adding up constraint (for example, wecould not have a cell with both 75% treatment and 50% or 75% placebo treatment). The result
15We aimed for around 100 cells with 10–20 subjects per cell; when major×cohort cells were much bigger or smaller,we adjusted by merging cells (across majors within cohort) or splitting cells (by gender or residential address). OnlineAppendix Table B.3 lists the 98 social network cells that we form. This process, particularly splitting cells by gender,led to some imbalance across cells on the gender dimension, as we discuss below.
16Due to the small cell sizes, the 1% treatment intensity results in cells that have either nobody treated (0%) or oneindividual treated (producing a treatment intensity of approximately 10%). We discuss the targeted treatment intensityand actual treatment intensity in greater detail in Section 4.
9

of our cross-randomization was that around 45% of subjects received the protest treatment; 20%received the placebo treatment; and, 35% of subjects were pure controls.
As noted above, all of the procedures of our experiment were pre-registered. Here we high-light the most salient elements. First, the two dimensions of randomization discussed (treatmentat the individual level and the randomized treatment intensity at the cell level) were the only di-mensions of randomization in the experiment. Second, for our baseline empirical specification,we proposed controlling for cell fixed effects (though we will also show results without fixed ef-fects). Third, in making statistical inferences, we committed to clustering standard errors at thecell level, and we pre-specified conducting one-sided statistical tests given our priors that protestattendance incentives would (at least weakly) increase protest turnout. However, to be conserva-tive, and following convention, we present results based on two-sided tests in the paper. None ofthe inferences presented are affected by our choice of one- or two-sided tests.
In Table 1, we present summary statistics and evidence of balance across treatment, placebotreatment, and pure control individuals. We first present tests of balance across the three groupsat the individual level (Table 1, columns 7–9). We generally find balance across observables, withthe exception of gender. This imbalance arises due to our construction of social network cells,which was partly based on gender. Random variation in treatment intensity across cells generatedseveral high treatment intensity, all-female cells, thus producing one dimension of imbalance. Wewill examine the impact of this imbalance below, concluding that it does not affect our findings.
In our empirical analysis below, we find that outcomes in 2017 are nearly identical for placebotreatment and pure control individuals. We will thus generally pool these two groups to increasethe power of our statistical tests — as we specified in the pre-analysis plan. We generally refer tothe pooled placebo treatment and pure control group as the “control group” in the analysis below.In Table 1, column 10, we present a balance test comparing the treatment and the pooled “control”groups, finding that they are very similar on observables, again with the exception of gender.
Finally, in Table 2, we compare average subject characteristics at the cell level, across therandomly assigned categories of treatment intensity. We again highlight the fact that observ-ables are not perfectly balanced. As discussed above, this is a result of our randomization overcoarsely-defined cells, sometimes defined at the major×cohort×gender level. One can see thatlow-intensity cells have more male subjects; have slightly younger subjects; have more subjectswho attended English-language schools; and, have subjects who expect higher earnings in thefuture.
To address concerns that imbalance affects our estimated treatment effects, we will control forcell fixed effects and for subject characteristics. In addition, we will control for subject character-istics interacted with treatment when analyzing heterogeneous treatment effects associated withcell-level treatment intensity. As noted above, these analyses (discussed in detail below) suggestthat imbalance on observables does not meaningfully affect our results.
10

3.3 Outcomes and conceptual framework
We study the treatment’s effects on the following outcomes. First, we ask subjects about protestparticipation in the 2017 march. If they report participating, they are then asked a series of ques-tions such as which political group they marched with, and an open-ended prompt for a descrip-tion of their impressions during the march. Findings on participation in the 2017 march can looselybe thought of as a “first stage” effect of our intervention.
An important concern regarding our self-reported measure of protest participation is that sub-jects may not report their participation truthfully. On the one hand, subjects may wish to reportattending the march even when they stayed home. We view this as unlikely to be a major con-cern: reported turnout in the treatment group is confirmed by photos and additional information;reported turnout in the control group does not have this supporting information but was so low(around 2%) that misreporting in this direction is sharply circumscribed. In addition, our addi-tional questions asking for corroborating details on march attendance are intended to increase thecost to a non-participant misreport on their participation.
On the other hand, some subjects may report non-participation even when they attended themarch, for example, out of fear. This concern is particularly relevant in the context of an ongo-ing anti-authoritarian movement. However, there are several reasons to believe that self-reportedprotest turnout is a good measure in our context.17 First, the particular protests that we studyremained peaceful. While subjects faced a risk of government crackdown on the protest ex ante,there was no concern regarding legal sanctions on participants after the protest, when subjects’protest participation was elicited. Second, for fear of government sanction to produce measure-ment error, it would need to be the case that subjects were willing to take the risk of attendinga (very public) protest, but unwilling to tell us in a private survey that they did so. While thisis possible (they may misperceive the observability of their protest choice and fear putting theirbehavior on the record), it strikes us as unlikely. Third, list experiments (also known as the “itemcount technique”) conducted in the 2016 survey suggest that subjects are willing to respond hon-estly to direct questions about sensitive political topics (see Cantoni et al., 2019 for a discussion).
Our second set of outcomes includes changes in beliefs about protest efficacy, beliefs aboutthe Hong Kong population, and changes in political preferences in the short run (just after the2017 march).18 Beliefs about protest efficacy include views on the most likely political institutionsin Hong Kong in 2025 and 2050 (on a spectrum running from full integration with China to fullindependence). Beliefs about the Hong Kong population include beliefs regarding other HongKong citizens’ support of Hong Kong independence, other citizens’ preferences for democracy,and other citizens’ views on the Chinese Communist Party’s legitimacy in ruling over Hong Kong.
17This discussion of Hong Kong students’ willingness to report their political attitudes and behavior truthfully closelyfollows Cantoni et al. (2016) and Cantoni et al. (2019).
18All survey materials, including all of the individual questions used to construct our outcome variables, are providedin Online Appendix C.
11

Political preferences include subjects’ views on the importance of living in a democratic society,subjects’ personal stance on the political spectrum (pro-democracy vs. pro-Beijing), subjects’ ownviews on the Chinese Communist Party’s legitimacy in ruling over Hong Kong, and subjects’positions on Hong Kong independence.
These outcomes capture potential mechanisms through which attendance in 2017 can shapeprotest turnout in 2018. They are intended to comprehensively measure drivers of protest partic-ipation in canonical models: changes in preferences that affect payoffs from protest participationand from protest success; changes in political beliefs that affect the expected payoffs from partic-ipation and from protest success, as well as the probability of a successful protest; and, finally,beliefs about other Hong Kong citizens, which affect the probability of a successful protest.
Third, we study changes in beliefs about protest efficacy, beliefs about the Hong Kong popula-tion, and changes in political preferences in the long run (just before the July 1, 2018, march). Thesame set of outcomes are elicited and examined as in the short-run survey of outcomes in 2017.These outcomes again capture potential mechanisms shaping protest turnout in 2018.
Fourth, we ask about protest participation in the 2018 march. Findings on participation in 2018can be seen as a “reduced form” effect of our intervention on persistent engagement in a politicalmovement. This is the ultimate outcome of interest.
Finally, we investigate the formation of new friendships with politically active peers. Elicitedfollowing the 2018 march, this measure will shed light on the role of new social interactions indriving any persistent impact of the treatment (i.e., any persistent impact of attending the July 1,2017, protest). This represents another potential mechanism linking treatment (and protest partici-pation) to persistent political engagement.
4 Results
4.1 First stage: Participation in the 2017 protest
In Figure 1, we begin by presenting the short-run effects of the indirect incentive for protest atten-dance — the “first stage” for the 2017 march.19 We show raw attendance rates for subjects in thetreatment, placebo treatment, and pure control groups, respectively, in the left-hand panel. Onecan see that in the treatment group turnout rates were substantially (about 10 percentage points)and statistically significantly higher than in both of the other two groups. The modest turnout rate
19As discussed above, throughout the analyses presented we conduct two-sided tests for statistical inference. Whiledeviating from the one-sided tests that we pre-registered in the pre-analysis plan, this approach is more conservative.As an alternative approach to statistical inference, we also conduct two-sided permutation tests (i.e., “randomizationinference”) for all specifications shown in the paper. These permutation tests are conducted with 1,000 repetitions.Each repetition randomly assigns the treatment indicator to the same proportion of participants who received the maintreatment, then estimates the regression specification and compares the t-statistic on the coefficient of interest to theanalogous t-statistic computed in the baseline regression. The p-value is calculated as the fraction of repetitions forwhich the magnitude of the t-statistic estimated from the permutation exercise exceeds the magnitude of the analogoust-statistic computed in the baseline regression.
12

among subjects in the pure control and placebo treatment groups (just over 1%) reflects the over-all participation in the July 1 march in 2017 (approximately 50,000 people, modest by historicalstandards).20
One can also see that protest attendance rates were very similar (and statistically indistin-guishable; p-value = 0.328) in the placebo treatment and pure control groups. This suggests thatany income effects contributing to changed protest participation in 2017 are unlikely to be large.We will see below, in Figure 2, that 2018 turnout rates in the placebo treatment and pure controlgroups are also very similar (and statistically indistinguishable). In addition, in Online AppendixTable A.7, we more comprehensively examine differences between the placebo treatment groupand the pure control group across our entire range of 30 survey questions about political prefer-ences and beliefs in the short run (July 2017) and long run (June 2018). We find that the differencesbetween the two groups are uniformly small and statistically insignificant.
Across a range of outcomes, then, we find that income effects induced by our treatment donot affect our outcomes of interest. Thus, to gain power, and adhering to our pre-analysis plan,we pool the pure control and placebo treatment groups into a larger comparison group that forconcision we refer to as the “control” group. In the right hand panel of Figure 1, we present theraw attendance rates for subjects in the treatment and control groups, and one again sees arounda 10 percentage point, statistically significant treatment effect on protest turnout in 2017.
Table 3 displays the analogous results in regression format, now including controls. One canfirst see that whether we include cell fixed effects has no impact on the estimated treatment effect(compare columns 1 and 2). To control for a broad set of individual characteristics that mightaffect protest turnout (without using many degrees of freedom), we first predict control groupindividuals’ protest turnout in 2017 using a full set of demographics. Then, using the estimatedcoefficients from this regression, we predict all subjects’ turnout based on their demographics,and control for predicted turnout. One can see in Table 3, column 3, that the predicted turnoutcontrol, too, has nearly no impact on the estimated treatment effect. In sum, the indirect incentivetreatment successfully increased protest attendance by approximately 10 percentage points in theyear when incentives were in place.
4.2 Persistence: Participation in the 2018 protest
We next examine whether the indirect incentive for protest attendance in 2017 generates long-run (i.e., 2018) effects of protest participation. We reiterate that neither subjects in the treatmentgroup nor those in the control group received incentives from the study to participate in the marchin 2018 — they only differ in whether they were incentivized to participate in the 2017 march.Figure 2 presents the reduced form results. In the left hand panel, we display the raw attendancerates for subjects in the treatment, placebo treatment, and pure control groups, respectively. One
20The turnout rate in our sample is quite close to the rate (2.7%) observed among a similar sample of students for the2016 march, a protest with similar total attendance.
13

can see that in the treatment group, turnout rates remained substantially — around 5 percentagepoints — and statistically significantly higher than in both of the other two groups one year afterbeing treated (p-values are 0.004 in a test of equality with the pure control group and 0.048 in atest of equality with the placebo treatment group).
One also sees that protest attendance rates were very similar (and statistically indistinguish-able; p-value = 0.892) in the placebo treatment and pure control groups. As noted above, thissuggests that income effects do not meaningfully affect our outcomes of interest, and we thuspool the pure control and placebo treatment groups into a larger control group. In the right handpanel of Figure 2, we present the raw attendance rates for subjects in the treatment and controlgroups, and one again sees a nearly 5 percentage point, statistically significant treatment effect onprotest turnout in 2018 (p-value = 0.001).
Table 4, Panel A, presents regression estimates of the reduced form treatment effect in 2018.One can see that whether we include cell fixed effects, or whether we control for predicted protestparticipation based on individual observable characteristics, we find a highly statistically signifi-cant, approximately 5 percentage point effect of the incentive treatment on 2018 protest turnout.
In Table 4, Panel B, we estimate the causal effect of 2017 protest attendance on 2018 protestattendance at the individual level, exploiting variation in 2017 attendance arising from our ex-perimental treatment. Two-stage estimates show a persistence rate of nearly 50%, regardless ofwhether we control for cell fixed effects or predicted protest turnout. That is, subjects who wererandomly, indirectly incentivized into protest participation in one year are nearly 50% more likelyto turnout to protest a full year later when the incentives are no longer in place. We can bench-mark this experimentally-induced persistence rate against the naturally occurring one using datawe have collected from the HKUST student panel surveys since 2014. Depending on the year andthe specification, we estimate the likelihood of that a student who participated in July 1st march inyear t, conditional on having participated in the march in year t− 1, ranges between 24% and 43%,a bit below, but not far from the experimental persistence rate we observe (see Online AppendixTable B.7).21
4.3 Mechanisms: Changes in beliefs, preferences, and social interactions
What explains the persistent engagement of individuals who turn out to protest due to our ex-perimental intervention? Standard models of protest participation would suggest changes in ex-pected payoffs from participation arising from changed preferences or changed beliefs — the latterof which include beliefs about the political climate and incumbent regime, as well as “strategic”
21One might also wish to benchmark the persistence rate we find against rates of persistence observed in othersettings in which changes in beliefs, preferences, and social interactions may produce persistent engagement (sportingevents, concerts, etc.). In this work our aim is to test for a meaningful effect of past protest behavior on future behavior(i.e., testing the effect of past participation against 0) and to test for meaningful roles of belief changes, preferencechanges, and changed social interactions (i.e., comparing these mechanisms’ effects to 0). Comparing the magnitudeswithin this setting to the analogous magnitudes in other settings is left for future work.
14

beliefs about other potential protesters. We examine these changes and also changes in individ-uals’ social interactions, which might shape protest engagement by affecting the social utility ofprotesting (due to joint consumption of the experience or a desire to conform) or by supportingcoordination or transmitting information and thus reducing protest attendance costs.
4.3.1 Beliefs and preferences
We study three categories of outcomes.22 First, we study subjects’ own beliefs about the politicalcontext, which include the following four components:
1 By 2025, which of the following outcomes regarding Hong Kong’s political institu-tions do you think is most likely? (complete integration with Mainland China vs.fully separate institutions)
2 For the most likely outcome you picked in the 2025 outcome above, how certain doyou think it will actually happen? (completely uncertain vs. completely certain)
3 By 2050, which of the following outcomes regarding Hong Kong’s political institu-tions do you think is most likely? (complete integration with Mainland China vs.fully separate institutions)
4 For the most likely outcome you picked in the 2050 outcome above, how certain doyou think it will actually happen? (completely uncertain vs. completely certain)
Second, we study subjects’ own political preferences, which include the following four com-ponents:
1 How important is it for you to live in a country that is governed democratically, evenif democracy makes no significant difference in the socioeconomic status of you, yourfamily, or the country as a whole? (not at all important vs. absolutely important)
2 Where do you stand in terms of your political attitudes? (pro-democracy vs. pro-establishment / pro-Beijing)
3 As it is now, is the Chinese Communist Party legitimate in ruling over Hong Kong?(not at all legitimate vs. completely legitimate)
4 To what extent do you think Hong Kong should be an independent nation? (HongKong should not be independent at all vs. Hong Kong should definitely be indepen-dent)
Third, we study subjects’ beliefs about the beliefs and preferences of other potential protestparticipants. Such beliefs about others could plausibly affect subjects’ strategic considerations indeciding whether to protest. This part of our analysis includes the following four components.
22As noted above, all survey materials, including all of the individual questions, are provided in Online Appendix C.
15

1 Some people in Hong Kong are in strong support of its independence. To what extentdo you think that these people who hold such beliefs are afraid of expressing theirbeliefs in public? (not at all afraid vs. extremely afraid)
{2-4} What is the average answer that all citizens of Hong Kong would have chosen in thefollowing questions?
2 How important is it for you to live in a country that is governed democratically, evenif democracy makes no significant difference in the socioeconomic status of you, yourfamily, or the country as a whole?
3 As it is now, is the Chinese Communist Party legitimate in ruling over Hong Kong?(not at all legitimate vs. completely legitimate)
4 To what extent do you think Hong Kong should be an independent nation? (HongKong should not be independent at all vs. Hong Kong should definitely be indepen-dent)
We summarize outcomes in each of these three categories (own beliefs, own preferences, andbeliefs about others) by constructing z-score index variables with larger, positive values indicatingmore anti-authoritarian responses, weighting by the inverse covariance of the standardized vari-ables, following Anderson (2008).23 We do so separately for outcomes elicited just after the 2017protest (to study short-run effects) and just before the 2018 protest (to study long-run effects).This reduces the hypotheses tested to three outcomes at two points in time, as we pre-registeredfor evaluation. For completeness, we present the treatment effects on all individual outcome vari-ables in Online Appendix Table B.8, adjusting p-values for multiple hypothesis testing followingList et al. (Forthcoming).
Figure 3 presents estimated effects of the treatment on subjects’ own political beliefs, subjects’own political preferences, and subjects’ “strategic” beliefs about others. One can see that differ-ences between treatment and control subjects’ own political beliefs and their beliefs about othersare small and statistically insignificant just after the 2017 march. These differences practicallydisappear just before the 2018 march. Political preferences are statistically significantly differentbetween treatment and control subjects just after the 2017 march. Yet, this difference also becomessmall (less than one-tenth of a standard deviation) and is statistically insignificant just before the2018 march.
We present the reduced form and two-stage least squares estimates of the treatment’s effectson subjects’ own political beliefs in Table 5, their political preferences in Table 6, and their beliefsregarding other Hong Kong citizens in Table 7. Whether examining the reduced form treatmenteffects or estimating the effects of 2017 protest attendance in a two-stage framework, we findstatistically insignificant effects. We note that the effect of protest participation (induced by our
23In the case of own beliefs about political outcomes, we code answers as optimistic/“anti-authoritarian” if respon-dents predict that full independence or separate institutions are most likely, and express a degree of certainty of 5 (outof 10) or more.
16

treatment) on political preferences appears much more meaningful in the two stage analysis (Ta-ble 6, panel B), but it is imprecisely estimated. We thus see changed beliefs — both regarding thepolitical environment and regarding other citizens in the population — as unlikely play a largerole in driving persistent political engagement in our setting. While changed preferences may playa meaningful role, we do not have compelling evidence of this.24
As a final approach to studying the role of beliefs and preferences in driving subjects’ persistentpolitical engagement, we examine subjects’ plans to participate in the July 1st march in 2018, asof a week prior to the protest. We view subjects’ planned participation as a summary statisticcapturing any of our subjects’ political attitudes, beliefs, or preferences — including beliefs andpreferences along dimensions beyond those about which we asked in our surveys — that couldpotentially affect turnout. In fact, we find small, statistically insignificant differences in plannedturnout between treatment and control subjects (see Online Appendix Table B.12). To the extentthat any changes in preferences and beliefs should map into changes in subjects’ plans, our resultssuggest that treated subjects’ higher turnout in 2018 is unlikely to be driven by these mechanisms.Rather, as we discuss below, persistence seems to be driven by a mechanism that allows treatedsubjects to differentially convert their plans into action.
4.3.2 Social interactions
We next examine the extent to which protest attendance, and in particular, persistent protest at-tendance among treated subjects, can be attributed to changed social interactions. We exploitthe random variation in treatment intensity across major×cohort social network cells to test forheterogeneous treatment effects, thus shedding light on the role of social interactions in drivingprotest attendance. Importantly, this is the only dimension of heterogeneity we examine; it isthe only dimension of heterogeneity that we included in our pre-analysis plan; and, the variationexploited is experimental.
In Figure 4 we plot turnout rates at the cell level by individual treatment status and by tar-geted cell treatment intensity, for the 2017 and 2018 protests, respectively. We also plot linearlyestimated turnout rates as a function of individual treatment status, cell treatment intensity, andtheir interaction for 2017 and 2018. One can see in the left hand panel that in 2017, turnout rateswere significantly higher among treatment group individuals than control, and that the gap inturnout rates between treatment and control subjects was of approximately the same magnituderegardless of treatment cell intensity. Any complementarities across treated peers within a social
24Further evidence against a meaningful treatment effect on preferences working through 2017 protest participationcan be seen in a comparison of Online Appendix Figures B.3 and B.4. In the figures we replicate the patterns fromFigure 3, but splitting the sample depending on whether subjects (in treatment or control group) attended the 2017protest. One can see that beliefs and preferences are never statistically significantly different in these subsamples, butif anything, the differences in preferences are larger among subjects who did not attend the 2017 protest. This suggeststhat the imprecise differences in preferences observed in Figure 3 and Tables 5, 6, and 7 are likely to be a result ofsampling variation, rather than reflecting a mechanism producing persistent protest participation.
17

network were not very strong in 2017, nor do there seem to have been large spillovers to untreatedsubjects. It seems that the treatment affected turnout in 2017 very much at an individual level.
In contrast, one can see in the right hand panel that in 2018, turnout rates were differentiallyhigher among treatment group individuals in treatment cells with the highest treatment intensity.This suggests a crucial complementarity across treated individuals within a major×cohort socialnetwork that was activated after the 2017 march. Indeed, the interaction between cell treatmentintensity and individual treatment is statistically significant (p-value = 0.022). We present thecorresponding linear regression results in Online Appendix Table B.13, and one can see that theinteraction between individual treatment and cell treatment intensity significantly predicts 2018protest turnout whether we control for cell fixed effects or for subjects’ predicted protest partici-pation.
One can see the same pattern in regression format without imposing the parametric assump-tion that cell treatment intensity linearly affects the individual treatment effect. In Table 8, weallow treatment to affect protest participation in 2018 differently depending on whether one wasin social network cells that have 1%, 50%, or 75% treatment intensities, respectively (1% treated isthe omitted category). One can see that the estimated treatment effects are monotonically increas-ing across treatment intensity categories, with the treatment effects in the 50% and 75% treatedcategories significantly greater than the treatment effect in the 1% treated cells. The treatment ef-fect in the 75% treated cells is estimated to be nearly twice as large as in the 50% cells, though thedifference is not statistically significant.
The pattern of greater treatment effects in 2018 in cells with greater treatment intensity is ro-bust: in Table 8, columns 2 and 3, one can see that the results are robust to including our usualcontrols for treatment cell fixed effects and subjects’ predicted protest turnout. In our analysisof heterogeneous treatment effects, a particular concern is that imbalanced characteristics at thecell level (discussed above), rather than cell treatment intensity, are behind the significant inter-actions we observe. To determine whether individual characteristics interacted with treatmentdistort our estimates, in Table 8, column 4, we control for an interaction of individuals’ predictedturnout (estimated using our full set of individual covariates) with individual treatment, and findthat our results are nearly unchanged.25 We finally consider whether deviations between targetedtreatment intensity and actual treatment intensity distort our results; selective attrition is of par-ticular concern. We show in the Online Appendix that our findings are robust to using actualintensity (rather than assigned intensity) and also to re-weighting our observations to account forattrition.26
25The results are also robust if we include an interaction between the individual treatment indicator and any ofthe unbalanced characteristics identified in Table 2; see Online Appendix Table B.14 (including all of the unbalancedcharacteristics interacted with treatment in the same specification absorbs too much variation and we no longer areable to precisely estimate the coefficients of interest).
26In Online Appendix Figure B.5 and Table B.15, we present the corresponding heterogeneous treatment effect es-timates, graphically and in regression form, with actual treatment intensity. Online Appendix Figures B.6 and B.7,and Online Appendix Tables B.16, B.17, and B.18 replicate the results, re-weighting the sample to match the observ-
18

4.4 Interpreting our treatment effects
4.4.1 Timing of heterogeneous effects and the importance of new friendships
How might the variation in treatment intensity at the cell level have generated significant inter-actions with individual treatment status in 2018, but not in 2017? While we cannot definitivelyidentify a specific mechanism, we believe that new friendships plausibly contributed to thesefindings.
In 2017, regardless of the fraction of other individuals in a subject’s social network who weretreated, treated subjects were around 10 percentage points more likely to turn out than controlsubjects. Such a homogeneous treatment effect might reflect a lack of salience of the treatment —with less than 5% of the HKUST undergraduate student body receiving the treatment, it wouldnot have been widely known and discussed. There was also very little time for individuals whowere treated to interact before the 2017 march to coordinate on attendance. Finally, individualsreceiving the treatment may not have known with whom to coordinate; they may not yet havehad any obviously politically oriented friends. The absence of any heterogeneity of turnout ratesin the control group across cells with different treatment intensity in 2017 is also consistent withthe lack of discussion of the treatment among subjects.
Importantly, the homogeneity of treatment effects at the individual level in 2017, and the exper-imental variation in treatment intensity across cells, implies that cells with the highest treatmentintensity (higher fraction of individuals treated) sent a higher fraction of individuals to the 2017march. It thus seems very likely that at the 2017 march or thereafter, 2017 march attendees (thevast majority of whom were in the treatment group) would have differentially encountered othermarch attendees from their social network cell if they were in cells with a higher fraction treated.If one met someone from the same cohort×major at the 2017 march, a new friendship might beformed. Similarly, an encounter after the march on campus might evolve into a friendship basedon common experience among individuals who both attended the 2017 march. Both of these typesof new friendships would be far more likely: (i) for treated individuals (who were far more likelyto attend the 2017 march); and (ii) in cells with higher treatment intensity (in which a much higherfraction of individuals attended the march). These new friendships may have shaped the costsor benefits of subsequent protest attendance, thus generating heterogeneous treatment effects in2018.
Several pieces of evidence are suggestive of the importance of new friendships formed as aresult of march attendance — either at the march itself or thereafter. First, heterogeneity drivenby pre-existing friendships among treated subjects (prior to 2017) would have made heteroge-neous treatment effects in 2017 more likely. We do not find evidence of these. Second, pre-existingfriendships would have been as common between a treated subject and a control subject as be-
able characteristics of the pre-attrition sample at baseline. All baseline results are robust to using actual intensity andre-weighting to account for attrition.
19

tween treated subjects. If attendance in the 2017 march by a treated subject shaped 2018 turnoutamong her pre-existing friends (i.e., those from before the 2017 march), one should see hetero-geneity in turnout rates associated with cell treatment intensity in 2018 among the control group aswell as the treatment group. The fact that we only see differentially large turnout rates in hightreatment intensity cells among treated subjects suggests that joint attendance at the 2017 marchattendance was crucial in shaping turnout in 2018.
We also directly measure changes in subjects’ friendships since the 2017 protest. In the July2018 survey we asked subjects: “Since last year’s July 1st march, have you formed stronger friendshipswith people who are politically engaged?” To test whether new friendships plausibly contributed tothe patterns of political engagement observed above, we estimate regression models analogous tothose in Table 8, but considering as the outcome a dummy variable indicating reported new friend-ships (see Table 9). We find patterns of new friendship formation that correspond quite closely tothe patterns of 2018 protest attendance: new political friendships are reported significantly moreoften by treated individuals in the cells with the highest (50% or 75%) treatment intensity.27
Our finding that protest plans in the weeks before the 2018 march were not significantly differ-ent between treatment and control groups (see Online Appendix Table B.12) also sheds some lighton the role played by social interactions. As implied by similar planned turnout rates and dif-ferent actual turnout rates, treated individuals were much more likely to convert their plans intoaction: among those subjects who reported planning to attend the 2018 march, actual turnout was35% among the treatment group, while it was below 20% in the control group (the p-value from atest of equality is 0.096; see Online Appendix Figure B.8). This suggests that politically-engagedfriendships induce higher turnout particularly through mechanisms that operate during the daysvery close to the actual protest and perhaps on the day of the protest itself. This may be throughproviding information about transportation, coordinating turnout times and meeting locations,and perhaps applying social pressure for turnout. Unfortunately, we are unable to more preciselypin down the nature of the social interaction effects we observe; they may work through increasedjoint consumption value from protest participation; changed social image considerations; reducedcosts of coordination; or, improved information transmission.
4.4.2 Alternative channels of causation
A crucial question is whether the treatment effect we observe in 2018 might work through mech-anisms other than through protest turnout in 2017. That is, how confident are we in the exclu-sion restriction implied by our analysis? Our conceptual framework discussed above conceived
27In addition to conducting the robustness checks included in Table 8 (namely, including cell fixed effects, controllingfor predicted protest participation, and controlling for predicted protest participation interacted with treatment status),we also examine the robustness of the findings in Table 9 to controlling for the interaction between the individualtreatment indicator and any of the unbalanced characteristics identified in Table 2, as well as to re-weighting the sampleto match the observable characteristics of the pre-attrition sample at baseline. We find that the results are, indeed, robust(see Tables B.19 and B.20).
20

of changes in beliefs, preferences, and social networks as potential mechanisms through whichprotest turnout in 2017 may be linked to turnout in the following year. But, the exclusion restric-tion would be violated if treatment had an effect on 2018 participation through channels distinctfrom increased participation in 2017 — for example, if beliefs, preferences or social interactionswere affected by our treatment even in the absence of protest participation by an individual.
We can evaluate several of the most prominent potential threats to the exclusion restriction. Amajor concern, as noted above, was that relatively large payments made to subjects might distorttheir responses on our surveys. To evaluate the possibility of income effects as a potential viola-tion of the exclusion restriction, we implemented the placebo (“subway”) treatment, and foundthat while the income differences induced were approximately as large as in the treatment group,outcomes — protest participation, beliefs, and preferences — were nearly identical to the controlcondition. It does not appear to be the case that the treatment worked through income provision,rather than protest attendance. Another concern is that beliefs or preferences may have shiftedamong treatment group subjects who did not attend the march in 2017 (e.g., due to greater at-tention paid to the march as a result of our treatment). But as can be seen in Online AppendixFigure B.4, non-participants’ beliefs and preferences among treatment group subjects look nearlyidentical to those among control group subjects, particularly in June 2018.
4.4.3 External validity
A central finding of our study is the importance of social interactions in supporting persistentpolitical mobilization. It is important to emphasize that the formation of social bonds based ongroup expression is not limited to settings such as Hong Kong, where the application of state co-ercion has been limited. The US Civil Rights movement, which was severely cracked down upon,had a similar dynamic.28 Martin Luther King, Jr., described freedom songs, sung on marches, as“the soul of the movement.” Freedom Ride participant James Farmer describes a night in jail withfellow participants in which “the Hinds County jail rocked with unrestrained singing of songsabout Freedom and Brotherhood.” The Student National Coordinating Committee leader BerniceReagan described the protests that took place in Albany, Georgia, as a “singing movement,” withsongs creating social ties among participants: “After the song, the differences among us wouldnot be as great.” Even protest participation that was privately very costly generated social tiesthat plausibly sustained individuals’ engagement in the movement.
5 Conclusion
We find evidence that individuals’ participation in a single protest causally shapes their persistentengagement in a political movement. Persistent engagement in the setting we study is not primar-
28The quotes that follow come from: https://kinginstitute.stanford.edu/encyclopedia/songs-and-civil-rights-movement,last accessed May 7, 2019.
21
ily a result of changed preferences or beliefs, but rather of changed social interactions. New socialinteractions with politically engaged peers — at the protest and subsequently — seem to play acrucial role in supporting persistent political engagement.
The persistence of political participation via social interactions is in some regards more basicthan other mechanisms, yet has been overlooked by the existing theoretical literature. Protests andpolitical movements, by definition, require large numbers of individuals to be present, expressingthemselves at the same location, simultaneously. Such a coordinated social gathering provides aplatform for like-minded individuals to interact and form stronger social ties, inducing persistentengagement in similar events subsequently.
Our findings suggest several directions for future research. First, extending existing dynamicmodels of protest participation to incorporate these important new social interactions arising fromprotest participation. Second, identifying the mechanisms through which changed social inter-actions work: how important are increased joint consumption value from protest participation;changed social image considerations; reduced costs of coordination; or, improved informationtransmission? More generally, our results highlight a potentially important source of correlatedbehavior within social networks: not only might information spread across nodes and shape be-havior (i.e., due to social learning, as in Banerjee et al., 2013, and Gonzalez, 2018), but changesin the utility derived from joint consumption or conformity (i.e., social utility, as in Bursztyn etal., 2014) can also generate correlated behavior across connected nodes. The importance of socialutility as a complement to social learning in networks deserves further study.
Finally, our findings also have practical implications. They suggest that political mobilizationin dynamic settings will have especially high returns from early efforts, as well as from concen-trated efforts mobilizing entire social networks. Our results indicate that mobilization in a move-ment’s early stages will have particularly high payoffs given that those mobilized once will tendto to participate again in the future. Concentrated mobilization within social networks may haveparticularly high payoffs as well: participation among individuals likely to interact socially at aprotest or thereafter will produce the social ties that we find support sustained political engage-ment.
22

References
Acemoglu, Daron and James A. Robinson, “Why Did the West Extend the Franchise? Democracy,Inequality, and Growth in Historical Perspective,” Quarterly Journal of Economics, November2000, 115 (4), 1167–1199.
and , Economic Origins of Dictatorship and Democracy, Cambridge University Press, 2006.
and , Why Nations Fail: the Origins of Power, Prosperity, and Poverty, New York: Crown Busi-ness, August 2012.
, Suresh Naidu, Pascual Restrepo, and James A. Robinson, “Democracy Does Cause Growth,”December 2015. MIT working paper: http://economics.mit.edu/files/11227.
, Tarek A. Hassan, and Ahmed Tahoun, “The Power of the Street: Evidence From Egypt’s ArabSpring,” NBER Working Paper, October 2014, 20665.
Aidt, Toke S. and Raphael Franck, “How to get the snowball rolling and extend the franchise:voting on the Great Reform Act of 1832,” Public Choice, January 2012, 155 (3-4), 229–250.
and , “Democratization Under the Threat of Revolution: Evidence From the Great ReformAct of 1832,” Econometrica, March 2015, 83 (2), 505–547.
Anderson, Michael L., “Multiple Inference and Gender Differences in the Effects of Early Inter-vention: A Reevaluation of the Abecedarian, Perry Preschool, and Early Training Projects,”Journal of the American Statistical Association, December 2008, 103 (484), 1481–1495.
Banerjee, Abhijit, Arun G Chandrasekhar, Esther Duflo, and Matthew O Jackson, “The Diffu-sion of Microfinance,” Science, July 2013, 341 (6144), 1236498–1236498.
Barbera, Salvador and Matthew O. Jackson, “A Model of Protests, Revolution, and Information,”August 2017. Unpublished, Stanford University: https://ssrn.com/abstract=2732864.
Biggs, Michael, “Strikes as Forest Fires: Chicago and Paris in the Late Nineteenth Century,” Amer-ican Journal of Sociology, 2005, 110 (6), 1684–1714.
Bueno de Mesquita, Ethan, “Regime Change and Revolutionary Entrepreneurs,” American Politi-cal Science Review, August 2010, 104 (3), 446–466.
Bursztyn, Leonardo, Florian Ederer, Bruno Ferman, and Noam Yuchtman, “UnderstandingMechanisms Underlying Peer Effects: Evidence From a Field Experiment on Financial Deci-sions,” Econometrica, 2014, 82 (4), 1273–1301.
Cantoni, Davide, David Y. Yang, Noam Yuchtman, and Jane Zhang, “The Funda-mental Determinants of Anti-Authoritarianism,” November 2016. Unpublished,UC Berkeley: http://faculty.haas.berkeley.edu/yuchtman/Noam_Yuchtman_files/
antiauthoritarian_draft.pdf.
, , , and , “Protests as Strategic Games: Experimental Evidence from Hong Kong’s Democ-racy Movement,” Quarterly Journal of Economics, 2019, 134 (2).
23

Coppock, Alexander and Donald P. Green, “Is Voting Habit Forming? New Evidence from Exper-iments and Regression Discontinuities,” American Journal of Political Science, 2016, 60 (4), 1044–1062.
DellaVigna, Stefano, John A List, Ulrike Malmendier, and Gautam Rao, “Voting to tell others,”The Review of Economic Studies, 2016, 84 (1), 143–181.
, Ruben Enikolopov, Vera Mironova, Maria Petrova, and Ekaterina Zhuravskaya, “Cross-Border Media and Nationalism: Evidence from Serbian Radio in Croatia,” American EconomicJournal: Applied Economics, July 2014, 6 (3), 103–132.
DeLong, J Bradford and Andrei Shleifer, “Princes and Merchants: European City Growth beforethe Industrial Revolution,” Journal of Law and Economics, October 1993, 36 (2), 671–702.
Edmond, Chris, “Information Manipulation, Coordination, and Regime Change,” Review of Eco-nomic Studies, October 2013, 80 (4), 1422–1458.
Enikolopov, Ruben, Alexey Makarin, and Maria Petrova, “Social Media and Protest Participa-tion: Evidence from Russia,” April 2016. Unpublished, Universitat Pompeu Fabra: https:
//ssrn.com/abstract=2696236.
Fujiwara, Thomas, Kyle Meng, and Tom Vogl, “Habit Formation in Voting: Evidence from RainyElections,” American Economic Journal: Applied Economics, 2016, 8 (4), 160–188.
Funk, Patricia, “Social Incentives and Voter Turnout: Evidence from the Swiss Mail Ballot Sys-tem,” Journal of the European Economic Association, 2010, 8 (5), 1077–1103.
Gerber, Alan, Mitchell Hoffman, John Morgan, and Collin Raymond, “One in a Million: FieldExperiments on Perceived Closeness of the Election and Voter Turnout;,” January 2017. Unpub-lished, University of Toronto.
Gerber, Alan S., Donald P. Green, and Christopher W. Larimer, “Social Pressure and VoterTurnout: Evidence from a Large-scale Field Experiment,” American Political Science Review,February 2008, 102 (1), 33–48.
, Gregory A. Huber, David Doherty, and Conor M. Dowling, “Social Judgments and PoliticalParticipation: Estimating the Consequences of Social Rewards and Sanctions for Voting,” 2013.Working Paper.
Glaeser, Edward L, Giacomo A M Ponzetto, and Andrei Shleifer, “Why does democracy neededucation?,” Journal of Economic Growth, May 2007, 12 (2), 77–99.
Gonzalez, Felipe, “Collective Action in Networks: Evidence from the Chilean Student Move-ment,” July 2018. Unpublished, PUC Chile.
Granovetter, M., “The strength of weak ties,” American Journal of Sociology, 1973.
Hensel, Lukas, Johannes Hermle, Anselm Rink, and Christopher Roth, “Political Activists asFree-Riders: Evidence From a Natural Field Experiment,” 2018. Unpublished, Oxford Univer-sity.
24

Hobbs, William and Margaret E. Roberts, “How Sudden Censorship Can Increase Access to In-formation,” 2016. Unpublished, UC-San Diego.
King, Gary, Jennifer Pan, and Margaret E. Roberts, “How Censorship in China Allows Govern-ment Criticism but Silences Collective Expression,” American Political Science Review, May 2013,107 (2), 326–343.
Lin, Kurt, “Stand and be counted,” Monocle, 2018, 117, 38.
List, John, Azeem Shaikh, and Yang Xu, “Multiple Hypothesis Testing in Experimental Eco-nomics,” Experimental Economics, Forthcoming.
Lizzeri, Alessandro and Nicola Persico, “Why did the Elites Extend the Suffrage? Democracy andthe Scope of Government, with an Application to Britain’s ”Age of Reform”,” Quarterly Journalof Economics, May 2004, 119 (2), 707–765.
Llavador, Humberto and Robert J. Oxoby, “Partisan Competition, Growth, and the Franchise,”Quarterly Journal of Economics, August 2005, 120 (3), 1155–1189.
Lorentzen, Peter, “Regularizing Rioting: Permitting Public Protest in an Authoritarian Regime,”Quarterly Journal of Political Science, April 2013, 8 (2), 127–158.
Madestam, Andreas, Daniel Shoag, Stan Veuger, and David Yanagizawa-Drott, “Do PoliticalProtests Matter? Evidence from the Tea Party Movement,” Quarterly Journal of Economics, Octo-ber 2013, 128 (4), 1633–1685.
Manacorda, Marco and Andrea Tesei, “Liberation Technology: Mobile Phones and Political Mo-bilization in Africa,” May 2016. Unpublished, Queen Mary University of London.
Meyersson, Erik, “Political Man on Horseback: Military Coups and Development,” April2016. Unpublished, SITE, Stockholm School of Economics: https://erikmeyersson.files.
wordpress.com/2015/04/coups_meyersson_1504.pdf.
Palfrey, Thomas and Howard Rosenthal, “Participation and the provision of discrete publicgoods: A strategic analysis,” Journal of Public Economics, 1984, 24 (2), 171–193.
Papaioannou, Elias and Gregorios Siourounis, “Democratisation and Growth,” Economic Journal,October 2008, 118 (532), 1520–1551.
Passarelli, Francesco and Guido Tabellini, “Emotions and Political Unrest,” Journal of PoliticalEconomy, 2017, 125 (3), 903–946.
Perez-Truglia, Ricardo and Guillermo Cruces, “Partisan Interactions: Evidence from a Field Ex-periment in the United States,” Journal of Political Economy, 2017, 125 (4), 1208–1243.
Persson, Torsten and Guido Tabellini, “Democracy and Development: The Devil in the Details,”American Economic Review, May 2006, 96 (2), 319–324.
Przeworski, Adam and Fernando Limongi, “Political Regimes and Economic Growth,” Journal ofEconomic Perspectives, Summer 1993, 7 (3), 51–69.
25
Qin, Bei, David Stromberg, and Yanhui Wu, “Why Does China Allow Freer Social Media?Protests vs. Surveillance and Propaganda,” Journal of Economic Perspectives, 2017, 31 (1), 117–140.
Rodrik, Dani and Romain Wacziarg, “Do Democratic Transitions Produce Bad Economic Out-comes?,” American Economic Review, May 2005, 95 (2), 50–55.
Shadmehr, Mehdi and Dan Bernhardt, “Collective Action with Uncertain Payoffs: Coordination,Public Signals and Punishment Dilemmas ,” American Political Science Review, 2011, 105 (4), 829–51.
Tullock, Gordon, “The Paradox of Revolution,” Public Choice, 1971, 11, 89–99.
Yanagizawa-Drott, David, “Propaganda and Conflict: Evidence from the Rwandan Genocide,”Quarterly Journal of Economics, December 2014, 129 (4), 1947–1994.
26

Figures and tables
p=0.328
p=0.001
p<0.001
0.00
0.05
0.10
0.15
Pure control Placebo TreatmentTreatment group
Mea
n pr
otes
t par
ticip
atio
n
●
●
p<0.001
0.00
0.05
0.10
0.15
Control TreatmentTreatment group
Mea
n pr
otes
t par
ticip
atio
nFigure 1: Participation in July 1, 2017 protest, by treatment group. 95% confidence intervals shown.p-values calculated from pairwise t-tests testing equality of means between conditions.
p=0.892
p=0.048
p=0.004
0.00
0.05
0.10
0.15
Pure control Placebo TreatmentTreatment group
Mea
n pr
otes
t par
ticip
atio
n
●
●
p=0.001
0.00
0.05
0.10
0.15
Control TreatmentTreatment group
Mea
n pr
otes
t par
ticip
atio
n
Figure 2: Participation in July 1, 2018 protest, by treatment group. 95% confidence intervals shown.p-values calculated from pairwise t-tests testing equality of means between conditions.
27

●●p = 0.639 p = 0.891
● ●
p = 0.084 p = 0.219
●
●p = 0.314 p = 0.996
Political beliefs about others
Political preferences
Political beliefs
Post July 2017 Pre July 2018
−0.1
0.0
0.1
−0.1
0.0
0.1
−0.1
0.0
0.1
Treatment group ● Control Treatment
Figure 3: Survey results on beliefs and preferences for treatment and control groups in the short runand long run. p-values calculated from pairwise t-tests testing equality of means between treatmentand control.
28
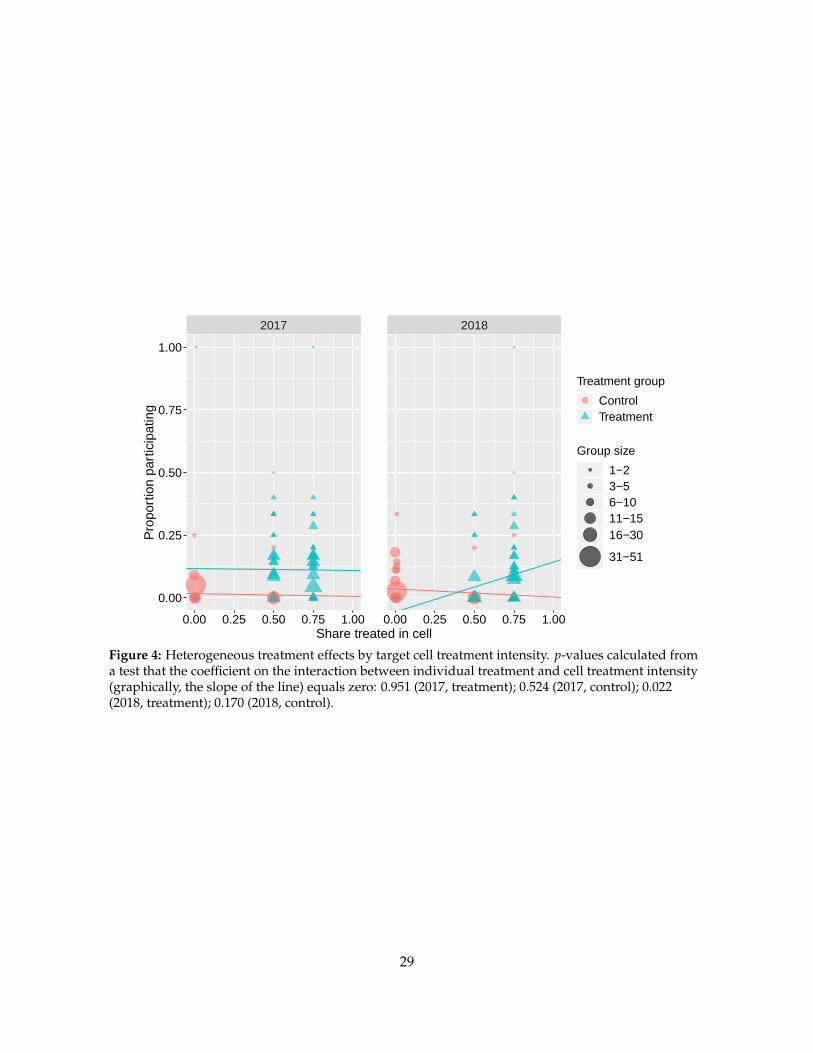
2017 2018
0.00 0.25 0.50 0.75 1.00 0.00 0.25 0.50 0.75 1.00
0.00
0.25
0.50
0.75
1.00
Share treated in cell
Pro
port
ion
part
icip
atin
g
Treatment group
ControlTreatment
Group size
1−23−56−1011−1516−30
31−51
Figure 4: Heterogeneous treatment effects by target cell treatment intensity. p-values calculated froma test that the coefficient on the interaction between individual treatment and cell treatment intensity(graphically, the slope of the line) equals zero: 0.951 (2017, treatment); 0.524 (2017, control); 0.022(2018, treatment); 0.170 (2018, control).
29

Table 1: Summary statistics and balance check: main treatment vs. placebo vs. pure control
Control
Overall Pure Placebo Both Treatment p-values
mean std.dev. mean mean mean mean (Pu=Pl) (Pu=T) (Pl=T) (B=T)
Variables: (1) (2) (3) (4) (5) (6) (7) (8) (9) (10)
Male 0.521 0.500 0.591 0.572 0.585 0.436 0.865 0.012 0.238 0.022Birth year 1997.22 1.44 1997.25 1997.09 1997.20 1997.25 0.600 0.992 0.620 0.779English language high school 0.794 0.405 0.796 0.789 0.794 0.794 0.861 0.959 0.900 0.987
HH monthly income 27448 16407 27228 26987 27152 27837 0.871 0.617 0.610 0.564Expected income at age 40 4.41 1.03 4.39 4.42 4.40 4.43 0.761 0.576 0.913 0.648# real estate owned 0.769 0.945 0.776 0.783 0.778 0.757 0.930 0.807 0.753 0.758
Planned to participate in 2017 protest 0.154 0.361 0.152 0.211 0.170 0.134 0.166 0.525 0.061 0.164Participated in any previous protest 0.359 0.480 0.336 0.388 0.353 0.368 0.274 0.305 0.654 0.599
# of obs. 849 330 152 482 367 - - - -
Notes: Table presents mean individual characteristics for the entire experimental sample, then presents means for the pure control group, the placebo treatmentgroup, the union of pure control and placebo treatment groups (‘control’), and the treatment group, respectively. It then tests for pairwise equality of meansbetween groups. ‘English language high school’ is an indicator of whether the subject completed high school with English as the formal language of instruction(as opposed to Chinese). ‘HH monthly income’ is the self-reported total income earned by both parents (including sources of income such as dividends andrents). ‘Expected income at age 40’ is a survey response indicating self-reported expectations of relative income compared to classmates at HKUST at age 40.‘# real estate owned’ is a measure of wealth: the number of real estate properties owned by a subject’s parents/household in Hong Kong at the time of thesurvey. ‘Planned to participate in 2017 protest’ is a subject’s self-reported plan (as of June 2017) to participate in the July 1, 2017 march prior to the treatmentassignment. ‘Participated in any previous protest’ is a self-reported indicator for having participated in a protest prior to 2017.
30

Table 2: Cell-level summary statistics and balance check
Overall 0-intensity 1-intensity 50-intensity 75-intensity p-value
mean std.dev. mean mean mean mean (0=1=50=75)
Variables: (1) (2) (3) (4) (5) (6) (7)
Male 0.521 0.500 0.753 0.734 0.414 0.435 0.000Birth year 1997.22 1.44 1996.80 1997.16 1997.38 1997.24 0.000
English language high school 0.794 0.405 0.831 0.808 0.783 0.786 0.040HH monthly income 27448 16407 28294 26837 26754 28205 0.595
Expected income at age 40 4.413 1.035 4.400 4.509 4.418 4.359 0.029# real estate owned 0.769 0.945 0.718 0.815 0.740 0.784 0.436
Planned to participate in 2017 protest 0.154 0.361 0.200 0.168 0.165 0.124 0.452
# of obs 97 13 20 28 36 -
Notes: Table presents mean individual characteristics at the cell level for the entire experimental sample, then presents mean cell characteristicsacross categories of cell treatment intensity: 0% treated, 1 individual treated, 50% treated, and 75% treated, respectively. It then tests for equalityof means across all groups. ‘English language high school’ is an indicator of whether the subject completed high school with English as the formallanguage of instruction (as opposed to Chinese). ‘HH monthly income’ is the self-reported total income earned by both parents (including sourcesof income such as dividends and rents). ‘Expected income at age 40’ is a survey response indicating self-reported expectations of relative incomecompared to classmates at HKUST at age 40. ‘# real estate owned’ is a measure of wealth: the number of real estate properties owned by a subject’sparents/household in Hong Kong at the time of the survey. ‘Planned to participate in 2017 protest’ is a subject’s self-reported plan (as of June2017) to participate in the July 1, 2017 march prior to the treatment assignment. ‘Participated in any previous protest’ is a self-reported indicatorfor having participated in a protest prior to 2017.
31

Table 3: Effects on turnout
Participated July 1, 2017
(1) (2) (3)
Treatment 0.099∗∗∗ 0.107∗∗∗ 0.106∗∗∗
(0.014) (0.019) (0.019)
p-value (permutation test) 0.000 0.000 0.000
Treatment cell FEs No Yes YesControl for predicted protest participation No No Yes
Observations 849 849 849
DV mean (control grp.) 0.012 0.012 0.012DV std. dev. (control grp.) 0.111 0.111 0.111DV mean (all) 0.055 0.055 0.055DV std. dev. (all) 0.229 0.229 0.229
Notes: Table reports estimated coefficients from regressions of protest turnout in July 2017 ona treatment indicator (the omitted control group is the union of the placebo treatment and purecontrol groups). Column 2 includes controls for a full set of treatment cell fixed effects. Col-umn 3 further includes a control for predicted protest participation. Predicted protest partic-ipation is constructed by regressing an indicator for planned turnout in 2017 on gender, age,monthly income, expected income at age 40, amount of real estate owned, and an indicatorfor whether the individual had attended a protest in the past. Standard errors clustered at thetreatment cell level.
32

Table 4: Persistent effects on participation
Participated July 1, 2018
(1) (2) (3)
Panel A: Reduced form
Treatment 0.046∗∗∗ 0.050∗∗∗ 0.050∗∗∗
(0.014) (0.017) (0.017)
p-value (permutation test) 0.002 0.009 0.008
Panel B: Two-stage least squares
Participated July 1, 2017 0.463∗∗∗ 0.466∗∗∗ 0.467∗∗∗
(0.134) (0.151) (0.152)
Treatment cell FEs No Yes YesControl for predicted protest participation No No Yes
Observations 849 849 849
DV mean (control grp.) 0.025 0.025 0.025DV std. dev. (control grp.) 0.156 0.156 0.156DV mean (all) 0.045 0.045 0.045DV std. dev. (all) 0.207 0.207 0.207
Notes: Panel A reports estimated coefficients from regressions of protest turnout in July 2018 ona treatment indicator (the omitted control group is the union of the placebo treatment and purecontrol groups). Panel B reports estimated coefficients from two-stage least squares regressionsof protest turnout in July 2018 on an indicator of protest turnout in July 2017, with the latterinstrumented in the first stage with the treatment indicator. Column 2 includes controls for afull set of treatment cell fixed effects. Column 3 includes controls for a full set of treatment cellfixed effects and a control for predicted protest participation. Predicted protest participationis constructed by regressing an indicator for planned turnout in 2017 on gender, age, monthlyincome, expected income at age 40, amount of real estate owned, and an indicator for whetherthe individual had attended a protest in the past. Standard errors clustered at the treatment celllevel.
33
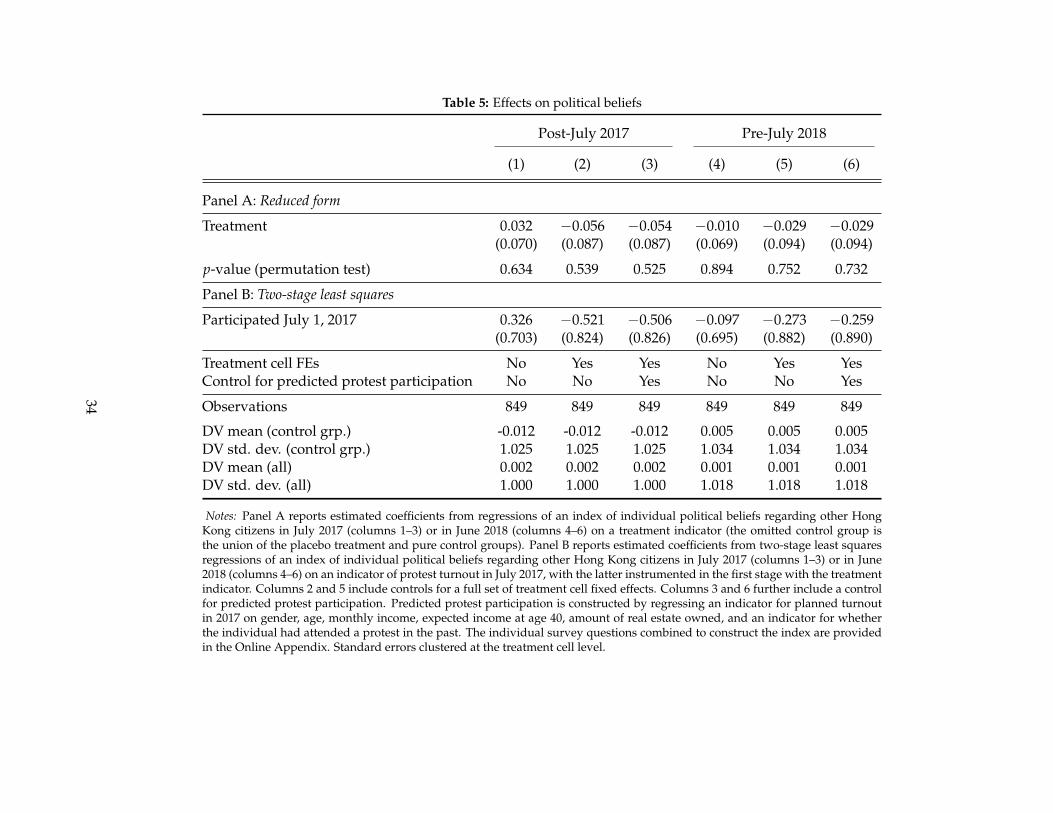
Table 5: Effects on political beliefs
Post-July 2017 Pre-July 2018
(1) (2) (3) (4) (5) (6)
Panel A: Reduced form
Treatment 0.032 −0.056 −0.054 −0.010 −0.029 −0.029(0.070) (0.087) (0.087) (0.069) (0.094) (0.094)
p-value (permutation test) 0.634 0.539 0.525 0.894 0.752 0.732
Panel B: Two-stage least squares
Participated July 1, 2017 0.326 −0.521 −0.506 −0.097 −0.273 −0.259(0.703) (0.824) (0.826) (0.695) (0.882) (0.890)
Treatment cell FEs No Yes Yes No Yes YesControl for predicted protest participation No No Yes No No Yes
Observations 849 849 849 849 849 849
DV mean (control grp.) -0.012 -0.012 -0.012 0.005 0.005 0.005DV std. dev. (control grp.) 1.025 1.025 1.025 1.034 1.034 1.034DV mean (all) 0.002 0.002 0.002 0.001 0.001 0.001DV std. dev. (all) 1.000 1.000 1.000 1.018 1.018 1.018
Notes: Panel A reports estimated coefficients from regressions of an index of individual political beliefs regarding other HongKong citizens in July 2017 (columns 1–3) or in June 2018 (columns 4–6) on a treatment indicator (the omitted control group isthe union of the placebo treatment and pure control groups). Panel B reports estimated coefficients from two-stage least squaresregressions of an index of individual political beliefs regarding other Hong Kong citizens in July 2017 (columns 1–3) or in June2018 (columns 4–6) on an indicator of protest turnout in July 2017, with the latter instrumented in the first stage with the treatmentindicator. Columns 2 and 5 include controls for a full set of treatment cell fixed effects. Columns 3 and 6 further include a controlfor predicted protest participation. Predicted protest participation is constructed by regressing an indicator for planned turnoutin 2017 on gender, age, monthly income, expected income at age 40, amount of real estate owned, and an indicator for whetherthe individual had attended a protest in the past. The individual survey questions combined to construct the index are providedin the Online Appendix. Standard errors clustered at the treatment cell level.
34

Table 6: Effects on political preferences
Post-July 2017 Pre-July 2018
(1) (2) (3) (4) (5) (6)
Panel A: Reduced form
Treatment 0.119∗ 0.135∗ 0.134∗ 0.085 0.092 0.092(0.065) (0.073) (0.073) (0.067) (0.095) (0.095)
p-value (permutation test) 0.092 0.117 0.105 0.241 0.264 0.288
Panel B: Two-stage least squares
Participated July 1, 2017 1.197∗ 1.264∗ 1.260∗ 0.855 0.859 0.875(0.683) (0.753) (0.757) (0.701) (0.935) (0.943)
Treatment cell FEs No Yes Yes No Yes YesControl for predicted protest participation No No Yes No No Yes
Observations 849 849 849 849 849 849
DV mean (control grp.) -0.062 -0.062 -0.062 -0.052 -0.052 -0.052DV std. dev. (control grp.) 0.995 0.995 0.995 1.040 1.040 1.040DV mean (all) -0.011 -0.011 -0.011 -0.015 -0.015 -0.015DV std. dev. (all) 0.993 0.993 0.993 1.007 1.007 1.007
Notes: Panel A reports estimated coefficients from regressions of an index of individual political beliefs regarding other HongKong citizens in July 2017 (columns 1–3) or in June 2018 (columns 4–6) on a treatment indicator (the omitted control groupis the union of the placebo treatment and pure control groups). Panel B reports estimated coefficients from two-stage leastsquares regressions of an index of individual political beliefs regarding other Hong Kong citizens in July 2017 (columns 1–3) orin June 2018 (columns 4–6) on an indicator of protest turnout in July 2017, with the latter instrumented in the first stage withthe treatment indicator. Columns 2 and 5 include controls for a full set of treatment cell fixed effects. Columns 3 and 6 furtherinclude a control for predicted protest participation. Predicted protest participation is constructed by regressing an indicatorfor planned turnout in 2017 on gender, age, monthly income, expected income at age 40, amount of real estate owned, and anindicator for whether the individual had attended a protest in the past. The individual survey questions combined to constructthe index are provided in the Online Appendix. Standard errors clustered at the treatment cell level.
35

Table 7: Effects on political beliefs regarding other Hong Kong citizens
Post-July 2017 Pre-July 2018
(1) (2) (3) (4) (5) (6)
Panel A: Reduced form
Treatment 0.069 0.043 0.043 0.000 0.015 0.015(0.065) (0.078) (0.078) (0.067) (0.077) (0.077)
p-value (permutation test) 0.297 0.629 0.600 1.000 0.862 0.879
Panel B: Two-stage least squares
Participated July 1, 2017 0.698 0.402 0.409 0.003 0.139 0.143(0.677) (0.734) (0.736) (0.676) (0.719) (0.727)
Treatment cell FEs No Yes Yes No Yes YesControl for predicted protest participation No No Yes No No Yes
Observations 849 849 849 849 849 849
DV mean (control grp.) -0.045 -0.045 -0.045 0.005 0.005 0.005DV std. dev. (control grp.) 1.017 1.017 1.017 1.051 1.051 1.051DV mean (all) -0.015 -0.015 -0.015 0.005 0.005 0.005DV std. dev. (all) 0.998 0.998 0.998 1.009 1.009 1.009
Notes: Panel A reports estimated coefficients from regressions of an index of individual political beliefs regarding other HongKong citizens in July 2017 (columns 1–3) or in June 2018 (columns 4–6) on a treatment indicator (the omitted control groupis the union of the placebo treatment and pure control groups). Panel B reports estimated coefficients from two-stage leastsquares regressions of an index of individual political beliefs regarding other Hong Kong citizens in July 2017 (columns 1–3) orin June 2018 (columns 4–6) on an indicator of protest turnout in July 2017, with the latter instrumented in the first stage withthe treatment indicator. Columns 2 and 5 include controls for a full set of treatment cell fixed effects. Columns 3 and 6 furtherinclude a control for predicted protest participation. Predicted protest participation is constructed by regressing an indicatorfor planned turnout in 2017 on gender, age, monthly income, expected income at age 40, amount of real estate owned, and anindicator for whether the individual had attended a protest in the past. The individual survey questions combined to constructthe index are provided in the Online Appendix. Standard errors clustered at the treatment cell level.
36

Table 8: Heterogeneity with respect to cell treatment intensity (semiparametric specification)
Protest participation in July 2018
(1) (2) (3) (4)
Treatment −0.030∗∗∗ −0.034∗ −0.033∗ −0.046(0.011) (0.019) (0.019) (0.035)
p-value (permutation test) 0.008 0.021 0.028 0.042
Treatment × 50intensity 0.058∗∗∗ 0.062∗∗∗ 0.062∗∗∗ 0.063∗∗∗
(0.017) (0.024) (0.024) (0.023)p-value (permutation test) 0.017 0.009 0.035 0.011
Treatment × 75intensity 0.106∗∗∗ 0.118∗∗∗ 0.117∗∗∗ 0.118∗∗∗
(0.028) (0.039) (0.038) (0.039)p-value (permutation test) 0.002 0.014 0.007 0.009
Treatment cell FEs No Yes Yes YesControl for predicted protest participation No No Yes Yes (interacted)
Observations 849 849 849 849
p-value (Treatment=Treatment×50) 0.000 0.000 0.000 0.000p-value (Treatment=Treatment×75) 0.001 0.000 0.002 0.012p-value (Treatment×50=Treatment×75) 0.142 0.221 0.221 0.214DV mean (control grp.) 0.025 0.025 0.025 0.025DV std. dev. (control grp.) 0.156 0.156 0.156 0.156DV mean (all) 0.045 0.045 0.045 0.045DV std. dev. (all) 0.207 0.207 0.207 0.207
Notes: Table reports estimated coefficients from regressions of protest turnout in July 2018 on a treatment indicator (theomitted control group is the union of the placebo treatment and pure control groups), the individual’s cell’s treatmentintensity, and the interaction of the two. Column 2 includes controls for a full set of treatment cell fixed effects. Column 3includes controls for a full set of treatment cell fixed effects and a control for predicted protest participation. Column 4adds an interaction term between treatment and predicted protest participation in addition to the level of predictedprotest participation. Predicted protest participation is constructed by regressing an indicator for planned turnout in2017 on gender, age, monthly income, expected income at age 40, amount of real estate owned, and an indicator forwhether the individual had attended a protest in the past. Standard errors clustered at the treatment cell level.
37

Table 9: Formation of new friendships: heterogeneity with respect to cell treatment intensity(semiparametric specification)
New friendships in 2018
(1) (2) (3) (4)
Treatment −0.061∗∗∗ −0.037∗ −0.036∗ −0.053(0.017) (0.019) (0.020) (0.044)
p-value (permutation test) 0.004 0.077 0.068 0.196
Treatment × 50intensity 0.108∗∗∗ 0.073∗∗ 0.073∗∗ 0.075∗∗
(0.030) (0.032) (0.033) (0.033)p-value (permutation test) 0.005 0.034 0.029 0.033
Treatment × 75intensity 0.086∗∗∗ 0.063 0.058 0.060(0.032) (0.040) (0.041) (0.041)
p-value (permutation test) 0.012 0.189 0.347 0.206
Treatment cell FEs No Yes Yes YesControl for predicted protest participation No No Yes Yes (interacted)
Observations 849 849 849 849
p-value (Treatment=Treatment×50) 0.000 0.000 0.000 0.000p-value (Treatment=Treatment×75) 0.000 0.002 0.004 0.003p-value (Treatment×50=Treatment×75) 0.301 0.528 0.526 0.526DV mean (control grp.) 0.025 0.025 0.025 0.025DV std. dev. (control grp.) 0.156 0.156 0.156 0.156DV mean (all) 0.045 0.045 0.045 0.045DV std. dev. (all) 0.207 0.207 0.207 0.207
Notes: Table reports estimated coefficients from regressions of an indicator of self reported new political friendshipformation between July 2017 and July 2018 on a treatment indicator (the omitted control group is the union of the placebotreatment and pure control groups), the individual’s cell’s treatment intensity, and the interaction of the two. Column 2includes controls for a full set of treatment cell fixed effects. Column 3 includes controls for a full set of treatment cellfixed effects and a control for predicted protest participation. Column 4 adds an interaction term between treatment andpredicted protest participation in addition to the level of predicted protest participation. Predicted protest participationis constructed by regressing an indicator for planned turnout in 2017 on gender, age, monthly income, expected incomeat age 40, amount of real estate owned, and an indicator for whether the individual had attended a protest in the past.Standard errors clustered at the treatment cell level.
38

SUPPLEMENTARY APPENDIX
Appendix A Political context1
A.1 Hong Kong’s anti-authoritarian movement
Prior to 1997, Hong Kong was a British colony, with limited democratic political rights, but strongprotections of civil liberties and respect for the rule of law. On July 1, 1997, Hong Kong wasreturned to the People’s Republic of China, to be ruled as a Special Administrative Region with itsown quasi-constitution — the “Basic Law” — and a promise from China that its institutions wouldbe respected and maintained until 2047, under a policy known as “one country, two systems.” TheBasic Law left ambiguous several important details that have been bargained and battled overbetween the so-called “pan-democracy” and “pro-Beijing” camps.
The first ambiguity to generate mass political protests was regarding Article 23 of the BasicLaw, which covered the legal regulation of speech and behavior that threatened the government.Under the encouragement of Beijing, a law implementing provisions of Article 23 — the “NationalSecurity Bill” — was proposed by the Hong Kong Chief Executive (the head of government) inSeptember 2002, and was seen by many Hong Kong citizens as deeply threatening to their humanrights and civil liberties.2 The proposed legislation catalyzed a massive July 1 march (in 2003) inwhich an estimated half million people protested. This expression of popular opposition led tothe withdrawal of the bill, and no legislation on Article 23 has passed since.
More recently, political conflict has arisen from a second ambiguity in the Basic Law, regard-ing the method of selection of Hong Kong’s Chief Executive. Article 45 of the Basic Law of HongKong states the following: “The method for selecting the Chief Executive shall be specified in thelight of the actual situation in the Hong Kong Special Administrative Region . . . The ultimate aimis the selection of the Chief Executive by universal suffrage upon nomination by a broadly repre-sentative nominating committee in accordance with democratic procedures.” While indicating anultimate aim of universal suffrage, the Basic Law does not state when elections will be introduced,nor does it clarify the details of nomination. From Hong Kong’s return to China until today, theChief Executive has been selected by an Election Committee, rather than by universal suffrage;currently, the Committee is composed of 1,200 members, and is widely seen as pro-Beijing.
In 2014, the Twelfth National People’s Congress proposed an election mode that would haveallowed the citizens of Hong Kong a choice between two or three candidates, but these candidateswould be selected by the same pro-Beijing committee as before.3 In response to this limited ex-pansion of democratic rights, a massive July 1 march was mobilized, with hundreds of thousandsof citizens taking to the streets. Further escalation and a police crackdown precipitated the evenlarger-scale “Umbrella Revolution,” named for the ubiquitous umbrellas carried by participants.The Umbrella Revolution persisted for months, being slowly cleared out by police by the end ofDecember 2014. While the movement did not alter the policy proposed by Beijing, it did send aclear signal to the Hong Kong legislature (the “LegCo”) that a circumscribed change in institutionswas unacceptable to the people of Hong Kong. In June 2015, the LegCo struck down the Chineseproposal led by the opposition of the pan-democratic camp.
1This description closely follows Cantoni et al. (2019).2For a discussion of these concerns, see the University of Hong Kong’s Human Rights Portal Page, “Research on
Article 23,” online at https://goo.gl/GdNcHY, last accessed February 28, 2018.3Refer to https://goo.gl/0oyNmt, last accessed February 28, 2018.
A.1

Since June 2015, the democratic movement in Hong Kong has both fragmented and radical-ized. Recent encroachments on Hong Kong citizens’ civil liberties, including the arrest of HongKong booksellers by the mainland Chinese government, have deepened some Hong Kong citi-zens’ fear of the CCP and their sense of a Hong Kong identity very much distinct from — evenopposed to — that of mainland China. The result is that Hong Kong citizens and political partiesare now much more loudly calling for independence or “self determination.” “Localist” violencehas occasionally flared; new political parties, such as the student-led Demosisto, have formed andwon seats in the 2016 LegCo election on platforms explicitly calling for self-determination.4
A.2 The July 1 marches: characteristics and achievements
Marches on the anniversary of Hong Kong’s handover to China, held each July 1, have been de-scribed as “the spirit of democratic struggle in Hong Kong.”5 The July 1 marches have played animportant role in Hong Kong citizens’ political engagement with the Chinese government, andhave achieved major policy changes and even constitutional concessions — particularly whenlarge crowds of protesters were mobilized.6 Each protest march, while part of a broader anti-authoritarian, democratic movement, is organized around a specific set of issues and policy aims.The first notable achievement came as a response to the CCP’s September 2002 proposal for ananti-subversion bill under Article 23, described above. The July 1, 2003, march included around500,000 people — the largest political gathering in Hong Kong since the Chinese Democracy move-ment of 1989. Not only was the proposed law withdrawn, but the march eventually forced theresignation of multiple government officials, including the Chief Executive, Tung Chee-hwa.7
Another success followed the 2012 march, which included up to 400,000 people, and was partof a mobilization against a CCP proposal for a mandatory “moral and national curriculum” inHong Kong schools. This proposal, too, was withdrawn shortly after the march. The 2014 marchagain saw hundreds of thousands of people demanding the popular nomination of Chief Exec-utive candidates in the 2017 election. Although the march did not achieve citizen nominationof Chief Executive candidates, it did produce the massive Umbrella Revolution and led to therejection of the CCP’s proposal for partial democratic rights.
Some characteristics of Hong Kong’s July 1 marches may appear idiosyncratic: they are reg-ularly scheduled events and they are largely tolerated by an authoritarian government. In fact,these characteristics appear in other contexts. First, regularly scheduled protests are utilized bymany anti-authoritarian movements, from Russia’s “Strategy 31” movement demanding rightsof assembly to the “Monday demonstrations” in Leipzig that precipitated the fall of the GermanDemocratic Republic.8 Second, authoritarian regimes are often surprisingly tolerant of protests,
4The legislators elected on a self-determination platform were since removed from office on various technicalitiesregarding their oath-taking, foreshadowing future conflict.
5“Sixteen Years of July 1st Marches: A Dynamic History of Hong Kong Citizens’ Fight for Democracy,” InitiumMedia, June 30, 2018. Available online at https://goo.gl/8bZDrf (last accessed July 5, 2018).
6A time series of turnout in July 1 marches can be seen in Figure B.1.7In an opinion piece tellingly titled “July 1st March turnout size is absolutely important,” former LegCo member
Margaret Ng Ngoi-yee writes,“[T]he turnout at the July 1st Marches is absolutely important. If not for 500,000 peopletaking to the street in 2003, Article 23 would have been legislated already.” The Stand News, June 29, 2018. Availableonline at https://goo.gl/vgP3WP (last accessed July 5, 2018).
8Strategy 31 is discussed in “The Russian protesters who won’t give up,” by Luke Harding, The Guardian, August30, 2010. Available online at: https://goo.gl/vfwZro (last accessed December 9, 2017). Weeks of modestly-sized,regularly-scheduled protests prior to the massive events that led to the fall of the Berlin Wall can be seen in OnlineAppendix Figure B.9.
A.2

within limits. The “Monday demonstrations” in Leipzig were able to proceed in the late sum-mer and autumn of 1989 despite the obvious feasibility of crackdown.9 In Russia, protesters re-cently organized rallies in support of opposition politician Alexei Navalny on Vladimir Putin’s65th birthday, in October 2017, and the Financial Times notes that in response to a protest of around1,000 people in Moscow, “police largely left protesters alone.”10 Even in mainland China, the Com-munist Party tolerates particular protests (Lorentzen, 2013). In each of these settings, there existsa threat of crackdown ex ante, and — including in Hong Kong — police do crack down whenprotests cross the line.
Thus, like other anti-authoritarian protests, Hong Kong’s July 1 marches demand (and occa-sionally win) fundamental political rights — civil liberties and democratic institutions — from anauthoritarian regime. Like other anti-authoritarian protests, turnout is important for success. Theimportance of protest size can be seen in our survey data: subjects in our experiment believe thereis a higher likelihood of protest success if a protest is larger (see Online Appendix Figure B.10).It can also be seen in the differences between July 1 march organizers’ turnout estimates and theturnout estimates of the Hong Kong police. Organizers consistently exceed independent estimatesof July 1 march size (and police estimates consistently fall below), with differences between thetwo reaching the tens or even hundreds of thousands (see Online Appendix Figure B.1).
Finally, like other anti-authoritarian protests, there is a tail risk of the turnout incurring highpersonal cost, although the probability is very low. On one hand, Chinese authorities are deeplyconcerned about political instability in Hong Kong, at least in part because of potential spilloversinto mainland China.11 Thus, beyond the time cost and the experience of heat, humidity, and rainon a Hong Kong summer’s day, the concern of the Chinese government implies the potential forhigh participation costs: the possibility of arrest and forceful police crackdowns using batons andtear gas. On the other hand, we stress that Hong Kong’s high level of civil liberty and the explicitprotection of public assembly by its Basic Law have made protest demonstrations a tradition ofthe city. The Hong Kong Government has repeatedly made statements after the July 1st Marchesindicating that the “Government respects citizens’ rights to assemble, protest, and express theiropinions.”12 Among a total of approximately 1,350,000 people who have participated in the July1st Marches during the past 15 years (2003-2018), 19 individuals were arrested and 5 people werecharged for activities during the Marches.13 Note that 10 of the 15 Marches have 0 arrests and 0charges at all.
9See “A Peaceful Revolution in Leipzig,” by Andrew Curry, Spiegel Online, October 9, 2009. Available online at:https://goo.gl/iUakCp (last accessed December 9, 2017).
10Several dozen protesters were detained then released in St. Petersburg, which saw a protest of over 2,000 people.See “Anti-Putin protests mark Russian president’s birthday,” by Max Seddon and Henry Foy, Financial Times, October7, 2017. Available online at: https://goo.gl/4oWQzA (last accessed December 9, 2017).
11The Chinese government blocked Instagram — the last major uncensored social media platform available insidethe Great Firewall — when the Umbrella Revolution broke out at the end of September 2014 (Hobbs and Roberts, 2016).
12Source: Hong Kong Government Newsroom, https://www.info.gov.hk/gia/general/200807/01/
P200807010156.htm (last accessed December 9, 2017).13Protest turnout counts are based on HKUPOP July 1st Headcounting Project; arrests and convictions are compiled
based on comprehensive news reporting archives from the WiseNews database.
A.3

Appendix B Appendix figures and tables
Figure B.1: Turnout at July 1st marches from 2003 to 2017, as counted by the organizers, as reported ingovernment announcements, and as estimated by the Public Opinion Programme at the University ofHong Kong (all in thousands). Reproduced from the Public Opinion Programme, the University ofHong Kong. Source: https://www.hkupop.hku.hk/english/features/july1/index.html, lastaccessed on December 26, 2017. This figure is also shown in Cantoni et al. (2019).
B.1

●
●
p=0.399
0.00
0.05
0.10
0.15
0.20
Placebo TreatmentTreatment group
Take
up p
ropo
rtio
n
Figure B.2: Take-up proportions for treatment group and placebo treatment group, respectively. 95%confidence intervals shown. p-values calculated from a pairwise t-test of equality of means betweenplacebo and treatment.
B.2

●●p = 0.563 p = 0.92
●●
p = 0.656 p = 0.249
●
●p = 0.149 p = 0.685
Political beliefs about others
Political preferences
Political beliefs
Post July 2017 Pre July 2018
−1
0
1
−1
0
1
−1
0
1
Treatment group ● Control Treatment
Figure B.3: Survey results on beliefs and preferences for treatment and control groups in the short runand long run (2017 participants only). p-values calculated from pairwise t-tests of equality of meansbetween treatment and control.
B.3

● ●p = 0.679 p = 0.764
● ●
p = 0.126 p = 0.241
●
●p = 0.108 p = 0.941
Political beliefs about others
Political preferences
Political beliefs
Post July 2017 Pre July 2018
−0.1
0.0
0.1
−0.1
0.0
0.1
−0.1
0.0
0.1
Treatment group ● Control Treatment
Figure B.4: Survey results on beliefs and preferences for treatment and control groups in the short runand long run (2017 non-participants only). p-values calculated from pairwise t-tests of equality ofmeans between treatment and control.
B.4

2017 2018
0.00 0.25 0.50 0.75 1.00 0.00 0.25 0.50 0.75 1.00
0.00
0.25
0.50
0.75
1.00
Share treated in cell
Pro
port
ion
part
icip
atin
g
Treatment group
ControlTreatment
Group size
1−23−56−1011−1516−30
31−51
Figure B.5: Heterogeneous treatment effects by empirical cell treatment intensity. p-values calculatedfrom a test that the coefficient on the interaction between individual treatment and cell treatmentintensity (graphically, the slope of the line) equals zero: 0.402 (2017, treatment); 0.535 (2017, control);0.268 (2018, treatment); 0.254 (2018, control).
2017 2018
0.00 0.25 0.50 0.75 1.00 0.00 0.25 0.50 0.75 1.00
0.00
0.25
0.50
0.75
1.00
Share treated in cell
Pro
port
ion
part
icip
atin
g
Treatment group
ControlTreatment
Group size
1−23−56−1011−1516−30
31−51
Figure B.6: Heterogeneous treatment effects by target cell treatment intensity (reweighted sample).p-values calculated from a test that the coefficient on the interaction between individual treatmentand cell treatment intensity (graphically, the slope of the line) equals zero: 0.402 (2017, treatment);0.535 (2017, control); 0.268 (2018, treatment); 0.254 (2018, control).
B.5

2017 2018
0.00 0.25 0.50 0.75 1.00 0.00 0.25 0.50 0.75 1.00
0.00
0.25
0.50
0.75
1.00
Share treated in cell
Pro
port
ion
part
icip
atin
gTreatment group
ControlTreatment
Group size
1−23−56−1011−1516−30
31−51
Figure B.7: Heterogeneous treatment effects by empirical cell treatment intensity (reweightedsample). p-values calculated from a test that the coefficient on the interaction between individualtreatment and cell treatment intensity (graphically, the slope of the line) equals zero. 0.402 (2017,treatment); 0.535 (2017, control); 0.268 (2018, treatment); 0.254 (2018, control).
B.6
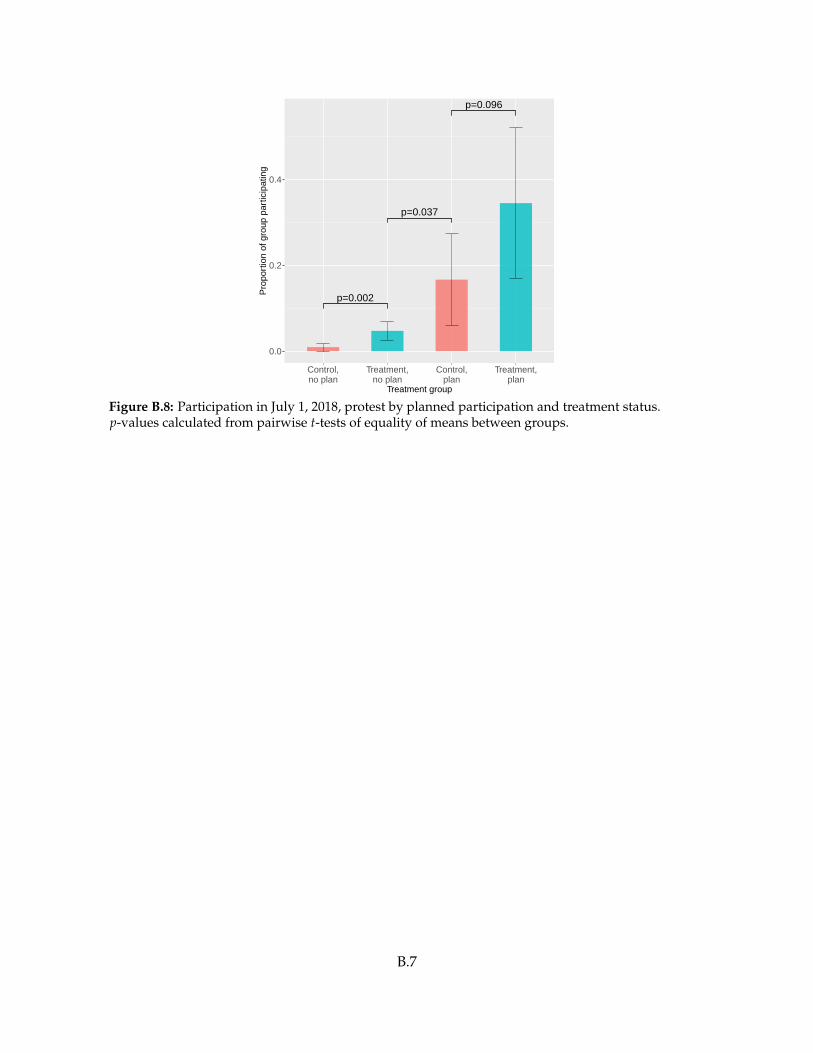
p=0.002
p=0.037
p=0.096
0.0
0.2
0.4
Control,no plan
Treatment,no plan
Control,plan
Treatment,plan
Treatment group
Pro
port
ion
of g
roup
par
ticip
atin
g
Figure B.8: Participation in July 1, 2018, protest by planned participation and treatment status.p-values calculated from pairwise t-tests of equality of means between groups.
B.7

100
200
300
400
500
Parti
cipa
nts
(Tho
usan
ds)
13aug1989 03sep1989 24sep1989 15oct1989 05nov1989Date
020
4060
Freq
uenc
y
0 100 200 300 400 500Participants (Thousands)
Figure B.9: Protest events in 13 East German district capitals in summer and fall 1989, throughNovember 9, 1989 (when the Berlin Wall fell). Left panel plots individual protests’ sizes by date; rightpanel shows a histogram of protest sizes during the entire time period. When a protest’s size isestimated, we take the average of the minimum and maximum estimates. Data come from the ArchivBurgerbewegung Leipzig. This figure is also shown in Cantoni et al. (2019).
1020
3040
5060
Belie
f on
prob
abilit
y of
... i
f # tu
rnou
t to
prot
est
10000 50000 250000 1250000Hypothetical protest turnout
Govt crackdown Democracy achieved in HK
Figure B.10: Students’ beliefs regarding the benefits (the chance of achieving democratic institutionsin Hong Kong) and costs (the chance of a violent government crackdown) for hypothetical protestswith different turnout levels, ranging from 10,000 to 1,250,000 participants. This figure is also shownin Cantoni et al. (2019).
B.8

Table B.1: Attrition across survey parts
Completed Wave 1 Only wave 1 All waves
mean std.dev. mean mean p-value
Variables: (1) (2) (3) (4) (5)
Male 0.512 0.500 0.482 0.521 0.283Birth year 1997.26 1.40 1997.41 1997.22 0.065English language high school 0.801 0.399 0.826 0.794 0.290
HH monthly income 27399 16457 27231 27448 0.855Expected income at age 40 4.40 1.04 4.34 4.41 0.357# real estate owned 0.771 0.951 0.777 0.769 0.905
Planned to participate in 2017 protest 0.151 0.358 0.138 0.154 0.520Participated in any previous protest 0.369 0.483 0.401 0.359 0.234
# of obs. 1096 247 849 -
Notes: Table presents mean individual characteristics for the entire sample recruited in 2017. It presents meanindividual characteristics first for the sample that completed only Wave 1, then for the sample that completedall waves. It then tests for equality of means between the latter two groups. ‘English language high school’ isan indicator of whether the subject completed high school with English as the formal language of instruction (asopposed to Chinese). ‘HH monthly income’ is the self-reported total income earned by both parents (includingsources of income such as dividends and rents). ‘Expected income at age 40’ is a survey response indicatingself-reported expectations of relative income compared to classmates at HKUST at age 40. ‘# real estate owned’is a measure of wealth: the number of real estate properties owned by a subject’s parents/household in HongKong at the time of the survey. ‘Planned to participate in 2017 protest’ is a subject’s self-reported plan (as of June2017) to participate in the July 1, 2017 march prior to the treatment assignment.
B.9

Table B.2: Evidence on compliers: comparing treatment group protesters to past protesters
Overall Past Treated
mean std.dev. mean mean p-value
Variables: (1) (2) (3) (4) (5)
Male 0.552 0.498 0.554 0.537 0.831Birth year 1997.03 1.44 1997.01 1997.22 0.377English language high school 0.823 0.382 0.829 0.780 0.447
HH monthly income 28425 17159 28275 29463 0.679Expected income at age 40 4.38 1.01 4.36 4.51 0.370# real estate owned 0.831 1.001 0.835 0.805 0.857
Planned to participate in 2017 protest 0.233 0.423 0.235 0.220 0.826Participated in any previous protest 0.874 0.332 1.000 0.000 0.000
# of obs. 326 285 41 -
Notes: Table studies the characteristics of protesters in the treatment group (taking them as sugges-tive of the “compliers” in the study, though they also include the “always takers”), comparing thesesubjects to other experimental subjects who reported attending past protests. The table first presentsmean individual characteristics for experimental subjects who either reported previously attendinga protest, or who were treatment group protesters in 2017, or both. The table then splits this group,presenting mean individual characteristics for two disjoint sets: (i) experimental subjects who partici-pated in past protests but were not treatment group protesters; and (ii) experimental subjects who weretreatment group protesters. It then tests for equality of means between groups. ‘English language highschool’ is an indicator of whether the subject completed high school with English as the formal lan-guage of instruction (as opposed to Chinese). ‘HH monthly income’ is the self-reported total incomeearned by both parents (including sources of income such as dividends and rents). ‘Expected incomeat age 40’ is a survey response indicating self-reported expectations of relative income compared toclassmates at HKUST at age 40. ‘# real estate owned’ is a measure of wealth: the number of real estateproperties owned by a subject’s parents/household in Hong Kong at the time of the survey. ‘Plannedto participate in 2017 protest’ is a subject’s self-reported plan (as of June 2017) to participate in the July1, 2017 march prior to the treatment assignment.
B.10

Table B.3: Description of social network cells
Protest SubwayMajor/program Cohorts Gender Residence Size treatment placebo
density (%) density (%)
1 Accounting 2014 Female All 20 1 02 Accounting 2014 Male All 21 1 503 Accounting 2015 Female All 37 50 14 Accounting 2015 Male All 12 1 505 Biochemistry and Cell Biology, Biotechnology, 2013 All All 10 1 50
Biological Science6 Biochemistry and Cell Biology 2014 Female All 13 75 07 Biochemistry and Cell Biology 2014 Male All 9 1 508 Biochemistry and Cell Biology 2015 Female All 15 75 09 Biochemistry and Cell Biology 2015 Male All 6 75 010 Biological Science, Biotechnology 2014 All All 20 50 011 Biological Science, Biotechnology 2015 Female All 18 75 012 Biological Science, Biotechnology 2015 Male All 11 50 113 Chemistry 2014 Female All 17 50 014 Chemistry 2014 Male All 6 1 015 Chemistry 2015 Female All 11 50 016 Chemistry 2015 Male All 15 75 117 Aerospace Engineering, Civil Engineering, 2013 All All 20 75 0
Civil and Environmental Engineering, Environmental Science,Environmental Management and Technology
18 Aerospace Engineering, Civil Engineering, 2014 Female All 5 50 50Civil and Environmental Engineering,Biotechnology and General Business Management
19 Aerospace Engineering, Civil Engineering, 2014 Male All 30 0 75Civil and Environmental Engineering,Biotechnology and General Business Management
20 Aerospace Engineering, Civil Engineering 2015 Female All 8 0 5021 Aerospace Engineering, Civil Engineering 2015 Male All 35 50 022 Computer Science, Computer Engineering, Electronic Engineering 2013 Female All 7 50 5023 Computer Science, Computer Engineering, Electronic Engineering 2013 Male All 14 1 024 Computer Science 2014 Female All 7 1 025 Computer Science 2014 Male All 24 1 5026 Computer Science 2015 Female All 6 75 0
Continued on next page
B.11

Protest SubwayMajor/program Cohorts Gender Residence Size treatment placebo
density (%) density (%)
27 Computer Science 2015 Male All 19 1 7528 Computer Engineering 2014 All All 18 75 129 Computer Engineering, Electronic Engineering 2015 Female All 6 75 030 Computer Engineering, Electronic Engineering 2015 Male All 24 75 031 Electronic Engineering 2014 Female All 4 50 5032 Electronic Engineering 2014 Male All 26 0 7533 Environmental Science, Environmental Management and Technology 2014 Female All 9 75 134 Environmental Science, Environmental Management and Technology 2014 Male All 14 75 035 Environmental Science, Environmental Management and Technology 2015 Female All 14 1 5036 Environmental Science, Environmental Management and Technology 2015 Male All 8 50 137 Accounting, Finance, Global Business, Economics and Finance 2013 Female All 11 75 038 Accounting, Finance, Global Business, Economics and Finance 2013 Male All 10 50 139 Finance, Economics and Finance 2014 Female All 13 50 5040 Finance, Economics and Finance 2014 Male All 24 50 5041 Finance, Economics and Finance 2015 Female All 18 1 5042 Finance, Economics and Finance 2015 Male All 14 75 143 Accounting, Finance, Economics, Economics and Finance 2016 Female All 19 75 044 Accounting, Finance, Economics, Economics and Finance 2016 Male All 15 0 145 Global Business, Economics, General Business Management 2014 All All 13 75 046 Global Business, Economics, World Business, 2015 Female All 17 50 0
General Business Management47 Global Business, Economics, World Business, 2015 Male All 14 75 0
General Business Management48 Global Business, General Business Management, 2016 Female All 12 75 1
Information Systems, Mathematics and Economics,Mathematics, Management, Quantitative Finance,Logistics Management and Engineering and General Business Management
49 Global Business, General Business Management, 2016 Male All 13 75 0Information Systems, Mathematics and Economics,Mathematics, Management, Quantitative Finance,Logistics Management and Engineering and General Business Management
50 Global China Studies 2014 All All 13 75 151 Global China Studies 2015 All All 15 0 052 Logistics Management and Engineering, 2014 All All 20 0 75
Continued on next page
B.12

Protest SubwayMajor/program Cohorts Gender Residence Size treatment placebo
density (%) density (%)
Industrial Engineering and Engineering Management53 Logistics Management and Engineering, 2015 Female All 11 75 0
Risk Management and Business Intelligence,Industrial Engineering and Engineering Management
54 Logistics Management and Engineering, 2015 Male All 10 1 50Risk Management and Business Intelligence,Industrial Engineering and Engineering Management
55 Logistics Management and Engineering, 2016 All All 15 50 1Risk Management and Business IntelligenceIndustrial Engineering and Engineering Management
56 Information Systems 2014 Female All 20 50 5057 Information Systems 2014 Male All 7 1 7558 Information Systems 2015 Female All 20 75 059 Information Systems 2015 Male All 10 50 5060 Mathematics and Economics, Mathematics, Quantitative Finance 2014 Female All 9 0 161 Mathematics and Economics, Mathematics, Quantitative Finance 2014 Male All 16 1 162 Mathematics and Economics, Quantitative Finance 2015 All All 15 75 063 Marketing 2013 All All 10 0 164 Marketing 2014 Female All 31 75 165 Marketing 2014 Male All 11 0 166 Marketing 2015 Female All 28 50 067 Marketing 2015 Male All 9 50 068 Mathematics 2015 Female All 7 75 169 Mathematics 2015 Male All 19 0 170 Mechanical Engineering 2014 Female All 9 0 7571 Mechanical Engineering 2014 Male All 15 50 5072 Mechanical Engineering 2015 All All 20 75 073 Operations Management, Management, Information Systems 2013 All All 10 1 174 Operations Management, Management, 2014 Female All 14 75 1
Logistics Management and Engineering and General Business Management75 Operations Management, Management, 2014 Male All 10 50 1
Logistics Management and Engineering and General Business Management76 Operations Management, Management 2015 Female All 16 1 5077 Operations Management, Management 2015 Male All 8 0 75
Continued on next page
B.13

Protest SubwayMajor/program Cohorts Gender Residence Size treatment placebo
density (%) density (%)
78 Risk Management and Business Intelligence 2014 All All 13 75 079 Business and Management (undeclared) 2015 All All 12 75 080 Marketing, Business and Management (undeclared) 2016 Female Off campus 68 50 5081 Marketing, Business and Management (undeclared) 2016 Female On campus 16 75 182 Marketing, Business and Management (undeclared) 2016 Male Off campus 37 50 083 Marketing, Business and Management (undeclared) 2016 Male On campus 14 75 084 Chemical Engineering, Chemical and Biomolecular Engineering, 2015 Female All 11 50 1
Engineering (undeclared), Individualized Interdisciplinary Major, Others85 Chemical Engineering, Chemical and Biomolecular Engineering, 2015 Male All 11 50 0
Engineering (undeclared), Individualized Interdisciplinary Major, Others86 Electronic Engineering, Computer Engineering, 2016 Female All 36 50 50
Computer Science and General Business Management,Civil Engineering and General Business Management,Chemical and Environmental Engineering, Engineering (undeclared)
87 Electronic Engineering, Computer Engineering, 2016 Male Off campus 74 1 50Computer Science and General Business Management,Civil Engineering and General Business Management,Chemical and Environmental Engineering, Engineering (undeclared)
88 Electronic Engineering, Computer Engineering, 2016 Male On campus 21 1 1Computer Science and General Business Management,Civil Engineering and General Business Management,Chemical and Environmental Engineering, Engineering (undeclared)
89 Physics, Science (undeclared) 2015 All All 19 75 090 Chemistry, Physics, Environmental Science, 2016 Female Off campus 49 75 0
Environmental Management and Technology, Science (undeclared)91 Chemistry, Physics, Environmental Science, 2016 Female On campus 17 50 50
Environmental Management and Technology, Science (undeclared)92 Chemistry, Physics, Environmental Science, 2016 Male Off campus 39 75 0
Environmental Management and Technology, Science (undeclared)93 Chemistry, Physics, Environmental Science, 2016 Male On campus 8 50 0
Environmental Management and Technology, Science (undeclared)94 Chemistry, Chemical Engineering, 2013 Male All 15 75 0
Chemical and Environmental Engineering, Mathematics and Economics,Mathematics, Quantitative Finance, Physics,
Continued on next page
B.14
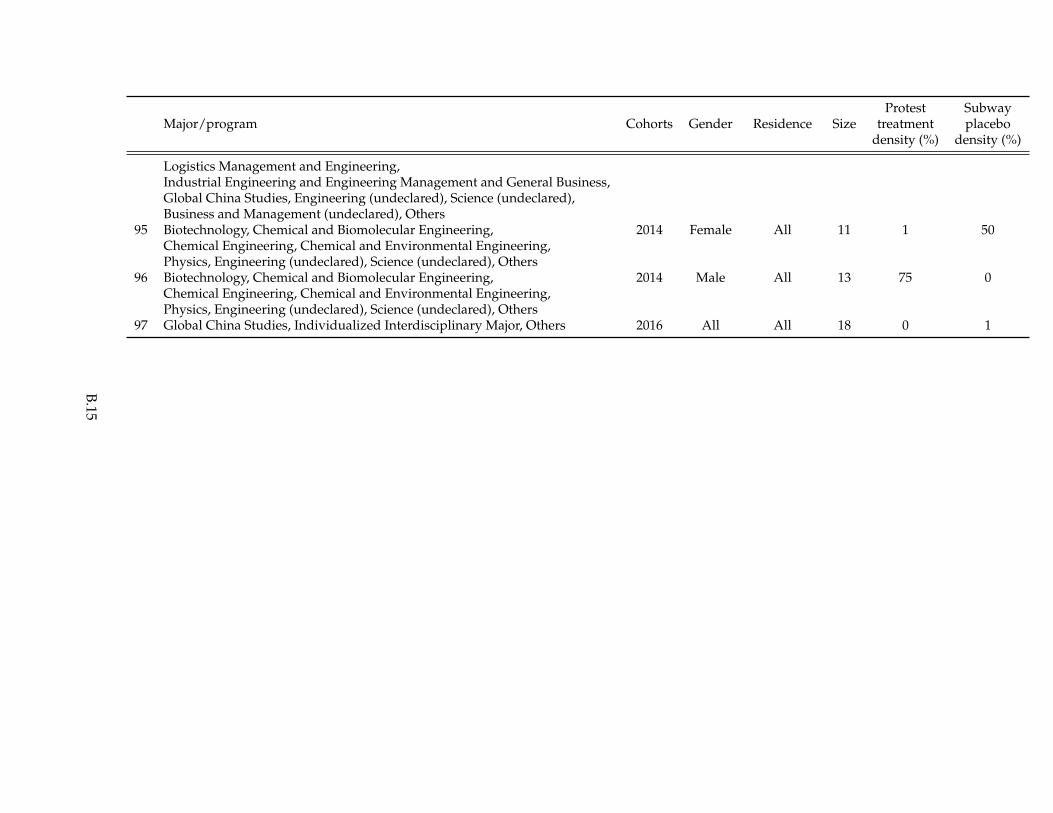
Protest SubwayMajor/program Cohorts Gender Residence Size treatment placebo
density (%) density (%)
Logistics Management and Engineering,Industrial Engineering and Engineering Management and General Business,Global China Studies, Engineering (undeclared), Science (undeclared),Business and Management (undeclared), Others
95 Biotechnology, Chemical and Biomolecular Engineering, 2014 Female All 11 1 50Chemical Engineering, Chemical and Environmental Engineering,Physics, Engineering (undeclared), Science (undeclared), Others
96 Biotechnology, Chemical and Biomolecular Engineering, 2014 Male All 13 75 0Chemical Engineering, Chemical and Environmental Engineering,Physics, Engineering (undeclared), Science (undeclared), Others
97 Global China Studies, Individualized Interdisciplinary Major, Others 2016 All All 18 0 1
B.15

Table B.4: List of treatment cells
Name Size # treated Empirical intensity Target intensity 2017 turnout 2018 turnout
1 ACCT-2014-F 10 0 0.00 1.00 0 02 ACCT-2014-M 12 0 0.00 1.00 0 03 ACCT-2015-F 25 13 52.00 50.00 0 04 ACCT-2015-M 10 0 0.00 1.00 0 05 BCB-2013 5 0 0.00 1.00 0 06 BCB-2014-F 5 4 80.00 75.00 0 07 BCB-2014-M 5 0 0.00 1.00 0 08 BCB-2015-F 9 5 55.56 75.00 0 09 BCB-2015-M 3 2 66.67 75.00 0 010 BISC-2014 9 3 33.33 50.00 0 111 BISC-2015-F 12 8 66.67 75.00 1 212 BISC-2015-M 6 4 66.67 50.00 0 013 CHEM-2014-F 9 7 77.78 50.00 1 014 CHEM-2014-M 3 0 0.00 1.00 0 015 CHEM-2015-F 9 5 55.56 50.00 2 016 CHEM-2015-M 11 8 72.73 75.00 1 017 CIVL-2013 6 3 50.00 75.00 0 018 CIVL-2014-F 3 2 66.67 50.00 0 019 CIVL-2014-M 15 0 0.00 0.00 0 120 CIVL-2015-F 4 0 0.00 0.00 1 021 CIVL-2015-M 20 11 55.00 50.00 1 022 COMP-2013-F 3 1 33.33 50.00 0 023 COMP-2013-M 5 1 20.00 1.00 0 024 COMP-2014-F 2 0 0.00 1.00 0 025 COMP-2014-M 10 0 0.00 1.00 0 026 COMP-2015-F 4 4 100.00 75.00 0 027 COMP-2015-M 10 1 10.00 1.00 0 128 CPEG-2014 7 6 85.71 75.00 1 129 CPEG-2015-F 2 1 50.00 75.00 0 030 CPEG-2015-M 11 7 63.64 75.00 2 231 ELEC-2014-F 2 0 0.00 50.00 0 0
Continued on next page.
B.16

Table B.4 – continued from previous page.
Name Size # treated Empirical intensity Target intensity 2017 turnout 2018 turnout
32 ELEC-2014-M 12 0 0.00 0.00 0 033 ENVS-2014-F 5 5 100.00 75.00 0 134 ENVS-2014-M 8 5 62.50 75.00 1 135 ENVS-2015-F 9 1 11.11 1.00 0 036 ENVS-2015-M 6 3 50.00 50.00 0 037 FINA-2013-F 5 2 40.00 75.00 2 238 FINA-2013-M 5 1 20.00 50.00 0 039 FINA-2014-F 4 2 50.00 50.00 0 040 FINA-2014-M 13 7 53.85 50.00 1 041 FINA-2015-F 9 1 11.11 1.00 0 142 FINA-2015-M 8 6 75.00 75.00 1 143 FINA-2016-F 13 9 69.23 75.00 0 144 FINA-2016-M 9 0 0.00 0.00 0 145 GBUS-2014 8 6 75.00 75.00 1 046 GBUS-2015-F 14 7 50.00 50.00 0 047 GBUS-2015-M 8 5 62.50 75.00 2 248 GBUS-2016-F 5 2 40.00 75.00 0 049 GBUS-2016-M 6 5 83.33 75.00 1 150 GCS-2014 7 5 71.43 75.00 0 051 GCS-2015 5 0 0.00 0.00 0 052 IELM-2014 6 0 0.00 0.00 0 053 IELM-2015-F 7 4 57.14 75.00 0 054 IELM-2015-M 3 0 0.00 1.00 0 155 IELM-2016 6 3 50.00 50.00 1 056 IS-2014-F 12 6 50.00 50.00 1 057 IS-2014-M 4 1 25.00 1.00 0 058 IS-2015-F 9 7 77.78 75.00 1 059 IS-2015-M 5 2 40.00 50.00 1 060 MAEC-2014-F 2 0 0.00 0.00 0 061 MAEC-2014-M 10 1 10.00 1.00 0 062 MAEC-2015 8 5 62.50 75.00 0 0
Continued on next page.
B.17

Table B.4 – continued from previous page.
Name Size # treated Empirical intensity Target intensity 2017 turnout 2018 turnout
63 MARK-2013 4 0 0.00 0.00 0 064 MARK-2014-F 19 14 73.68 75.00 2 165 MARK-2014-M 5 0 0.00 0.00 0 066 MARK-2015-F 18 10 55.56 50.00 1 067 MARK-2015-M 6 3 50.00 50.00 1 068 MATH-2015-F 4 3 75.00 75.00 1 169 MATH-2015-M 11 0 0.00 0.00 1 270 MECH-2014-F 2 0 0.00 0.00 0 071 MECH-2014-M 9 5 55.56 50.00 0 072 MECH-2015 15 11 73.33 75.00 1 073 OM-2013 5 0 0.00 1.00 0 074 OM-2014-F 6 3 50.00 75.00 0 075 OM-2014-M 4 2 50.00 50.00 0 076 OM-2015-F 7 0 0.00 1.00 0 177 OM-2015-M 3 0 0.00 0.00 0 078 RMBI-2014 8 6 75.00 75.00 1 179 SBM-2015 4 3 75.00 75.00 0 080 SBM-2016-F-Off 29 12 41.38 50.00 2 081 SBM-2016-F-On 6 4 66.67 75.00 0 082 SBM-2016-M-Off 25 12 48.00 50.00 1 183 SBM-2016-M-On 7 5 71.43 75.00 1 284 SENG-2015-F 6 4 66.67 50.00 1 185 SENG-2015-M 8 6 75.00 50.00 0 086 SENG-2016-F 16 6 37.50 50.00 0 087 SENG-2016-M-Off 40 1 2.50 1.00 3 188 SENG-2016-M-On 10 1 10.00 1.00 0 089 SSCI-2015 12 8 66.67 75.00 0 190 SSCI-2016-F-Off 30 23 76.67 75.00 1 291 SSCI-2016-F-On 9 4 44.44 50.00 2 292 SSCI-2016-M-Off 18 12 66.67 75.00 3 193 SSCI-2016-M-On 4 3 75.00 50.00 1 1
Continued on next page.
B.18
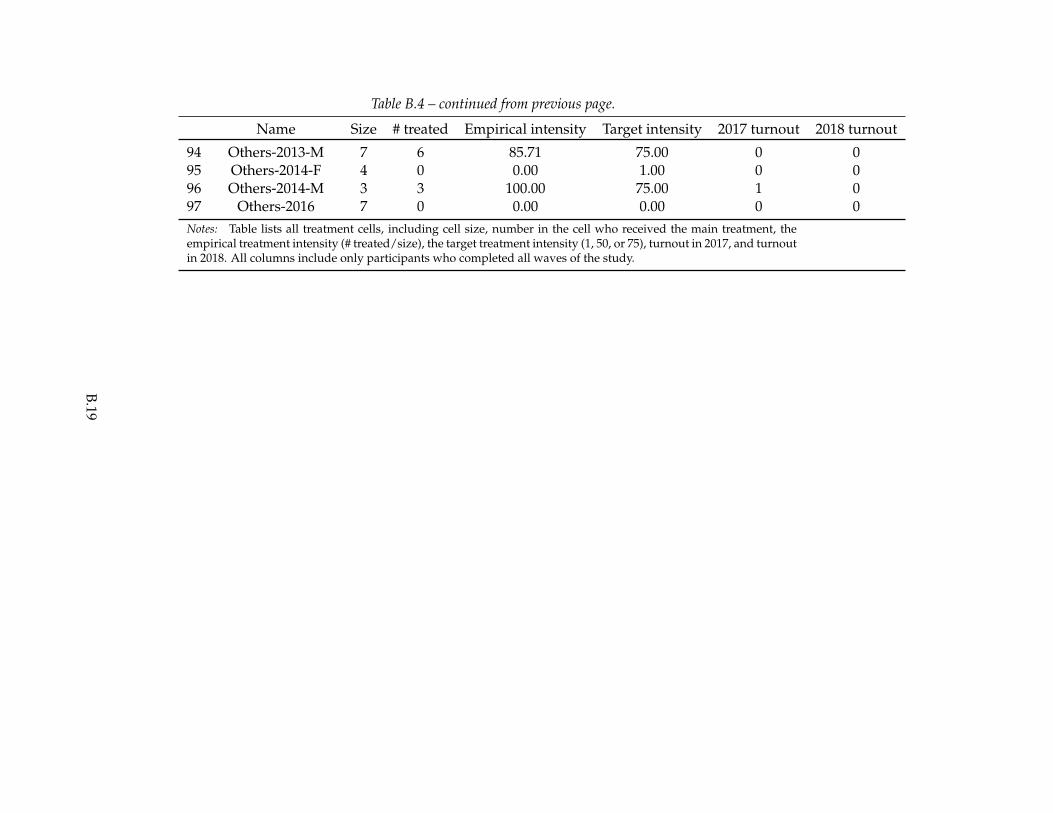
Table B.4 – continued from previous page.
Name Size # treated Empirical intensity Target intensity 2017 turnout 2018 turnout
94 Others-2013-M 7 6 85.71 75.00 0 095 Others-2014-F 4 0 0.00 1.00 0 096 Others-2014-M 3 3 100.00 75.00 1 097 Others-2016 7 0 0.00 0.00 0 0Notes: Table lists all treatment cells, including cell size, number in the cell who received the main treatment, theempirical treatment intensity (# treated/size), the target treatment intensity (1, 50, or 75), turnout in 2017, and turnoutin 2018. All columns include only participants who completed all waves of the study.
B.19

Table B.5: Effects on turnout (reweighted sample)
Participated July 1, 2017
(1) (2) (3)
Treatment 0.098∗∗∗ 0.106∗∗∗ 0.105∗∗∗
(0.014) (0.018) (0.019)
p-value (permutation test) 0.000 0.000 0.000
Treatment cell FEs No Yes YesControl for predicted protest participation No No Yes
Observations 849 849 849
DV mean (control grp.) 0.013 0.013 0.013DV std. dev. (control grp.) 0.112 0.112 0.112DV mean (all) 0.055 0.055 0.055DV std. dev. (all) 0.228 0.228 0.228
Notes: Table reports estimated coefficients from regressions of protest turnout in July 2017 ona treatment indicator (the omitted control group is the union of the placebo treatment and purecontrol groups). Column 2 includes controls for a full set of treatment cell fixed effects. Col-umn 3 further includes a control for predicted protest participation. Predicted protest partic-ipation is constructed by regressing an indicator for planned turnout in 2017 on gender, age,monthly income, expected income at age 40, amount of real estate owned, and an indicator forwhether the individual had attended a protest in the past. Standard errors clustered at the treat-ment cell level. Observations re-weighted to match the sample of individuals who completedat least one wave of the study on observables.
B.20

Table B.6: Persistent effects on participation (reweighted sample)
Participated July 1, 2018
(1) (2) (3)
Panel A: Reduced form
Treatment 0.046∗∗∗ 0.049∗∗∗ 0.049∗∗∗
(0.014) (0.017) (0.017)
p-value (permutation test) 0.000 0.006 0.003
Panel B: Two-stage least squares
Participated July 1, 2017 0.468∗∗∗ 0.467∗∗∗ 0.467∗∗∗
(0.134) (0.149) (0.149)
Treatment cell FEs No Yes YesControl for predicted protest participation No No Yes
Observations 849 849 849
DV mean (control grp.) 0.025 0.025 0.025DV std. dev. (control grp.) 0.155 0.155 0.155DV mean (all) 0.045 0.045 0.045DV std. dev. (all) 0.206 0.206 0.206
Notes: Panel A reports estimated coefficients from regressions of protest turnout in July 2018 ona treatment indicator (the omitted control group is the union of the placebo treatment and purecontrol groups). Panel B reports estimated coefficients from two-stage least squares regressionsof protest turnout in July 2018 on an indicator of protest turnout in July 2017, with the latterinstrumented in the first stage with the treatment indicator. Column 2 includes controls for afull set of treatment cell fixed effects. Column 3 includes controls for a full set of treatment cellfixed effects and a control for predicted protest participation. Predicted protest participationis constructed by regressing an indicator for planned turnout in 2017 on gender, age, monthlyincome, expected income at age 40, amount of real estate owned, and an indicator for whetherthe individual had attended a protest in the past. Standard errors clustered at the treatment celllevel. Observations re-weighted to match the sample of individuals who completed at least onewave of the study on observables.
B.21

Tabl
eB
.7:N
atur
ally
occu
rrin
gpe
rsis
tenc
era
te
Part
icip
atio
nin
July
1stm
arch
inye
ar..
.20
1520
1620
1720
18
(1)
(2)
(3)
(4)
(5)
(6)
(7)
(8)
Part
icip
atio
nin
t-1
0.36
6∗∗∗
0.35
6∗∗∗
0.23
8∗∗∗
0.25
5∗∗∗
0.27
5∗0.
272∗
0.37
6∗∗
0.42
6∗∗∗
[0.0
30]
[0.0
31]
[0.0
56]
[0.0
60]
[0.1
21]
[0.1
19]
[0.1
15]
[0.1
23]
Mal
e0.
004
-0.0
060.
010
-0.0
02[0
.008
][0
.009
][0
.010
][0
.007
]Bi
rth
year
-0.0
07∗
0.00
1-0
.000
-0.0
07∗
[0.0
03]
[0.0
02]
[0.0
03]
[0.0
03]
Not
relig
ious
-0.0
06-0
.007
-0.0
01-0
.008
[0.0
11]
[0.0
11]
[0.0
12]
[0.0
10]
HK
-ori
ente
dch
ildho
oden
v.-0
.001
0.00
8∗0.
005
-0.0
03[0
.004
][0
.003
][0
.004
][0
.004
]H
Hec
onom
ican
dso
cial
stat
us0.
005
-0.0
000.
001
0.00
9[0
.004
][0
.004
][0
.005
][0
.004
]O
wn
proj
ecte
dec
onom
icst
atus
-0.0
04-0
.003
-0.0
04-0
.002
[0.0
04]
[0.0
04]
[0.0
04]
[0.0
03]
Obs
erva
tion
s30
5228
0112
7311
7278
169
910
6397
1A
djus
ted
R2
0.20
40.
202
0.11
00.
117
0.08
70.
091
0.12
70.
175
Mea
nof
Dep
.Var
.0.
0554
0.05
640.
0236
0.02
560.
0154
0.01
570.
0188
0.01
75SD
ofD
ep.V
ar.
0.22
90.
231
0.15
20.
158
0.12
30.
125
0.13
60.
131
Not
es:
Tabl
eB.
7sh
ows
the
resu
lts
ofre
gres
sing
part
icip
atio
nin
the
July
1st
mar
chin
year
ton
part
icip
atio
nin
the
July
1st
mar
chin
year
t−1
(and
ona
set
ofde
mog
raph
icch
arac
teri
stic
sfo
rye
art)
,sep
arat
ely
byye
ar.
Part
icip
atio
nin
the
July
1st
mar
chin
year
tis
elic
ited
from
subj
ects
eith
erdi
rect
lyaf
ter
the
mar
chin
year
t(a
sked
asa
ques
tion
abou
t“cu
rren
t”pr
otes
tpar
tici
pati
on),
orin
futu
resu
rvey
wav
esin
year
st+
1,t+
2,..
.(a
sked
asa
ques
tion
abou
tpa
stpr
otes
tpa
rtic
ipat
ion)
.Fo
rth
eye
ars
2016
,201
7,an
d20
18,t
hesa
mpl
eson
lyin
clud
esu
bjec
tsw
how
ere
noti
nth
etr
eatm
entg
roup
sof
eith
erof
the
expe
rim
ents
affe
ctin
gth
epr
otes
tpar
tici
pati
onw
eco
nduc
ted
in20
16(p
rovi
sion
ofin
form
atio
non
fello
wst
uden
ts’p
lann
edpa
rtic
ipat
ion,
see
Can
toni
etal
.,20
19)a
nd20
17(t
heex
peri
-m
entf
rom
the
curr
entp
aper
).H
ong
Kon
g-or
ient
edch
ildho
oden
viro
nmen
t,th
eho
useh
old’
sec
onom
ican
dso
cial
stat
us,a
ndsu
bjec
ts’
own
proj
ecte
dec
onom
icst
atus
are
z-sc
ore
indi
ces,
i.e.t
hey
are
wei
ghte
dby
the
inve
rse
cova
rian
ceof
the
stan
dard
ized
vari
able
s(s
eeA
nder
son,
2008
).
B.22

Table B.8: Group effects on individual outcomes
(1) (2) (3) (4) (5) (6)(T-Pu) (T-Pu, FE) (T-Pl) (T-Pl, FE) (Pl-Pu) (Pl-Pu, FE)
Panel A.1: Likelihood of integration by 2025, post-July 2017
Group 1 0.058 0.059 0.051 0.050 0.007 0.007(0.043) (0.043) (0.055) (0.055) (0.057) (0.058)
DV mean 2.184 2.184 2.184 2.184 2.184 2.184DV std.dev. 0.572 0.572 0.572 0.572 0.572 0.572p-value 0.179 0.168 0.355 0.362 0.904 0.910Adj. p-value 0.471 - 0.702 - 0.906 -
Panel A.2: Likelihood of integration by 2025, pre-July 2018
Group 1 0.031 0.031 0.026 0.021 0.005 0.007(0.046) (0.046) (0.057) (0.056) (0.060) (0.060)
DV mean 2.193 2.193 2.193 2.193 2.193 2.193DV std.dev. 0.601 0.601 0.601 0.601 0.601 0.601p-value 0.500 0.497 0.651 0.704 0.928 0.912Adj. p-value 0.816 - 0.652 - 0.930 -
Panel B.1: Confidence in answer to likelihood of integration by 2025, post-July 2017
Group 1 -0.011 -0.022 -0.097 -0.098 0.087 0.089(0.135) (0.135) (0.175) (0.176) (0.179) (0.179)
DV mean 6.253 6.253 6.253 6.253 6.253 6.253DV std.dev. 1.801 1.801 1.801 1.801 1.801 1.801p-value 0.936 0.873 0.579 0.578 0.629 0.621Adj. p-value 0.943 - 0.586 - 0.973 -
Panel B.2: Confidence in answer to likelihood of integration by 2025, pre-July 2018
Group 1 -0.044 -0.039 0.132 0.134 -0.176 -0.165(0.125) (0.126) (0.169) (0.169) (0.174) (0.174)
DV mean 6.895 6.895 6.895 6.895 6.895 6.895DV std.dev. 1.716 1.716 1.716 1.716 1.716 1.716p-value 0.728 0.756 0.434 0.430 0.313 0.342Adj. p-value 0.909 - 0.712 - 0.686 -
Panel C.1: Likelihood of integration by 2050, post-July 2017
Group 1 0.066 0.066 0.054 0.051 0.011 0.011(0.057) (0.058) (0.074) (0.074) (0.076) (0.076)
DV mean 1.894 1.894 1.894 1.894 1.894 1.894DV std.dev. 0.764 0.764 0.764 0.764 0.764 0.764p-value 0.254 0.253 0.463 0.486 0.881 0.884Adj. p-value 0.436 - 0.708 - 0.986 -
Continued on next page.
B.23

Table B.8 – continued from previous page.
(1) (2) (3) (4) (5) (6)(T-Pu) (T-Pu, FE) (T-Pl) (T-Pl, FE) (Pl-Pu) (Pl-Pu, FE)
Panel C.2: Likelihood of integration by 2050, pre-July 2018
Group 1 -0.047 -0.048 -0.083 -0.087 0.036 0.035(0.057) (0.057) (0.072) (0.072) (0.076) (0.076)
DV mean 1.832 1.832 1.832 1.832 1.832 1.832DV std.dev. 0.755 0.755 0.755 0.755 0.755 0.755p-value 0.409 0.401 0.247 0.225 0.633 0.640Adj. p-value 0.848 - 0.624 - 0.844 -
Panel D.1: Confidence in answer to likelihood of integration by 2050, post-July 2017
Group 1 -0.204 -0.224 -0.248 -0.255 0.043 0.044(0.161) (0.161) (0.210) (0.211) (0.209) (0.209)
DV mean 6.271 6.271 6.271 6.271 6.271 6.271DV std.dev. 2.140 2.140 2.140 2.140 2.140 2.140p-value 0.204 0.165 0.240 0.227 0.836 0.834Adj. p-value 0.431 - 0.595 - 0.995 -
Panel D.2: Confidence in answer to likelihood of integration by 2050, pre-July 2018
Group 1 -0.027 -0.034 0.207 0.209 -0.234 -0.233(0.150) (0.151) (0.190) (0.190) (0.203) (0.203)
DV mean 6.865 6.865 6.865 6.865 6.865 6.865DV std.dev. 2.002 2.002 2.002 2.002 2.002 2.002p-value 0.857 0.823 0.276 0.273 0.249 0.252Adj. p-value 0.869 - 0.585 - 0.615 -
Panel E.1: Index of political beliefs (z-score), post-July 2017
Group 1 0.047 0.041 0.001 -0.003 0.046 0.046(0.074) (0.074) (0.098) (0.098) (0.101) (0.101)
DV mean 0.002 0.002 0.002 0.002 0.002 0.002DV std.dev. 1.000 1.000 1.000 1.000 1.000 1.000p-value 0.526 0.576 0.993 0.973 0.648 0.647
Panel E.2: Index of political beliefs (z-score), pre-July 2018
Group 1 -0.034 -0.035 0.043 0.037 -0.076 -0.073(0.078) (0.078) (0.096) (0.096) (0.101) (0.101)
DV mean 0.001 0.001 0.001 0.001 0.001 0.001DV std.dev. 1.018 1.018 1.018 1.018 1.018 1.018p-value 0.665 0.655 0.659 0.700 0.452 0.473
Panel F.1: Perceived importance of democracy, post-July 2017
Group 1 0.092 0.106 0.059 0.068 0.033 0.045Continued on next page.
B.24

Table B.8 – continued from previous page.
(1) (2) (3) (4) (5) (6)(T-Pu) (T-Pu, FE) (T-Pl) (T-Pl, FE) (Pl-Pu) (Pl-Pu, FE)
(0.157) (0.158) (0.201) (0.201) (0.215) (0.215)DV mean 6.512 6.512 6.512 6.512 6.512 6.512DV std.dev. 2.109 2.109 2.109 2.109 2.109 2.109p-value 0.559 0.500 0.771 0.735 0.877 0.833Adj. p-value 0.794 - 0.798 - 0.988 -
Panel F.2: Perceived importance of democracy, pre-July 2018
Group 1 0.314 0.323 0.097 0.107 0.217 0.233(0.159) (0.160) (0.202) (0.202) (0.217) (0.216)
DV mean 6.787 6.787 6.787 6.787 6.787 6.787DV std.dev. 2.131 2.131 2.131 2.131 2.131 2.131p-value 0.048 0.044 0.629 0.596 0.318 0.283Adj. p-value 0.194 - 0.863 - 0.530 -
Panel G.1: Political attitudes (pro-democracy vs. pro-Beijing), post-July 2017
Group 1 0.110 0.110 0.308 0.308 -0.197 -0.206(0.152) (0.153) (0.195) (0.195) (0.197) (0.197)
DV mean 3.703 3.703 3.703 3.703 3.703 3.703DV std.dev. 2.013 2.013 2.013 2.013 2.013 2.013p-value 0.470 0.474 0.114 0.115 0.318 0.297Adj. p-value 0.832 - 0.348 - 0.754 -
Panel G.2: Political attitudes (pro-democracy vs. pro-Beijing), pre-July 2018
Group 1 -0.067 -0.064 0.288 0.286 -0.356 -0.357(0.152) (0.153) (0.194) (0.195) (0.198) (0.199)
DV mean 3.789 3.789 3.789 3.789 3.789 3.789DV std.dev. 2.016 2.016 2.016 2.016 2.016 2.016p-value 0.659 0.675 0.138 0.143 0.074 0.073Adj. p-value 0.881 - 0.419 - 0.230 -
Panel H.1: Legitimacy of CCP rule in Hong Kong, post-July 2017
Group 1 0.263 0.240 0.096 0.094 0.168 0.149(0.186) (0.186) (0.231) (0.231) (0.241) (0.240)
DV mean 4.910 4.910 4.910 4.910 4.910 4.910DV std.dev. 2.435 2.435 2.435 2.435 2.435 2.435p-value 0.157 0.198 0.679 0.686 0.487 0.534Adj. p-value 0.453 - 0.963 - 0.849 -
Panel H.2: Legitimacy of CCP rule in Hong Kong, pre-July 2018
Group 1 -0.042 -0.061 0.303 0.303 -0.345 -0.377(0.183) (0.184) (0.226) (0.226) (0.253) (0.250)
Continued on next page.
B.25

Table B.8 – continued from previous page.
(1) (2) (3) (4) (5) (6)(T-Pu) (T-Pu, FE) (T-Pl) (T-Pl, FE) (Pl-Pu) (Pl-Pu, FE)
DV mean 4.962 4.962 4.962 4.962 4.962 4.962DV std.dev. 2.441 2.441 2.441 2.441 2.441 2.441p-value 0.817 0.739 0.181 0.181 0.173 0.133Adj. p-value 0.812 - 0.444 - 0.403 -
Panel I.1: HK should be independent, post-July 2017
Group 1 -0.051 -0.048 -0.083 -0.068 0.032 0.033(0.203) (0.203) (0.254) (0.254) (0.268) (0.268)
DV mean 4.353 4.353 4.353 4.353 4.353 4.353DV std.dev. 2.675 2.675 2.675 2.675 2.675 2.675p-value 0.802 0.813 0.746 0.790 0.906 0.903Adj. p-value 0.803 - 0.928 - 0.902 -
Panel I.2: HK should be independent, pre-July 2018
Group 1 0.117 0.144 -0.049 -0.022 0.166 0.193(0.215) (0.215) (0.271) (0.269) (0.284) (0.283)
DV mean 4.565 4.565 4.565 4.565 4.565 4.565DV std.dev. 2.842 2.842 2.842 2.842 2.842 2.842p-value 0.585 0.504 0.856 0.935 0.559 0.496Adj. p-value 0.927 - 0.857 - 0.575 -
Panel J.1: Index of political preferences (z-score), post-July 2017
Group 1 0.110 0.111 0.137 0.144 -0.027 -0.031(0.075) (0.075) (0.096) (0.095) (0.098) (0.098)
DV mean -0.011 -0.011 -0.011 -0.011 -0.011 -0.011DV std.dev. 0.993 0.993 0.993 0.993 0.993 0.993p-value 0.143 0.143 0.151 0.133 0.780 0.748
Panel J.2: Index of political preferences (z-score), pre-July 2018
Group 1 0.047 0.054 0.168 0.175 -0.121 -0.117(0.076) (0.076) (0.095) (0.095) (0.102) (0.102)
DV mean -0.015 -0.015 -0.015 -0.015 -0.015 -0.015DV std.dev. 1.007 1.007 1.007 1.007 1.007 1.007p-value 0.537 0.473 0.079 0.066 0.236 0.251
Panel K.1: Others afraid of expressing pro-independence views, post-July 2017
Group 1 0.047 0.036 -0.050 -0.044 0.097 0.079(0.165) (0.165) (0.206) (0.206) (0.211) (0.210)
DV mean 4.441 4.441 4.441 4.441 4.441 4.441DV std.dev. 2.153 2.153 2.153 2.153 2.153 2.153p-value 0.777 0.827 0.807 0.830 0.646 0.707
Continued on next page.
B.26

Table B.8 – continued from previous page.
(1) (2) (3) (4) (5) (6)(T-Pu) (T-Pu, FE) (T-Pl) (T-Pl, FE) (Pl-Pu) (Pl-Pu, FE)
Adj. p-value 0.950 - 0.809 - 0.950 -
Panel K.2: Others afraid of expressing pro-independence views, pre-July 2018
Group 1 -0.243 -0.219 -0.087 -0.076 -0.156 -0.150(0.177) (0.178) (0.224) (0.224) (0.218) (0.219)
DV mean 4.925 4.925 4.925 4.925 4.925 4.925DV std.dev. 2.302 2.302 2.302 2.302 2.302 2.302p-value 0.171 0.218 0.699 0.734 0.475 0.492Adj. p-value 0.480 - 0.966 - 0.851 -
Panel L.1: Second-order beliefs about importance of democracy, post-July 2017
Group 1 0.060 0.065 0.129 0.123 -0.069 -0.066(0.121) (0.122) (0.154) (0.154) (0.160) (0.161)
DV mean 6.380 6.380 6.380 6.380 6.380 6.380DV std.dev. 1.607 1.607 1.607 1.607 1.607 1.607p-value 0.621 0.596 0.403 0.425 0.669 0.681Adj. p-value 0.952 - 0.866 - 0.887 -
Panel L.2: Second-order beliefs about importance of democracy, pre-July 2018
Group 1 0.031 0.030 -0.055 -0.056 0.086 0.090(0.123) (0.124) (0.152) (0.153) (0.156) (0.156)
DV mean 6.420 6.420 6.420 6.420 6.420 6.420DV std.dev. 1.601 1.601 1.601 1.601 1.601 1.601p-value 0.799 0.811 0.718 0.714 0.580 0.563Adj. p-value 0.957 - 0.914 - 0.552 -
Panel M.1: Second-order beliefs about legitimacy of CCP rule in Hong Kong, post-July 2017
Group 1 0.131 0.111 0.132 0.119 -0.001 -0.014(0.143) (0.143) (0.190) (0.189) (0.180) (0.180)
DV mean 5.166 5.166 5.166 5.166 5.166 5.166DV std.dev. 1.895 1.895 1.895 1.895 1.895 1.895p-value 0.359 0.439 0.488 0.531 0.996 0.936Adj. p-value 0.827 - 0.863 - 0.998 -
Panel M.2: Second-order beliefs about legitimacy of CCP rule in Hong Kong, pre-July 2018
Group 1 -0.089 -0.097 0.046 0.047 -0.135 -0.142(0.138) (0.139) (0.170) (0.170) (0.190) (0.190)
DV mean 5.348 5.348 5.348 5.348 5.348 5.348DV std.dev. 1.837 1.837 1.837 1.837 1.837 1.837p-value 0.521 0.485 0.787 0.783 0.479 0.455Adj. p-value 0.884 - 0.797 - 0.723 -
Continued on next page.
B.27

Table B.8 – continued from previous page.
(1) (2) (3) (4) (5) (6)(T-Pu) (T-Pu, FE) (T-Pl) (T-Pl, FE) (Pl-Pu) (Pl-Pu, FE)
Panel N.1: Second-order beliefs about whether HK should be independent, post-July 2017
Group 1 -0.029 -0.022 0.083 0.091 -0.111 -0.114(0.140) (0.141) (0.178) (0.178) (0.182) (0.183)
DV mean 4.609 4.609 4.609 4.609 4.609 4.609DV std.dev. 1.848 1.848 1.848 1.848 1.848 1.848p-value 0.838 0.877 0.642 0.608 0.542 0.533Adj. p-value 0.839 - 0.876 - 0.945 -
Panel N.2: Second-order beliefs about whether HK should be independent, pre-July 2018
Group 1 -0.016 -0.000 0.220 0.230 -0.236 -0.234(0.154) (0.154) (0.191) (0.190) (0.194) (0.195)
DV mean 4.594 4.594 4.594 4.594 4.594 4.594DV std.dev. 1.999 1.999 1.999 1.999 1.999 1.999p-value 0.918 0.999 0.249 0.227 0.225 0.230Adj. p-value 0.924 - 0.666 - 0.595 -
Panel O.1: Index of second-order beliefs (z-score), post-July 2017
Group 1 0.053 0.050 0.104 0.100 -0.051 -0.055(0.075) (0.075) (0.096) (0.096) (0.100) (0.100)
DV mean -0.015 -0.015 -0.015 -0.015 -0.015 -0.015DV std.dev. 0.998 0.998 0.998 0.998 0.998 0.998p-value 0.477 0.505 0.280 0.298 0.609 0.580
Panel O.2: Index of second-order beliefs (z-score), pre-July 2018
Group 1 -0.026 -0.025 0.057 0.060 -0.083 -0.084(0.077) (0.077) (0.093) (0.093) (0.103) (0.103)
DV mean 0.005 0.005 0.005 0.005 0.005 0.005DV std.dev. 1.009 1.009 1.009 1.009 1.009 1.009p-value 0.738 0.746 0.541 0.522 0.424 0.419
Treatment cell FEs No Yes No Yes No YesObservations 849 849 849 849 849 849Notes: Table reports estimated coefficients from regressions of each outcome on an indicator for the firstcondition in the column heading (the main treatment in Columns 1-4 and the placebo in Columns 5-6),in which the sample is limited to the two conditions listed in the column heading (treatment and purecontrol in Columns 1-2, treatment and placebo in Columns 3-4, and placebo and pure control in Columns5-6). Columns 2, 4, and 6 include controls for a full set of treatment cell fixed effects. We present p-valuesadjusted for multiple hypothesis testing following Enikolopov et al. (2016) at the level of each of thethree broad categories within each period (post-17 and pre-18) and at the level of each of the three broadcategories (political beliefs, political preferences, and political beliefs about other Hong Kong citizens).
B.28

Table B.9: Effects on political beliefs (reweighted sample)
Post-July 2017 Pre-July 2018
(1) (2) (3) (4) (5) (6)
Panel A: Reduced form
Treatment 0.033 −0.057 −0.055 −0.005 −0.023 −0.023(0.069) (0.086) (0.086) (0.069) (0.095) (0.095)
p-value (permutation test) 0.628 0.493 0.526 0.943 0.808 0.800
Panel B: Two-stage least squares
Participated July 1, 2017 0.340 −0.538 −0.521 −0.053 −0.221 −0.204(0.704) (0.822) (0.825) (0.704) (0.895) (0.904)
Treatment cell FEs No Yes Yes No Yes YesControl for predicted protest participation No No Yes No No Yes
Observations 849 849 849 849 849 849
DV mean (control grp.) -0.014 -0.014 -0.014 -0.000 -0.000 -0.000DV std. dev. (control grp.) 1.024 1.024 1.024 1.034 1.034 1.034DV mean (all) 0.000 0.000 0.000 -0.003 -0.003 -0.003DV std. dev. (all) 1.001 1.001 1.001 1.018 1.018 1.018
Notes: Panel A reports estimated coefficients from regressions of an index of individual political beliefs regarding other HongKong citizens in July 2017 (columns 1–3) or in June 2018 (columns 4–6) on a treatment indicator (the omitted control group isthe union of the placebo treatment and pure control groups). Panel B reports estimated coefficients from two-stage least squaresregressions of an index of individual political beliefs regarding other Hong Kong citizens in July 2017 (columns 1–3) or in June2018 (columns 4–6) on an indicator of protest turnout in July 2017, with the latter instrumented in the first stage with the treatmentindicator. Columns 2 and 5 include controls for a full set of treatment cell fixed effects. Columns 3 and 6 further include a controlfor predicted protest participation. Predicted protest participation is constructed by regressing an indicator for planned turnoutin 2017 on gender, age, monthly income, expected income at age 40, amount of real estate owned, and an indicator for whetherthe individual had attended a protest in the past. The individual survey questions combined to construct the index are providedin the Online Appendix. Standard errors clustered at the treatment cell level. Observations re-weighted to match the sample ofindividuals who completed at least one wave of the study on observables.
B.29

Table B.10: Effects on political preferences (reweighted sample)
Post-July 2017 Pre-July 2018
(1) (2) (3) (4) (5) (6)
Panel A: Reduced form
Treatment 0.122∗ 0.138∗ 0.136∗ 0.089 0.095 0.095(0.064) (0.072) (0.072) (0.067) (0.094) (0.094)
p-value (permutation test) 0.061 0.081 0.098 0.222 0.270 0.276
Panel B: Two-stage least squares
Participated July 1, 2017 1.248∗ 1.297∗ 1.293∗ 0.911 0.898 0.916(0.688) (0.753) (0.758) (0.710) (0.942) (0.952)
Treatment cell FEs No Yes Yes No Yes YesControl for predicted protest participation No No Yes No No Yes
Observations 849 849 849 849 849 849
DV mean (control grp.) -0.066 -0.066 -0.066 -0.058 -0.058 -0.058DV std. dev. (control grp.) 0.993 0.993 0.993 1.040 1.040 1.040DV mean (all) -0.013 -0.013 -0.013 -0.019 -0.019 -0.019DV std. dev. (all) 0.992 0.992 0.992 1.007 1.007 1.007
Notes: Panel A reports estimated coefficients from regressions of an index of individual political beliefs regarding other HongKong citizens in July 2017 (columns 1–3) or in June 2018 (columns 4–6) on a treatment indicator (the omitted control groupis the union of the placebo treatment and pure control groups). Panel B reports estimated coefficients from two-stage leastsquares regressions of an index of individual political beliefs regarding other Hong Kong citizens in July 2017 (columns 1–3) orin June 2018 (columns 4–6) on an indicator of protest turnout in July 2017, with the latter instrumented in the first stage withthe treatment indicator. Columns 2 and 5 include controls for a full set of treatment cell fixed effects. Columns 3 and 6 furtherinclude a control for predicted protest participation. Predicted protest participation is constructed by regressing an indicatorfor planned turnout in 2017 on gender, age, monthly income, expected income at age 40, amount of real estate owned, and anindicator for whether the individual had attended a protest in the past. The individual survey questions combined to constructthe index are provided in the Online Appendix. Standard errors clustered at the treatment cell level. Observations re-weightedto match the sample of individuals who completed at least one wave of the study on observables.
B.30

Table B.11: Effects on political beliefs regarding other Hong Kong citizens (reweighted sample)
Post-July 2017 Pre-July 2018
(1) (2) (3) (4) (5) (6)
Panel A: Reduced form
Treatment 0.072 0.045 0.045 0.003 0.016 0.016(0.066) (0.078) (0.078) (0.066) (0.075) (0.075)
p-value (permutation test) 0.324 0.603 0.632 0.968 0.832 0.846
Panel B: Two-stage least squares
Participated July 1, 2017 0.739 0.420 0.428 0.034 0.155 0.159(0.688) (0.736) (0.739) (0.677) (0.713) (0.722)
Treatment cell FEs No Yes Yes No Yes YesControl for predicted protest participation No No Yes No No Yes
Observations 849 849 849 849 849 849
DV mean (control grp.) -0.044 -0.044 -0.044 0.005 0.005 0.005DV std. dev. (control grp.) 1.017 1.017 1.017 1.052 1.052 1.052DV mean (all) -0.012 -0.012 -0.012 0.006 0.006 0.006DV std. dev. (all) 0.997 0.997 0.997 1.009 1.009 1.009
Notes: Panel A reports estimated coefficients from regressions of an index of individual political beliefs regarding other HongKong citizens in July 2017 (columns 1–3) or in June 2018 (columns 4–6) on a treatment indicator (the omitted control groupis the union of the placebo treatment and pure control groups). Panel B reports estimated coefficients from two-stage leastsquares regressions of an index of individual political beliefs regarding other Hong Kong citizens in July 2017 (columns 1–3) orin June 2018 (columns 4–6) on an indicator of protest turnout in July 2017, with the latter instrumented in the first stage withthe treatment indicator. Columns 2 and 5 include controls for a full set of treatment cell fixed effects. Columns 3 and 6 furtherinclude a control for predicted protest participation. Predicted protest participation is constructed by regressing an indicatorfor planned turnout in 2017 on gender, age, monthly income, expected income at age 40, amount of real estate owned, and anindicator for whether the individual had attended a protest in the past. The individual survey questions combined to constructthe index are provided in the Online Appendix. Standard errors clustered at the treatment cell level. Observations re-weightedto match the sample of individuals who completed at least one wave of the study on observables.
B.31

Table B.12: Effects on planned July 2018 protest participation
Plan to participate in July 2018 protest
(1) (2) (3)
Treatment −0.021 −0.020 −0.021(0.021) (0.024) (0.025)
p-value (permutation test) 0.315 0.415 0.405
Treatment cell FEs No Yes YesControl for predicted protest participation No No Yes
Observations 849 849 849
DV mean (control grp.) 0.100 0.100 0.100DV std. dev. (control grp.) 0.300 0.300 0.300DV mean (all) 0.091 0.091 0.091DV std. dev. (all) 0.287 0.287 0.287
Notes: Table reports estimated coefficients from regressions of self-reported planned turnout in the July2018 march (reported in June 2018) on a treatment indicator (the omitted control group is the union ofthe placebo treatment and pure control groups). Column 2 includes controls for a full set of treatmentcell fixed effects. Column 3 further includes a control for predicted protest participation. Predictedprotest participation is constructed by regressing an indicator for planned turnout in 2017 on gender,age, monthly income, expected income at age 40, amount of real estate owned, and an indicator forwhether the individual had attended a protest in the past. Standard errors clustered at the treatment celllevel.
B.32

Table B.13: Heterogeneity with respect to cell treatment intensity (target intensity)
Protest participation in July 2018
(1) (2) (3)
Treatment × share treated in cell 0.232∗∗∗ 0.181∗∗ 0.178∗∗
(0.071) (0.079) (0.078)p-value (permutation test) 0.002 0.013 0.022
Treatment −0.091∗∗ −0.056 −0.055(0.039) (0.036) (0.035)
p-value (permutation test) 0.018 0.102 0.113
Share treated in cell −0.032 - -(0.023) - -
p-value (permutation test) 0.172 - -
Treatment cell FEs No Yes YesControl for predicted protest participation No No Yes
Observations 849 849 849
DV mean (control grp.) 0.025 0.025 0.025DV std. dev. (control grp.) 0.156 0.156 0.156DV mean (all) 0.045 0.045 0.045DV std. dev. (all) 0.207 0.207 0.207
Notes: Table reports estimated coefficients from regressions of protest turnout in July 2018 ona treatment indicator (the omitted control group is the union of the placebo treatment and purecontrol groups), the individual’s cell’s treatment intensity, and the interaction of the two. Col-umn 2 includes controls for a full set of treatment cell fixed effects (thus absorbing the treatmentcell intensity variable). Column 3 includes controls for a full set of treatment cell fixed effectsand a control for predicted protest participation. Predicted protest participation is constructedby regressing an indicator for planned turnout in 2017 on gender, age, monthly income, expectedincome at age 40, amount of real estate owned, and an indicator for whether the individual hadattended a protest in the past. Standard errors clustered at the treatment cell level.
B.33

Table B.14: Heterogeneity by cell treatment intensity: robustness to imbalanced characteristics
Protest participation in July 2018
(1) (2) (3) (4) (5)
Treatment −0.030∗∗∗ −0.047 −0.033 −0.092∗∗ −0.034∗
(0.011) (0.032) (0.021) (0.044) (0.020)p-value (permutation test) 0.013 0.221 0.228 0.043 0.151
Treatment × 50intensity 0.058∗∗∗ 0.068∗∗ 0.059∗∗ 0.059 0.062∗∗
(0.017) (0.027) (0.026) (0.038) (0.026)p-value (permutation test) 0.022 0.039 0.055 0.161 0.042
Treatment × 75intensity 0.106∗∗∗ 0.122∗∗∗ 0.116∗∗∗ 0.122∗∗ 0.118∗∗∗
(0.028) (0.040) (0.040) (0.050) (0.038)p-value (permutation test) 0.007 0.003 0.009 0.011 0.013
Treatment cell FEs Yes Yes Yes Yes YesControl for predicted protest participation Yes Yes Yes Yes YesControl for treatment ×male No Yes No No NoControl for treatment × birth year No No Yes No NoControl for treatment × English-language HS No No No Yes NoControl for treatment × # real estate owned No No No No Yes
Observations 849 849 849 849 849
p-value (Treatment=Treatment×50) 0.000 0.011 0.011 0.012 0.006p-value (Treatment=Treatment×75) 0.000 0.002 0.000 0.001 0.009p-value (Treatment×50=Treatment×75) 0.143 0.278 0.232 0.314 0.216DV mean (control grp.) 0.025 0.025 0.025 0.025 0.025DV std. dev. (control grp.) 0.156 0.156 0.156 0.156 0.156DV mean (all) 0.045 0.045 0.045 0.045 0.045DV std. dev. (all) 0.207 0.207 0.207 0.207 0.207
Notes: Table reports estimated coefficients from regressions of protest turnout in July 2018 on a treatment indicator (the omittedcontrol group is the union of the placebo treatment and pure control groups), the individual’s cell’s treatment intensity, and theinteraction of the two. Column 1 reports the “baseline“ specification from Column 3 of Table 8 in the main text. Column 2 includesan indicator for the respondent being male and the interaction with the main treatment. Column 3 includes birth year (scaled toa standard normal distribution) and the interaction with the main treatment. Column 4 includes an indicator for the respondenthaving attended an English-language high school and the interaction with the main treatment. Column 5 includes the number ofreal estate properties owned by the respondent’s parents (scaled to a standard normal distribution) and the interaction with themain treatment. Predicted protest participation is constructed by regressing an indicator for planned turnout in 2017 on gender,age, monthly income, expected income at age 40, amount of real estate owned, and an indicator for whether the individual hadattended a protest in the past. Standard errors clustered at the treatment cell level.
B.34

Table B.15: Heterogeneity with respect to cell treatment intensity (empirical intensity)
Protest participation in July 2018
(1) (2) (3)
Treatment × share treated in cell 0.122 0.083 0.080(0.080) (0.094) (0.094)
p-value (permutation test) 0.112 0.285 0.301
Treatment −0.021 0.003 0.005(0.051) (0.055) (0.055)
p-value (permutation test) 0.378 0.612 0.517
Share treated in cell −0.029 - -(0.025) - -
p-value (permutation test) 0.216 - -
Treatment cell FEs No Yes YesControl for predicted protest participation No No Yes
Observations 849 849 849
DV mean (control grp.) 0.025 0.025 0.025DV std. dev. (control grp.) 0.156 0.156 0.156DV mean (all) 0.045 0.045 0.045DV std. dev. (all) 0.207 0.207 0.207
Notes: Table reports estimated coefficients from regressions of protest turnout in July 2018 ona treatment indicator (the omitted control group is the union of the placebo treatment and purecontrol groups), the individual’s cell’s treatment intensity, and the interaction of the two. Col-umn 2 includes controls for a full set of treatment cell fixed effects (thus absorbing the treatmentcell intensity variable). Column 3 includes controls for a full set of treatment cell fixed effectsand a control for predicted protest participation. Predicted protest participation is constructedby regressing an indicator for planned turnout in 2017 on gender, age, monthly income, expectedincome at age 40, amount of real estate owned, and an indicator for whether the individual hadattended a protest in the past. Standard errors clustered at the treatment cell level.
B.35

Table B.16: Heterogeneity with respect to cell treatment intensity (semiparametric specification, reweighted sample)
Protest participation in July 2018
(1) (2) (3) (4)
Treatment −0.030∗∗∗ −0.034∗ −0.033∗ −0.046(0.011) (0.019) (0.019) (0.035)
p-value (permutation test) 0.011 0.016 0.033 0.053
Treatment × 50intensity 0.058∗∗∗ 0.062∗∗∗ 0.062∗∗∗ 0.063∗∗∗
(0.017) (0.024) (0.024) (0.023)p-value (permutation test) 0.025 0.043 0.047 0.068
Treatment × 75intensity 0.106∗∗∗ 0.118∗∗∗ 0.117∗∗∗ 0.118∗∗∗
(0.028) (0.039) (0.038) (0.039)p-value (permutation test) 0.011 0.008 0.007 0.522
Treatment cell FEs No Yes Yes YesControl for predicted protest participation No No Yes Yes (interacted)
Observations 849 849 849 849
p-value (Treatment=Treatment×50) 0.000 0.000 0.000 0.000p-value (Treatment=Treatment×75) 0.001 0.000 0.002 0.012p-value (Treatment×50=Treatment×75) 0.142 0.221 0.221 0.214DV mean (control grp.) 0.025 0.025 0.025 0.025DV std. dev. (control grp.) 0.155 0.155 0.155 0.155DV mean (all) 0.044 0.044 0.044 0.044DV std. dev. (all) 0.206 0.206 0.206 0.206
Notes: Table reports estimated coefficients from regressions of protest turnout in July 2018 on a treatment indicator (theomitted control group is the union of the placebo treatment and pure control groups), the individual’s cell’s treatmentintensity, and the interaction of the two. Column 2 includes controls for a full set of treatment cell fixed effects. Column 3includes controls for a full set of treatment cell fixed effects and a control for predicted protest participation. Column 4adds an interaction term between treatment and predicted protest participation in addition to the level of predictedprotest participation. Predicted protest participation is constructed by regressing an indicator for planned turnout in 2017on gender, age, monthly income, expected income at age 40, amount of real estate owned, and an indicator for whetherthe individual had attended a protest in the past. Standard errors clustered at the treatment cell level. Observationsre-weighted to match the sample of individuals who completed at least one wave of the study on observables.
B.36

Table B.17: Heterogeneity with respect to cell treatment intensity (target intensity, reweighted sample)
Protest participation in July 2018
(1) (2) (3)
Treatment × share treated in cell 0.232∗∗∗ 0.183∗∗ 0.179∗∗
(0.071) (0.077) (0.076)p-value (permutation test) 0.004 0.012 0.030
Treatment −0.090∗∗ −0.058 −0.056(0.038) (0.035) (0.035)
p-value (permutation test) 0.022 0.114 0.125
Share treated in cell −0.032 - -(0.022) - -
p-value (permutation test) 0.219 - -
Treatment cell FEs No Yes YesControl for predicted protest participation No No Yes
Observations 849 849 849
DV mean (control grp.) 0.025 0.025 0.025DV std. dev. (control grp.) 0.156 0.156 0.156DV mean (all) 0.045 0.045 0.045DV std. dev. (all) 0.207 0.207 0.207
Notes: Table reports estimated coefficients from regressions of protest turnout in July 2018 ona treatment indicator (the omitted control group is the union of the placebo treatment and purecontrol groups), the individual’s cell’s treatment intensity, and the interaction of the two. Col-umn 2 includes controls for a full set of treatment cell fixed effects (thus absorbing the treatmentcell intensity variable). Column 3 includes controls for a full set of treatment cell fixed effectsand a control for predicted protest participation. Predicted protest participation is constructedby regressing an indicator for planned turnout in 2017 on gender, age, monthly income, expectedincome at age 40, amount of real estate owned, and an indicator for whether the individual hadattended a protest in the past. Standard errors clustered at the treatment cell level. Observationsre-weighted to match the sample of individuals who completed at least one wave of the study onobservables.
B.37

Table B.18: Heterogeneity with respect to cell treatment intensity (empirical intensity, reweighted sample)
Protest participation in July 2018
(1) (2) (3)
Treatment × share treated in cell 0.127 0.091 0.087(0.079) (0.091) (0.091)
p-value (permutation test) 0.141 0.266 0.287
Treatment −0.024 −0.001 0.000(0.050) (0.054) (0.053)
p-value (permutation test) 0.413 0.519 0.531
Share treated in cell −0.029 - -(0.025) - -
p-value (permutation test) 0.197 - -
Treatment cell FEs No Yes YesControl for predicted protest participation No No Yes
Observations 849 849 849
DV mean (control grp.) 0.025 0.025 0.025DV std. dev. (control grp.) 0.156 0.156 0.156DV mean (all) 0.045 0.045 0.045DV std. dev. (all) 0.207 0.207 0.207
Notes: Table reports estimated coefficients from regressions of protest turnout in July 2018 ona treatment indicator (the omitted control group is the union of the placebo treatment and purecontrol groups), the individual’s cell’s treatment intensity, and the interaction of the two. Col-umn 2 includes controls for a full set of treatment cell fixed effects (thus absorbing the treatmentcell intensity variable). Column 3 includes controls for a full set of treatment cell fixed effectsand a control for predicted protest participation. Predicted protest participation is constructedby regressing an indicator for planned turnout in 2017 on gender, age, monthly income, expectedincome at age 40, amount of real estate owned, and an indicator for whether the individual hadattended a protest in the past. Standard errors clustered at the treatment cell level. Observationsre-weighted to match the sample of individuals who completed at least one wave of the study onobservables.
B.38

Table B.19: Heterogeneity in friendship formation by treatment intensity: robustness to imbalancedcharacteristics
Protest participation in July 2018
(1) (2) (3) (4) (5)
Treatment −0.061∗∗∗ −0.074∗∗ −0.034 −0.066 −0.029(0.017) (0.036) (0.028) (0.058) (0.023)
p-value (permutation test) 0.012 0.223 0.214 0.041 0.163
Treatment × 50intensity 0.108∗∗∗ 0.090∗∗∗ 0.067∗ 0.085∗∗ 0.065∗
(0.030) (0.034) (0.038) (0.038) (0.036)p-value (permutation test) 0.016 0.044 0.048 0.176 0.039
Treatment × 75intensity 0.086∗∗∗ 0.073∗ 0.058 0.067 0.051(0.032) (0.040) (0.047) (0.052) (0.041)
p-value (permutation test) 0.012 0.002 0.012 0.020 0.016
Treatment cell FEs Yes Yes Yes Yes YesControl for predicted protest participation Yes Yes Yes Yes YesControl for treatment ×male No Yes No No NoControl for treatment × birth year No No Yes No NoControl for treatment × English-language HS No No No Yes NoControl for treatment × # real estate owned No No No No Yes
Observations 849 849 849 849 849
p-value (Treatment=Treatment×50) 0.000 0.012 0.012 0.012 0.006p-value (Treatment=Treatment×75) 0.000 0.002 0.000 0.001 0.010p-value (Treatment×50=Treatment×75) 0.144 0.280 0.230 0.313 0.216DV mean (control grp.) 0.025 0.025 0.025 0.025 0.025DV std. dev. (control grp.) 0.156 0.156 0.156 0.156 0.156DV mean (all) 0.045 0.045 0.045 0.045 0.045DV std. dev. (all) 0.207 0.207 0.207 0.207 0.207
Notes: Table reports estimated coefficients from regressions of an indicator of self reported new political friendship formationbetween July 2017 and July 2018 on a treatment indicator (the omitted control group is the union of the placebo treatment andpure control groups), the individual’s cell’s treatment intensity, and the interaction of the two. Column 1 reports the “baseline“specification from Column 3 of Table 8 in the main text. Column 2 includes an indicator for the respondent being male and theinteraction with the main treatment. Column 3 includes birth year (scaled to a standard normal distribution) and the interactionwith the main treatment. Column 4 includes an indicator for the respondent having attended an English-language high schooland the interaction with the main treatment. Column 5 includes the number of real estate properties owned by the respondent’sparents (scaled to a standard normal distribution) and the interaction with the main treatment. Predicted protest participationis constructed by regressing an indicator for planned turnout in 2017 on gender, age, monthly income, expected income at age40, amount of real estate owned, and an indicator for whether the individual had attended a protest in the past. Standard errorsclustered at the treatment cell level.
B.39
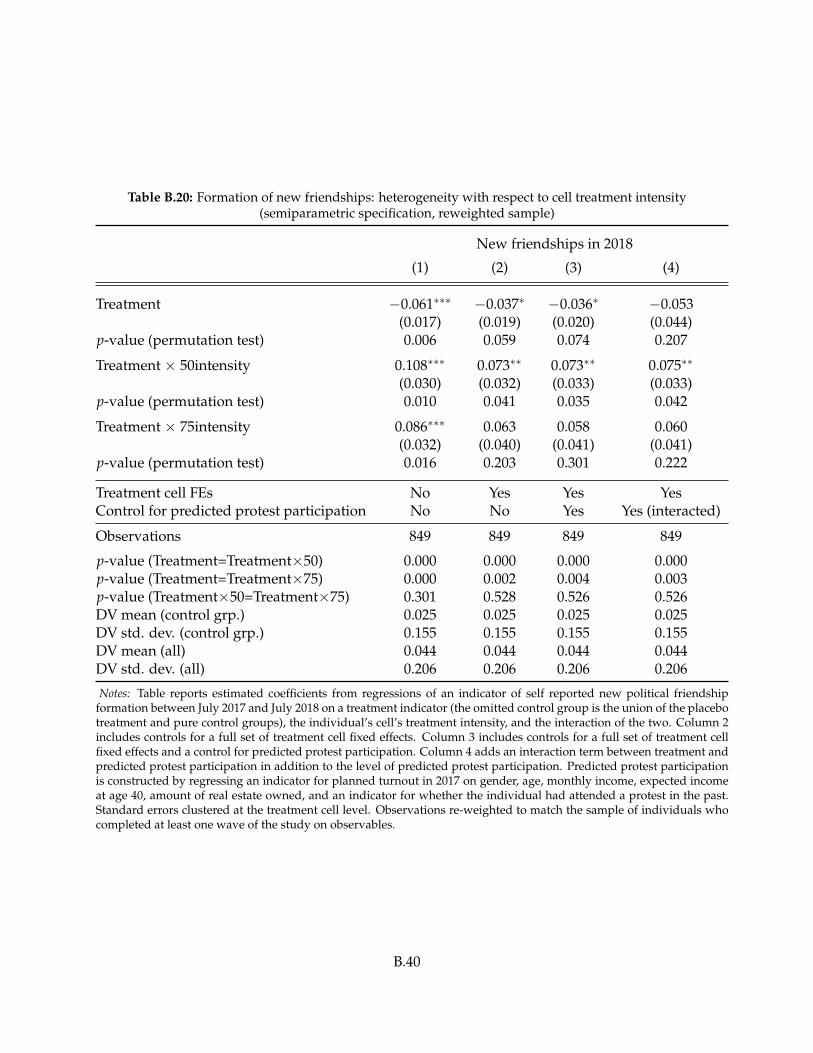
Table B.20: Formation of new friendships: heterogeneity with respect to cell treatment intensity(semiparametric specification, reweighted sample)
New friendships in 2018
(1) (2) (3) (4)
Treatment −0.061∗∗∗ −0.037∗ −0.036∗ −0.053(0.017) (0.019) (0.020) (0.044)
p-value (permutation test) 0.006 0.059 0.074 0.207
Treatment × 50intensity 0.108∗∗∗ 0.073∗∗ 0.073∗∗ 0.075∗∗
(0.030) (0.032) (0.033) (0.033)p-value (permutation test) 0.010 0.041 0.035 0.042
Treatment × 75intensity 0.086∗∗∗ 0.063 0.058 0.060(0.032) (0.040) (0.041) (0.041)
p-value (permutation test) 0.016 0.203 0.301 0.222
Treatment cell FEs No Yes Yes YesControl for predicted protest participation No No Yes Yes (interacted)
Observations 849 849 849 849
p-value (Treatment=Treatment×50) 0.000 0.000 0.000 0.000p-value (Treatment=Treatment×75) 0.000 0.002 0.004 0.003p-value (Treatment×50=Treatment×75) 0.301 0.528 0.526 0.526DV mean (control grp.) 0.025 0.025 0.025 0.025DV std. dev. (control grp.) 0.155 0.155 0.155 0.155DV mean (all) 0.044 0.044 0.044 0.044DV std. dev. (all) 0.206 0.206 0.206 0.206
Notes: Table reports estimated coefficients from regressions of an indicator of self reported new political friendshipformation between July 2017 and July 2018 on a treatment indicator (the omitted control group is the union of the placebotreatment and pure control groups), the individual’s cell’s treatment intensity, and the interaction of the two. Column 2includes controls for a full set of treatment cell fixed effects. Column 3 includes controls for a full set of treatment cellfixed effects and a control for predicted protest participation. Column 4 adds an interaction term between treatment andpredicted protest participation in addition to the level of predicted protest participation. Predicted protest participationis constructed by regressing an indicator for planned turnout in 2017 on gender, age, monthly income, expected incomeat age 40, amount of real estate owned, and an indicator for whether the individual had attended a protest in the past.Standard errors clustered at the treatment cell level. Observations re-weighted to match the sample of individuals whocompleted at least one wave of the study on observables.
B.40

Appendix C Experimental materials
C.1 Ethical considerations
Our research design is based on a careful assessment of potential risks to our participants. Onemight have several specific dimensions of concern with the study, which we address in turn:
Underage participants: There are no underage participants in our study. We screened out minorsin the first step of our online survey.
IRB approval: We sought and obtained approval from four different IRBs: the University ofMunich (economics ethics committee, protocol 2017-04), Stanford University (Institutional ReviewBoard, Protocol 38481), the University of California-Berkeley (Committee for Protection of HumanSubjects, Protocol ID 2015-05-7571), and Hong Kong University of Science and Technology (Hu-man Participants Research Panel, submission 147). In all of those IRB submissions, we followed allrequired procedures and answered questions relating all relevant dimensions of concern, includ-ing risk. The experimental intervention in 2017 was started only after IRB approval. Outcomesand covariates from previous years were collected in the context of our continuing panel surveyof Hong Kong students, which has been ongoing since 2016.
Payment: Our participants were paid HKD 350 (approx. USD 45, or EUR 40) for completingeither of the two experimental modules. This payment is in line with prevailing wages in HongKong, the time commitment expected for completing the task, and our own payments to studyparticipants in previous waves of our HKUST student panel.
Risks: The generally accepted principle for ethics reviews are that risks should be minimal, i.e.not larger “than those ordinarily encountered in daily life of the general population;” moreover,these risks should be reasonable in relation to anticipated benefits. We firmly believe that thesecriteria are met in relation to participating in Hong Kong’s July 1st protest marches.
1. Demonstrations have so far been largely peaceful. No protester outside of a radical group orleadership of the democracy movement has ever been convicted for participating. Demon-strations are an event with broad participation of all strata of society, not just a few radicalstudents. From 2003 until today, a cumulative number of over 1.35 million participants havetaken part in the July 1st marches, while the number of individuals arrested, charged or con-victed in any given year were, at most, in the single digits (see table on the following page).In 10 out of 15 protests of the past not a single individual was arrested, charged or convicted.
2. The mere fact that thousands of people are participating in protests every year — even hun-dreds of thousands in some years — shows that these are integral part of the “daily life ofthe general population.”
3. Demonstrations are legal in Hong Kong. Freedom of speech is guaranteed by the currentlegal system.1 This is true today, and this was true during 2017–18 when the experimentwas conducted.
1Article 27 of the Hong Kong Basic Law (“Hong Kong residents shall have freedom of speech, of the press and ofpublication; freedom of association, of assembly, of procession and of demonstration; and the right and freedom toform and join trade unions, and to strike.”) and Articles 16 (“Freedom of opinion and expression”) and 17 (“Right ofpeaceful assembly”) of the Hong Kong Bill of Rights.
C.1

Discussion: Importantly, this shows how the setting of our experimental intervention differsfrom mainland China. Freedom House, an independent organization dedicated to the expansionof freedom and democracy around the world, rates Hong Kong’s civil liberties as 2 out of 7 (1 =most free, 7 = least free) for the past 10 years, the same score as France. Mainland China, on theother hand, scores 6.2 The Hong Kong Government has repeatedly made statements after the July1st Marches indicating that the “Government respects citizens’ rights to assemble, protest, andexpress their opinions.”3
Our research design illustrates that we anticipated the risks to be low, and, through revealedpreference, how study participants themselves assessed the risks as low. We designed a placebotreatment with the hopes of achieving a similar take up rate at the same level of payment. Whenstudy participants were offered the exactly same monetary incentives to complete two differenttasks — counting crowd size during the protest on July 1st and counting crowd size at the MTR(subway) stations one week later — the shares of students who took up the offers and completedthe tasks are very similar (11% and 14%, respectively). This suggests that study participants per-ceived these two tasks with similar degree of risk.
As in all social science research — from handing out conditional cash transfers, to sendingout enumerators to favelas, or community organizers in reconciliation efforts after civil wars —there is always a small risk of bad consequences: in our case, a demonstration turning violent,military crackdown. Our assessment is that is a very unlikely, tail (“de minimis”) outcome, underconsiderable uncertainty. So far, no violent crackdown has ever occurred in Hong Kong’s July 1stmarches.
2Source: https://freedomhouse.org/report/freedom-world/2019/hong-kong, last accessed July 23, 2019.3Source: https://www.info.gov.hk/gia/general/200807/01/P200807010156.htm, last accessed July 23, 2019.
C.2

Summary of arrests, charges and convictions related to July 1 March participants during the Marches since 20031
(as of July 2019)
Year Number of attendees2
Arrested by police
Charged by DOJ
Convicted by court
Reason of arrest/charge/conviction
2003 462,000 1 0 0 Not reported 2004 193,000 0 0 0 2005 22,000 0 0 0 2006 36,000 0 0 0 2007 32,000 0 0 0 2008 17,000 0 0 0 2009 34,000 0 0 0 2010 23,000 0 0 0 2011 63,000 0 0 0 2012 95,000 2 2 2 2 protesters were charged with
assaulting police officers. 1 was sentenced 21 days of imprisonment and the other was sentenced 6 weeks of imprisonment.
2013 97,000 3 3 3 3 protesters were charged with unlawful assembly and sentenced for 80 hours of community service.
2014 157,000 5 (organizers)
0 0 5 march organizers were arrested on July 4 for violating the assembly permit. None of them were charged as of today.
2015 28,000 0 0 0 2016 30,000 3 0 0 3 were arrested for possession of
weapons. None of them were charged as of today.
2017 30,000 5 0 03 Arrested for common assault, criminal damage, disorder in public places and obstructing public officers.
2018 28,000 0 0 0
1 Compiled by reports in HK newspapers. Source: WiseNews database. Note that there were individuals arrested, charged, or convicted for activities on July 1st but outside of the July 1st March activities. 2 Source: HKUPOP July 1 headcounting project. 3 Another 8 individuals sabotaging the July 1st March were arrested and charged. 1 was charged for damaging demonstration props; 3 were fined for $1500 each; 4 were sentenced for 18 months of imprisonment with probation; 1 was sentenced for 2 weeks of imprisonment with probation.

C.2 Recruitment email script (June 2017)
Dear students,
Greetings! Hope the summer is going well!
We are researchers from HKUST, University of Chicago, University of Munich, Stanford Uni-versity, and University of California at Berkeley. We are conducting this research project in orderto better understand attitudes and preferences among college students in Hong Kong. We’d loveto invite you to participate in this study, which will take place online.
The survey consists of 2 main parts. You will start Part 1 of the survey today, which will takeabout 30 minutes to complete. Part 2 of the survey will start 2 weeks later, which will take another30 minutes to complete. When you complete both parts of the survey, you will receive HKD 300as compensation. Based on the choices you make during the survey, you may earn an additionalbonus payment of up to HKD 200.
All data collected from the survey will be for academic research only. We abid by academicregulations in Hong Kong, United States, and the European Union to protect the rights and pri-vacy of all study participants.
Please note that in order to be eligible to participate in this study, you need to be: (a) currentlyregistered undergraduate student at HKUST; (b) above 18 years old; and (c) either a resident ofHong Kong SAR or citizen of People’s Republic of China.
To begin the survey, please click on the following link: [survey link]
Feel free to contact us at [email protected] if you have questions and/or concerns regardingparticipating in this study.
We look forward to your participation!
With regards,HK Student Attitudes and Preferences Research Team:Leonardo Bursztyn (University of Chicago)Davide Cantoni (University of Munich)David Yang (Stanford University)Noam Yuchtman (University of California, Berkeley)Jane Zhang (HKUST)
C.4

C.3 Baseline survey module (June 2017)
ANTI-AUTHORITARIANISM
Panel A: Responses to direct questions
Category A.1: Support for democracy
A.1.1 How important is it for you to live in a country that is governed democratically, even if democracymakes no significant difference in the socioeconomic status of you, your family, or the country asa whole? (0 = not at all important; 10 = absolutely important)
A.1.2 Do you think that universal and truly democratic elections play an important role in determiningwhether you and your family are able to make a better living? (0 = not at all important; 10 =extremely important)
A.1.3 Do you think that universal and truly democratic elections are an important factor in whetheror not a country’s economy can develop successfully? (0 = not at all important; 10 = extremelyimportant)
A.1.4 Where do you stand in terms of your political attitudes? (0 = pro-establishment / pro-Beijing; 10= pro-Democracy)
A.1.5 Where do you stand in terms of the following two statements? (0 = I think that only those whodemonstrate patriotism towards Beijing should be allowed to become candidates for the ChiefExecutive; 10 = I think that no restriction should be imposed in terms of who are allowed tobecome candidates during the Chief Executive election)
Category A.2: Support for HK independence
A.2.1 Where do you stand in terms of the following two statements? (0 = I would like to see Hong Kongbe fully integrated with the political institutions of Mainland China; 10 = I would like Hong Kongto be separate and have its own political institutions)
A.2.2 Where do you stand in terms of the following two statements? (0 = I would like to see HongKong be fully integrated with the economic institutions of Mainland China; 10 = I would likeHong Kong to be separate and have its own economic institutions)
A.2.3 As it is now, is the Chinese Communist Party legitimate in ruling over Hong Kong? (0 = com-pletely legitimate; 10 = not at all legitimate)
A.2.4 If the Chinese Communist Party undergoes significant reform and Mainland China adopts trulydemocratic political institutions, do you think the Chinese central government can be a legitimateruling government over Hong Kong? (0 = completely legitimate; 10 = not at all legitimate)
A.2.5 To what extent do you think Hong Kong should be an independent nation? (0 = HK should notbe independent at all; 10 = HK should definitely be independent)
A.2.6 To what extent do you think Hong Kong society should discuss and debate the potential prospectof its independence? (0 = independence should not be discussed at all; 10 = important and bene-ficial to have open discussion on independence)
Category A.3: HK identity: self-reported
A.3.1 Where do you stand in terms of your national identity? (0 = Chinese; 10 = Hong Kongese)A.3.2 Where do you stand in terms of your cultural identity? (0 = Chinese; 10 = Hong Kongese)A.3.3 How important is being a Hong Kongese citizen to you? (0 = not at all important; 10 = extremely
important)A.3.4 How important is being a Chinese citizen to you? (0 = extremely important; 10 = not at all impor-
tant)
Category A.4: Unhappiness with political status quo
Continued on next page
C.5

A.4.1 How democratically is Hong Kong being governed today? (0 = completely democratic; 10 = notat all democratic)
A.4.2 How would you rate the political system in Hong Kong between 1997 and 2012, relative to thatprior to 1997? (0 = extremely good; 10 = extremely bad)
A.4.3 How would you rate the political system in Hong Kong today, relative to that prior to 1997? (0 =extremely good; 10 = extremely bad)
A.4.4 All things considered, how satisfied are you with your life as a whole these days? (0 = completelysatisfied; 10 = completely dissatisfied)
Category A.5: Anti-CCP views on current events
A.5.1 To what degree do believe that the electoral reform package proposed by Mainland China isdemocratic? (0 = completely democratic; 10 = completely undemocratic)
A.5.2 Do you support the Legislative Council’s veto decision? (0 = completely against Legco’s decision;10 = completely support Legco’s decision)
A.5.3 Between October and December 2015, multiple booksellers from Causeway Bay Books have gonemissing. Many suspect that the mainland Chinese government was involved. If this is true, whatdo you think of mainland Chinese government’s action? (0 = completely legitimate, in accordancewith Basic Law; 10 = completely illegitimate, violation against Basic Law)
Panel B: Self-reported behavior and real-stakes decisions
B.1 Have you participated in the Occupy Central / Umbrella Revolution during September - Decem-ber 2014?
B.2 Which party are you are you planning to vote for, during the 2016 Hong Kong Legislative CouncilElection? (0 = pro-Beijing parties; 1 = pro-democracy parties)
B.3 Are you planning to participate in the July 1st March in 2016? (0 = no, or not sure yet but moreunlikely than yes; 1 = yes, or not sure yet but more likely than not)
B.4.1-4 Average amount allocated to HK local partner in national identity games, relative to the amountallocated to Mainland Chinese
B.5 How much money from your participation fee do you want to contribute to Demosisto? (0 =none; 1 = positive amount)
FUNDAMENTAL FACTORS
Panel C: Economic preferences
Category C.1: Risk tolerance
C.1.1 Please tell me, in general, how willing or unwilling you are to take risks? (0 = completely unwill-ing to take risks; 10 = very willing to take risks)
C.1.2 Certainty equivalent from step-wise lottery choices (what would you prefer: a draw with 50 per-cent chance of receiving 300 HKD, and the same 50 percent chance of receiving nothing, or theamount of xxx HKD as a sure payment?)
C.1.3 Eckel and Grossman (2002) lottery decisions: for the following lottery options, please choose onethat you like the most? [incentivized]
Category C.2: Patience
C.2.1 How willing are you to give up something that is beneficial for you today in order to benefit morefrom that in the future? (0 = completely unwilling; 10 = very willing)
C.2.2 I tend to postpone tasks even if I know it would be better to do them right away (0 = describesme perfectly; 10 = does not describe me at all)
Continued on next page
C.6

C.2.3 Patience index from a step-wise intertemporal choices (would you rather receive 100 HKD todayor xxx HKD in 12 months?)
Category C.3: Altruism
C.3.1 How willing are you to give to good causes without expecting anything in return? (0 = completelyunwilling; 10 = very willing)
C.3.2 Today you unexpectedly received 10,000 HKD. How much of this amount would you donate to agood cause? (value between 0 and 10,000)
Category C.4: Reciprocity
C.4.1 When someone does me a favor I am willing to return it (0 = describes me perfectly; 10 = does notdescribe me at all)
C.4.2 I assume that people have only the best intentions (0 = does not describe me at all; 10 = describesme perfectly)
C.4.3 When a stranger helps you, would you be willing to give one of the following presents to thestranger as a thank-you gift?
C.4.4 How willing are you to punish someone who treats you unfairly, even if there may be costs foryou? (0 = completely unwilling; 10 = very willing)
C.4.5 How willing are you to punish someone who treats others unfairly, even if there may be costs foryou? (0 = completely unwilling; 10 = very willing)
C.4.6 If I am treated very unjustly, I will take revenge at the first occasion, even if there is a cost to doso (0 = describes me perfectly; 10 = does not describe me at all)
Category C.5: Preference for redistribution
C.5.1-11 Average amount of money allocated to a fellow HK local partner in a series of dictator games[incentivized]
Panel D: Personality traits
Category D.1: Big 5 - openness
D.1.1-5 On each numerical scale that follows, indicate which point is generally more descriptive of you:D.1.1 1 = no-nonsense; 5 = a dreamerD.1.2 1 = practical; 5 = theoreticalD.1.3 1 = following authority; 5 = following imaginationD.1.4 1 = seek routine; 5 = seek noveltyD.1.5 1 = prefer things clear-cut; 5 = comfortable with ambiguity
Category D.2: Big 5 - agreeableness
D.2.1-5 On each numerical scale that follows, indicate which point is generally more descriptive of you:D.2.1 1 = abrupt; 5 = courteousD.2.2 1 = selfish; 5 = generousD.2.3 1 = cold; 5 = warmD.2.4 1 = independent; 5 = team playerD.2.5 1 = skeptical; 5 = trusting
Category D.3: Big 5 - conscientiousness
D.3.1-5 On each numerical scale that follows, indicate which point is generally more descriptive of you:D.3.1 1 = messy; 5 = neatD.3.2 1 = open-minded; 5 = decisiveD.3.3 1 = easily distracted; 5 = stay focusedD.3.4 1 = comfortable with chaos; 5 = a preference for order
Continued on next page
C.7

D.3.5 1 = procrastinate; 5 = on time
Category D.4: Big 5 - neuroticism
D.4.1-5 On each numerical scale that follows, indicate which point is generally more descriptive of you:D.4.1 1 = calm; 5 = eagerD.4.2 1 = confident; 5 = cautiousD.4.3 1 = upbeat; 5 = discouragedD.4.4 1 = don’t give a darn; 5 = easily embarrassedD.4.5 1 = unflappable; 5 = distractible
Category D.5: Big 5 - extraversion
D.5.1-5 On each numerical scale that follows, indicate which point is generally more descriptive of you:D.5.1 1 = prefer being alone; 5 = prefer being with othersD.5.2 1 = pessimistic; 5 = optimisticD.5.3 1 = private; 5 = exhibitionistD.5.4 1 = cool; 5 = outgoingD.5.5 1 = thoughtful; 5 = conversational
Panel E: Cognitive ability
Category E.1: Cognitive reflection test
E.1.1 A bat and a ball cost $1.10 in total. The bat costs $1.00 more than the ball. How much does theball cost?
E.1.2 If it takes 5 machines 5 minutes to make 5 widgets, how long would it take 100 machines to make100 widgets?
E.1.3 In a lake, there is a patch of lily pads. Every day, the patch doubles in size. If it takes 48 days forthe patch to cover the entire lake, how long would it take for the patch to cover half of the lake?
Category E.2: University GPA
E.2.1 GPA at HKUST, demeaned by major/program
Panel F: Economic status
Category F.1: Household economic & social status
F.1.1 During the past 12 months, what’s the average monthly income of your family?F.1.2 How many properties in HK do your parents currently own in total?F.1.3 Father’s highest educational attainment is above high schoolF.1.4 Mother’s highest educational attainment is above high school
Category F.2: Student’s projected economic status
F.2.1 Median income of HKUST graduates in same major/program (as of 2014)F.2.2 At age 40, where do you see yourself financially, relative to your classmates at HKUST? (1 = at
the very bottom; 7 = at the very top)
Panel G: Background characteristics
G.1 Gender (0 = female; 1 = male)G.2 Birth year
Category G.3: HK-oriented childhood environment
G.3.1 Generations since family migrated to HK (1 = self-migrated; 4 = great grandparents migrated)G.3.2 Attended HK high school using English as language of instruction
Continued on next page
C.8

Category G.4: Religiosity
G.4.1 Religiosity (0 = atheist; 1 = religious)
SIMULTANEOUSLY DETERMINED VARIABLES
Panel H: Beliefs about politics
Category H.1: Beliefs about future institutions
H.1.1 Optimistic about HK’s political institutions in 2025 (believe that Hong Kong will have separateand completely different political institutions from those of Mainland China by 2025, with highcertainty)
H.1.2 Optimistic about HK’s political institutions in 2050 (believe that Hong Kong will have separateand completely different political institutions from those of Mainland China by 2050, with highcertainty)
Category H.2: Beliefs about protest efficacy
H.2.1 Probability of achieving democratic institutions in HK if protests occur, relative to the probabilityif no protest occurs (based on separate elicitation of probability of various protest scenarios andconditional probabilities of democratic institutions under these scenarios)
Panel I: Beliefs about HKUST students
Category I.1: Beliefs about HKUST students: support for democracy
I.1.1-2 What is the average answer that other participants from HKUST in this study have chosen?I.1.1 Corresponding question: A.1.4I.1.2 Corresponding question: A.1.5
Category I.2: Beliefs about HKUST students: support for HK independence
I.2.1-3 What is the average answer that other participants from HKUST in this study have chosen?I.2.1 Corresponding question: A.2.1I.2.2 Corresponding question: A.2.2I.2.3 Corresponding question: A.2.5
Category I.3: Beliefs about HKUST students: HK identity
I.3.1-2 What is the average answer that other participants from HKUST in this study have chosen?I.3.1 Corresponding question: A.3.1I.3.2 Corresponding question: A.3.2
Category I.4: Beliefs about HKUST students: unhappiness with political status quo
I.4.1-2 What is the average answer that other participants from HKUST in this study have chosen?I.4.1 Corresponding question: A.4.1I.4.2 Corresponding question: A.4.4
Category I.5: Beliefs about HKUST students: aggressive pursuit of political rights
I.5.1 What is the average answer that other participants from HKUST in this study have chosen? Cor-responding question: A.6.2
Panel J: Social life
Category J.1: Political social network
Continued on next page
C.9

J.1.1 When you get together with your friends, would you say you discuss political matters frequently,occasionally, or never? (0 = never; 10 = frequently)
J.1.2 When you, yourself, hold a strong opinion, do you ever find yourself persuading your friends,relatives or fellow schoolmates to share your views or not? If so, does this happen often, fromtime to time, or rarely? (0 = never; 10 = always)
J.1.3 Do you know any direct relative who has participated in the Occupy Central movement in 2014?J.1.4 Do you know any schoolmate who has participated in the Occupy Central movement in 2014?J.1.5 Do you know any friend outside of school who has participated in the Occupy Central movement
in 2014?J.1.6 Has any of your direct relatives, schoolmates, or friends outside of school persuaded you to sup-
port Occupy Central (or anti-Occupy Central)?J.1.7 How much do you know, on average, about your direct relatives’ political orientation? (0 = do
not know at all; 10 = very familiar and certain)J.1.8 How much do you know, on average, about your schoolmates’ political orientation? (0 = do not
know at all; 10 = very familiar and certain)J.1.9 How much do you know, on average, about your friends’ political orientation? (0 = do not know
at all; 10 = very familiar and certain)
Category J.2: Sociability
J.2.1 Total number of friends at HKUST elicited (Please list the names of your friends at HKUST, in theorder from those whom you interact with most frequently, to those whom you interact with lessfrequently. Please list as many names as you want – there is no space limit)
J.2.2 Current relationship status is non-single
Panel K: Beliefs about close friends
Category K.1: Beliefs about close friends: support for democracy
K.1.1-2 What is the average answer that 5 of your closest friends at HKUST would have chosen?K.1.1 Corresponding question: A.1.4K.1.2 Corresponding question: A.1.5
Category K.2: Beliefs about close friends: support for HK independence
K.2.1-3 What is the average answer that 5 of your closest friends at HKUST would have chosen?K.2.1 Corresponding question: A.2.1K.2.2 Corresponding question: A.2.2K.2.3 Corresponding question: A.2.5
Category K.3: Beliefs about close friends: HK identity
K.3.1-2 What is the average answer that 5 of your closest friends at HKUST would have chosen?K.3.1 Corresponding question: A.3.1K.3.2 Corresponding question: A.3.2
Category K.4: Beliefs about close friends: unhappiness with political status quo
K.4.1-2 What is the average answer that 5 of your closest friends at HKUST would have chosen?K.4.1 Corresponding question: A.4.1K.4.2 Corresponding question: A.4.4
Category K.5: Beliefs about close friends: aggressive pursuit of political rights
K.5.1 What is the average answer that 5 of your closest friends at HKUST would have chosen? Corre-sponding question: A.6.2
Continued on next page
C.10

Panel L: Media consumption
Category L.1: Frequency of news consumption
L.1.1 How often do you browse the internet to read about news and current events? (1 = never; 6 =multiple times a day)
Category L.2: Pro-democratic source of media
L.2.1 What are the top 3 internet websites that you regularly browse to consume information? (SelectHK local websites among the top 2 choices)
L.2.2 What are the top 3 news outlets that you regularly read for news (including the website, hard-copies of the newspaper, etc.)? (Select pro-democracy news outlets in HK among the top 2 choices)
Panel M: Political interest and knowledge
Category M.1: Political interest
M.1.1 How interested would you say you are in politics? (0 = not at all interested; 10 = extremelyinterested)
Category M.2: Political knowledge
M.2.1-4 Able to answer the following questions correctly:M.2.1 Which of the following is a Democratic Party Legco member?M.2.2 Which of the following is a pro-Beijing Legco member?M.2.3 Which of the following is a leader of a newly founded party in HK that focuses on self-
determination?M.2.4 Which of the following is a leader of a newly founded party in HK that focuses on independence?
ADDITIONAL OUTCOME VARIABLES
Panel N: Intensity of political support
Category N.1: Aggressive pursuit of political rights
N.1.1 What do you think is the consequence of this veto decision, in terms of Hong Kong adoptingfully democratic political institutions in the future? (0 = the veto decision is extremely harmfulin leading Hong Kong to fully democratic institutions in the future; 10 = the veto decision isextremely beneficial in leading Hong Kong to fully democratic institutions in the future)
N.1.2 Some people support the use of violence to fight for Hong Kong citizens’ political rights, whileothers oppose the use of violence. Where do you stand on this question? (0 = violence can neverbe justified; 10 = violence is currently justified)
C.11

C.4 Post July 1st 2017 protest module (July 2017)
[Section: welcome] [add survey logo here] Welcome screen: thank you for participating in this follow-up survey, which will take 10 minutes to complete. You will earn an additional HKD 50 once you complete this short survey, which will be added to your total payment you have earned from the study. M�L(��b���_� n
@I ] [Section: July 1st March participation]
1. Did you attend the July 1 2017 March? L[�D 2017Er����0«
{IF “NO”, skip to Q6.}
2. Which political group’s crowd did you join during the March? (please choose all that apply)
�#��/��Ue4¥r��« ©�%�Q[y,r�¡ª
�d¨ Civic Party d�¨ Democratic Party d!� People Power C¨ Labour Party ud� League of Social Democrats �C Neighbourhood and Worker Service Centre Wd�-s Neo Democrats EWU Youngspiration ¤itJ Demosisto k��d Civic Passion \5d��{ Hong Kong Indigenous
C.12

w8<pZ HKUST Student Union w8�$ ProgressUST <� HKFS Y}Ue<� Proletariat Political Institute ¤i�p HKpeanut D100d��+ D100 Radio �Cs Hong Kong Confederation of Trade Unions A§d�V> Siu Lai Democracy Groundwork 56c~�s Land Justice League f�" Falun Gong l*�d�����D Alliance for Universal Pension O�UF��B=¢£n�a��s Give Dogs a Home X�¦14 Mong Kok Shopping Revolution �I�) Friends of Conscience S��& Umbrella Blossom ¤im&Px'.ENvg$ HKSAR Establishment Day celebration events
�� Others
3. Why did you attend this year’s July 1st March? [please choose all that apply] a = Many of my friends were attending the March, making it an enjoyable social event b = Being politically active is an important component of my identity c = I wanted to send a political signal to those who were not attending the March d = I believed the March would produce political change
4. Did you persuade your friends to participate in this year’s March? [yes/no]
C.13

5. What was your general impression of the March (300 words or less)? L@�E����r|¥�M9�«©� �q; �2zª
{OPEN-ENDED}
6. To the best of your knowledge, how many students your class and major k = at HKUST went to the July 1 March this year?
{Drop down menu: from 0 to xxx}
7. To what extent did your friends’ decision to participate (or not participating) in this year’s July 1st March affect your decision? 0 = not affected by friends’ decisions at all 10 = my decision was entirely based on my friends’ decisions
[Section: information about protests]
8. How many people in total do you think participated in the July 1st March (��8��) in 2017?
{Open-ended question; fill in integer > 0}
9. On July 14th, Hong Kong’s High Court ruled that 4 directly-elected members of the Legislative Council are disqualified of their seats. Who are these 4 disqualified LegCo members? [pick 4 out of 5] LEUNG Kwok-hung `3� Nathan LAW Kwun-chung }�� Eddie CHU Hoi Dick ]�G LAU Siu-lai A§ Edward YIU Chung-yim :^j
C.14

[Section: political beliefs and attitudes]
10. By 2025, which of the following outcome regarding Hong Kong’s political institutions (Ue¥�) do you think is the most likely? 1. Completely integrated with the political institutions of
Mainland China 2. Not fully integrated with the political institutions of Mainland
China, but closer to that of Mainland China than to full democracy
3. Not fully integrated with the political institutions of Mainland China, but closer to full democracy than to the institutions of Mainland China
4. Hong Kong has separate and completely different political institution from those of Mainland China
11. For the most likely outcome that you picked in previous question (2025 outcome), how certain do you think it will actually happen?
0 = completely uncertain 5 = somewhat certain 10 = completely certain
12. By 2050, which of the following outcomes regarding Hong Kong’s political institutions (Ue¥�) do you think is the most likely? 1. Completely integrated with the political institutions of
Mainland China 2. Not fully integrated with the political institutions of Mainland
China, but closer to that of Mainland China than to full democracy
3. Not fully integrated with the political institutions of Mainland China, but closer to full democracy than to the institutions of Mainland China
4. Hong Kong has separate and completely different political institutions from those of Mainland China
13. For the most likely outcome that you picked in previous question (2050 outcome), how certain are you that it will actually happen?
0 = completely uncertain 5 = somewhat certain 10 = completely certain
C.15

14. How important is it for you to live in a country that is governed democratically, even if democracy makes no significant difference in the socioeconomic status of you, your family, or the country as a whole?
0 = not at all important 5 = neutral 10 = absolutely important
15. Where do you stand in terms of your political attitudes? (TRrUex7)
0 = pro-democracy (TRd�h) 5 = neutral (�x) 10 = pro-establishment / pro-Beijing (TRH�h)
16. As it is now, is the Chinese Communist Party legitimate in ruling over Hong Kong?
0 = not at all legitimate 5 = in between 10 = completely legitimate
17. To what extent do you think Hong Kong should be an independent nation?
0 = HK should not be independent at all 5 = in between 10 = HK should definitely be independent [Section: beliefs regarding others]
18. Some people in Hong Kong are in strong support of its independence (¤iox). To what extent do you think that these people who hold such beliefs are afraid of (?K) expressing their beliefs in public?
C.16

0 = not at all afraid 5 = somewhat afraid 10 = extremely afraid
19. How important is it for you to live in a country that is governed democratically, even if democracy makes no significant difference in the socioeconomic status of you, your family, or the country as a whole? 0 = not at all important 5 = neutral
10 absolutely important
What is the average answer that all citizens of Hong Kong would have chosen? [Fill in a number, from 0-10]
20. As it is now, is the Chinese Communist Party legitimate in ruling over Hong Kong? 0 = not at all legitimate 5 = in between 10 = completely legitimate
What is the average answer that all citizens of Hong Kong would have chosen? [Fill in a number, from 0-10]
21. To what extent do you think Hong Kong should be an independent nation? 0 = HK should not be independent at all 5 = in between 10 = HK should definitely be independent
What is the average answer that all citizens of Hong Kong would have chosen? [Fill in a number, from 0-10]
C.17

[Section: donation] Thank you for participating in our study this year. As promised, you will receive HKD 300 for completing last month’s online surveys, as well as the various bonus payments that you may earn throughout the study (including the HKD 50 for participating in today's survey). We would like to give you the choice of receiving the HKD 300 participation fee directly, or making a contribution to one of the following organizations. Your participation payment belongs to you, and you should feel absolutely free to receive all of it as a direct payment to you, or to contribute any amount of your payment to the organization you prefer. We will transfer the amount you indicated to the corresponding organization on your behalf. We will provide you with a receipt from the contribution; your contribution decision will be completely private and anonymous. Please note this research project is not affiliated with any of the following organizations.
k @I
) @I
o
e .
i4 e .
f
@I k
C.18

22. Do you want to make a contribution to any of the following organizations from part or all the participation fee (HKD 300) that you have earned?
1 = Demosistō¤itJ (https://www.demosisto.hk) 2 = DABdH� (http://www.dab.org.hk) 3 = None
23. [Display if previous question’s answer is 1 or 2] How much of the HKD 300 participation fee do you want to contribute to the group that you chose above? Please fill in number between 0-300. {fill in blank, integer 0-300}
[Section: conclusion] Thank you for participating in today’s follow-up survey. We will email you in a week to inform you the total amount that you have earned throughout the study this summer, as well as additional payment details. The payment will be deposited directly to your bank account via the HKUST Student Information System (SIS), as soon as the study concludes. If you have indicated that you want to make contribution to an organization, we will transfer the amount you indicated on your behalf in approximately 2 weeks, and we will email you a receipt from the contribution. Thank you again for your support of this study. Feel free to contact us at [email protected] if you have questions and/or concerns regarding this study.
C.19

C.5 Pre July 1st 2018 protest module (June 2018)
[Section: welcome] [add survey logo here] Thank you for participating in this follow-up survey, which will take less than 10 minutes to complete. Your continuous participation in this year’s survey is extremely important to validity of our academic research. You will earn HKD 100 once you have completed today’s survey. There will be a 2nd part of the survey, which will start around end of July. You will earn additional money when you complete the 2nd part of the survey. [font: 1 size smaller] All data collected from the survey will be for academic research only. We abide by academic regulations in Hong Kong, United States, and the European Union to protect the rights and privacy of all study participants. Identifiable information will only be used to contact you as a study participant and to process study payment. The identifiable information will be de-linked from the data and stored separately, in encrypted format. We will never share the data we collected with any government bodies, organizations, or the school administration. You can click here [insert FAQ link: stanford.edu/~dyang1/pdfs/HKUST_Study_FAQ.pdf] to learn about additional details of the study. M�L(��b���_� n k @I
100
[4 3 s@I3
b : sz @I ke 3
3 k @I k @I k
0
[insert FAQ link: stanford.edu/~dyang1/pdfs/HKUST_Study_FAQ.pdf] @I
C.20

[Section: information about protests]
1. How many people in total do you think participated in the July 1st March (��8��) in 2017?
{Open-ended question; fill in integer > 0}
2. Are you planning to participate in the July 1st March (��8��) in 2018? 1 = Yes 2 = Not sure yet, but more likely than not 3 = Not sure yet, but more unlikely than yes 4 = No
3. On July 14th, Hong Kong’s High Court ruled that 4 directly-elected members of the Legislative Council are disqualified of their seats. Who are these 4 disqualified LegCo members? [pick 4 out of 5] LEUNG Kwok-hung `3� Nathan LAW Kwun-chung }�� Eddie CHU Hoi Dick ]�G LAU Siu-lai A§ Edward YIU Chung-yim :^j
[Section: political beliefs and attitudes]
4. By 2025, which of the following outcome regarding Hong Kong’s political institutions (Ue¥�) do you think is the most likely?
1. Completely integrated with the political institutions of Mainland China
2. Not fully integrated with the political institutions of Mainland China, but closer to that of Mainland China than to full democracy
3. Not fully integrated with the political institutions of Mainland China, but closer to full democracy than to the institutions of Mainland China
C.21

4. Hong Kong has separate and completely different political institution from those of Mainland China
5. For the most likely outcome that you picked in previous question (2025 outcome), how certain do you think it will actually happen?
0 = completely uncertain 5 = somewhat certain 10 = completely certain
6. By 2050, which of the following outcomes regarding Hong Kong’s political institutions (Ue¥�) do you think is the most likely? 1. Completely integrated with the political institutions of
Mainland China 2. Not fully integrated with the political institutions of Mainland
China, but closer to that of Mainland China than to full democracy
3. Not fully integrated with the political institutions of Mainland China, but closer to full democracy than to the institutions of Mainland China
4. Hong Kong has separate and completely different political institutions from those of Mainland China
7. For the most likely outcome that you picked in previous question (2050 outcome), how certain are you that it will actually happen?
0 = completely uncertain 5 = somewhat certain 10 = completely certain
8. How important is it for you to live in a country that is governed democratically, even if democracy makes no significant difference in the socioeconomic status of you, your family, or the country as a whole?
0 = not at all important 5 = neutral 10 = absolutely important
C.22

9. Where do you stand in terms of your political attitudes? (TRrUex7)
0 = pro-democracy (TRd�h) 5 = neutral (�x) 10 = pro-establishment / pro-Beijing (TRH�h)
10. As it is now, is the Chinese Communist Party legitimate in ruling over Hong Kong?
0 = not at all legitimate 5 = in between 10 = completely legitimate
11. To what extent do you think Hong Kong should be an independent nation?
0 = HK should not be independent at all 5 = in between 10 = HK should definitely be independent [Section: beliefs regarding others]
12. Some people in Hong Kong are in strong support of its independence (¤iox). To what extent do you think that these people who hold such beliefs are afraid of (?K) expressing their beliefs in public?
0 = not at all afraid 5 = somewhat afraid 10 = extremely afraid
13. How important is it for you to live in a country that is governed democratically, even if democracy makes no significant difference in the socioeconomic status of you, your family, or the country as a whole? 0 = not at all important 5 = neutral
11 absolutely important
C.23

11 absolutely important
What is the average answer that all citizens of Hong Kong would have chosen? [Fill in a number, from 0-10]
14. As it is now, is the Chinese Communist Party legitimate in ruling over Hong Kong? 0 = not at all legitimate 5 = in between 10 = completely legitimate
What is the average answer that all citizens of Hong Kong would have chosen? [Fill in a number, from 0-10]
15. To what extent do you think Hong Kong should be an independent nation? 0 = HK should not be independent at all 5 = in between 10 = HK should definitely be independent
What is the average answer that all citizens of Hong Kong would have chosen? [Fill in a number, from 0-10]
[Section: donation] Thank you for participating in our study this year. As promised, you will receive HKD 100 for completing this part of the survey. You will also be able to earn additional compensation when you completed the 2nd part of the survey which will start in about 3 weeks. We would like to give you the choice of receiving the HKD 100 participation fee directly, or making a contribution to one of the following organizations.
C.24

Your participation payment belongs to you, and you should feel absolutely free to receive all of it as a direct payment to you, or to contribute any amount of your payment to the organization you prefer. We will transfer the amount you indicated to the corresponding organization on your behalf. We will provide you with a receipt from the contribution; your contribution decision will be completely private and anonymous. Please note this research project is not affiliated with any of the following organizations.
k @I
)
e .
i4 e .
f
@I k
16. Do you want to make a contribution to any of the following organizations from part or all the participation fee (HKD 100) that you have earned from today’s survey? Note that your donation decision will not affect the participation fee that you will be receiving from participating in future part(s) of the study. You will receive those amounts in entirety.
1 = Demosistō¤itJ (https://www.demosisto.hk) 2 = DABdH� (http://www.dab.org.hk) 3 = None
C.25

17. [Display if previous question’s answer is 1 or 2] How much of the HKD 100 participation fee do you want to contribute to the group that you chose above? Please fill in number between 0-100. {fill in blank, integer 0-100}
[Section: conclusion] Thank you for participating in today’s survey. We will email you around late July about the 2nd part of the survey. The study payment will be deposited directly to your bank account via the HKUST Student Information System (SIS), as soon as the study concludes (by end of July). The payment process normally takes about four to eight weeks. There might be some delays in SIS payment processing due to summer vacation. If you wish to receive the payment sooner, you may choose to receive the payment by bank cheque below. You will need provide us with your mailing address and payee name in order to receive the cheque. We will issue a bank cheque to process your payment approximately two weeks after the study concludes. Please make sure to click “>>” in order for us to record your answer. [question: “I would like to receive my payment by: a = HKUST Student Information System (SIS) b = bank cheque (need to provide mailing address and cheque payee info)] If (b) is chosen, then shown 2 more questions.
1. Mailing address [large text box] 2. Payee Name (must be identical to bank record)
If you have indicated that you want to make contribution to an organization, we will transfer the amount you indicated on your behalf in approximately 2 weeks, and we will email you a receipt from the contribution.
C.26

Thank you again for your support of this study. Feel free to contact us at [email protected] if you have questions and/or concerns regarding this study.
@I @I [4 2 S
r mf [4 j h
f
r
@I @I
h
3
2 S
k r =
u .
( [
@I 8 k
C.27

C.6 Post July 1st 2018 protest module (June 2018)
[Section: welcome] [add survey logo here] Thank you for participating in this follow-up survey, which will take about 5 minutes to complete. You will earn HKD 100 once you have completed today’s survey. Your continuous participation in this year’s survey is extremely important to validity of our academic research. You will have opportunity to participate in additional components of the study, which will take about 40 minutes. You will earn additional payment if you complete the additional components of the study. We will tell you more details at the end of today’s survey. Feel free to contact us at [email protected] if you have questions and/or concerns regarding participating in this study.
k
k @I
k@I n
k@I [email protected] k All data collected from the survey will be for academic research only. We abide by academic regulations in Hong Kong, United States, and the European Union to protect the rights and privacy of all study participants. Identifiable information will only be used to contact you as a study participant and to process study payment. The identifiable information will be de-linked from the data and stored separately, in encrypted format. We will never share the data we collected with any government bodies, organizations, or the school administration. You can click here [insert FAQ link: stanford.edu/~dyang1/pdfs/HKUST_Study_FAQ.pdf] to learn about additional details of the study.
[4 3 s@I3 b : s
z @I ke 3 3 k @
C.28

I k @I k
0 [insert FAQ link: stanford.edu/~dyang1/pdfs/HKUST_Study_FAQ.pdf] @I
[Section: protest participation]
1. Have you participated in the July 1st March in 2018? [yes / no]
k r
2. Since last year’s July 1st march, have you formed stronger friendships with people who are politically engaged? [yes / no] i r k k
3. [If #1 (participated in 2018 = yes)]
Did you participate in this year’s July 1st March with any of these closer friends? [yes / no]
k k r
[Section: conclusion, and introduction to panel module] Thank you for participating in today’s survey. You have earned HKD 100 additional payment. We now invite you to participate in a follow-up survey that will take about 40 minutes to complete. You will earn an additional HKD 250 if you complete this part, as well as bonus payment up to HKD 200 depending on your answers. You can start the survey right now, or you can complete it
C.29

at a later time at your convenience. Your participation in this part of the survey is extremely important to validity of our academic research. Please click the following link to start the additional follow-up survey: [insert study link] We will process your study payment as soon as the study completes, using the method you prefer. We will email you soon about the total payment you earn from this year’s study, and details on the payment process. If you have chosen to receive the payment via SIS, please confirm the bank account information that you registered at the SIS. Please click here [insert pdf link for SIS bank account info: stanford.edu/~dyang1/pdfs/ SIS_Bank_Information_Instruction.pdf] for more details. Thank you again for your support of this study. Feel free to contact us at [email protected] if you have questions and/or concerns regarding this study.
k
k 250
j 200 5
k @I
[insert study link]
0 ]
[4 r
[insert pdf link for SIS bank account info: stanford.edu/~dyang1/pdfs/ SIS_Bank_Information_Instruction.pdf]
k @I [email protected] k
C.30

C.7 Protest participation treatment (June 2017)
As researchers, we have continually been struck by how widely-varying are reports on the size of each July 1 March, depending on the information source. For example, on July 2, 2014, the BBC reported that organizers estimated attendance of 510,000 people, while police estimated 98,000 people. We would like to do better using the wisdom of crowds: as researchers, we can provide a scientific and politically-neutral estimate. Because many students attend the events of July 1, we are asking a subset of survey participants to help us get a better estimate of the July 1 March attendance. The idea we have is to collect information from individuals on the number of people around them at different places, at different times of day during the March.
@Ie r k
l 2014 7 2 BBC r k 51p f
9p 8
3c> @I f
r e
r k
r7 ============ Page break =========== We would like to ask you to participate in this scientific endeavor. This should take only 5 minutes of your time while you are at the March. If you attend the March, we would ask you to:
a. At two points in time during the March (ideally one hour apart or more), please make a note of approximately how many people you would touch if you reached your arms straight out to the side and spun in
C.31

a circle. Please also note the location (nearest intersection) and time.
b. At the two times when you count the people around you, please take a photo showing the area around you.
Before July 1st, we will email you a survey link at which to upload your counts and photos. We assure you that the information you send us will be used only for scientific purposes. We will use data from the photo that you send us (for example, counting individuals), but then we will permanently delete the photo. Once you have uploaded all the information, we will pay you HK$350 for your time and effort. Feel free to contact us at [email protected] if you have questions.
k r n
k r
r =
a t
=
3 =
3 3 3 =
=
7 n
C.32

C.8 Protest participation reporting module (July 2017)
[Screen 1: welcome] {insert survey logo} Thank you for participating in our crowdsourcing effort to estimate the total number of people who went to this year’s July 1st March. You can upload your counts and the photos you took here. [Screen 2] Observation note #1
1. What time was this observation made? July 1st 2017, hour ___ (AM/PM), minute ___
2. Where was this observation made?
Nearest street intersection: (e.g. xxxx)
3. Approximately how many people you would touch if you reached your arms straight out to the side and spun in a circle? {fill in blank for number: integer >= 0}
4. Please upload the photo you took during this observation moment.
Please do not compress photo, but upload the original full-sized file.
[Screen 3] Observation note #2
5. What time was this observation made? July 1st 2017, hour ___ (AM/PM), minute ___
6. Where was this observation made?
Nearest street intersection: (e.g. xxxx)
C.33

7. Approximately how many people you would touch if you reached your arms straight out to the side and spun in a circle? {fill in blank for number: integer >= 0}
8. Please upload the photo you took during this observation moment.
Please do not compress photo, but upload the original full-sized file.
[Screen 4] Thank you very much for your participation. We assure you that the information you provide us will be used only for scientific purposes. We will use data from the photo that you upload to count individuals present at the event, but then we will permanently delete the photo once we process the photo. We will add HKD 350 on top of the total amount that you have earned through completing the online surveys in June. Once we have concluded this round of the study and calculated all the bonus payment, we will email you to notify you the total amount you have earned and payment details. We will process your participation and bonus payment through the HKUST Student Information System (SIS). Feel free to contact us at [email protected] if you have questions.
C.34

C.9 Subway placebo treatment (June 2017)
There have been many arguments that the MTR in Hong Kong is exceeding its operating capacity, primarily due to the large number of tourists visiting Hong Kong. As researchers, we would like to use the wisdom of crowds to provide a scientific and politically-neutral estimate of the number of people at some hub MTR stations during the peak hours. Because many students go to MTR stations in downtown Hong Kong, we are asking a subset of survey participants to help us get a better estimate of the size of crowds at these stations. The idea we have is to collect information from individuals on the number of people around them at different MTR stations, at different times of day during the weekend of July 8th and 9th.
S [ h
@Ie 3c> f
e
7 8 7 9
============ Page break =========== We would like to ask you to participate in this scientific endeavor. This should take only 5 minutes of your time while you are at a downtown MTR station. You can go to any of the following stations listed:
• Central, Admiralty, Wan Chai, Causeway Bay, Tsim Sha Tsui, Mong Kok When you are at an MTR station, we would ask you to:
C.35

a. At two points in time – at least two hours apart – please make a note of approximately how many people you would touch if you reached your arms straight out to the side and spun in a circle. Please also note the station name, location within the station, and time.
b. At the times when you count the people around you, please take a photo showing the area around you.
Before the weekend of July 8th, we will email you a survey link at which to upload your counts and photos. We assure you that the information you send us will be used only for scientific purposes. We will use data from the photo that you send us (for example, counting individuals), but then we will permanently delete the photo. Once you have uploaded all the information, we will pay you HK$350 for your time and effort. Feel free to contact us at [email protected] if you have questions.
n
• 1
7
j =
a =
3 =
3 3 3 =
=
7 n
C.36

C.10 Subway participation reporting module (July 2017)
[Screen 1: welcome] {insert survey logo} Thank you for participating in our crowdsourcing effort to estimate the number of people at some important MTR stations in Hong Kong on weekends. You can upload your counts and the photos you took here. [Screen 2] Observation note #1
1. What time was this observation made? July ___ 2017, hour ___ (AM/PM), minute ___
2. At which MTR station was this observation made? [drop-down menu] Central, Admiralty, Wan Chai, Causeway Bay, Tsim Sha Tsui, Mong Kok
3. Where was this observation made in the station?
[open-ended question]
4. Approximately how many people you would touch if you reached your
arms straight out to the side and spun in a circle? [fill in blank for number: integer >= 0]
5. Please upload the photo you took during this observation moment.
Please do not compress photo, but upload the original full-sized file.
[Screen 3]
1. What time was this observation made? July ___ 2017, hour ___ (AM/PM), minute ___
2. At which MTR station was this observation made? [drop-down menu]
C.37

Central, Admiralty, Wan Chai, Causeway Bay, Tsim Sha Tsui, Mong Kok
3. Where was this observation made in the station? [open-ended question]
4. Approximately how many people you would touch if you reached your
arms straight out to the side and spun in a circle? [fill in blank for number: integer >= 0]
5. Please upload the photo you took during this observation moment.
Please do not compress photo, but upload the original full-sized file.
[Screen 4] Thank you very much for your participation. We assure you that the information you provide us will be used only for scientific purposes. We will use data from the photo that you upload to count individuals present at the event, but then we will permanently delete the photo once we process the photo. We will add HKD 350 on top of the total amount that you have earned through completing the online surveys in June. Once we have concluded this round of the study and calculated all the bonus payment, we will email you to notify you the total amount you have earned and payment details. We will process your participation and bonus payment through the HKUST Student Information System (SIS). Feel free to contact us at [email protected] if you have questions.
C.38