personal investing 2 market efficiency indexes and index funds mutual funds fixed income securities
TRANSCRIPT

Personal Investing 2
Market Efficiency
Indexes and Index Funds
Mutual Funds
Fixed Income Securities
Personal Investing 2 2
Efficient Market Hypothesis Definition
Prices of securities fully reflect all available information about these securities
Question Is it worth going after a $100 bill you find
while walking down a busy street?

Personal Investing 2 3
Random Walk Hypothesis Tracing the evolution of several economic
variables predict stock prices? Kendall (1953) no predictable patterns Random Walk
Stock prices are random More precisely
Expected return is positive over time Positive trend and random around the trend

Personal Investing 2 4
Random Walk Hypothesis Positive Trend with random fluctuation
TimeTime
Security Security PricesPrices

Personal Investing 2 5
Efficient Markets and Random Walk Stock prices fully and immediately
reflect all available information Once information becomes available,
market participants analyze it Competition assures that prices reflect all available information

Personal Investing 2 6
Implications of EMH Passive Investing beats Active Investing
Index Funds and Buy-and-Hold strategy are best! Role of Investment Advisors and Portfolio
Management: Diversification
Idiosyncratic risk should be diversified away at a minimal cost
Appropriate risk level Provide the systematic risk level that investors
can tolerate Tax considerations
Growth vs Income stocks, munis vs Treasuries Other considerations

Personal Investing 2 7
Indexes: Equity and Bond What are they?
An indicator of average security prices Why do we need them?
Tracking market returns Benchmarking fund manager performance Bases for derivatives, e.g., index options
Factors affecting an index Representative? Weighting of components?

Personal Investing 2 8
Equity Indexes DJIA S&P 500, S&P Mid Cap. NASDAQ 100 Nikkei 225 (Tokyo Stock Exchange) FTSE 100 (London) Wilshire 5000 MSCI-EAFE Index
Morgan Stanley Capital International Europe, Australia, Far East Index (including 21 developed countries outside North America)

Personal Investing 2 9
Equity Indexes: DJIA Some facts
30 industrial stock price-weighted average. Oldest and best-known in the U.S. Used to representing about a quarter of the
market value of the NYSE stocks. Quantitatively
Divisor changes when stock splits or stock is replaced by another

Personal Investing 2 10
Equity Indexes: DJIA Construction
Suppose DJIA has two stocksStocks SharesName Outstanding Yesterday Today
A 20 $30 $25B 5 $40 $50
DJIA 2 35 37.5
Price
Divisor

Personal Investing 2 11
Equity Indexes: DJIA What happens when a stock splits?
At market close today, B has a 2-for-1 split
Where does the new divisor come from?
Stocks SharesName Outstanding Yesterday Today
A 20 $30 $25B 5 $40 $50
DJIA 2 35 37.5B 10 $25
DJIA 1.3333 37.5
Price
3333.1$37.5
25$25$divisor new
5.37$
divisor new
25$25$
Divisor
Personal Investing 2 12
Equity Indexes: S&P 500 Including 500 NYSE, Amex, NASDAQ stocks Considered to be a much broader index of
the U.S. market than the DJIA Numerous financial products derived from the
index Mutual funds indexed to the S&P 500 Index S&P Depository Receipts (SPDR) S&P 500 Index Options and Futures
Market value-weighted index – larger companies have more weight in S&P 500

Personal Investing 2 13
Equity Indexes: S&P 500 Market value-weighted index - Calculation
Stocks SharesName Outstanding Yesterday Today
A 20 $30 $25B 5 $40 $50
S&P 8 100 93.75
Price

Personal Investing 2 14
Equity Indexes: S&P 500 When does the divisor change?
NOT for stock split YES for stock replacement in the index E.g., C replaces B in the index
Stocks SharesName Outstanding Yesterday Today
A 20 $30 $25B 5 $40 $50
S&P 8 100 93.75C 40 $50 $60
S&P 30.9333 93.75
Price
Divisor
9333.3093.75
60402520divisor new
divisor new
6040252075.93

Personal Investing 2 15
Example: Amazon.com joining S&P 500Amazon.com Stock Price
40
42
44
46
48
50
11/1/05 11/8/05 11/15/05 11/22/05 11/29/05
Amazon.com Trading Volume
0
20000000
40000000
60000000
11/1/05 11/8/05 11/15/05 11/22/05 11/29/05
AMZN joins S&P 500 on
Nov 18, 2005
Announcement is made after market closing
on Nov 14, 2005

Personal Investing 2 16
Equally Weighted Indexes Equally Weighted Stock Indexes
Equally weighted stock indexes place equal weight on each stock return, and call for a portfolio strategy that places equal dollar values in each stock.
E.g. Stock A has a return of 2% and stock B has a return of 1%. An equally weighted index of A and B has a return of 0.5*2% + 0.5*1% = 1.5%
Real life example: Guggenheim S&P 500® Equal Weight ETF (see LINKS)
Constant portfolio rebalancing is required to track such an index!

Personal Investing 2 17
Bond Indexes An indicator for bond market returns
Lehman Brothers* Merrill Lynch Salomon Brothers# of Issues > 6,500 > 5,000 > 5,000Maturity >= 1 year >= 1 year >= 1 yearExcluded Issues High Yield High Yield High Yield
Convertible Convertible ConvertibleFloating Rate Floating Rate
Weighting Market Value Market Value Market ValueReinvestment No Yes* Yes**
*specific bond ** 30-day T-bill
Bond Indexes
* Now Barclays Capital Aggregate Bond Index

Personal Investing 2 18
Mutual Funds - Basics What is a Mutual Fund?
Financial intermediaries that invest on behalf of individual investors
Why Mutual Fund? Diversification and divisibility
Fractional shares yet many different securities Professional management
Portfolio managers and security analysts Lower transaction costs
Large block trade, reduced commissions and fees Record keeping and administration
Status report about distribution, dividends, etc.
Personal Investing 2 19
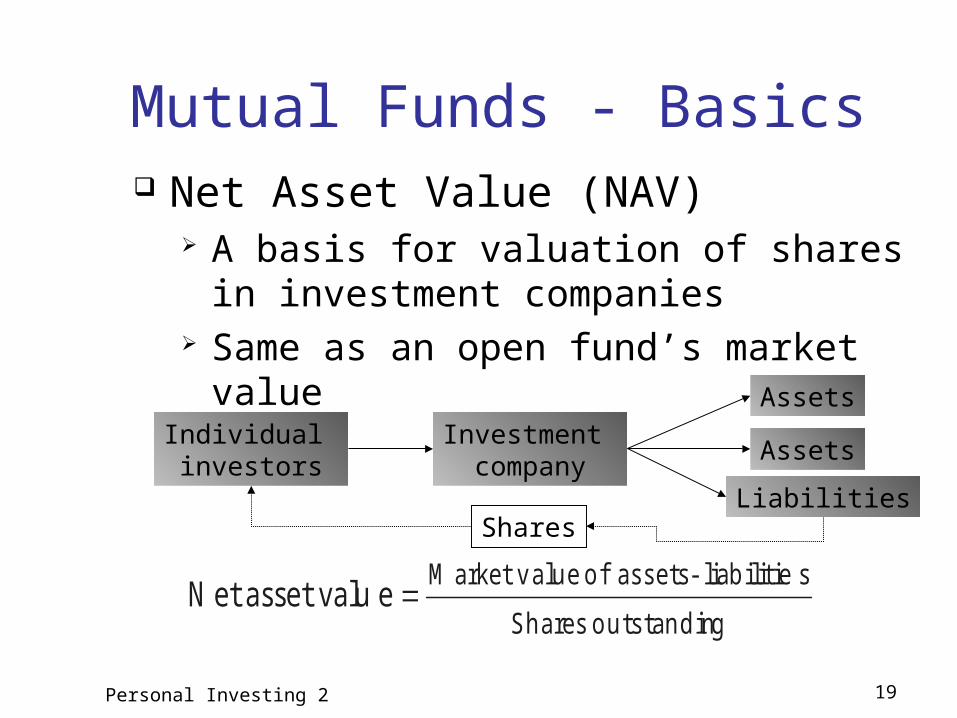
Mutual Funds - Basics Net Asset Value (NAV)
A basis for valuation of shares in investment companies
Same as an open fund’s market value
Individual investors
Investment company
Assets
Assets
LiabilitiesShares
go u ts ta n d in Sh a re s
slia b ilit ie - a s s e t s o f u eM a rke t v a l ea sse t va luN e t
Personal Investing 2 20
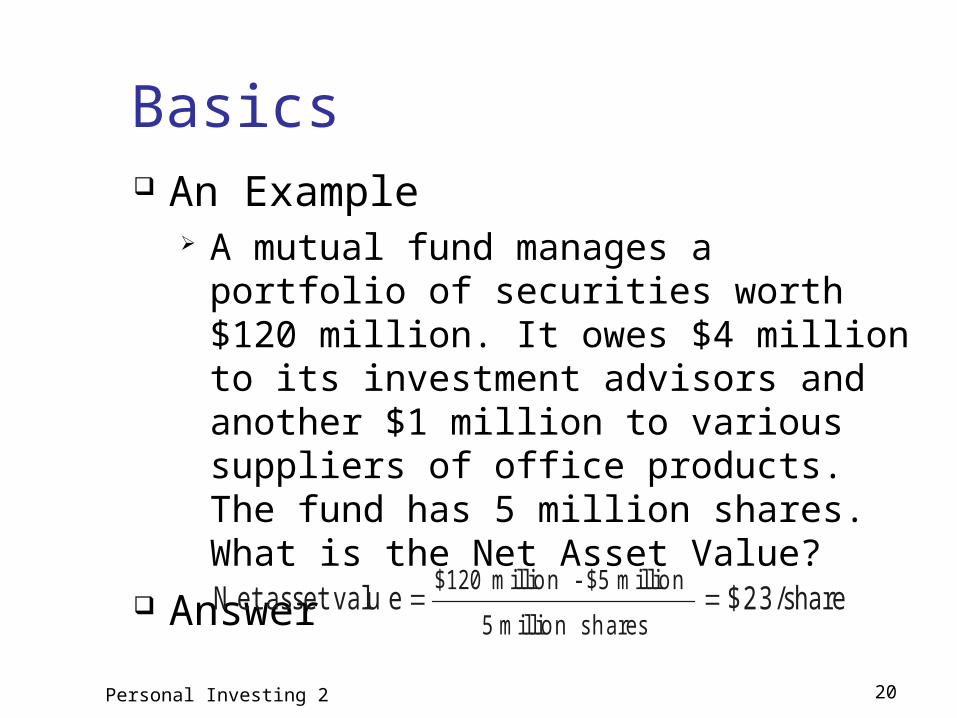
Basics An Example
A mutual fund manages a portfolio of securities worth $120 million. It owes $4 million to its investment advisors and another $1 million to various suppliers of office products. The fund has 5 million shares. What is the Net Asset Value?
Answer
$ 2 3 /sha re ea sse t va luN e t s h a re sm illio n 5
m illio n $5 -m illio n $120

Personal Investing 2 21
Types: Open-End Funds Managed investment company
Investors can invest/divest in the fund by cashing in/out at NAV (at the day’s closing prices)
Market price = NAV: sold at par Dominant type of investment: over 90% Assets under management: nearly $12 trillion by
2011
Individual investors
Redeemable shares
Fund’s boardof directors
Managementcompany
Assets
Assets
Liabilities

Personal Investing 2 22
Types: Investment Policies Money market funds
Specializing in money market securities Equity Funds
Fixed Income Funds Treasury, corporate, high yield bonds
Current income
Capital appreciation Maximum Capital Gains
Growth
Growth and Income
Income
Income and Security
Risk

Personal Investing 2 23
Types: Investment Policies Balanced and Income Funds
Fixed % equities and fixed-income securities Asset Allocation Funds
Variable % equities and fixed-income securities Market timers
Specialized Sector Funds Internet, biotech, pharmaceuticals, etc.
Index Funds Tracking S&P500, DJIA, etc.
Global Funds Invest in securities of other countries

Personal Investing 2 24
Open-End Funds – Strategies
Can not use leverage Can not use short sales Can not use fast turnover
Must receive less than 30% of the gross income from the sale of securities held less than 3 months
What can they do?

Personal Investing 2 25
Costs: Sales Load Front-end load (“entrance fee”)
A commission or sales charge Not to exceed 8.5% Low load funds: 1-3%
Back-end load (“exit fee”) A redemption fee Contingent deferred sales charges 5-6% with 1% sliding down per year

Personal Investing 2 26
Costs: Operating Expenses Administrative expenses Investment advisory fees
Range from 0.2% to 2% of asset value 12b-1 charges
Commissions to brokers, distribution costs Up to 1%
Payment of expenses No explicit bill for operating expenses Automatic deduction from fund assets
Personal Investing 2 27
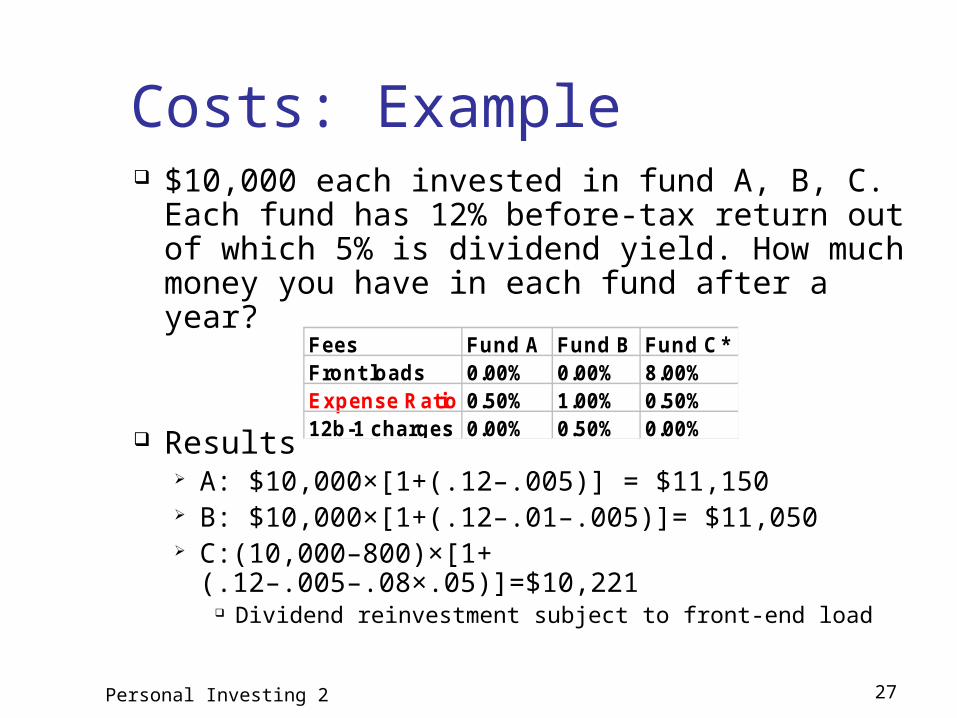
Costs: Example $10,000 each invested in fund A, B, C. Each
fund has 12% before-tax return out of which 5% is dividend yield. How much money you have in each fund after a year?
Results A: $10,000×[1+(.12–.005)] = $11,150 B: $10,000×[1+(.12–.01–.005)]= $11,050 C:(10,000–800)×[1+(.12–.005–.08×.05)]=$10,221
Dividend reinvestment subject to front-end load
Fees Fund A Fund B Fund C*Front loads 0.00% 0.00% 8.00%Expense Ratio 0.50% 1.00% 0.50%12b-1 charges 0.00% 0.50% 0.00%

Personal Investing 2 28
Taxation “Pass-through” Status
Investors responsible for paying taxes Investors lose tax-timing options
Turnover rate Ratio of total trading volume to asset value Higher turnover ratio, higher tax liability E.g. e-Tech fund has asset value of $100 million,
over the last year. It sold $60 million of old stocks and bought the same amount of new stocks. What is the turnover ratio?
Turnover ratio = 60/100 = 60%

Personal Investing 2 29
Taxation Example
An investor’s asset is $1M. In the year, he sells 1K shares of Microsoft at $80, and 2K shares of Ford at $40. He then buys 1.6K shares of IBM at $100
What’s the portfolio’s turnover rate? If the purchase price for Microsoft and Ford are $70 and
$35, and the investor has 28% tax rate, what’s his tax liability?
Answer: Trading volume = 1,000×80+2,000×40=$160,000 Turnover rate = Trading vol./Asset = 160,000/1MM=16% Profit = 1,000×(80-70)+2,000×(40-35)=$20,000 Tax = 20,000×28% = $5,600

Personal Investing 2 30
Closed-End Funds (CEFs) Managed investment company
Investors invest/divest in the fund by buying/selling the company shares
Individual investors
Non-redeemable shares
Fund’s boardof directors
Managementcompany
Assets
Assets
Liabilities
Exchange listed

Personal Investing 2 31
CEFs - NAV vs. Price Market price of shares on an exchange is
determined by relative supply and demand of shares on the market general market and economic conditions other factors beyond our control
Market price of CEF shares could be at, above, or below their NAV?
Closed-End Fund Puzzle IPO price > NAV: sold at premium Secondary market price < NAV: sold at
discount

Personal Investing 2 32
CEFs – SnapshotFund NAV Mkt Price Prem/Disc % 52 Wk Return %
Adams Express Company (ADX) 12.89 11.11 −13.81 26.13
Advent/Clay Enhcd G&I (LCM) 12.16 11.58 −4.77 23.52
BlackRock Equity Div (BDV) 10.65 10.03 −5.82 27.39
BlackRock Str Eq Div Achv (BDT) 11.8 10.68 −9.49 26.17
Cohen & Steers CE Oppty (FOF) 14.64 13.46 −8.06 25.17
Cohen & Steers Dvd Mjrs (DVM) 14.70 13.82 −5.99 49.28
Eaton Vance Tax Div Inc (EVT) 18.75 17.19 −8.32 29.89
Gabelli Div & Inc Tr (GDV) 18.64 16.58 −11.05 43.52
Gabelli Equity Trust (GAB) 6.08 6.10 0.33 48.48
General Amer Investors (GAM) 32.71 28.26 −13.60 30.93
Guggenheim Enh Eq Inc (GPM) 9.58 9.65 0.73 38.93

Personal Investing 2 33
CEFs – Issuers and Resources CEFs are issued or sponsored by many financial
companies, e.g. BlackRock Eaton Vance ING Nuveen PIMCO Vanguard
http://www.cefconnect.com/ – comprehensive CEF resource site sponsored by Nuveen Investments

Personal Investing 2 34
Example: Nuveen New York Performance Plus Municipal Fund
Nuveen New York Performance Plus Municipal Fund is a closed-end, diversified management investment company. The Fund seeks current income exempt from regular Federal as well as New York State and New York City income tax.
The Fund may engage in financial futures and options in order to hedge its portfolio. The Fund may leverage up to 35% of its capital through the issuance of preferred
stock. This fund uses leverage to seek to enhance the income produced for common shareholders through the issuance of short-term preferred shares. The proceeds from the sale of the preferred shares can be used to purchase additional long-term bonds.
This fund is composed of quality municipal bonds - those rated investment grade (BBB/Baa or better at the time of purchase) by either Moody's Investor Service or Standard & Poor's Corporation, or those found by fund's investment adviser to be of equivalent credit quality.
This fund is designed to pay monthly dividends free from regular federal and state income taxes.
Dividends can be reinvested automatically. There may be a nominal charge associated with reinvestment.
Shareholders who choose not to reinvest will receive monthly dividend checks, and will also receive a check for any capital gains distributions.
This fund is actively managed with no fixed term.

Personal Investing 2 35
Example: Nuveen New York Performance Plus Municipal Fund
Portfolio Manager: Scott Romans NYSE Symbol: NNP NASDAQ Symbol: XNNPX Cusip Number: 67062R104 Inception Date: 11/16/1989 Inception NAV: $14.05 Inception Share Price: $15.00 Total Net Assets as of 12/6/2013: $310.293M Share Price as of 12/6/2013: $13.03 NAV as of 12/6/2013: $14.70 Premium/Discount as of 12/6/2013: -11.36%

Personal Investing 2 36
Open-End vs. Closed-End Funds
Key Differences Shares Outstanding
Closed-end: No change unless new stock offered
Open-end: Changes when new shares are sold or old shares are redeemed
Pricing Open-end: Fund share price = NAV Closed-end: Fund share price may trade at
premium or discount to NAV

Personal Investing 2 37
Mutual Fund Resources Prospectus
Investment objectives and policies Fee structure
Morningstar (web or Fund Sourcebook) Yahoo Finance (market data => mutual fund)
Performance Expense ratio Minimal initial investment Turnover rate Manager Top holdings

Personal Investing 2 38
Performance How well mutual funds fare?
Evidence On average, equity fund outperforms money market as
compensation for investment risk. Benchmark: Wilshire 5000, S&P500, etc
You can buy and hold index at very low cost (~18bp) Vanguard S&P 500 or Total stock market fund
Risk adjustment: beta risk, factor risk, etc Higher return does not mean a fund is better, risk has to
be factored in to evaluate a fund performance.

Personal Investing 2 39
Performance Historical comparison (1980 - 2005)*
S&P 500 – 12.3% average yearly return Average Mutual Fund - 10% average yearly return
Historical comparison (1971 - 2010)** Wilshire 5000 – 10.3% average yearly return Average Mutual Fund return was 0.8% lower than
Wilshire 5000 Consensus: passive equity fund (indexed)
outperforms active managed funds
* The Economist, Feb 28, 2008 ** BKM, 9th ed.

Investments 6 40
Performance

Personal Investing 2 41
Performance – Hot Hands Hot Hands
Generally mixed evidence What do we learn from the exceptions?
Warren Buffet Peter Lynch George Soros

Investments 6 42
Performance – Past and Future

Personal Investing 2 43
Performance – Past and Future

Personal Investing 2 44
Persistence of Mutual Fund PerformanceCarhart (1997, JF) - not much of a long term persistence!
Personal Investing 2 45
Other Investment Organizations Hedge Funds
Private speculative investment pool, exempt from SEC regulation
Unit Investment Trusts Money pooled from many investors is invested in portfolio
fixed for life of fund
Commingled Funds Partnership of investors pooling funds; designed for
trusts/larger retirement accounts to get professional management for fee
Real Estate Investment Trusts (REITs) Similar to closed-end funds, invests in real estate/real estate
loans

Personal Investing 2 46
Hedge Funds Strategies
No restrictions Objectives
Arbitrage To achieve absolute
returns Usually market-
neutral (market-hedged) positions
Check this out: www.hedgeindex.com
Personal Investing 2 47
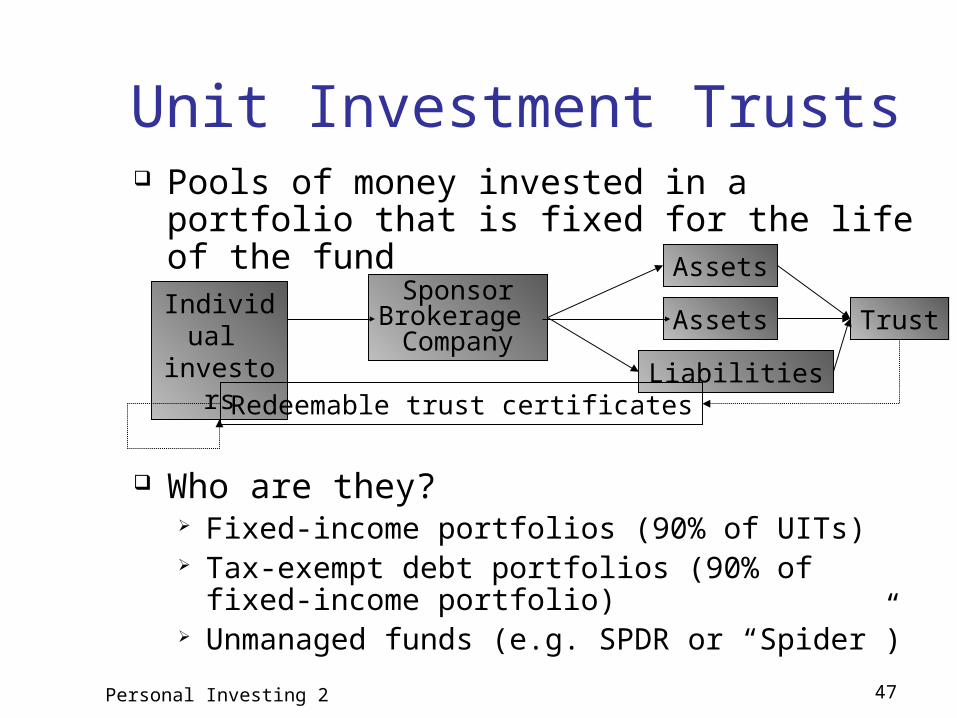
Unit Investment Trusts Pools of money invested in a portfolio that is
fixed for the life of the fund
Who are they? Fixed-income portfolios (90% of UITs) Tax-exempt debt portfolios (90% of fixed-income
portfolio) Unmanaged funds (e.g. SPDR or “Spider”)
Individual investors
SponsorBrokerage Company
Assets
Assets
LiabilitiesRedeemable trust certificates
Trust

Personal Investing 2 48
Unit Investment Trusts What’s in for the sponsors
Sell trust shares at a premium over NAV An Example
A trust purchases $5 million of assets. It then sells 5,000 shares to the public at a price of $1,030 per share. What is the premium?
Answer3 % P remium
$1,000
$1,000 -$1,030

Personal Investing 2 49
Recent Developments - ETFs Exchange-Traded Funds (ETFs)
Funds that allow investors to trade index portfolios
Examples: “Spiders,” “Diamonds,” and “Cubes” Spiders - the first index ETF started in 1993 iShares by BlackRock Market Vectors by Van Eck Global

Personal Investing 2 50
ETFs – Sponsors and Products

Personal Investing 2 51
ETFs – Pros and Cons Potential Advantages
Trade continuously throughout day like stocks
Can be sold short or purchased on margin Lower costs (no marketing, lower fund
expenses) Potentially lower tax rates
Potential Disadvantages Small deviations from NAV possible Brokerage commission to buy ETF

Personal Investing 2 52
Growth of U.S. ETFs over Time

Personal Investing 2 53
Growth of U.S. ETFs over Time

Personal Investing 2 54
Where are We Now? Investment Company Assets Under
Management, 2011 ($ Billion)

Personal Investing 2 55
Fixed-Income Securities Publicly Issued
Treasury Notes and Bonds Agency Issues (Federal Government) Municipal Bonds
Federal tax exemption Local and state tax exemption for state residents
Privately Issued Corporate Bonds Mortgage-Backed Securities

Personal Investing 2 56
Fixed-Income Securities What are they?
A security promising full payment of coupon and principal according to a fixed time schedule
E.g., A 10 year $10,000 T-note with 6¼% coupon
Three Prominent Characteristics Principal
Face value of a bond Interest
Coupon of a bond Maturity
Life span of a bond

Personal Investing 2 57
Source of Risks Interest Rate Risk (Market Risk)
The major factor affecting bond prices The price of bond changes in the opposite
direction of interest change All bonds are exposed
Inflation Risk Inflation reduces purchasing power Yield changes to reflect the expected inflation
Reinvestment Risk No guarantees that coupon payments could be
reinvested at the same rate

Personal Investing 2 58
Source of Risks Credit Risk
Inability of issuer to pay coupon and/or principal Corporate, Emerging market and high-yield bonds Credit linked debt securities, credit derivatives
Liquidity Risk Inability to unload position without substantial loss Municipal, Corporate, and Emerging market bond
FX Risk The risk of exchange rate fluctuation in reducing
the return on a foreign bond
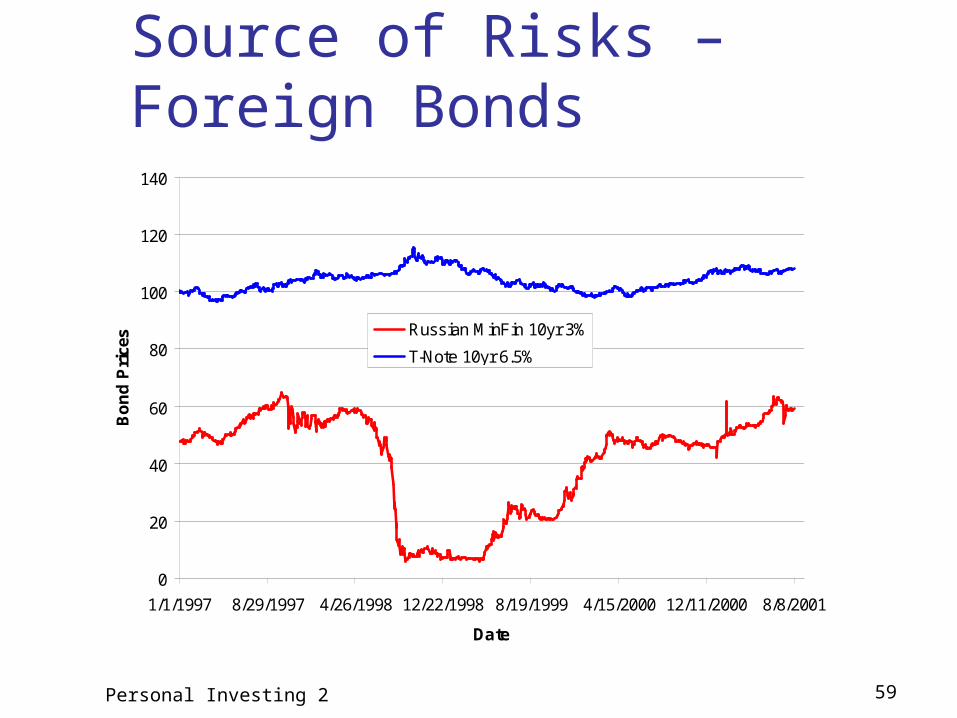
Personal Investing 2 59
Source of Risks – Foreign Bonds
0
20
40
60
80
100
120
140
1/1/1997 8/29/1997 4/26/1998 12/22/1998 8/19/1999 4/15/2000 12/11/2000 8/8/2001
Date
Bo
nd
Pri
ces Russian MinFin 10yr 3%
T-Note 10yr 6.5%

Personal Investing 2 60
Rearview MirrorS&P 500
30.47%
10.07%
21.04%
-11.89%
-22.10%
28.69%
10.88%
4.91%
15.79%
5.49%2.79%
7.62%
37.58%
22.96%
33.36%
28.58%
1.32% -9.10%
-30.00%
-20.00%
-10.00%
0.00%
10.00%
20.00%
30.00%
40.00%
50.00%
1990 1992 1994 1996 1998 2000 2002 2004 2006

Personal Investing 2 61
Rearview MirrorU.S. Bond Aggregate Index
8.95%
16.00%
7.40%
9.75%
3.63%
11.63%10.26%
4.10%2.43%
4.33%
6.97%
18.47%
8.69%
-2.92% -0.82%
9.65%8.44%
4.34%
-5.00%
0.00%
5.00%
10.00%
15.00%
20.00%
1990 1992 1994 1996 1998 2000 2002 2004 2006

Personal Investing 2 62
Bond Prices and Yields
Price
Yield

Investments 15 63
Price Sensitivity to Interest Rates Although 1-yr and 30-yr interest rates are closely correlated…
0%
2%
4%
6%
8%
10%
12%
14%
16%
18%
1Year Rate
30 Year Rate

Investments 15 64
Price Sensitivity to Interest Rates1-yr and 30-yr bond prices display drastically different interest rate sensitivity!
0
20
40
60
80
100
120
140
160
180 1 Year Price ($100 par)
30 Year Price ($1000 par)

Personal Investing 2 65
Debt Classes: Definition Bond (Fixed Income Security)
A security obligating issuer to pay interest and principal to the holder on specified dates.
Coupon Interest rate, e.g. 4%, 5 3/4%, etc. Face/par value or Principal amount, e.g. $100 MM, $3B. Maturity, e.g. 3 month, 1 year, 30 years, etc.
Bond can be classified according to its attributes Payment type, e.g. semi-annual coupon, amortizing, etc. Issuer, e.g. government, agency, corporate, etc. Maturity, e.g. short, medium, long, etc. Security, e.g. secured, unsecured debenture, etc.

Personal Investing 2 66
Debt Classes: Payment Type Pure Discount or Zero-Coupon Bond
No coupon payments prior to maturity. Bond’s face value paid at maturity.
Coupon Bond A stated coupon paid periodically prior to maturity. Bond’s face value paid at maturity.
Perpetual (Consol) Bond A stated coupon paid at periodic intervals.
Self-Amortizing Bond Certain amount paid at each payment period. No balloon payment at maturity.
Personal Investing 2 67
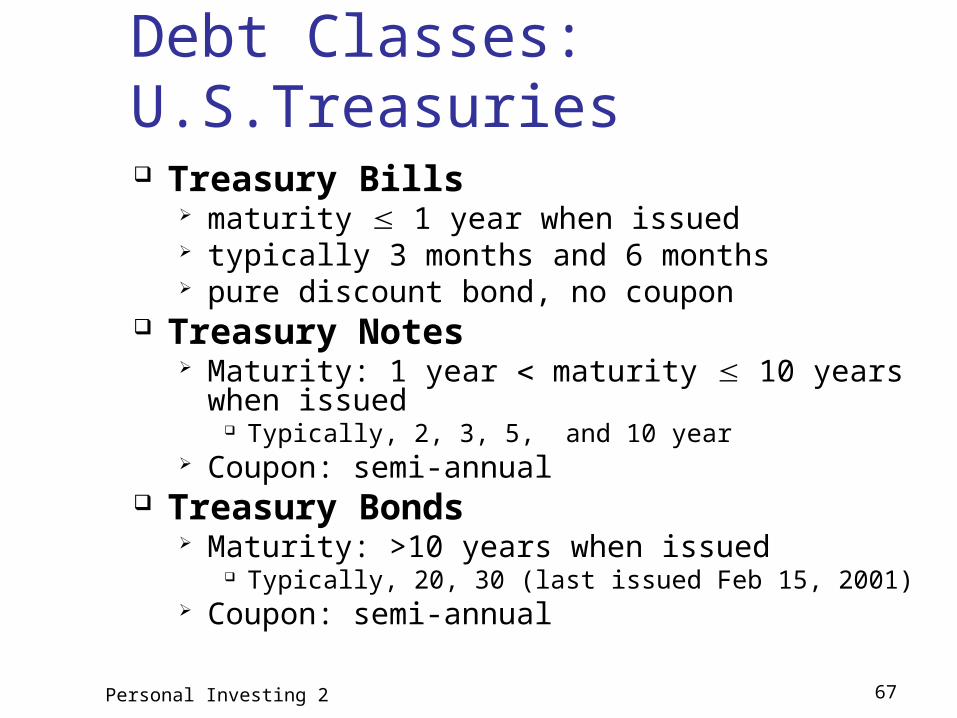
Debt Classes: U.S.Treasuries Treasury Bills
maturity 1 year when issued typically 3 months and 6 months pure discount bond, no coupon
Treasury Notes Maturity: 1 year maturity 10 years when
issued Typically, 2, 3, 5, and 10 year
Coupon: semi-annual Treasury Bonds
Maturity: >10 years when issued Typically, 20, 30 (last issued Feb 15, 2001)
Coupon: semi-annual
Personal Investing 2 68
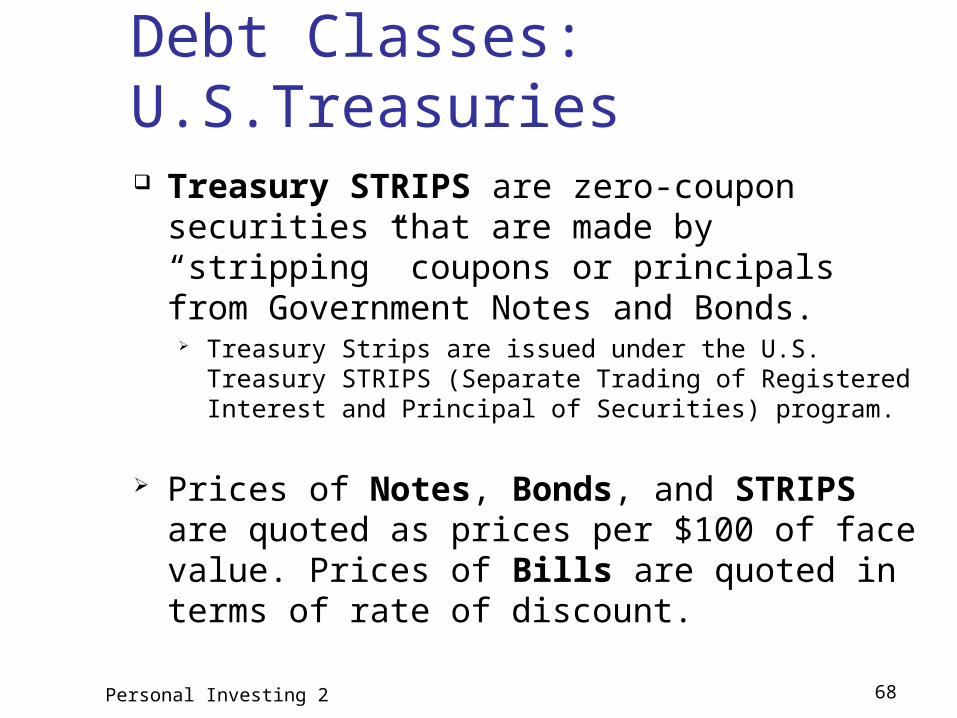
Debt Classes: U.S.Treasuries Treasury STRIPS are zero-coupon securities
that are made by “stripping” coupons or principals from Government Notes and Bonds.
Treasury Strips are issued under the U.S. Treasury STRIPS (Separate Trading of Registered Interest and Principal of Securities) program.
Prices of Notes, Bonds, and STRIPS are quoted as prices per $100 of face value. Prices of Bills are quoted in terms of rate of discount.

Personal Investing 2 69
Debt Classes: Municipal Bonds Municipal Bonds
Maturity varies from one month to 40 years Exempt from federal taxes and state taxes (for
residents of issuing state) Generally two types:
Revenue bonds backed by the revenue of a particular project e.g. water bond
General Obligation bonds backed by the tax revenue of local government e.g. school bond
Riskier than U.S. Government bonds

Personal Investing 2 70
Debt Classes: Corporate Bonds Secured Debt (backed by collateral assets)
Secured by real property Property reverts to bondholder upon default
Subordinate Debenture General creditors subordinate to secured debt Higher priority over stockholders
Other Features of corporate bonds (optional) Convertible bonds: convertible to equity Callable bonds: issuer’s right to buys back bond Putable bonds: holder’s right to sell bond to issuer Sinking funds: reduced face amount over time

Personal Investing 2 71
Corporate Bonds – Default Risk
One of the biggest differences between Corporate Bonds and U.S. Treasury Bonds is the default risk on corporate bonds
Corporate bonds are rated on the basis of their default risk by a few rating companies

Personal Investing 2 72
Factors Used by Rating Companies
Coverage ratios Leverage ratios Liquidity ratios Profitability ratios Cash flow to debt Effects of bond covenants
Personal Investing 2 73
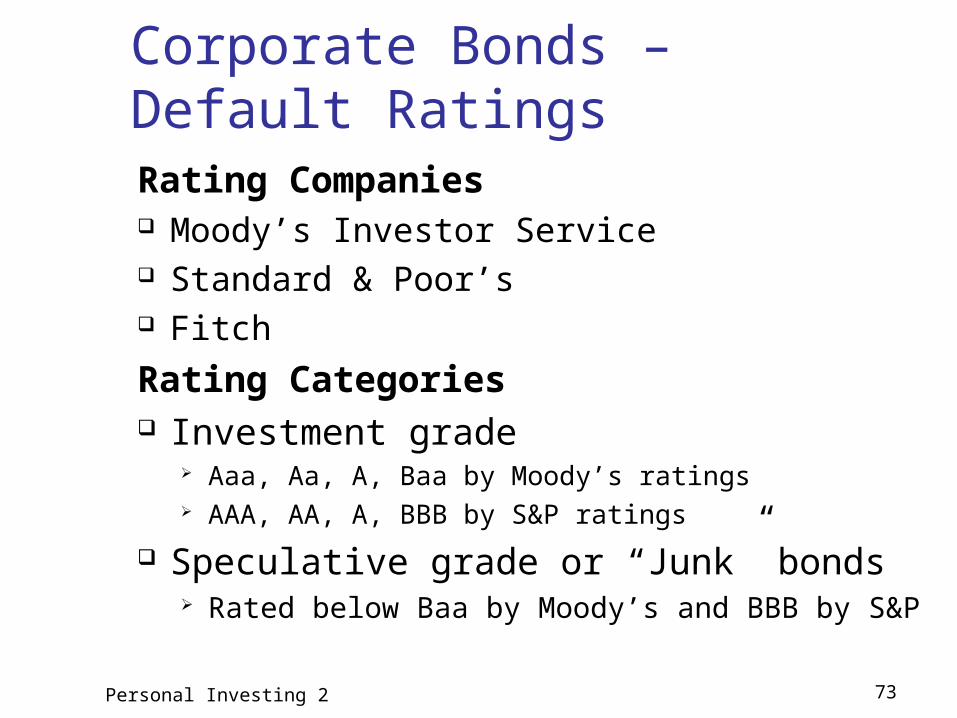
Corporate Bonds – Default RatingsRating Companies Moody’s Investor Service Standard & Poor’s Fitch
Rating Categories Investment grade
Aaa, Aa, A, Baa by Moody’s ratings AAA, AA, A, BBB by S&P ratings
Speculative grade or “Junk” bonds Rated below Baa by Moody’s and BBB by S&P

Personal Investing 2 74
Debt Classes: Corporate Bonds Credit Rating
Moody S&P Quality of Issue Aaa AAA Highest quality. Very small risk of default.
Aa AA High quality. Small risk of default.
A A High-Medium quality. Strong attributes, but potentially vulnerable.
Baa BBB Medium quality. Currently adequate, but potentially unreliable.
Ba BB Some speculative element. Long-run prospects questionable.
B B Able to pay currently, but at risk of default in the future.
Caa CCC Poor quality. Clear danger of default .
Ca CC High specullative quality. May be in default.
C C Lowest rated. Poor prospects of repayment.
- D In default.

Personal Investing 2 75
Average One-Year Credit Loss Rates
0.0% 0.0% 0.1% 0.1%
0.9%
2.7%
6.1%
0.00%
1.00%
2.00%
3.00%
4.00%
5.00%
6.00%
7.00%
Aaa Aa A Baa Ba B Caa - C
Source: “Credit Derivatives” by E. Banks, P. Siegel, M. Glantz; McGraw-Hill, 2006

Personal Investing 2 76
Ratings and Average Time to Default
Source: “Credit Derivatives” by E. Banks, P. Siegel, M. Glantz; McGraw-Hill, 2006
Original RatingAverage # of Years from Original Rating to Default
AAA 8.0
AA 9.5
A 8.5
BBB 6.5
BB 4.8
B 3.6
CCC 3.3

Personal Investing 2 77
Mean and Median Recovery Rates
70%
44%39%
29%
16%
83%
40%35%
21%
6%
0%
20%
40%
60%
80%
100%
Ba and Up B Caa Ca C
Mean
Median
Source: “Credit Derivatives” by E. Banks, P. Siegel, M. Glantz; McGraw-Hill, 2006

Personal Investing 2 78
Protection Against Default
Sinking funds
Subordination of future debt
Dividend restrictions
Collateral
Personal Investing 2 79
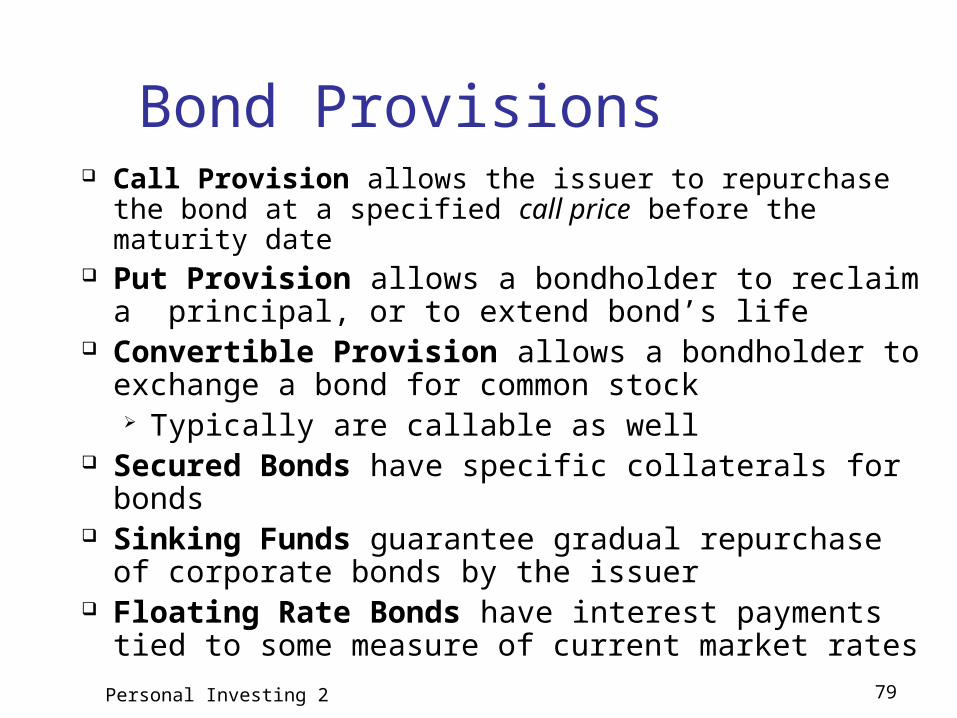
Bond Provisions Call Provision allows the issuer to repurchase the bond
at a specified call price before the maturity date Put Provision allows a bondholder to reclaim a
principal, or to extend bond’s life Convertible Provision allows a bondholder to
exchange a bond for common stock Typically are callable as well
Secured Bonds have specific collaterals for bonds Sinking Funds guarantee gradual repurchase of
corporate bonds by the issuer Floating Rate Bonds have interest payments tied to
some measure of current market rates

Personal Investing 2 80
Bond Resources WSJ - Bonds Yahoo – Bonds Bloomberg - Bonds Lehman Brothers Bond Indices
(what’s left of them…) www.investinginbonds.com PIMCO - Everything You Need to Know
About Bonds