personalfinance - pfnewsletter.com · 27 years, and serving as the newsletter’s chief investment...
TRANSCRIPT

Stocks in the US hit a new all-time peak a few weeks ago, a bull run that begs three questions.
After an advance of four-plus years, are prices now too high, particularly in light of the various challenges confronting the US and the rest of the world? Is it too late to invest? Should you cash in and head to the sidelines?
No, no and no.In a lifetime of investing and many valuable lessons learned, two guiding
principles currently stand out for me:
Rule #1: Bull markets die of excess, not old age.This demise can take various forms, such as investor euphoria, wild spend-
ing, easy credit, soaring inflation, tight monetary conditions and so on. Two recent examples that led to bear markets were the new era in technology of the late 1990s and the real estate/subprime lending insanity that precipi-tated the 2008 financial crisis. No such excesses exist today.
Indeed, this may well be the least-believed, least-loved bull market ever. The S&P 500 is up about 135 percent from its March 2009 low. Yet share-trading volume on all US exchanges has declined for four straight years, according to Bloomberg.
Do you hear much chatter from relatives, friends and neighbors about the bull market? I don’t.
Many investors, individual and institu-tional alike, remain over-weighted in bonds and cash amid a slow emo-tional recovery from the wounds of the financial crisis. Even the high-priced hedge funds remain befuddled, notching a dismal average return of 3.8 percent in this year’s first quarter, versus 10.6 percent for the S&P 500.
In dramatic contrast, our PF Growth and Income Portfolios during the first quarter returned 8.7 percent and 10.4 percent, respectively.
It’s Still a Bull Market for Financial AssetsWe’re looking for a stock-market rotation that offers new op-portunities in the US—and maybe overseas, too.
BY PHIL IP SPRINGER
In 1986, I penned my first article for Per-sonal Finance. After contributing advice for 27 years, and serving as the newsletter’s chief investment strategist for the past year, it’s time for me to move on. Rest assured, I leave you in highly capable hands.
Taking the helm now is Philip Springer, a well-regarded industry veteran with whom I worked when I first broke into the business. Phil discusses his investment philosophy, which closely mirrors my own, and provides his current market outlook in the article at your right.
Elsewhere in this issue, you’ll find the views of new and familiar faces carrying forward PF’s mission of providing sound investment advice. My old friend Soula Stefanopoulos highlights the benefits and pitfalls of “socially responsible” investing in an era of expand-ing regulation, and Igor Greenwald focuses on real estate investment trusts.
My feature article headline last issue read “Toward Dow 20,000.” My point was stocks over time are a very reliable builder of wealth—but only if investors pick quality companies and recognize no bull market moves in a straight line.
US stocks’ current run began in March 2009. Only recently, however, has the bull market been getting real media attention, and many investors are deciding it’s time to jump in with both feet.
That’s clear from near-record low readings on the market’s primary fear gauge—the Chicago Board Options Exchange Volatil-ity Index (VIX)—as well as rock-bottom bond yields and the recent slide in gold prices.
New money may indeed keep pushing stocks higher this year, particularly with sluggish global growth and Federal Reserve policies holding down returns on bonds and other interest-bearing investments. But bar-gains are increasingly scarce, particularly in the most popular sectors.
It’s absolutely critical to be discriminating about what you buy. Don’t chase the high fly-ers, be skeptical of lofty claims and take an occasional profit when you have a big one.
Rising prices reflect higher expectations. If a stock, sector or the broad market fails to measure up, the consequences can be se-vere to your wealth.
Marketwatch
I n s i d e T h i s I s s u eThe REIT Stuff for Yield Seekers 3The New Role of SRI Funds 5Growth Track 6-7Income Report 8-9
Fund Focus 10Article Update 11The Big IRA Grab? 12Recession Radar 12
PORTFOLIO EMAIL ALERTS: Sign up at www.PFnewsletter.com/alerts
PersonalFinance3 9 Y E A R S O F P R O F I T S I N B U L L & B E A R M A R K E T S
Vol. XL, No. 9 • May 8, 2013Roger Conrad, Chief Investment Strategist PFnewsletter.com
NEXT ISSUE AVAILABLE ONLINE: MAY 18, 2013
Source: Bloomberg
The Big PictureComparative Total Returns of the SPDR S&P 500 (SPY) ETF,
iShares MSCI ACWI ex US Index ETF (ACWX) and the iShares MSCI Emerging Markets ETF (EEM), 04/19/11 to 04/19/13.
-30
-20
-10
0
10
20
30%
A M J J A S O N D J F M A M J J A S O N D J F M A
EEM
SPY
ACWX
‘12 ‘13

PERSONAL FINANCE2 May 8, 2013
Moreover, while the US economy is sluggish, a new recession isn’t on the horizon. PF’s proprietary Recession Radar projects only a 30 percent pos-sibility of a downturn. And although corporate earnings growth has slowed, it continues to generally exceed reduced expectations, as recent quarterly results show.
Stock valuations? As always, opin-ions vary as to whether they’re too high, still at a bargain basement low or just right. The S&P 500 currently is trading at about 14 times projected 2013 earnings before extraordinary items. Not cheap, but hardly lofty, particularly considering two key fac-tors that are often ignored.
One is low inflation, which increas-es the value of earnings and dividend streams. The second is the paucity of at-tractive investment alternatives to stocks in today’s investment world.
Equities generally fare well in any comparison. When investing, the reality is that most values are relative and few are absolute. Those two factors easily justify price-to-earnings (P/E) ratios that already aren’t out of line.
Rule #2: Get the investment theme right.
There have been two primary dynam-ics of this investment era since global financial markets bottomed in 2009.
Theme #1: US over the rest of the world. Our stock market now has climbed back to about where it was 5 1/2 years ago. Meanwhile, almost all other large markets are still well below their 2007 peaks.
That outperformance has persisted even over just the last two years. Check out our graph, “The Big Picture.” Using the leading exchange-traded funds (ETFs) as a proxy, it compares the 24-month performance of the S&P 500 (NYSE: SPY) with the iShares MSCI ACWI ex US ETF (NYSE: ACWX), which covers the world outside the US; and the iShares Emerging Markets Index (NYSE: EEM).
At this point, the US is the world’s most attractive market. Unlike Europe, the US dealt forcefully and quickly with the financial crisis. We have better
demographics (more younger workers) than Europe, China and Japan. The US economy, while not robust, is doing better than most. The housing market is strong and energy costs are down.
Most importantly from an investment standpoint, we have the world’s best and
biggest assortment of established, finan-cially strong companies with dominant global business franchises.
Moreover, these companies as a group are hiking dividend payouts and buying back stock in record dollar amounts. It’s only logical that global investors seeking good returns would gravitate toward the US.
It’s also worth noting here that the breadth of the latest rally remains im-pressive, a sign of strength. Most of the large-cap and small-cap indexes are at or near their highs, as is the important NYSE advance-decline line.
Investment theme #2: the quest for income in a yield-starved world. The uniquely aggressive monetary easing among the world’s developed economies in a sluggish global economy has led to return-free savings yields and puny bond yields.
So extreme is this situation that the current, depressed 1.7 percent yield on US Treasury issues maturing in 10 years (a negative return after inflation and taxes) is higher than those of the world’s other major-market, 10-year government bonds.
For instance, how would you like to invest in Japan government bonds at 0.6 percent and leave your money there for a decade?
The Federal Reserve’s current stance is that it will maintain its policy of buying $85 billion a month in gov-ernment bonds and mortgage securi-
ties until the labor market improves “substantially.”
The Fed also says it will keep short-term interest rates near zero until the unemployment rate drops to 6.5 percent or inflation rises above 2.5 percent.
Unemployment and inflation rates in the US are 7.6 percent and 1.5 percent, respectively. Conse-quently, the Fed’s policy is unlikely to be reversed in the near future, despite recent pundit chatter to the contrary.
By the way, Fed chairman Ben Bernanke may or may not continue after his current term ends in January 2014. But the favorite to succeed him, Janet Yellen, would be expected to continue the current program.
President Obama is highly unlikely to appoint someone who advocates a tighter monetary policy.
Amid today’s backdrop of lingering financial crises, political dysfunction and sluggish growth in the world’s developed economies, anxious investors understandably are increasingly inter-ested in the most bond-like equities they can find. Many stocks of good-quality companies carry yields of 2 percent, 3 percent or more.
The rewards of investing in lower-risk stocks that pay good income with capital-appreciation potential have been considerable. Our second chart, “Less Risk, More Gain,” compares the S&P 500 with the PowerShares S&P 500 Low Volatility exchange-traded fund (NYSE: SPLV), which holds the 100 least-volatile stocks in the S&P 500. These equities usually also carry above-average dividend yields.
The dividend-stock trend didn’t take hold early in the bull market. But over the last two years, even this conservative ETF has outpaced the more volatile, the-oretically growth-oriented benchmark index, and that outperformance has even accelerated in the last 12 months.
What’s Next?At this point, virtually everybody seems
to think that US stocks are overbought and overdue for a pullback, in the wake of their strong advance since November.
It’s hard to disagree, which is why I
PERSONAL FINANCE (ISSN 0164-7768) is published semi-monthly. © 2013 by Investing Daily, a division of Capitol Information Group, Inc. Address editorial correspondence to Investing Daily, 7600A Leesburg Pike, West Building, Suite 300, Falls Church, VA 22043-2004. CHIEF INVESTMENT STRATEGIST: Roger S. Conrad; MANAGING DIRECTOR: John Persinos; INVESTMENT ANALYSTS: Jason Burack, Ari Charney, David Dittman, Jim Fink, Igor Greenwald, Khoa Nguyen, Robert Rapier, Benjamin Shepherd, Soula Stefanopoulos; DIRECTOR OF DESIGN AND PRODUCTION: Melanie Selmer; CUSTOMER SERVICE DIRECTOR: Andrea Prendergast; PUBLISHER: Phil Ash. SUBSCRIPTIONS: 24 issues, $99; in Canada, US$123; International US$201. POSTMASTER: Send address changes to: PO Box 3808, McLean, VA 22103. Send subscription-related correspondence to above address; en-close mailing label from a recent issue and a new address. For customer service, call 800-832-2330 or 703-394-4931. The information contained in Personal Finance has been carefully compiled from sources believed to be reliable, but its accuracy is not guaranteed. Investing Daily, a division of Capitol Information Group, Inc. its officers and owners, the editors of Personal Finance and their respective affiliates, or accounts managed by such persons, may from time to time have a position in investments referred to in this newsletter. Periodicals postage paid at Falls Church, VA, and additional mailing offices. Printed in U.S.A. R136740115. For permission to photocopy or use material electronically from Personal Finance, ISSN #0164-7768, please access www.copyright.com or contact Copyright Clearance Center, Inc. (CCC) 222 Rosewood Drive, Danvers, MA 01923, 978-750-8400. CCC is a not-for-profit organization that pro-vides licenses and registration for a variety of users.
Source: Bloomberg
Less Risk, More GainComparative Total Returns of the SPDR S&P 500 ETF (SPY)
and the PowerShares S&P 500 Low Volatility ETF (SPLV), 05/05/11 to 04/19/13.
SPY
SPLV
-20
-10
0
10
20
30
40%
M J J A S O N D J‘12 ‘13
F M A M J J A S O N D J F M A

www.PFnewsle t ter.com 703-394-4931 May 8, 2013 3
advise staying invested, perhaps tak-ing some profits, and approaching new positions with caution, all while heeding our PF Portfolio buy limits. Still, when “everybody” agrees, something else often happens.
While a meaningful pullback may or may not occur, what we’d really like to see is a change in market leadership.
As our “Valuation Snapshots” graph shows, the slower-growth, higher-yielding sectors (telecom services, consumer staples and utili-ties) currently are the S&P 500’s most expensive. In contrast, energy, financials and technology, all more sensitive to the broad economy, are relatively undervalued.
Recent indications of economic softness, here in the US, Europe and even China, backed by readings of lower inflation and the sharp decline in yields of Treasury securities, all sup-port the case for the strength in the market-leading, economy-resistant sec-tors. But for the stock market to keep rising, it needs meaningful participa-tion from those other groups.
Speaking of laggards, the world’s other major stock markets generally
are cheaper than ours. It would also be a big plus if they were to join chroni-cally depressed Japan, now financially juiced by a monetary policy even more aggressive than ours, in stepping up their relative performance (in dollar terms for US investors).
Keep Your BalanceA key component of successful long-
term investing is to always keep your risk in check, which in turn leads to emo-tional calm, an absolute essential when it comes to making financial decisions.
There’s no one allocation mix that’s right for everybody. Instead, ask yourself when you’ll need to draw on your invest-ment assets for living expenses. If you’re
using some of this money now to pay bills or expect to do so within five years, then you need to minimize your risk with that portion of your wealth.
Your risk tolerance—how you deal with volatility, uncertainty and price declines—is also important. And it’s essential that you adjust your asset al-
location to protect yourself when market conditions deteriorate. Risk control is vital.
That said, we currently recom-mend a general allocation of 60 percent stocks, 20 percent bonds and 20 percent cash. We’ll bring our Portfolios in line with my allocation parameters, in future issues.
Keeping so much in cash, despite its miniscule returns, is appropriate in light of weak economic growth,
huge government debt and political uncertainty in much of the world.
So there you have it: the outline of a program for growth and income that should help you maintain and strength-en your financial security in a challeng-ing world.
Philip Springer is the incoming chief in-vestment strategist of Personal Finance.
The REIT Stuff for Yield SeekersThese two real-estate investment trusts and a related ETF are advantageously leveraged to economic growth.
BY IGOR GREENWALD
Real estate in the US is one of the most promising markets in any-
thing, anywhere.Prices for residential and commer-
cial properties alike have only just begun recovering from the 2008-09 crash, and the gains appear to be gathering pace, aided by low interest rates that are not expected to budge until the economy improves dramati-cally.
Although the trend over the past year in prices and in rents has been clearly up, recently burned devel-opers have been slow to add sup-ply, preferring to let confirmed demand dictate the pace.
It’s all accrued to the advan-tage of REITs, the tax-advan-taged real estate investment trusts whose payouts and capital gains have significantly outpaced stocks and bonds in recent years.
Financial fashions can be fickle, but REITs have been clear outperformers for four decades, with the FTSE NAREIT Index
delivering a compound annual return of 12.46 percent over that span ver-sus 10.09 percent for the S&P 500 (through February).
REITs are not subject to corporate income tax on the dividends they pay shareholders, provided such dividends amount to at least 90 percent of tax-able income. Enacted in 1960 to per-mit mutual investment in commercial property, the rules have been broadly interpreted in recent years to shield from corporate taxes profit streams as
diverse as those from data centers, cell towers, prisons, mortgage bonds and casinos.
Still, most REITs stick to the famil-iar business of converting ownership of land and buildings into a predict-able, and hopefully growing, rental income stream. For frustrated Ameri-can income investors, this has been a godsend.
REITs’ average dividend yield, although much diminished at just shy of 4 percent, still comfortably
exceeds the recent 1.71 percent for 10-year US Treasuries, while offering much better protection against inflation.
REIT income and returns are tied to economic growth, another positive given the slowly improving job market and steady consumer spending gains.
As the scars from the Great Recession slowly heal, investors are venturing from the tradi-tional safe harbors of Treasuries, gold, money-market funds and
Source: Bloomberg*as of 04/19/13
Valuation Snapshots2013 Forward Price-to-Earnings (P/E) Ratios of Major Sectors*
0 5 10 15 20 25
Energy Materials Industrials
Consumer Discretionary Consumer Staples
Health Care Financials
Information Technology Telecommunication Services
Utilities S&P 500
Source: Bloomberg
The REIT WayComparative Total Returns of the PowerShares KBW Premium Yield Equity REIT ETF (KBWY), Vanguard REIT Index ETF (VNQ), and the S&P 500 Index (SPX), 04/23/12 to 04/22/13.
VNQ
KBWY
SPX
-10
0
10
20
30
40
50%
A M J J A S O N D J‘13
F M A

PERSONAL FINANCE4 May 8, 2013
saving accounts into the stock mar-ket’s tempting but turbulent waters. Many have been naturally drawn to REITs for their regular payouts, high historic returns and relative transpar-ency.
In the current economic environ-ment, a steady 4 percent yield with the potential for growth as well capi-tal appreciation sounds awfully good to a great many.
Detractors keep warning that when the Federal Reserve finally starts rais-ing rates one of these years, REITs will get crushed. But the historical record argues otherwise.
REITs saw big annual gains in 2000, 2004 and 2006, even as interest rates climbed, and they broke even during the 1994 bond rout. The bad years in 1990 and 2007-08 coincided with real estate slumps, while in 1998 REITs also got clubbed while interest rates fell.
Nonetheless, REITs will clearly need to increase their distribu-tions to remain competitive when rates do rise. That will be easier for those in sectors lever-aged to higher economic growth. And smaller, riskier REITs may also grow faster than big, safe ones.
These are exactly the sorts of REITs that are winning the current chase for yield. They’re likely to continue win-ning it while rates stay low, as long the economy keeps healing.
For proof, look no further than the recent performance gap between a market-cap weighted US REITs proxy such as the Vanguard REIT ETF (NYSE: VNQ) and a yield-attuned one such as the PowerShares KBW Premium Yield Equity REIT Port-folio (NYSE: KBWY).
Unlike the Vanguard fund, KBWY is weighted by yield from among 24 to 40 small-cap and midcap REITs. (See “The REIT Way.”)
KBWY’s monthly distributions in 2013 work out to an annual yield of 4.5 percent, while VNQ yields 3.4 percent on a trailing basis. The gap would have been wider still but for the fact that KBWY has risen 20 percent so far this year, versus 12.5 percent for VNQ and 11 percent for the S&P 500 (all figures as of April 25.)
With low interest rates and the recovery in real estate prices muting credit risk, buyers have clearly gravi-tated toward the largest payouts. Buy the PowerShares KBW Premium
Yield Equity REIT Portfolio below 37.
The yield chase has also turned health care, retail, and diversified RE-ITs, with their above-average yields, into some of this year’s biggest win-ners. (See “How They Stack Up.”)
Freestanding retail REITs, which specialize in leasing single-tenant properties, have been on the move in April, tacking on 8 percent to trade nearly 25 percent higher on the year. Regional mall REITS gained more than 9 percent between March 28 and April 24.
The freestanding retail REIT category includes perennial champ National Retail Properties (NYSE: NNN), a provider of triple-net single-occupant leases to retail chains that leave all maintenance expenses as the tenant’s responsibility.
National’s occupancy rate stood just shy of 98 percent at the end of last year, and though its units are up 26 percent year-to-date, they still yield an enticing 4.1 percent.
The REIT grew funds from op-erations by more than 8 percent in each of the last two years, and has increased annual distributions for 23 years in a row.
National’s leases run for 15 to 20 years, the sort of commitment palatable only to the strongest and fastest growing retail chains. Only 7 percent of current leases are up before 2016. Market cap leverage is modest at 31 percent.
National’s long, strong dividend record is matched only but its history of capital gains, which have averaged more than 13 percent annually over the last two decades. Buy National Retail Properties below 43.
Lodging and resort REITs also have extensive leverage to economic growth and have performed well this year, led by Hospitality Properties
Trust (NYSE: HPT), which is up 21 percent in 2013 yet still yields 6.7 percent.
Hospitality Properties owns nearly 300 hotels in the US, Canada and Puerto Rico, managed by such lead-ing brands as Marriott, Intercontinen-tal, Hyatt, Sonesta and Wyndham.
Hospitality Properties also owns 145 highway rest stops managed by TravelCenters of America (NYSE: TA), a business that has gained no-table momentum in recent months.
Many of Hospitality Properties’ agreements with hotel operators
include rent guarantees in the event the business sours, yet of-fer incentives if revenue exceeds minimum thresholds. The latter will be more relevant than the former in the current environ-ment.
Revenue per available room (RevPAR), a key hotel indus-try metric, was up 8.4 percent year-over-year in the most recent quarter, as occupancy rose to 68.8 percent and average day rates climbed 6.1 percent.
Recently renovated hotels delivered RevPAR gains of more
than 12 percent, and once Hospitality Properties completes its extensive re-modeling program in 2014, it should have more scope to increase distribu-tions.
In February, Hospitality Properties announced it would invest $375 mil-lion in the Latin American, European and US holdings of a Spanish hotel group. In March, it completed an equity offering raising much of that contribution.
The discount on Hospitality Proper-ties relative to other lodging REITs may have to do with its management by Reit Management & Research (RMR), an outside adviser owned by Barry Portnoy and his son Adam Portnoy.
RMR is also the outside man-ager of the CommonWealth REIT (NYSE: CWH), and in that context has been accused by hedge funds of mismanaging CommonWealth to its private benefit.
However, it would be hard to levy the same charge over RMR’s man-agement of Hospitality Properties, which has delivered strong returns that should only get stronger. Buy Hospitality Properties Trust be-low 33.
Igor Greenwald is an investment analyst at Personal Finance and The Energy Strategist.
Source: MorningstarYear to Date: 01/02/13 to 04/19/13
How They Stack UpComparative Total Returns of REITs by Sector.
0% 10% 20% 30% 40% 50%
Diversi�ed
Health Care
Hotel & Motel
Industrial
Of�ce
Residential
Retail
3-Year
1-Year
YTD*

www.PFnewsle t ter.com 703-394-4931 May 8, 2013 5
You probably think that socially re-sponsible investing (SRI) is all about
avoiding “sin” stocks that benefit from tobacco, alcohol, weapons, gambling, and the like. Think again.
The focus now is on factors that are much more related to stock perfor-mance: environmental, social and gover-nance issues, collectively known as ESG.
The premise is that companies with poor worker-safety records or absentee Boards are more exposed to such risks as costly litigation, fines, high employee turnover, and bad public relations that can hurt sales.
Recent case in point: The deadly garment factory collapse in late April in Bangladesh, and its adverse fallout for clothing retailers based in the US and Europe.
By contrast, the top ESG scorers are likely to be innovators and market leaders.
Stock-performance data back up such claims. From 2006 to 2010, investors would have added 2 percentage points annually to their returns by investing only in US companies with above-aver-age ESG ratings, says a study by RCM, part of the giant investment firm Allianz Global Investors.
In a 2005 to 2007 study, Goldman Sachs (NYSE: GS) found that adding ESG screening led to stock returns that were 25 percent higher, on average.
Consequently, an increasing number of institutional investors are incorpo-rating ESG screening, using ratings provided by a slew of third parties and indexes.
This year, for example, California’s two largest pension funds (CalPERs and CalSTERs) both added an ESG compo-nent to their investment process.
The Parnassus AdvantageUnless you’re capable of doing your
own research, the only way to add an ESG component to your portfolio is through an actively managed Socially
Responsible Investing (SRI) fund.However, the vast majority of SRI
funds are unlikely to provide any monetary benefit to a stock portfolio. They tend to be long-term underper-formers with above-average fees and/or overly concentrated in sectors such as technology.
One of the exceptions is San Francis-co-based Parnassus Equity Income Fund (PRBLX), which has already been discovered by institutional investors. Assets were almost $6 billion recently, making PRBLX the largest SRI fund. Still, all the new money doesn’t seem to have affected this fund’s performance or investment approach.
Founded in 1984, Parnassus Invest-ments is first and foremost a value-in-vesting shop that uses ESG screening as an added layer of downside protection.
On the firm’s 12-member research team, to which all the fund managers belong, three analysts focus exclusively on ESG screening, using an in-house rating system as well as information from third parties.
The results have been impressive. Of Parnassus’ five stock funds, three garner Morningstar’s coveted five-star rating, including PRBLX.
Launched in 1992, PRBLX has gained about twice as much as the S&P 500 during the past 15 years. During 2008, when the S&P 500 sank 37 percent, PR-BLX was down much less—23 percent. (See “Long-Term Winner”.)
In fact, longtime manager Todd Ahlsten, who has most of his own net worth in PRBLX, says he spends most of his time figuring out how to avoid losing money.
Therefore, most of PRBLX’s 40 or so holdings are large, dividend-paying companies, such as Procter & Gamble (NYSE: PG), PepsiCo (NYSE: PEP) and Waste Management (NYSE: WM), which is expanding into recycling.
The fund also features wide sec-
tor diversification: 24 percent is in industrials; 23 percent, consumer staples; 14 percent, technology; and 12 percent, health care.
The stake in industrials is largely positions in market-leading logistics and infrastructure companies whose massive distribution networks are leveraged to a pick-up in economic growth. Included here are Expedi-tors International (NSDQ: EXPD), CH Robinson (NSDQ: CHRW) and Praxair (NYSE: PX).
A major new position is in PF Growth Portfolio pick Mondelez International (NSDQ: MDLZ). Parnassus likes Mon-delez’s competitive advantage in global snack foods, also noting that it has been a leader in nutrition labeling and educa-tion, low-calorie alternatives and has a highly rated workplace.
Unlike many SRI funds, PRBLX doesn’t avoid the energy sector, where its focus now is on US natural gas stor-age, distribution and utilities.
Whistling While They WorkTwo smaller Parnassus funds also
merit consideration, although they’re not as diversified: Parnassus Mid-Cap (PARMX), a smaller-stock ver-sion of Parnassus Equity Income, and Parnassus Workplace Fund (PAR-WX), both launched in 2005.
The Workplace Fund seeks out companies with stellar working envi-ronments, the idea being that happy employees will work harder and be more loyal. Recently, the top holding was credit card company Capital One Financial (NYSE: COF).
To the surprise of many, the Work-place Fund has been a top performer, up more than 10 percent annually the past five years versus just under 5 percent for the S&P 500.
Soula Stefanopoulos is an investment ana-lyst at Personal Finance and Benjamin Shepherd’s Wall Street.
The New Role of SRI FundsNo longer just for “do-gooders,” socially responsible investing is increasingly used to minimize risk and enhance returns.
BY SOULA STEFANOPOULOS
Long-Term Winner Recent Total Return Expense AssetsFund Symbol Yield (Annualized) Ratio ($ Billions) Year-to-Date 3 yr 5 yr 10 yr 15 yr 2008 Parnassus Equity Income PRBLX 2.3% 11.7% 10.9% 7.6% 9.2% 8.8% -23.0% 0.9% $5.9S&P 500 n/a 2.1 9.7 11.4 4.6 7.9 4.1 -37.0 n/a n/a
*Data as of 04/19/2013. Source: Morningstar.

PERSONAL FINANCE6 May 8, 2013
Is the glass half empty or half full? That’s the question analysts are ask-
ing, as they ponder mixed economic indicators. As investors, we prefer to pose the question differently: How can we make the glass bigger?
Some of the latest first-quarter earnings reports from our Growth Portfolio are less than stellar, but all of our holdings nonetheless face brighter days ahead. Here are the highlights.
Baxter International (NYSE: BAX) reported that first-quarter earnings fell 6.1 percent to $552 million, for $1.05 in earnings per share (EPS), stemming from charges related to its acquisition in December of medical equipment maker Grambro AB for $2.8 billion. Growth in emerging markets helped drive revenue up 1.8 percent to $3.6 billion.
Baxter’s earnings guidance for 2013 is $4.60 to $4.70 in EPS, which includes the impact of the Gambro acquisition.
Baxter develops, manufactures and markets treatments for hemophilia, im-mune disorders, infectious diseases, kid-ney disease, trauma, and other complex medical conditions.
These diseases and ailments represent a huge market in every country in the world, providing Baxter with substantial growth opportunities. Baxter Interna-tional is a buy up to 73.
Honeywell International (NYSE: HON) reported first-quarter earnings reached $966 million, an increase of 17 percent compared to the previous quarter. Revenue remained flat at $9.3 billion.
Honeywell’s bottom line was enhanced by healthy gross margins of 16.2 percent, an increase of 15.2 percent from the previous year. The company’s $1.21 in EPS beat analysts’ estimates of $1.14 in EPS.
Honeywell will benefit from the up-surge in aerospace activity this year, in both the civilian and military sectors.
The company produces cockpit technology for airliners and jet fight-ers. Robust overseas demand for these aircraft in Asia should offset any
Pentagon cutbacks or US economic slowdown.
Honeywell also makes cybersecurity products that are growing in popularity, as corporations and government agencies step-up efforts to fight hacking.
Management raised its full-year earnings guidance to $4.80 to $4.95 in EPS, up from $4.75 to $4.95. Honeywell International is a buy up to 70.
Johnson & Johnson’s (NYSE: JNJ) first-quarter earnings reached $3.5 bil-lion, a decline of 11 percent from the same period a year ago, mostly due to a $600 million one-time item associated with the acquisition last June of Synthes.
Synthes offers programs and services to help hospitals better manage the purchasing process. The company’s acquisition dovetails with Johnson & Johnson’s product mix and also reflects the growing trend toward third-party administration of health care provision.
Johnson & Johnson’s first-quarter revenue hit $17.5 billion, an increase of 8.5 percent from the year-ago quar-ter and slightly beating Wall Street’s estimate of $17.4 billion. Earnings came in at $4.1 billion, up 8 percent from the year-ago quarter.
The company’s first-quarter growth was driven by strong sales of its over-the-counter medicines, which increased 2.2 percent quarter-over-quarter to $3.7 billion, as well as a 10 percent jump in medical device sales due to the addition of Synthes. John-son & Johnson is a buy up to 75.
Philip Morris International’s (NYSE: PM) first-quarter earnings fell 1.7 percent to $2.1 billion or $1.28 in EPS, missing analysts’ estimates of $1.34 in EPS. The drop stemmed from a 6.5 percent decline in cigarette shipments to 205 billion units during the quarter.
Sales in Europe dropped 10 percent quarter over quarter, because of reces-sions throughout the Continent. Sales in Asia also fell 10 percent, as lagging volumes in the Philippines pulled
down the entire region.The big surprise from Philip Morris
was the decline in popularity of the company’s iconic Marlboro brand, which experienced a 4.8 percent drop in shipments during the quarter, as it fell victim to aggressive price under-cutting by competitors.
On March 13, the company an-nounced that COO André Calantzo-poulos will become its CEO immedi-ately following its shareholder meeting on May 8. Current Chairman and CEO Louis Camilleri will remain as chairman of the board.
Philip Morris lowered its full-year guidance to $5.55 to $5.65 in EPS, down from $5.68 to $5.78. Nonethe-less, we think the Western tastes of an expanding middle class overseas con-tinue to bode well for the company. Philip Morris International remains a buy up to 95.
Union Pacific’s (NYSE: UNP) first-quarter earnings were lifted by higher rates, despite a drop of 2 percent in coal and agricultural shipments. Earn-ings were $957 million, or $2.03 in EPS, up 11 percent from the same year-ago quarter. Revenue was $5.3 billion, a year-over-year increase of 3.7 percent, beating analysts’ expectations.
Despite the decrease in coal demand and concomitant shipments, the com-pany expects overall shipping volumes to rise in tandem with the improving economy. Union Pacific is a buy up to 135.
John Persinos is managing director of Per-sonal Finance and its parent website, In-vesting Daily.
Through a Glass, BrightlyThe latest earnings reports from our Growth holdings bring mixed tidings, but the companies still enjoy solid prospects.
BY JOHN PERSINOS
GROWTH TRACK
Source: Bloomberg
Intel Corp (NSDQ: INTC)Stock price, 04/24/12 to 04/19/13
18
20
22
24
26
28
$30
A M J J A S O N D J‘13
F M A

www.PFnewsle t ter.com 703-394-4931
Best Buy: IntelIntel Corp (NSDQ: INTC), the
world’s largest semiconductor maker, has been struggling over the past year (see stock price graph, page 6). How-ever, we think the company’s growth prospects make its stock a rare bargain.
The company reported that first-quarter earnings fell 25 percent to $2 billion, due to lower sales of its PC chips, as laptop sales continue to plum-met in the face of competition from smartphones, tablets and other mobile devices.
Intel’s first-quarter revenue was $12.6 billion, a fall of 3 percent from the same year-ago quarter, largely stemming from the company’s PC Cli-ent segment year-over-year drop of 6 percent to $8 billion.
Nonetheless, the company boosted its sales of high-end chips for data centers by 7 percent, to $2.6 billion for the quarter.
Global PC shipments dropped 14 percent compared to the year-ago quarter, their largest decline since 1994.
Intel has suffered greatly from its tardiness in getting aboard the smart-phone revolution, but it’s now making up for lost time, plowing considerable amounts of its huge research and development (R&D) war chest into ever-faster chips for ever-smaller devices.
Intel intends to spend $13 billion on R&D in 2013, compared to $10.2 billion in 2012 and $8.4 billion in 2011. The company’s Mobility Group manufactures and produces proces-sors for notebook computers and all other mobile devices and will continue to represent a growing percentage of total revenue.
The Mobility Group in the second quarter plans to begin shipping next-generation Haswell chips, which are used in mobile devices such as the company’s Ultrabooks. Based on this shift in emphasis, the company released a relatively positive outlook of 0.4 percent sales growth in 2013 to $53.5 billion.
We haven’t lost faith in Intel’s ability to reinvent itself and remain innovative. In addition to resetting its course for mobile devices, the company also is a major player in the booming cyber-security market and is poised to profit from growing concerns over hacking.
According to a 2012 report released by the Norton consultancy, the global price tag for cybercrime is $110 billion annually, in the form of fraud, theft, repairs and loss.
Intel recently announced its leading role in a research consortium tasked with devising new security solutions for organizations of all types. Intel Corp is a buy up to 29.50.
The following advice is suitable for investors who seek long-term capital appreciation. The Growth Portfolio is a top-down portfolio that tracks the 10 S&P 500 sectors. The Growth Portfolio’s allocation to each sector reflects our outlook for the group. New subscribers should consider allocating funds to the top-listed names in the sec-tors with the heaviest weighting.
Security Date Recent Total(Exchange: Symbol) Added Price* Yield* Return+ Advice# Analyst
Consumer Staples (Growth Portfolio Allocation: 19.0%, S&P 500 Weighting: 11.4%*) Diageo (NYSE: DEO) 09/14/11 $123.12 1.8% 64.3% Buy < 115 NguyenHillshire Brands (NYSE: HSH) 06/28/12 35.62 1.4 5.0 Buy < 35 DittmanKimberly-Clark Corp (NYSE: KMB) 03/25/09 105.49 3.1 165.3 Buy < 95 DittmanKraft Foods (NSDQ: KRFT) 10/03/12 51.19 3.9 15.9 Buy < 45 FinkMondelez International (NSDQ: MDLZ) 03/28/12 31.86 1.6 31.4 Buy < 27 FinkPhilip Morris International (NYSE: PM) 06/27/12 93.60 3.6 13.5 Buy < 95 Nguyen
Energy (18.0%, 10.5%) EOG Resources (NYSE: EOG) 12/10/08 117.00 0.6 63.7 Buy < 125 RapierLinn Energy LLC (NSDQ: LINE) 12/13/06 38.95 7.4 129.8 Buy < 40 RapierSeaDrill (NYSE: SDRL) 05/26/10 36.35 9.4 118.5 Buy < 45 RapierTortoise Energy Infrastructure (NYSE: TYG) 12/13/06 46.21 4.9 101.3 Buy < 44 Rapier
Health Care (17.0%, 13.0%) Allergan (NYSE: AGN) 03/28/12 114.09 0.2 21.6 Buy < 100 ShepherdBaxter International (NYSE: BAX) 12/10/08 69.85 2.6 51.6 Buy < 73 ShepherdBayer (OTC: BAYZF, BAYRY) 09/10/03 101.55 2.4 483.8 Buy < 90 ShepherdJohnson & Johnson (NYSE: JNJ) 10/12/11 85.45 2.9 40.1 Buy < 75 ShepherdNovartis (NYSE: NVS) 12/10/08 73.23 2.8 95.9 Buy < 65 Shepherd
Information Technology (15.0%, 17.4%) Apple (NSDQ: AAPL) 04/03/13 406.13 3.0 -6.0 Buy < 480 PersinosCisco Systems (NSDQ: CSCO) 02/24/10 20.91 3.3 -10.1 Buy < 23 PersinosIntel (NSDQ: INTC) 04/11/12 23.38 3.9 -12.9 Buy < 29.50 PersinosQualcomm (NSDQ: QCOM) 01/12/11 65.35 2.1 29.3 Buy < 70 Persinos
Materials (10.0%, 3.3%) BHP Billiton (NYSE: BHP) 08/25/10 64.50 3.5 7.0 Buy < 100 DittmanBunge (NYSE: BG) 05/10/06 68.88 1.6 23.2 Buy < 75 ConradGoldcorp (NYSE: GG) 12/24/08 27.75 2.2 0.4 Buy < 55 ConradMonsanto (NYSE: MON) 11/12/08 103.75 1.4 41.6 Buy < 90 Conrad
Industrials (9.0%, 9.8%) ABB (NYSE: ABB) 03/10/10 21.72 3.3 12.8 Buy < 29 ConradDeere & Co (NYSE: DE) 03/23/11 84.78 2.4 -2.7 Buy < 100 DittmanHoneywell International (NYSE: HON) 05/11/11 74.76 2.2 28.5 Buy < 70 PersinosIllinois Tool Works (NYSE: ITW) 05/12/10 62.76 2.4 32.2 Buy < 65 ConradUnion Pacific (NYSE: UNP) 12/14/11 147.43 1.9 53.5 Buy < 135 Shepherd
Financials (6.0%, 16.0%) Discover Financial Services (NYSE: DFS) 11/24/10 44.33 1.8 144.2 Buy < 42 DittmanHDFC Bank (NYSE: HDB) 08/26/09 41.39 0.5 115.1 Buy < 37 Dittman
Consumer Discretionary (4.0%, 11.8%) Home Depot (NYSE: HD) 07/11/12 73.38 2.1 44.2 Buy < 60 ConradScripps Networks Interactive (NYSE: SNI) 02/23/11 67.43 0.9 33.4 Buy < 60 Conrad
Telecom Services (2.0%, 3.2%) China Mobile (NYSE: CHL) 02/11/09 53.17 3.9 31.0 Buy < 60 Conrad
Utilities (0.0%, 3.6%)
*As of 04/23/13, close. Estimated yields for the next 12 months can differ from actual dividends because of com-pany policy. Estimated yields based on company filings because a full year’s dividends have not yet been paid. +Re-turns are calculated from the date added. Returns for sold stocks are the returns on the date they were sold. Sold stocks will continue to appear in the Portfolio for two subsequent issues. #Buy at or below prices given. All buy prices are in US dollars. Hold means we’re looking to convert the advice to a buy or a sell within the next two months. We consider our Portfolio to consist of all stocks rated either buy or hold.
To buy all or part of the Growth Portfolio in one transaction, go to PFnewsletter.com/Folio. To ask questions about Folio Investing, please call 1-888-973-7890.
Personal Finance and Folio Investing do not have a financial relationship.
G R O W T H P O R T F O L I O
May 8, 2013 7

PERSONAL FINANCE8 May 8, 2013
With the market trading just below its all-time high, many of the stocks
in our Income Portfolio are priced near or well above our buy targets. As such, investors should patiently wait for stocks to drop below these targets before build-ing new positions or adding to existing positions.
If you can avoid chasing our stocks higher, you’ll eventually have the op-portunity to buy shares at a discount to our estimate of fair value, while locking in yields at a higher rate. That’s the key to producing solid gains in growth and income over the long term.
Now that earnings season is underway, the good news is that our stocks’ un-derlying companies are largely perform-ing well in what remains a challenging economy.
After enduring a difficult fourth quarter in which expenses relating to Superstorm Sandy as well as employee pensions significantly eroded its bot-tom line, Verizon Communications (NYSE: VZ) bounced back by growing first-quarter earnings to $0.68 per share, a 15.3 percent jump from a year ago.
The wireless segment’s historic quarter resulted in record margins of 32.9 percent on $6.4 billion in operat-ing income. Verizon’s investment in broadening its 4G LTE (long-term evolution) network successfully enticed new customers, whose demand for data-intensive wireless broadband and video continues expanding with each advance in smartphone technology.
The company added 677,000 retail postpaid customers to its rolls, the most ever in any quarter, which increased its postpaid base to 93.2 million.
Verizon’s average revenue per account climbed 6.9 percent, to $150.27 per month, thanks to its Share Everything Plan, which allows customers to add multiple devices to each account and now represents 30 percent of all retail postpaid accounts.
Equally important, smartphone pen-etration rose to 61.4 percent of the postpaid customer base, a significant 14.6 percentage point improvement from a year ago.
By contrast, the wireline segment’s margins thinned to 0.1 percent on
just $13 million in operating profits. The one major bright spot was a 15.1 percent rise in revenue from its FiOS business, which offers digital video, telephone and Internet service via a fiber-optic network.
Roughly 26.5 percent of the fixed-line segment’s $9.8 billion in revenue was derived from FiOS, and the ser-vice added 188,000 Internet connec-tions and 169,000 video connections during the quarter for growth of 12 percent and 12.5 percent, respectively.
The strength of the wireless unit enabled Verizon to generate a substantial $3.9 billion in free cash flow, up 64.3 percent year over year. The company ended the quarter with $5.5 billion in cash on its balance sheet.
Although Verizon’s shares still yield an attractive 4 percent, income-hungry investors have pushed the stock well above our buy target of 45.
Project-Driven GrowthAtlanta, Ga.-based electric utility
Southern Co’s (NYSE: SO) shares suf-fered a modest decline after the compa-ny took a $333 million after-tax charge ($0.38 per share) against first-quarter earnings due to higher projected costs for constructing its new integrated gasifi-cation combined cycle (IGCC) facility in Kemper County, Miss.
The company intends to fully absorb the higher costs incurred by the project, rather than petition state regulators to further increase custom-ers’ base rates.
Excluding after-tax charges, South-ern’s earnings per share (EPS) grew 16.7 percent year over year, to $0.49. Although winter was still warmer than average, the season came closer to normal temperatures than last year.
In fact, management attributes a majority of the $0.07 increase in EPS to cooler weather, as heating degree days, a measurement that reflects demand for heating energy, jumped 54 percent from a year ago.
As a result, kilowatt-hour sales to retail customers in Southern’s four-state service area climbed 2.3 percent and residential energy sales rose 8.3 percent.
In addition to its IGCC project, Southern is also building two new nuclear reactors at its Vogtle site in Georgia. Management reports that overall construction is now more than 40 percent complete.
Beyond Southern’s huge investment in new projects, management also sees a strengthening regional economy as an important growth driver. Dur-ing the quarter, the company added 13,000 new residential customers of which about half were new connec-tions resulting from a rebound in the real estate market.
Southern’s steady performance enabled management to increase its quarterly payout by 3.6 percent, to an annual rate of $2.03 per share.
Southern’s shares yield 4.1 percent, but the stock currently trades almost 7 percent above our buy target of 45.
Italian super oil Eni’s (NYSE: E) first-quarter profits fell 42.1 percent from a year ago, to EUR1.4 billion, due to lower crude oil prices as well as disruptions to operations in Libya, Nigeria and the UK. Consequently, oil and natural gas production fell 4.9 percent to 1.6 million barrels of oil equivalent (BOE) per day.
However, those issues have been largely resolved—Libyan production is back to around 260,000 BOE per day and pipelines in Nigeria damaged during last year’s floods have been repaired.
Given Eni’s robust investment in growth projects in countries such as Kazakhstan, Angola and Algeria, man-agement has reiterated its guidance for full-year 2013 production to rise to 1.7 million BOE per day.
In March, Eni agreed to sell a 28.6 percent stake in its East African op-eration to China National Petroleum Corp in a USD4.2 billion deal. Eni’s subsidiary holds a 70 percent interest in a major natural gas field off Mozam-bique’s shore.
Eni’s shares are down almost 11 percent from their 52-week high and currently yield 4.6 percent. Eni remains a buy up to 50.
Ari Charney is an investment analyst at Personal Finance.
Investing to GrowOur Income picks boast strong businesses that are holding them in good stead amid challenging conditions.BY ARI CHARNEY
INCOME REPORT
www.PFnewsle t ter.com 703-394-4931
The following investment advice is suitable for investors who seek a high level of current income while preserving wealth. Typically, these types of investors are retired or less than five years from retirement.
Stocks and Preferreds (70%) Date Recent Total Name (Exchange: Symbol) Recomm. Price* Yield* Return+ Advice# Analyst
Asia CLP Holdings (OTC: CLPHY) 08/13/08 $8.75 5.8% 24.0% Buy < 9 Conrad
Australia AGL Energy (ASX: AGK, OTC: AGLNY) 10/24/12 15.66 5.7 10.8 Buy < 16 DittmanAPA Group (ASX: APA, OTC: APAJF) 10/12/11 6.58 5.4 68.6 Buy < 5.50 Dittman
Canada Canadian Apt Prop REIT (OTC: CDPYF) 10/12/05 24.62 4.4 225.3 Buy < 24 DittmanVermilion Energy (OTC: VET) 04/14/04 47.44 4.9 518.8 Buy < 52 Dittman
Electric Utilities Dominion Resources (NYSE: D) 08/05/87 61.01 3.7 1,647.4 Buy < 55 ConradExelon Corp (NYSE: EXC) 08/15/12 36.87 3.4 1.0 Buy < 35 ConradSouthern Co (NYSE: SO) 07/09/97 48.65 4.2 674.0 Buy < 45 ConradXcel Energy (NYSE: XEL) 09/24/08 30.93 3.5 84.4 Buy < 26 Conrad
Financials Arrow Financial Corp (NSDQ: AROW) 12/24/08 23.84 4.2 34.2 Buy < 28 Dittman
Health Care Bristol-Myers Squibb (NYSE: BMY) 02/10/10 42.30 3.3 103.7 Buy < 34 Shepherd
Metals Freeport-McMoRan Copper & Gold (NYSE: FCX) 05/09/12 28.52 4.4 -16.8 Buy < 42 Conrad
Master Limited Partnerships Alliance Resource Partners (NSDQ: ARLP) 11/28/12 66.95 6.6 22.3 Buy < 62 ConradEnterprise Products Partners LP (NYSE: EPD) 12/13/06 61.37 4.3 207.6 Buy < 56 CharneyEnergy Transfer Partners (NYSE: ETP) 05/23/12 48.58 7.4 13.6 Buy < 50 ConradGenesis Energy LP (NYSE: GEL) 06/09/10 47.98 4.1 215.7 Buy < 35 ConradSpectra Energy Partners LP (NYSE: SEP) 06/24/09 37.62 5.3 126.3 Buy < 34 Charney
Preferred Stocks AES Corp 6.75% Pref C (NYSE: AES C, CUSIP: 00808N202)** 02/08/06 50.34 6.7 42.9 Buy < 50 ConradCons Energy $4.50 Pref B (NYSE: CMS B, CUSIP: 210518304)** 02/28/01 99.00 4.5 148.7 Hold Conrad
Real Estate Investment Trusts WP Carey (NYSE: WPC) 11/07/12 68.74 4.8 44.9 Buy < 55 Conrad
Super Oils Chevron Corp (NYSE: CVX) 03/28/90 117.48 3.1 1,439.2 Buy < 105 ConradEni (NYSE: E) 01/14/09 46.10 6.0 38.2 Buy < 50 ConradTotal (FP: FP, NYSE: TOT) 11/07/12 47.92 6.3 1.3 Buy < 55 Conrad
Telecommunications Services Verizon Communications (NYSE: VZ) 08/17/87 52.32 3.9 898.1 Buy < 45 ConradWindstream (NSDQ: WIN) 12/28/11 8.73 11.5 -15.0 Buy < 11 Conrad
Bonds (20%) ***
Cash (10%)
*As of 04/23/13, close. Estimated yields for the next 12 months can differ from actual dividends because of com-pany policy. +Returns are calculated from the date added and can be volatile due to significant price and dividend moves. Returns for sold stocks are the returns on the date they were sold. Sold stocks continue to appear in the Portfo-lio for two subsequent issues. #Buy at or below prices given. All buy prices are in US dollars. Hold means we’re looking to convert the advice to a buy or a sell within the next two months. We consider our Portfolio to consist of all stocks rated either buy or hold. **Call dates and prices for the preferreds are as follows: AES Corp 05/21/13, $50.00; and Cons Energy 05/23/13 $110.00. *** See Fund Portfolio Bond Selections.
To buy all or part of the Income Portfolio in one transaction, go to PFnewsletter.com/Folio. To ask questions about Folio Investing, please call 1-888-973-7890.
Personal Finance and Folio Investing do not have a financial relationship.
Best Buy: Freeport- McMoRan
Over the past two weeks, Freeport-McMoRan Copper & Gold’s (NYSE: FCX) shares fell as much as 19.9 per-cent from their intra-day high on April 9, as gold and copper prices tumbled amid a fear-driven selloff.
Copper traders worried about what China’s slowdown portends for the global economy. And gold traders panicked at the prospect of troubled European countries following Cyprus’ lead by liquidating gold reserves to finance bailouts.
However, positive economic data caused copper prices to rebound 3.4 percent from the 18-month low they hit on April 23, with May futures recently settling at $3.24 a pound.
Reports of strong central bank demand for gold pushed the yellow metal up 7.8 percent from its intra-day low on April 15, with the contract for June delivery settling at $1,462 per troy ounce.
Freeport’s shares have similarly recovered, rising 9.6 percent since hitting a 52-week low on April 18, although they’re still down almost 32 percent from their 52-week high.
The mining giant, which is one of the few pure-plays on copper, derived 79.4 percent of its $18 billion in revenue last year from the red metal, while gold and molybdenum account-ed for 9.4 percent and 6.7 percent of revenue, respectively.
Although Freeport’s first-quarter profits fell 15.2 percent, to $648 million, that was still good enough to beat analyst estimates, thanks in part to cost-containment as well as copper production that exceeded manage-ment’s earlier forecast.
Management expects to sell 4.3 bil-lion pounds of copper in 2013 versus 3.6 billion pounds last year, with net cash costs averaging $1.45 per pound, down almost 6 percent from a year ago.
After a dismal 2012 in which earn-ings per share (EPS) fell almost 36 per-cent, analysts expect Freeport’s EPS to rise nearly 20 percent this year. But the company’s bid to diversify its resource portfolio into oil and natural gas is clouding this picture considerably.
Disgruntled shareholders could force Freeport to walk away from its pending acquisitions of Plains Exploration & Production Co (NYSE: PXP) and Mc-MoRan Exploration Co (NYSE: MMR), especially if shareholders of the former require a sweetener.
While risk-averse investors should steer clear of Freeport’s stock until this uncertainty has lifted, it offers a worthwhile contrarian play for income investors with an aggressive streak. Buy Freeport-McMoRan Copper & Gold up to 42.
I N C O M E P O R T F O L I O
May 8, 2013 9

PERSONAL FINANCE10 May 8, 2013
The global growth engine of China is showing signs of slowing, but Japan’s
economy appears poised to accelerate, thanks to its newly implemented stimulus program.
As a result of that shifting growth dynamic in Asia, our position in iShares MSCI All Country Asia ex Japan (NSDQ: AAXJ), which includes a hefty allocation to Chinese equities and no ex-posure to Japan, has been badly lagging not only emerging market indexes but developed market indexes as well.
While both economic and political risk remains high in the region, I’ve decided to take advantage of the recent swoon in many Asian markets to swap out iShares MSCI All Country Asia ex Japan and take a slightly more aggressive stance.
China and India figure prominently in the portfolio of SPDR S&P Emerging Asia Pacific (NYSE: GMF) at 35.7 per-cent and 15.9 percent respectively, but its geographic allocation also includes Indo-nesia, Malaysia, Thailand, the Philippines and Taiwan.
The economies of those countries
typically grow between 5 percent and 6 percent annually, with the exception of Taiwan, which usually averages closer to 4 percent. Moreover, they all boast con-siderably more attractive demographic profiles than Japan or even China.
Their citizens skew younger, with median ages in the early-30s, and they’re relatively well educated for the region, attracting new manufacturers and other businesses. These increasingly affluent consumers are intent on spending money on the perceived “good life.”
As a result, the economies of these countries are decoupling from those of China or other Asian nations, leaving them increasingly insulated from the risk of a regional slowdown.
These countries also have ample foreign currency reserves, strong foreign investment inflows and healthy govern-ment balance sheets, with relatively little debt. Consequently, even if the Chinese economy does slow, they should be the real outperformers in the region.
I look for the fund to benefit not only from strong economic growth but also
from currency appreciation, because the fund doesn’t hedge out currency risk.
From a sector perspective, financial companies account for 28 percent of the fund’s assets, followed by a 19.8 percent allocation to information technology and a 10.7 percent slice devoted to energy firms.
Financials and energy both play key roles in economic development and, historically, have been among the top performers in the Asian equity markets.
SPDR S&P Emerging Asia will also be slightly less volatile than iShares MSCI All Country Asia ex Japan, with a lower beta and standard deviation over the trailing 3 years.
Sell iShares MSCI All Country Asia ex Japan and buy SPDR S&P Emerg-ing Asia.
Benjamin Shepherd is an investment ana-lyst at Personal Finance and chief invest-ment strategist of Benjamin Shepherd’s Wall Street.
Buying into Emerging AsiaWe look at the best ways now for fund investors to profit from Asia’s growth.
BY BENJAMIN SHEPHERD
The following investment advice is suitable for investors who seek capital appreciation and current income.Funds Date Recent Dividend Total(Symbol, Phone Number) Added Price* Yield* Return+ Type
Alerian MLP ETF (NYSE: AMLP) 06/13/12 $17.87 5.8% 19.6% MLPEGShares Dow Jones Emerging Markets Consumer Titans (NYSE: ECON) 11/10/10 27.00 0.4 19.2 Sector ETFSELL - iShares MSCI All Country Asia ex Japan (NSDQ: AAXJ) 01/13/10 58.55 0.0 8.0 Asia PacificiShares S&P Global Healthcare (NYSE: IXJ) 02/10/10 76.78 1.4 64.0 Health CareiShares S&P Latin America 40 Index (NYSE: ILF) 02/13/13 42.68 1.6 -4.2 Latin AmericaMatthews Asia Dividend (MAPIX, 800-789-2742) 07/09/09 15.83 3.5 82.7 Asia PacificPRIMECAP Odyssey Growth (POGRX, 800-729-2307) 08/26/09 20.40 0.5 71.3 Large GrowthBUY - SPDR S&P Emerging Asia Pacific (NYSE: GMF) 05/08/13 76.43 1.8 NEW Asia PacificT. Rowe Price Small-Cap Value (PRSVX, 800-638-5660) 12/10/08 42.34 1.3 107.2 Small-Cap Value
BondsFidelity Floating Rate High Income (FFRHX, 800-544-6666) 05/26/10 10.01 3.1 18.1 Bank LoanFidelity GNMA (FGMNX, 800-544-6666) 04/08/09 11.77 1.7 24.5 Int’l GovernmentMarket Vectors Intermediate Municipal ETF (NYSE: ITM) 07/13/11 23.79 2.5 14.7 Int’l MuniOsterweis Strategic Income (OSTIX, 866-236-0050) 12/10/08 11.92 4.2 62.7 Multisector BondVanguard Intermediate-Term Investment Grade (VFICX,800-997-2798) 12/12/12 10.26 3.2 1.3 Inv. Grade Bond
Special SituationsConsumer Staples Select Sector SPDR (NYSE: XLP) 08/08/12 41.43 1.9 18.5 Sector ETFFidelity Select Gold (FSAGX, 800-544-6666) 01/14/09 23.00 0.0 0.1 Precious MtlsPowerShares BuyBack Achievers (NYSE: PKW) 08/22/12 34.36 0.2 17.4 Specialty EquityTechnology Select Sector SPDR (NYSE: XLK) 06/23/10 29.90 1.7 42.4 Sector ETF
*As of 04/24/13. +Since original recommendation.To Buy the entire Fund Portfolio in one transaction, go to Pfnewsletter.com/Folio. To ask questions about Folio Investing, please call 1-888-973-7890.
Personal Finance and Folio Investing do not have a financial relationship.
F U N D P O R T F O L I O
FUND FOCUS
www.PFnewsle t ter.com 703-394-4931 May 8, 2013 11
The steel industry tends to ebb and flow in tandem with economic
conditions. Last year, as the world economy slowed by 1 percentage point from the previous year, global steel consumption in turn only grew by 1.2 percent to 1.41 billion metric tons—the lowest rate since 2009.
However, steel consumption for 2013 is expected to grow by about 2.9 percent to 1.45 billion metric tons, largely driven by improving economies in China and India, where steel demand is expected to grow by 3.1 percent to 668.8 million tons and by 5.9 percent to 75.8 million tons, respectively.
Last year, Ari Charney recommend-ed two highly efficient steel companies that stood to benefit from a growing global economy. Despite their under-performance due to weak economic conditions, these companies’ value grew in line with the broader market.
Steely DANRAfter a strong start to its fiscal 2012,
Danieli’s (Milan: DANR) revenues fell 1.2 percent to EUR3.08 billion for the full year.
The reduced sales stemmed from slowing 2012 global gross domestic product growth, which declined by 1 percentage point from 4.3 percent the previous year. The company’s larg-est sales drop came from its Middle East sales, which fell 32 percent to EUR616.2 million.
Although the European steel market felt a 9.3 percent decline in consump-tion to 140 million tons in 2012, Europe and Russia (which together
represent 46 percent of the com-pany’s sales) actually grew 3 percent to EUR1.42 billion. The company saw the greatest expansion of its sales in Asia, by 39 percent to EUR739.5 million.
For the first six months of fis-cal 2013, sales fell 15 percent to EUR1.29 billion, while profits fell 20 percent to EUR77.5 billion mostly due to a loss of EUR21.4 million from foreign currency transactions.
Danieli’s gross operating margins showed signs of improvement, as earnings before interest, taxes, depre-ciation and amortization (EBITDA) grew 9 percent to EUR149 million.
The company’s current order book of EUR3.3 billion—equal to a year of sales— is up slightly from EUR3.2 billion at the end of fiscal 2012 and remains well diversified by sectors and product mix.
With EUR1.7 billion in cash and equivalents and a EUR820 million net financial position, Danieli should continue to efficiently finance its steel-making investments and wait for mac-roeconomic conditions to improve. Danieli is a buy under EUR12.
Steeled For GrowthNucor (NYSE: NUE) saw revenues
in 2012 fall 3 percent to $19.4 bil-lion, as a drop in the price per ton of steel fell 3 percent, even as total tons of steel shipped to outside customers remained relatively flat at 23 million tons.
For the first quarter, Nucor’s sales fell 11.4 percent to $4.55 billion, as
shipments to outside customers fell 3.6 percent to 5.7 million tons. The average scrap and scrap substitute cost per ton used in the first quarter fell15 percent from last year to $379 per ton.
Although the company’s operat-ing rates fell to 72 percent from 79 percent a year ago, they’re up slightly from 71 percent in the fourth quarter of 2012. And average scrap cost also improved 2 percent from $372 in the fourth quarter of 2012.
Nucor still faces a challenging mac-roeconomic environment, but it ex-pects earnings to continue improving throughout the year, due to improved performance at its downstream busi-nesses, raw materials operations and most steel mill product groups.
The company also is expected to benefit in the second half of 2013 from the improving US automotive and construction sectors.
This year, US industry sales of new cars are expected to exceed 15.3 mil-lion, from 14.4 million in 2012 and increase at an annual rate of at least 6.5 percent until 2015.
The company’s balance sheet remains strong, with a total debt-to-capital ratio of 32 percent. Cash and short-term investments totaled $1.1 billion at the end of the first quarter. And the company has $1.5 billion un-secured revolving credit which doesn’t mature until 2016.
Nucor is a buy if the price dips below 42.
Khoa Nguyen is an investment analyst at Personal Finance.
Aligned With EconomiesArticle in Review: “Up From Scrap,” by Ari Charney, April 25, 2012.
BY KHOA NGUYEN
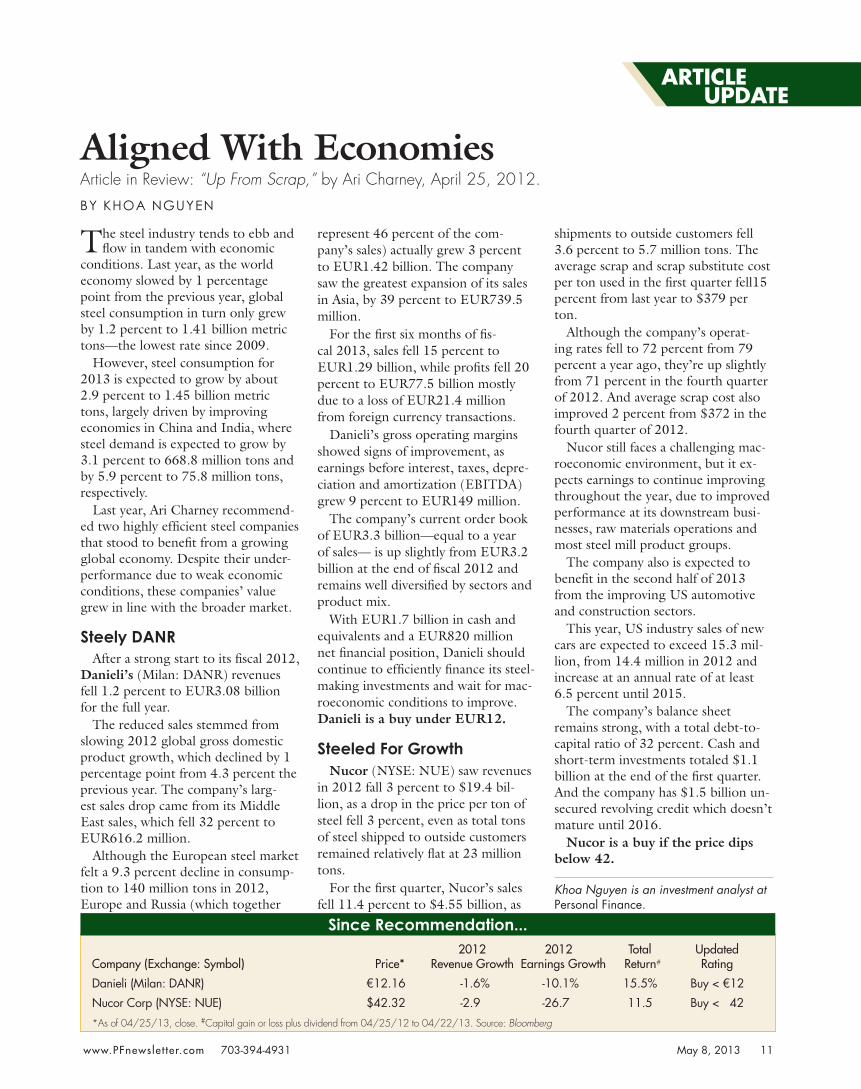
Since Recommendation... 2012 2012 Total UpdatedCompany (Exchange: Symbol) Price* Revenue Growth Earnings Growth Return# Rating
Danieli (Milan: DANR) €12.16 -1.6% -10.1% 15.5% Buy < €12
Nucor Corp (NYSE: NUE) $42.32 -2.9 -26.7 11.5 Buy < 42
*As of 04/25/13, close. #Capital gain or loss plus dividend from 04/25/12 to 04/22/13. Source: Bloomberg
ARTICLE UPDATE

Savers in Cyprus aren’t the only ones worried that government poli-
cies will attack their nest eggs. Add Americans to the list.
President Barack Obama’s 2014 budget proposal seeks to cap multi-million-dollar tax-favored Individual Retirement Accounts (IRAs)—ironi-cally, the type of IRA held by high net worth individuals such as Mitt Rom-ney, his Republican rival in 2012.
Introduced on April 10, Obama’s budget blueprint would cap the amount taxpayers can accumulate in a single IRA.
The cap would start at $3.4 mil-lion, the amount required to fund a $205,000 annual annuity for a 62-year-old, and would be adjusted for the cost of living.
Individuals would be prohibited from adding additional tax-free money to their IRA accounts when the cap is reached. Because the cap is linked to annuities, it could decline if interest rates rise.
The White House claims that the proposal would generate an additional $9 billion in revenue over the next 10 years.
The rationale for the change is that these big IRAs are being used by extraordinarily wealthy people to accumulate several millions of dollars more than they really need to live a comfortable retirement, thereby twist-ing the original purpose of the IRA.
According to the administration’s logic, the IRA is supposed to serve as a retirement-planning tool for people of modest means, but it has now morphed into an estate-planning
scheme for wealthy families because current IRS rules allow the accounts to be handed down to heirs.
During the last presidential cam-paign, Romney’s IRA actually became an issue, when he revealed that his IRA held up to $87.4 million.
Most taxpayers can contribute a maximum of $5,500 for 2013. Older workers, self-employed workers and those who save through 401(k)-style plans enjoy higher caps and can roll those accounts into IRAs.
Tax accountants say that Romney was able to circumvent the limits by contributing investments from his private equity firm, Bain Capital, that were valued at nearly nothing but which grew substantially over time. This tactic allowed the investments to grow tax-free in the IRA, but when taken out would only be subject to taxation as ordinary income.
When the extent of Romney’s IRA was revealed, it catalyzed calls in Con-gress for a reform of the laws, to help generate more revenue to ameliorate the federal deficit.
The president’s proposed IRA cap is part of a $3.8 trillion federal budget for next year that targets high-wealth households for additional revenue. Obama’s proposal is fiercely opposed by Republicans and faces an uphill battle.
Nonetheless, it pays to prepare for the worst. The proposal could make it prudent for wealthier investors to put more cash into insurance, where death payouts are generally exempt from federal taxes.
Insurance policyholders who are still
alive can withdraw premium payments from permanent coverage without a federal tax bite. They also can take out additional cash tax-free in the form of a loan that’s repaid from the benefit proceeds upon death.
For nervous IRA holders looking for an alternative stream of retirement income, tax-deferred annuities are another insurance product that could fit the bill.
Whenever a new income or estate tax comes down the pike, it tends to increase the attractiveness of life insurance products. But keep in mind, these products are purchased with after-tax dollars, which gives them a lesser tax benefit than a tax-deferred retirement account.
Obama’s proposed IRA caps may be irrelevant to your situation and as such don’t warrant any drastic action on your part.
In 2011, about 0.1 percent of savers older than 60 had at least $3 million in 401(k) and IRA accounts, accord-ing to the non-partisan Employee Benefit Research Institute.
Consequently, despite the viable alternatives mentioned above, don’t get caught up in the political heat and lose sight of your wealth-building goals.
IRAs are still worth it for certain high-income savers. Deductible or not, any money you deposit ac-cumulates free of taxes as long as it stays there. This means it can grow and compound without having a big chunk sliced off for current taxes, as would be the case with an ordinary investment.
The Big IRA Grab?New budget proposals in Washington are putting a scare in IRA savers. Here are the facts.
BY JOHN PERSINOS
ON THE MONEY
The Personal Finance Recession Radar measures the likelihood of a recession in the next six months. For more information about this proprietary measure, please visit PFnewsletter.com/Radar.
< 15% Normal statistical risk16-30% Medium risk31-50% Elevated risk> 51% Recession likely
30%
PF’S RECESSION RADAR
357,500
Initial Jobless Claims
5.5 %Year over year:
4-Week Average:
▲▲0.2%▲0.2%
December
November
▼0.5%January
The Conference Board Index of Leading Economic Indicators (LEI)
The LEI is a broad measure of economic activity. A rising LEI suggests that economic activity will increase in the near future.
700
Increase in index takes into account intangible from risk of no Washington budget compromise.