personality as a modulator for physiological and … department...personality and physiological...
TRANSCRIPT
RUNNING HEAD: Personality and Physiological Reaction
Personality as a Modulator for Physiological and Neurological Reactions to Emotional Images
John A. Smith
Roanoke College
May 2014
Author’s Note:

Personality and Physiological Reactions 2
Abstract
The current study compared self-reported emotional reactivity to film clips and compared
reactivity between obsessive and hysterical personality patterns, and separately measured
physiological and neurological responses to emotional images and compared responses between
groups labeled Emotionally Expressive and Emotionally Restricted. Results validated the use of
the selected film clips in eliciting a self-reported emotional response; however, there were no
significant differences between hysterical and obsessive personalities. Results validated the use
of emotional images as a tool of emotional elicitation, and significant changes in heart rate (HR)
and galvanic skin response (GSR) were shown in response to negative images; however, the
GSR response was opposite the predicted direction. Neither physiological data nor self-report
valence ratings were significantly different between styles of emotional expressivity.
Abbreviations: GSR – Galvanic skin response; HR – heart rate; EEG – electroencephalogram;
LKATS – Lazare-Klerman-Armor Trait Scales

Personality and Physiological Reactions 3
Personality as a Modulator for Physiological and Neurological Reactions to Emotional Images
Emotions allow us to assess our environment subjectively, to appraise potentially
dangerous situations, and influence subsequent actions based on feelings (Smith & Lazarus,
1990). According to Smith and Lazarus (1990), human emotion evolved from simpler, more
structured automatic responses to stimuli. As humans began to move away from the rigidity of
response and became more and more complex, we became less dependent on instinct and more
dependent on thought and judgment. We learned how to perpetuate our species and survive not
only because of instinct, but also because of our ability to assess and adapt to a multitude of
situations (Ekman, 1984; Lazarus, 1968; Smith & Lazarus, 1990). Emotions, in part learned from
experience, allow us to bridge the gap between environmental adversity and subsequent actions
(Smith & Lazarus, 1990). Thus, modern humans do not always act reflexively; we are able to use
emotions as a tool to guide us through our surroundings.
Each person’s subjective emotion follows an appraisal of stimuli that is based on personal
motivations and environmental constraints and allowances (Lazarus, 1968; Smith & Lazarus,
1990). The actions that follow are expressed in a particular physiological pattern and are
relevant to the situation at hand. Considering the “fight or flight” response, an organism’s choice
to stay and fight or to flee depends on the preceding emotional response, which is based on
environmental cues and motivational factors. Emotions, in conjunction with reflexes and basic
physical needs (e.g., hunger), motivate a person to behave in ways that enable him or her to
survive and to thrive (Smith & Lazarus, 1990). This biological root of emotion has been
investigated by Ekman (1992) through his research of 6 basic emotions that exist cross-culturally
(happiness, surprise, fear, sadness, anger, and disgust), and is supported with evidence of 6 basic
types of facial expressions that every culture recognizes and experiences. Research supporting

Personality and Physiological Reactions 4
cross-cultural emotions gives evidence for the biological nature of emotions. While this does not
ignore the cultural or social aspects of emotional expression, it does give reason for exploring the
physiological nature of emotion (Ekman, 1992; Ekman, Friesen, & Ellsworth, 1972).
Emotional Expression and Personality
The relationship between emotion and personality has been studied extensively from the
point of view of various psychological paradigms (Bono & Vey, 2007; Friedman & Booth-
Kewley, 1987; Shapiro, 1965; Temoshok, 1986). Emotions are often the foundation of
personality tendencies and relate to a person’s style of cognition, stability, and social interaction
(Keltner, 1996). Obsessive and hysterical personality patterns described by David Shapiro (1965)
are just one example of this type of formulation. Shapiro (1965) described these types of
“neurotic” personality styles (along with paranoid and impulsive styles), outlining their general
characteristics, including emotional tendencies. The obsessive is rigid with restricted
emotionality and does not like to lose control of emotions, and the hysteric is free and
inconsistent in emotional expression (Shapiro, 1965). Because Shapiro describes emotionality
mainly in obsessive and hysterical patterns, these patterns were chosen for the current study.
Lazare, Klerman, and Armor (1966) developed a factor-derived questionnaire designed to
assess these patterns, and the use of their survey has been validated in several studies (Boyce &
Mason, 1996; Hirschfield, Klerman, Clayton, Keller, & Andreasen, 1984; Lazare et al., 1966). In
1987, researchers Whitson and Dievendorf tested the validity of clinical descriptions of
hysterical and obsessive personality types. Expression of emotion is a trait that clearly differs
between obsessive and hysterical patterns, hysterics having uninhibited emotions and obsessives
restricting emotional expression (Lazare, et. al., 1966; Shapiro, 1965). Whitson and Dievendorf
(1987) hypothesized a significant positive relationship between hysterical personality and the

Personality and Physiological Reactions 5
level of emotionality attributed to characters in the TAT stimulus pictures, and a significant
negative relationship between obsessive personality and emotionality level seen in the characters.
Results of this study showed a significant positive relationship between hysterical personality
and the degree of emotionality attributed to characters in the stories (Whitson & Dievendorf,
1987). Hysterical personality was positively correlated with discomfort, anxiety, irritability, and
sadness of the story characters and negatively correlated with relaxation and confidence in
handling the situation in the story. Obsessive personality was negatively associated with
irritability of the characters, and positively correlated with relaxation. The scale has also been
widely tested in relation to clinical disorders such as depression (Boyce & Mason, 1996;
Hirschfield, et. al., 1984).
Eliciting Emotions
Because many types of stimuli that humans experience on a daily basis have the potential
to elicit an emotional response, there are many potential methods for experimentally eliciting
emotions as well (Hagemann et al., 1999). While many of these methods are useful, all come
with inevitable flaws. Images are standardized so that each participant views the same stimuli,
but they are not very immersive and may rely heavily on the participant’s imagination in order to
produce an emotional response (Hagemann et al., 1999). If the participant is instructed to
imagine an emotional scenario behind a still image, the scenarios that people come up with will
vary greatly. Some people may not even engage in the task and thus ignore the stimulus
altogether. A participant who is not engaged in the stimuli may have a muted response or no
response at all (Hagemann et al., 1999). There is also the issue of demand characteristics;
someone who may not have a strong response could feign one so that the experimenter gets
results, even though those results are invented (Rottenberg, Ray, & Gross, 2007).

Personality and Physiological Reactions 6
Film clips have been widely used in emotional research over the past few decades and
have been shown to be valid tools. Film clips are standardized like pictures, but they are dynamic
and engaging so that the participant is immersed in the stimuli enough to respond to it
(Hagemann et al., 1999). Considering ethics, there are potential psychological risks involved
with viewing frightening, disgusting, or otherwise arousing films similar to those involved with
real-life situations. These risks are no more than what a person experiences when he or she views
a film privately; nevertheless, all subjects need to be informed of the nature of the experiment
before beginning and given the option to withdraw. Because color is a potential confound, to
avoid different emotional responses related to the color of the clips, all clips should be either
color or black and white for consistent presentation (Hagemann et al., 1999). Film clips were
used as a tool of emotional elicitation in Part 1 of the current study.
Despite the usefulness of film clips, images containing emotional content were used for
the second part of the current study due to time and analysis constraints. Overall, although clips
are effective in eliciting emotions, the onset of emotional content within clips varies, making it
difficult to isolate and measure differences at the time of emotional reaction for each clip. With
images, the emotional content is presented constantly for the duration of the stimulus, making it
easy to define the time range of emotional reaction. For these reasons, images were used to elicit
emotion in Part 2 of this study.
Measuring Emotion
Emotion can be operationally defined in many ways, but for the purpose of this study we
focused on the intensity of physiological and self-reported response (Rottenberg, et. al., 2007).
Response strength can be measured through self-report surveys and skin conductance (Lisetti &
Nasoz, 2004). The link between emotional response and physical response is made possible by

Personality and Physiological Reactions 7
the sympathetic nervous system (Brouwer, Van Wouwe, Muehl, Van Erp, & Toet, 2013); the
stronger the mental response to emotions, the greater the nervous system will respond and
increase sweat production on the skin, which in turn increases skin conductance levels (Brouwer
et. al., 2013; Codispoti, et. al., 2008; Gross & Levenson, 1995). There is a positive relationship
between emotional response and skin conductance, so theoretically the stronger the response the
greater the skin conductance level. Valence (pleasantness) of the emotion is not a factor in the
magnitude of the skin conductance level because positive and negative emotions both produce
elevated Galvanic skin response (GSR) levels (Brouwer et al., 2013; Codispotti, Surcinelli, &
Baldaro, 2008; Khalfa, Isabelle, Jean-Pierre, & Manon, 2002). General emotional expression is
indicated with GSR amplitudes greater than baseline. The nuances of negative and positive
emotions were not individually examined because the focus was on how response intensity
differs for broad emotional valences, in addition to differences between neutral responses and
emotional responses.
Although some research has been done on interpreting skin response to determine the
specific emotion the participant was feeling, individual differences in physical response may
present difficulties in determining exactly which emotions are felt during stimuli presentation
(Lisetti & Nasoz, 2004; Nakasone, Prendinger, & Ishizuka, 2005). Because emotions are so
subjective, we believe self-report surveys are necessary in addition to physical measures so that
interpretation of the emotion felt is left up to the individual, not an outside observer who may
misinterpret feelings. Although it is unclear if Galvanic skin response can accurately determine
specific emotions felt, it can show the intensity of the response. Self-report fills in which
emotions were felt and allows the subjective experience of emotion to remain subjective. This
type of response was used in both parts of the current study.

Personality and Physiological Reactions 8
In addition to skin conductance level, the current study (Part 2) used heart rate as a
secondary physical response indicator. Research has shown that heart rate decelerates during
negative emotions (Codispoti, et. al., 2008; Gross & Levenson, 1995). There has also been
research showing a similar decrease during pleasant stimuli presentation (Codispoti, et. al.,
2008). The decrease or increase of heart rate does not matter for this study; we will simply be
looking for a difference in heart rate response between emotional and neutral images.
Electroencephalogram (EEG) measures brain wave activity over longer epochs and
activity of certain waves can be averaged over the duration of the recording (Coles & Rugg,
1995). This ability to record over longer periods of time allows participants to process complex
stimuli adequately. Average wave amplitude over time will indicate which brain waves were the
most synchronous (therefore most prevalent and at the highest amplitude) during stimulus
presentation. Each wave occurs within a specific frequency range that can be used to identify the
waves. The specific brain wave type indicates the type of brain activity occurring. Alpha waves
(8-13 Hz) are more synchronous in the occipital region of the brain when a person is awake but
relaxed, with his or her eyes closed, and are indicative of a relaxed mental state (Sammler,
Grigutsch, Fritz, & Koelsch, 2007; Teplan, 2002). Beta waves (13-30 Hz) are more synchronous
during general consciousness and indicate a person is attentive, with his or her eyes open (Abdou
et al., 2006; Teplan, 2002). Beta waves can be observed in the left temporal lobe during a state of
wakefulness (Overman et al., 2003). Both alpha and beta waves are most prominent during
wakefulness and have been studied well; therefore, these waves will be examined in the current
study (Teplan, 2002). EEG equipment measured differences in brain activity while viewing
emotional versus neutral stimuli. The emotional stimuli comprise of negative and positive
images taken from the internet and the neutral stimuli comprise of images of everyday objects

Personality and Physiological Reactions 9
that do not ordinarily elicit an emotional response. This study examined EEG responses while
subjects viewed emotional images and compared them to responses to neutral images. Alpha and
beta waves were be focused on because of their implications in arousal, which is linked to
emotional response (Höller et al., 2012; Husain, Thompson, & Schellenberg, 2002). Alpha
waves, associated with mental relaxation, are more synchronous (high amplitudes) during non-
emotionally arousing stimulation, and beta waves, associated with mental arousal, are stronger
during the presentation of emotional stimuli (Lefrancois, 2012).
Current Study
The current study assessed differences in emotional response to film clips and images
between personality patterns discussed by Shapiro (1965). Separated into two parts, the first part
examined responses to film clips via self-reported emotionality, and the second used images to
elicit physiological responses. Both parts measure a personality variable in addition to recording
self-report emotional response to the chosen form of stimulus.
Part 1 utilized emotional film clips to produce a self-report response which was compared
to LKATS personality patterns. For each clip, participants rated the intensity of 6 emotions
(happiness, surprise, fear, sadness, anger, and disgust) on a Likert scale from 1-8 (1 = none at all,
4 = somewhat, 8 = extremely, a great deal). Personality responses were used to group
participants based on overall LKATS personality pattern (obsessive or hysteric) in an attempt to
correlate this personality variable with self-report intensity of emotional response. The following
predictions were tested
1. Emotional clips will produce stronger responses than neutral clips. This will validate their
use as a tool for emotional elicitation in future research.

Personality and Physiological Reactions 10
2. The target emotion for each film clip will be the strongest reported emotion out of the 6
total emotions (i.e., a clip targeting disgust will elicit the strongest response in the disgust
category). This will show that each clip is targeting the appropriate emotion, and other
confounding emotions are not a factor.
3. Participants who score low in the obsessive personality pattern and high in the hysterical
pattern will report stronger emotional reactivity to the clips. In addition, those who score
high on the obsessive pattern and low on the hysterical pattern will report lower
emotional reactivity to the clips. These results will echo Shapiro’s (1965) and Whitson
and Dievendorf’s (1987) research on the emotional expressivity of obsessive and
hysterical personality patterns.
4. Lower self-reported response to all emotions would support the emotional restriction that
is characteristic of obsessive personality types; response to emotions not targeted by the
film clips would support the inconsistent emotional response that is characteristic of
hysterical personality type.
Part 2 used emotional images to produce a physiological response measured by GSR,
HR, and EEG. Self-reported emotional reaction to each image was also measured through a
Likert scale from 1-9 (1 = very negative, 5 = neutral, 9 = very positive). The following
predictions were tested:
1. Because of previous research showing increased skin conductance in response to
emotional stimuli, GSR response magnitudes will be larger for emotional (positive and
negative) images than for neutral images.
2. HR response will differ between neutral images and positive/negative images. Research
has shown a deceleration in HR in response to negative stimuli; however, responses to

Personality and Physiological Reactions 11
positive stimuli are more inconsistent. Because of this, the current study looked for bi-
directional differences between neutral and emotional responses.
3. Alpha waves are associated with a relaxed mental state; therefore, alpha waves will be
higher during neutral image presentation; beta waves are associated with mental arousal
(which includes emotional arousal) and, therefore, beta waves will be higher during
emotional image presentation.
4. Participants who score low on emotional expression will demonstrate a lower magnitude
of response on the self-report ratings and the physiological measures. Conversely,
participants who score high on emotional expression will show higher magnitudes of
response. These finding will support a biological basis for differences in outward
emotional expression.
Method Part 1
Participants
Sixty-one participants (14 male) aged 18-22 were recruited from psychology classes at
Roanoke College in Salem, VA. Subjects had normal or corrected to normal vision. Experiments
were conducted in accordance with the guidelines of the Roanoke College Institutional Review
Board.
Stimuli
Film clip choices can be found in Appendix A. These clips were chosen based on
previous research with similar films (Rottenberg, et. al., 2007). If a clip could not be obtained,
then a different clip targeting the same emotion was chosen from commercially available films
found on YouTube and shortened to 30 second MP4 Video files using Windows Movie Maker.
Clips were shown on a projector through Windows Power Point. There were 6 clips for sad,

Personality and Physiological Reactions 12
disgust, happiness, and neutral emotions. Three clips in each category were silent, and three
retained their sound. The length of the clips was chosen based on the research of Brouwer et. al.
(2013), which showed that skin conductance, our focus measure of physiological emotional
response in Part 2, can be determined over a time block of 30s. Films were originally intended to
carry over to Part 2; however, this medium was ultimately replaced with images.
Procedure
Groups of participants viewed 18 film clips from each target emotion as well as 6 neutral
clips and gave a self-reported emotional intensity of Ekman’s 6 cross cultural emotions between
each clip (Ekman, 1992). Participants rated clips based on a Likert scale from 1 to 9, 1 meaning
they did not feel that emotion at all, 5 meaning they felt the emotion moderately, and 9 meaning
they felt the emotion very much. The surveys included a write-in option for rating any emotions
not listed. Each of the 6 emotions was assigned a rating for each clip.
The order of the film clips was randomly chosen out of three possible orders that were
previously arranged. In the interest of time, each participant viewed each film clip once. After
clip presentation, participants completed the LKATS personality measurement. The LKATS is a
145 True/False questionnaire designed to measure Shapiro’s personality styles (obsessive and
hysterical). Questions cluster together into factors that comprise the broader personality patterns.
One such factor is emotional restriction, which includes such questions as “I usually express
myself with caution and restraint” (Lazare, et. al., 1966). This added personality variable was
intended to give insight into differences in reactions to films with and without sound between
personality patterns, and also offer preliminary data for the effect of emotional films on different
personalities. The presentation of the films lasted 20-40 minutes, with the personality survey
lasting 15-20 minutes.
Personality and Physiological Reactions 13
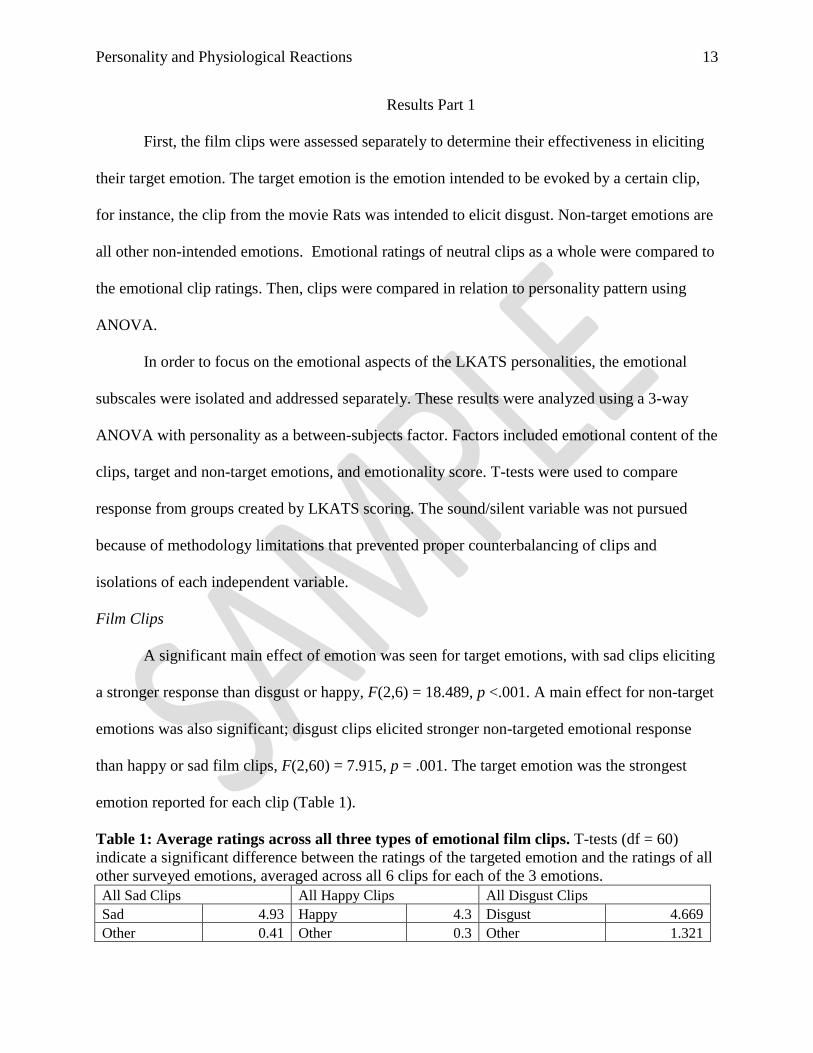
Results Part 1
First, the film clips were assessed separately to determine their effectiveness in eliciting
their target emotion. The target emotion is the emotion intended to be evoked by a certain clip,
for instance, the clip from the movie Rats was intended to elicit disgust. Non-target emotions are
all other non-intended emotions. Emotional ratings of neutral clips as a whole were compared to
the emotional clip ratings. Then, clips were compared in relation to personality pattern using
ANOVA.
In order to focus on the emotional aspects of the LKATS personalities, the emotional
subscales were isolated and addressed separately. These results were analyzed using a 3-way
ANOVA with personality as a between-subjects factor. Factors included emotional content of the
clips, target and non-target emotions, and emotionality score. T-tests were used to compare
response from groups created by LKATS scoring. The sound/silent variable was not pursued
because of methodology limitations that prevented proper counterbalancing of clips and
isolations of each independent variable.
Film Clips
A significant main effect of emotion was seen for target emotions, with sad clips eliciting
a stronger response than disgust or happy, F(2,6) = 18.489, p <.001. A main effect for non-target
emotions was also significant; disgust clips elicited stronger non-targeted emotional response
than happy or sad film clips, F(2,60) = 7.915, p = .001. The target emotion was the strongest
emotion reported for each clip (Table 1).
Table 1: Average ratings across all three types of emotional film clips. T-tests (df = 60)
indicate a significant difference between the ratings of the targeted emotion and the ratings of all
other surveyed emotions, averaged across all 6 clips for each of the 3 emotions.
All Sad Clips All Happy Clips All Disgust Clips
Sad 4.93 Happy 4.3 Disgust 4.669
Other 0.41 Other 0.3 Other 1.321

Personality and Physiological Reactions 14
P-value 0.00 P-value 0.00 P-value 0.00
Effects of Personality
Median splits were conducted on the sub-scale data and scores were combined to form
two groups labeled high and low emotionality. Participants who scored high on obsessive and
low on hysterical (low emotionality) were compared to participants who scored high on
hysterical and low on obsessive (high emotionality). These groupings reflect the emotional
expression or restriction of Shapiro’s original personality patterns (Shapiro, 1965). Twenty eight
participants who scored average on both types were excluded because these participants do not
represent distinct personality patterns. No significant main effects of personality were found
(Figures 1 and 2), and there was not a significant interaction between personality and
Target/Non-target emotions, contrary to our hypothesis, F(10,20) = 1.502, p = .210. Personality
data were split into upper and lower thirds of emotionality in order to compare the most extreme
responses (very high compared to very low). With these data, a significant interaction between
personality and emotion was trending toward significance (F(1,44) = 3.064, p = .087); however,
the difference was opposite the intended direction (obsessives displayed higher emotionality).

Personality and Physiological Reactions 15
Figure 1: Target Emotion vs. Non-Target Emotion. For each emotion, target emotions were
rated significantly stronger in emotion than non-target emotions (F(2,60) = 117.562, p < .001).
No significant differences in response between personality patterns were seen.
Figure 2: Emotional Ratings per Personality. Emotional ratings were averaged across the
variables of emotion and sound content for target emotion. No significant differences between
personality patterns were seen.
Emotional clips produced significantly stronger responses than neutral clips, supporting this
hypothesis. The target emotion for each film clip was the strongest reported emotion out of the 6
total emotions, which confirmed that each clip targeted the appropriate emotion. Although non-
target emotions in the disgust category were significantly higher than in other categories, the
non-target emotions in each category were significantly lower than the target emotions.
0.000
1.000
2.000
3.000
4.000
5.000
6.000
Sad T Sad NT Happy T Happy NT Disgust T DisgustNT
Neutral
Emotion
Obsessive
Hysterical
0.00
1.00
2.00
3.00
4.00
5.00
6.00
Happy Sad Disgust
Emotion
Target
Obsessive
Hysterical

Personality and Physiological Reactions 16
With regard to the personality hypotheses, neither of them was supported. There were no
significant differences between emotional reactivity to the clips and the personality trait of
emotionality, t(35) = .844, p = .404. Finally, high emotional expression (related to hysterical
personality) did not display significantly higher responses to non-target emotions, F(1,11) =
.217, p = .651.
Discussion Part 1
Personality data were not significant when using the full LKATS survey. Possible
reasons for this lack of significance will be outlined in the General Discussion section. The
number of people who scored either high on emotional expression and low on emotional
restriction, or low on emotional expression and high on emotional restriction was no more than
one would expect due to random chance. This suggests that the personality survey used did not
systematically differentiate between patterns of emotional expression. Because the LKATS did
not seem to categorize participants into distinct groups, it is questionable whether the scale is a
valid tool for assessing these personality types in this population. The sample population
comprised of all college students, which may reflect a selection bias; the obsessive personality
type is more reflected in this population because traits that correspond to this pattern are
preferred over hysterical traits (i.e., attention to detail, orderliness, and ability to focus) (Shapiro,
1965).
Alternatively, the personality variable may have too small an effect size to be visible in a
college-age population at a small liberal arts college of mostly females. It can be difficult to
make a clear distinction between these styles of emotionality because environmental factors
affect how people react, and people may display characteristics of both expression and restriction
depending on the situation (Funder, 1997). While the personality variable was not a factor in this

Personality and Physiological Reactions 17
study, the results do validate the use of short film clips in producing differential emotional
response. All of our hypotheses involving the emotional nature of the clips were supported,
which validates the chosen clips as an emotional stimulus tool.
Because of the lack of significant results drawn from the full LKATS survey, in Part 2 of
this study the researchers isolated the emotional reactivity variables in an attempt to be more
specific in the target personality variable, rather than assessing a much broader personality
pattern as a whole. To create a much shorter and efficient survey examining emotionality style,
14 LKATS emotionality questions were combined with 6 questions unrelated to emotionality.
Method Part 2
Participants
Thirty-one participants aged 18-22 (4 male) were recruited from students in the
Psychology Department at Roanoke College in Salem, VA. All subjects had normal or corrected
to normal vision. The experiments were conducted in accordance with the guidelines of the
Roanoke College Institutional Review Board.
Images
Image choices can be found in Appendix B. These images were chosen based on previous
research that validated their efficacy in producing an emotional response (ERP) in a short period
of time (Fall 2013 Neuro Seminar). There were 3 categories of clips (positive, neutral, and
negative), each with 20 black-and-white images. Images were rated in terms of valence on a
Likert scale from 1-9, 1 being very negative, 5 being neutral, and being very positive.
Equipment
Heart rate was measured via AD Instruments Finger Pulse Transducer and recorded
through LabChart software. The transducer pad was attached with Velcro® to the participant’s

Personality and Physiological Reactions 18
middle finger on the non-dominant hand. The non-dominant hand was used to allow the use of
the dominant hand for the number keypad, which would decrease anxiety about using unfamiliar
equipment with the non-dominant hand (additional anxiety would confound the emotion reaction
to images). Particular settings in the LabChart recording software were applied to the
physiological data. For HR, a valid range of 40-140 BPM was chosen.
GSR was also recorded using AD Instruments’ skin conductance amplifier and finger
electrodes applied to the participant’s index and ring fingers on the non-dominant hand.
LabChart chose an appropriate recording range of ±20 μSiemens. Conductance level was zeroed
for each participant before data collection began. Participants were encouraged to relax so their
skin conductance levels would not be elevated when zeroed and would therefore not confound
subsequent conductance changes.
Electroencephalography (EEG) signals were recorded using a PowerLab 26T (AD
Instruments). Five lead-shielded electrodes transmitted voltage signals from the scalp of the
participant to a bio amp specially designed to record signals in the biologically relevant range
(±50 μV for EEG) and to minimize artifacts from other electrical devices in the room. Stimulus
onset is indicated by a signal sent from an external Cedrus StimTracker device to the same
computer, which is also recorded by the LabChart 7 software. Channel 1 electrodes were placed
at Fp2 and Oz; Channel 2 electrodes were placed at Cz and A1 (ear for reference). Channel 1
intended to record alpha waves in the occipital region because previous research shows alpha
wave synchronization in the occipital region while a person is awake and relaxed. Theoretically,
greater alpha waves in this region indicate less response to visual stimulation than lower alpha
waves (less relaxation, more attention). Channel 2, in the upper parietal region, intended to
Personality and Physiological Reactions 19
measure beta waves in response to emotional response to stimuli (higher beta waves suggest
higher emotional arousal).
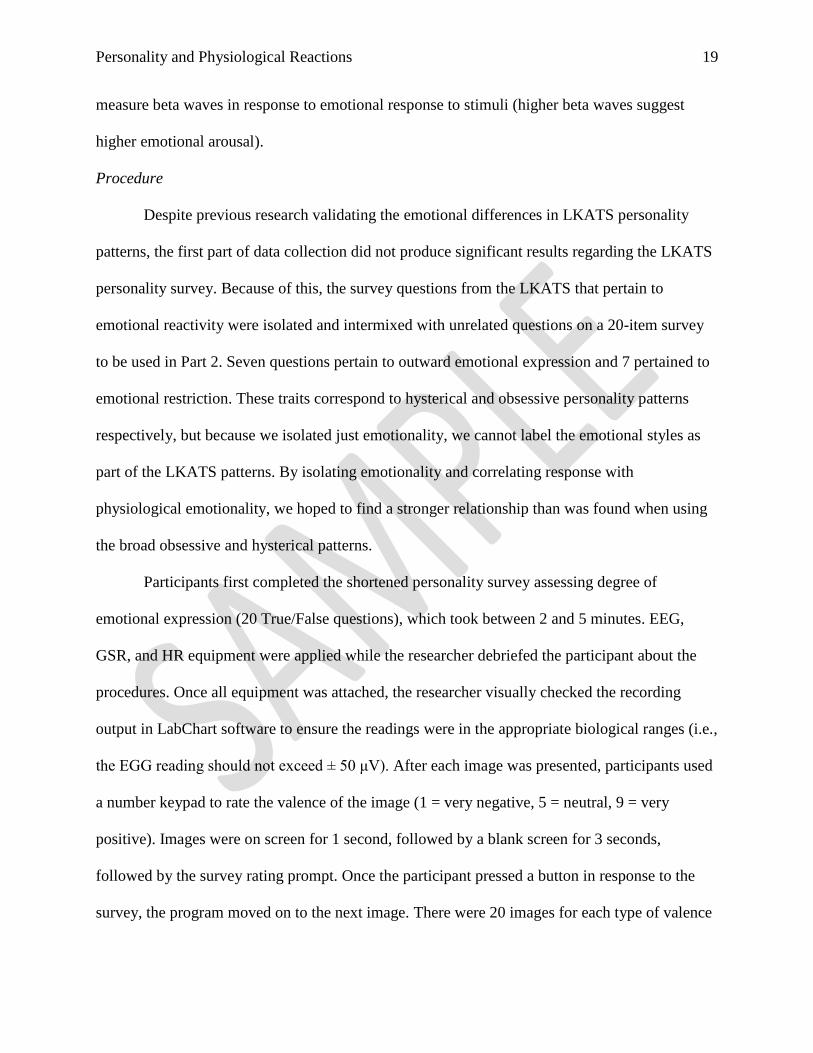
Procedure
Despite previous research validating the emotional differences in LKATS personality
patterns, the first part of data collection did not produce significant results regarding the LKATS
personality survey. Because of this, the survey questions from the LKATS that pertain to
emotional reactivity were isolated and intermixed with unrelated questions on a 20-item survey
to be used in Part 2. Seven questions pertain to outward emotional expression and 7 pertained to
emotional restriction. These traits correspond to hysterical and obsessive personality patterns
respectively, but because we isolated just emotionality, we cannot label the emotional styles as
part of the LKATS patterns. By isolating emotionality and correlating response with
physiological emotionality, we hoped to find a stronger relationship than was found when using
the broad obsessive and hysterical patterns.
Participants first completed the shortened personality survey assessing degree of
emotional expression (20 True/False questions), which took between 2 and 5 minutes. EEG,
GSR, and HR equipment were applied while the researcher debriefed the participant about the
procedures. Once all equipment was attached, the researcher visually checked the recording
output in LabChart software to ensure the readings were in the appropriate biological ranges (i.e.,
the EGG reading should not exceed ± 50 μV). After each image was presented, participants used
a number keypad to rate the valence of the image (1 = very negative, 5 = neutral, 9 = very
positive). Images were on screen for 1 second, followed by a blank screen for 3 seconds,
followed by the survey rating prompt. Once the participant pressed a button in response to the
survey, the program moved on to the next image. There were 20 images for each type of valence

Personality and Physiological Reactions 20
for a total of 60 images, each presented once per participant. All images were randomized using
Cedrus SuperLab 4.5. The study lasted between 35 and 45 minutes.
Results Part 2
To assess differences in response to each type of emotional stimuli, a repeated-measures
ANOVA was conducted for EEG, GSR, and HR separately. Examined variables included alpha
and beta EEG waves on Channels1 and 2, and 2 separate time ranges chosen from the overall
time course for both GSR and HR. Based on the average time course recordings for all
participants for the HR and GSR measures, time ranges 2.5-3.5 seconds and 4-5 seconds were
chosen for analysis.
Pairwise t-tests confirmed differences between emotions for each dependent variable if
the ANOVA was significant. Pearson correlation coefficients (r) were calculated to assess the
relationship between physiological emotional responses and self-reported emotional expression.
Heart Rate
Repeated-measures ANOVA confirmed a significant difference between emotional
valences at the first time range of analysis (2.5-3.5 seconds: F(2, 60) = 5.563, p = .006), shown
in Figure 3. Pairwise t-tests showed that the negative condition was significantly different from
the positive and neutral conditions (Neg.vs Pos: t(30) = -2.559, p = .016; Neg vs Neu: t(30) = -
2.766, p = .010; Pos vs Neu: t(30) = .109, p = .914). The 4-5 second time range showed no
significant differences (F(2, 60) = .327, p = .723) (Figure 4).

Personality and Physiological Reactions 21
Positive Negative Neutral
Series1 0.903 -0.341 0.866
-1.000
-0.500
0.000
0.500
1.000
1.500
Figure 3: HR Amplitudes 2.5-3.5s Post-Presentation. Negative HR amplitudes were
significantly different from the Positive and Neutral conditions. Neutral and Positive were not
significantly different.
Figure 4: HR Amplitudes 4-5s Post-Presentation. HR amplitudes did not significantly differ
between emotional conditions in the second time range, reflecting reaction to rating images using
the keypad, F(2,60) = .327, p = .111.
Galvanic Skin Response
Significant differences were found for GSR amplitudes at the 2.5-3.5s post-presentation
range. Amplitudes during the 2.5-3.5 range were significantly different per emotion. When
means were compared at this time range, a significant difference was found between the
positive/neutral condition and the negative condition (2.5-3.5 range: F(2, 60) = 3.545, p = .035).
ANOVA results for the 4-5 range were not significant, F(2,60) = 2.285, p = .111.
Positive Negative Neutral
Series1 0.242 -0.144 -0.011
-0.600-0.400-0.2000.0000.2000.4000.6000.800

Personality and Physiological Reactions 22
Figure 5: GSR Amplitudes 2.5-3.5s After Image Presentation. Negative amplitudes were
significantly different from neutral amplitudes, t(30) = -2.337, p = .026. Positive and neutral
amplitudes did not significantly differ, t(30) = -1.723, p = .095.
Figure 7: GSR Amplitudes 4-5s After Image Presentation. Positive and Negative amplitudes
were significantly different, t(30) = -2.252, p = .032; however, no other comparisons were
significantly different. Despite this pairwise difference, ANOVA results were not significant.
EEG
Average physiological amplitudes were calculated using MatLab software. EEG
amplitudes were calculated at the alpha (8-13 Hz) and beta (13-30 Hz) ranges as different from a
1/F curve. To calculate the amplitudes, a basic 1/F curve was subtracted from the data curve (the
Positive Negative Neutral
Series1 -0.001 0.066 0.019
-0.040
-0.020
0.000
0.020
0.040
0.060
0.080
0.100
0.120
Positive Negative Neutral
Series1 0.015 -0.001 0.045
-0.040
-0.020
0.000
0.020
0.040
0.060
0.080

Personality and Physiological Reactions 23
0.000
0.200
0.400
0.600
0.800
1.000
1.200
Po
siti
ve
Neg
ativ
e
Neu
tral
Po
siti
ve
Neg
ativ
e
Neu
tral
Alpha Beta
Channel 1
-0.300
-0.200
-0.100
0.000
0.100
0.200
0.300
Po
siti
ve
Neg
ativ
e
Neu
tral
Po
siti
ve
Neg
ativ
e
Neu
tral
Alpha Beta
Channel 2
maximum difference from the 1/F curve within a given Hz range that corresponds to either aloha
or beta waves). For Channels 1 and 2, no significant differences were shown for alpha or beta
outputs (Figures 7 and 8).
Channel 1 Alpha: F(2, 60) = 1.187, p = .312; Channel 1 Beta: F(2,60) = 1.770, p = .179;
Channel 2 Alpha: F(2,60) = .069, p = .933; Channel 2 Beta: F(2,60) = .036, p = .964.
Figures 7 & 8: EEG amplitudes for alpha and beta waves on Channels 1 and 2. Errors bars
indicate a lack of significant differences between wave types in response to different valences.
Personality
Correlations between emotional expression survey responses were not significant (Table
2).
Table 2: No relationships found between physiological data and emotionality score.
Variable Correlated with Emotional score Pearson r p value
HR, positive, 2.5-3.5 seconds .066 .722
HR, negative, 2.5-3.5 seconds -.161 .387

Personality and Physiological Reactions 24
GSR, positive, 2.5-3.5 seconds -.229 .214
GSR, negative, 2.5-3.5 seconds -.158 .395
GSR, neutral, 2.5-3.5 seconds .078 .675
EEG, alpha waves on channel 1, positive -.084 .652
EEG, alpha waves on channel 1, negative -.142 .446
EEG, beta waves on channel 2, positive .263 .153
EEG, beta waves on channel 2, negative .195 .294
In addition, the range of self-reported valence was calculated for each image per
participant. A wide range of ratings would represent high emotional expression (a wide range of
feelings) and a narrow range would represent low emotional expression (restricted range of
emotion). The range of self-report survey responses to the images was not significantly
correlated with scores on the emotionality survey, r (29) = .038, p = .840.
Discussion Part 2
HR
Part of our hypothesis regarding HR changes was supported; HR did significantly
decelerate in response to negative stimuli; however, there were not significant differences
between positive and neutral conditions. HR deceleration has been found in several studies
(Codispoti, et. al., 2008; Gross & Levenson, 1995); however, the current study was not able to
produce a significant deceleration in response to positive stimuli as well (Codispoti, et. al.,
2008).The lack of difference between positive and neutral conditions for the HR variable
suggests that the positive stimuli elicited not an emotional response, but rather a response to any
on-screen stimulus, independent of emotional content. The neutral condition acted as a control

Personality and Physiological Reactions 25
and a measure of responses to stimuli rather than emotion, and the results of this study suggest
that positive stimuli do not produce a strong physiological reaction.
GSR
There was a significant change in GSR 2.5-3.5 seconds post-presentation of stimuli;
however, it was opposite of what was predicted. If the GSR change was higher in response to
negative stimuli rather than lower, the hypothesis would have been supported and would have
corresponded with previous research. Burbridge, Larsen, and Barch (2005) found that
participants experienced higher HR and more frequent GSR changes in response to negative
stimuli, but not in response to positive or neutral stimuli. It is possible that the differences
observed were due to random chance.
EEG
Despite research showing that alpha waves are higher during neutral stimuli than
emotional stimuli, and the opposite for beta waves (Lefrancois, 2012), the current study did not
find significant EEG results on either channel. There may be several explanations for this; one is
that the data had too many artifacts to record valid EEG signals. Several participants were
nervous or unsure about the nature of the EEG equipment, and this may have contributed to
unnecessary movements, eye blinks, or body shifts that affected the data recording. Other
possible confounds include anxiety felt when using the keypad to rate images and increased
anxiety caused by unfamiliar equipment.
Personality
When personality variables were correlated with physiological responses, no significant
results were found despite the isolation of emotionality items from the original LKATS. There
was variability across participants in the total survey scores, so the lack of differences may not
Personality and Physiological Reactions 26
be attributed to faults in the survey but instead to invalid physiological data, or simply a lack of
physiological differences between these personality traits. Other possible explanations will be
discussed in the following section.
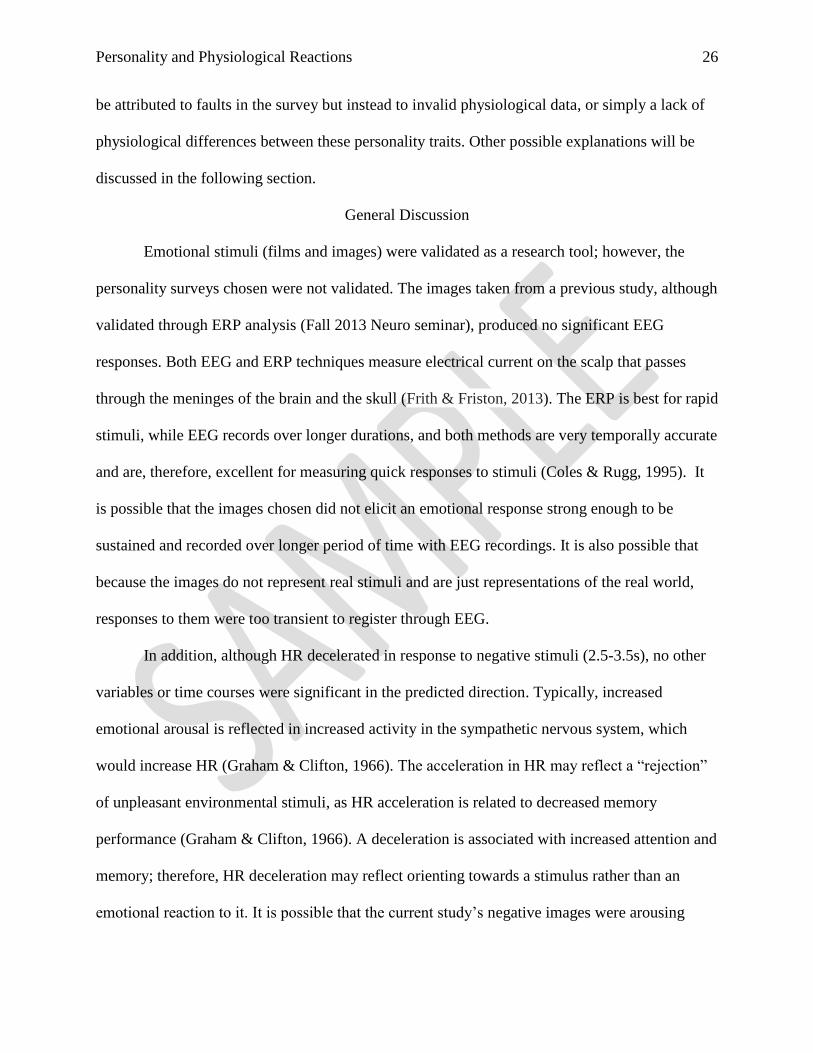
General Discussion
Emotional stimuli (films and images) were validated as a research tool; however, the
personality surveys chosen were not validated. The images taken from a previous study, although
validated through ERP analysis (Fall 2013 Neuro seminar), produced no significant EEG
responses. Both EEG and ERP techniques measure electrical current on the scalp that passes
through the meninges of the brain and the skull (Frith & Friston, 2013). The ERP is best for rapid
stimuli, while EEG records over longer durations, and both methods are very temporally accurate
and are, therefore, excellent for measuring quick responses to stimuli (Coles & Rugg, 1995). It
is possible that the images chosen did not elicit an emotional response strong enough to be
sustained and recorded over longer period of time with EEG recordings. It is also possible that
because the images do not represent real stimuli and are just representations of the real world,
responses to them were too transient to register through EEG.
In addition, although HR decelerated in response to negative stimuli (2.5-3.5s), no other
variables or time courses were significant in the predicted direction. Typically, increased
emotional arousal is reflected in increased activity in the sympathetic nervous system, which
would increase HR (Graham & Clifton, 1966). The acceleration in HR may reflect a “rejection”
of unpleasant environmental stimuli, as HR acceleration is related to decreased memory
performance (Graham & Clifton, 1966). A deceleration is associated with increased attention and
memory; therefore, HR deceleration may reflect orienting towards a stimulus rather than an
emotional reaction to it. It is possible that the current study’s negative images were arousing

Personality and Physiological Reactions 27
enough for participants to pay close attention to them, and the neutral and positive images were
not arousing enough to elicit increased attention and therefore a deceleration in HR.
Zhang, Kalinowski, Saltuklaroglu, and Hudock (2010) studied HR response to negative
stimuli (stuttered speech) and found a sustained HR deceleration over 1 minute. It is possible that
the images chosen for the current study were not negative enough to produce a prolonged
response similar to Zhang et al. (2010), or perhaps images are more subject to emotional
habituation because they are constant over the duration of physiological measurement. HR
response to images may have a shorter duration than responses to other types of stimuli. Another
explanation is that the randomization of the images reduced the strength of response to each one.
For example, if a positive stimulus was presented first followed by a neutral one, there may be
residual response to the positive stimulus that carries over to the neutral image and thus
confounds the neutral response, leading to a lack of differences between the two conditions.
Future research could increase the duration of image presentation and compare longer-term
responses to images and other types of emotional stimuli.
The lack of significance for the personality variables in both parts of the current study
suggests that the LKATS survey does not reliably differentiate between personality patterns or
types of emotional expression in the examined population. Results close to significance in Part 1
suggest a small effect size that is only observable in large samples. For reasons stated in the
Discussion section for Part 1, the LKATS survey may not be appropriate to use in college
samples. Limitations on this study include small sample size and a homogenous sample. All
participants were selected from psychology classes at Roanoke College, which is a
predominantly Caucasian female subject pool. It is possible that a more diverse sample is needed
to observe effects of personality on emotional expression.

Personality and Physiological Reactions 28
Research on emotional reactivity to stimuli is useful in the field of clinical psychology in
that many psychological disorders involve distinct emotional characteristics. These
characteristics can be examined using physiological measurements and used as diagnostic aids,
reports of treatment progression, and methods of gaining insight into the physiological and
biological nature of psychological disorders. Physiological data is a tool that is becoming more
popular because of its objectivity and ability to measure processes that are not directly
observable in a client, and they are more reliable than self-report methods over time (Nishith, et.
al., 2002; Richard & Huprich, 2011). HR has been useful in assessing fear activation and
habituation in treatments for rape victims with PTSD (Nishith, Griffin, & Weaver, 2002), and
GSR has been studied in newborn babies to determine when their “emotional sweating” response
develops (Gladman & Chiswick, 1990). Physiological differences in relation to personality traits
have been observed in other research; for example, Weinberger, Schwartz, and Davidson (1979)
found that those who actively repressed anxiety but self-reported low levels of anxiety had
significantly higher skin conductance levels than those with openly low or high anxiety levels.
Although dissimilar to previous research in the area, the current study adds to this clinical
literature in its investigation of clinically relevant personality patterns and emotional expression.

Personality and Physiological Reactions 29
References
Abdou, A. M., Higashiguchi, S., Horie, K., Kim, M., Hatta, H., & Yokogoshi, H. (2006).
Relaxation and immunity enhancement effects of γ-aminobutyric acid (GABA)
administration in humans. Biofactors, 26(3), 201-20.
Bono, J. E., & Vey, M. A. (2007). Personality and emotional performance: Extraversion,
neuroticism, and self-monitoring. Journal of Occupational Health Psychology, 12(2),
177- 192.
Boyce, P., & Mason, C. (1996). An overview of depression-prone personality traits and the role
of interpersonal sensitivity. Australian and New Zealand Journal of Psychiatry, 30 (1),
90-103.
Brouwer, A. M., Van Wouwe, N., Muehl, C., Van Erp, J. B., & Toet, A. (2013). Perceiving
blocks of emotional pictures and sounds: Effects on physiological variables. Frontiers in
Human Neuroscience, 7, 295.
Burbridge, J. A., Larsen, R. J., & Barch, D. M. (2005). Affective reactivity in language: the role
of psychophysiological arousal. Emotion, 5(2), 145-153.
Codispoti, M., Surcinelli, P., & Baldaro, B. (2008). Watching emotional movies: Affective
reactions and gender differences. International Journal of Psychophysiology, 69(2), 90-
95.
Coles, M.G., & Rugg, M.D. (1995). Event-related brain potentials: An introduction. New York:
Oxford University Press.
Ekman, P. (1984). Expression and the nature of emotion. In K. Scherer & P. Ekman (Eds.),
Approaches to Emotion, (pp. 319-344). Hillsdale, NJ: Erlbaum.
Ekman, P. (1992). An argument for basic emotions. Cognition & Emotion, 6(3-4), 169-200.

Personality and Physiological Reactions 30
Funder, D. C. (1997). The personality puzzle. WW Norton & Co.
Gladman, G., & Chiswick, M. L. (1990). Skin conductance and arousal in the newborn. Archives
of disease in childhood, 65(10 Spec No), 1063-1066.
Graham, F. K., & Clifton, R. K. (1966). Heart-rate change as a component of the orienting
response. Psychological bulletin, 65(5), 305-320.
Gross, J. J. & Levenson, R. W. (1995) Emotion elicitation using films. Cognition and Emotion, 9
(1), 87-108.
Hagemann, D., Naumann, E., Maier, S., Becker, G., Lürken, A., & Bartussek, D. (1999). The
assessment of affective reactivity using films: Validity, reliability and sex
differences. Personality and Individual Differences, 26(4), 627-639.
Hirschfield, R. M. A., Klerman, G. L., Clayton, P. J., Keller, M. B., & Andreasen, N. C. (1984).
Personality and gender-related differences in depression. Journal of Affective Disorders,
7, 211-221.
Höller, Y., Thomschewski, A., Schmid, E. V., Höller, P., Crone, J. S., & Trinka, E. (2012).
Individual brain-frequency responses to self-selected music. International Journal of
Psychophysiology, 86(3), 206-213.
Husain, G., Thompson, W. F., & Schellenberg, E. G. (2002). Effects of musical tempo and mode
on arousal, mood, and spatial abilities. Music Perception, 20(2), 151-171.
Keltner, D. (1996). Facial expressions of emotion and personality. In C. Magai & S. H.
McFadden (Eds.), Handbook of emotion, adult development, and aging (pp. 385-401).
San Diego: Academic Press, Inc.
Khalfa, S., Isabelle, P., Jean-Pierre, B., & Manon, R. (2002). Event-related skin conductance
responses to musical emotions in humans. Neuroscience letters, 328(2), 145-149.

Personality and Physiological Reactions 31
Lazare, A., Klerman, G. L., & Armor, D. J. (1966). Oral, obsessive, and hysterical personality
patterns: An investigation of psychoanalytic concepts by means of factor analysis.
Archives of General Psychiatry, 14(6), 624-630.
Lazarus, R. S. (1968) Emotions and adaptation: Conceptual and empirical relations. Nebraska
Symposium on Motivation, 16, 175-266.
Lefrancois, G. R. (2012). Theories of learning: What the professor said (6th ed.). Belmont, CA:
Wasdworth. ISBN 978-1-111-82974-2.
Lisetti, C. L., & Nasoz, F. (2004). Using noninvasive wearable computers to recognize human
emotions from physiological signals. EURASIP Journal on Applied Signal
Processing, 2004, 1672-1687.
Nakasone, A., Prendinger, H., & Ishizuka, M. (2005). Emotion recognition from
electromyography and skin conductance. In Proc. of the 5th International Workshop on
Biosignal Interpretation, 219-222.
Nishith, P., Griffin, M. G., & Weaver, T. L. (2002). Utility of the heart rate response as an index
of emotional processing in a female rape victim with posttraumatic stress
disorder. Cognitive and Behavioral Practice, 9(4), 302-307.
Overman, A. A., Hoce, J., Dale, J. A., Cross, J. D., & Chien, A. (2003). EEG alpha
desynchronization in musicians and nonmusicians in response to changes in melody,
tempo, and key in classical music. Perceptual and Motor Skills, 97(2), 519-532.
Richard, D. C., & Huprich, S. K. (Eds.). (2011). Clinical psychology: Assessment, treatment, and
research. San Diego: Academic Press, Inc.

Personality and Physiological Reactions 32
Rottenberg, J., Ray, R.D., & Gross, J.J. (2007) Emotion elicitation using films. In J.A. Coan &
J.J.B. Allen (Eds.), The handbook of emotion elicitation and assessment. London: Oxford
University Press.
Sammler, D., Grigutsch, M., Fritz, T., & Koelsch, S. (2007). Music and emotion:
Electrophysiological correlates of the processing of pleasant and unpleasant
music. Psychophysiology, 44(2), 293-304.
Shapiro, D. (1965). Neurotic styles. New York: Basic Books, Inc.
Smith, C. A., & Lazarus, R. S. (1990). Emotion and adaptation. (p. 557). New York: Oxford
University Press.
Temoshok, L. (1986). Personality, coping style, emotion and cancer: Towards an integrative
model. Cancer surveys, 6(3), 545-567.
Teplan, M. (2002). Fundamentals of EEG measurement. Measurement science review, 2(2), 1-
11.
Weinberger, D. A., Schwartz, G. E., & Davidson, R. J. (1979). Low-anxious, high-anxious, and
repressive coping styles: Psychometric patterns and behavioral and physiological
responses to stress. Journal of abnormal psychology, 88(4), 369-380.
Whitson, E. R. & Dievendorf, F. (April, 1987). Hysterical and obsessive personality and TAT
responses. Paper presented at the annual meeting of the Eastern Psychological
Association at Arlington, VA.
Zhang, J., Kalinowski, J., Saltuklaroglu, T., & Hudock, D. (2010). Stuttered and fluent speakers'
heart rate and skin conductance in response to fluent and stuttered speech. International
Journal of Language & Communication Disorders, 45(6), 670-680.

Personality and Physiological Reactions 33
Appendix A: Film Clip descriptions
Neutral
Length Description Movie Sound/
Silent
1 30.81s Mass production of potato chips. Chips
move past screen on a conveyor belt.
Discovery Channel How It’s Made
Pringles Episode
Silent
2 30.00 A rainbow ribbon of light shifts and
moves
Amazing Screen Saver for Windows
7 [Full HD – 1080p] Youtube
Silent
3 29.48s An abstract moving object of light and
color dances on screen
Flurry Screen Saver from Mac
Computer
Silent
4 29.65s Traveling along a mountain road.
Mountains, trees, and clouds populate
the background.
♥♥ Yellowstone's Tower General Store to
Canyon Village (3 of 5)
YouTube
Sound
5 30.15s Ducks and geese swimming and eating
bread thrown onto the shore.
Very Cute Carolina Ducks Swimming in a
Pond, Water, Eating
YouTube
Sound
6 29.0 Traveling along a mountain road.
Mountains, trees, and clouds populate
the background.
♥♥ Yellowstone's Tower General Store to
Canyon Village (3 of 5)
YouTube
Sound
Sad Clips
Length Description Movie Sound/
Silent
1 29.88s A man on a screen wished he could be at her wedding. They
both cry as he says goodbye.
Armageddo
n
Sound
2 30.0s A little boy cries as he asks his dead father to wake up. Champ Sound
3 30.18s A sick man stumbles and falls in the rain while calling to his son
who is getting into a car with his family. They hear the man
calling and run over to be with him as he dies.
Click Sound
4 30.0s A son confronts his father in prison. He writes on a piece of
paper that he forgives what he has done and they both cry.
Venia
(Forgivenes
s)
Silent
5 31.50s A man cries at his brother’s grave because he wasn’t able to
save him in a battle. A woman tries to comfort him.
Legends of
the Fall
Silent
6 30.53s A man runs through a crowd and into a bathroom to find his
brother shot dead on the floor. He cradles his body as he sobs.
American
History X
Silent

Personality and Physiological Reactions 34
Disgust Clips
Length Description Movie Sound/
Silent
1 30.13s A woman breaks the ankles of a man tied to a bed. She used a
sledge hammer and beats his feet against a block of wood.
Misery Silent
2 30.15s An eye surgeon performs Lasik eye surgery which includes
cutting off a flap of the cornea. The scene shows the doctor
touching the patient’s eye with various instruments.
Discovery
How It’s
Made Lasik
Eye Surgery
Silent
3 30.64s A witch doctor chants some incantations then reaches into a
captive man’s chest to pull out his still beating heart/
Indiana
Jones and
the Temple
of Doom
Silent
4 30.0s Thousands of rats take over a room. A woman falls into a pit full
of them and they crawl over her and fall on top of her.
The Rats Sound
5 30.08s A man wakes up in a bed with blood on his hands and legs. He
throws back the covers to find a bloody severed horse head and
he screams.
The
Godfather
Sound
6 30.0s A man cuts off a woman’s dangling bloody eyeball and pus oozes
out of her bleeding face.
Hostel Sound
Happy Clips
Length Description Movie Sound/
Silent
1 29.59s A man in a military uniform kisses a factory worker while the
other workers look on. He picks her up and carries her out of the
factory while the others cheer. The man and woman smile and
laugh.
An Officer
and a
Gentleman
Silent
2 30.33s People gather on an airport tarmac. A man looks around the area
and sees his little son running towards him. They hug and are
joined by a woman, presumably the boy’s mother.
Armageddo
n
Silent
3 30.36s A man dressed as an old woman cooks dinner, but catches the
female body suit on fire.
Mrs.
Doubtfire
Silent
4 30.0s A woman and a man are talking at a New Year’s Eve party. The
woman is moved to tears and the two embrace and kiss.
When Harry
Met Sally
Sound
5 24.0s A young man raises his hand to ask a man in a wheel chair about
dodging balls. The old man throws a wrench at the boy which hits
him in the face.
Dodgeball Sound
6 30.07s A priest prepares to give a wedding speech, but he has a terrible
speech impediment.
The Princess
Bride
Sound

Personality and Physiological Reactions 35
Appendix B: Images borrowed from Fall 2013 Neuro Seminar at Roanoke College
Positive picture stimuli

Personality and Physiological Reactions 36
Neutral picture stimuli
Personality and Physiological Reactions 37
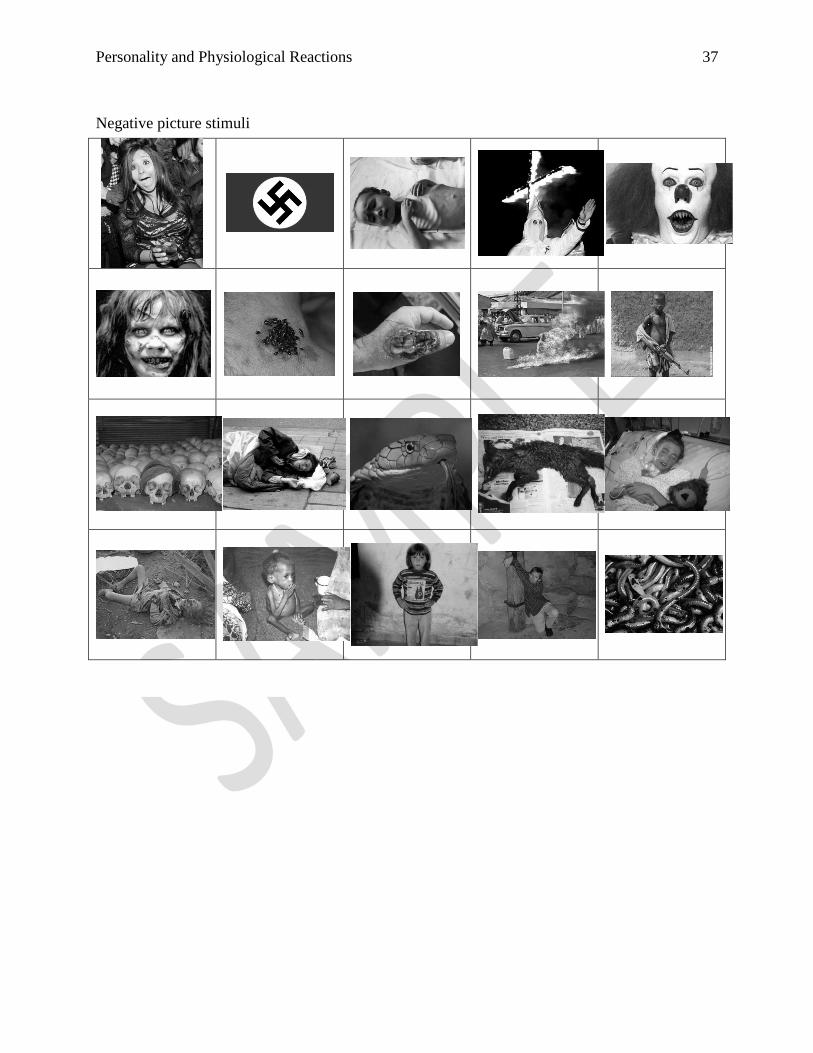
Negative picture stimuli

Personality and Physiological Reactions 38
Appendix C: Emotionality subscale questions taken from the larger LKATS survey (Lazare,Klerman, &
Armor, 1966). LKATS questions are mixed with other non-LKATS questions.
Please read each of the following statements carefully. If you agree with the statement, or if it is generally
true for you, write “T” on the line before it. If you do not agree with it, or if it is generally not true for
you, then write “F” on the line. Please make a response for each statement.
1. _____ I enjoy the outdoors.
2. _____ I am calm and placid most of the time.
3. _____ I am rather sensitive, impressionable, and easily stirred.
4. _____ I have intense likes and dislikes.
5. _____ I often find myself daydreaming.
6. _____ My feelings and emotions are easily aroused.
7. _____ It takes a good deal to make me angry.
8. _____ I give full vent to my sentiments when I am stirred.
9. _____ I have one or two hobbies that I am very passionate about.
10. _____ I take pride in my ability to control my emotions.
11. _____ I display “temper” when the occasion warrants it.
12. _____ I am considered somewhat excitable by my friends.
13. _____ I can easily focus on a task for long periods of time.
14. _____ I usually express myself with caution and restraint.
15. _____ I find it difficult to control my emotions.
16. _____ Interacting with people has never been a problem for me.
17. _____ I am moderate in my tastes and sentiments.
18. _____ I have a habit of waking up early, even if I don’t need to.
19. _____ My emotional life is marked by moderation and balance.
20. _____ I do things in a leisurely sort of way without worry or irritation