personalized learning instructional staff survey … paper personalized learning instructional staff...
TRANSCRIPT

Working Paper
Personalized Learning Instructional Staff Survey Results (Spring 2014)
Kyle Siler-Evans, Elizabeth D. Steiner, Laura S. Hamilton, and John F. Pane
RAND Education
WR-1062-BMGFNovember 2014 Prepared for the Bill & Melinda Gates Foundation
RAND working papers are intended to share researchers’ latest findings and to solicit informal peer review. They have been approved for circulation by RAND Education but have not been formally edited or peer reviewed. Unless otherwise indicated, working papers can be quoted and cited without permission of the author, provided the source is clearly referred to as a working paper. RAND’s publications do not necessarily reflect the opinions of its research clients and sponsors.
is a registered trademark.

Personalized Learning Instructional Staff Survey Results (Spring 2014) Kyle Siler-Evans, Elizabeth Steiner, Laura Hamilton, and John Pane
The purpose of this document is to descriptively summarize instructional staff responses to a survey administered by RAND in 23 personalized learning (PL) schools in Spring 2014. This work was performed at the request of the Bill & Melinda Gates Foundation (BMGF), as part of a multi-year evaluation contract. The 23 schools were selected from a larger portfolio of PL schools funded directly or indirectly by BMGF because they implemented PL school-wide during both of the two academic years and they also administered Northwest Evaluation Association’s (NWEA) Measures of Academic Progress (MAP) both years.
Teaching Context
1. Please indicate your current title. Written responses (N=52)
Teacher (10 Responses) Math teacher (2) English Teacher (2) Classroom Teacher (2)
Third Grade Teacher (2) Fourth grade mathematics teacher
4th Grade Lead Teacher
4th grade teacher
4th Grade Literacy Teacher 4th Grade Math Teacher - Flex Space
6th and 7th Grade Math Teacher
6th Grade Teacher
7th Math/ Science Teacher 7th Grade Teacher 7th Grade Math Teacher
8th Math
8th grade ELA teacher 8th Grade Teacher / Blended Learning Specialist
English 10 Teacher Tutor
High school English 2 Teacher for sophomores
Fifth Grade Guided Reading teacher
Math & English teacher
Resource Specialist (2)
Special Education Coordinator/Teacher
Mathematics Blended Learning Instructor
ELA Literacy Learning Lab Teacher
Behavior Specialist, Special Education Teacher
5th grade Math and Science teacher
Special Educator History Teacher
Special Education Teacher (2) Reading Learning Lab Teacher English Language Arts Teacher
Biology teacher
Spanish title
2. In addition to your work instructing students, do you also serve in any of the following formal roles this year? (N=48) Multiple selections allowed.
None of the above 46% Other (see below) 15% Department head or lead teacher 13% Coach or mentor for other teachers 11% Master teacher 6% PD provider 6% Guidance counselor or provider of nonacademic support to students 6% Technology support provider 4% Administrator (e.g., assistant principal) 0%
Written responses for Other: Run a once a week S.T.E.M after school program & On recruitment team; Case Manager; Co-Teacher; Instructional Leadership Team; Interventionist; Special education coordinator

2
3. Which of the following best describes your teaching arrangement this year?
N I teach several classes of different students during the day in a particular subject or perhaps two subjects (Traditional secondary arrangement; sometimes called “subject-specific,” “subject matter specialist,” or “departmentalized”.)
52 76%
“Pull-Out” or “Push-In” Instruction: I mainly teach selected students released from (or in) their regular classes in specific skills or to address specific needs (for example, special education, reading, English as a second language, gifted and talented.)
52 10%
I teach a single group of students all or most of the day in multiple subject areas. (Traditional elementary arrangement; sometimes called "self-contained".) 52 8%
Co-teaching or Job Share: I am one of two or more teachers who are jointly responsible for teaching the same subject(s) to a group of students (for example, in the same classroom), all or most of the day and/or in a majority of classes.
52 4%
I work with individuals or small groups of students under the supervision of another teacher 52 2% I primarily supervise the work of other teachers rather than directly instructing students 52 0% I teach students exclusively online, with no in-person interaction 52 0% Other, please describe 52 0%
4. What subject area(s) are you teaching (or supervising) this year (2013-2014)? (N=52)Multiple selections allowed.
English/language arts/reading/writing 61% Mathematics 54% Science 22% Social Studies 22% Other subject area(s) 10% Foreign Language 2% Career/technical education 2% Visual or performing arts 0% Physical Education/Health Education 0%
Written responses for Other: Advisory; Online Learning Programs; Study skills.

3
5. Please indicate the grade levels of the students you teach. (N=52)Multiple selections allowed.
Kindergarten 2% 1st grade 2% 2nd grade 4% 3rd grade 6% 4th grade 15% 5th grade 19% 6th grade 15% 7th grade 20% 8th grade 9% 9th grade 20% 10th grade 15% 11th grade 7% 12th grade 6% Our school doesn’t use grade levels 0%
6. What percentage of the students you teach:
Have individualized education programs (IEPs) for special education services? % Are considered English Language Learners or Limited English Proficient? % Participate in a gifted and talented program? %
N Maximum Mean Median
Percent IEP 48 100% 21% 10% Percent ELL 43 99% 35% 20% Percent Gifted 40 10% 1% 0%
Your Background
7. Including this school year (2013-2014), how many total years have you been teaching, regardless oflocation?
N Minimum Maximum Mean Median
Years Teaching 51 1 17 4.5 3

4
8. Prior to teaching, did you have a career outside the field of education?
N Yes No
51 24% 76%
9. Was your previous career focused on technology?
N Yes No
51 6% 94%
10. Do you hold a regular or standard certificate to teach in this state?
N Yes No, but I am currently
enrolled in a certification program
No, and I am not currently enrolled in a certification
program 51 78% 16% 6%
11. In what content area and grade range does your certificate allow you to teach? (N=40) Multiple selections allowed.
At least one of grades 6-8 63%
Early childhood, preschool, or at least one of grades K-5 46% At least one of grades 9-12 37%
12. Through which of the following types of programs did you enter teaching?
N Checked “yes” Through an alternative teacher preparation program (for example, Teach for America, or a program aimed at mid-career changers) 27 53%
Through an undergraduate teacher preparation program 11 22%
Through a graduate teacher preparation program 10 20%
No formal preparation program 2 4% Courses taken after attainment of undergraduate/bachelors degree, but not as part of a formalized graduate or alternative teacher preparation program 1 2%
Other, please describe 0 0%

5
13. To what extent did each of the following influence your decision to accept a teaching position in your current school?
N Moderate or
Large Extent Fit with your background, education, experience, and/or interests 50 66% Opportunity to work with disadvantaged students 50 60% Friendliness of the staff you met 50 48% Opportunities for career advancement 50 48% Location 50 48% Salary level or benefits (for example, vacation time, retirement plan) 50 46% It was the first or only job you were offered 50 44% Supports available (for example, mentoring, professional development) 50 44% Interest in an environment that emphasizes personalized learning 50 40% Interest in working in a technology-rich environment 49 39% You were placed in the school by your teacher preparation program 51 33% You were recruited by, or previously worked with, an administrator or teacher in this school 50 30%
Working conditions (for example, length of work day, autonomy to run your own class) 50 20%
Opportunities to earn additional compensation 50 20% You were asked to move from another school in your current charter management organization (CMO) to this school 49 2%
6
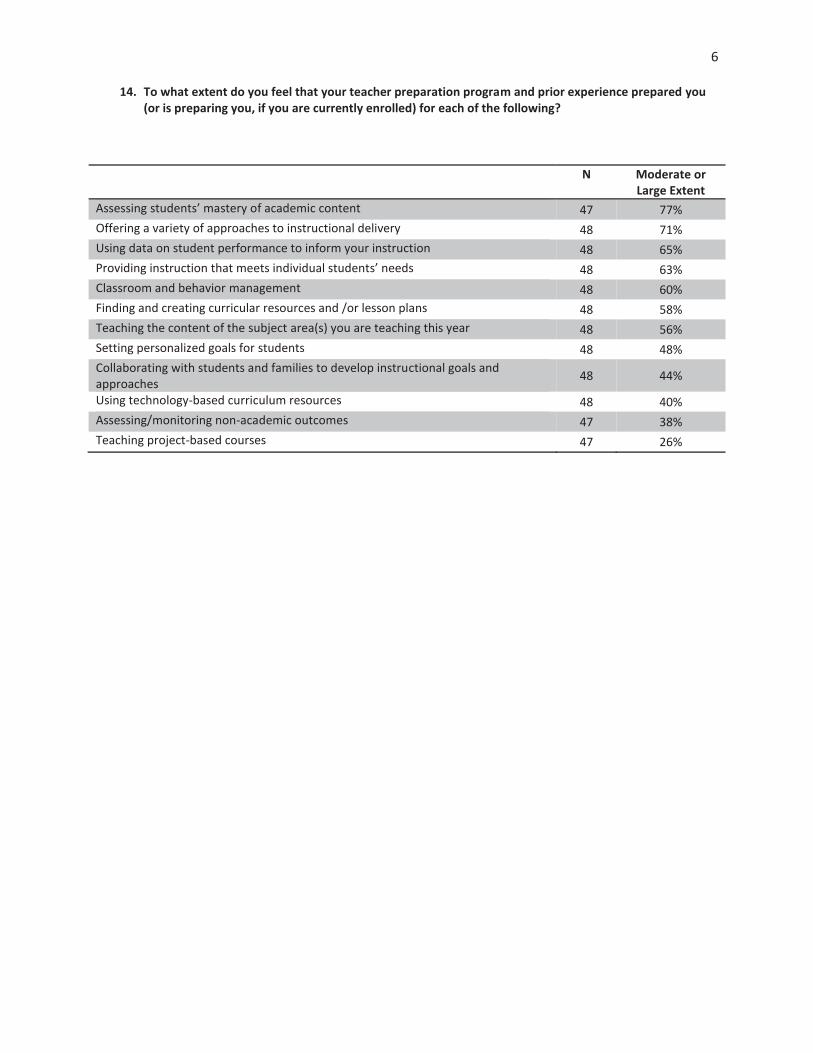
14. To what extent do you feel that your teacher preparation program and prior experience prepared you (or is preparing you, if you are currently enrolled) for each of the following?
N Moderate or
Large Extent Assessing students’ mastery of academic content 47 77% Offering a variety of approaches to instructional delivery 48 71% Using data on student performance to inform your instruction 48 65% Providing instruction that meets individual students’ needs 48 63% Classroom and behavior management 48 60% Finding and creating curricular resources and /or lesson plans 48 58% Teaching the content of the subject area(s) you are teaching this year 48 56% Setting personalized goals for students 48 48% Collaborating with students and families to develop instructional goals and approaches 48 44%
Using technology-based curriculum resources 48 40% Assessing/monitoring non-academic outcomes 47 38% Teaching project-based courses 47 26%

7
School Environment and Supports for Teaching
15. Please indicate whether the following characteristics, or layouts of physical space, exist in your school. For each that does exist in your school, please indicate the extent to which it facilitates or hinders personalized learning.
13%
45%
51%
60%
68%
74%
0% 20% 40% 60% 80% 100%
Classroom furniture easy rearranged
Large, open instructional spaces
Comfortable, non-traditional classroom furniture, suchas couches, floor pillows, rugs or stuffed chairs
Classroom furniture cannot be rearranged
Open instructional spaces with smaller rooms forindividual or small group instruction
Open common areas for student use
Does not exist in my school
17%
19%
23%
28%
36%
77%
0% 20% 40% 60% 80% 100%
Classroom furniture cannot be rearranged
Open common areas for student use
Open instructional spaces with smaller rooms forindividual or small group instruction
Large, open instructional spaces
Comfortable, non-traditional classroom furniture, suchas couches, floor pillows, rugs or stuffed chairs
Classroom furniture easy rearranged
Exists and it facilitates personalized learning

8
Question 15 Full Answer Text and Numbers of Respondents N Traditional classrooms with furniture that cannot be easily rearranged (e.g., large, stationary desks) 47 Traditional classrooms with furniture that is easy to rearrange (e.g., small desks and chairs that can be easily moved) 47
Comfortable, non-traditional classroom furniture, such as couches, floor pillows, rugs or stuffed chairs 47
Large, open instructional spaces 47 Open common areas for student use 47 Open instructional spaces with smaller rooms for individual or small group instruction 47 Other (please describe in this space: ________________________________________________) 32 Note: While 32 respondents checked the “Other” box, only one provided a written description: “Access to wifi and power outlets virtually everywhere on campus” (Exists and it facilitates personalized learning)
16. Are there other staff who share instructional duties with you while you are teaching? Consider staff who provide instruction in the same classroom or space as you, not staff who provide pullout instruction in another location.
N Yes No
46 54% 46%
6%
9%
11%
13%
23%
28%
0% 20% 40% 60% 80% 100%
Open common areas for student use
Open instructional spaces with smaller rooms forindividual or small group instruction
Classroom furniture easy rearranged
Comfortable, non-traditional classroom furniture, suchas couches, floor pillows, rugs or stuffed chairs
Classroom furniture cannot be rearranged
Large, open instructional spaces
Exists and it hinders personalized learning

9
17. In what areas do these staff provide support? Note: results are limited to those who answered Yes to Question 16 (N=25)
Written responses for Other: “support with technology”
Full Answer Text Providing advice, guidance or coaching support to me and/or other staff Providing whole-class instruction on academic content Providing instruction on academic content to small groups of students Providing support targeted toward students with disabilities or English language learners Providing extra academic support for students who are performing below expectations Working with students to improve their motivation. Helping students access social supports Other, please specify
18. To what extent do you find these staff helpful for improving the learning outcomes of your students?
N Extremely helpful
Somewhat helpful
Minimally helpful
Not at all helpful
25 64% 36% 0% 0%
56%
68%
68%
72%
88%
88%
92%
0% 20% 40% 60% 80% 100%
Providing whole-class instruction on academic content
Working with students to improve their motivation
Helping students access social supports
Providing advice, guidance or coaching support to me…
Providing support targeted toward students with…
Providing extra academic support for students who are…
Providing instruction on academic content to small…
Yes Response to Types of Staff Support

10
19. Please indicate whether, in the past year, you received each of the following kinds of supports, and the extent to which you found it helpful for improving your instruction.
N I did not receive this
support Observation of and feedback on your lessons by other teachers 45 60% Release time to observe other teachers 46 57% Informal mentor 46 50% Formally assigned mentor or coach 46 22% Access to professional learning communities where you can discuss concerns or engage in instructional planning with other teachers 46 20%
Common planning time (formally scheduled) with other teachers 46 11% Observation of and feedback on your lessons by administrators 45 7% N Support was somewhat
or very helpful Formally assigned mentor or coach 46 74% Informal mentor 46 43% Release time to observe other teachers 46 41% Observation of and feedback on your lessons by other teachers 45 38% Observation of and feedback on your lessons by administrators 45 87% Common planning time (formally scheduled) with other teachers 46 83% Access to professional learning communities where you can discuss concerns or engage in instructional planning with other teachers 46 76%

11
20. Please indicate your level of agreement with each of the following statements about all of your professional development experiences during the current school year (2013-2014, including summer 2013).
N Agree or Strongly
Agree Have encouraged me to study my own practice and try to improve it 46 91% Have been useful for improving my instruction 46 89% Have been designed to address needs revealed by analysis of student data 46 83% Have been well aligned with the Common Core State Standards or other standards that my state or district has adopted 46 78%
Have helped me implement the technology used in my classroom 46 76% Have been well aligned with the curriculum materials I use 46 72% Have familiarized me with a variety of approaches to instructional delivery 46 70% Have helped me understand how to personalize goals for students 45 69% Have helped me understand how to offer instruction that addresses individual students’ needs 45 64%
Have addressed ways to collaborate with students and families to develop instructional goals and approaches 46 63%
Have taken more time than they were worth1 46 50% Have tried to cover too many topics1 46 48% 1 Note negative framing

12
21. Rate your level of agreement with each of the following statements about your school. N Agree or Strongly
Agree The teachers at my school are highly focused on the mission of improving student learning. 45 100%
The teachers at my school are effective at improving student learning. 44 100% The teachers at my school have high expectations for all students. 45 98% I feel accepted and respected as a colleague by staff members at my school. 45 96% The teachers at my school collaborate well with one another. 45 93% Teachers at my school support each other in their efforts to improve teaching. 45 93%
There is someone at my school I can turn to if I need help improving my teaching. 44 93%
Administrators at my school are highly focused on student learning. 45 91% Administrators at my school are highly supportive of teachers. 44 86% Parents and other family members are involved in students’ education. 45 84% Students in this school are motivated to achieve. 45 84% If I had concerns about my school, I would feel comfortable raising them with administrators at the school. 45 82%
Students in this school respect the school staff. 45 78% Administrators at my school trust teachers to make decisions about their own instruction. 45 78%
Students in this school respect one another. 45 73%

13
22. Please indicate the extent to which each of the following conditions is an obstacle to your efforts to promote student learning using technology such as computers, smartphones, or tablets. If the condition does not exist in your school, please mark “Not applicable”. Respondents who marked “Not applicable” are included in the denominator for the percentages shown below.
N Condition is Minor
or Major Obstacle
Inadequate technology skills among students 44 55% Inadequate opportunities for teachers to provide input on how technology is used 44 50%
Inadequate opportunities to participate in professional development related to technology use 44 45%
Excessive amounts of time I need to spend developing content for technology-based instruction 44 41%
An inadequate number of computers or devices to accommodate all students 44 39%
Lack of high-quality content for technology-based instruction 44 39% Lack of support from technology specialists or other staff who can provide technical support 44 39%
Lack of alignment between the content students learn online and the content that I am trying to teach 44 36%
Slow Internet connection or inadequate bandwidth 44 27%
Lack of flexibility in deciding how I can use technology in my instruction 44 20% Problems with hardware, such as insufficient computing power or lack of compatibility with software 44 20%
My own limited technology skills 44 18%

14
23. Please indicate the extent to which each of the following conditions is an obstacle to your efforts to promote personalized learning for students. If the condition does not exist in your school, please mark “Not applicable”. Respondents who marked “Not applicable” are included in the denominator for the percentages shown below.
N Condition is Minor
or Major Obstacle Too much diversity in achievement levels among my students 43 63% An inadequate amount of time to prepare personalized lessons for all students 43 60% Excessive amounts of time I need to spend developing personalized content 42 60% High levels of student disciplinary problems 43 53% Too many students for whom I am responsible 42 50% Lack of high-quality content or materials 43 49% Pressure to cover specific material as a result of state or district standards or testing requirements 43 47%
My own limited knowledge of how to effectively personalize instruction 43 44% Lack of flexibility in the curriculum I am required to teach (i.e., need to teach specific material in a specific timeframe) 43 42%
Scheduling constraints 43 40% Inadequate opportunities to participate in professional development related to personalizing learning 43 40%
Too much variation in age or maturity among my students 43 37% High levels of student absenteeism 43 26% Lack of support from school administration 43 23% Inadequate data to help me personalize students’ instruction 43 14%
24. Does your school focus support and professional development more on the mechanics of how to use technology or more on how to integrate technology into the curriculum?
N Mechanics of using technology
Integrating technology into curriculum
43 23% 77%
25. Which would be more useful to you: focusing on the mechanics or focusing on how to integrate technology?
N Mechanics of using
technology Integrating technology into
curriculum 43 7% 93%
15
Use of Student Assessment Data
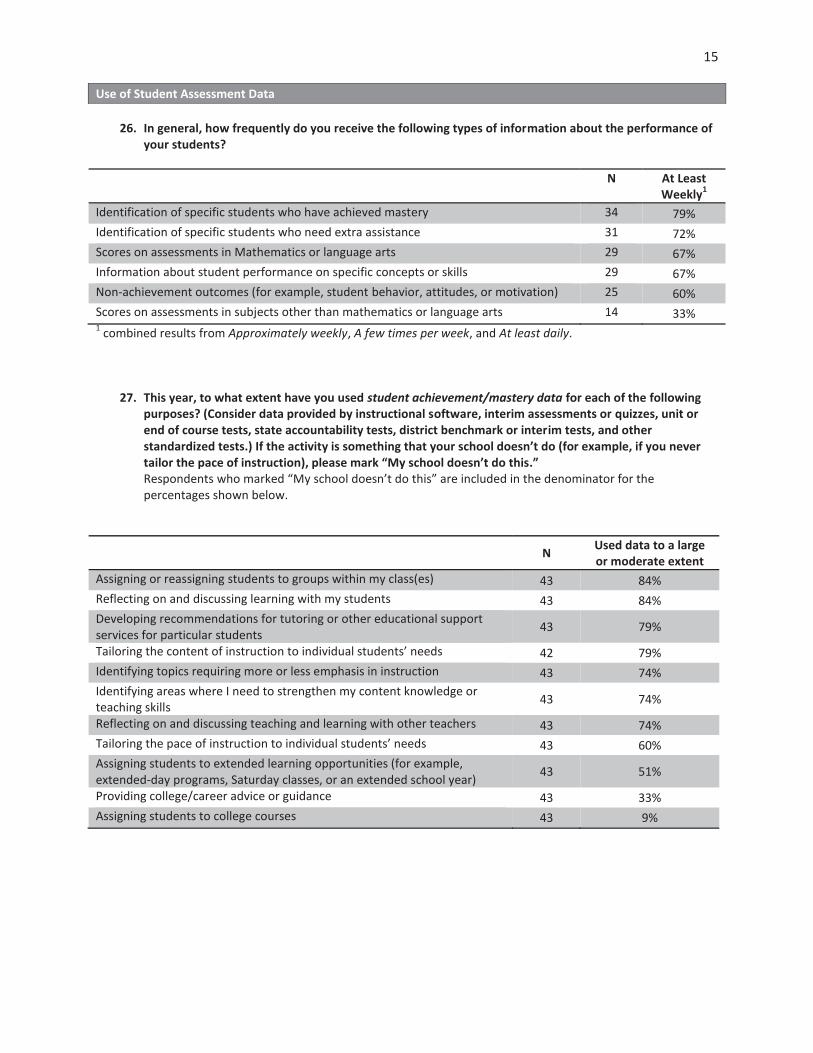
26. In general, how frequently do you receive the following types of information about the performance of your students?
N At Least
Weekly1 Identification of specific students who have achieved mastery 34 79% Identification of specific students who need extra assistance 31 72% Scores on assessments in Mathematics or language arts 29 67% Information about student performance on specific concepts or skills 29 67% Non-achievement outcomes (for example, student behavior, attitudes, or motivation) 25 60% Scores on assessments in subjects other than mathematics or language arts 14 33% 1 combined results from Approximately weekly, A few times per week, and At least daily.
27. This year, to what extent have you used student achievement/mastery data for each of the following purposes? (Consider data provided by instructional software, interim assessments or quizzes, unit or end of course tests, state accountability tests, district benchmark or interim tests, and other standardized tests.) If the activity is something that your school doesn’t do (for example, if you never tailor the pace of instruction), please mark “My school doesn’t do this.” Respondents who marked “My school doesn’t do this” are included in the denominator for the percentages shown below.
N Used data to a large
or moderate extent Assigning or reassigning students to groups within my class(es) 43 84% Reflecting on and discussing learning with my students 43 84% Developing recommendations for tutoring or other educational support services for particular students 43 79%
Tailoring the content of instruction to individual students’ needs 42 79% Identifying topics requiring more or less emphasis in instruction 43 74% Identifying areas where I need to strengthen my content knowledge or teaching skills 43 74%
Reflecting on and discussing teaching and learning with other teachers 43 74% Tailoring the pace of instruction to individual students’ needs 43 60% Assigning students to extended learning opportunities (for example, extended-day programs, Saturday classes, or an extended school year) 43 51%
Providing college/career advice or guidance 43 33% Assigning students to college courses 43 9%

16
28. This year, have you used data on non-achievement outcomes (for example, student behavior, attitudes, or motivation?
N Yes No
43 72% 28%
29. This year, to what extent have you used data on non-achievement outcomes (for example, student behavior, attitudes, or motivation) for each of the following purposes? Note: Results are limited to those who selected Yes to Question 28.
N Used data to a moderate
or large extent Reflecting on and discussing learning with my students 31 74% Developing recommendations for tutoring or other support services for particular students 31 65%
Assigning or reassigning students to groups within my class(es) 31 55% Tailoring the pace of instruction to individual students’ needs 31 48% Tailoring the content of instruction to individual students needs 31 48% Assigning or reassigning students to classes or to content 30 47% Providing college/career advice or guidance 30 23%

17
30. Please indicate your level of agreement with each of the following statements. N Agree or strongly agree Our school’s data system includes achievement measures that provide information about students of varying achievement levels. 43 91%
I have access to high-quality assessment data that help me adapt the pace or content of instruction to meet students’ needs. 43 86%
I have the necessary skills and experience to use data to guide my instruction. 43 84% Our school’s data system provides information at a level of detail that helps me inform my instruction (e.g., breakdowns for specific skills or topics). 43 79%
Our school’s data system is easy to use. 42 76% It is easy to create custom assessments that evaluate what students are learning. 43 72%
I can use the school’s data system to easily produce the views or reports I need. 42 71%
I need additional training or professional development to interpret and make use of all of the data I receive.1 43 63%
The assessment data in our school’s data system are not useful for decision making because they do not provide good information about students who are far above or below what would be expected based on their ages or grade levels.1
43 44%
There is too much data in our school’s data system to be of use.1 43 37% 1 Note negative framing
31. Does your school focus support and professional development more on the mechanics of generating student data (e.g., running reports) or more on how to use student data to inform your instruction?
N Mechanics of generating data
Using data to inform instruction
43 12% 88%
32. Which would be more useful to you: focusing on the mechanics or focusing on how to use student data?
N Mechanics of generating data
Using data to inform instruction
43 14% 86%
33. Does your school use frequently-updated, shared documents, either paper or electronic (such as learner profiles and learning plans), to document each student’s strengths, weaknesses, and goals along with individualized plans to accomplish those goals?
N Yes No
43 63% 37%

18
34. Do your school’s learner profiles or learning plans have these attributes?
(By learner profiles and learning plans, we mean documents about student strengths, weaknesses, and goals, and individualized plans to accomplish those goals)
Note: Results are limited to those who selected Yes to Question 33.
These documents… N True to a great extent
Are routinely accessed/updated by teachers 26 42% Exists for every student 27 41% Summarize the student’s strengths, weaknesses, and progress, drawing on multiple sources of information, including standardized tests and other information
27 41%
Set forth a personalized plan for students to accomplish instructional goals 27 37% Are frequently updated to incorporate new information 27 33% Are routinely accessed/updated by students 27 30% Summarize the student’s goals, interests, and aspirations 27 19% Are routinely accessed/updated by parents or guardians 26 15%
These documents… N True to some extent or to a great extent
Summarize the student’s strengths, weaknesses, and progress, drawing on multiple sources of information, including standardized tests and other information
27 96%
Are frequently updated to incorporate new information 27 89% Set forth a personalized plan for students to accomplish instructional goals 27 89% Are routinely accessed/updated by teachers 26 88% Exists for every student 27 81% Summarize the student’s goals, interests, and aspirations 27 74% Are routinely accessed/updated by parents or guardians 26 69% Are routinely accessed/updated by students 27 67%

19
Curriculum and Instructional Practices
35. On average throughout the school year, for approximately what portion of instructional time do students use technology for educational purposes? Please consider time students spend using a device such as a computer or smartphone, but not time that they spend watching you or another student use a device. Please include time during which students are simultaneously using technology and engaging in more traditional activities (e.g., taking notes on a tablet while you present a lesson to the class).
Share of instructional time that students use technology
N Mean Minimum Median Maximum 43 50% 10% 45% 99%
36. On average throughout the school year, during the times when students use technology, approximately what percentage of that time are they engaged in the following activities? For this question, please consider only the time students spend using technology such as a computer, smartphone, or tablet throughout the school year. Please estimate the percentage of that time during which students are engaged in the following types of activities.
Note that the results presented here give the average overall instructional time that students are using technology for each of the activities reported below. These results were calculated by taking the product of the overall instructional time spent using technology (Question 35) and the mid-point from the range of time spent on the various activities posed in Question 36. For example, if a teacher reported that students spend 50% of instructional time using technology (Question 35) and 31%-50% of that time was allocated to Reading, then we estimate that 20.25% of total instructional time was allocated to students using technology for reading (50% × 40.5%, which is the mid-point between 31%-50%). The results are then averaged across all teachers who responded to both questions 35 and 36. It is important to note that Question 36 is intended to identify the activities that dominate the time dedicated to technology. The question is not intended to provide a precise measure of the allocation of classroom time. The share of instructional time allocated to the activities below exceeds 100%. This may be explained by three factors: First, the activities are not mutually exclusive. Several of the activities could occur simultaneously, in which case we would expect the total to be greater than 100%. Second, respondents might have overestimated the time spent on the various activities in Question 36 (for example, indicating that 31%-51% of time was spent on each of the 15 categories, resulting in an over-allocation of time). And third, some of the over-allocation of time may have resulted of our use of the midpoint in the calculation explained above; we would tend to overestimate the time spent on each activity if teachers’ estimates are at the low end of the response range but we assign the midpoint value. For these reasons, we do not believe it is appropriate to interpret the percentages in the table below as indicators of the average amount of instructional time allocated to each activity. Instead, they provide a general sense of relative emphasis on different activities.

20
Average share of instructional time that students are using technology for the following activities (Q36) N Average Share of
Instructional Time Using structured curriculum materials online 43 22% Receiving immediate feedback on problem solutions 43 21% Reading 43 16% Solving problems with clear solutions (e.g., multiple-choice math problems or vocabulary drills) 43 14%
Taking assessments 43 13% Solving multi-step, open-ended problems or conducting investigations 43 12% Watching videos, animations, or simulations 42 10% Using online reference materials 43 10% Receiving feedback about strengths and weaknesses from an automated system 43 9%
Receiving problem solving help from an automated tutoring system 43 9% Engaging in discussions or collaborative problem solving with other students in the school 43 8%
Searching for relevant materials on the web 42 8% Receiving help from an online human acting as a teacher, tutor, or mentor 43 7% Adjusting parameters of simulations and observing the results 43 5% Engaging in discussions or collaborative problem solving with other students not from the same school 43 3%

21
37. Please indicate the extent to which you agree with each of the following statements about your
curriculum and instruction.
N Agree or Strongly Agree
When students are working independently, I require them to get through a certain amount of material even if they are working at their own pace 43 93%
I frequently adapt course content to meet students’ needs by providing additional assignments, resources, and activities for remediation or enrichment 43 88%
When students are working on an assignment or activity, they know what the goals of the assignment or activity are 43 88%
I provide a variety of materials or instructional approaches to accommodate individual needs and interests 42 88%
I give students the chance to work through instructional material at a faster or slower pace than other students in this class 43 86%
I frequently regroup students for instruction to address changing learning needs and interests 43 86%
I am usually accessible to students via electronic communication when I am not available face-to-face 43 86%
I clearly present the goal or objective for each assignment 42 86% Students are able to access instructional materials both in and outside of the classroom 43 84%
I connect what students are learning with experiences they have throughout the rest of the school day or outside of school 43 84%
I have devised strategies that allow students to keep track of their own learning progress 43 81%
Students have opportunities to review or practice new material until they fully understand it 43 81%
If students have trouble understanding the material when they are using technology, they are able to get help quickly 43 74%
Different students work on different topics or skills at the same time 43 72% I require students to show that they understand a topic before they can move onto a new topic 43 63%
Students keep track of their own learning progress using technology (for example, by using an online gradebook or portfolio) 43 47%
Students have opportunities to choose what instructional materials (such as books or computer software) they use in class 43 40%
Students have opportunities to choose what topics they focus on in class 43 35%

22
38. I have adequate access to technology-based curriculum materials that: 39. I have adequate access to non-technology-based curriculum materials that:
Agree or strongly agree regarding access to technology- or non-technology-based curriculum materials (Q38 &Q39)
N1
Technology-based curriculum
materials (Q38)
Non-technology-based curriculum materials
(Q39) Are easy for my students to use 43 84% Are easy for me to use in the classroom 43 81% Are of high quality 43 81% 58% Do not require frequent technical support 43 81% Contribute to my efforts to promote college and career readiness 43 74% 60%
Support anytime/anywhere learning by being accessible at other times and in other places 43 72% 37%
Address the learning needs of all of my students 43 60% 51% 1 The same 43 respondents answered both questions
40. Approximately what proportion of the curriculum and instructional materials you use were provided to you by your school or district?
41. Approximately what proportion of the curriculum and instructional materials you use consists of existing material that you searched for (e.g., from websites) to supplement the curriculum that was provided to you?
42. Approximately what proportion of the curriculum and instructional materials you use consists of original material you created to supplement the curriculum that was provided to you?
N None Fewer
than half About
half A
majority All of the materials
Q40: Approximately what proportion of the curriculum and instructional materials you use were provided to you by your school or district?
43 14% 23% 28% 28% 7%
Q41: Approximately what proportion of the curriculum and instructional materials you use consists of existing material that you searched for (e.g., from websites) to supplement the curriculum that was provided to you?
43 5% 35% 21% 37% 2%
Q42: Approximately what proportion of the curriculum and instructional materials you use consists of original material you created to supplement the curriculum that was provided to you?
41 2% 39% 27% 24% 7%