perspectives in oncology in supportive care oncologyin supportive care oncology digging deeper...
TRANSCRIPT

In Supportive Care Oncology
Digging Deeper Updates from ASH 2016
Number 30 • April 2017
Interviews with Dr. Berinstein, Dr. Cheson, Dr. Connors, Dr. LeBlanc, Dr. Owen, and Dr. Peters
P E R S P E C T I V E S I N O N C O L O G Y
MULTIPLE MYELOMA Novel Agent and New Therapy Combinations Provide Effective Treatment in Relapsed Setting
CHRONIC LYMPHOCYTIC LEUKEMIA Longer-Term Follow-Ups Confirm Efficacy and Safety of Alternative Therapies
I N S I D E T H I S I S S U E
ACUTE LEUKEMIASNovel Therapies Demonstrate Efficacy in High-Risk Patients
LYMPHOMASNew Treatments Improve Patient Outcomes Throughout the Continuum of Care in Lymphoma Subtypes
New Evidence in Oncology | April 2017 1
PublisherPaul Borlinha
Medical WritersJane Cheung, PhD Enio Polena, MSc
Cassandra Uchida, PhD
EditorKristine Garcia, MSc, PhD
Art DirectorsJobet Dimaculangan
Glen Cho Andrew Oyen Derrick Tam
Video Editors/ProducersRonaji Naranjo
Casey Nash
Website DesignRonaji Naranjo Connie Fong
New Evidence in Oncology is published by NEW EVIDENCE
67 Mowat Ave., Suite 200 Toronto, Ontario M6K 3E3
Editorial correspondence should be addressed to:
The Editor, NEW EVIDENCE 67 Mowat Ave., Suite 200 Toronto, Ontario M6K 3E3
fax: 416-503-1927 e-mail: [email protected]
website: www.newevidence.com
To join our mailing list or to inquire about subscription information, please contact us
by e-mail: [email protected]
New Evidence in Oncology is also available online at www.newevidence.com
New Evidence in Oncology is a publication that provides oncology specialists with scientific data from research presented at international and Canadian oncology conferences. A special feature of the journal, the Canadian Perspective, gives key opinion leaders a forum to discuss recent developments in oncology and to comment on how these advances may shape Canadian clinical practice. In addition, the Investigator Commentary sections provide information on key clinical studies from interviews with principal investigators. New Evidence also publishes discussion and expert opinion papers on timely topics of interest to oncologists in Canada.
Our April 2017 issue presents coverage from the 58th American Society of Hematology (ASH) Annual Meeting. This issue reports on presentations and perspectives about the latest therapeutic developments in acute lymphoblastic leukemia, acute promyelocytic leukemia, chronic lymphocytic leukemia, Hodgkin lymphoma, non-Hodgkin lymphoma, and multiple myeloma.
We would like to thank Dr. Neil Berinstein, Dr. Joseph Connors, Dr. Richard LeBlanc, Dr. Carolyn Owen, and Dr. Anthea Peters for their Canadian Perspectives. We would also like to thank Dr. Bruce Cheson for his Investigator Commentary.
New this year, the NE Live app was launched to provide physicians with a forum to discuss the latest clinical data presented at national and international conferences. NE Live collaborates with Key Opinion Leaders in Oncology to provide up-to-date, unbiased perspectives and commentary on the latest studies. These perspectives are presented in short videos or in written format, highlighting key takeaways and opinions. Physicians who wish to stay up-to-date with the reports are invited to visit www.newevidence.live, as well as Apple’s App Store or the Google Play store to download the NE Live app.
We also invite you to visit our website at www.newevidence.com any time for the online version of New Evidence and more reports on current research.
www.newevidence.com
www.newevidence.live

2 New Evidence in Oncology | April 2017
Contents MULTIPLE MYELOMA
CHRONIC LYMPHOCYTIC LEUKEMIA
6
Improved Outcomes in Patients with Relapsed/Refractory Multiple Myeloma
• Efficacy of daratumumab, lenalidomide and dexamethasone versus lenalidomide and dexamethasone alone for R/R MM among patients with 1–3 prior lines of therapy based on previous treatment exposure: Updated analysis of POLLUX. (Moreau P, et al. ASH 2016:489)
• Efficacy of daratumumab, lenalidomide and dexamethasone versus lenalidomide and dexamethasone in R/R MM among patients with 1–3 prior lines of therapy: Updated analysis of POLLUX. (Usmani SZ, et al. ASH 2016:1151)
Brief Perspective
15Dr. Richard LeBlanc: Impressive Results from the POLLUX Trial• Efficacy of daratumumab, bortezomib, and dexamethasone versus
bortezomib and dexamethasone in R/R MM based on prior lines of therapy: Updated analysis of CASTOR. (Mateos MV, et al. ASH 2016:1150)
• Results of an early access program of daratumumab in U.S. patients with R/R MM. (Chari A, et al. ASH 2016:2133)
Brief Perspective
23
Dr. Neil Berinstein: Perspective on an Early Access Treatment Protocol of Daratumumab in Patients with R/R Multiple Myeloma • Use of montelukast to reduce infusion reactions in an early access
program of daratumumab in U.S. patients with R/R MM. (Chari A, et al. ASH 2016:2142)
Brief Perspective
26
Dr. Neil Berinstein: Use of Montelukast in Patients with R/R Multiple Myeloma Receiving Daratumumab
28
Long-term Studies Provide Reassurance on Efficacy and Safety of Treatments in Chronic Lymphocytic Leukemia
• Favourable toxicity profile and long-term outcome of elderly, physically fit CLL patients receiving first-line BR chemoimmunotherapy in comparison to FCR in advanced CLL: Update analysis of the CLL10 study. (Eichhorst BF, et al. ASH 2016:4382)
Canadian Perspective
31A Canadian Perspective by Dr. Carolyn Owen on the Updated Analysis of the CLL10 Study that Examined Long-term Outcome of First-line BR Therapy Compared to FCR in Fit, Elderly Patients with CLL
• Updated analysis of overall survival in randomized phase III study of idelalisib in combination with BR in patients with relapsed/refractory CLL. (Zelenetz AD, et al. ASH 2016:231)
• Five-year experience with single-agent ibrutinib in patients with previously untreated and relapsed/refractory CLL/SLL. (O’Brien SM, et al. ASH 2016:233)
• Updated efficacy and safety from the phase III RESONATETM-2 study: Ibrutinib as a first-line treatment option in patients 65 years and older with CLL/SLL. (Barr PM, et al. ASH 2016:234)

New Evidence in Oncology | April 2017 3
ACUTE LEUKEMIAS
CHRONIC LYMPHOCYTIC LEUKEMIA (con't)
LYMPHOMAS
46
Current Insights and Challenges in the Treatment of APL and ALL
• Analysis of the randomized trial, APL2006, on whether arsenic trioxide is required in the treatment of high-risk, newly diagnosed APL. (Ades L, et al. ASH 2016:895)
• ATRA, ATO, and gemtuzumab ozogamicin are safe and highly effective in patients with previously untreated high-risk APL: Final results from SWOG/Alliance/ECOG S0535 Trial. (Lancet JE, et al. ASH 2016:896)
• Reduction of early deaths and improved survival in elderly patients (>60 years) with APL as a result of using a simplified treatment algorithm and expert support: A prospective multicentre trial. (Kota V, et al. ASH 2016:1622)
• Real-life experience with ATRA- and ATO-based regimen in APL: Updated results of the prospective German intergroup Napoleon registry. (Platzbecker U, et al. ASH 2016:2815)
• Results from a randomized study of pegaspargase and calaspargase pegol in pediatric patients with newly diagnosed acute lymphoblastic leukemia or lymphoblastic lymphoma. (Silverman LB, et al. ASH 2016:175)
• Anti-pegaspargase, anti-calaspargase pegol, and anti-polyethylene glycol antibody incidence in high-risk ALL patients receiving pegaspargase or calaspargase pegol and associated anaphylactic or hypersensitivity reaction rates. (Schore RJ, et al. ASH 2016:3965)
62
New Treatments Improve Outcomes for Patients with Lymphoma Throughout the Continuum of Care
• Obinutuzumab plus bendamustine followed by obinutuzumab maintenance prolongs OS compared with bendamustine alone in patients with rituximab-refractory iNHL: Updated results of the GADOLIN study. (Cheson BD, et al. ASH 2016:615)
Investigator Commentary
68An Interview with Dr. Bruce Cheson on the GADOLIN Study
• Autologous stem cell transplantation with Benda-EAM in aggressive NHL and Hodgkin lymphoma. (Noesslinger T, et al. ASH 2016:2265)
• Obinutuzumab-based induction and maintenance prolongs PFS in patients with previously untreated FL: Primary results of the randomized phase III GALLIUM study. (Marcus R, et al. ASH 2016:6)
• Rituximab, bendamustine and cytarabine as induction therapy in elderly patients with MCL: Final results of a phase II study from the Fondazione Italiana Linfomi. (Visco C, et al. ASH 2016:472)
• Bendamustine and rituximab versus dexamethasone, rituximab, and cyclophosphamide in patients with Waldenström Macroglobulinemia. (Paludo J, et al. ASH 2016:2968)
• Multicentre open-label phase II study of ibrutinib in chronic graft versus host disease after failure of corticosteroids. (Miklos D, et al. ASH 2016:LBA-3)
Brief Perspective
41Dr. Joseph Connors: Insights on Ibrutinib Treatment for Patients with CLL/SLL
Brief Perspective
41Dr. Anthea Peters: Commentary on Updated Efficacy and Safety from the RESONATETM-2 Study• Integrated and long-term safety analysis of ibrutinib in patients
with CLL/SLL. (Coutre S, et al. ASH 2016:4383)

4 New Evidence in Oncology | April 2017
Joseph Connors, MD, FRCPCDr. Joseph Connors earned his medical degree from Yale University. He completed his residency
training in Internal Medicine and chief residency at the University of North Carolina in Chapel
Hill. Prior to completing his Medical Oncology Fellowship at Stanford University, he worked at the
Indian Health Service in Alaska for two years. In 1981, he accepted a position in Medical Oncology
at the BC Cancer Agency. He has been a member of the Faculty of Medicine at the University of
British Columbia since that time, reaching the position of Clinical Professor in 1997.
At present, he is a Clinical Professor in the Department of Medicine, Division of Medical Oncology,
at the University of British Columbia and the Chair of the Lymphoma Tumour Group for the
BC Cancer Agency. Dr. Connors’ clinical activities and research efforts are focused in the area of
lymphoid cancers. He is best known for his clinical investigations into the treatment of Hodgkin
lymphoma, non-Hodgkin lymphoma, chronic lymphocytic leukemia, and multiple myeloma.
Bruce D. Cheson, MD, FACP, FAAS, FASCODr. Bruce Cheson completed his internship and residency in Internal Medicine at the University
of Virginia Hospitals and then a clinical and research fellowship in Hematology at New England
Medical Center Hospital. He is former Editor-in-Chief of Clinical Advances in Hematology and
Oncology and Clinical Lymphoma, Leukemia and Myeloma, and a former Associate Editor of the
Journal of Clinical Oncology. From 2002 to 2006, he was on the Oncologic Drug Advisory Committee
to the U.S. Food and Drug Administration. He is past-Chair of the Lymphoma Committee of the
Cancer and Leukemia Group B/Alliance, the Scientific Advisory Board of the Lymphoma Research
Foundation, and the American Joint Committee on Cancer (AJCC) Subcommittee on Lymphoma.
Currently, Dr. Cheson is Professor of Medicine, Head of Hematology, and Deputy Chief of
Hematology-Oncology at Georgetown University Hospital, Lombardi Comprehensive Cancer
Center. Dr. Cheson’s clinical interests focus on the development and evaluation of new therapeutic
approaches for hematologic malignancies.
Neil Berinstein, MD, FRCPC, ABIMDr. Neil Berinstein earned his premedical degree and medical doctorate from the University of Manitoba
and received further specialty and research training at the University of Toronto and Stanford University.
Dr. Berinstein currently holds multiple academic and professional positions, including Professor in the
Department of Medicine at the University of Toronto, and is an active staff member of the Hematology
Oncology Site Group in the Odette Cancer Program at the Sunnybrook Health Sciences Centre. He is
currently the Director of Translational Research at the Ontario Institute for Cancer Research.
Dr. Berinstein specializes in the management and research of patients with lymphoproliferative disorders,
including non-Hodgkin lymphoma, chronic lymphocytic leukemia, Hodgkin lymphoma, and myeloma.
Contributors

New Evidence in Oncology | April 2017 5
Richard LeBlanc, MD, FRCPCDr. Richard LeBlanc is a hematologist and medical oncologist at Hôpital Maisonneuve-Rosemont in
Montreal, Quebec. He is also a Clinical Assistant Professor of Medicine at the University of Montreal.
Dr. LeBlanc obtained his medical degree at Laval University and is certified in Internal Medicine,
Hematology, and Medical Oncology. He worked as a research fellow at the Dana Farber Cancer
Institute in Boston from 2000 to 2002. Dr. LeBlanc was recruited by Hôpital Maisonneuve-Rosemont
to help improve medical care, research, and teaching in multiple myeloma.
Dr. LeBlanc holds the Myeloma Canada Chair at the University of Montreal. He is the Director
of the Myeloma Cell Bank at Hôpital Maisonneuve-Rosemont, which is affiliated with the Quebec
Leukemia Cell Bank. He is also the Medical Director of the Clinical Immunology Laboratory at
Hôpital Maisonneuve-Rosemont. Finally, Dr. LeBlanc is a member of the Scientific Advisory Board of
Myeloma Canada.
Carolyn Owen, MD, FRCPCDr. Carolyn Owen completed postgraduate training in internal medicine and hematology at the
University of Ottawa and the University of British Columbia, respectively, followed by a research
fellowship in molecular genetics at Barts and the London School of Medicine and Dentistry in London,
U.K. Her research focused on familial myelodysplasia and acute myeloid leukemia. She is currently
an Assistant Professor at the Foothills Medical Centre and Tom Baker Cancer Centre, University of
Calgary, and her clinical interests are low-grade lymphoma and chronic lymphocytic leukemia. She is
also the local principal investigator in Calgary for several clinical trials in these areas.
Anthea Peters, MD, FRCPCDr. Anthea Peters obtained her medical degree from the University of Saskatchewan in 2006. She then
completed her residencies in Internal Medicine at the University of Alberta and in Hematology at the
University of Calgary. Dr. Peters joined the Division of Hematology at the University of Alberta as a
Clinical Scholar in July 2011. Her main area of interest is in lymphoma.

6 New Evidence in Oncology | April 2017
Multiple Myeloma
Improved Outcomes in Patients with Relapsed/Refractory Multiple Myeloma
A majority of patients with multiple myeloma (MM) relapse after therapy, and the duration of remission decreases with each line of therapy.1 Novel agents, including proteasome inhibitors (PIs) and immuno-modulatory agents (IMIDs), have improved outcomes for patients with MM.2 However, treatment options are limited for patients who become refractory to PIs and IMIDs. The CD38 inhibitor daratumumab has demon-strated rapid, deep, and durable responses in patients with relapsed/refractory (R/R) MM, both as a single agent and in combination with the IMID, lenalido-mide, or the PI, bortezomib.3–5 Daratumumab was also well tolerated, with manageable adverse events.
The phase III POLLUX study found improved out-comes with the combination of daratumumab, lenalidomide, and dexamethasone (DRd) over lenalidomide and dexamethasone (Rd) in patients with R/R MM4, while the phase III CASTOR study showed a similar benefit for daratumumab, bortezo-mib, and dexamethasone (DVd) over bortezomib and dexamethasone (Vd).5
Daratumumab has been approved as monotherapy for patients with heavily pretreated R/R MM by the Food and Drug Administration (FDA), the European Medi-cines Agency, Health Canada, Mexico, and Singapore. The FDA, in part due to data from the POLLUX and CASTOR studies, has also approved daratumumab in combination with standard of care regimens in patients with R/R MM after at least one prior therapy.
New Evidence reported on the results of five studies, presented at the 2016 American Society of Hematology (ASH) Annual Meeting, which reaffirmed
the efficacy and safety of daratumumab in patients with R/R MM:
• Updated results from the POLLUX study demon-strated improved outcomes with DRd over Rd in patients with R/R MM and 1–3 prior lines of treat-ment. Benefits with DRd were seen regardless of prior lenalidomide treatment, refractoriness to bortezomib, or cytogenetic profile. (Moreau P, et al. ASH 2016:489)
• An additional analysis of the POLLUX study found that patients who received DRd experienced deeper responses than those who received Rd, regardless of the risk status or refractoriness to prior treatment. (Usmani SZ, et al. ASH 2016:1151)
• An updated analysis of the CASTOR study reaf-firmed the superiority of the combination of DVd over Vd in patients with R/R MM. The superiority of DVd over Vd was observed regardless of prior lines of therapy, with the greatest benefit observed in patients with one prior line of therapy. (Mateos MV, et al. ASH 2016:1150)
• Results from the Early Access Treatment Protocol (EAP), which provided patients with early access to daratumumab, showed that patients with R/R MM who received daratumumab experienced similar adverse events as previously reported while main-taining quality of life. (Chari A, et al. ASH 2016:2133)
• A subanalysis of the EAP provided evidence that premedication with montelukast may mitigate infusion-related reactions associated with the first infusion of daratumumab. (Chari A, et al. ASH 2016:2142)
References: 1. Kumar SK, Lee JH, Lahuerta JJ, et al. Risk of progression and survival in multiple myeloma relapsing after therapy with IMiDs and bortezomib: A multicenter international myeloma working group study. Leukemia 2012;26:149–57. 2. Rajkumar SV. Myeloma today: Disease definitions and treatment advances. Am J Hematol 2016;92:90–100. 3. Lonial S, Weiss BM, Usmani SZ, et al. Daratumumab monotherapy in patients with treatment-refractory multiple myeloma (SIRIUS): an open-label, randomised, phase 2 trial. Lancet 2016;387:1551–60. 4. Dimopoulos MA, Oriol A, Nahi H, et al. Daratumumab, lenalidomide, and dexamethasone for multiple myeloma. N Engl J Med 2016;375:1319–31. 5. Palumbo A, Chanan-Khan A, Weisel K, et al. Daratumumab, bortezomib, and dexametha-sone for multiple myeloma. N Engl J Med 2016;375:754–66.

New Evidence in Oncology | April 2017 7
Background
In a phase I/II study, 32 patients with relapsed or
refractory (R/R) multiple myeloma (MM) were treated
with daratumumab, lenalidomide, and dexametha-
sone (DRd), which induced rapid, deep, and durable
responses with a manageable safety profile.1 The
phase III POLLUX study compared DRd to the com-
bination of lenalidomide and dexamethasone (Rd)
in patients with R/R MM. Updated results from the
POLLUX study were presented at the 2016 ASH Meeting.2
Study design
• The POLLUX study was a multicentre, randomized,
open-label, active-controlled, phase III study.
• Patients were stratified by number of lines of
therapy, International Staging System stage at study
entry, and prior lenalidomide treatment.
• The primary endpoint was progression-free
survival (PFS).
• Secondary endpoints included time to progression,
overall survival, overall response rate (ORR), mini-
mal residual disease (MRD), time to response, and
duration of response.
• The primary analysis included 177 PFS events.
• MRD was evaluated at three sensitivity thresholds
(10–4, 10–5, and 10–6).
• MRD-negativity rate was defined as the proportion
of patients with negative MRD test results at any
time during treatment.
• A stringent, unbiased MRD evaluation was applied:
MRD-negativity counts were evaluated against
the intent-to-treat (ITT) population;
Any patient in the ITT population not determined
to be MRD-negative was scored as MRD-positive;
and
A minimum cell input equivalent to the given
sensitivity threshold was required to determine
MRD-negativity (i.e., MRD at 10–6 required that
≥1,000,000 cells were evaluated).
• MRD was assessed at suspected complete response
(CR) and three and six months after CR.
Efficacy of daratumumab, lenalidomide and dexamethasone versus lenalidomide and dexamethasone alone for R/R MM among patients with 1–3 prior lines of therapy based on previous treatment exposure: Updated analysis of POLLUX
Moreau P, et al. ASH 2016:489
Daratumumab 16 mg/kg iv• Qw in Cycles 1–2, q2w in Cycles 3–6, then q4w until PDR 25 mg po• Days 1–21 of each cycle until PDd 40 mg po• 40 mg qw until PD
DRd (n = 286)
RANDOMIZE
1:1
Key eligibility criteria• R/R MM• ≥1 prior line of therapy• Prior lenalidomide exposure, but not refractory• Creatinine clearance ≥30 mL/min
d = dexamethasone; DRd = daratumumab, lenalidomide, dexamethasone; iv = intravenous; MM = multiple myeloma; PD = progressive disease; po = oral; qw = weekly; q2w = every two weeks; q4w = every four weeks; R = lenalidomide; Rd = lenalidomide, dexamethasone; R/R = relapsed/refractory
R 25 mg po• Days 1–21 of each cycle until PDd 40 mg po• 40 mg qw until PD
Rd (n = 283)
Cycles: 28 days
Study design
8 New Evidence in Oncology | April 2017
Key findings
Baseline characteristics and disposition
• In the updated analysis, evaluations were performed on the subgroup of patients who had received 1–3 prior lines of therapy, which comprised 95% of the DRd arm and 93% of the Rd arm.
• Baseline demographics were similar between groups.
• Median age was 65 years in both treatment arms; 10% and 12% of patients were aged ≥75 years in the DRd and Rd groups, respectively.
• In both treatment arms, 18% of patients had received prior lenalidomide, and 21% of patients were refractory to bortezomib.
• Cytogenetic profiling was conducted on 161 patients in the DRd arm and on 150 patients in the Rd arm.
The majority of patients tested had standard risk cytogenetic profiles (83% in the DRd arm and 75% in the Rd arm).
Efficacy
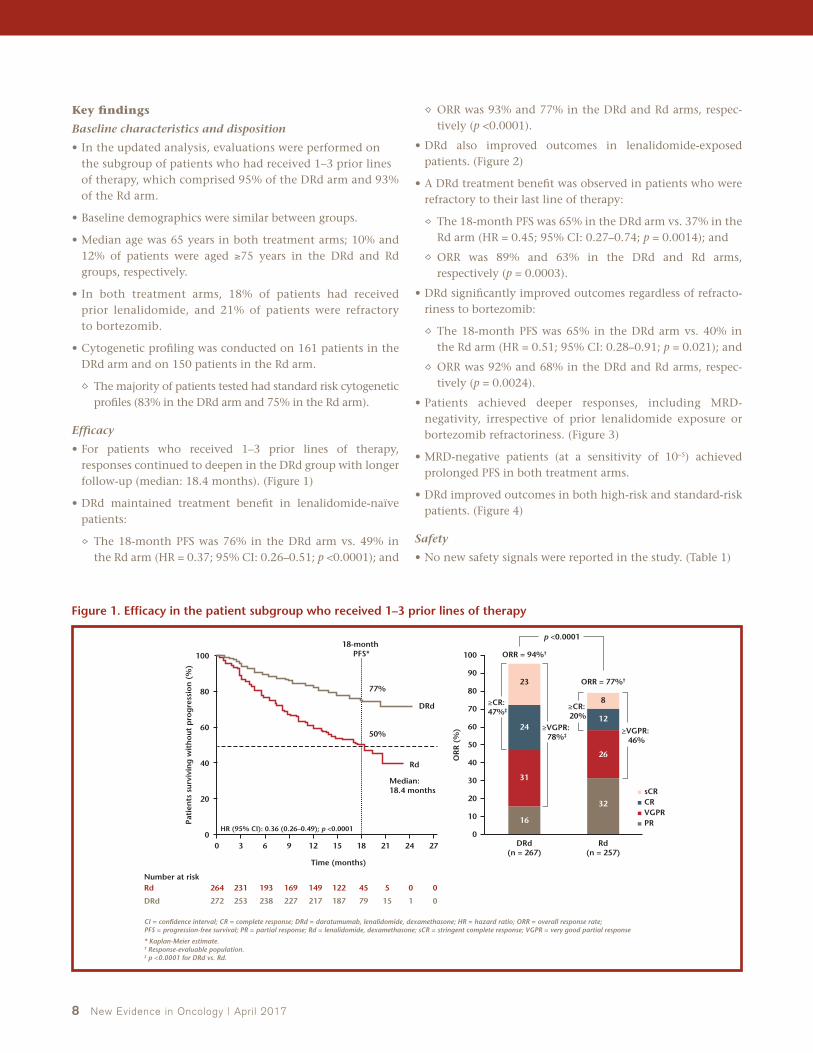
• For patients who received 1–3 prior lines of therapy, responses continued to deepen in the DRd group with longer follow-up (median: 18.4 months). (Figure 1)
• DRd maintained treatment benefit in lenalidomide-naïve patients:
The 18-month PFS was 76% in the DRd arm vs. 49% in the Rd arm (HR = 0.37; 95% CI: 0.26–0.51; p <0.0001); and
ORR was 93% and 77% in the DRd and Rd arms, respec-tively (p <0.0001).
• DRd also improved outcomes in lenalidomide-exposed patients. (Figure 2)
• A DRd treatment benefit was observed in patients who were refractory to their last line of therapy:
The 18-month PFS was 65% in the DRd arm vs. 37% in the Rd arm (HR = 0.45; 95% CI: 0.27–0.74; p = 0.0014); and
ORR was 89% and 63% in the DRd and Rd arms, respectively (p = 0.0003).
• DRd significantly improved outcomes regardless of refracto-riness to bortezomib:
The 18-month PFS was 65% in the DRd arm vs. 40% in the Rd arm (HR = 0.51; 95% CI: 0.28–0.91; p = 0.021); and
ORR was 92% and 68% in the DRd and Rd arms, respec-tively (p = 0.0024).
• Patients achieved deeper responses, including MRD-negativity, irrespective of prior lenalidomide exposure or bortezomib refractoriness. (Figure 3)
• MRD-negative patients (at a sensitivity of 10–5) achieved prolonged PFS in both treatment arms.
• DRd improved outcomes in both high-risk and standard-risk patients. (Figure 4)
Safety
• No new safety signals were reported in the study. (Table 1)
31
24
23
16
26
12
8
32
ORR = 94%†
p <0.0001
≥CR: 47%‡
≥VGPR: 78%‡
≥CR: 20%
≥VGPR: 46%
sCRCRVGPRPR
ORR = 77%†
242118
18-month PFS*
Median: 18.4 months
Rd
HR (95% CI): 0.36 (0.26–0.49); p <0.0001
DRd
77%
50%
1512963
Time (months)
Pati
ents
sur
vivi
ng
wit
hou
t p
rog
ress
ion
(%
)
0
00545122149169193231264
011579187217227238253272
RdNumber at risk
DRd
0
20
40
60
80
100
CI = confidence interval; CR = complete response; DRd = daratumumab, lenalidomide, dexamethasone; HR = hazard ratio; ORR = overall response rate; PFS = progression-free survival; PR = partial response; Rd = lenalidomide, dexamethasone; sCR = stringent complete response; VGPR = very good partial response
* Kaplan-Meier estimate.† Response-evaluable population.‡ p <0.0001 for DRd vs. Rd.
27 Rd(n = 257)
DRd(n = 267)
OR
R (
%)
0
20
40
60
80
90
70
50
30
10
100
Figure 1. Efficacy in the patient subgroup who received 1–3 prior lines of therapy

New Evidence in Oncology | April 2017 9
33
26
22
7
29
9
2
27
ORR = 87%†
p = 0.022
≥CR: 48%‡
≥VGPR: 80%§
≥CR: 11%
≥VGPR: 40%
sCRCRVGPRPR
ORR = 67%†
242118
18-month PFS*
Rd
HR (95% CI): 0.45 (0.20–0.99); p = 0.042
DRd
79%
59%
1512963
Time (months)
Pati
ents
sur
vivi
ng
wit
hou
t p
rog
ress
ion
(%
)
0
014222629353845
018303737384146
RdNumber at risk
DRd
0
20
40
60
80
100
CI = confidence interval; CR = complete response; DRd = daratumumab, lenalidomide, dexamethasone; HR = hazard ratio; ORR = overall response rate; PFS = progression-free survival; PR = partial response; Rd = lenalidomide, dexamethasone; sCR = stringent complete response; VGPR = very good partial response
* Kaplan-Meier estimate.† Response-evaluable population.‡ p = 0.0001 for DRd vs. Rd.§ p <0.0001 for DRd vs. Rd.
Rd(n = 45)
DRd(n = 46)
OR
R (
%)
0
20
40
60
80
90
70
50
30
10
100
Figure 2. Efficacy in lenalidomide-exposed patients
6
25
*
6
25
6
24
4
28
6
22
DRd = daratumumab, lenalidomide, dexamethasone; ITT = intent to treat; MRD = minimal residual disease; Rd = lenalidomide, dexamethasone
P-values calculated using likelihood-ratio chi-square test.
* p <0.0001.† p <0.01.‡ p <0.05.
Rd(n = 283)
Total evaluable population
(ITT)
DRd(n = 286)
Rd(n = 264)
1–3 prior line population
DRd(n = 272)
Rd(n = 219)
Lenalidomide-naïve(1–3 prior lines)
DRd(n = 226)
Rd(n = 45)
Lenalidomide-exposed(1–3 prior lines)
DRd(n = 46)
Rd(n = 49)
Bortezomib-refractory(1–3 prior lines)
DRd(n = 54)
MR
D-n
egat
ive
rate
(%
)
0
5
10
15
25
30
20
* * † ‡
Figure 3. MRD-negative rates (10–5)

10 New Evidence in Oncology | April 2017
30
15
19
22
33
23
29
11
27
17
7
31
25
6
36
ORR = 85%
sCRCRVGPRPR
ORR = 67%
ORR = 95%
ORR = 82%
242118
Rd standard risk
Rd high risk
DRd standard risk
DRd high risk
1512963
Time (months)Pa
tien
ts s
urvi
vin
g w
ith
out
pro
gre
ssio
n (
%)
0
01185165718695103
043893103108111119124
Rd standard risk
Number at risk
DRd standard risk
006131517202934
029181919212228
Rd high risk
DRd high risk
0
20
40
60
80
100
CR = complete response; DRd = daratumumab, lenalidomide, dexamethasone; ORR = overall response rate; PFS = progression-free survival; PR = partial response; Rd = lenalidomide, dexamethasone; sCR = stringent complete response; VGPR = very good partial response
Rd(n = 111)
DRd(n = 132)
Rd(n = 36)
High risk Standard risk
DRd(n = 27)
OR
R (
%)
0
20
40
60
80
90
70
50
30
10
100
Total population (response evaluable)
1–3 prior lines population
Figure 4. Responses and PFS by cytogenetic status
Table 1. Most common AEs in the patient subgroup who received 1–3 prior lines of therapy
DRd (n = 269) Rd (n = 262)
Hematologic (%)All grade ≥25%*
Grade 3/4 ≥5%*
All grade ≥25%*
Grade 3/4 ≥5%*
Neutropenia
Febrile neutropenia
61
6
54
6
43
3
37
3
Anemia 34 14 38 21
Thrombocytopenia 28 14 30 16
Lymphopenia 5 5 6 4
Non-hematologic (%)
Diarrhea 48 7 28 3
Fatigue 36 7 30 3
Upper respiratory tract infection 34 1 23 1
Cough 31 0 13 0
Constipation 30 1 26 0.8
Muscle spasms 28 0.7 21 2
Nausea 26 2 16 0.4
Nasopharyngitis 26 0 17 0
Pneumonia 16 9 13 8
AE = adverse event; DRd = daratumumab, lenalidomide, dexamethasone; Rd = lenalidomide, dexamethasone
* Common treatment-emergent AEs listed are either ≥25% all grade OR ≥5% grade 3/4.

New Evidence in Oncology | April 2017 11
• DRd significantly improved outcomes for patients with R/R MM and 1–3 prior lines of treatment.
• This treatment benefit was maintained regardless of prior treatment with lenalidomide or refractoriness to bortezomib.
• Higher MRD-negative rates were observed in the DRd arm vs. the Rd arm for all subgroups.
• DRd was superior to Rd in both standard- and high-risk cytogenetic patients.
• The safety profile was unchanged between treatment arms.
• These data support the use of DRd, irrespective of prior lenalidomide treatment or bortezomib refractoriness.
Key conclusions
References: 1. Plesner T, Arkenau HT, Gimsing P, et al. Phase 1/2 study of daratumumab, lenalidomide, and dexamethasone for relapsed multiple myeloma. Blood 2016;128:1821–8. 2. Moreau P, Kaufman JL, Sutherland HJ, et al. Efficacy of daratumumab, lenalidomide and dexamethasone versus lenalidomide and dexamethasone alone for relapsed or refractory multiple myeloma among patients with 1 to 3 prior lines of therapy based on previous treatment exposure: updated analysis of POLLUX. ASH Annual Meeting Abstracts 2016:489.
Background
The POLLUX study has previously demonstrated
deeper response with daratumumab, lenalidomide,
and dexamethasone (DRd) compared to lenalidomide
and dexamethasone (Rd) in patients with relapsed/
refractory (R/R) multiple myeloma (MM). At the 2016
ASH Meeting, Usmani and colleagues also reported
updated results from the POLLUX study.1
Study design
• The POLLUX study was a multicentre, randomized,
open-label, active-controlled, phase III study that
compared DRd to Rd.
• Premedication for the DRd treatment group con-
sisted of dexamethasone 20 mg, acetaminophen,
and an antihistamine.
• On daratumumab dosing days, dexamethasone
20 mg was administered as a premedication on
Day 1 and Day 2.
• Patients were stratified by number of lines of ther-apy, International Staging System stage at study entry, and prior lenalidomide treatment.
• The primary endpoint was progression-free survival (PFS).
• Secondary endpoints included time to progression, overall survival (OS), overall response rate (ORR), minimal residual disease (MRD), time to response, and duration of response.
• The primary analysis included 177 PFS events.
Key findings
Baseline characteristics and disposition
• Baseline demographics were similar between groups.
• Median age was 65 years in both treatment arms; 10% and 12% of patients were aged ≥75 years in the DRd and Rd groups, respectively.
• A total of 28% and 27% of patients were refrac-tory to their last line of therapy in the DRd and Rd groups, respectively.
Efficacy of daratumumab, lenalidomide and dexamethasone versus lenalidomide and dexamethasone in R/R MM among patients with 1–3 prior lines of therapy: Updated analysis of POLLUX
Usmani SZ, et al. ASH 2016:1151

12 New Evidence in Oncology | April 2017
• Cytogenetic profiling was conducted on 161 patients in the
DRd arm and on 150 patients in the Rd arm.
• The majority of patients tested had standard risk cytogenetic
profiles (83% in the DRd arm and 75% in the Rd arm).
Efficacy
• Responses continued to deepen in the DRd group with lon-
ger follow-up (median 17.3 months).
The 18-month PFS was 76% in the DRd arm vs. 49% in
the Rd arm (HR = 0.37; 95% CI: 0.28–0.50; p <0.0001); and
ORR was 93% and 76% in the DRd and Rd arms, respec-
tively (p <0.0001).
• MRD-negative rates were more than threefold higher in the
DRd arm compared to the Rd arm at all thresholds for MRD.
(Figure 1)
• MRD-negativity was associated with improved PFS in both
treatment arms. (Figure 2)
• In terms of PFS, DRd was superior to Rd regardless of time
since last therapy. (Figure 3)
• DRd also benefitted patients who were refractory to the last line of therapy. (Figure 4)
• DRd improved outcomes regardless of cytogenetic risk.
Among high-risk patients, median PFS was not reached in the DRd arm and was 10.2 months in the Rd arm (HR = 0.44; 95% CI: 0.19–1.03; p = 0.0475);
Among high-risk patients, ORR was 85% in the DRd arm and 67% in the Rd arm (not statistically significant);
Among standard-risk patients, PFS was not reached in the DRd arm and was 17.1 months in the Rd arm (HR = 0.30; 95% CI: 0.18–0.49; p <0.0001); and
Among standard-risk patients, ORR was 95% in the DRd arm and 82% in the Rd arm (p = 0.0020).
• OS data were immature; however, preliminary data favoured DRd. (Figure 5)
There were 40 OS events (14%) in the DRd arm and 56 events (20%) in the Rd arm.
Safety
• No new safety signals were reported in the study.
Daratumumab 16 mg/kg iv• Qw in Cycles 1–2, q2w in Cycles 3–6, then q4w until PDR 25 mg po• Days 1–21 of each cycle until PDd 40 mg po• 40 mg qw until PD
DRd (n = 286)
RANDOMIZE
1:1
Key eligibility criteria• R/R MM• ≥1 prior line of therapy• Prior lenalidomide exposure, but not refractory• Creatinine clearance ≥30 mL/min
d = dexamethasone; DRd = daratumumab, lenalidomide, dexamethasone; iv = intravenous; MM = multiple myeloma; PD = progressive disease; po = oral; qw = weekly; q2w = every two weeks; q4w = every four weeks; R = lenalidomide; Rd = lenalidomide, dexamethasone; R/R = relapsed/refractory
R 25 mg po• Days 1–21 of each cycle until PDd 40 mg po• 40 mg qw until PD
Rd (n = 283)
Cycles: 28 days
Study design

New Evidence in Oncology | April 2017 13
8.8
31.8
*
3.6×
DRd = daratumumab, lenalidomide, dexamethasone; MRD = minimal residual disease; Rd = lenalidomide, dexamethasone
P-values are calculated using likelihood-ratio chi-square test.
* p <0.0001.
Rd
10–4Sensitivity threshold
DRd
5.7
24.8
RdDRd
2.5
11.9
RdDRd
10–5 10–6
MR
D-n
egat
ive
rate
(%
)
0
5
10
15
25
30
35
20
*
4.4×
*
4.8×
Figure 1. MRD-negative rates in the intent-to-treat population
242118
DRd MRD-negative (n = 71)
Rd MRD-negative (n = 16)
Rd MRD-positive (n = 267)
DRd MRD-positive (n = 215)
1512963
Time (months)
Pati
ents
pro
gre
ssio
n-f
ree
and
aliv
e (%
)
0
0010121515161616
0628576670717171
Rd MRD-negativeNumber at risk
DRd MRD-negative
0538120144166190233267
0
0
0
0
1954137161167178195215
Rd MRD-positive
DRd MRD-positive
0
20
40
60
80
100
DRd = daratumumab, lenalidomide, dexamethasone; MRD = minimal residual disease; PFS = progression-free survival; Rd = lenalidomide, dexamethasone
27
Figure 2. PFS stratified by MRD status (10–5) in the intent-to-treat population

14 New Evidence in Oncology | April 2017
242118
Rd
60%
83%
37%
Median: 10.3 months
70%DRd
18-monthPFS*
>12 months ≤12 months
HR (95% CI): 0.37 (0.23–0.61); p <0.0001
1512963
Time (months)
Pati
ents
sur
vivi
ng
wit
hou
t p
rog
ress
ion
(%
)
0
042688103111123139149
0944109118122127133140
Rd >12Number at risk
DRd >12
Rd ≤12Number at risk
DRd ≤12
0
1
0
20
40
60
80
100
CI = confidence interval; DRd = daratumumab, lenalidomide, dexamethasone; HR = hazard ratio; PFS = progression-free survival; Rd = lenalidomide, dexamethasone
* Kaplan-Meier estimate.
27 242118
Rd
DRd
18-monthPFS*
HR (95% CI): 0.38 (0.26–0.55); p <0.0001
1512963
Time (months)
Pati
ents
sur
vivi
ng
wit
hou
t p
rog
ress
ion
(%
)
0
012244567083110134
063885109115122133146
0
0
0
20
40
60
80
100
27
26
24
23
14
19
10
6
30
ORR = 87%†
p = 0.0011
≥CR: 47%‡
≥VGPR: 73%‡
≥CR: 15%
≥VGPR: 34%
sCRCRVGPRPR
ORR = 64%†
242118
18-month PFS*
Rd
HR (95% CI): 0.47 (0.29–0.76); p = 0.0015
DRd65%
Median: 10.3 months
36%
1512963
Time (months)
Pati
ents
sur
vivi
ng
wit
hou
t p
rog
ress
ion
(%
)
0
0116263034446076
0224405255626880
RdNumber at risk
DRd
0
20
40
60
80
100
CI = confidence interval; CR = complete response; DRd = daratumumab, lenalidomide, dexamethasone; HR = hazard ratio; ORR = overall response rate; PFS = progression-free survival; PR = partial response; Rd = lenalidomide, dexamethasone; sCR = stringent complete response; VGPR = very good partial response
* Kaplan-Meier estimate.† Response-evaluable population.‡ p <0.0001 for DRd vs. Rd.
Rd(n = 73)
DRd(n = 78)
OR
R (
%)
0
20
40
60
80
90
70
50
30
10
100
Figure 3. PFS stratified by time from last line of therapy
Figure 4. Efficacy in patients refractory to the last line of therapy

New Evidence in Oncology | April 2017 15
242118
Rd
DRd
HR (95% CI): 0.63 (0.42–0.95)
1512963
Time (months)
Pati
ents
sur
vivi
ng
(%
)
0
01894215236249255272283
021102232260266271277286
RdNumber at risk
DRd
0
1
0
20
40
60
80
100
CI = confidence interval; DRd = daratumumab, lenalidomide, dexamethasone; HR = hazard ratio; OS = overall survival; Rd = lenalidomide, dexamethasone
Median OS was not reached; results did not cross the prespecified stopping boundary.
27
Figure 5. Overall survival in the intent-to-treat population
• DRd significantly improved outcomes for patients with MM, with a 63% reduction in risk of progression or death for DRd vs. Rd.
• More patients achieved deeper responses, including MRD-negativity, with DRd.
• DRd is superior to Rd regardless of time since last therapy, refractoriness to last line of therapy, or cytogenetic risk.
• Safety profiles remained unchanged.
• These data support the use of DRd for patients who received at least one prior therapy regardless of risk status or refractoriness to prior treatment.
Key conclusions
Reference: 1. Usmani SZ, Dimopoulos MA, Belch A, et al. Efficacy of da-ratumumab, lenalidomide and dexamethasone versus lenalidomide and dexamethasone alone for relapsed or refractory multiple myeloma among patients with 1 to 3 prior lines of therapy based on previous treatment exposure: updated analysis of POLLUX. ASH Annual Meeting Abstracts 2016:1151.
The addition of daratumumab to lenalidomide and dexa-methasone (DRd) vs. lenalidomide and dexamethasone (Rd) alone was evaluated in the POLLUX trial, a randomized, open-label, multicentre, phase III study. The population of the study included 569 patients with multiple myeloma (MM), who had received at least one previous line of therapy.
DRd treatment resulted in an improved progression-free survival, response rate, and depth of response in all sub-groups including patients who had a treatment-free interval ≤12 months and those with high-risk cytogenetics. Dara-tumumab is a relatively new drug that has already shown clinical benefit when used as monotherapy. Now it clearly demonstrates a positive effect as an addition to an immuno-modulatory backbone treatment.
The impressive results of the POLLUX trial in patients with R/R MM (not refractory to lenalidomide) are among the best in this setting. It is certainly a practice-changing
study that will have a significant impact on the way we are treating Canadian patients with R/R MM. The fact that lenalidomide-exposed patients (although a small group) had a similar outcome as other subgroups of patients, including lenalidomide-naïve patients, is interesting, since many relapsed patients have been previously exposed to lenalidomide but are not refractory.
Another related abstract sought to evaluate how the addition of daratumumab to Rd in the POLLUX trial promoted T-cell response. The findings certainly support an immunomodulatory effect of daratumumab as its mecha-nism of action. The understanding of its immunomodulating properties is of interest since daratumumab is administered in combination with dexamethasone, which is associated with immunosuppressive effects. It is theoretically plausible that dexamethasone could decrease part of the efficacy of daratumumab through its immunosuppressive effect.
Dr. Richard LeBlanc: Impressive Results from POLLUX Trial

16 New Evidence in Oncology | April 2017
Daratumumab (16 mg/kg iv)• Every week: Cycles 1–3• Every 3 weeks: Cycles 4–8V: 1.3 mg/m2 sc on Days 1, 4, 8, and 11 of Cycles 1–8d: 20 mg po/iv on Days 1, 2, 4, 5, 8, 9, 11, and 12 of Cycles 1–8
DVd (n = 251)
RANDOMIZE
1:1
Key eligibility criteria• R/R MM• ≥1 prior line of therapy• Prior bortezomib exposure, but not refractory
D = daratumumab; d = dexamethasone; DVd = daratumumab, bortezomib, dexamethasone; iv = intravenous; MM = multiple myeloma; Obs = observation; po = oral; R/R = relapsed/refractory; sc = subcutaneous; V = bortezomib; Vd = bortezomib, dexamethasone
V: 1.3 mg/m2 sc on Days 1, 4, 8, and 11 of Cycles 1–8d: 20 mg po/iv on Days 1, 2, 4, 5, 8, 9, 11, and 12 of Cycles 1–8
Vd (n = 247)
Cycles 1–8: repeat every 21 daysCycles 9+: repeat every 28 days
Every 4 weeks: Cycles 9+
D only
Obs only
Background
An early phase study of daratumumab in combina-
tion with bortezomib showed deep and durable
responses in patients with multiple myeloma (MM).
The combination was also well tolerated with man-
ageable adverse events.1 The CASTOR study compared
the combination of daratumumab, bortezomib, and
dexamethasone (DVd) to bortezomib and dexametha-
sone (Vd) alone in patients with relapsed/refractory
(R/R) MM. Updated results from the CASTOR study
were presented at the 2016 ASH Meeting.2
Study design
• The CASTOR study was a multicentre, randomized,
open-label, active-controlled, phase III study that
enrolled 498 patients.
• Premedication for the DVd treatment group con-
sisted of dexamethasone 20 mg, acetaminophen,
and an antihistamine.
• Patients were stratified by number of lines of thera-
py (1 vs. 2 or 3 vs. >3), International Staging System
stage (I, II, and III), and prior bortezomib treatment
(no vs. yes).
• The study planned to enrol 480 patients.
• The primary endpoint was progression-free survival
(PFS).
• Secondary endpoints included time to progression, overall survival (OS), overall response rate (ORR), and minimal residual disease (MRD).
• The primary analysis included 177 progression-free survival (PFS) events.
• MRD was evaluated by a clonoSEQ next-generation sequencing-based assay in a central lab at three sensitivity thresholds, for patients with suspected complete response (CR) and also for patients who maintained CR at Cycles 9 and 15.
Key findings
Baseline characteristics and disposition
• Baseline demographics were similar between groups.
• Median age was 64 years in both treatment arms; 9% and 14% of patients were aged ≥75 years in the DVd and Vd groups, respectively.
• The majority of patients had received 1–3 prior lines of therapy, which comprised 91% of the DVd arm and 89% of the Vd arm.
• Cytogenetic profiling was conducted on 167 patients in the DVd arm and 186 patients in the Vd arm.
• The majority of patients tested had standard risk cytogenetic profiles (74% in the DVd arm and 73% in the Vd arm).
Efficacy of daratumumab, bortezomib, and dexamethasone versus bortezomib and dexamethasone in R/R MM based on prior lines of therapy: Updated analysis of CASTOR
Mateos MV, et al. ASH 2016:1150
Study design

New Evidence in Oncology | April 2017 17
Efficacy
• Responses continued to deepen in the DVd group with
longer follow-up (median 13.0 months). (Figure 1)
An additional 7% of patients in the DVd arm achieved at
least a CR with longer follow-up.
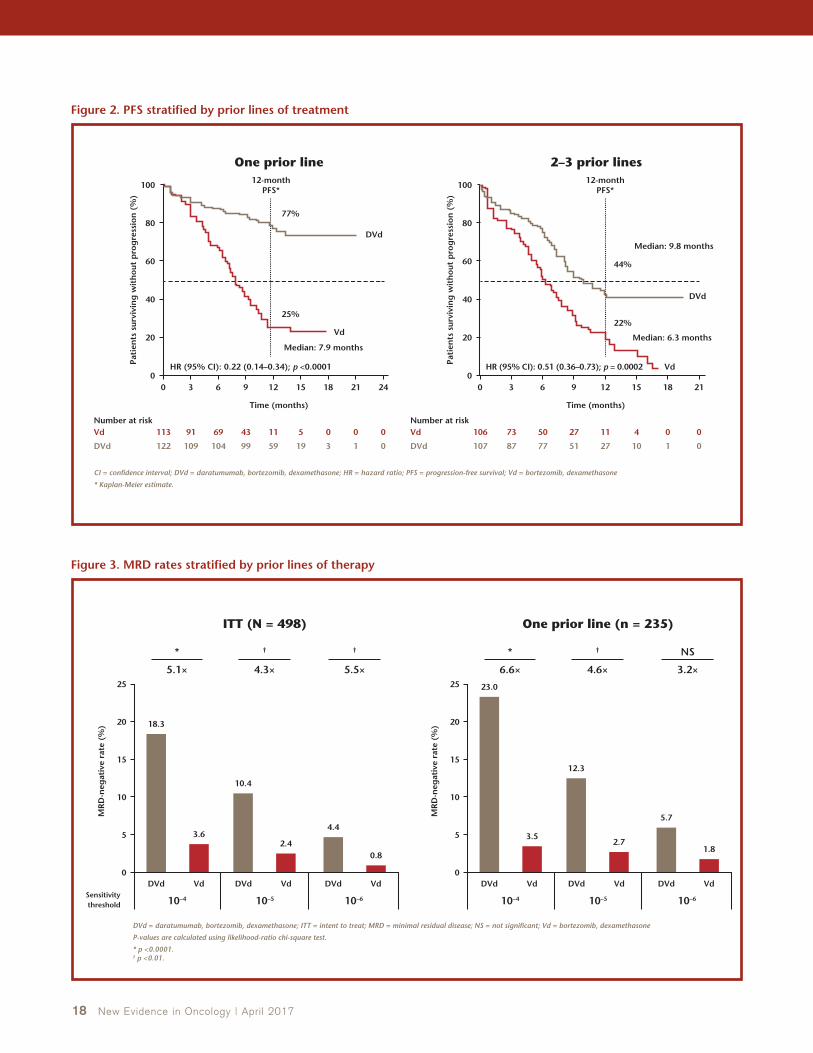
• DVd was superior to Vd regardless of prior lines of therapy,
with the greatest benefit observed in patients with one
prior line of therapy. (Figure 2)
• In patients who received one prior line of therapy, DVd
provided a treatment benefit regardless of prior bortezo-
mib exposure.
• More patients achieved a deeper response with DVd after
one prior line of treatment.
In patients with one prior line of treatment, ORR was 91%
in the DVd arm vs. 74% in the Vd arm (p = 0.0014); and
In patients with 2–3 prior lines of treatment, ORR was 79%
in the DVd arm vs. 58% in the Vd arm (p = 0.0022).
• MRD-negative rates for the DVd arm were at least threefold
higher than the Vd arm across all thresholds. (Figure 3)
• MRD-negativity was associated with better PFS outcomes
in both treatment arms.
• DVd improved PFS regardless of cytogenetic risk. (Figure 4)
• Overall survival (OS) data were immature; however, pre-
liminary data favoured DVd (HR = 0.63; 95% CI: 0.42–0.96).
There were 37 OS events (15%) in the DVd arm and 58 events
(24%) in the Vd arm.
In patients who received one prior line of therapy,
HR = 0.42; 95% CI: 0.19–0.93.
In patients who received 1–3 prior lines of therapy,
HR = 0.54; 95% CI: 0.34–0.84.
Safety
• Grade 3/4 treatment-emergent adverse events (TEAEs)
occurred in 79% of patients in the DVd arm vs. 63% in the
Vd arm. (Table 1)
• Discontinuations due to TEAEs occurred in 9% of patients
in both treatment arms.
• No new infusion-related reactions were reported (inci-
dence remained stable at 45% with longer follow-up).
35
19
7
22
19
8
2
34
ORR = 84%
p <0.0001
≥CR: 26%†
≥VGPR: 62%†
≥CR: 10%
≥VGPR: 29%
sCRCRVGPRPR
ORR = 63%
242118
12-month PFS*
VdHR (95% CI): 0.33 (0.26–0.43); p <0.0001
DVd
60%
Median: 7.1 months
22%
1512963
Time (months)
Pati
ents
sur
vivi
ng
wit
hou
t p
rog
ress
ion
(%
)
0
00092373129182247
0153391160198215251
VdNumber at risk
DVd
0
20
40
60
80
100
CI = confidence interval; CR = complete response; DVd = daratumumab, bortezomib, dexamethasone; HR = hazard ratio; ORR = overall response rate; PFS = progression-free survival; PR = partial response; Vd = bortezomib, dexamethasone; sCR = stringent complete response; VGPR = very good partial response
* Kaplan-Meier estimate.† p <0.0001 for DVd vs. Vd.
Vd(n = 234)
DVd(n = 240)
OR
R (
%)
0
20
40
60
80
90
70
50
30
10
100
Figure 1. Updated efficacy
18 New Evidence in Oncology | April 2017
242118
Vd
Median: 7.9 months
25%
77%
DVd
12-monthPFS*
One prior line 2–3 prior lines
HR (95% CI): 0.22 (0.14–0.34); p <0.0001
1512963
Time (months)
Pati
ents
sur
vivi
ng
wit
hou
t p
rog
ress
ion
(%
)
0
00511436991113
13195999104109122
VdNumber at risk
DVd
VdNumber at risk
DVd
0
0
0
20
40
60
80
100
CI = confidence interval; DVd = daratumumab, bortezomib, dexamethasone; HR = hazard ratio; PFS = progression-free survival; Vd = bortezomib, dexamethasone
* Kaplan-Meier estimate.
2118
Vd
Median: 6.3 months
Median: 9.8 months
22%
44%
DVd
12-monthPFS*
HR (95% CI): 0.51 (0.36–0.73); p = 0.0002
1512963
Time (months)
Pati
ents
sur
vivi
ng
wit
hou
t p
rog
ress
ion
(%
)
0
00411275073106
011027517787107
0
20
40
60
80
100
18.3
3.6
10.4
2.4
4.4
0.8
*
5.1×
DVd = daratumumab, bortezomib, dexamethasone; ITT = intent to treat; MRD = minimal residual disease; NS = not significant; Vd = bortezomib, dexamethasone
P-values are calculated using likelihood-ratio chi-square test.
* p <0.0001.† p <0.01.
Vd
10–4Sensitivity threshold
DVd VdDVd VdDVd
10–5 10–6
MR
D-n
egat
ive
rate
(%
)
0
5
10
15
25
20
†
4.3×
†
5.5×
ITT (N = 498)
23.0
3.5
12.3
2.7
5.7
1.8
*
6.6×
Vd
10–4
DVd VdDVd VdDVd
10–5 10–6
MR
D-n
egat
ive
rate
(%
)
0
5
10
15
25
20
†
4.6×
NS
3.2×
One prior line (n = 235)
Figure 2. PFS stratified by prior lines of treatment
Figure 3. MRD rates stratified by prior lines of therapy

New Evidence in Oncology | April 2017 19
242118
DVd high risk
DVd standard risk
Vd high risk
Vd standard risk
1512963
Time (months)
Pati
ents
pro
gre
ssio
n-f
ree
and
aliv
e (%
)
0
006144479106135
14174782101110123
Vd standard riskNumber at risk
DVd standard risk
000213233251
0
0
0
00151426343844
Vd high risk
DVd high risk
0
20
40
60
80
100
CI = confidence interval; del(17p) = deletion of 17p; DVd = daratumumab, bortezomib, dexamethasone; HR = hazard ratio; ITT = intent to treat; NR = not reached; ORR = overall response rate; PFS = progression-free survival; t(4;14) = translocation between chromosomes 4 and 14; t(14;16) = translocation between chromosomes 14 and 16; Vd = bortezomib, dexamethasone
* ITT/Biomarker risk-evaluable analysis set.† Central next-generation sequencing. High-risk patients had any of t(4;14), t(14;16), or del(17p). Standard-risk patients had an absence of high-risk abnormalities.
High risk† DVdn = 44
Vdn = 51
Median PFS, months 11.2 7.2
HR (95% CI) 0.49 (0.27–0.89)
p-value 0.0167
n = 44 n = 47
ORR, % 82 62
p-value 0.039
Standard riskDVd
n = 123Vd
n = 135
Median PFS, months NR 7.0
HR (95% CI) 0.29 (0.20–0.43)
p-value <0.0001
n = 118 n = 131
ORR, % 85 64
p-value 0.0003
Figure 4. PFS stratified by cytogenetic risk in all evaluable patients*
Table 1. Most common treatment-emergent adverse events (all patients)
DVd (n = 243) Vd (n = 237)
Hematologic, n (%)All grade ≥25%*
Grade 3/4 ≥5%*
All grade ≥25%*
Grade 3/4 ≥5%*
Thrombocytopenia 145 (60) 110 (45) 105 (44) 78 (33)
Anemia 67 (28) 36 (15) 75 (32) 38 (16)
Neutropenia 45 (19) 32 (13) 23 (10) 11 (5)
Lymphopenia 32 (13) 24 (10) 9 (4) 6 (3)
Non-hematologic, n (%)
Peripheral sensory neuropathy 120 (49) 11 (5) 90 (38) 16 (7)
Diarrhea 83 (34) 9 (4) 53 (22) 3 (1)
Upper respiratory tract infection 72 (30) 6 (3) 43 (18) 1 (0.4)
Cough 66 (27) 0 30 (13) 0
Fatigue 53 (22) 12 (5) 58 (25) 8 (3)
Pneumonia 33 (14) 22 (9) 28 (12) 23 (10)
Hypertension 22 (9) 16 (7) 8 (3) 2 (0.8)
DVd = daratumumab, bortezomib, dexamethasone; TEAE = treatment-emergent adverse event; Vd = bortezomib, dexamethasone* Common TEAEs listed are either ≥25% all grade OR ≥5% grade 3/4.Vd arm treated for eight cycles and DVd arm treated until progressive disease, per protocol.

20 New Evidence in Oncology | April 2017
• A PFS benefit was continually maintained with DVd over time.
• DVd was superior to Vd regardless of prior lines of therapy.
• The largest magnitude of benefit with DVd was observed in patients with one prior line of therapy, who had a 78% reduction in the risk of progression or death with DVd vs. Vd.
• More patients in the DVd arm achieved deeper responses with longer follow-up, including higher CR and MRD-negative rates.
– MRD-negativity translated into longer PFS.
• DVd was superior to Vd regardless of cytogenetic risk or time since last therapy.
• These data support the use of DVd for patients with R/R MM, with most benefit observed in patients with one prior line of therapy.
Key conclusions
References: 1. Mateos MV, Moreau P, Comenzo R, et al. An open-label, multicenter, phase 1B study of daratumumab in combination with pomalidomide-dexamethasone and with backbone regimens in patients with multiple myeloma. EHA Annual Meeting Abstracts 2015:P275. 2. Mateos MV, Estell J, Barreto W, et al. Efficacy of daratumumab, bortezomib, and dexamethasone versus bortezomib and dexamethasone in relapsed or refractory multiple myeloma based on prior lines of therapy: updated analysis of CASTOR. ASH Annual Meeting Abstracts 2016:1150.
Background
A multicentre, open-label, Early Access Treatment Protocol (EAP) was opened in June 2015 after the MMY2002 study demonstrated the efficacy and safety profile of daratumumab in patients with relapsed/ refractory (R/R) multiple myeloma (MM).1 Results from the EAP were presented at the 2016 ASH Meeting.2
Study design
• The objectives of the EAP were to provide early ac-cess to daratumumab treatment and to collect safety and patient-reported outcome data in patients with MM who had received ≥3 prior lines of therapy, including a proteasome inhibitor (PI) and an immu-nomodulatory agent (IMID), or who were double refractory to a PI and an IMID.
• Additional inclusion criteria were:
Age ≥18 years; Documented MM; Progression by International Myeloma Working Group criteria; and
An Eastern Cooperative Oncology Group perfor-
mance status (ECOG PS) of 0–2.
• Exclusion criteria were:
Known chronic obstructive pulmonary disease
(COPD);
Persistent asthma;
Ongoing MM therapy;
Prior exposure to anti-CD38 antibody therapy;
Absolute neutrophil count ≤0.5 × 10⁹/L;
Platelet count <50 × 109/L; and
Creatinine clearance ≤20 mL/min/1.73 m2.
• Patients received daratumumab at a dose of 16 mg/kg
intravenously (iv) every week for eight weeks, then
every two weeks for 16 weeks, and then every four
weeks until disease progression, unacceptable toxic-
ity, or 60 days after U.S. approval.
• Pre- and post-infusion medications were administered
as per study MMY2002:
Results of an early access program of daratumumab in U.S. patients with R/R MM
Chari A, et al. ASH 2016:2133

New Evidence in Oncology | April 2017 21
Daratumumab 16 mg/kg iv
D1 D8 D15
Cycle 1–2
D22 D1 D1D15
D = day; iv = intravenous
Cycle length = 28 days.
Cycle 3–6 Cycle 7+ Follow-up
• A PFS benefit was continually maintained with DVd over time.
• DVd was superior to Vd regardless of prior lines of therapy.
• The largest magnitude of benefit with DVd was observed in patients with one prior line of therapy, who had a 78% reduction in the risk of progression or death with DVd vs. Vd.
• More patients in the DVd arm achieved deeper responses with longer follow-up, including higher CR and MRD-negative rates.
– MRD-negativity translated into longer PFS.
• DVd was superior to Vd regardless of cytogenetic risk or time since last therapy.
• These data support the use of DVd for patients with R/R MM, with most benefit observed in patients with one prior line of therapy.
Key conclusions
Acetaminophen 650–1,000 mg iv or orally (po) one hour
prior to infusion;
An antihistamine (diphenhydramine 25–50 mg iv or po,
or equivalent) one hour prior to infusion;
Methylprednisolone 100 mg iv prior to infusions 1–2
(60 mg iv prior to subsequent infusions); and
Methylprednisolone 20 mg or equivalent post infusion for
two days.
• For subjects with a higher risk of respiratory complications
(predicted % forced expiratory volume in one minute <75%),
the following post-infusion medications were considered:
Diphenhydramine (25–50 mg) or equivalent on the two
days following all daratumumab infusions;
Short-acting β2 adrenergic receptor agonists such as salbu-
tamol aerosol;
Inhaled corticosteroids ± long-acting β2 adrenergic recep-
tor agonists for subjects with asthma; and
Long-acting bronchodilators such as tiotropium or salbuta-
mol ± inhaled corticosteroids for subjects with COPD.
Key findings
Baseline characteristics and disposition
• In total, 400 patients were screened and 348 patients were enrolled and dosed.
• Patients were enrolled at 39 U.S. sites from July to November 2015.
• The median age was 65 years (range: 27–94).
• The majority of patients were male (59%), Caucasian (72%), and had an ECOG PS of 1 (58%).
• Patients received a median eight doses of daratumumab (range: 1–17), and the median treatment exposure time was 1.9 months (range: 0.03–6.0).
• Patient disposition is summarized in Figure 1.
Efficacy
• The median change from baseline in all domains of the EuroQol-five dimensions, five-level questionnaire (EQ-5D-5L) and the European Organization for Research and Treatment of Cancer Quality of Life Questionnaire Core 30 scales was 0 after one and two cycles, as well as at patients’ last assessment. (Table 1)
Study design
Patients(n = 348)
Progressive disease129 (37.1%)
Adverse event13 (3.7%)
Death 5 (1.4%)
Other*13 (3.7%)
Withdrew consent7 (2.0%)
Discontinued therapy147 (42.2%)
Ended study participation due to Market Authorization
181 (52%)
* Remaining patient disposition: five (1.4%) discontinued due to other reasons, four (1.1%) discontinued due to physician decision, two (0.6%) discontinued due to disease relapse, and one subject (0.3%) each discontinued due to adverse event (other) and lost to follow-up.
Figure 1. Patient disposition

22 New Evidence in Oncology | April 2017
The exception to this was the EQ-5D-5L visual analogue scale, which showed a median increase of 1 and 2 units after one and two cycles, respectively.
Safety
• The total number of patients who experienced an adverse event (AE) was 281 (80.7%).
• Grade ≥3 AEs were reported in 50% of patients. (Table 2)
• The total number of patients who discontinued treatment due to an AE was 13 (3.7%).
• Serious AEs (SAEs) occurred in 35% of patients, including
12% of patients with SAEs that were determined by the
investigator to be drug-related.
• Grade 3/4 SAEs occurred in 29.0% of patients. (Table 3)
• A total of 195 patients (56%) experienced infusion-related
reactions (IRRs) during the study, and all 195 of them
experienced IRRs during their first infusion. (Table 4)
• No subjects discontinued the study due to an IRR.
Table 1. Patient-reported outcomes
Change from Baseline
BaselineMean, Median(N: Min, Max)
Cycle 2 Day 1Mean, Median(N: Min, Max)
Cycle 3 Day 1Mean, Median(N: Min, Max)
Last AssessmentMean, Median(N: Min, Max)
EQ-5D-5L
Utility score0.75, 0.79
(324: 0.1, 1.0)–0.01, 0.00
(223: –0.6, 0.3)0.00, 0.00
(142: –0.6, 0.3)–0.02, 0.00
(269: –0.6, 0.4)
VAS63.06, 66.00
(324: 9.0, 100.0)0.71, 1.00
(223: –70.0, 60.0)3.35, 2.00
(142: –72.0, 58.0)–0.16, 0.00
(269: –80.0, 58.0)
EORTC QLQ-C30
Appetite loss 19.94, 0.00(326: 0.0, 100.0)
5.04, 0.00(225: –66.7, 100.0)
0.93, 0.00(144: –66.7, 100.0)
4.57, 0.00(270: –66.7, 100.0)
Cognitive functioning 76.89, 83.33(326: 0.0, 100.0)
0.89, 0.00(225: –83.3, 83.3)
0.93, 0.00(144: –66.7, 83.3)
–0.74, 0.00(270: –66.7, 66.7)
Constipation 15.54, 0.00(326: 0.0, 100.0)
0.44, 0.00(225: –100.0, 100.0)
–1.16, 0.00(144: –100.0, 66.7)
–0.49, 0.00(270: –100.0, 66.7)
Diarrhea 17.48, 0.00(326: 0.0, 100.0)
0.44, 0.00(225: –66.7, 100.0)
1.62, 0.00(144: –66.7, 100.0)
1.48, 0.00(270: –100.0, 100.0)
Dyspnea 22.60, 33.33(326: 0.0, 100.0)
–0.15, 0.00(225: –66.7, 66.7)
–3.01, 0.00(144: –100.0, 66.7)
3.21, 0.00(270: –100.0, 66.7)
Emotional functioning 77.53, 83.33(326: 8.3, 100.0)
1.11, 0.00(225: –75.0, 66.7)
2.49, 0.00(144: –33.3, 41.7)
–1.42, 0.00(270: –66.7, 66.7)
Fatigue 42.26, 33.33(326: 0.0, 100.0)
3.01, 0.00(225: –55.6, 66.7)
–0.54, 0.00(144: –55.6, 55.6)
2.55, 0.00(270: –66.7, 88.9)
Financial difficulties 24.34, 0.00(326: 0.0, 100.0)
–4.74, 0.00(225: –100.0, 66.7)
–0.93, 0.00(144: –66.7, 100.0)
–2.35, 0.00(270: –100.0, 66.7)
Global health status 58.61, 58.33(326: 0.0, 100.0)
1.11, 0.00(225: –58.3, 66.7)
4.69, 0.00(144: –50.0, 66.7)
–1.48, 0.00(270: –58.3, 66.7)
Nausea and vomiting 7.31, 0.00(326: 0.0, 83.3)
1.04, 0.00(225: –50.0, 100.0)
0.58, 0.00(144: –33.3, 50.0)
3.46, 0.00(270: –50.0, 100.0)
Pain score 39.11, 33.33(326: 0.0, 100.0)
–1.41, 0.00(225: –66.7, 83.3)
–2.55, 0.00 (144: –66.7, 66.7)
0.74, 0.00(270: –66.7, 83.3)
Physical functioning 68.68, 73.33(326: 6.7, 100.0)
–1.73, 0.00(225: –80.0, 40.0)
0.83, 0.00(144: –46.7, 46.7)
–3.40, 0.00(270: –80.0, 53.3)
Role functioning 64.37, 66.67(326: 0.0, 100.0)
0.07, 0.00(225: –83.3, 66.7)
0.81, 0.00(144: –83.3, 66.7)
–3.70, 0.00(270: –100.0, 66.7)
Sleep disturbance 29.86, 33.33(326: 0.0, 100.0)
1.48, 0.00(225: –100.0, 100.0)
–1.39, 0.00(144: –66.7, 100.0)
–0.12, 0.00(270: –100.0, 100.0)
Social functioning 65.13, 66.67(326: 0.0, 100.0)
2.67, 0.00(225: –50.0, 66.7)
1.50, 0.00(144: –83.3, 66.7)
–0.99, 0.00(270: –100.0, 66.7)
EORTC QLQ-C30 = European Organization for Research and Treatment of Cancer Quality of Life Questionnaire Core 30; EQ-5D-5L = EuroQol-five dimensions, five-level questionnaire; VAS = visual analogue scale

New Evidence in Oncology | April 2017 23
• AEs in the EAP were consistent with the previously described AE profile of daratumumab in patients with MM who had received ≥3 prior lines of therapy, including a PI and an IMID, or who were double refractory to a PI and an IMID.
• No new safety signals were observed.
• SAEs occurred in one-third of patients, including 12% of patients who experienced a drug-related SAE.
• More than half of patients experienced IRRs, which primarily occurred during the first infusion and were mostly grade 1/2 in severity.
• Patients maintained their health-related quality of life during a median duration of two months of therapy.
Key conclusions
References: 1. Lonial S, Weiss BM, Usmani SZ, et al. Phase II study of dara-tumumab (DARA) monotherapy in patients with ≥3 lines of prior therapy or double refractory multiple myeloma (MM): 54767414MMY2002 (Sirius). J Clin Oncol (ASCO Annual Meeting) 2015;33(Suppl): abstr LBA8512. 2. Chari A, Mark TM, Krishnan A, et al. Results of an early access program (EAP) of daratumumab in United States patients with relapsed or refractory multiple myeloma. ASH Annual Meeting Abstracts 2016:2133.
Table 2. Most common grade 3/4 adverse events
Patients (%)N = 348
Total grade 3 or 4 TEAEs 50
Blood and lymphatic system disorders 30
Thrombocytopenia 15
Anemia 14
Respiratory, thoracic, and mediastinal disorders 6
General disorders and administration site conditions
4
Dyspnea 3
TEAE = treatment-emergent adverse event
Table 3. Most common grade 3/4 serious adverse events
Patients (%)N = 348
Total grade 3 or 4 SAEs 29.0
Pneumonia 2.9
Hypercalcemia 2.9
Thrombocytopenia 2.3
Urinary tract infection 1.7
Febrile neutropenia 1.7
Dyspnea 1.7
SAE = serious adverse event
Table 4. Infusion-related reactions
IRRs (%)N = 348
Percentage of patients with IRRs
First infusion 56
Second infusion 2
All subsequent infusions 2
Respiratory or thoracic symptoms 31
Cough 14
Dyspnea 9
Throat irritation 6
Nasal congestion 5
Bronchospasm 2
IRR = infusion-related reaction
In previous studies, daratumumab has been shown to have
anti-myeloma activity in patients refractory to lenalidomide
and bortezomib, and promising activity when combined with
drugs such as lenalidomide and dexamethasone in patients
with recurrent myeloma.
The results from this study demonstrate that daratumumab can
be safely administered in a community-type setting. Although
the efficacy of daratumumab, either alone or in combination
therapies, in patients with recurrent or refractory myeloma
has been demonstrated in previous studies, the adverse event
profile highlighted here must be considered. Treatment-related
adverse events (TRAEs) of grade >3 were mostly of the hema-
tologic nature and occurred in 51% of patients. Furthermore,
12% of patients had serious TRAEs. This toxicity profile may be expected for a heavily pretreated myeloma population.
Additionally, infusion-related reactions (IRRs) occurred in 56% of patients and required careful management. Relatively long infu-sion times were required (between 3.5 and 7.4 h). Although these IRRs occurred in over half of patients, only 8% were grade >3. In order to limit IRRs, premedication with steroids and broncho-dilators or other interventions were used. Optimizing strategies with premedication to mitigate IRRs could potentially reduce the incidence and severity of these reactions. These IRRs may limit access, particularly in busy chemotherapy units.
Finally, a reduction of IRRs would make this treatment more attractive.
Dr. Neil Berinstein: Perspective on an Early Access Treatment Protocol of Daratumumab in Patients with R/R Multiple Myeloma

24 New Evidence in Oncology | April 2017
Background
Daratumumab is a CD38-directed monoclonal antibody indicated for the treatment of patients with relapsed/ refractory (R/R) multiple myeloma (MM). CD38 is expressed on airway smooth muscle cells, and infusion-related reactions (IRRs) in registration studies of daratumumab were marked by symptoms similar to those of allergic rhinitis (e.g., cough, wheezing, rhinor-rhea). Anecdotal reports indicated that premedication with montelukast, a leukotriene receptor antagonist, may reduce the IRR rate associated with daratumumab therapy. At the 2016 ASH Meeting, Chari et al. pre-sented results from the Early Access Treatment Protocol (EAP) that investigated the efficacy of montelukast pre-medication on IRR reduction in patients with R/R MM who were treated with daratumumab.1
Study design
• The EAP was a multicentre, open-label study.
• The objectives of this study were to provide early access to daratumumab treatment, to collect safety data (including IRRs), and to allow the use of monte-lukast as a premedication for daratumumab therapy.
• Inclusion criteria were:
Age ≥18 years;
Documented MM;
Progression by International Myeloma Working Group criteria following the most recent therapy;
Three or more prior lines of therapy including a proteasome inhibitor (PI) and an immunomodu-latory agent (IMID), or disease double refractory to a PI and an IMID; and
An Eastern Cooperative Oncology Group perfor-mance status (ECOG PS) of 0–2.
• Exclusion criteria were:
Known chronic obstructive pulmonary disease
(COPD);
Persistent asthma;
Ongoing MM therapy;
Prior exposure to anti-CD38 antibody therapy;
Absolute neutrophil count ≤0.5 × 10⁹/L;
Platelet count <50 × 109/L; and
Creatinine clearance ≤20 mL/min/1.73 m2.
• Patients received daratumumab at a dose of 16 mg/kg
intravenously (iv) every week for eight weeks, then
every two weeks for 16 weeks, and then every four
weeks until disease progression, unacceptable toxic-
ity, or 60 days after U.S. approval.
• Pre- and post-infusion medications were adminis-
tered as per study MMY2002.
• Premedications administered one hour (± 15 minutes)
prior to the daratumumab infusion included:
Methylprednisolone 100 mg (or equivalent)
iv for the first two infusions, and 60 mg with
subsequent infusions;
Acetaminophen 650–1,000 mg; and
Diphenhydramine 25–50 mg (or equivalent anti-
histamine drug).
• Postmedication included a corticosteroid (methyl-
prednisolone 20 mg or equivalent) and was given
on the two consecutive days following daratumum-
ab infusions.2
• Montelukast was not recommended but was
allowed at the investigator’s discretion.
Use of montelukast to reduce infusion reactions in an early access program of daratumumab in U.S. patients with R/R MM
Chari A, et al. ASH 2016:2142

New Evidence in Oncology | April 2017 25
Daratumumab 16 mg/kg iv
D1 D8 D15
Cycle 1–2
D22 D1 D1D15
D = day; iv = intravenous
Cycle length = 28 days.
Cycle 3–6 Cycle 7+ Follow-up
Study design
• For subjects with a higher risk of respiratory complications (predicted % forced expiratory volume in one minute <75%), the following post-infusion medications were considered:
Diphenhydramine (25–50 mg) or equivalent on the two days following all daratumumab infusions;
Short-acting β2 adrenergic receptor agonists such as salbutamol aerosol;
Inhaled corticosteroids ± long-acting β2 adrenergic receptor agonists for subjects with asthma; and
Long-acting bronchodilators such as tiotropium or salbu-tamol ± inhaled corticosteroids for subjects with COPD.
Key findings
Baseline characteristics and disposition
• In total, 400 patients were screened and 348 patients were enrolled and dosed.
• Patients were enrolled at 39 U.S. sites from July to November 2015.
• The median age was 65 years (range: 27–94).
• The majority of patients were male (59%), Caucasian (72%), and had an ECOG PS of 1 (58%).
• Patients received a median eight doses of daratumumab
(range: 1–17), and the median treatment exposure time
was 1.9 months (range: 0.03–6.0).
Safety
• A total of 195 patients (56%) experienced IRRs during the
study, and all 195 of them experienced IRRs during their
first infusion. (Table 1)
• The most common IRRs were respiratory or thoracic symp-
toms, which occurred in 31% of patients.
• Sixty patients received montelukast during therapy,
including 50 patients who received montelukast 10 mg
given >30 minutes prior to the first infusion. (Table 2)
• Median time for the first infusion was 6.7 and 7.6 hours
for patients who did or did not receive montelukast,
respectively, while times for subsequent infusions were
similar in both groups.
• A total of 24 patients experienced IRRs that were consid-
ered serious adverse events, but no patient discontinued
the study due to an IRR.
Table 1. Infusion-related reactions
IRRs (%)N = 348
Grade >3 IRRs 8
Percentage of patients with IRRs
First infusion 56
Second infusion 2
All subsequent infusions 2
Respiratory or thoracic symptoms 31
Cough 14
Dyspnea 9
Throat irritation 6
Nasal congestion 5
Bronchospasm 2
IRR = infusion-related reaction

26 New Evidence in Oncology | April 2017
• The findings of the EAP study were similar to those observed in the MMY2002 registration study conducted on the same patient population.2
• The observed IRR rate during the first daratumumab infusion was one-third lower in patients who received 10 mg of montelukast >30 minutes prior to the first infusion vs. patients who did not receive montelukast.– Respiratory and gastrointestinal symptoms were lower in patients who received montelukast, while chills were
observed at a similar rate in both groups.
• The median time for the first infusion was 0.9 hours shorter in patients who received montelukast.
• Because the use of montelukast was limited to a small number of centres, the role of montelukast in reducing IRRs cannot be determined from these uncontrolled observations.
• Additional studies to determine if montelukast mitigates the IRRs associated with the first infusion of daratumumab are needed.
Key conclusions
References: 1. Chari A, Mark TM, Krishnan A, et al. Use of montelukast to reduce infusion reactions in an early access program (EAP) of daratumumab in United States patients with relapsed or refractory multiple myeloma. ASH Annual Meeting Abstracts 2016:2142. 2. Lonial S, Weiss BM, Usmani SZ, et al. Daratumumab monotherapy in patients with treatment-refractory multiple myeloma (SIRIUS): an open-label, randomised, phase 2 trial. Lancet 2016;387(10027):1551–60.
Table 2. Observed IRRs in patients with or without montelukast therapy
Montelukast 10 mg as pre-infusion (n = 50)
No montelukast given as pre-infusion (n = 298)
IRR rate at first infusion, % 38.0 58.5
Respiratory symptoms, % 20 32
Gastrointestinal symptoms, % 4 11
Chills, % 14 14
Median time for first infusion, hours 6.7 7.6
IRR = infusion-related reaction
This study sought to evaluate how infusion-related reactions (IRRs) related to treatment with daratumumab were affected by premedication with montelukast, a leukotriene receptor antagonist. The rationale for this stems from the high incidence of IRRs (up to 71% of patients in one phase I trial) and the requirement for relatively long infusion times (over 7 h for the first infusion).
A total of 348 patients were enrolled in an Early Access Pro-gram. Pre- and post-infusion systemic corticosteroids and post-infusion inhaled corticosteroids and bronchodilators were prescribed. Montelukast was used randomly in 50 patients based on investigator discretion.
The results of this study showed that the use of montelukast resulted in an IRR rate of 38% vs. 58.5% for those who did not receive montelukast for the first infusion. The rate of respiratory
IRRs decreased from 32% to 20% and the rate of gastrointesti-nal IRRs decreased from 11% to 4%. In addition, the median duration time of IRRs was reduced from 7.6 to 6.7 h with the use of montelukast. The authors concluded that further studies to evaluate montelukast would be useful, suggesting perhaps a randomized trial.
The major limitation of this study is in the design, as patients were not randomized to receive or not receive montelukast. It is unclear why some patients were offered montelukast while oth-ers were not; there was likely some bias for its use. Furthermore, it was not clear whether the patients who received montelukast had all received the same other premedications.
Finally, the objective of making daratumumab infusions more tolerable and quicker warrants further investigation, and per-haps this abstract can give us some clues on how to approach it.
Dr. Neil Berinstein: Insights on the Use of Montelukast in Patients with R/R Multiple Myeloma Receiving Daratumumab

• The findings of the EAP study were similar to those observed in the MMY2002 registration study conducted on the same patient population.2
• The observed IRR rate during the first daratumumab infusion was one-third lower in patients who received 10 mg of montelukast >30 minutes prior to the first infusion vs. patients who did not receive montelukast.– Respiratory and gastrointestinal symptoms were lower in patients who received montelukast, while chills were
observed at a similar rate in both groups.
• The median time for the first infusion was 0.9 hours shorter in patients who received montelukast.
• Because the use of montelukast was limited to a small number of centres, the role of montelukast in reducing IRRs cannot be determined from these uncontrolled observations.
• Additional studies to determine if montelukast mitigates the IRRs associated with the first infusion of daratumumab are needed.
Key conclusions
We will change what a cancer diagnosis means. Together.
At Janssen, we’re not about small steps. We’ve set our sights on
making cancer a preventable and curable disease. This isn’t easy.
That’s why we partner with the world’s top minds, from academic
institutions and patient advocates to companies large and small.
Together, we are working toward one goal: changing what a
cancer diagnosis means for patients and their loved ones.
We bring to life transformational cancer therapies – with a
commitment to help get them to the people who need them.
We are Janssen. We collaborate with the world for the health
of everyone in it.
Learn more at www.janssen.com/canada
Janssen Inc.19 Green Belt DriveToronto, OntarioM3C 1L9
vx170004© 2017 Janssen Inc. www.janssen.com/canada
The image depicted contains modelsand is being used for illustrative purposes only.
28 New Evidence in Oncology | April 2017
Chronic Lymphocytic Leukemia
Long-term Studies Provide Reassurance on Efficacy and Safety of Treatments in Chronic Lymphocytic Leukemia
Chronic lymphocytic leukemia (CLL) is considered incurable with conventional therapies.1 However, with the emergence of novel agents and combination therapies, many clinical trial programs have been established and demonstrated significant improve-ment in patient survival. The favourable study results have prompted investigation on the long-term efficacy and safety profiles for these treatments, and a majority of patients enrolled in these trials continued on their treatment for an extended period of time.
One such clinical trial is the CLL10 study, conducted by the German CLL Study Group, which aimed to show the noninferiority of bendamustine plus rituximab (BR) compared to fludarabine, cyclophos-phamide, and rituximab (FCR) in fit, elderly patients.
For patients with CLL who are young and fit, FCR is the gold-standard therapy; however, due to the signif-icant toxicities associated with FCR, it is an unsuitable treatment for older patients with CLL, who often have multiple comorbidities. As the median age of patients with CLL is 72 years2, many patients with CLL are un-able to tolerate FCR therapy and require alternative treatment. In the CLL10 study, at a median follow-up of 37.1 months, BR showed comparable efficacy and reduced toxicity in fit patients older than 65 years when compared with FCR, indicating that BR is a suit-able alternative to FCR in this patient population.3 Based on these data, long-term follow-up has been initiated to confirm that results are consistent.
Aside from the CLL10 study, long-term efficacy and safety have also been examined for novel tar-geted agents in patients with treatment naïve (TN) or relapsed/refractory (R/R) CLL/small lymphocytic lymphoma (SLL). Studies have shown that these targeted agents have tolerable safety profiles, which make them suitable for physically unfit and elderly patients, and they are efficacious in patients with cytogenetic abnormalities such as deletion of 17p (del[17p]) or 11q (del[11q]), who typically respond poorly to chemoimmunotherapy.1
Among these targeted agents is ibrutinib, a first-in-
class, oral, covalent inhibitor of Bruton’s tyrosine
kinase. Ibrutinib has been approved by Health
Canada for patients with CLL/SLL who received ≥1
prior therapy or those with del(17p).4 This approval
was based on data from the phase III RESONATETM
trial, which showed a 78% and 57% reduction in the
risk of progression and death, respectively, in patients
with R/R CLL treated with ibrutinib compared with
ofatumumab.5 In the RESONATETM-2 study, ibrutinib
has also demonstrated reduced risk of progression or
death (by 84%) compared to chlorambucil in elderly
patients with TN CLL/SLL.6 In addition, ibrutinib has
also shown encouraging results in the phase Ib/II
PCYC-1102 study in patients with TN and R/R
CLL/SLL.7,8 The promising short-term efficacy and
safety profile for ibrutinib shown in these studies urges
researchers to perform longer term follow-ups.
Another targeted agent that is being examined in
longer term follow-up is idelalisib. Idelalisib is a
first-in-class, oral inhibitor which selectively targets
phosphatidylinositol 3-kinase (PI3K) delta; it has been
approved by Health Canada in combination with
rituximab for the treatment of patients with relapsed
CLL.9 In a phase III study, idelalisib in combination
with BR has been shown to improve progression-free
survival in patients with R/R CLL when compared
with BR alone after a median follow-up of 12 months,
which prompted further analysis of overall survival in
a longer observation time.10
At the 2016 American Society of Hematology (ASH)
Annual Meeting, long-term efficacy and safety of the
aforementioned therapies in CLL were reported:
• In an updated analysis of the CLL10 study, BR
continued to show comparable efficacy with a
favourable toxicity profile compared to FCR in fit,
elderly patients with CLL. (Eichhorst BF, et al. ASH
2016:4382)

New Evidence in Oncology | April 2017 29
References: 1. Rai KR, Jain P. Chronic lymphocytic leukemia (CLL) – Then and now. Am J Hematol 2016;91:330–40. 2. Tadmor T, Polliack A. Optimal management of older patients with chronic lymphocytic leukemia: some facts and principles guiding therapeutic choices. Blood Rev 2012;26:15–23. 3. Eichhorst B, Fink AM, Bahlo J, et al. First-line chemoimmunotherapy with bendamustine and rituximab versus fludarabine, cyclophosphamide, and rituximab in patients with advanced chronic lymphocytic leukaemia (CLL10): an international, open-label, randomised, phase 3, non-inferiority trial. Lancet Oncol 2016;17:928–42.4. Janssen. PrImbruvica® (ibrutinib) Product Monograph. September 14, 2015. 5. Byrd JC, Brown JR, O’Brien S, et al. Ibrutinib versus ofatumumab in previously treated chronic lymphoid leukemia. N Engl J Med 2014;371:213–23. 6. Burger JA, Tedeschi A, Barr PM, et al. Ibrutinib as initial therapy for patients with chronic lymphocytic leukemia. N Engl J Med 2015;373:2425–37. 7. O’Brien S, Furman RR, Coutre SE, et al. Ibrutinib as initial therapy for elderly patients with chronic lymphocytic leukaemia or small lymphocytic lymphoma: an open-label, multicentre, phase 1b/2 trial. Lancet Oncol 2014;15:48–58. 8. Byrd JC, Furman RR, Coutre SE, et al. Targeting BTK with ibrutinib in relapsed chronic lymphocytic leukemia. N Engl J Med 2013;369:32–42. 9. Gilead. PrZydeligTM (idelalisib) Product Monograph. November 23, 2016. 10. Zelenetz AD, Robak T, Coiffier B, et al. Idelalisib plus bendamustine and rituximab (BR) is superior to BR alone in patients with relapsed/refractory chronic lymphocytic leukemia: Results of a phase 3 random-ized double-blind placebo-controlled study. ASH Annual Meeting Abstracts 2015:LBA-5.
• After a longer observation period, overall survival was in favour of idelalisib plus BR compared to BR alone in patients with R/R CLL, regardless of high-risk features, and the com-bination had a manageable safety profile. (Zelenetz AD, et al. ASH 2016:231)
• The extension study of PCYC-1102, which is the longest experience to date for ibrutinib-treated patients, confirmed ibrutinib’s durable responses and tolerable safety profile in patients with TN or R/R CLL/SLL, including those with cytogenetic abnormalities. (O’Brien SM, et al. ASH 2016:233)
• In the long-term follow-up of the RESONATETM-2 study, ibrutinib continued to demonstrate substantial efficacy and reduction in risk of progression or death in elderly patients with TN CLL/SLL when compared with chlorambucil. (Barr PM, et al. ASH 2016:234)
• The integrated safety analysis of RESONATETM and RESONATETM-2, and the long-term safety analysis of PCYC-1102/1103 supported the manageable safety profile of prolonged ibrutinib treatment in patients with TN and R/R CLL/SLL. (Coutre S, et al. ASH 2016:4383)
Background
Fludarabine, cyclophosphamide, and rituximab (FCR)
is the standard frontline regimen for physically fit
patients with chronic lymphocytic leukemia (CLL)
without tumour protein 53 (TP53) alteration. The
CLL10 study, conducted by the German CLL Study
Group (GCLLSG), has previously demonstrated the
noninferiority of bendamustine plus rituximab (BR)
compared to FCR in this population.1 At the 2016
ASH Meeting, Eichhorst and colleagues presented an
updated analysis of the study, which evaluated the
long-term outcome and toxicity.2
Study design
• The CLL10 study was an international, phase III,
multicentre trial that evaluated the noninferiority
of BR compared to FCR for progression-free survival
(PFS) in frontline therapy of physically fit patients
with CLL.
• Trial inclusion criteria allowed enrolment of patients with untreated active CLL, without significant comor-bidity (Cumulative Illness Rating Score ≤6 and normal creatinine clearance), and without the deletion of 17p (del[17p]).
• A total of 688 patients were screened and 561 patients were randomized to receive FCR (n = 282) or BR (n = 279).
• Patients were followed every three months for two years and every six months for three years, then annu-ally until progressive disease (PD).
• After PD, annual visits were documented either within the study or within the GCLLSG registry.
• Health-related quality of life (HRQoL) was assessed by the European Organization for Research and Treat-ment of Cancer questionnaire (EORTC C30), which was completed at baseline, after Month 3, 6, and 12, and then annually until Year 5.
• The median observation time was 58.2 months.
Favourable toxicity profile and long-term outcome of elderly, physically fit CLL patients receiving first-line BR chemoimmunotherapy in comparison to FCR in advanced CLL: Update analysis of the CLL10 study
Eichhorst BF, et al. ASH 2016:4382

30 New Evidence in Oncology | April 2017
Key findings
• The median age was 61.5 years.
• There were 86 and 108 patients who were >65 years in the FCR and BR arms, respectively.
• The median PFS for FCR was 57.6 months, compared to 42.3 months for the BR arm (HR = 1.593; 95% CI: 1.271–1.996; p <0.0001). (Figure 1)
• While the median PFS for FCR vs. BR was significantly differ-ent in younger patients with age ≤65 years (57.6 months vs. 38.2 months; p <0.0001), the difference between arms was not statistically significant in elderly patients with age >65 years (57.9 months vs. 48.5 months; p = 0.134). (Figure 2)
• The difference in overall survival (OS) for younger patients and elderly patients was not statistically significant between both arms. For younger patients, the OS at 5 years was 85.6% for FCR and 81.1% for BR; for elderly patients, the OS at 5 years was 70.9% for FCR and 78.8% for BR.
• A total of 51 patients (18.1%) died in the FCR arm and 54 patients (19.4%) died in the BR arm. The main causes of death are outlined in Table 1.
• Secondary malignancies were documented in 49 patients (17%)
in the FCR arm and 35 patients (13%) in the BR arm. (Table 2)
Secondary myelodysplastic syndrome and/or acute
myeloid leukemia occurred more frequently after FCR
therapy, particularly in elderly patients.
• Following frontline treatment, 77 patients (27.3%) in the
FCR arm and 108 patients (38.7%) in the BR arm received
at least one subsequent therapy. Second-line treatments are
outlined in Table 3.
• A total of 540 patients (96.3%) were evaluable for HRQoL
analysis, with 272 patients in the FCR arm and 268 patients in
the BR arm.
No differences were detected between arms with respect to
global health status or any functional or symptom scale.
Compared to an age- and sex-matched normal popula-
tion, functional scale values were impaired mostly during
treatment phase, and symptom scale values were affected
during follow-up.
Patients with untreated active CLL, without significant comorbidity (CIRS ≤6 and normal creatinine clearance), and without del(17p)
Follow-up until PD + long-termobservation within the GCLLSG registry
6 x FCRFludarabine 25 mg/m2 iv, Days 1–3Cyclophosphamide 250 mg/m2 iv, Days 1–3Rituximab 375 mg/m2 iv Day 0, Cycle 1Rituximab 500 mg/m2 iv Day 1, Cycles 2–6; q28d
6 x BRBendamustine 90 mg/m2 iv, Days 1–2Rituximab 375 mg/m2 iv Day 0, Cycle 1Rituximab 500 mg/m2 iv Day 1, Cycles 2–6; q28d
Randomization
BR = bendamustine plus rituximab; CIRS = Cumulative Illness Rating Score; CLL = chronic lymphocytic leukemia; del(17p) = deletion of 17p; FCR = fludarabine, cyclophosphamide, rituximab; GCLLSG = German CLL Study Group; iv = intravenous; PD = progressive disease; q28d = every 28 days
Study design
BR = bendamustine plus rituximab; CI = confidence interval; FCR = fludarabine, cyclophosphamide, rituximab; HR = hazard ratio; PFS = progression-free survival
84 96726048362412
Time to event (months)
Cum
ulat
ive
surv
ival
0
FCRBR
Median PFSFCR: 57.6 monthsBR: 42.3 monthsp <0.0001HR = 1.59395% CI: 1.271–1.996
0.0
0.2
0.4
0.6
0.8
1.0
BR = bendamustine plus rituximab; FCR = fludarabine, cyclophosphamide, rituximab; PFS = progression-free survival
84 96726048362412
Time to event (months)
Cum
ulat
ive
surv
ival
0
Median PFSFCR, ≤65 years: 57.6 monthsFCR, >65 years: 57.9 monthsBR, ≤65 years: 38.2 monthsBR, >65 years: 48.5 months
FCR, ≤65 yearsFCR, >65 yearsBR, ≤65 yearsBR, >65 years
0.0
0.2
0.4
0.6
0.8
1.0
Figure 1. Progression-free survival Figure 2. PFS according to treatment and age

• Long-term follow-up of the CLL10 study confirms the superiority of the FCR regimen in young and fit patients with CLL.
• BR is an alternative frontline treatment option in fit elderly patients with CLL.
Key conclusions
References: 1. Eichhorst B, Fink AM, Bahlo J, et al. First-line chemoim-munotherapy with bendamustine and rituximab versus fludarabine, cyclophosphamide, and rituximab in patients with advanced chronic lymphocytic leukaemia (CLL10): an international, open-label, randomised, phase 3, non-inferiority trial. Lancet Oncol 2016;17:928–42. 2. Eichhorst BF, Bahlo J, Maurer C, et al. Favorable toxicity profile and long term outcome of elderly, but physically fit CLL patients (pts) receiving first line bendamus-tine and rituximab (BR) frontline chemoimmunotherapy in comparison to fludarabine, cyclophosphamide, and rituximab (FCR) in advanced chronic lymphocytic leukemia (CLL): Update analysis of an international, random-ized study of the German CLL Study Group (GCLLSG) (CLL10 Study). ASH Annual Meeting Abstracts 2016:4382.
Table 1. Main causes of death
FCRn (%)
BRn (%)
SPM 14 (5.0) 10 (4.3)
CLL/RT 11 (3.9)Including 2 RT
15 (5.4)Including 6 RT
Infections 7 (2.5) 12 (4.3)
Concomitant disease 6 (2.1) 10 (4.3)
Other* 13 (4.6) 7 (2.5)
BR = bendamustine plus rituximab; CLL = chronic lymphocytic leukemia; FCR = fludarabine, cyclophosphamide, rituximab; RT = Richter’s transformation; SPM = secondary primary malignancy
* Adverse events to frontline/relapse treatment or unknown.
Table 2. Secondary primary malignancies
FCR (n = 279)n (%)
BR (n = 278)n (%)
SPM 49 (17) 35 (13)
Solid tumour 28 (10) 25 (9)
Skin tumour 9 (4) 8 (3)
AML/MDS All 9 (3) 2 (1)
>65 years 6 (7) 1 (1)
RT 5 (2) 8 (3)
AML = acute myeloid leukemia; BR = bendamustine plus rituximab; FCR = fludarabine, cyclophosphamide, rituximab; MDS = myelodysplastic syndrome; RT = Richter’s transformation; SPM = secondary primary malignancies
Table 3. Second-line treatment
FCR (n = 77) BR (n = 108)
FCR 6 33
BR 42 31
R-CHOP 3 5
Antibody alone 4 5
Ibrutinib or idelalisib + rituximab
3 6
Venetoclax 2 0
Lenalidomide 0 3
Other 17 24
BR = bendamustine plus rituximab; FCR = fludarabine, cyclophosphamide, rituximab; R-CHOP = rituximab, cyclophosphamide, doxorubicin, vincristine
Canadian Perspective by Dr. Carolyn Owen on the Updated Analysis of the CLL10 Study that Examined Long-term Outcome of First-line BR Therapy Compared to FCR in Fit, Elderly Patients with CLL
In the treatment of chronic lym-phocytic leukemia (CLL), a key challenge is patient tolerability of the most effective treatment, which is often accompanied by toxicities that are difficult to man-age. In Canada, the combination of fludarabine, cyclophosphamide, and rituximab (FCR) is the stan-
dard of care for first-line, fit, and young patients with CLL. FCR has demonstrated an overall survival (OS) advantage when compared to fludarabine and cyclophosphamide, and it has been shown to induce long remission durations in patients with CLL.1 However, it is associated with sig-nificant toxicities such as prolonged cytopenias, increased risk of infections, and secondary malignancies, which may
be intolerable for unfit or older patients. Since the median age of patients with CLL at diagnosis is 72 years2, and the average age of patients receiving treatment would be older than that because less than half of those patients require treatment upon first diagnosis, most treated CLL patients have multiple comorbidities and require alternative treat-ment options.
For older patients who are relatively fit or any patient who can tolerate treatments that are more aggressive than chlorambu-cil-based therapies, one treatment option is bendamustine plus rituximab (BR), which is available in many provinces. For unfit, elderly patients with CLL, most centres have adopted the regimen from the CLL11 study conducted by the German CLL Study Group (GCLLSG) and use the combina-tion of chlorambucil and obinutuzumab.3
New Evidence in Oncology | April 2017 31

When determining patient fitness, I would mostly con-sider kidney function, comorbidities, and the number of concomitant medications. I worry about drug clearance in those with reduced renal function because it can greatly affect treatment outcome due to tolerability. Since liver failure or significant liver dysfunction is uncommon in patients with CLL, poor kidney function is the most impor-tant problem that usually leads to treatment modification. For a full assessment of comorbidities, I tend to use the Cumulative Illness Rating Score (CIRS) because this was an inclusion criteria in the GCLLSG CLL8 and CLL11 practice-changing studies. However, most physicians do not look at the CIRS score; rather, they base their assessment of fitness on age and functional ability.
The CLL10 study conducted by the GCLLSG aimed to show the noninferiority of BR compared to FCR based on pro-gression-free survival (PFS) in fit patients with CLL. Overall, the rationale and design of the CLL10 study were excel-lent. It was a properly conducted, randomized, phase III study in a large population. In terms of patient selection, patients with CIRS ≤6 and normal creatinine clearance were included. This patient population is less reflective of the general CLL population because many real-world patients have either CIRS >6 or reduced renal function upon their first treatment and are not as fit as those included in this study. Moreover, the median age was 61.5 years1, which is younger than that of an average patient with CLL. These differences cause difficulty in extrapolating results from this study to a broader CLL population.
At the 2016 ASH Meeting, the long-term follow-up of the CLL10 study was presented, which confirmed the superiority of FCR in young and fit patients with CLL (age ≤65 years), and supported the recommendation of using BR in fit, elderly patients with age >65 years.4 The median PFS for young patients was 57.6 months for FCR compared to 38.2 months for BR (p <0.0001), while the median PFS for patients with age >65 years was not significantly differ-ent between treatment groups. For young and fit patients, the data continue to indicate that FCR is a more effective therapy than BR and that it produces longer remissions. However, FCR was associated with more frequent adverse
events (AEs), particularly infectious toxicity, compared to BR. For fit, elderly patients, the data justified using BR as an alternative frontline treatment because FCR and BR had similar efficacy in this patient subgroup and FCR treatment resulted in a significant excess of AEs. In addition, this lon-ger-term follow-up data continues to show no difference in OS, which reassures clinicians in their choice of FCR or BR.
The original CLL10 presentation supported the use of BR in fit, elderly patients, and its results led to a change in our practice where BR was then used in many CLL patients. This longer-term follow-up gives us similar information as the published data5 and does not change our interpreta-tion; thus, it does not influence our practice. It would be more interesting to see longer follow-ups in patients who are treated more recently because treatment options in CLL have changed significantly since this study was started (e.g., availability of novel agents at relapse). Moreover, a more in-depth, longer-term safety analysis is desired because the current follow-up only reported deaths and frequency of secondary malignancies after a relatively short period. There are still a lot of questions about secondary malignan-cies and the length of the current follow-up is too short to make any conclusions about this adverse event.
Based on the CLL10 study and its long-term follow-up, I would recommend BR as first-line treatment to fit, elderly patients with age >65 years. Since elderly patients toler-ated FCR poorly, we would extrapolate that younger, less fit patients would be similar. Thus, many clinicians would assume that BR is safer than FCR in young unfit patients, though the CLL10 study did not include such patients and such a study has not been conducted.
Overall, since a minority of the total CLL patient popu-lation can tolerate FCR well, the CLL10 study and its long-term follow-up support using BR in a relatively large percentage of first-line patients. In many centres, physi-cians prefer to give a stronger treatment, such as BR, rather than a chlorambucil-based therapy as first-line treatment in younger unfit patients, though a study of BR versus chlo-rambucil plus obinutuzumab has not been performed.
References: 1. Eichhorst B, Fink AM, Busch R, et al. Frontline chemoimmunotherapy with fludarabine (F), cyclophosphamide (C), and rituximab (R) (FCR) shows superior efficacy in comparison to bendamustine (B) and rituximab (BR) in previously untreated and physically fit patients (pts) with advanced chronic lymphocytic leukemia (CLL): final analysis of an international, randomized study of the German CLL Study Group (GCLLSG) (CLL10 Study). Blood (ASH Annual Meeting Abstracts) 2014;124:19. 2. Tadmor T, Polliack A. Optimal management of older patients with chronic lymphocytic leukemia: some facts and principles guiding therapeutic choices. Blood Rev 2012;26:15–23. 3. Goede V, Fischer K, Busch R, et al. Obinutuzumab plus chlorambucil in patients with CLL and coexisting conditions. N Engl J Med 2014;370:1101–10. 4. Eichhorst BF, Bahlo J, Maurer C, et al. Favorable toxicity profile and long term outcome of elderly, but physically fit CLL patients (pts) receiving first line bendamustine and rituximab (BR) frontline chemoimmunotherapy in comparison to fludarabine, cyclophosphamide, and rituximab (FCR) in advanced chronic lymphocytic leukemia (CLL): Update analysis of an international, randomized study of the German CLL Study Group (GCLLSG) (CLL10 Study). ASH Annual Meeting Abstracts 2016:4382. 5. Eichhorst B, Fink AM, Bahlo J, et al. First-line chemoimmunotherapy with bendamustine and rituximab versus fludarabine, cyclophosphamide, and rituximab in patients with advanced chronic lymphocytic leukaemia (CLL10): an international, open-label, randomised, phase 3, non-inferiority trial. Lancet Oncol 2016;17:928–42.
32 New Evidence in Oncology | April 2017

New Evidence in Oncology | April 2017 33
Background
Idelalisib in combination with bendamustine and rituximab (BR) has been shown to improve progres-sion-free survival (PFS) in patients with relapsed/refractory (R/R) chronic lymphocytic leukemia (CLL) when compared with BR alone after a median follow-up of 12 months.1 At the 2016 ASH Meeting, Zelenetz and colleagues presented the updated data on overall survival (OS) in this study.2
Study design
• This was a phase III, randomized, placebo-controlled study, which was unblinded by the independent data monitoring committee at the first interim analysis for efficacy.
• Between June 2012 and August 2014, patients with R/R CLL were enrolled in the study across 19 coun-tries. Key eligibility criteria included:
Age ≥18 years;
R/R CLL requiring treatment;
CLL progression within 36 months from the last prior therapy;
Measurable disease;
No history of transformation of CLL;
No progression within six months from the last
bendamustine treatment; and
No prior treatments with inhibitors of the B-cell
pathway.
• Patients were randomized to BR for six four-week
cycles and idelalisib (arm A) or placebo (arm B).
• Stratification was based on the presence of deletion
of 17p (del[17p]) and/or tumour protein 53 (TP53)
mutation, immunoglobulin heavy chain variant
(IGHV) mutation status, and disease status (refrac-
tory vs. relapsed CLL).
• Pre-specified interim analysis was performed at
67% of the total number of planned events of CLL
progression.
• There was an improvement in median PFS from
15 months to 22.5 months due to the addition of
idelalisib to BR (HR = 0.67).
• The primary endpoint was PFS, assessed by indepen-
dent review committee (IRC).
• Secondary endpoints included OS, overall
response rate (ORR), nodal response, and com-
plete response (CR).
Updated analysis of overall survival in randomized phase III study of idelalisib in combination with BR in patients with relapsed/refractory CLL
Zelenetz AD, et al. ASH 2016:231
Arm An = 207
Investigator’s choice(standard of care orinvestigational)
B (70 mg/m2 D1, D2 of each four-week cycle, C1–C6)
Post-study therapy
R (375 mg/m2 C1, 500 mg/m2 C2–C6)
Idelalisib (150 mg bid) PD
PDPlacebo (bid)
B (70 mg/m2 D1, D2 of each four-week cycle, C1–C6)
R (375 mg/m2 C1, 500 mg/m2 C2–C6)
Double-blind initial combination therapy
B = bendamustine; bid = twice daily; C = cycle; D = day; PD = disease progression; R = rituximab
Ran
do
miz
atio
n
Arm Bn = 209
Study design

34 New Evidence in Oncology | April 2017
Key findings
Baseline characteristics and disposition
• A total of 416 patients were enrolled in the study (n = 207 for idelalisib plus BR, n = 209 for placebo plus BR).
• The percentage of male patients was similar between arms (77% for idelalisib plus BR, 75% for placebo).
• The median age of patients was 62 years (range: 38–83) in the idelalisib plus BR arm and 64 years (range: 32–82) in the placebo arm.
• A total of 48% of patients in the idelalisib plus BR arm and 42% of patients in the placebo arm had Rai stage III/IV disease.
• The median number of prior therapies was two for both arms.
• In both arms, 33% of patients had del(17p) and/or TP53 mutation.
• There were 84% and 83% of patients with unmutated IGHV in the idelalisib plus BR and control arms, respectively.
• There were 34% and 33% of patients with refractory disease in the idelalisib plus BR and control arms, respectively.
• Data cutoff of the current analysis was in May 2016, repre-senting a median follow-up of 21 months (range: 0.1–43.3).
Efficacy
• In the intent-to-treat population, the median OS for idelal-isib plus BR was not reached, compared to 40.6 months for
placebo plus BR (HR = 0.67; 95% CI: 0.47–0.96; p = 0.04). (Figure 1)
• In patients without del(17p) or TP53, the median OS was not reached in the idelalisib plus BR arm, compared to 40.6 months in the control arm (HR = 0.67; 95% CI: 0.4–1.12; p = 0.12).
• The median IRC-assessed PFS of idelalisib plus BR vs. placebo was 23 vs. 11.1 months (HR = 0.31; 95% CI: 0.24–0.41; p <0.0001). (Figure 2)
• In all the subgroups analyzed, OS favoured idelalisib plus BR.
Safety
• In the idelalisib plus BR arm, 64 patients discontinued the study; 44 patients discontinued the study in the control arm. Reasons for discontinuation include adverse events (AEs), physician decision, consent withdrawal, and other.
• There were 35% and 68% of patients in the idelalisib plus BR and control arms, respectively, who were off study due to disease progression or death.
• AE summary is outlined in Table 1.
Serious AEs (SAEs) occurred in 147 patients (71%) in the ide-lalisib plus BR arm and 94 patients (45%) in the control arm.
• The most common all-grade AEs with idelalisib plus BR were neutropenia (64%) and pyrexia (44%); with placebo plus BR, they were neutropenia (55%) and nausea (35%).
BR = bendamustine plus rituximab; CI = confidence interval; HR = hazard ratio; NR = not reached; OS = overall survival
36 40322824128 20164
Time (months)
Prob
abili
ty o
f su
rviv
al (
%)
0
143(43)
126(46)
154(38)
159(33)
163(30)
45(52)
34(53)
56(50)
76(48)
106(47)
21(53)
9(53)
1(53)
0(53)
1(53)
2(53)
4(53)
166(27)
178(19)
184(14)
193(10)
199(6)
207(0)
123(56)
107(59)
140(50)
151(43)
159(35)
31(68)
24(68)
42(67)
52(66)
78(64)
17(69)
5(69)
0(70)
0(70)
2(69)
2(69)
3(69)
166(31)
168(30)
182(21)
195(11)
204(5)
209(0)
Idelalisib + BRN at risk (events)
Placebo + BR
Idelalisib + BRPlacebo + BR
0
20
40
60
80
100
44
Idelalisib + BR Placebo + BR
Median OS, months NR 40.6
0.67
95% CI
p-value
0.47–0.96
0.04 (stratified)0.06 (unstratified)
HR
Figure 1. OS in intent-to-treat population

New Evidence in Oncology | April 2017 35
• The most common grade ≥3 AEs with idelalisib plus BR were
neutropenia (60%) and febrile neutropenia (24%); with placebo
plus BR, they were neutropenia (47%) and anemia (13%).
• Grade ≥3 diarrhea occurred in 12% of patients treated with
idelalisib plus BR and in 2% of patients treated with placebo
plus BR.
• Transaminase abnormalities were observed more frequently
in the idelalisib plus BR vs. placebo plus BR arms.
Alanine transaminase (ALT) elevation of any grade was
observed in 63% and 32% of patients in the idelalisib plus
BR and placebo plus BR arms, respectively.
Grade ≥3 ALT elevation was observed in 21% and 3% of
patients in the idelalisib plus BR and placebo plus BR arms,
respectively.
Aspartate transaminase (AST) elevation of any grade was
observed in 54% and 29% of patients in the idelalisib plus
BR and placebo plus BR arms, respectively.
Grade ≥3 AST elevation was observed in 16% and 3% of
patients in the idelalisib plus BR and placebo plus BR arms,
respectively.
• Infections and infestations occurred in 73% and 60% of
patients in the idelalisib plus BR and placebo plus BR arms,
respectively.
The total number of patients with opportunistic infections
(Pneumocystis jirovecii pneumonia/cytomegalovirus) was
5/13 in the idelalisib plus BR arm vs. 0/3 in the placebo arm.
BR = bendamustine plus rituximab; CI = confidence interval; HR = hazard ratio; IRC = independent review committee; PFS = progression-free survival
36 40322824128 20164
Time (months)
PFS
pro
bab
ility
(%
)
0
90(78)
71(81)
101(69)
107(64)
120(54)
17(93)
16(93)
24(89)
40(87)
62(82)
7(95)
3(95)
1(95)
0(95)
1(95)
1(95)
1(95)
132(44)
148(33)
156(25)
178(11)
194(6)
207(0)
34(146)
18(155)
46(135)
64(128)
63(119)
1(165)
1(165)
3(164)
5(163)
12(160)
0(165)
0(165)
0(165)
0(165)
0(165)
0(165)
0(165)
96(85)
133(56)
146(46)
171(27)
199(7)
209(0)
Idelalisib + BRN at risk (events)
Placebo + BR
Idelalisib + BRPlacebo + BR
0
20
40
60
80
100
44
Idelalisib + BR Placebo + BR
Median PFS, months 23 11.1
0.31
95% CI
p-value
0.24–0.41
<0.0001
HR
Figure 2. IRC-assessed PFS
Table 1. Adverse event summary
Idelalisib + BR (n = 207)
n (%)
Placebo + BR (n = 209)
n (%)
Any AE 207 (100) 203 (97)
Grade ≥3 196 (95) 163 (78)
Any SAE 147 (71) 94 (45)
AE leading to
Study drug dose reduction 34 (16) 13 (6)
Study drug discontinuation 68 (33) 31 (15)
Death 25 (12) 19 (9)
AE = adverse event; BR = bendamustine plus rituximab; SAE = serious AE

36 New Evidence in Oncology | April 2017
• The combination of idelalisib and BR was superior to BR alone with regards to OS in patients with R/R CLL.
• The efficacy results were consistent across patients with or without high-risk features, such as del(17p)/TP53 mutations, unmutated IGHV, and refractory disease.
• The safety profile was manageable.
• Opportunistic infections and SAEs were more frequent with idelalisib plus BR.
• Idelalisib plus BR represents an important option for patients with R/R CLL.
Key conclusions
References: 1. Zelenetz AD, Robak T, Coiffier B, et al. Idelalisib plus bendamustine and rituximab (BR) is superior to BR alone in patients with relapsed/refrac-tory chronic lymphocytic leukemia: Results of a phase 3 randomized double-blind placebo-controlled study. ASH Annual Meeting Abstracts 2015:LBA-5. 2. Zelenetz AD, Brown JR, Delgado J, et al. Updated analysis of overall survival in randomized phase III study of idelalisib in combination with bendamustine and rituximab in patients with relapsed/refractory CLL. ASH Annual Meeting Abstracts 2016:231.
Background
The PCYC-1102 trial has demonstrated the efficacy
and tolerability of single-agent ibrutinib in patients
with treatment naïve (TN) or relapsed/refractory
(R/R) chronic lymphocytic leukemia (CLL)/small
lymphocytic lymphoma (SLL).1,2 At the 2016 ASH
Meeting, O’Brien and colleagues reported the efficacy
and safety of ibrutinib in a five-year follow-up study
(PCYC-1103), which is the longest experience to date
for ibrutinib-treated patients.3
Study design
• The PCYC-1103 study is an extension of the phase II
PCYC-1102 study.
• Patients with CLL/SLL received 420 mg or 840 mg of oral ibrutinib once daily.
• Overall response rate (ORR), including partial response (PR) with lymphocytosis (PR-L), was assessed using the updated International Workshop on Chronic Lymphocytic Leukemia (iwCLL) criteria.
• Responses were assessed by risk groups: unmu-tated immunoglobulin heavy chain variant (IGHV), complex karyotype (≥3 unrelated chromosomal abnormalities by stimulated cytogenetics, assessed by a reference lab), and in hierarchical order for deletion of 17p (del[17p]) then deletion of 11q (del[11q]).
• Grade ≥3 adverse events (AEs), serious AEs (SAEs), and AEs requiring dose reduction or discontinua-tion were recorded.
Five-year experience with single-agent ibrutinib in patients with previously untreated and relapsed/refractory CLL/SLL
O’Brien SM, et al. ASH 2016:233
BR = bendamustine plus rituximab; CIRS = Cumulative Illness Rating Score; CLL = chronic lymphocytic leukemia; del(17p) = deletion of 17p; FCR = fludarabine, cyclophosphamide, rituximab; GCLLSG = German CLL Study Group; iv = intravenous; PD = progressive disease; q28d = every 28 days
CLL = chronic lymphocytic leukemia; R/R = relapsed/refractory; SD = stable disease; SLL = small lymphocytic lymphoma
* R/R includes patients with high-risk CLL/SLL, defined as progression of disease <24 months after the initiation of a chemoimmunotherapy regimen or failure to respond.
Treatment naïve≥65 years(n = 31)
Patients with CLL/SLL treated with oral,
once-daily ibrutinib (420 or 840 mg/day)
PCYC-1102(N = 132)
Extension studyPCYC-1103
Long-term follow-up≥SD
R/R*(n = 101)
Study design

New Evidence in Oncology | April 2017 37
• The combination of idelalisib and BR was superior to BR alone with regards to OS in patients with R/R CLL.
• The efficacy results were consistent across patients with or without high-risk features, such as del(17p)/TP53 mutations, unmutated IGHV, and refractory disease.
• The safety profile was manageable.
• Opportunistic infections and SAEs were more frequent with idelalisib plus BR.
• Idelalisib plus BR represents an important option for patients with R/R CLL.
Key conclusionsKey findings
Baseline characteristics and disposition
• There were 31 patients who were TN and 101 patients with R/R CLL/SLL.
• The median age of TN patients was 71 years (range: 65–84) and the median age of patients with R/R disease was 64 years (range: 37–82).
There were 74% of TN patients and 34% of patients with R/R CLL/SLL who were ≥70 years.
• There were 55% of TN patients and 57% of patients with R/R CLL/SLL with Rai stage III/IV disease.
• Patient’s cytogenetic abnormalities and IGHV mutation are summarized in Table 1.
• The median time on study for TN patients was 62 months (range: 1–67) and 49 months (range: 1–67) for patients with R/R disease.
• After five years of follow-up, 65% of TN patients and 30% of patients with R/R disease remained on ibrutinib therapy.
• Primary reasons for discontinuation include progressive disease, AE, consent withdrawal, investigator decision, and lost to follow-up.
Efficacy
• The ORR was 89% for all-treated patients, 87% for TN patients, and 89% for patients with R/R disease. (Figure 1)
• In patients with R/R disease and high-risk abnormalities, the ORR was 97% for patients with del(11q), 90% for patients with unmutated IGHV, 90% for patients with com-plex karyotype, and 79% for patients with del(17p). (Figure 2)
• Median progression-free survival (PFS) was not reached for TN patients and 52 months for patients with R/R disease, with five-year PFS rates of 92% and 43%, respectively. (Figure 3)
CRPRPR-L
R/R(n = 101)
TN(n = 31)
Total(n = 132)
Pati
ents
(%
)
0
20
40
60
80
100
+ = and up; CR = complete response; DOR = duration of response; NR = not reached; ORR = overall response rate; PR = partial response; PR-L = partial response with lymphocytosis; R/R = relapsed/refractory; TN = treatment naïve
55%
29%
3%
87%
76%
10%
3%
89%
3%
71%
14%
89%
Median DOR,months (range)
Median follow-up,months (range) 62 (1–67) 49 (1–67) 56 (1–67)
NR(0.0+ to 65.5+)
56.8(0.0+ to 65.5+)
NR(0.0+ to 65.5+)
Figure 1. ORR in all treated patients
86%
9%
3%
97%
77%
9%
4%
90%
7%
76%
7%
90%
65%
6%
79%
9%
CRPRPR-L
Unmutated IGHV (n = 79)
Del(11q)(n = 35)
Complexkaryotype (n = 41)
Pati
ents
(%
)
0
20
40
60
80
100
+ = and up; CR = complete response; del(11q) = deletion of 11q; del(17p) = deletion of 17p; DOR = duration of response; IGHV = immunoglobulin heavy chain variant; ORR = overall response rate; PR = partial response; PR-L = partial response with lymphocytosis; R/R = relapsed/refractory
Median DOR,months (range)
Median follow-up,months (range) 55 (1–67) 49 (1–67) 55 (1–67)
38.7(0.0+ to 65.3+)
53.2(0.0+ to 65.5+)
38.7(0.0+ to 65.5+)
Del(17p)(n = 34)
47 (1–67)
30.6(0.0+ to 65.3+)
Figure 2. ORR in patients with R/R disease and high-risk abnormalities
Table 1. Patients’ cytogenetic abnormalities and IGHV mutation
TN(n = 31)
R/R(n = 101)
Cytogenetic abnormalities, %
Del(17p) 6 34
Del(11q) 3 35
Trisomy 12 26 12
Del(13q) 55 47
Complex karyotype 13 37
Unmutated IGHV, % 48 78
Del(11q) = deletion of 11q; del(13q) = deletion of 13q; del(17p) = deletion of 17p; IGHV = immunoglobulin heavy chain variant; R/R = relapsed/refractory; TN = treatment naïve

38 New Evidence in Oncology | April 2017
• Median overall survival (OS) was not reached for all treated patients, with five-year OS rates of 92% for TN patients and 57% for patients with R/R disease.
• In patients with R/R disease, the median PFS was 63 months for patients with mutated IGHV and 43 months for patients with unmutated IGHV, with five-year PFS rates of 53% and 38%, respectively.
• The PFS outcomes sorted by chromosomal abnormalities in patients with R/R disease are shown in Figure 4.
There were two TN patients with chromosomal abnor-malities who showed progressive disease or death.
• Median PFS was 33 months for patients with complex karyotype and it was not reached for patients without complex karyotype.
The majority of patients (90%) with complex karyotype had R/R disease, with a median of 4 prior therapies.
• Median PFS was not reached for patients with no prior therapies, 63 months for those with 1–2 prior therapies, 59 months for those with 3 prior therapies, and 39 months for those with 4 prior therapies.
• Multivariate analysis identified del(17p) as a significant predictor of PFS and OS.
Safety
• Among all-treated patients, the onset of grade ≥3 treatment-emergent AEs was highest in the first year and decreased during subsequent years.
• With five years of follow-up, the most frequent grade ≥3 AEs were hypertension (26%), pneumonia (22%), neutropenia (17%), and atrial fibrillation (9%).
54484236302418126
Months from initiation of ibrutinib
PFS
(%)
0
TNR/R
0
20
40
60
80
100
NR = not reached; PFS = progression-free survival; R/R = relapsed/refractory; TN = treatment naïve
60 66 72
Median PFS, months 5-year PFS, %
TN NR 92
R/R 52 43
Figure 3. PFS in overall population
54484236302418126
Months from initiation of ibrutinib
PFS
(%)
0
Del(13q)No abnormalityTrisomy 12Del(11q)Del(17p)
0
20
40
60
80
100
Del(11q) = deletion of 11q; del(13q) = deletion of 13q; del(17p) = deletion of 17p; NR = not reached; PFS = progression-free survival; R/R = relapsed/refractory
* No del(17p), del(11q), del(13q), or trisomy 12; in hierarchical order of del(17p), then del(11q), etc.
60 66 72
Median PFS,months
5-year PFS,%
Del(17p) (n = 34) 26 19
Del(11q) (n = 28)
Trisomy 12 (n = 5)
No abnormality* (n = 16)
Del(13q) (n = 13)
55 33
NR 80
NR 91
NR 66
Figure 4. PFS outcomes by chromosomal abnormalities in patients with R/R disease
• At five years of follow-up, single-agent ibrutinib continues to show durable responses in patients with TN or R/R CLL/SLL, including those with del(17p), del(11q), or unmutated IGHV.
• Survival outcomes for patients with complex karyotype or del(17p) were less robust compared to those in the lower risk genetic groups.
• Ibrutinib was well tolerated, and the manageable safety profile allows for extended dosing.
Key conclusions
References: 1. O’Brien S, Furman RR, Coutre SE, et al. Ibrutinib as initial therapy for elderly patients with chronic lymphocytic leukaemia or small lym-phocytic lymphoma: an open-label, multicentre, phase 1b/2 trial. Lancet Oncol 2014;15:48–58. 2. Byrd JC, Furman RR, Coutre SE, et al. Targeting BTK with ibrutinib in relapsed chronic lymphocytic leukemia. N Engl J Med 2013;369:32–42. 3. O’Brien SM, Furman RR, Coutre SE, et al. Five-year experience with single-agent ibrutinib in patients with previously untreated and relapsed/refractory chronic lymphocytic leukemia/small lymphocytic leukemia. ASH Annual Meeting Abstracts 2016:233.

New Evidence in Oncology | April 2017 39
Background
The RESONATETM-2 trial had previously shown that ibrutinib significantly reduced the risk of progres-sion or death by 84% in older patients with chronic lymphocytic leukemia (CLL)/small lymphocytic lym-phoma (SLL).1 The current extension study provides updated efficacy and safety results of ibrutinib versus chlorambucil for RESONATETM-2.2
Study design
• RESONATETM-2 (PCYC-1115) was a randomized, phase III, open-label, multicentre, international study.
• Treatment-naïve patients with CLL/SLL who were 65 years of age or older were randomized 1:1 to receive ibrutinib or chlorambucil.
• Patients with deletion of 17p (del[17p]) were excluded.
• Primary endpoint was progression-free survival (PFS), as evaluated by the independent review com-mittee (as per the 2008 International Workshop on CLL criteria).
• Secondary endpoints included overall survival (OS), overall response rate (ORR), rate of hematologic improvement, and safety.
Key findings
• A total of 269 patients were enrolled in the study (n = 136 for the ibrutinib arm, n = 133 for the chlorambucil arm).
• Baseline characteristics were balanced between treatment arms:
The median age was 73 years, with 70% of patients aged over 70 years; and
Approximately 45% of patients had advanced Rai stage disease, 20% had deletion of 11q (del[11q]),
and 69% had comorbidities at baseline, including a Cumulative Illness Rating Scale (CIRS) score >6, reduced creatinine clearance, or an Eastern Cooperative Oncology Group (ECOG) performance status of 2.
• The median follow-up was 29 months.
• Median PFS was not reached in the ibrutinib arm compared to 15 months in the chlorambucil arm, demonstrating that there was an 88% reduction in the risk of progression or death for patients who received ibrutinib. (Figure 1)
• Subgroup analysis of PFS revealed that the effect of ibrutinib was preserved across all subgroups.
• There was a 99% reduction in the risk of progression or death for patients with del(11q) who received ibrutinib, and a 82% reduction in those without del(11q). (Figure 2)
• The two-year OS was estimated to be 95% and 84% in the ibrutinib and chlorambucil arms, respectively.
• The investigator-assessed ORR was 92% and 36% in the ibrutinib and chlorambucil arms, respectively.
• Overall, 4/135 patients discontinued ibrutinib due to progressive disease.
• One case of Richter’s transformation was observed in each arm.
• In the ibrutinib arm, grade ≥3 AEs occurring in ≥5% of patients included neutropenia (12%), pneumonia (7%), anemia (7%), and hypertension (5%).
AEs led to dose reductions in 13% of patients.
• Major hemorrhage occurred in 7% of patients and atrial fibrillation occurred in 10% of patients in the ibrutinib arm.
Updated efficacy and safety from the phase III RESONATETM-2 study: Ibrutinib as a first-line treatment option in patients 65 years and older with CLL/SLL
Barr PM, et al. ASH 2016:234
RANDOMIZE
1:1
CLL = chronic lymphocytic leukemia; del(17p) = deletion of 17p; ECOG PS = Eastern Cooperative Oncology Group performance status; FCR = fludarabine, cyclophosphamide, rituximab; IRC = independent review committee; PD = progressive disease; SLL = small lymphocytic lymphoma* Patients could enrol in separate Extension Study PCYC-1116 after IRC-confirmed PD or at study PCYC-1115 closure for continuing treatment and follow-up.
Patients (N = 269)• Treatment-naïve CLL/SLL with
active disease• Age ≥65 years• Comorbidity that may preclude
FCR (for patients aged 65–69 years)
• Excluded patients with del(17p)
Stratification factors• ECOG PS (0/1 vs. 2)• Rai stage (III/IV vs. ≤II)
Ibrutinib 420 mg once daily until PD
Chlorambucil 0.5 mg/kg (to maximum 0.8 mg/kg) on Days 1 and 15 of 28-day cycle for up to 12 cycles
PCYC-1116 Extension Study*
In chlorambucil arm, 55 patients crossed over to
ibrutinib following PD
CLL progression or closure of PCYC-1115
Study design

40 New Evidence in Oncology | April 2017
CI = confidence interval; HR = hazard ratio; NR = not reached; PFS = progression-free survival
27 302421181512963
Time (months)
PFS
(%)
0
ibrutinibchlorambucil
0
20
40
60
80
100
33 36
10
30
50
70
90
Ibrutinib Chlorambucil
Median PFS, months NR 15
24-month PFS, % 89 34
HR (95% CI) 0.121 (0.074–0.198)
p-value <0.0001
CI = confidence interval; del(11q) = deletion of 11q; HR = hazard ratio; PFS = progression-free survival
27 302421181512963
Time (months)
PFS
(%)
00
20
40
60
80
100
chlorambucil, del(11q)chlorambucil, no del(11q)
ibrutinib, del(11q)ibrutinib, no del(11q)
33 36
10
30
50
70
90
Del(11q) No del(11q)
Ibrutinib Chlorambucil Ibrutinib Chlorambucil
24-month PFS, % 97 17 86 40
HR (95% CI) 0.014 (0.002–0.108) 0.180 (0.106–0.303)
p-value <0.0001 <0.0001
Figure 1. PFS of ibrutinib vs. chlorambucil
Figure 2. PFS in patients with del(11q)
• Ibrutinib continued to have substantial efficacy compared to chlorambucil in elderly patients with CLL/SLL.
Key conclusion
References: 1. Burger JA, Tedeschi A, Barr PM, et al. Ibrutinib as initial therapy for patients with chronic lymphocytic leukemia. N Engl J Med 2015;373:2425–37. 2. Barr PM, Robak T, Owen CJ, et al. Updated efficacy and safety from the phase 3 RESONATE-2 study: Ibrutinib as first-line treatment option in patients 65 years and older with chronic lymphocytic leukemia/small lymphocytic leukemia. ASH Annual Meeting Abstracts 2016:234.

New Evidence in Oncology | April 2017 41
Abstracts #233 and #234 presented at ASH 2016 are best appreciated together. Both address the long-term outcomes using ibrutinib for chronic lymphocytic leukemia (CLL)/ small lymphocytic lymphoma (SLL). In the first abstract, Dr. Susan O'Brien describes the long-term follow-up of patients treated with ibrutinib. In the second abstract, Dr. Paul Barr describes the outcome on the experimental arm of RESONATETM-2 where patients received ibrutinib. Results are largely consistent across both studies; ibruti-nib has been proven to be a remarkably effective and well tolerated treatment. The responses to the treatment have also proven durable, with the two studies showing a 5-year progression-free survival (PFS) of 92% (O'Brien) and a 2-year PFS of 89% (Barr), respectively. Both studies used daily oral ibrutinib and patients tolerated it very well, with very modest levels of grade 3/4 toxicities.
Finally, oral ibrutinib was able to overcome the adverse
effect associated with major prognostic factors. Patients with
11q deletion and patients with unmutated Immunoglobulin
Heavy Chain Variable gene responded equally well compared
to those without these adverse factors, an achievement never
seen with a well-tolerated agent for CLL in the past.
The B-cell response pathway inhibitors, led by the first
widely-tested agent, ibrutinib, are transforming the man-
agement of CLL. The updates of these two experiences
verify that this agent is remarkably effective, well tolerated
even over years of administration, and able to overcome
previously resistant types of CLL in the majority of patients.
Keep your eye on them!
Dr. Paul Barr presented updated results of RESONATETM-2, a large phase III trial that randomized elderly treatment-naïve patients with chronic lymphocytic leukemia (CLL)/small lymphocytic lymphoma (SLL), with few comorbidities, to receive ibrutinib or chlorambucil. Preliminary results pub-lished in 2015 (Burger et al., N Engl J Med 2015;373:2425) demonstrated a substantial advantage in both progression-free survival (PFS) and overall survival (OS) in the ibrutinib arm. With extended median follow-up from 18 to 29 months, PFS remained significantly superior for the ibrutinib arm (89% vs. 34% at 24 months). OS was also superior in the ibrutinib arm despite a crossover rate of 41%.
This study confirms an unquestionable advantage of single-agent ibrutinib over chlorambucil in the treatment-naïve
setting, lending credence to a chemotherapy-free approach
in CLL/SLL and expanding valuable data on ibrutinib in
treatment-naïve patients. However, the comparator arm of
chlorambucil is no longer relevant because a survival advan-
tage, by combining it with anti-CD20 antibody obinutuzumab
in elderly patients with comorbidities, has been previously
shown (Goede et al., N Engl J Med 2014;370:1101). Further-
more, the cost and duration of therapy is substantially greater
for ibrutinib, which is particularly relevant in publicly-funded
jurisdictions. For these reasons, caution should be exercised
before widely adopting front-line ibrutinib in elderly
patients with CLL until definitive evidence of its superiority to
chemoimmunotherapy emerges.
Dr. Joseph Connors: Insights on Ibrutinib Treatment for Patients with CLL/SLL
Dr. Anthea Peters: Commentary on Updated Efficacy and Safety from the RESONATETM-2 Study

42 New Evidence in Oncology | April 2017
Background
At the 2016 ASH Meeting, Coutre and colleagues
reported results from the integrated and long-
term safety analysis of ibrutinib in patients with
treatment-naïve (TN) or relapsed/refractory (R/R)
chronic lymphocytic leukemia (CLL)/small lym-
phocytic lymphoma (SLL).1
Study design
• In this integrated safety analysis, data from the
ibrutinib-treated patients from the RESONATETM and
RESONATETM-2 trials were pooled.
RESONATETM study:
– Patients were randomized to receive ibrutinib
or ofatumumab.
– The inclusion criteria were CLL/SLL diagnosis,
≥1 prior therapy, and ineligibility for treatment
or retreatment with purine analogs.
– In the ofatumumab arm, 132 patients crossed over
to ibrutinib following progressive disease (PD).
RESONATETM-2 study:
– Patients were randomized to receive ibrutinib or chlorambucil.
– The inclusion criteria were TN CLL/SLL, age ≥65 years, and comorbidity that precludes fludarabine, cyclophosphamide, and rituximab for patients with age 65–69 years.
– Patients with deletion of 17p were excluded.
– In the extension study (PCYC-1116), 55 patients in the chlorambucil arm crossed over to ibrutinib.
• Long-term safety data from the phase Ib/II PCYC-1102 study were also examined.
Patients could continue receiving ibrutinib in the long-term extension study PCYC-1103, where adverse event (AE) collection was limited to grade ≥3 AEs, major hemorrhage, or AEs leading to dose modification.
Only data from patients treated with 420 mg/day ibrutinib were examined.
Integrated and long-term safety analysis of ibrutinib in patients with CLL/SLL
Coutre S, et al. ASH 2016:4383
RANDOMIZE
RANDOMIZE
Oral ibrutinib (420 mg once daily) until PD or unacceptable toxicity
n = 195
Ofatumumab iv (initial dose of 300 mg followed by
2,000 mg x 11 doses) over 24 weeksn = 196
In ofatumumab arm, 132 patients crossed over to ibrutinib following PD
IRC = independent review committee; iv = intravenous; PD = progressive disease
Ibrutinib 420 mg once daily until PD or unacceptable toxicity
n = 136IRC-
confirmed progression
Chlorambucil 0.5 mg/kg (to maximum 0.8 mg/kg) on Days 1 and 15 of 28-day cycle for up to 12 cycles
n = 133
PCYC-1116 Extension Study
In chlorambucil arm, 55 patients crossed
over to ibrutinib
RESONATETM study
RESONATETM-2 study
1:1
Study design
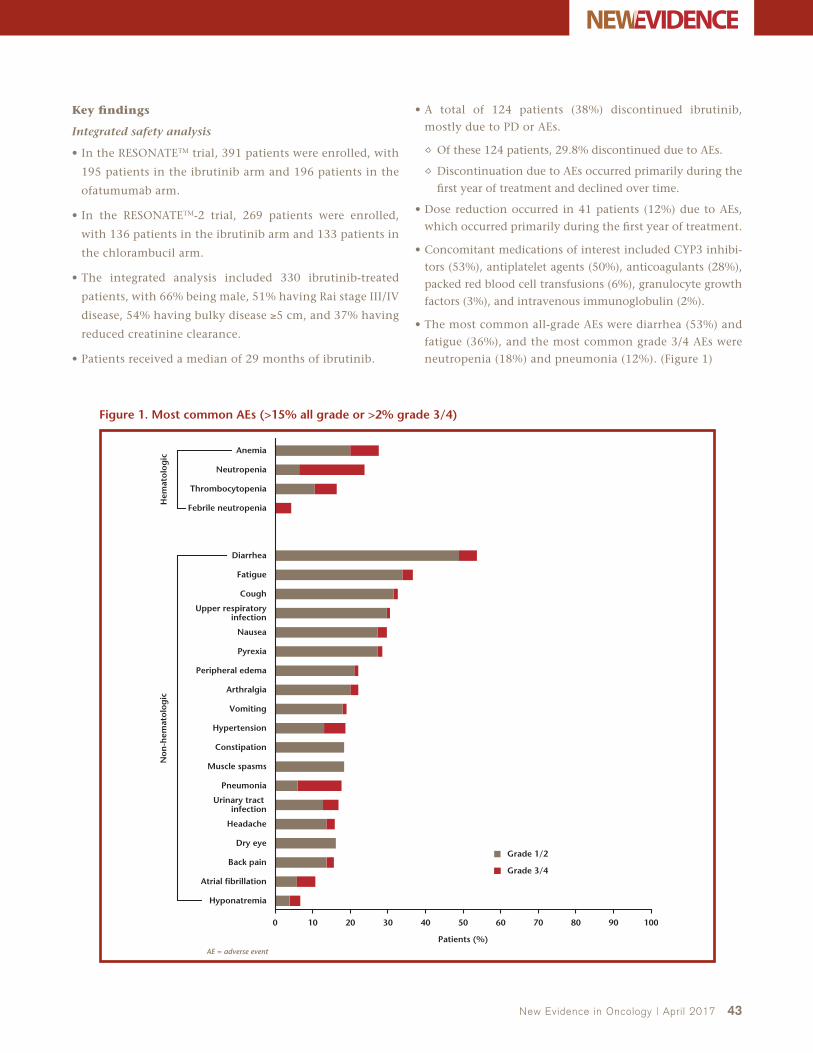
New Evidence in Oncology | April 2017 43
Key findings
Integrated safety analysis
• In the RESONATETM trial, 391 patients were enrolled, with
195 patients in the ibrutinib arm and 196 patients in the
ofatumumab arm.
• In the RESONATETM-2 trial, 269 patients were enrolled,
with 136 patients in the ibrutinib arm and 133 patients in
the chlorambucil arm.
• The integrated analysis included 330 ibrutinib-treated
patients, with 66% being male, 51% having Rai stage III/IV
disease, 54% having bulky disease ≥5 cm, and 37% having
reduced creatinine clearance.
• Patients received a median of 29 months of ibrutinib.
• A total of 124 patients (38%) discontinued ibrutinib,
mostly due to PD or AEs.
Of these 124 patients, 29.8% discontinued due to AEs.
Discontinuation due to AEs occurred primarily during the
first year of treatment and declined over time.
• Dose reduction occurred in 41 patients (12%) due to AEs,
which occurred primarily during the first year of treatment.
• Concomitant medications of interest included CYP3 inhibi-
tors (53%), antiplatelet agents (50%), anticoagulants (28%),
packed red blood cell transfusions (6%), granulocyte growth
factors (3%), and intravenous immunoglobulin (2%).
• The most common all-grade AEs were diarrhea (53%) and
fatigue (36%), and the most common grade 3/4 AEs were
neutropenia (18%) and pneumonia (12%). (Figure 1)
100 20 30 40 50 60 70 80 90 100
Grade 1/2
Grade 3/4
Patients (%)
Dry eye
Muscle spasms
Constipation
Pneumonia
Headache
Back pain
Hyponatremia
Hypertension
Atrial fibrillation
Urinary tract infection
Pyrexia
Fatigue
Diarrhea
Cough
Nausea
Peripheral edema
Vomiting
Arthralgia
Anemia
Neutropenia
Febrile neutropenia
Thrombocytopenia
Hem
atol
ogic
Non
-hem
atol
ogic
Upper respiratory infection
AE = adverse event
Figure 1. Most common AEs (>15% all grade or >2% grade 3/4)

44 New Evidence in Oncology | April 2017
• A total of 29 patients (9%) died, most commonly due to
PD and pneumonia/lung infection.
• Select AEs of clinical relevance (diarrhea, arthralgia,
hypertension, rash, bleeding/bruising, fatigue, and atrial
fibrillation) were primarily grade 1/2 and infrequently led
to ibrutinib dose adjustments or discontinuation.
Most AEs were resolved in most patients, with the excep-
tion of hypertension.
Hypertension and arthralgia were frequently managed
with concomitant medications.
Atrial fibrillation was resolved in over half of the patients,
and was often short lived (median duration of 3 days).
• Rates of diarrhea, fatigue, grade ≥3 infections, and rash
were highest during the first year of treatment.
• Prevalence of hypertension increased over time, with most
events ongoing or recurrent after 12 months.
• Prevalence of atrial fibrillation was similar across time periods,
with many events ongoing or recurrent after 12 months.
Long-term safety analysis of PCYC-1102/1103
• The median follow-up was 47.9 months (range: 0.3–67.4).
• The most frequent grade 3/4 AEs were similar to those reported in the integrated analysis, with hypertension as the most commonly reported AE (30%). (Table 1)
Given the approximately additional 19 months of median treatment, prevalence of some AEs was increased compared to the integrated analysis.
• The most frequent malignancies of other types included basal cell carcinoma, squamous cell carcinoma, and myelodysplastic syndromes; malignancy was diagnosed in 7 of 15 patients during the first year.
• Kaplan-Meier analysis showed that:
For TN patients, overall survival (OS) was 95% at 2 years in the RESONATETM-2 study and 91% at 5 years in the PCYC-1102/1103 studies.
For patients with R/R disease, OS was 74% at 3 years in the RESONATETM study and 62% at 5 years in the PCYC-1102/1103 studies.
• The integrated and long-term analyses showed that AEs were primarily grade 1/2 and manageable, allowing the majority of older patients to have prolonged treatment with ibrutinib.
Key conclusion
Reference: 1. Coutre S, Byrd JC, Hillmen P, et al. Integrated and long-term safety analysis of ibrutinib in patients with chronic lymphocytic leukemia (CLL)/small lymphocytic lymphoma (SLL). ASH Annual Meeting Abstracts 2016:4383.
Table 1. Most common grade 3/4 (>3%) AEs in PCYC-1102/1103 studies
Ibrutinib (N = 94)n (%)
Hematologic AEs
Neutropenia 14 (15)
Thrombocytopenia 7 (7)
Decreased lymphocyte count 6 (6)
Increased lymphocyte count 4 (4)
Leukocytosis 3 (3)
Decreased neutrophil count 3 (3)
Non-hematologic AEs
Hypertension 28 (30)
Pneumonia 16 (17)
Atrial fibrillation 10 (11)
Diarrhea 8 (9)
Cellulitis 7 (7)
Hyperglycemia 7 (7)
Fatigue 6 (6)
Sepsis 5 (5)
Acute kidney injury 4 (4)
Dehydration 4 (4)
Hypokalemia 4 (4)
Syncope 4 (4)
AE = adverse event

• The integrated and long-term analyses showed that AEs were primarily grade 1/2 and manageable, allowing the majority of older patients to have prolonged treatment with ibrutinib.
MAKE TREANDA A PART OF YOUR TREATMENT PLAN FOR CLL AND RELAPSED iNHL
lundbeck.com/ca
Pr
© 2016 Lundbeck Canada Inc.® Treanda is a registered trademark.
TREANDA is indicated for treatment of patients with relapsed indolent B-cell non-Hodgkin lymphoma (NHL) who did not respond to or progressed during or shortly following treatment with a rituximab regimen and for the treatment of patients with symptomatic chronic lymphocytic leukemia (CLL) who have received no prior treatment.
Please consult the product monograph at http://www.lundbeck.com/upload/ca/en/files/pdf/pm/Treanda.pdf for important information about:
• Contraindication in patients hypersensitive to mannitol
• The most serious warnings and precautions regarding myelosuppression, infections (including fatalities), second malignancies and serious infections
• Other relevant warnings and precautions regarding patients with poor tolerance to prior NHL therapies; extravasation; cardiac disorders; ECG changes; hypertension; tumor lysis syndrome; increase in liver enzymes and bilirubin; use of live-attenuated vaccines; reactivation of infections; infusion reactions and anaphylaxis; reproductive capacity; skin reactions; recommendation during pregnancy or breast-feeding; women and men of childbearing potential; use with renal impairment; use in hepatic impairment; monitor/test for complete blood counts (CBC), renal (creatinine) and liver (AST, ALT, bilirubin and ALP) function, electrolytes, blood pressure and hepatitis B prior to treatment; monitor/test for CBC, electrolytes, signs of infection, ECG in patients with cardiac disorders, particularly if electrolyte imbalances, renal function, liver function and blood sugar during treatment
• Conditions of clinical use, adverse reactions, drug interactions and dosing instructions
The product monograph is also available by calling us at 514-844-8515 or 1-800-586-2325.
* Since international launch in 1971 to January 6, 2016, the cumulative exposure from marketing experience is estimated to be 297,494 patients.† Clinical significance is unknown.Reference: 1. Data on file. Lundbeck Canada Inc.
A N E S T I M AT E D
297,000PATIENTS HAVE BEEN EXPOSEDTO BENDAMUSTINEW O R L D W I D E1*†

46 New Evidence in Oncology | April 2017
Acute Leukemias
Current Insights and Challenges in the Treatment of APL and ALL
The standard of care for acute promyelocytic leuke-mia (APL) has traditionally been all-trans retinoic acid (ATRA) and chemotherapy; however, newer regimens are showing improved outcomes. One recent addition to APL treatment is arsenic trioxide (ATO), which has demonstrated efficacy as a single agent in the treat-ment of acute promyelocytic leukemia (APL).1,2 In North America, ATO is indicated for induction of remission and consolidation in patients with APL characterized by the PML/RARα (promyelocytic leuke-mia/retinoic acid receptor alpha) gene translocation t(15;17), who are refractory to or have relapsed from retinoid and anthracycline therapy.3,4
In low-risk patients (white blood cell count [WBC] <10 x 109/L), a daily schedule of all-trans retinoic acid (ATRA) plus ATO led to improved event-free and overall survival (OS) when compared with ATRA plus idarubicin (AIDA).5 These results indicated that ATRA plus ATO was at least as efficacious as chemotherapy-containing protocols.
However, APL presents a therapeutic challenge in high-risk patients (WBC >10 x 109/L), with signifi-cantly greater early mortality rates and higher risk of relapse when compared with low-risk patients.6 Cluster of differentiation 33 (CD33) is a therapeutic target in APL and is highly expressed in leukemic blast cells. Gemtuzumab ozogamicin (GO), an anti-CD33 antibody, has demonstrated efficacy in monotherapy for patients with molecularly relapsed APL.1,7 The combination of ATO, ATRA, and GO was efficacious as first-line therapy in high-risk patients with APL.8 Studies are ongoing to confirm the role of ATO in this treatment regimen.
Acute lymphoblastic leukemia (ALL), a common type of cancer in children, has seen remarkable progress in treatment over the past few decades.9 Once consid-ered fatal, it is now a cancer with a cure rate of almost
90%. This is in part due to optimal use of antileuke-mic agents, improved supportive care, and precise risk assessment.10
L-asparaginase is an important component of ALL treatment. A pegylated form of L-asparaginase, called pegaspargase (SS-PEG), is commonly used in frontline therapy.10 Calaspargase pegol (SC-PEG) is a novel form of L-asparaginase. It has a longer half-life than SS-PEG because it possesses a different linker molecule, ren-dering it more hydrolytically stable.11 The longevity of L-asparaginase in the human body is of special importance, given that antibodies to either form of it have been associated with its rapid clearance. Studies are ongoing to determine the more effective form of L-asparaginase in the treatment of ALL.
Here we report the results of six studies that investi-gated these agents, presented at the 2016 American Society of Hematology (ASH) Annual Meeting:
• In a randomized study, APL2006, the addition of ATO to and the removal of cytarabine from chemo-therapy reduced myelosuppression in patients with high-risk APL. (Ades L, et al. ASH 2016:895)
• Final results from a randomized trial showed that the combination of ATRA, ATO, and GO is safe and highly effective in patients with previously untreat-ed high-risk APL. (Lancet JE, et al. ASH 2016:896)
• A prospective multicentre trial demonstrated that using a simplified treatment algorithm and expert support can lead to a reduction of early deaths and improved survival in elderly patients with APL. (Kota V, et al. ASH 2016:1622)
• Updated results of the prospective German inter-group Napoleon registry provided further evidence for the efficacy and safety of ATRA plus ATO in low- and intermediate-risk APL. (Platzbecker U, et al. ASH 2016:2815)

New Evidence in Oncology | April 2017 47
References: 1. Burnett AK, Russell N, Hills R, et al. APL of all risk groups is highly curable with a chemo-free combination of attenuated arsenic trioxide and ATRA. EHA Congress Abstracts 2015:LB2067. 2. Breccia M, Lo-Coco F. Arsenic trioxide for management of acute promyelocytic leukemia: current evidence on its role in front-line therapy and recurrent disease. Expert Opin Pharmacother 2012;13:1031–43. 3. Lundbeck Canada Inc. PrTrisenox® (arsenic trioxide) Product Monograph. June 6, 2013. 4. National Comprehensive Cancer Network (NCCN). NCCN Guidelines v2: Acute Myeloid Leukemia. 2016. 5. Lo-Coco F, Avvisati G, Vignetti M, et al. Retinoic acid and arsenic trioxide for acute promyelocytic leukemia. N Engl J Med 2013;369:111–21. 6. Lancet JE, Othus M, DeAngelo DJ, et al. Safety and tolerability of the combination of ATRA + arsenic trioxide (ATO) + gemtuzumab ozogamicin (GO) in high-risk acute promyelocytic leukemia (APL): Initial report of the SWOG/Alliance/ECOG S0535 trial. J Clin Oncol (ASCO Annual Meeting) 2015;33 (Suppl):abstr 7016. 7. Lo-Coco F, Cimino G, Breccia M, et al. Gemtuzumab ozogamicin (Mylotarg) as a single agent for molecularly relapsed acute promyelocytic leukemia. Blood 2004;104:1995–9. 8. Ravandi F, Estey E, Jones D, et al. Effective treatment of acute promyelocytic leukemia with all-trans-retinoic acid, arsenic triox-ide, and gemtuzumab ozogamicin. J Clin Oncol 2009;27:504–10. 9. Pui CH, Evans WE. A 50-year journey to cure childhood acute lymphoblastic leukemia. Semin Hematol;50:185–96. 10. Dinndorf PA, Gootenberg J, Cohen MH, et al. FDA drug approval summary: pegaspargase (oncaspar) for the first-line treat-ment of children with acute lymphoblastic leukemia (ALL). Oncologist 2007;12:991–8. 11. Angiolillo AL, Schore RJ, Devidas M, et al. Pharmacokinetic and pharmacodynamic properties of calaspargase pegol Escherichia coli L-asparaginase in the treatment of patients with acute lymphoblastic leukemia: results from Children’s Oncology Group Study AALL07P4. J Clin Oncol 2014;32:3874–83.
• A randomized study found that a single dose of SC-PEG during induction led to a more sustained therapeutic effect when com-pared with SS-PEG in pediatric patients with newly diagnosed ALL or lymphoblastic lymphoma. (Silverman LB, et al. ASH 2016:175)
• Preliminary analysis from COG AALL07P4 showed that patients with ALL receiving SC-PEG have numerically less antibody formation and anaphylactic or hypersensitivity reactions than patients receiving SS-PEG. (Schore RJ, et al. ASH 2016:3965)
Background
While acute promyelocytic leukemia (APL) is pre-
dominantly associated with low white blood cell count
(WBC), 25% of cases have a WBC of >10 x 109/L and
a higher rate of relapse (considered high-risk APL). In
patients with high-risk APL, it is still unclear if chemo-
therapy can be avoided or greatly reduced. However,
the addition of arsenic trioxide (ATO) to all-trans reti-
noic acid (ATRA) plus chemotherapy reduces relapses
in patients.1 Ades and colleagues evaluated the addi-
tion of ATO to chemotherapy during consolidation in
a randomized trial (APL2006) in high-risk patients with
APL, who received ATRA plus chemotherapy during
induction. The findings were presented at ASH 2016.2
Study design
• Newly diagnosed patients with high-risk APL, who
had received induction of ATRA with idarubicin and
cytarabine until complete remission (CR), were ran-
domized for consolidation between chemotherapy
and chemotherapy plus ATO.
• After a first interim analysis in September 2010 of 81 patients, cytarabine was removed from the consoli-dation cycles of the chemotherapy plus ATO group.
• The inclusion criteria were: Newly diagnosed patients with APL (subsequent-ly confirmed by conventional cytogenetics and/or presence of promyelocytic leukemia/retinoic acid receptor alpha transcript);
Aged <70 years;
WBC count of >10 x 109/L; and
No contraindication to induction and consolida-tion chemotherapy or ATO.
• The primary endpoint was event-free survival (EFS) from the time of CR achievement.
Key findings
Baseline characteristics and disposition
• Analysis was conducted on a total of 219 patients over 48 centres.
A total of 193 patients were randomized for con-solidation, 97 in the chemotherapy arm and 96 in the chemotherapy plus ATO arm.
Analysis of the randomized trial, APL2006, on whether arsenic trioxide is required in the treatment of high-risk, newly diagnosed APL
Ades L, et al. ASH 2016:895

48 New Evidence in Oncology | April 2017
• The median follow-up was 55 months.
• The median age was 39.2 years (range: 29.6–54.2) in the chemotherapy arm and 45.0 years (range: 34.2–58.9) in the chemotherapy plus ATO arm.
• The median WBC was 23.7 x 10⁹/L (range: 14.9–40.5) in the chemotherapy arm and 19.7 x 10⁹/L (range: 13.0–33.9) in the chemotherapy plus ATO arm.
• Pre-treatment characteristics were well balanced between the two groups.
Seven patients (three in the chemotherapy arm and four in the chemotherapy plus ATO arm) had relapsed.
The 2-year cumulative incidence of relapse (CIR) was 3.7% vs. 3.9% for the chemotherapy arm and chemotherapy plus ATO arm, respectively (p = 0.69).
Nine patients had died in CR: seven (7.8%) in the chemotherapy arm and two (5.1%) in the chemotherapy including cytarabine and ATO arm.
• The 5-year CIR was 3.7% for the chemotherapy arm, 5.3% for the chemotherapy plus cytarabine and ATO arm, and 3.3% for the chemotherapy plus ATO without cytarabine arm (p = 0.62).
Efficacy
• Prior to consolidation, 95.7% of patients achieved CR and 1% had resistant leukemia.
• The 2-year EFS rate was 93.0% in the chemotherapy arm and 94.5% in the chemotherapy plus ATO arm (p = 0.63). (Figure 1)
• The 2-year overall survival rate was 95.0% in the chemo-therapy arm and 96.0% in the chemotherapy plus ATO arm (p = 0.77). (Figure 2)
Safety
• Median days with antibiotics, median number of red blood cell transfusions, median time to absolute neutrophil count >1 x 10⁹/L, and median time to platelet count >50 x 109/L were all significantly improved in the chemotherapy plus ATO arm after September 2010 vs. prior to September 2010. (Table 1)
Consolidation 1Idarubicin 12 mg/m2 x 3
Cytarabine 200 mg/m2 x 7
Consolidation 2
Maintenance
Induction
R
Chemotherapy Arm
Idarubicin 12 mg/m2 x 3Cytarabine 200 mg/m2 x 7
ATRA until CR
ATO = arsenic trioxide; ATRA = all-trans retinoic acid; CR = complete response; MTX = methotrexate; R = randomization
Idarubicin 9 mg/m2 x 3Cytarabine 1 g/m2 x 8
Two-year maintenance with intermittent ATRA and continuous MTX and mercaptopurine
Idarubicin 12 mg/m2 x 3Cytarabine 200 mg/m2 x 7
ATO 25 days
Chemotherapy + ATO Arm
Idarubicin 9 mg/m2 x 3Cytarabine 1 g/m2 x 8
ATO 25 days
Study design

New Evidence in Oncology | April 2017 49
9684726048362412
Time (months)
Even
t-fr
ee s
urvi
val
0
1021314561758697
1121324561778696
0.0
0.2
0.4
0.6
0.8
1.0
ATO = arsenic trioxide; CI = confidence interval; EFS = event-free survival
Chemotherapy armChemotherapy + ATO arm
Chemotherapy Arm
Chemotherapy + ATO Arm
p-value
Number of events
10 8
Two-year EFS, % (95% CI)
93.0 (87.8–98.6)
94.5(90.0–99.3)
0.63
Chemotherapy arm
Chemotherapy + ATO arm
9684726048362412
Time (months)
Ove
rall
surv
ival
0
10 21 32 46 63 76 86 97
12 22 32 45 62 78 86 96
0.0
0.2
0.4
0.6
0.8
1.0
ATO = arsenic trioxide; CI = confidence interval; OS = overall survival
Chemotherapy armChemotherapy + ATO arm
Chemotherapy Arm
Chemotherapy + ATO Arm
p-value
Number of deaths
7 6
Two-year OS, % (95% CI)
95.0 (91.0–99.9)
96.0(91.7–99.9)
0.77
Chemotherapy arm
Chemotherapy + ATO arm
Figure 1. Event-free survival
Figure 2. Overall Survival

50 New Evidence in Oncology | April 2017
• The addition of ATO to the ATRA plus chemotherapy regimen did not reduce the number of relapses, but added some myelosuppression.
• If ATO was added and cytarabine was omitted from consolidation cycles, relapses were not increased, while myelosuppression and deaths in CR were reduced.
• Therefore, ATO appears to be useful in patients with high-risk APL.
Key conclusions
References: 1. Powell BL, Moser B, Stock W, et al. Arsenic trioxide improves event-free and overall survival for adults with acute promyelocytic leukemia: North American Leukemia Intergroup Study C9710. Blood 2010;116:3751–7. 2. Ades L, Raffoux E, Spertini O, et al. Is arsenic trioxide (ATO) required in the treatment of high-risk newly diagnosed APL? Analysis of a randomized trial (APL2006) by the French Belgian Swiss APL Group. ASH Annual Meeting Abstracts 2016:895.
Background
Cluster of differentiation 33 (CD33) is highly expressed in acute promyelocytic leukemia (APL), representing a viable therapeutic target in the disease. Gemtuzumab ozogamicin (GO) (anti-CD33 plus calicheamicin) has demonstrated single-agent activity in APL.1 The efficacy of combined arsenic trioxide (ATO), all-trans retinoic acid (ATRA), and GO in a subset of high-risk APL has been shown.2 Final results from a trial combining the three agents in patients with untreated high-risk APL were presented at ASH 2016.3
Study design
• ATRA, ATO, and GO were given as induction until complete remission (CR).
• Consolidation 1 and 2 consisted of ATO, consolida-tion 3 and 4 consisted of daunorubicin and ATRA, and consolidation 5 and 6 consisted of GO.
• One-year maintenance was done with ATRA, mercaptopurine, and methotrexate.
• The primary objectives of the trial were three-year continuous CR rate and six-week mortality rate.
ATRA, ATO, and gemtuzumab ozogamicin are safe and highly effective in patients with previously untreated high-risk APL: Final results from the SWOG/Alliance/ECOG S0535 trial
Lancet JE, et al. ASH 2016:896
Table 1. Hematological toxicities
MedianChemotherapy
ArmChemotherapy + ATO Arm (before September 2010)
Chemotherapy + ATO Arm (after September 2010)
Days with antibiotics 1st Consolidation 2nd Consolidation
15.010.0
18.014.5
10.0*10.0*
RBC transfusion 1st Consolidation 2nd Consolidation
4.04.0
4.04.0
2*
1.0*
Time to ANC >1 x 10⁹/L
22 25 19*
Time to platelet >50 x 109/L
24 26 20*
ANC = absolute neutrophil count; ATO = arsenic trioxide; RBC = red blood cell
* p <0.001 vs. chemotherapy + ATO before September 2010.
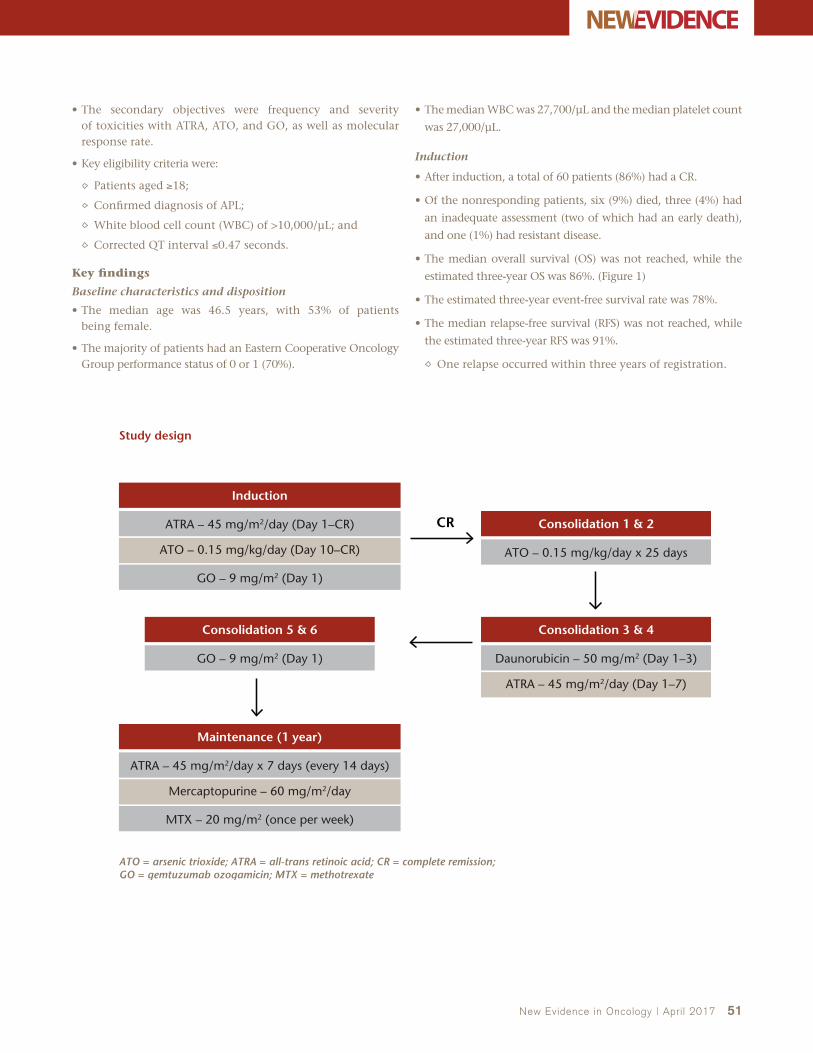
New Evidence in Oncology | April 2017 51
• The secondary objectives were frequency and severity of toxicities with ATRA, ATO, and GO, as well as molecular response rate.
• Key eligibility criteria were:
Patients aged ≥18;
Confirmed diagnosis of APL;
White blood cell count (WBC) of >10,000/μL; and
Corrected QT interval ≤0.47 seconds.
Key findings
Baseline characteristics and disposition
• The median age was 46.5 years, with 53% of patients being female.
• The majority of patients had an Eastern Cooperative Oncology Group performance status of 0 or 1 (70%).
• The median WBC was 27,700/μL and the median platelet count
was 27,000/μL.
Induction
• After induction, a total of 60 patients (86%) had a CR.
• Of the nonresponding patients, six (9%) died, three (4%) had
an inadequate assessment (two of which had an early death),
and one (1%) had resistant disease.
• The median overall survival (OS) was not reached, while the
estimated three-year OS was 86%. (Figure 1)
• The estimated three-year event-free survival rate was 78%.
• The median relapse-free survival (RFS) was not reached, while
the estimated three-year RFS was 91%.
One relapse occurred within three years of registration.
CR
ATO = arsenic trioxide; ATRA = all-trans retinoic acid; CR = complete remission; GO = gemtuzumab ozogamicin; MTX = methotrexate
Induction
ATRA – 45 mg/m2/day (Day 1–CR)
ATO – 0.15 mg/kg/day (Day 10–CR)
ATRA – 45 mg/m2/day (Day 1–7)
GO – 9 mg/m2 (Day 1)
Maintenance (1 year)
ATRA – 45 mg/m2/day x 7 days (every 14 days)
Mercaptopurine – 60 mg/m2/day
MTX – 20 mg/m2 (once per week)
Consolidation 1 & 2
ATO – 0.15 mg/kg/day x 25 days
Consolidation 3 & 4
Daunorubicin – 50 mg/m2 (Day 1–3)
Consolidation 5 & 6
GO – 9 mg/m2 (Day 1)
Study design

52 New Evidence in Oncology | April 2017
Postinduction
• Sixty-two patients registered for consolidation.
Three patients were ineligible, five withdrew voluntarily, three experienced adverse events (AEs), and two were not registered due to other reasons.
• Forty-nine patients completed consolidation as planned.
• Forty-eight patients registered for maintenance.
Two patients were ineligible, two withdrew voluntarily, four experienced AEs, one died, and two were not registered due to other reasons.
• Thirty-seven patients completed maintenance as planned.
Safety
• The most common grade 3–5 AE after induction was febrile neutropenia (34%). (Table 1)
Eight patients died within six weeks: four due to hemor-rhage, two due to sepsis or infection, one due to hepatic failure, and one due to other reasons.
• The most common grade 3–5 AEs after consolidation were febrile neutropenia (53%), fatigue (14%), and headache (14%). (Table 2)
• The grade 3–5 AEs experienced in ≥5% of patients during maintenance were nausea (11%), headache (11%), elevated alanine aminotransferase (11%), fatigue (9%), and elevated bilirubin (9%).
• During induction therapy, five patients (7%) experienced retinoic acid syndrome of Common Terminology Criteria for Adverse Events (CTCAE) grade 1/2, while one patient (1%) experienced retinoic acid syndrome of CTCAE grade 3/4.
7654321
Years after registration
Estimated 3-year OS = 86%
At risk70
Deaths11
Median in yearsNR
Ove
rall
surv
ival
(%
)
00
20
40
60
80
100
NR = not reached; OS = overall survival
Figure 1. Overall Survival Table 1. Induction grade 3–5 AEs in ≥5% of patients (n = 70)
Event n (%)
Febrile neutropenia 24 (34)
AST elevation 8 (11)
ALT elevation 8 (11)
Hyperglycemia 8 (11)
Hypoxia 8 (11)
Headache 7 (10)
QTc prolonged 8 (11)
Dyspnea 6 (9)
Hypertension 6 (9)
Hypokalemia 5 (7)
Fatigue 4 (6)
Hypophosphatemia 4 (6)
AE = adverse event; ALT = alanine aminotransferase; AST = aspartate aminotransferase; QTc = corrected QT interval
Table 2. Consolidation grade 3–5 AEs in ≥5% of patients (n = 59)
Event n (%)
Febrile neutropenia 31 (53)
Fatigue 8 (14)
Headache 8 (14)
Nausea 7 (12)
AST elevation 5 (8)
Catheter-related infection 5 (8)
Blood infection 4 (7)
Abdominal pain 4 (7)
Anorexia 4 (7)
ALT elevation 4 (7)
Hypokalemia 4 (7)
Vomiting 4 (7)
Lung infection 4 (7)
Muscle weakness 3 (5)
Dyspnea 3 (5)
Back pain 3 (5)
QTc prolonged 3 (5)
AE = adverse event; ALT = alanine aminotransferase; AST = aspartate aminotransferase; QTc = corrected QT interval

New Evidence in Oncology | April 2017 53
• This was the largest reported experience of ATO, ATRA, and GO combination therapy in high-risk APL.
– The treatment led to durable responses, low rates of early mortality, and compared favourably with chemotherapy-based induction regimens.
• The ATO, ATRA, and GO combination regimen should be considered as a therapeutic option for patients with high-risk APL in the future.
• Results on molecular response are pending and will be evaluated for effect on outcomes.
• High failure rate of completion of all planned therapy raises questions about the benefit of extended consolidation and maintenance.
Key conclusions
References: 1. Lo-Coco F, Cimino G, Breccia M, et al. Gemtuzumab ozogamicin (Mylotarg) as a single agent for molecularly relapsed acute promyelocytic leukemia. Blood. 2004;104:1995–9. 2. Ravandi F, Estey E, Jones D, et al. Effective treatment of acute promyelocytic leukemia with all-trans-retinoic acid, arsenic trioxide, and gemtuzumab ozogamicin. J Clin Oncol. 2009;27:504–10. 3. Lancet JE, Moseley A, Komrokji R, et al. ATRA, arsenic trioxide (ATO), and gemtuzumab ozogamicin (GO) is safe and highly effective in patients with previously untreated high-risk acute promyelocytic leukemia (APL): final results of the SWOG/Alliance/ECOG S0535 trial. ASH Annual Meeting Abstracts 2016:896.
Background
In large multicentre trials, induction mortality occurs
in only 5%–10% of patients with acute promyelocytic
leukemia (APL); however, it is higher outside clinical
trials. Patients who survive induction show excellent
cure rates with few late relapses. Therefore, reducing
the number of early deaths (EDs) is a high priority
in this highly curable disease. Specifically, there is a
need for significant improvement in the outcomes
of elderly patients (>60 years old). At ASH 2016, Kota
and colleagues presented outcomes from a prospec-
tive trial of elderly patients with APL, using a set of
simplified treatment guidelines along with support
from APL experts.1
Study design
• Elderly patients with APL were prospectively
enrolled in the trial from July 2013 to June 2016
(newer group [NG]).
• Outcomes were compared with prior institutional experience among elderly patients (early group [EG]) taken from January 2007 to June 2013.
• The protocol consisted of a simplified treatment algorithm with emphasis on preventing the most common causes of ED: bleeding, infection, and differentiation syndrome (DS).
Key findings
• A total of 70 elderly patients with APL were treated or co-managed between 2007 and 2016.
Twenty-three of these patients were in the EG, while 47 were in the NG.
All EG patients were treated in the authors’ insti-tution.
Thirteen NG patients were treated in the authors’ institution, while the remaining 34 were man-aged in 18 other centres.
• The median age was 66 years in the EG and 69 years in the NG.
Reduction of early deaths and improved survival in elderly patients (>60 years) with APL as a result of using a simplified treatment algorithm and expert support: A prospective multicentre trial
Kota V, et al. ASH 2016:1622

54 New Evidence in Oncology | April 2017
• Clinical characteristics are outlined in Table 1.
• In the EG, induction consisted of:
All-trans retinoic acid (ATRA) alone (n = 5; 21%);
ATRA with arsenic trioxide (ATO) (n = 5; 21%); and
ATRA with anthracyclines (n = 13; 56%).
• In the NG, induction consisted of:
ATRA alone (n = 2; 4%);
ATRA with ATO (n = 43; 91%); and
ATRA with chemotherapy (n = 2; 4%).
• In the NG, doses of ATRA and/or ATO were reduced in a majority of the patients.
• Bleeding at presentation occurred in four (17%) EG vs. five (11%) NG patients.
• The median follow-up was 2,165 days (range: 1–3,540) in EG and 267 days (1–960) in NG.
• Complications during induction for the EG vs. NG were as follows:
Infection in 13 (56%) vs. 10 (22%) patients; and
Differentiation syndrome in 13 (56%) vs. 18 (40%) patients.
• In the EG, 12 patients (52%) died during induction.
Four patients were discharged to hospice immediately after presentation and one patient refused care, bringing the induction mortality to 7/18 (39%).
• NG had eight induction deaths.
One death was due to refusal of transfusions and one was due to multi-organ failure, after failing to consult the investigators for 12 days.
• The induction mortality rate in the NG was 6/45 (13.3%).
Four patients in the NG experienced late deaths from a secondary cancer (n = 1), relapse (n = 1), and non-APL related deaths (n = 2).
• With a median follow-up of 267 days in the NG, overall sur-vival was 77.8% when compared with 42% in the EG. (Figure 1)
2,5002,0001,5001,000500
Time (days)
Early death rate: 13.3%
Pre-algorithm
Post algorithm: 6/45 deaths
Cum
ulat
ive
surv
ival
0
0.0
0.2
0.4
0.6
0.8
1.0
Figure 1. Overall survival
• Elderly patients tolerate full doses of ATRA and ATO poorly during induction.
• ATRA and ATO are better tolerated at reduced doses.
• Use of a simplified treatment algorithm with expert support has the potential to decrease induction mortality (13.3%) and improve population-wide survival (77.8%).
• APL treatment should be simplified and standardized in all large and experienced institutions.
• To improve outcomes in this patient population, educa-tion of hematologists and oncologists about EDs and rapid diagnosis and treatment is needed.
• A network of leukemia experts who can co-manage patients during treatment might help improve outcomes in elderly patients.
• Arsenic-based induction was used more frequently in the NG.
– Improvised treatment protocols based on age and comorbidities might help improve outcomes.
Key conclusions
Reference: 1. Kota V, Karkhanis P, Sharma R, et al. A prospective multi-center trial shows reduction of early deaths (ED) and improved survival in elderly acute promyelocytic leukemia (APL) patients (>60 years). Results of using a simplified treatment algorithm and expert support in Georgia, South Carolina and Neighboring States. ASH Annual Meeting Abstracts 2016:1622.
Table 1. Clinical characteristics
Early group Newer group
Median age (range) 66 (61–80) 69 (61–83)
Median WBC/mm3 1.9 (0.3–132) 2.3 (0.3–38)
Male to female ratio 1:2 1:1
Low risk (WBC <10,000/mm3), %
73 93
Treatment centre (large >3 patients/year vs. small hospital)
100% large hospital
42.5% large/57.5%
small hospitals
WBC = white blood cell count

New Evidence in Oncology | April 2017 55
• Elderly patients tolerate full doses of ATRA and ATO poorly during induction.
• ATRA and ATO are better tolerated at reduced doses.
• Use of a simplified treatment algorithm with expert support has the potential to decrease induction mortality (13.3%) and improve population-wide survival (77.8%).
• APL treatment should be simplified and standardized in all large and experienced institutions.
• To improve outcomes in this patient population, educa-tion of hematologists and oncologists about EDs and rapid diagnosis and treatment is needed.
• A network of leukemia experts who can co-manage patients during treatment might help improve outcomes in elderly patients.
• Arsenic-based induction was used more frequently in the NG.
– Improvised treatment protocols based on age and comorbidities might help improve outcomes.
Key conclusions
Background
The combination of all-trans retinoic acid (ATRA) and chemotherapy is the standard therapy for acute promyelocytic leukemia (APL). The introduction of arsenic trioxide (ATO) in APL treatment has allowed achievement of similarly high remission and survival rates coupled with significantly reduced myelosup-pression. Recent results of the APL0406 trial by the GIMEMA-AMLSG-SAL study groups showed that the combination of ATRA and ATO is superior to stan-dard ATRA and chemotherapy in frontline therapy of low- and intermediate-risk APL.1 An APL registry, Napoleon, was recently initiated in order to provide evidence of the clinical reality of APL patient care in Germany. The first analysis of patients prospectively enrolled in the registry was presented at ASH 2016.2
Study design
• The eligibility criteria were adults of at least 18 years of age, with newly diagnosed or relapsed APL within their first year of diagnosis or relapse.
• The aims of the registry are:
To document epidemiologic data, treatment, long-term outcomes, and quality of life of patients with APL;
To obtain real-world data on APL demographics, as well as use of various therapies and adherence to therapeutic guidelines;
To collect samples from patients for biobanking and further translational studies;
To improve access to the current treatment approaches and assist in the development of best practice guidelines; and
To examine the implementation of existing diag-nostic and therapeutic guidelines.
Key findings
• A total of 106 patients were included in the registry.
• As of August 2016, 88 patients were included in this study with a median age of 57 years (range: 22–87).
• All patients had newly diagnosed APL with 58 (66%) being of low/intermediate risk according to the Sanz score.
Out of those patients, 44 (76%) received an ATO and ATRA-based induction regimen followed by a median of four courses of consolidation (according to the APL0406 study).
The characteristics of these patients are outlined in Table 1.
Of the 41 patients evaluable for response to induction, 40 (98%) patients achieved complete remission with the ATRA-ATO regimen.
Early death rate within 30 days of therapy was 2% (one of 44 patients).
After a median follow-up of 12 months, the event-free survival, cumulative incidence of relapse, and overall survival at 12 months were 97%, 0%, and 97%, respectively.
Therapy was well tolerated with no new safety signals.
Real-life experience with ATRA- and ATO-based regimen in APL: Updated results of the prospective German intergroup Napoleon registry
Platzbecker U, et al. ASH 2016:2815
Table 1. Patient characteristics
ATRA + ATO(n = 44)
Age, median (range) 53 (22–87)
WBC 109/L, median (range) 2.2 (0.3–9)
Sanz risk Low/intermediate, n (%)
44 (100)
FLT3-ITD, n mutated/n total (%) 3/29 (10)
ATO = arsenic trioxide; ATRA = all-trans retinoic acid; FLT3-ITD = FMS-like tyrosine kinase-internal tandem duplication; WBC = white blood cell count
• The real-life data from this prospective German registry provide further evidence for the safety and sustained anti-leukemic efficacy of ATRA-ATO in low- and intermediate-risk APL.
• The results presented here further support ATRA-ATO as the new standard of care in this clinical setting.
Key conclusions
References: 1. Lo-Coco F, Avvisati G, Vignetti M, et al. Retinoic acid and arsenic trioxide for acute promyelocytic leukemia. N Engl J Med 2013;369:111–21. 2. Platzbecker U, Lengfelder E, Goetze KS, et al. Real life experience with ATRA-arsenic trioxide based regimen in acute promyelocytic leukemia – updated results of the prospective German intergroup Napoleon registry. ASH Annual Meeting Abstracts 2016:2815.

56 New Evidence in Oncology | April 2017
Background
Pegaspargase (SS-PEG) is commonly used as frontline therapy in childhood acute lymphoblastic leukemia (ALL). Calaspargase pegol (SC-PEG) is a novel formu-lation that uses the same asparaginase enzyme and PEG moiety as SS-PEG but a different linker molecule. Patients typically receive a single dose of SS-PEG dur-ing induction, followed by 15 doses every two weeks post induction in order to maintain therapeutic serum asparaginase activity (SAA), defined as ≥0.1 IU/mL, for 30 consecutive weeks. The investigators hypothesized that SC-PEG could be administered less frequently than SS-PEG during post-induction therapy with a similar SAA and toxicity profile. Findings were pre-sented at ASH 2016.1
Study design
• Between 2012 and 2015, patients were randomized at study entry to receive either SS-PEG or SC-PEG.
• Both groups received a single dose during multi-agent remission induction.
• Post induction, patients assigned to SS-PEG received 15 doses every two weeks, while those assigned to SC-PEG received 10 doses every three weeks along with other risk-stratified chemotherapy.
• The endpoints of the study were:
SAA;
Asparaginase-related toxicities (hypersensitiv-
ity, pancreatitis, clots, hyperbilirubinemia, and
infection);
End-induction minimal residual disease (MRD);
and
Event-free survival (EFS).
• Serum samples were obtained at 4, 11, 18, and
25 days after the induction dose to determine SAA
and prior to each post-induction dose to determine
nadir SAA (NSAA) by a validated biochemical assay.
• Patients were switched to Erwinia asparaginase for
grade 2 or higher allergy or for silent inactivation
(defined as two consecutive non-detectable NSAA).
• Asparaginase was permanently discontinued for
pancreatitis and held for thrombosis (but restarted
once the clot improved).
• End-induction MRD was assessed in patients with
ALL by immunoglobulin heavy chain/T-cell recep-
tor polymerase chain reaction assay, with low MRD
defined as <0.001 and high MRD defined as ≥0.001.
Results from a randomized study of pegaspargase and calaspargase pegol in pediatric patients with newly diagnosed acute lymphoblastic leukemia or lymphoblastic lymphoma
Silverman LB, et al. ASH 2016:175
Asparaginase type
Arm A
Arm B
SC-PEG = calaspargase pegol; SS-PEG = pegaspargase
SC-PEG2,500 IU/m2
Remission induction
1 dose (Day 7)
SS-PEG2,500 IU/m2 1 dose (Day 7)
Postinduction (Week 7)
10 doses every three weeks (30 weeks total)
15 doses every two weeks (30 weeks total)
Study design

New Evidence in Oncology | April 2017 57
• To be eligible for inclusion, patients had to be between 1 and 21 years of age and newly diagnosed with ALL or lympho-blastic lymphoma (LL).
• Two patients in the SC-PEG arm (1.7%) and none in the SS-PEG arm met criteria for silent inactivation.
Key findings
• A total of 239 patients were enrolled (230 patients with ALL and 9 with LL).
• A total of 119 patients received SC-PEG and 120 received SS-PEG.
• There were no significant differences in presenting character-istics between the two groups.
• The SAA was higher for patients on SC-PEG when compared with those on SS-PEG (median 0.298 IU/mL vs. 0.056 IU/mL). (Figure 1)
Twenty-five days after dose, 88% of patients on SC-PEG had SAA ≥0.1 IU/mL vs. 15% of patients on SS-PEG (p <0.001).
• Post-induction NSAA was similar between arms, with median NSAA ≥1.0 IU/mL at 7, 13, 19, and 25 weeks after beginning the 30-week post-induction asparaginase treatment.
NSAA was ≥0.1 IU/mL in ≥98% of patients on both arms at each time point.
• There were no significant differences in rates of asparaginase-related toxicities between the two arms. (Table 1)
• There were no differences in rates of complete remission between the two arms (95% for the SC-PEG arm and 99% for the SS-PEG arm; p = 0.12).
• There were no differences in end-induction MRD.
Low MRD was 91% in the SC-PEG arm vs. 90% in the SS-PEG arm.
High MRD was 9% in the SC-PEG arm vs. 10% in the SS-PEG arm.
• EFS awaits longer follow-up.
251811
Days after induction with asparaginase
SS-PEGSC-PEG
Seru
m a
spar
agin
ase
enzy
me
acti
vity
leve
l (IU
/mL)
4
0.0
0.2
0.4
0.6
0.8
1.0
1.2
1.4
SAA = serum asparaginase activity; SC-PEG = calaspargase pegol; SS-PEG = pegaspargase
Figure 1. Median SAA by asparaginase type
Table 1. Induction adverse events
Adverse event (%)SC-PEG
(n = 119)SS-PEG
(n = 120)p-value
Asparaginase allergy (grade ≥2) 0 1 1.00
Pancreatitis (grade ≥3) 3 3 1.00
Thrombosis 3 7 0.22
Elevated bilirubin (grade ≥3) 8 12 0.40
Insulin-requiring hyperglycemia 1 2 1.00
Infection: bacterial (grade ≥3) 13 10 0.55
Infection: fungal (grade ≥3) 4 5 1.00
SC-PEG = calaspargase pegol; SS-PEG = pegaspargase
• Single dose of SC-PEG during induction led to a more sustained therapeutic effect when compared with SS-PEG.
– SC-PEG may be given less frequently than SS-PEG.– Substitution of SC-PEG may lead to more prolonged asparagine depletion.
• SC-PEG and SS-PEG showed similar toxicity.
• There were no differences in end-induction MRD between SC-PEG and SS-PEG.
• Both SC-PEG and SS-PEG might be given at a reduced dose and/or with a longer interval.
Key conclusions
Reference: 1. Silverman LB, Blonquist TM, Hunt SK, et al. Randomized study of pegaspargase (SS-PEG) and calaspargase pegol (SC-PEG) in pediatric patients with newly diagnosed acute lymphoblastic leukemia or lymphoblastic lymphoma: results of DFCI ALL Consortium Protocol 11-001. ASH Annual Meeting Abstracts 2016:175.

58 New Evidence in Oncology | April 2017
Background
Both pegaspargase (SS-PEG) and calaspargase pegol
(SC-PEG) consist of L-asparaginase and antibodies
to either asparaginase or polyethylene glycol (PEG)
and have been associated with rapid clearance of
asparaginase. The Children Oncology Group (COG)
AALL07P4 study evaluated the pharmacokinetic (PK)
and pharmacodynamic comparability of SS-PEG and
SC-PEG as part of an augmented Berlin-Frankfurt-
Munster chemotherapy regimen for the treatment
of newly diagnosed, National Cancer Institute
high-risk, B-precursor acute lymphoblastic leukemia
(ALL). Results from COG AALL07P4 were presented
at ASH 2016.1
Study design
• A total of 166 patients were randomized.
Fifty-four patients were randomized to SS-PEG at 2,500 IU/m2, 43 to SC-PEG at 2,500 IU/m2, and 69 to SC-PEG at 2,100 IU/m2.
One patient was not evaluable.
Both SC-PEG treatment groups were pooled for this report.
• Blinded analyses of anti-SS-PEG and anti-SC-PEG antibodies were performed on samples obtained prior to asparaginase administration and at protocol-specified time points through the second cycle of maintenance therapy in patients with adequate samples (50 and 111 patients in the SS-PEG and SC-PEG treatment groups, respectively).
Anti-pegaspargase, anti-calaspargase pegol, and anti-polyethylene glycol antibody incidence in high-risk ALL patients receiving pegaspargase or calaspargase pegol and associated anaphylactic or hypersensitivity reaction rates
Schore RJ, et al. ASH 2016:3965
MRD = minimal residual disease; RER = rapid early responders; SC-PEG = calaspargase pegol; SER = slow early responders; SS-PEG = pegaspargase
AALL07P4Study enrolment
Patients randomized to receive treatment with
SC-PEG or SS-PEG
Bone marrow and blood testsMeasurement of MRD
Arm ASC-PEG
Arm BSS-PEG
Off study therapy
RER SER
Induction Induction
Consolidation Consolidation
Interim maintenance 1 Interim maintenance 1
Delayed intensification 1 Delayed intensification 1
Maintenance Interim maintenance 2
Delayed intensification 2
Maintenance
Study design

New Evidence in Oncology | April 2017 59
• Immunogenicity assessment included the detection of bind-ing anti-SS-PEG or anti-SC-PEG antibodies by a validated direct enzyme-linked immunosorbent assay (ELISA).
• All detected antibodies were analyzed in a neutralizing anti-SS-PEG/anti-SC-PEG antibody assay for their neutralizing capacity using a validated enzymatic coupled activity assay.
• Analysis of anti-PEG antibodies using ELISA was assessed retrospectively in a subset of patients who had available specimens (26 and 42 patients in the SS-PEG and SC-PEG treatment groups, respectively), including all patients with anti-SS-PEG/anti-SC-PEG antibody positive samples.
• All grades of anaphylactic reactions and hypersensitivity were reported according to the Common Terminology Crite-ria for Adverse Events v3.0 prior to July 2011 and converted into v4.0 codes with subsequent adverse events (AEs) col-lected in v4.0.
Key findings
• The analysis showed fewer anti-SC-PEG antibodies (2.7% [3 of 111 patients]) than anti-SS-PEG antibodies (10.0% [5 of 50 patients]).
The majority of positive post-treatment antibodies were transient and not detectable at subsequent visits.
• Three patients (one in the SC-PEG and two in the SS-PEG treatment group) showed positive results for binding anti-bodies at the last tested time point.
It is unknown whether these antibodies are of transient or persistent nature.
• Only one patient in the SC-PEG treatment group tested positive for neutralizing antibodies at one time point with negative results at subsequent time points.
• Focusing on the subset of patients who had available anti-PEG antibody data, eight of 45 (17.8%) in the SC-PEG treatment group had detectable anti-PEG antibodies vs. six of 26 (23.1%) in the SS-PEG treatment group.
• Full analyses of antibody incidence are presented in Table 1.
• Among 111 patients treated with SC-PEG, 30 (27.0%) devel-oped an anaphylactic and/or hypersensitivity reaction and two of them (6.7%) had anti-SC-PEG present at the time of reaction.
• Among 50 patients treated with SS-PEG, 12 (24%) developed an anaphylactic and/or hypersensitivity reaction and two of them (16.7%) had anti-SS-PEG present at the time of reaction.
• In the patients who had anaphylactic and hypersensitivity reactions, two out of 10 (20%) patients treated with SC-PEG had either anti-SC-PEG or anti-PEG antibodies vs. five out of eight (62.5%) patients treated with SS-PEG, who had either anti-SS-PEG or anti-PEG antibodies.
• Full analyses of anaphylactic or hypersensitivity reaction rates are presented in Table 2.
• Observed differences in antibody responses were not statisti-cally significant.
• As previously reported, many patients with clinical ana-phylactic and hypersensitivity reactions did not have antibodies detected.
Table 1. Antibody incidence in patients with ALL receiving SC-PEG or SS-PEG
SC-PEG SS-PEG
Patients with post-baseline anti-SC-PEG/anti-SS-PEG assessments (n = 161)
n 111 50
Positive post-baseline anti-SC-PEG/anti-SS-PEGn (%)
95% CI3 (2.7)0.6–7.7
5 (10.0)3.3–21.8
Patients with post-baseline anti-SC-PEG/anti-SS-PEG and anti-PEG assessments (n = 71)
n 45 26
Anti-SC-PEG/anti-SS-PEG and/or anti-PEG*n (%)
95% CI8 (17.8)8.0–32.1
9 (34.6)17.2–55.7
Anti-SC-PEG/anti-SS-PEGn (%)
95% CI3 (6.7)
1.4–18.35 (19.2)6.6–39.4
Anti-PEGn (%)
95% CI8 (17.8)8.0–32.1
6 (23.1)9.0–43.6
ALL = acute lymphoblastic leukemia; CI = confidence interval; PEG = polyethylene glycol; SC-PEG = calaspargase pegol; SS-PEG = pegaspargase* Positive antibodies were counted if anti-SC-PEG/anti-SS-PEG or anti-PEG antibodies were positive.

60 New Evidence in Oncology | April 2017
• In this preliminary analysis of COG AALL07P4, patients receiving SC-PEG have numerically less antibody formation to both asparaginase and PEG than patients receiving SS-PEG.
• Fewer patients with anaphylactic and hypersensitivity reactions to SC-PEG had detectable antibodies as compared to those who received SS-PEG.
• Since these antibodies may be associated with rapid clearance of asparaginase, further evaluation of PK and immunogenicity is ongoing.
• Additional investigation is warranted to better understand the clinical significance of these findings.
Key conclusions
Reference: 1. Schore RJ, Devidas M, Bleyer A, et al. Anti-pegaspargase, anti-calaspargase pegol, and anti-polyethylene glycol antibody incidence in high-risk acute lymphoblastic leukemia patients receiving pegaspargase or calaspargase pegol and associated anaphylactic or hypersensitivity reaction rates: results from Children’s Oncology Group (COG) study AALL07P4. ASH Annual Meeting Abstracts 2016:3965.
Table 2. Anaphylactic or hypersensitivity reaction rates associated with antibody incidence in patients with ALL receiving SC-PEG or SS-PEG
SC-PEG SS-PEG
Patients with post-baseline anti-SC-PEG/anti-SS-PEG assessments (n = 161)
n 111 50
Anaphylactic reaction and/or hypersensitivity*,† n (%) 30 (27) 12 (24.0)
Positive post-baseline anti-SC-PEG/anti-SS-PEG‡ n (%)95% CI
2 (6.7)0.8–22.1
2 (16.7)2.1–48.4
Patients with post-baseline anti-SC-PEG/anti-SS-PEG and anti-PEG assessments (n = 71)
n 45 26
Anaphylactic reaction and/or hypersensitivity*,† n (%) 10 (22.2) 8 (30.8)
Anti-SC-PEG/anti-SS-PEG and/or anti-PEG‡ n (%)95% CI
2 (20.0)2.5–55.6
5 (62.5)24.5–91.5
Anti-SC-PEG/anti-SS-PEG‡ n (%)95% CI
2 (20.0)2.5–55.6
2 (25.0)3.2–65.1
Anti-PEG‡ n (%)95% CI
2 (20.0)2.5–55.6
4 (50.0)15.7–84.3
ALL = acute lymphoblastic leukemia; CI = confidence interval; PEG = polyethylene glycol; SC-PEG = calaspargase pegol; SS-PEG = pegaspargase* The denominator is the number of subjects with post-baseline anti-SC-PEG/anti-SS-PEG antibody assessments, which were obtained in the following cycles:
induction Day 29, consolidation Days 15 and 43, interim maintenance 1 Day 1, delayed intensification Days 4 and 43, interim maintenance 2 Days 2 and 22, and maintenance cycle 1 and 2 Day 1.
† Subjects who experienced anaphylactic reaction and hypersensitivity events were counted once.‡ The denominator is the number of subjects with the events.


62 New Evidence in Oncology | April 2017
Lymphomas
New Treatments Improve Outcomes for Patients with Lymphoma Throughout the Continuum of Care
Outcomes for patients with lymphoma have improved steadily over time; between 2001 and 2015, mortality rates for non-Hodgkin lymphomas (NHL) declined by more than 2% per year in Canada.1 Despite these improvements, unmet needs remain in the treatment of lymphomas.
The combination of bendamustine and rituximab (BR) recently became the standard of care in the first line for indolent NHL, due to improvements in efficacy and tolerability over the previous standard (the combination of rituximab, cyclophosphamide, doxorubicin, vincristine, and prednisone).2–4 Even with improved regimens, many patients eventually relapse or become refractory to these treatments. New agents (such as obinutuzumab) and regimens (such as the combination of bendamustine, rituximab, and cytarabine [R-BAC]) are being investigated to further improve response durability in the first line.
In aggressive lymphomas and relapsed/refractory (R/R) Hodgkin lymphoma (HL), autologous stem cell transplant (ASCT) is the standard of care, with five-year progression-free survival (PFS) rates of approximately 50%.5 New regimens are continuing to be developed in an effort to reduce the toxicities associated with conditioning for ASCT; one such example is the combination of bendamustine, etoposide, cytarabine, and melphalan (Benda-EAM).
Following transplants, chronic graft versus host dis-ease (cGVHD) is a common cause of morbidity, with incidence rates of cGVHD post allogeneic transplant reaching 37%.6 Currently, there are no treatment options for cGVHD if patients do not respond to corticosteroids; the Bruton’s tyrosine kinase inhibi-
tor ibrutinib is being investigated as an option for these patients.
For patients with R/R disease who are ineligible for ASCT, treatment options are limited. Immuno-chemotherapies such as BR have become standard treatments for this patient population; obinutuzum-ab is being studied as a replacement for rituximab in such regimens.
At the 2016 American Society of Hematology (ASH) Annual Meeting, New Evidence covered several stud-ies highlighting improvements in patient outcomes throughout the continuum of care. The following abstracts are summarized in this section:
• Updated results of the GADOLIN study confirmed that induction with obinutuzumab plus benda-mustine followed by obinutuzumab maintenance significantly reduced risk of disease progression or death relative to bendamustine alone in patients with R/R FL. (Cheson BD, et al. ASH 2016:615)
• A retrospective analysis of patients with aggressive NHL and HL who received Benda-EAM condition-ing before ASCT reported promising outcomes and an acceptable toxicity profile. (Noesslinger T, et al. ASH 2016:2265)
• Primary results from the phase III GALLIUM study demonstrated clinically meaningful improvements in PFS with obinutuzumab-based regimens com-pared to rituximab-based regimens in patients with previously untreated follicular lymphoma (FL). (Marcus R, et al. ASH 2016:6)
• A single arm, phase II, multicentre trial supported the use of dose-reduced R-BAC in elderly patients

New Evidence in Oncology | April 2017 63
with previously untreated mantle cell lymphoma, demon-strating durable responses with manageable toxicities. (Visco C, et al. ASH 2016:472)
• A direct, real-world comparison between BR and the combination of dexamethasone, rituximab, and cyclophos-phamide demonstrated a trend towards superior PFS with BR
in patients with either treatment-naïve or R/R Waldenström Macroglobulinemia. (Paludo J, et al. ASH 2016:2968)
• A study investigating the efficacy and safety of ibrutinib in patients with cGVHD who had failed frontline therapy found that ibrutinib treatment resulted in clinically meaningful and sustained responses. (Miklos D, et al. ASH 2016:LBA-3)
References: 1. Canadian Cancer Statistics 2015. Canadian Cancer Society. http://www.cancer.ca/~/media/cancer.ca/CW/cancer%20information/cancer%20101/Canadian%20cancer%20statistics/Canadian-Cancer-Statistics-2015-EN.pdf. Accessed on January 6, 2017. 2. Rummel MJ, Niederle N, Maschmeyer G, et al. Bendamsutine plus rituximab versus CHOP plus rituximab as first-line treatment for patients with indolent and mantle-cell lymphomas: an open-label, multicentre, randomised, phase 3 non-inferiority trial. Lancet 2013;381:1203–10. 3. Flinn IW, van der Jagt R, Kahl BS, et al. Randomized trial of bendamustine-rituximab or R-CHOP/R-CVP in first-line treatment of indolent NHL or MCL: the BRIGHT study. Blood 2014;123:2944–52. 4. Dreyling M, Geisler C, Hermine O, et al. Newly diagnosed and relapsed mantle cell lymphoma: ESMO Clinical Practice Guidelines for diagnosis, treatment and follow-up. Ann Oncol 2014;25 (Suppl 3):iii83–92. 5. Philip T, Guglielmi C, Hagenbeek A, et al. Autologous bone marrow transplantation as compared with salvage chemotherapy in relapses of chemotherapy-sensitive non-Hodgkin’s lymphoma. N Engl J Med 1995;333(23):1540–5. 6. Arai S, Arora M, Wang T, et al. Increasing incidence of chronic graft-versus-host disease in allogeneic transplantation: a report from the Center for International Blood and Marrow Transplant Research. Biol Blood Marrow Transplant 2015;21(2):266–74.
Background
Treatment options for patients with relapsed or refrac-
tory (R/R) indolent non-Hodgkin lymphoma (iNHL)
are limited. The GADOLIN study compared the effi-
cacy and safety of obinutuzumab plus bendamustine
induction followed by obinutuzumab maintenance
(G-B arm) with bendamustine induction alone
(B arm), in patients with rituximab-refractory
iNHL. In the primary analysis, median independent
review committee-assessed progression-free sur-
vival (PFS) was not reached in the G-B arm and was
14.9 months in the B arm, a 45% reduction in risk of
progression or death (HR = 0.55, 95% CI: 0.40–0.74;
p = 0.0001).1 Seventeen additional patients were
enrolled after the data cutoff for the primary analysis. At
the ASH 2016 Meeting, Cheson and colleagues reported
updated time-to-event and safety results from a
planned analysis of all GADOLIN patients using a
data cutoff of April 1, 2016.2
Study design
• The GADOLIN study was an open-label, multicen-tre, randomized, phase III study in patients with rituximab-refractory iNHL.
• Rituximab-refractory was defined as failure to respond to or progression during any prior ritux-imab-containing regimen, or progression within six months of the last rituximab dose, in the induction or maintenance settings.
• Endpoints considered in the following analysis included investigator-assessed PFS, overall survival (OS), time to next treatment (TTNT), and safety.
Key findings
Baseline characteristics and disposition
• A total of 204 patients were randomized to the G-B arm, while 209 patients were randomized to the B arm.
• In the G-B arm, 189 patients (93%) started follow-up; 192 patients (92%) started follow-up in the B arm.
• Two patients crossed over from the B arm to G-B maintenance at the end of induction.
Obinutuzumab plus bendamustine followed by obinutuzumab maintenance prolongs OS compared with bendamustine alone in patients with rituximab-refractory iNHL: Updated results of the GADOLIN study
Cheson BD, et al. ASH 2016:615

64 New Evidence in Oncology | April 2017
• In the randomized population, 80.4% of the patients in the G-B arm (n = 164) and 81.8% of the patients in the B arm (n = 171) had a follicular lymphoma (FL) diagnosis.
Baseline characteristics of the FL population were similar to the overall iNHL population.
• In the iNHL population, baseline characteristics were similar between treatment arms:
Median age was 62.0 years (range: 34–87) in the G-B arm and 61.9 years (range: 21–87) in the B arm;
The majority of patients were male (56.9% in the G-B arm and 58.4% in the B arm) and had an Eastern Cooperative Oncology Group performance status (ECOG PS) of 0–1 (95.6% in the G-B arm and 95.1% in the B arm).
• Patients had received a median number of two prior regi-mens in both treatment arms (range: 1–7 in the G-B arm and 1–10 in the B arm); the median time since completion of the last regimen was 3.9 months in both treatment arms (range: 0.1–128.4 in the G-B arm and 0.5–64.0 in the B arm).
• The majority of patients were refractory to their last regimen (92.2% in the G-B arm and 92.3% in the B arm) and were refractory to both rituximab and an alkylating agent (77.5% in the G-B arm and 81.3% in the B arm).
• Treatment history was similar in the FL population.
Efficacy
• After a median follow-up of 31.8 months in the iNHL popu-lation and 31.2 months in the FL population, median PFS was significantly higher in the G-B arm compared to the B arm. (Figure 1)
• When PFS was stratified by baseline characteristics, nearly every subgroup favoured G-B over B (with the exception of patients with an ECOG PS of 2).
Results were similar in the FL population.
• Median TTNT was numerically higher in the G-B arm compared to the B arm in both the iNHL and FL populations:
iNHL population: 40.8 months in the G-B arm vs. 19.4 months in the B arm (HR = 0.59; 95% CI: 0.45–0.77).
FL population: 33.6 months in the G-B arm vs. 18.0 months in the B arm (HR = 0.57; 95% CI: 0.43–0.75).
• OS was significantly higher in the G-B arm compared to the B arm in both the iNHL and FL populations. (Figure 2)
Safety
• Incidences of adverse events (AEs) were similar between treatment arms. (Table 1)
• Grade 3–5 AEs of interest are summarized in Table 2.
• Grade 5 AEs were as follows:
G-B arm: infections and infestations (n = 6), neoplasms benign, malignant, and unspecified (n = 5), blood and lymphatic system disorders (n = 1), cardiac disorders (n = 1), immune system disorders (n = 1), injury, poisoning, and procedural complications (n = 1), and renal and urinary disorders (n = 1).
B arm: infections and infestations (n = 7), neoplasms benign, malignant, and unspecified (n = 3), nervous system disorders (n = 2), and metabolism and nutrition disorders (n = 1).
GRANDOMIZED
1:1
Induction Maintenance*
B = bendamustine; C = cycle; CD20 = cluster of differentiation 20; D = day; ECOG PS = Eastern Cooperative Oncology Group performance status; G = obinutuzumab; G-B = obinutuzumab plus bendamustine; iNHL = indolent non-Hodgkin lymphoma; iv = intravenous* Patients in the G-B arm without evidence of progression following induction received G maintenance.
Patients were aged ≥18 years with documented rituximab-refractory
iNHL and an ECOG PS of 0–2
Target enrolment: 410
B 90 mg/m2 iv (D1, D2, C1–C6) and G 1,000 mg iv (D1, D8, D15,
C1; D1, C2–6), every 28 days
G-B GCD20+ rituximab-refractory iNHL
B 120 mg/m2 iv (D1, D2, C1–C6), every 28 days
B
G 1,000 mg iv every two months for two years
Data cutoff:April 1, 2016
Study design

New Evidence in Oncology | April 2017 65
54 60484236302418126
Time (months)
iNHL populationPr
ob
abili
ty
0
2 0101623294763106170209
5 02133506488109135175204
BNumber of patients at risk
G-B
B (n = 209)G-B (n = 204)
0.0
0.2
0.4
0.6
0.8
1.0
B = bendamustine; CI = confidence interval; FL = follicular lymphoma; G-B = obinutuzumab plus bendamustine; HR = hazard ratio; iNHL = indolent non-Hodgkin lymphoma; PFS = progression-free survival
* Stratified analysis; stratification factors: iNHL subtype, prior therapies, refractory type, geographical region.† Stratified analysis; stratification factors: prior therapies, refractory type, geographical region.
G-B (n = 204) B (n = 209)
Patients with event, n (%) 115 (56.4) 146 (69.9)
Median PFS, months (95% CI) 25.8 (19.5–41.1) 14.1 (12.6–16.0)
HR (95% CI), p-value* 0.57 (0.44–0.73), p <0.0001
54 60484236302418126
Time (months)
FL population
Pro
bab
ility
0
0 0491518324584141171
4 0152640496786107138164
BNumber of patients at risk
G-B
B (n = 171)G-B (n = 164)
0.0
0.2
0.4
0.6
0.8
1.0
G-B (n = 164) B (n = 171)
Patients with event, n (%) 93 (56.7) 125 (73.1)
Median PFS, months (95% CI) 25.3 (17.4–36.0) 14.0 (11.3–15.3)
HR (95% CI), p-value† 0.52 (0.39–0.69), p <0.0001
Figure 1. Investigator-assessed progression-free survival

66 New Evidence in Oncology | April 2017
54 60484236302418126
Time (months)
FL population
iNHL population
Pro
bab
ility
0
126 7 018416381105149166190209
25 12 0497089118141159175186204
BNumber of patients at risk
G-B
B (n = 209)G-B (n = 204)
0.0
0.2
0.4
0.6
0.8
1.0
B = bendamustine; CI = confidence interval; FL = follicular lymphoma; G-B = obinutuzumab plus bendamustine; HR = hazard ratio; iNHL = indolent non-Hodgkin lymphoma; NR = not reached; OS = overall survival
* Stratified analysis; stratification factors: iNHL subtype, prior therapies, refractory type, geographical region.† Stratified analysis; stratification factors: prior therapies, refractory type.
66
54 60484236302418126
Time (months)
Pro
bab
ility
0
13 732496584103122137159171
20 1238567190111129141147164
BNumber of patients at risk
G-B
B (n = 171)G-B (n = 164)
0.0
0.2
0.4
0.6
0.8
1.0
66
G-B (n = 204) B (n = 209)
Patients with event, n (%) 52 (25.5) 73 (34.9)
Median OS, months (95% CI) NR (NR–NR) NR (48.2–NR)
HR (95% CI), p-value* 0.67 (0.47–0.96), p = 0.0269
G-B (n = 164) B (n = 171)
Patients with event, n (%) 39 (23.8) 64 (37.4)
NR (NR–NR) 53.9 (40.9–NR)
HR (95% CI), p-value† 0.58 (0.39–0.86), p = 0.0061
Median OS, months (95% CI)
Figure 2. Overall survival

New Evidence in Oncology | April 2017 67
• The updated analysis of GADOLIN:
– Confirms that G-B induction plus obinutuzumab maintenance significantly reduces risk of disease progression or death relative to bendamustine induction alone in patients with rituximab-refractory FL;
– Demonstrates a significant improvement in OS in the G-B arm; and
– Confirms the comparable safety profile observed in the primary analysis.
• Collectively, these data establish G-B induction plus obinutuzumab maintenance as a new standard of care for patients with rituximab-refractory FL.
Key conclusions
References: 1. Sehn LH, Chua N, Mayer J, et al. Obinutuzumab plus bendamustine versus bendamustine monotherapy in patients with rituximab-refractory indolent non-Hodgkin lymphoma (GADOLIN): a randomised, controlled, open-label, multicentre, phase 3 trial. Lancet Oncol 2016;17(8):1081–93. 2. Che-son BD, Trneny M, Bouabdallah K, et al. Obinutuzumab plus bendamustine followed by obinutuzumab maintenance prolongs overall survival compared with bendamustine alone in patients with rituximab-refractory indolent non-Hodgkin lymphoma: updated results of the GADOLIN study. ASH Annual Meeting Abstracts 2016:615.
Table 1. Adverse events in the iNHL population
% (n) G-B (n = 204) B (n = 203)*
Any AE 99.0 (202) 98.5 (200)
Grade 3–5 AE 72.5 (148) 65.5 (133)
Grade 5 (fatal) AE 7.8 (16) 6.4 (13)
SAE 43.6 (89) 36.9 (75)
AE leading to withdrawal from any study treatment 20.1 (41) 17.2 (35)
AE leading to dose modification† 50.0 (102) 42.4 (86)
AE = adverse event; B = bendamustine; G-B = obinutuzumab plus bendamustine; iNHL = indolent non-Hodgkin lymphoma; SAE = serious adverse event
* Two patients who crossed over from the B arm to the G-B arm during maintenance are excluded. † Decrease or delay.
Table 2. Grade 3–5 adverse events in the iNHL population
Induction Maintenance Overall
% (n)G-B
(n = 204)B
(n = 205)*G-B
(n = 158)†
G-B (n = 204)
B (n = 203)†
Neutropenia‡ 27.5 (56) 26.8 (55) 10.8 (17) 34.8 (71) 27.1 (55)
Thrombocytopenia‡ 10.3 (21) 15.6 (32) 1.3 (2) 10.8 (22) 15.8 (32)
Infections and infestations§ 7.8 (16) 12.2 (25) 10.1 (16) 22.5 (46) 19.2 (39)
Infusion-related reactions‡ 8.8 (18) 3.4 (7) 0.6 (1) 9.3 (19) 3.4 (7)
Neoplasms** 1.0 (2) 1.0 (2) 2.5 (4) 5.9 (12) 5.4 (11)
Cardiac disorders†† 2.5 (5) 1.0 (2) 1.9 (3) 4.4 (9) 1.5 (3)
B = bendamustine; G-B = obinutuzumab plus bendamustine; iNHL = indolent non-Hodgkin lymphoma; PT = Preferred Term; SOC = System Organ Class
* Two patients who crossed over from the B arm to the G-B arm during maintenance are included. † Two patients who crossed over from the B arm to the G-B arm during maintenance are excluded. ‡ By PT. § By SOC. ** By SOC. Benign, malignant, and unspecified (including cysts and polyps). †† By SOC. Eight of 12 patients with a history of cardiac disease.

At the 2016 ASH Annual Meet-ing, New Evidence spoke with Dr. Bruce Cheson, Head of Hematology and Deputy Chief of Hematology-Oncology at Georgetown University Hospital and Lombardi Comprehensive Cancer Center in Washington, D.C., U.S., about the updated
results of the GADOLIN study. The study compared the efficacy and safety of obinutuzumab plus bendamus-tine induction followed by obinutuzumab maintenance (G-B arm) with bendamustine induction alone (B arm) in patients with rituximab-refractory indolent non-Hodgkin lymphoma (iNHL).
New Evidence: What advantages does obinutuzumab offer over rituximab?
Dr. Cheson: Obinutuzumab offers a number of ad-vantages over rituximab. Obinutuzumab has greater antibody-dependent cellular cytotoxicity and greater direct cell death of cluster of differentiation 20 (CD20)-positive tumour cells compared to rituximab.1–3 Also, in preclinical models, obinutuzumab in combination with bendamustine was more active than the combination of bendamustine and rituximab.4
New Evidence: What treatments are currently available for patients with rituximab-refractory iNHL? What key un-met needs remain for the management of these patients?
Dr. Cheson: There are a couple of treatment options available for patients with relapsed/refractory (R/R) fol-licular lymphoma (FL) and iNHL. The frontline therapy that the patient received will, to some extent, determine the appropriate second-line therapy. For example, if the patient received the combination of rituximab, cyclo-phosphamide, doxorubicin, vincristine, and prednisone (R-CHOP) as frontline therapy, then the combination of bendamustine and rituximab (BR) is a reasonable alterna-tive. However, there are not a lot of data to support the efficacy of R-CHOP in the second line if a patient received BR in the first line.
For these patients, there are two drugs currently on the U.S. market: 90Y ibritumomab tiuxetan (which is not often used) and idelalisib. While idelalisib is very active, with response rates of 50%–60%, it has been associated with a number of unpleasant adverse effects.5 There is a need in this space for newer, more effective, well-tolerated therapies.
New Evidence: Please describe the design of the GADO-LIN study. What was the rationale for the chosen doses of bendamustine and obinutuzumab?
Dr. Cheson: The GADOLIN study was a randomized phase III trial. In the G-B arm, the dose of bendamustine was 90 mg/m2, which is the standard dose when bendamustine is given in combination with an anti-CD20 monoclonal antibody. In this arm, induction therapy was followed by maintenance for two years. In the B arm, bendamustine was given as a single agent at a dose of 120 mg/m2, which is the approved single-agent dose of bendamustine. Even though this was a randomized trial, the doses were a bit different in each treatment arm. However, the addition of the antibody to a lower dose of bendamustine created a very interesting, effective combination.
New Evidence: Please summarize and comment on the efficacy results of the GADOLIN study.
Dr. Cheson: The overall response and complete response rates were the same in both arms. Nevertheless, the impor-tant time-dependent endpoints were quite different. There was a significantly longer progression-free survival (PFS), time to next treatment (TTNT), and overall survival (OS) in the G-B arm compared to the B arm. Despite the use of a lower dose of the traditional cytotoxic agent in the G-B arm, the addition of the antibody made a more effective combination approach.
New Evidence: Please summarize and comment on the safety results of the GADOLIN study.
Dr. Cheson: Even though a combination therapy was compared to a single drug, there were no major safety signals in the study. There were more infusion-related reactions with obinutuzumab, which was expected. There was also a slightly higher incidence of neutro-penia in the G-B arm compared to the B arm, although there was no difference in the incidence of neutropenic fevers or infections. There was more thrombocytopenia in the B arm compared to the G-B arm. All other observed toxicities were reasonably comparable between arms. Adverse events (AEs) were managed in a typical fashion. If patients had infections, they were treated appropriately. The most common AEs were cytopenias and infections. There were no major safety signals that had to be addressed. The increased efficacy observed in the G-B arm was not complicated by a large difference in the toxicity profile.
Investigator Commentary An Interview with Dr. Bruce Cheson on the GADOLIN study
68 New Evidence in Oncology | April 2017

New Evidence: What kind of prophylactic measures do you take prior to treatment with G-B?
Dr. Cheson: There is no need for prophylactic antimicro-bial therapy because the risk of infections (bacterial, fungal, and viral) is so low that it would not be appropriate.
New Evidence: In which patients would you currently recommend giving G-B?
Dr. Cheson: The population in the GADOLIN study in-cluded patients with rituximab-refractory low-grade FL, yet the FDA approval of G-B is for all patients with R/R FL following a rituximab-containing regimen.6 I think the G-B regimen is a reasonable treatment for all patients in this setting who have not previously received bendamus-tine. There were only three patients in the GADOLIN study who had previously received bendamustine, so the efficacy of the regimen in this context is unknown. No subset of patients in the G-B arm experienced reduced efficacy compared to the entire study population (age, sex, FL International Prognostic Index score, etc.).
New Evidence: Where do you see the G-B regimen fitting best in the sequence of iNHL treatments?
Dr. Cheson: I think this regimen is excellent for patients who have previously received rituximab (as a single agent, in combination with chemotherapy, or during mainte-nance) because G-B was advantageous in all of these prior treatment groups. In the U.S., the majority of patients re-ceive BR as frontline therapy. We do not yet know if G-B is beneficial for this population. However, we are starting to use more targeted approaches, including in the first line. Because of this, I think there will be opportunities to use G-B in patients who failed R-CHOP, rituximab, or some other biological non-cytotoxic therapy.
New Evidence: Do you think that G-B will fill the current unmet need for patients with rituximab-refractory iNHL?
Dr. Cheson: In the foreseeable future, this regimen will fulfill the niche for patients with rituximab-refractory FL
and low-grade lymphoma. When you look at the data in PFS, TTNT, and OS, G-B was superior not only in patients with FL, but also in the entire study population.
New Evidence: Will the results from this study change the standard of care for patients in this setting?
Dr. Cheson: I think the results of this study should clearly change practice, and G-B should become the stan-dard of care for patients who are rituximab-refractory to frontline therapy.
New Evidence: Where do you see the treatment of rituximab-refractory iNHL heading in the future?
Dr. Cheson: We are currently in an era where we are moving away from traditional cytotoxic therapies (e.g., chemotherapy, chemoimmunotherapy) to more targeted, individualized, and personalized approaches. We have countless new agents that target the cell surface (e.g., monoclonal antibodies, antibody-drug conjugates), intra-cellular pathways (e.g., phosphoinositide 3-kinase, Bruton’s tyrosine kinase, spleen tyrosine kinase, or B-cell lymphoma 2 inhibitors), or the microenvironment (e.g., lenalidomide and the checkpoint inhibitors). Various combinations of these drugs are widely in development in clinical trials.
It is highly likely that in the next few years we will see a change in frontline therapy. One regimen that may alter our approach is the R-squared regimen (rituximab plus lenalidomide). We initially developed R-squared over a decade ago. Data in relapsed patients and in the frontline setting stimulated interest in the RELEVANCE trial, which compares R-squared to rituximab plus che-motherapy in patients with previously untreated FL.7–9 If this trial is positive, I think it will completely change how we treat FL in the first line. We are also still going to need novel approaches in the relapsed setting. For now, G-B is a great therapy for rituximab-refractory patients. However, we are developing newer non-chemotherapy approaches and I think this is the future of treatment in FL and low-grade lymphoma.
New Evidence in Oncology | April 2017 69
References: 1. Decaup E, Jean C, Laurent C, et al. Anti-tumor activity of obinutuzumab and rituximab in a follicular lymphoma 3D model. Blood Cancer J 2013;3:e131. 2. Herter S, Herting F, Mundigl O, et al. Preclinical activity of the type II CD20 antibody GA101 (obinutuzumab) compared with rituximab and ofatumumab in vitro and in xenograft models. Mol Cancer Ther 2013;12:2031-42. 3. Cang S, Mukhi N, Wang K, et al. Novel CD20 monoclonal antibodies for lymphoma therapy. J Hematol Oncol 2012;5:64. 4. Herting F, Friess T, Bader S, et al. Enhanced anti-tumor activity of the glycoengi-neered type II CD20 antibody obinutuzumab (GA101) in combination with chemotherapy in xenograft models of human lymphoma. Leuk Lymphoma 2014;55:2151–60. 5. Barrientos JC. Idelalisib for the treatment of indolent non-Hodgkin lymphoma: a review of its clinical potential. Onco Targets Ther 2016;18:2945–53. 6. Genentech, Inc. GAZYVA® (obinutuzumab) Prescribing Information. February 2016. 7. Leonard JP, Jung SH, Johnson J, et al. Randomized trial of lenalidomide alone versus lenalidomide plus rituximab in patients with recurrent follicular lymphoma: CALGB 50401 (Alliance). J Clin Oncol 2015;33:3635–40. 8. Martin P, Jung SH, Johnson J, et al. CALGB 50803 (Alliance): A phase II trial of lenalidomide plus rituximab in patients with previously untreated follicular lymphoma. J Clin Oncol (ASCO Annual Meeting) 2014;32:5s(Suppl):abstr 8521. 9. Fowler NH, Davis RE, Rawal S, et al. Safety and activity of lenalidomide and rituximab in untreated indolent lymphoma: an open-label, phase 2 trial. Lancet Oncol 2014;15:1311–8.

70 New Evidence in Oncology | April 2017
Background
Autologous stem cell transplantation (ASCT) is the
standard of care for patients with relapsed diffuse
large B-cell lymphoma (DLBCL), Hodgkin lymphoma
(HL), and other aggressive non-Hodgkin lymphomas
(NHL). The combination of carmustine, etoposide,
cytarabine, and melphalan (BEAM) is a standard con-
ditioning regimen, but it is associated with increased
risk of interstitial pneumonia and secondary tumours
after ASCT. The following study, presented at ASH
2016, reported promising results with bendamustine
replacing carmustine in the BEAM regimen, first
described as Benda-EAM in 2011.1,2
Study design
• This study was a retrospective analysis of patients
with aggressive NHL and HL who received Benda-
EAM conditioning before ASCT.
• Endpoints included engraftment, safety, and
response.
Key findings
Baseline characteristics and disposition
• Forty-one patients were treated as of July 1, 2016 (27 males and 14 females).
• The median age was 52 years (range: 22–71).
A total of 29% of patients were more than 60 years of age.
• The median line of treatments was 2 (range: 1–4).
• Thirty-two patients had NHL:
Eleven patients had DLBCL in the second to fourth lines of treatment (two of which had double-hit lymphoma);
Ten patients had mantle cell lymphoma (MCL), nine of whom were in the first line of treatment;
Six patients had follicular lymphoma (FL) in the second to third lines of treatment;
Three patients had T-cell lymphoma (TCL) in the first line of treatment; and
Two patients had grey zone lymphoma (GZL) in the first and third lines of treatment.
Autologous stem cell transplantation with Benda-EAM in aggressive NHL and Hodgkin lymphoma
Noesslinger T, et al. ASH 2016:2265
Days –8 –7 –6 –5 –4 –3 –2 0
Bendamustine 200 mg/m2
Cytarabine 400 mg/m2
Etoposide 200 mg/m2
Melphalan 140 mg/m2
Bendamustine Cytarabine Etoposide Melphalan
ASCT
ASCT = autologous stem cell transplantation
Study design

New Evidence in Oncology | April 2017 71
• Nine patients had HL in the second to third lines of treatment.
• Salvage treatment/mobilization regimens that patients received are summarized in Table 1.
• At the time of transplant, 34 patients (83%) were in complete remission and seven patients (17%) were in partial remission.
• Details of engraftment are summarized in Table 2.
Efficacy
• After ASCT, 22 patients (56%) achieved a complete response and eight patients (17%) had disease progression.
• No patients had a partial response after ASCT.
• There were 11 deaths after ASCT:
Three patients with DLBCL;
Three patients with HL;
Two patients with MCL; and
One patient each with GZL, TCL, and FL.
• All deaths were due to progressive disease, and all patients had complete remission before ASCT.
• After a median follow-up of 37 months (range: 19–56), 44% of patients had experienced relapse or progression.
Median time to progression was seven months (range: 2–29).
• One- and two-year progression-free survival rates were 73.2% and 57.9%, respectively. (Figure 1)
• One- and two-year overall survival rates were 85.4% and 77.6%, respectively. (Figure 2)
Safety
• Grade 3/4 toxicities are summarized in Table 3.
• No pulmonary toxicities were observed.
• No treatment-related mortality (TRM) was observed.
Table 1. Salvage treatment/mobilization regimes
14 x R-DHAP
10 x (R)-mini Benda-EAM
10 x (R)-CHOP like
3 x BR or R-BAC
2 x R-ICE
1 x DA-EPOCH-R, 1 x BEACOPP esc
BEACOPP esc = dose-escalated bleomycin, etoposide, doxorubicin, cyclophosphamide, vincristine, procarbazine, prednisone; Benda-EAM = bendamustine, etoposide, cytarabine, melphalan; BR = bendamustine, rituximab; CHOP = cyclophosphamide, doxorubicin, vincristine, prednisone; DA-EPOCH-R = dose-adjusted rituximab, etoposide, prednisone, vincristine, cyclophosphamide, doxorubicin; R = rituximab; R-BAC = rituximab, bendamustine, cytarabine; R-DHAP = rituximab, dexamethasone, cytarabine, cisplatin; R-ICE = rituximab, ifosfamide, carboplatin, etoposide
Table 2. Engraftment
Median CD34+ cells/kg body weight infused, n (range)
4.2 × 10⁶ (1.6–13.3 × 10⁶)
Median time of ANC <1 × 10⁹/L, days (range)
10 (8–13)
Median time to platelets >20 × 109/L, days (range)
12 (7–110)
Median time of fever, days (range)
5 (0–15)
ANC = absolute neutrophil count; CD34 = cluster of differentiation 34
Cum
ulat
ive
prob
abili
ty o
f sur
viva
l (%
)
0
20
40
80
100
60
Progression-free survival (days)
0 180 540 900 1,260360 720 1,080 1,440 1,620
Cum
ulat
ive
prob
abili
ty o
f sur
viva
l (%
)
0
20
40
80
100
60
Overall survival (days)
0 180 540 900 1,260360 720 1,080 1,440 1,620
Figure 1. Progression-free survival Figure 2. Overall survival

72 New Evidence in Oncology | April 2017
Table 3. Grade 3/4 toxicities (CTC 4.0)
Toxicity (%) Number of Patients
Grade 3 Grade 4
Cardiologic (7) 3 0
Gastrointestinal (34) 11 3
Oral mucositis (15) 6 1
Febrile neutropenia (14) 5 1
Infections (22) 6 3
CTC = common toxicity criteria
• Benda-EAM seems to be a feasible treatment with a promising outcome.
• Rapid trilineage engraftment was observed.
• There was acceptable toxicity with no TRM.
• A randomized, international, phase II trial comparing BEAM with Benda-EAM is currently recruiting; first results are expected for 2018.
Key conclusions
References: 1. Noesslinger T, Panny M, Simanek R, et al. Autologous stem cell transplantation with Benda-EAM (bendamustine, etoposide, cytarabine, melphalan) in aggressive NHL and Hodgkins lymphoma. ASH Annual Meeting Abstracts 2016:2265. 2. Visani G, Malerba L, Stefani PM, et al. BeEAM (benda-mustine, etoposide, cytarabine, melphalan) before autologous stem cell transplantation is safe and effective for resistant/relapsed lymphoma patients. Blood 2011;118(12):3419–25.
Background
There is a significant benefit of rituximab-based
induction and maintenance therapy in patients with
previously untreated, advanced-stage, symptomatic
follicular lymphoma (FL), with reported progression-
free survival (PFS) rates of more than six years.1
Obinutuzumab has greater preclinical activity than
rituximab2,3 and prolonged PFS when combined with
bendamustine in patients with indolent non-Hodgkin
lymphoma (iNHL) who were refractory to rituximab.4
The GALLIUM study compared the efficacy and
safety of obinutuzumab-based and rituximab-based
regimens in patients with previously untreated iNHL;
primary results for the subset of patients with FL were
presented at ASH 2016.5
Study design
• The GALLIUM study was an international, open-label, randomized phase III trial.
• Patients with previously untreated, CD20-positive FL or splenic/nodal/extranodal marginal zone lymphoma (MZL) were included in the study.
• Along with either obinutuzumab or rituximab, patients received one of the following chemotherapy regimens during induction:
Bendamustine (n = 827);
Cyclophosphamide, doxorubicin, vincristine, prednisone (CHOP) (n = 433); or
Cyclophosphamide, vincristine, prednisone (CVP) (n = 141).
• The primary endpoint was investigator-assessed PFS in patients with FL.
Obinutuzumab-based induction and maintenance prolongs PFS in patients with previously untreated FL: Primary results of the randomized phase III GALLIUM study
Marcus R, et al. ASH 2016:6

New Evidence in Oncology | April 2017 73
• Benda-EAM seems to be a feasible treatment with a promising outcome.
• Rapid trilineage engraftment was observed.
• There was acceptable toxicity with no TRM.
• A randomized, international, phase II trial comparing BEAM with Benda-EAM is currently recruiting; first results are expected for 2018.
• Other endpoints included independent review committee (IRC)-assessed PFS, overall survival (OS), event-free survival, disease-free survival, duration of response, time to next treat-ment (TTNT), complete response (CR) and overall response rates (ORR) at the end of induction, and safety.
• The study was unblinded (per Independent Data Monitoring Committee [IDMC] recommendation) after the preplanned interim efficacy analysis.
• IDMC found that PFS was superior for patients with FL on obinutuzumab-based therapies; this subset of patients is the subject of the following analyses.
Key findings
Baseline characteristics and disposition
• A total of 1,202 patients with FL were enrolled and random-ized to treatment (intent to treat population).
• Median follow-up was 34.5 months; maintenance is ongoing in 114 patients (n = 54 in the rituximab arm and n = 60 in the obinutuzumab arm).
• The safety population was comprised of 1,192 patients.
• Baseline patient and disease characteristics were similar between the obinutuzumab and rituximab arms.
• The median age was 58 years in the rituximab arm and 60 years in the obinutuzumab arm.
• A large number of patients had an FL International Prog-nostic Index (FLIPI) score ≥3 (42.1% in the rituximab arm and 41.4% in the obinutuzumab arm) and bulky disease (45.2% in the rituximab arm and 42.5% in the obinutu-zumab arm).
• The median time from diagnosis to randomization was 1.4 months in the rituximab arm and 1.5 months in the obinutuzumab arm.
Efficacy
• At the end of induction, ORR was 86.9% in the rituximab arm and 88.5% in the obinutuzumab arm.
CR was achieved in 23.8% of patients in the rituximab arm
and in 19.5% of patients in the obinutuzumab arm.
• The three-year investigator-assessed PFS was 80.0% in
the obinutuzumab arm and 73.3% in the rituximab arm
(HR = 0.66; 95% CI: 0.51–0.85; p = 0.0012). (Figure 1)
PFS was stratified by chemotherapy regimen; however, post
hoc analysis determined that the study was not powered
to detect differences between chemotherapy regimens in
either treatment arm.
• IRC-assessed PFS was 81.9% in the obinutuzumab arm and
77.9% in the rituximab arm (HR = 0.71; 95% CI: 0.54–0.93;
p = 0.0138).
• Three-year TTNT was 87.1% in the obinutuzumab arm and
81.2% in the rituximab arm (HR = 0.68; 95% CI: 0.51–0.91;
p = 0.0094).
• Three-year OS was 94.0% in the obinutuzumab arm and
92.1% in the rituximab arm (HR = 0.75; 95% CI: 0.49–1.17;
p = 0.21). (Figure 2)
Safety
• The incidence of adverse events (AEs) was higher in the
obinutuzumab arm than in the rituximab arm, particularly
for infusion-related reactions (IRRs), cytopenias, and infec-
tions. (Table 1)
• Grade 5 AEs occurred more frequently in patients receiving
bendamustine, regardless of treatment arm.
There were 34 deaths in the group who received benda-
mustine (19 in the obinutuzumab arm and 15 in the
rituximab arm).
There were seven deaths in the group who received
CHOP (three in the obinutuzumab arm and four in the
rituximab arm).
There were two deaths in the group who received CVP
(one in each arm).
ObinutuzumabG 1,000 mg iv on D1, D8, D15 of C1 and D1 of C2–8 (q3w) or C2–6 (q4w)
plus CHOP, CVP, or bendamustine†
RANDOMIZE
1:1*
Induction Maintenance
Previously untreated CD20+ iNHL• Age ≥18 years• FL (grade 1–3a) or splenic/ nodal/extranodal MZL• Stage III/IV or stage II bulky disease (≥7 cm) requiring treatment• ECOG PS 0–2• Target FL enrolment: 1,200
C = cycle; CD20 = cluster of differentiation 20; CHOP = cyclophosphamide, doxorubicin, vincristine, prednisone; CR = complete response; CVP = cyclophosphamide, vincristine, prednisone; D = day; ECOG PS = Eastern Cooperative Oncology Group performance status; EOI = end of induction; FL = follicular lymphoma; FLIPI = Follicular Lymphoma International Prognostic Index; G = obinutuzumab; iNHL = indolent non-Hodgkin lymphoma; IPI = International Prognostic Index; iv = intravenous; MZL = marginal zone lymphoma; PD = progressive disease; PR = partial response; q2mo = every two months; q3w = every three weeks; q4w = every four weeks; R = rituximab; SD = stable disease
* FL and MZL patients were randomized separately; stratification factors: chemotherapy, FLIPI (FL) or IPI (MZL) risk group, geographic region.† CHOP q3w × 6 cycles, CVP q3w × 8 cycles, bendamustine q4w × 6 cycles; choice by site (FL) or by patients (MZL).‡ Patients with SD at EOI were followed for PD for up to two years.
RituximabR 375 mg/m2 iv on D1 of C1–8 (q3w)
or C1–6 (q4w) plus CHOP, CVP,or bendamustine†
ObinutuzumabG 1,000 mg iv
q2mo for two years or until PD
CR or PR‡
at EOI visit
RituximabR 375 mg/m2 iv
q2mo for two years or until PD
Study design

74 New Evidence in Oncology | April 2017
54484236302418126
Time (months)
Pro
bab
ility
0
01068160266378463505562601
01375168278405502536570601
RituximabNumber of patients at risk
Obinutuzumab
Rituximab (n = 601)Median follow-up: 34.5 monthsObinutuzumab (n = 601)
0.0
0.2
0.4
0.6
0.8
1.0
CI = confidence interval; FL = follicular lymphoma; FLIPI = Follicular Lymphoma International Prognostic Index; HR = hazard ratio; PFS = progression-free survival
* Stratified analysis; stratification factors: chemotherapy regimen, FLIPI risk group, geographic region.
Rituximab(n = 601)
Obinutuzumab (n = 601)
Patients with event, n (%) 144 (24.0) 101 (16.8)
3-year PFS, % (95% CI) 73.3 (68.8–77.2) 80.0 (75.9–83.6)
HR (95% CI), p-value* 0.66 (0.51–0.85), p = 0.0012
54484236302418126
Time (months)
Pro
bab
ility
0
58160265399527549566588601
55
2
161271416549563573584601
RituximabNumber of patients at risk
Obinutuzumab
Rituximab (n = 601)
Median follow-up: 34.5 months
Obinutuzumab (n = 601)
0.0
0.2
0.4
0.6
0.8
1.0
CI = confidence interval; FL = follicular lymphoma; FLIPI = Follicular Lymphoma International Prognostic Index; HR = hazard ratio; OS = overall survival
* Stratified analysis; stratification factors: chemotherapy regimen, FLIPI risk group, geographic region.
60
Rituximab(n = 601)
Obinutuzumab (n = 601)
Patients with event, n (%) 46 (7.7) 35 (5.8)
3-year OS, % (95% CI) 92.1 (89.5–94.1) 94.0 (91.6–95.7)
HR (95% CI), p-value* 0.75 (0.49–1.17), p = 0.21
Figure 1. Investigator-assessed progression-free survival (FL population)
Figure 2. Overall survival (FL population)

New Evidence in Oncology | April 2017 75
Table 1. Safety summary (FL population)
% (n)Rituximab arm
(n = 597)Obinutuzumab arm
(n = 595)
Any AE 98.3 (587) 99.5 (592)
Grade ≥3 AEs (≥5% in either arm) 67.8 (405) 74.6 (444)
Neutropenia 37.9 (226) 43.9 (261)
Leucopenia 8.4 (50) 8.6 (51)
Febrile neutropenia 4.9 (29) 6.9 (41)
IRRs* 3.7 (22) 6.7 (40)
Thrombocytopenia 2.7 (16) 6.1 (36)
Grade ≥3 AEs of special interest by category (selected)
Infections† 15.6 (93) 20.0 (119)
IRRs‡ 6.7 (40) 12.4 (74)
Second neoplasms§ 2.7 (16) 4.7 (28)
SAEs 39.9 (238) 46.1 (274)
AEs causing treatment discontinuation 14.2 (85) 16.3 (97)
Grade 5 (fatal) AEs 3.4 (20) 4.0 (24)**
Median (range) change from baseline in IgG levels at end of induction, g/L††
–1.46 (–16.4 to 9.1)‡‡ –1.50 (–22.3 to 6.5)§§
AE = adverse event; EOI = end of induction; FL = follicular lymphoma; IgG = immunoglobulin G; IRR = infusion-related reaction; MedDRA = Medical Dictionary for Regulatory Activities; SAE = serious adverse event
* As MedDRA preferred term.† All events in MedDRA System Organ Class ‘Infections and Infestations’.‡ Any AE occurring during or within 24 hours of infusion of obinutuzumab or rituximab and considered drug-related.§ Standardized MedDRA query for malignant or unspecified tumours starting six months after treatment start.** Includes patient who died after clinical cut-off date from AE starting before cut-off date.†† Immunoglobulin levels were measured during screening, at EOI, at end of maintenance, and during follow-up.‡‡ n = 472.§§ n = 462.
• Obinutuzumab plus chemotherapy and maintenance was superior to rituximab plus chemotherapy and maintenance in untreated patients with advanced FL.
• There was a clinically meaningful improvement in PFS that was supported by other time-to-event endpoints.
• Nonfatal AEs were higher in the obinutuzumab arm, particularly in IRRs, cytopenias, and infections.
• Fatal AEs were more common in patients on bendamustine in both arms.
• Obinutuzumab-based therapy significantly improves outcomes compared with rituximab-based therapy and should now be considered as a first-line treatment for FL.
Key conclusions
References: 1. Salles GA, Seymour JF, Feugier P, et al. Updated 6 year follow-up of the PRIMA study confirms the benefit of 2-year rituximab maintenance in follicular lymphoma patients responding to frontline immunochemotherapy. Blood 2013;122(21):509. 2. Herter S, Herting F, Mundigl O, et al. Preclinical activity of the type II CD20 antibody GA101 (obinutuzumab) compared with rituximab and ofatumumab in vitro and in xenograft models. Mol Cancer Ther 2013;12(10):2031–42. 3. Mössner E, Brünker P, Moser S, et al. Increasing the efficacy of CD20 antibody therapy through the engineering of a new type II anti-CD20 antibody with enhanced direct and immune effector cell-mediated B-cell cytotoxicity. Blood 2010;115(22):4393–402. 4. Sehn LH, Chua N, Mayer J, et al. Obinutuzumab plus bendamustine versus bendamustine monotherapy in patients with rituximab-refractory indolent non-Hodgkin lymphoma (GADOLIN): a randomised, controlled, open-label, multicentre, phase 3 trial. Lancet Oncol 2016;17(8):1081–93. 5. Marcus R, Davies A, Ando K, et al. Obinutuzumab-based induction and maintenance prolongs progression-free survival (PFS) in patients with previously untreated follicular lymphoma: primary results of the randomized phase III GALLIUM study. ASH Annual Meeting Abstracts 2016:6.

76 New Evidence in Oncology | April 2017
Background
The combination of bendamustine and rituximab is an effective frontline treatment for elderly patients with mantle cell lymphoma (MCL). Cytarabine is highly beneficial in younger patients with MCL, and the combination of bendamustine, rituximab, and cytarabine (R-BAC) is strongly synergistic when cultured consecutively on MCL cell lines.1,2 At ASH 2016, Visco and colleagues presented the results of a phase II trial that investigated the efficacy and safety of R-BAC in elderly patients with MCL.3
Study design
• The study was a single arm, phase II, multicentre trial that used the Bryant and Day two-stage design.4
Stage I was designed to recruit 19 patients; the study would stop if fewer than eight patients achieved a complete response (CR) or if more than seven patients experienced toxicity.
Stage II was designed to recruit 38 patients; the results would be considered positive if more
than 28 patients achieved CR and fewer than
18 patients experienced toxicity.
• The dose of cytarabine in this study was reduced to
500 mg/m2 (R-BAC500).
• Inclusion criteria were:
Previously untreated patients with MCL aged
>65 years, or age 60–65 and unfit for autologous
stem cell transplantation; and
No history of indolent disease (non-nodal leuke-
mic disease).
• Patients were recruited between May 2, 2012 and
February 25, 2014.
• The primary objectives were CR rate (according to
2007 International Working Group criteria) and
safety.
• Secondary objectives included the rate of molecu-
lar response, progression-free survival (PFS), overall
survival (OS), and duration of response (DoR).
Rituximab, bendamustine and cytarabine as induction therapy in elderly patients with MCL: Final results of a phase II study from the Fondazione Italiana Linfomi
Visco C, et al. ASH 2016:472
R-BAC500 3rd and 4th
If CR or PR, no relevant toxicity
R-BAC500 5th and 6th R-BAC500 5th and 6th
R-BAC500 3rd and 4th
PR or SD
PD
CR
Baseline PET + MRD
MRD +6, +12, +24
Intermediate MRD (before cycle 3)
Final PET + MRD (end of treatment)
R-BAC500 1st and 2nd
CR = complete response; MRD = minimal residual disease; PD = progressive disease; PET = positron emission tomography; PR = partial response;R-BAC500 = rituximab, bendamustine, cytarabine (cytarabine at 500 mg/m2); SD = stable disease
Stop Treatment
Stop treatment if SD or PD, or at least one episode of relevant toxicity
Follow-up phase; 24 months
Study design

New Evidence in Oncology | April 2017 77
Key findings
Baseline characteristics and disposition
• A total of 57 patients were enrolled from 29 centres; 304 cycles of R-BAC500 were delivered.
• The median age was 71 years (range: 61–79).
• The majority of patients were male (75%) with a performance status of 0–1 (94%), bone marrow involvement (63%), and classical histology (75%).
• Elevated Ki-67 expression (≥30%) was found in 31% of patients.
• No patients were excluded based on pathology review.
• Three patients discontinued due to toxicity/adverse event (AE) after at least two cycles of treatment.
• After at least four cycles, a further 16 patients discontinued
treatment:
Eleven patients discontinued due to toxicity/AE;
One patient discontinued due to progressive disease (PD);
and
Four patients discontinued due to doctor/patient decision.
• A total of 38 patients completed six cycles of treatment
(67%).
Efficacy
• At the end of treatment, CR rate and overall response rate
were both 91%.
1.0
0.8
0.6
0.4
0.2
0.0
0 10 20 30 40 50 60
Prob
abili
ty o
f OS
Time (months)
Overall survival
Two-year OS: 86% (95% CI: 74–93)
Progression-free survival
57Number at risk 53 50 44 17 1
1.0
0.8
0.6
0.4
0.2
0.0
0 10 20 30 40 50
57 52 46 41 14 1
60
Prob
abili
ty o
f PFS
Time (months)
Two-year PFS: 81% (95% CI: 74–93)
Number at risk
1.0
0.8
0.6
0.4
0.2
0.0
0 10 20 30 40 50
52 52 47 43 14 1
60
Prob
abili
ty o
f res
pon
se d
urat
ion
Time (months)
Two-year DoR: 90% (95% CI: 85–94)
Number at risk
Duration of response
CI = confidence interval; DoR = duration of response; OS = overall survival; PFS = progression-free survival
Figure 1. Survival curves

78 New Evidence in Oncology | April 2017
• Forty-five patients were assessed for minimal residual
disease (MRD).
By the end of treatment, 55% of these patients had
achieved MRD in bone marrow, and 79% had achieved
MRD in peripheral blood.
Twelve months after the end of treatment, 57% of 28
patients analyzed maintained MRD in the bone marrow,
and 75% maintained MRD in peripheral blood.
• After a median follow-up of 35 months, two-year OS was
86%, two-year PFS was 81%, and two-year DoR was 90%.
(Figure 1)
• High MCL International Prognostic Index (MIPI) score, blastoid morphology, and elevated Ki-67 expression were associated with inferior PFS. (Figure 2)
Safety
• Twenty-three patients (40%) had at least one episode of hematological ‘relevant toxicity’, which exceeded the predefined safety boundaries. (Table 1)
However, the incidence of grade 4 hematological toxicities was lower than previously reported.5
• Forty-one patients (72%) had at least one dose reduction over treatment courses.
• Non-hematological toxicities are summarized in Table 2.
1.0
0.8
0.6
0.4
0.2
0.0
0.0
0 10 20 30 40 50 60
Prob
abili
ty o
f PFS
Time (months)
Grouping variable: MIPI
p = 0.03
MIPI Low-Intermediate
MIPI High
Ki-67 ≥30%
Ki-67 <30%, no blastoid — LR
Ki-67 ≥30% and/or blastoid — HR
Classical
Pleomorphic
Blastoid
Ki-67 <30%
p <0.0001
p <0.0001 p <0.0001
Grouping variable: Ki-671.0
0.8
0.6
0.4
0.2
0.0
0 10 20 30 40 50 60
Prob
abili
ty o
f PFS
Time (months)
1.0
0.8
0.6
0.4
0.2
0 10 20 30 40 50 60
Prob
abili
ty o
f PFS
Time (months)
Grouping variable: Morphology
HR = high risk; LR = low risk; MIPI = Mantle Cell Lymphoma International Prognostic Index; PFS = progression-free survival
1.0
0.8
0.6
0.4
0.2
0.0
0 10 20 30 40 50 60
Prob
abili
ty o
f PFS
Time (months)
Figure 2. Univariate analysis for PFS

New Evidence in Oncology | April 2017 79
Table 1. Hematological toxicities (% of delivered cycles) Overall
Delivered cycles: 304R-BAC study (JCO 2013)5
Adverse event
Grade
0 1 2 3 4 Grade 4
Leukopenia — 30% 26% 17% 27% 28%
Neutropenia — 15% 36% 14% 35% 17%
Febrile neutropenia — — — 5% 1% 4%
Thrombocytopenia — 14% 34% 16% 36% 64%
Anemia 21% 24% 43% 12% <1% 12%
Platelet transfusion 89/304 cycles (29%) 62%
JCO = Journal of Clinical Oncology; R-BAC = rituximab, bendamustine, cytarabine
Table 2. Non-hematological toxicities occurring in more than one patientAdverse event All grades, n (%) Grade 3, n (%) Grade 4, n (%)
Nausea/vomiting 12 (21) 0 0
Stomatitis 3 (5) 0 0
Constipation/diarrhea 6 (10) 0 0
Infusion related/TLS 12 (21) 1 (2) 0
Fatigue 14 (25) 1 (2) NA
Documented infections 5 (9) 5* (9) 2† (4)
g-GT/GOT-GPT elevation 7 (12) 1 (2) 0
Alopecia 3 (5) 0 0
Rash/desquamation 5 (9) 0 0
Cardiac 3 (5) 2‡ (3) 1§ (2)
CMV = cytomegalovirus; g-GT = gamma-glutamyl-transpeptidase; GOT = glutamate oxaloacetate transaminase; GPT = glutamic-pyruvic transaminase; HZV = herpes zoster virus; NA = not applicable; TLS = tumour lysis syndrome
* HZV reactivation, infection of the surgical wound, CMV reactivation (n = 2), fungal infection.† Pseudomonas Aeruginosa and Gram+ sepsis.‡ Atrial fibrillation, chest pain. § Myocardial infarction with cerebral ischemia.
• The results support the use of R-BAC500 in elderly patients with MCL, and the regimen could be considered as an inexpensive and short-term option.
• Hematological toxicity exceeded the prespecified safety boundaries, but was manageable with dose reduction and reduced compared to previous experience.
• Responses were durable without the use of maintenance therapy, and PFS compared favourably with previously reported regimens, including the combination of bendamustine and rituximab.
Key conclusions
References: 1. Visco C, Castegnaro S, Chieregato K, et al. The cytotoxic effects of bendamustine in combination with cytarabine in mantle-cell lymphoma cell lines. Blood Cells Mol Dis 2012;48(1):68–75. 2. Hiraoka N, Kikuchi J, Yamauchi T, et al. Purine analog-like properties of bendamustine underlie rapid activation of DNA damage response and synergistic effects with pyrimidine analogues in lymphoid malignancies. PLoS One 2014;9(3):e90675. 3. Visco C, Chiappella A, Nassi L, et al. Rituximab, bendamustine and cytarabine (RBAC500) as induction therapy in elderly patients with mantle cell lymphoma (MCL): final results of a phase 2 study from the Fondazione Italiana Linfomi. ASH Annual Meeting Abstracts 2016:472. 4. Bryant J, Day R. Incorporating toxicity considerations into the design of two-stage phase II clinical trials. Biometrics 1995;51(4):1372–83. 5. Visco C, Finotto S, Zambello R, et al. Combination of rituximab, bendamustine, and cytarabine for patients with mantle-cell non-Hodgkin lymphoma ineligible for intensive regimens or autologous transplanta-tion. J Clin Oncol 2013;31(11):1442–9.

80 New Evidence in Oncology | April 2017
Background
Bendamustine plus rituximab (BR) and dexametha-sone, rituximab, and cyclophosphamide (DRC) combination therapies are frequently used for the treatment of Waldenström Macroglobulinemia (WM), both in the frontline and relapsed/refractory (R/R) settings. No direct comparison between BR and DRC has been reported. At the 2016 ASH Meeting, Paludo and colleagues reported outcomes of patients receiv-ing either BR or DRC in R/R and treatment-naïve (TN) patients with WM in the real-world setting.1
Study design
• Records of all patients with WM treated at the Mayo Clinic from January 2007 to December 2014 were reviewed.
• Myeloid differentiation primary response gene-88 (MYD88) L265P point mutation (MYD88L265P) status was recorded when available.
• Analyses were performed on patients treated with up to six cycles of either:
BR (bendamustine 90 mg/m2 intravenous [iv] on Day 1 and 2, and rituximab 375 mg/m2 iv on Day 1); or
DRC (dexamethasone 20 mg iv followed by rituximab 375 mg/m2 iv on Day 1, and cyclo-phosphamide 100 mg/m2 oral, twice a day on Days 1–5).
• Response criteria from the International WM Work-shop VI were utilized.
• Time-to-event analyses were performed from BR or DRC initiation date, using the Kaplan-Meier method.
Key findings
Baseline characteristics and disposition
• Sixty patients received BR (73% in the R/R setting), and 100 patients received DRC (50% in the R/R set-ting, p = 0.004 vs. BR).
• In the R/R population, BR was the second-line therapy (range: 2–11) in 47% of patients, while DRC was the second-line therapy (range: 2–8) in 58% of patients.
• Rituximab monotherapy was the only prior line of therapy in eight (20%) patients in the BR group and 20 (40%) patients in the DRC group (p = 0.66).
• Apart from the number of patients in the R/R setting, baseline characteristics were similar in both treatment groups. (Table 1)
Efficacy
• In the frontline setting:
Median immunoglobulin M (IgM) levels decreased from 3,785 mg/dL to 724 mg/dL (p = 0.0001) at best response with BR, and from 4,130 mg/dL to 1,250 mg/dL (p = 0.001) with DRC.
The median time to best response was 6.1 months (range: 1–25) with BR and 11 months (range: 0.5–47) with DRC (p = 0.13).
The overall response rate (ORR) was 93% for BR and 96% for DRC. (Figure 1)
Median follow-up was 30 months for both groups.
The two-year progression-free survival (PFS) was 88% and 61% in the BR and DRC groups, respec-tively (p = 0.08). (Figure 2)
The two-year time to next therapy (TTNT) was 88% and 76% in the BR and DRC groups, respec-tively (p = 0.35). (Figure 2)
Median PFS from DRC was 34 months (95% CI: 23–not reached [NR]) and NR from BR (p = 0.13).
TTNT and disease-specific survival (DSS) were NR with either regimen.
• In the R/R setting:
Median IgM levels decreased from 3,880 mg/dL to 659 mg/dL (p = 0.0001) at best response with BR, and from 3,870 mg/dL to 1,846 mg/dL (p = 0.001) with DRC.
Bendamustine and rituximab versus dexamethasone, rituximab, and cyclophosphamide in patients with Waldenström Macroglobulinemia
Paludo J, et al. ASH 2016:2968
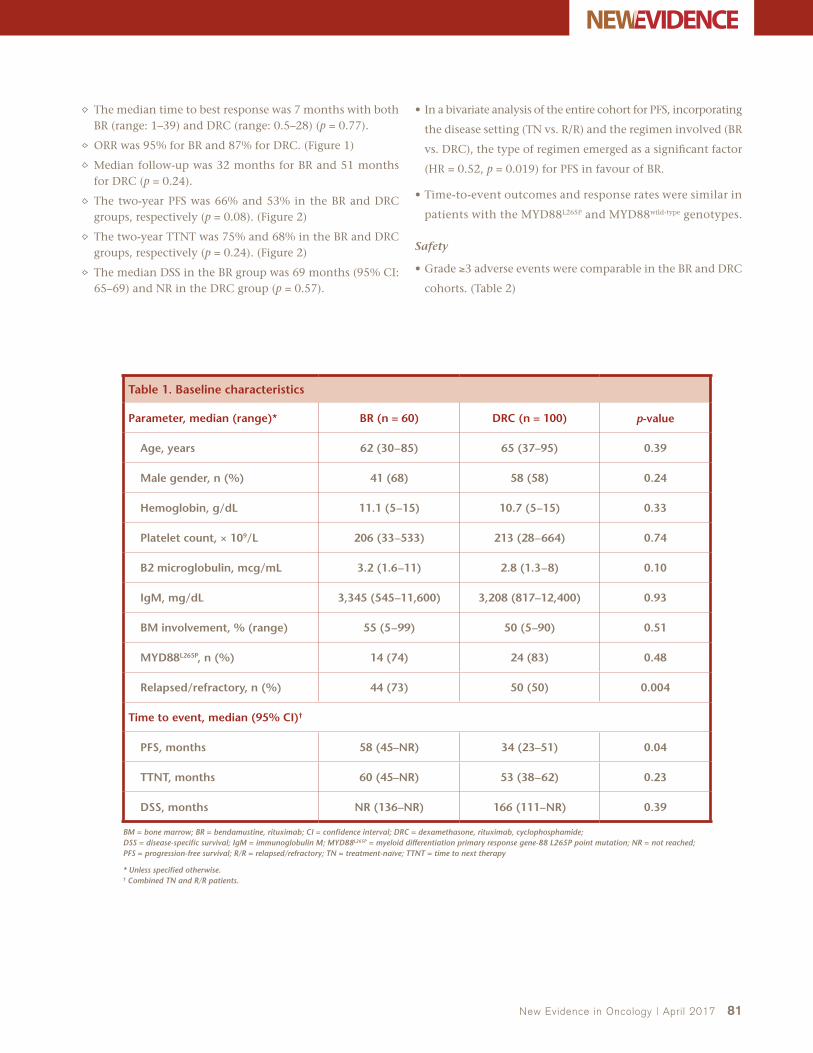
New Evidence in Oncology | April 2017 81
The median time to best response was 7 months with both BR (range: 1–39) and DRC (range: 0.5–28) (p = 0.77).
ORR was 95% for BR and 87% for DRC. (Figure 1)
Median follow-up was 32 months for BR and 51 months for DRC (p = 0.24).
The two-year PFS was 66% and 53% in the BR and DRC groups, respectively (p = 0.08). (Figure 2)
The two-year TTNT was 75% and 68% in the BR and DRC groups, respectively (p = 0.24). (Figure 2)
The median DSS in the BR group was 69 months (95% CI: 65–69) and NR in the DRC group (p = 0.57).
• In a bivariate analysis of the entire cohort for PFS, incorporating
the disease setting (TN vs. R/R) and the regimen involved (BR
vs. DRC), the type of regimen emerged as a significant factor
(HR = 0.52, p = 0.019) for PFS in favour of BR.
• Time-to-event outcomes and response rates were similar in
patients with the MYD88L265P and MYD88wild-type genotypes.
Safety
• Grade ≥3 adverse events were comparable in the BR and DRC
cohorts. (Table 2)
Table 1. Baseline characteristics
Parameter, median (range)* BR (n = 60) DRC (n = 100) p-value
Age, years 62 (30–85) 65 (37–95) 0.39
Male gender, n (%) 41 (68) 58 (58) 0.24
Hemoglobin, g/dL 11.1 (5–15) 10.7 (5–15) 0.33
Platelet count, × 109/L 206 (33–533) 213 (28–664) 0.74
B2 microglobulin, mcg/mL 3.2 (1.6–11) 2.8 (1.3–8) 0.10
IgM, mg/dL 3,345 (545–11,600) 3,208 (817–12,400) 0.93
BM involvement, % (range) 55 (5–99) 50 (5–90) 0.51
MYD88L265P, n (%) 14 (74) 24 (83) 0.48
Relapsed/refractory, n (%) 44 (73) 50 (50) 0.004
Time to event, median (95% CI)†
PFS, months 58 (45–NR) 34 (23–51) 0.04
TTNT, months 60 (45–NR) 53 (38–62) 0.23
DSS, months NR (136–NR) 166 (111–NR) 0.39
BM = bone marrow; BR = bendamustine, rituximab; CI = confidence interval; DRC = dexamethasone, rituximab, cyclophosphamide; DSS = disease-specific survival; IgM = immunoglobulin M; MYD88L265P = myeloid differentiation primary response gene-88 L265P point mutation; NR = not reached; PFS = progression-free survival; R/R = relapsed/refractory; TN = treatment-naïve; TTNT = time to next therapy
* Unless specified otherwise.† Combined TN and R/R patients.

82 New Evidence in Oncology | April 2017
CRVGPRPRMRSDPD
57%70%
29%
17%
7%
7% 9% 13%9%
4%5%4%
DRC
Treatment Naïve Relapsed/Refractory
BR BR DRC
Perc
enta
ge
of
pat
ien
ts (
%)
0
20
40
60
80
100
BR = bendamustine, rituximab; CR = complete response; DRC = dexamethasone, rituximab, cyclophosphamide; MR = minor response; PD = progressive disease; PR = partial response; SD = stable disease; VGPR = very good partial response
41%
38%
3%
64%
19%
4%
1.0
0.8
0.6
0.4
0.2
0
0 12 24 36 48
Time (months)
Treatment Naïve PFS
0 12 24 36 48
0 12 24 36 48 0 12 24 36 48
BRDRC
Relapsed/refractory PFS1.0
0.8
0.6
0.4
0.2
0
Time (months)
1.0
0.8
0.6
0.4
0.2
0
Time (months)
Treatment Naïve TTNT Relapsed/refractory TTNT
BR = bendamustine, rituximab; DRC = dexamethasone, rituximab, cyclophosphamide; PFS = progression-free survival; TTNT = time to next therapy
1.0
0.8
0.6
0.4
0.2
0
Time (months)
Figure 1. Best response rates
Figure 2. Progression-free survival and time to next therapy

New Evidence in Oncology | April 2017 83
Table 2. Adverse events
BR DRC
Toxicity, % AllGrade ≥3
AllGrade ≥3
Neutropenia 39 11 39 20
Thrombocytopenia 26 2 20 7
Nausea/vomiting 9 2 7 0
Fever/Chills 5 0 3 0
Headache 2 0 4 0
Hypotension 2 0 3 1
Infections 19 5 15 3
BR = bendamustine, rituximab; DRC = dexamethasone, rituximab, cyclophosphamide
• Although both DRC and BR regimens show activity and comparable toxicities, the BR regimen shows a trend towards a superior PFS in patients with WM, both in the TN and the R/R settings.
• MYD88L265P mutation status does not appear to impact the activity of BR or DRC.
Key conclusions
Reference: 1. Paludo J, Abeykoon JP, Hesse A, et al. Bendamustine and rituximab (BR) versus dexamethasone, rituximab and cyclophosphamide (DRC) in patients with Waldenstrom Macroglobulinemia. ASH Annual Meeting Abstracts 2016:2968.
Background
Chronic graft versus host disease (cGVHD) is the most common cause of morbidity after allogeneic trans-plant. There are no approved therapies for patients with cGVHD who fail corticosteroids. In preclinical models, ibrutinib reduced the severity of cGVHD, mer-iting its further study as a potential therapy for this disease.1 The following study, presented at ASH 2016, investigated the efficacy and safety of ibrutinib in patients with cGVHD who had failed frontline therapy.2
Study design
• A total of 42 patients were enrolled in the study.
• The primary endpoint was cGVHD response per National Institute of Health 2005 response criteria.
• Secondary endpoints included rate of sustained response, change in Lee cGVHD symptom scale, change in corticosteroid requirement over time, safety, and the effect of lymphoid and myeloid signalling pathways, plasma cytokines, and plasma chemokines.
Key findings
Baseline characteristics and disposition
• The median age was 56 years (range: 19–74), and 52% of patients were male.
• The median time from allogeneic transplant to diagnosis of cGVHD was 7.6 months (range: 1.5–76.0) and the median time from diagnosis to ibrutinib treatment was 13.7 months (range: 1.1–63.2).
• The majority of patients had cGVHD symptoms in the mouth (86%) or skin (81%).
• The majority of patients received nonmyeloablative transplants (57%).
• The majority of patients received peripheral stem cell transplants (88%).
• The indications for transplant were as follows: acute lymphoblastic leukemia (n = 9), acute myelogenous leukemia (n = 8), chronic lymphocytic leukemia (n = 7), chronic myelogenous leukemia (n = 3), myelofibrosis (n = 3), myelodysplastic syndrome (n = 3), Hodgkin lymphoma (n = 3), aplastic anemia (n = 2), T-cell prolymphocytic leukemia (n = 1), T-cell-type acute leukemia (n = 1), diffuse large B-cell lymphoma (n = 1), and acute promyeloid leukemia (n = 1).
• Patients received a median of two prior regimens for cGVHD (range: 1–3).
• The median dose of prednisone at enrolment was 0.3 mg/kg/day (range: 0.1–1.3).
Multicentre open-label phase II study of ibrutinib in chronic graft versus host disease after failure of corticosteroids
Miklos D, et al. ASH 2016:LBA-3

84 New Evidence in Oncology | April 2017
• All patients had previously received corticosteroids as thera-
py for cGVHD.
• After a median follow-up of 14 months, 12 patients (29%)
remained on ibrutinib.
Reasons for ibrutinib discontinuation included adverse
events (AEs) (33%), patient decision (14%), progression of
cGVHD (12%), investigator decision (5%), recurrence or
progression of original malignancy (5%), and noncompli-
ance with study drug (2%).
Efficacy
• Ibrutinib produced a high rate of response that was
sustained. (Figure 1)
One third of responders had a complete response, 79% of
whom had responded at the time of first response assess-
ment.
Of the 28 responders, 71% had a sustained cGVHD
response of at least five months.
• A total of 80% of patients with two or more involved organs
at baseline responded in at least two organs. (Figure 2)
Out of nine patients with three or more involved organs
at baseline, five (56%) responded in at least three organs.
• Overall, 26 patients (62%) achieved corticosteroid doses <0.15 mg/kg/day while on ibrutinib. (Figure 3)
Five responders were able to discontinue all corticosteroid treatment.
• Ibrutinib produced a clinically meaningful improvement in Lee symptom scale score among responders. (Figure 4)
Consistent with improvement in cGVHD symptoms, clinician-assessed and patient-reported reductions in overall cGVHD severity were also reported.
• Soluble plasma factors related to inflammation, fibrosis, and cGVHD decreased with ibrutinib.
• Functional blockade of Bruton’s tyrosine kinase and inter-leukin-2-inducible T-cell kinase was observed with ibrutinib.
Safety
• The AE profile showed largely low-grade events consistent with those reported for B-cell malignancies treated with ibrutinib and those observed in cGVHD patients on cortico-steroids. (Figure 5)
• Serious AEs occurred in 22 patients (52%) including pneu-monia (n = 6), septic shock (n = 2), and pyrexia (n = 2).
• Two fatal events occurred (multilobular pneumonia and bronchopulmonary aspergillosis).
cGVHD = chronic graft versus host disease; NIH = National Institute of Health
* Recommended phase II dose identified in phase I of the study.
Key eligibility criteria• Steroid dependent/refractory• ≤3 prior treatments for cGVHD• Other systemic
immunosuppressants, if used, were continued
• >25% body surface area NIH-defined criteria “erythematous rash” or >4 total mouth score by NIH-defined criteria
Patients with cGVHD who have failed frontline
therapy (N = 42)
Ibrutinib 420 mg* orally continued until progression of
cGVHD or unacceptable toxicity
Study design

New Evidence in Oncology | April 2017 85
Skin(n = 24)
Mouth(n = 24)
GI(n = 11)
Liver(n = 3)
88% 88%91%
67%
Res
po
nse
(%
)0
20
40
60
80
100
GI = gastrointestinal
Figure 2. Response by organ
0 4 8 12 16 20 24 28 32 36 40 44
Time (weeks)
CR/PR (n = 28)
SD/PD/Not assessed (n = 14)
48 52 56 0 4 8 12 16 20 24
Med
ian
wee
kly
aver
age
of d
aily
co
rtic
oste
roid
dos
e (m
g/k
g/d
ay)
0.00
0.10
0.20
0.30
0.40
0.50
CR = complete response; PD = progressive disease; PR = partial response; SD = stable disease
0.05
0.15
0.25
0.35
0.45
Figure 3. Corticosteroid doses during ibrutinib treatment
CRPR
9
19
72
SD PD
ORR = 67%
Res
pon
der
s (%
)
0
20
40
60
80
100
cGVHD = chronic graft versus host disease; CR = complete response; ORR = overall response rate; PD = progressive disease; PR = partial response; SD = stable disease* Five patients had no response assessment during the study but were included in the denominator.
N = 42*
Figure 1. Best of cGVHD response

86 New Evidence in Oncology | April 2017
Best responseMonth 6
43%
11%
61%
11%
CR/PR (n = 28)
SD/PD (n = 9)
Pati
ents
wit
h im
pro
vem
ent*
(
≥7 p
oin
t d
ecre
ase)
(%
)
0
40
80
100
CR = complete response; PD = progressive disease; PR = partial response; SD = stable disease* Five patients had no Lee symptom scale assessment during the study.
20
60
Figure 4. Improvement in Lee symptom scale score among responders
100 20 30 40 50 60 70 80 90 100
Grade 4
Grade 5
Grade 3
Grade 1
Grade 2
Patients (%)
Pneumonia
Muscle spasms
Diarrhea
Nausea
Upper respiratory tract infection
Pyrexia
Fall
Fatigue
Headache
Tendency to bruise
Figure 5. Treatment-emergent adverse events occurring in >15% of patients
• Ibrutinib resulted in clinically meaningful and sustained responses in patients who had failed at least one prior treatment for cGVHD.
• Patients experienced reductions in corticosteroid doses while on ibrutinib.
• Biomarker changes supported a beneficial effect of ibrutinib on cGVHD-related immune cell subsets.
• AEs were consistent with those previously reported for ibrutinib, and with those observed in patients with cGVHD on concomitant corticosteroids.
Key conclusions
References: 1. Dubovsky JA, Flynn R, Du J, et al. Ibrutinib treatment ameliorates murine chronic graft-versus-host disease. J Clin Invest 2014;124(111):4867–76. 2. Miklos D, Cutler CS, Arora M, et al. Multicenter open-label phase 2 study of ibrutinib in chronic graft versus host disease (cGVHD) after failure of corticosteroids. ASH Annual Meeting Abstracts 2016:LBA-3.

New Evidence in Oncology | April 2017 87

www.newevidence.com
Paul Borlinhat 416.503.0018
For details on media information, contact:Jobet Dimaculangan67 Mowat Ave, Suite 200, Toronto, Ontario, M6K 3E3t 416.503.1656 f [email protected]
Send ad materials to:
Oncology Advertising InformationNew Evidence is a medical publishing company focused on reporting data from
pivotal international research presented today that can impact practice tomorrow. Our issues feature perspectives and articles from key opinion leaders and interviews with international investigators. Our oncology issues are circulated to an extensive
database of oncology health care professionals across Canada.
Journal Trim Size• Final trim size of publication is 8 ½" × 11"• Allow bleed of 0.125" on all sides• Live matter should be kept to a minimum of a ½" inside
trimmed and binded edges
Production Details
• Binding: Perfect bound• Cover: Pacesetter Gloss 80lb cover
Inside pages: Pacesetter Gloss 60 lb text• Digital print
Digital Submission of Ads
• Formats accepted:High-resolution, print-ready PDF/X1aInDesign with supporting fonts and high-resolution (minimum 300 dpi) graphic files
• Files may be emailed, FTP’d (instructions available upon request), or submitted on CD-ROM or USB key
• Ad production/design, if required, is available and is billed in addition to advertising rates
Page size Trim Price
Full 8 ½" × 11" Colour$2,500.00
1/2 Horizontal 8 ½" × 5 ½" Colour
$1,250.00
1/2 Vertical 4 ¼" × 11" Colour
$1,250.00
1/4 4 ¼" × 5 ½" Colour$625.00
Product Monograph pages 8 ½" × 11" Black & White
$800.00
Electronic Banner Advertising RatesRotating banner ads will appear on the New Evidence website. Click-through rates are tracked and can be reported.
A. Leaderboard (728 x 90 px):• Rotate at top of home page and interior pages• $3,000 1-year contract
B. Medium Rectangle 1 (300 x 250 px):• Rotate at right side of home page and interior pages• $2,000 1-year contract
C. Medium Rectangle 2 (300 x 250 px):• Rotate at right side of home page and interior pages• $1,900 1-year contract
Ads must be submitted in GIF, JPG, or PNG format.
60,000+Users
2,800+Circulation
149,000+Page Views
A
B
C

www.newevidence.com
New Evidence in Oncology is an independent medical news reporting service providing educational updates on current medical events. Views expressed are those of the participants and do not necessarily reflect those of the publisher or the sponsors. Support for the development and distribution of this report was provided by Janssen and Lundbeck. Any therapies mentioned in this report should be used in accordance with the recognized prescribing information. No claims or endorsements are made for any products, uses, or doses presently under investigation. Information provided herein is not intended to serve as the sole basis for individual care. Our objective is to facilitate understanding of current trends in oncology for physicians and allied healthcare providers.
NEW EVIDENCE 67 MOWAT AVENUE, SUITE 200
TORONTO ON M6K 3E3