perspectives of water stress in cyprus iacovos iacovides water resources specialist european forum...
TRANSCRIPT

Perspectives of water stress
in Cyprus
Perspectives of water stress
in Cyprus
Iacovos IacovidesIacovos IacovidesWater Resources SpecialistWater Resources Specialist
European Forum Cyprus
"Cyprus without water? One island, one problem and some related challenges"
Barcelona - Nov. 13-16, 2008
Council of Europe European UnionConseil de l'Europe Union européenne
I.A.CO Environmental and Water Consultants LtdI.A.CO Environmental and Water Consultants Ltd 2
ContentsContents
Water Resources
Water Demands
Significant water management issues
Desertification
Drought

I.A.CO Environmental and Water Consultants LtdI.A.CO Environmental and Water Consultants Ltd 3
THE AVAILABILITY OF WATER RESOURCES THE AVAILABILITY OF WATER RESOURCES ISLAND-WIDE (1951-1981)ISLAND-WIDE (1951-1981)
Surface water 54%
Northern Part 30%
Groundwater 46%

I.A.CO Environmental and Water Consultants LtdI.A.CO Environmental and Water Consultants Ltd 4
THE AVAILABILITY OF WATER RESOURCES THE AVAILABILITY OF WATER RESOURCES AFTER 1970 (G.C. Southern part only (1970-2000))AFTER 1970 (G.C. Southern part only (1970-2000))
ANNUAL WATER SUPPLY 2860
EVAPOTRANSPIRATION EVAPOTRANSPIRATION (83%) 2370(83%) 2370BALANCE “USEABLE” 490
SURFACE WATER 295SURFACE WATER 295
GROUNDWATER 195 + 43GROUNDWATER 195 + 43
LOSSES LOSSES 160160
LOSSES LOSSES 102102
EXCESS EXCESS PUMPING -46PUMPING -46
DAM DAM RELEASES 125RELEASES 125
PUMPING & PUMPING & SPRINGS 124SPRINGS 124
DIVERSIONS DIVERSIONS 2525
AREA OF G.C. CYPRUS = 6153 km2
AVERAGE ANNUAL RAINFALL = 465 mm
TOTAL ANNUAL WATER SUPPLY = 2860 Mm3
83% EVAPOTRANSPIRATION = 2370 Mm3
BALANCE “USEABLE” = 490
SURFACE WATER 295
GROUNDWATER 195
490 490
River diversions = 25 Pumping =124 Use from dams = 125 Springs Aquifer recharge* = 43 Losses to sea = 160 Losses to sea = 102 Excess pumping = - 46 295 *238
Estimated >10% reduction

I.A.CO Environmental and Water Consultants LtdI.A.CO Environmental and Water Consultants Ltd 5
Troodos Mountains Rainfall Troodos Mountains Rainfall in 1917 - 1970 vs 1971 - 2000in 1917 - 1970 vs 1971 - 2000
-3
-2
-1
0
1
2
3
1915 1920 1925 1930 1935 1940 1945 1950 1955 1960 1965 1970 1975 1980 1985 1990 1995 2000 2005
m1
m1 - s1
m1 + s1
m2 + s2
m2 - s2
m2
Hydrological years
Reg
ion
al s
tan
dard
ised
an
nual
pre
cip
itat
ion
Data used to design the dams1917-1970
Recent observations1971-2000
m1, m2 : mean of the 1917-1970 and 1971-2000 periods
s1 , s2 : standard deviation of the 1917-1970 and 1971-2000 periods
YEAR OF DROP
CHANGE
-100 mm (15-25% less)
STATISTICAL ANALYSIS OF PRECIPITATION RECORDS (1916-2000) SHOWS A STEP CHANGE AROUND 1970. 100 mm lower than older period (or 15 to 25% )
Data used for the design of dams
Recent observations 1970-2000

I.A.CO Environmental and Water Consultants LtdI.A.CO Environmental and Water Consultants Ltd 6
Average annual rainfall (Southern-part)Average annual rainfall (Southern-part)
NOTICE THE DROP OF RAINFALL AT VARIOUS PERIODS:
1901-1970
541 mm
1971-2005
470 mm
1987-2008
453 mm

I.A.CO Environmental and Water Consultants LtdI.A.CO Environmental and Water Consultants Ltd 7
Relation between annual rainfall and inflow for Kouris dam
0
10
20
30
40
50
60
70
80
0 100 200 300 400 500 600 700 800 900 1000 1100
Kouris Dam : Annual Inflow vs. Annual Rainfall
an
nu
al in
flo
w in
mcm
annual rainfall in mm
Rain - 13 %
Flow - 34 %
Observed 1916/17-1969/70 mean Observed 1970/71-1999/2000 mean rainfall
Estimated 1916/17-1969/70 mean
Estimated 1970/71-1999/2000
Regresion curve
1970/71-1999/2000 annual observations
FLOW - 34%
RAIN-13%
Surface runoff reduction has been 20 to 60%

I.A.CO Environmental and Water Consultants LtdI.A.CO Environmental and Water Consultants Ltd 8
Inflow of water into dams (1987-2008)The decrease of inflow to dams varies between 24% and 58%. The island has roughly
40% less water than had been assumed based on pre-1970 records
I.A.CO Environmental and Water Consultants LtdI.A.CO Environmental and Water Consultants Ltd 9
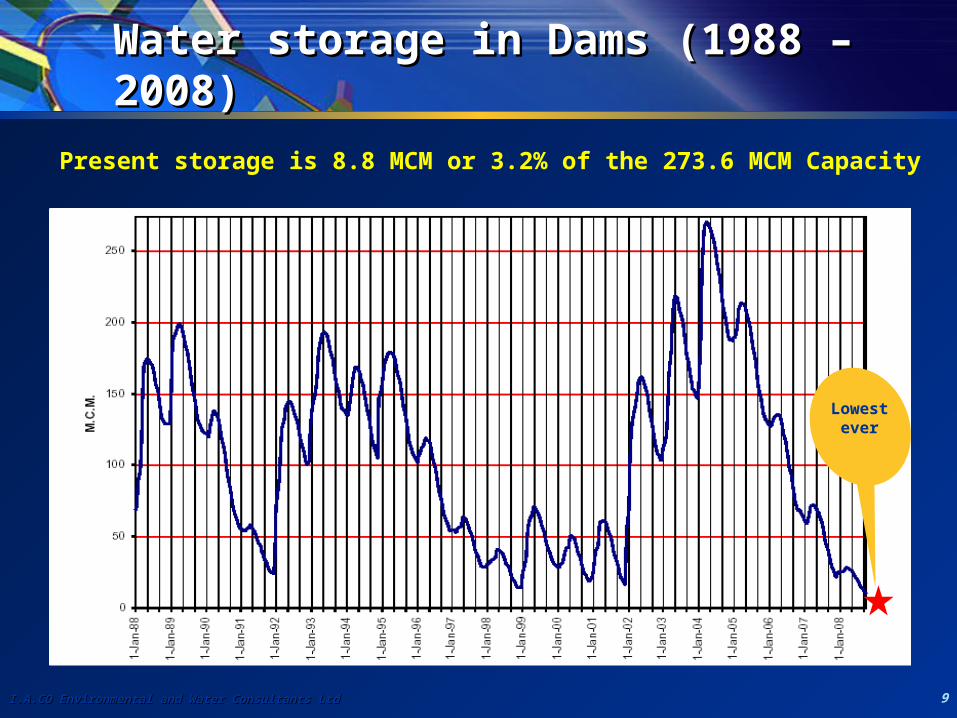
Water storage in Dams (1988 – 2008)Water storage in Dams (1988 – 2008)
Present storage is 8.8 MCM or 3.2% of the 273.6 MCM Capacity
Lowest ever

I.A.CO Environmental and Water Consultants LtdI.A.CO Environmental and Water Consultants Ltd 10
The Morphou coastal aquiferThe Morphou coastal aquifer
(after M. Ergil: Eastern Mediterranean University)(after M. Ergil: Eastern Mediterranean University)
meets the needs of the North (275 km2 45-100 m thick).
Aquifer annual safe yield in northern Cyprus is 74 MCM. But 29 MCM are over-extracted (UNDP 1970, DSI 2002).Surface water (13MCM) and dams (7) make the total potential to 94 MCMThus the water deficit of North Cyprus is about 12.5 million m3 (106.6 – 94.1)

I.A.CO Environmental and Water Consultants LtdI.A.CO Environmental and Water Consultants Ltd 11
Water transport from Turkey Water transport from Turkey (after G. Elgiran, M. Ergil, European Univ. Lefke)(after G. Elgiran, M. Ergil, European Univ. Lefke)
Water transported in large water bags (10000 to 30000 m3) towed by ship from Anamur Turkey to the coast of Morphou in the period of 1998-2002 amounted to 4.1 MCM.
TCM = Thousands m3

I.A.CO Environmental and Water Consultants LtdI.A.CO Environmental and Water Consultants Ltd 12
Use of water resources in northern part of Use of water resources in northern part of Cyprus (Cyprus (after World Bankafter World Bank))
Some 76% are used for irrigation and 2% for livestock

I.A.CO Environmental and Water Consultants LtdI.A.CO Environmental and Water Consultants Ltd 13
Options for solution of water problem in Options for solution of water problem in northern Cyprusnorthern Cyprus
Conversion of traditional irrigation methods to modern irrigation on 1400 ha of land in Morphou
Rehabilitation and use of treated wastewater Importation of 7 MCM from Turkey Transportation cost of water imported from Turkey to
Morphou by a tanker with a capacity of 40,000 m3 was found to be $0.79 per m3 (incl. infrastructure and port handling) (after H. Bicak & G. Jenkins, 1999).
Thus importation is competitive to desalination Leakage in the network (est. 30%) is the most important
variable affecting price of water. Water resource development needs to focus on increasing
the supply of potable water at the expense of irrigation.

I.A.CO Environmental and Water Consultants LtdI.A.CO Environmental and Water Consultants Ltd 14
Kokkinochoria aquifer water levels and Kokkinochoria aquifer water levels and sea intrusion (1994 -2000)sea intrusion (1994 -2000)
Hydr. No. LIO_469
Hydr. No. XFG_66
ParalimniLake
Achna Dam
5
kilometers
2.50
ACHNA
ORMIDEIA
XYLOTYMVOU
PERGAMOS
MAKRASYKA
GAIDOURAS
KONTEA
SINTA
KALOPSIDA
KOUKLIA
XYLOFAGOU
LIOPETRI
AVGOROU
FRENAROS
ACHERITOU
AMMOCHOSTOS
AGIA NAPA
PARALIMNI
DERYNEIA
SOTIRA
Green Line
Green Line
Green Line
Green Line
Green Line
Green Line
Green Line
Green Line
Green Line
Green Line
Green Line
Green Line
Green Line
Green Line
Green Line
Green Line
Green Line
Green Line
40
20
60
-200
-40
-20
0
20
-40
-20
400
20
-40
-40
-20
0
100
60
80
20
40
0 -40-200
Hydr. No. LIO_469
Hydr. No. XFG_66
ParalimniLake
Achna Dam
5
kilometers
2.50
ACHNA
ORMIDEIA
XYLOTYMVOU
PERGAMOS
MAKRASYKA
GAIDOURAS
KONTEA
SINTA
KALOPSIDA
KOUKLIA
XYLOFAGOU
LIOPETRI
AVGOROU
FRENAROS
ACHERITOU
AMMOCHOSTOS
AGIA NAPA
PARALIMNI
DERYNEIA
SOTIRA
Green Line
Green Line
Green Line
Green Line
Green Line
Green Line
Green Line
Green Line
Green Line
Green Line
Green Line
Green Line
Green Line
Green Line
Green Line
Green Line
Green Line
Green Line
500 500
300
1,000
500
300
300
500
1,000
> - 40 m 500 mg/l

I.A.CO Environmental and Water Consultants LtdI.A.CO Environmental and Water Consultants Ltd 15
Akrotiri Aquifer: sea intrusion 2001Akrotiri Aquifer: sea intrusion 2001
Hydr. No. 775
ERIMI
KOLOSSIEPISKOPI
KANTOU
AKROTIRI
ASOMATOS
TRACHONI
YPSONAS
TSERKEZOI
MESA GEITONIAPANO POLEMIDIA
KATO POLEMIDIA
LEMESOS
Akrotiri Salt LakeAkrotiri Salt LakeAkrotiri Salt LakeAkrotiri Salt LakeAkrotiri Salt LakeAkrotiri Salt LakeAkrotiri Salt LakeAkrotiri Salt LakeAkrotiri Salt Lake
Ko
uris River
Ko
uris River
Ko
uris River
Ko
uris River
Ko
uris River
Ko
uris River
Ko
uris River
Ko
uris River
Ko
uris River
Garyllis R
iver
Garyllis R
iver
Garyllis R
iver
Garyllis R
iver
Garyllis R
iver
Garyllis R
iver
Garyllis R
iver
Garyllis R
iver
Garyllis R
iver
42
kilometers
0
100010001000100010001000100010001000
250250250250250250250250250
500500500500500500500500500
400
400
400
400
400
400
400
400
400
400400400400400400400400400
200200200200200200200200200
250250250250250250250250250
5005005005005005005005005001000
100010001000100010001000100010001500
15001500150015001500150015001500
200020002000200020002000200020002000
300030003000300030003000300030003000
4000400040004000400040004000400040007000
70007000700070007000700070007000
-4
-3
-2
-1
0
1
2
3
4
No
v-6
1
No
v-66
No
v-71
No
v-7
6
No
v-81
No
v-8
6
No
v-91
No
v-9
6
No
v-0
1
WA
TE
R L
EV
EL
(m
ams
l)
TREND
Hydrograph of borehole 775 (Elev. 15.63 m amsl) 1961-2001
500 mg/l

I.A.CO Environmental and Water Consultants LtdI.A.CO Environmental and Water Consultants Ltd 16
Water Demand in southern part of CyprusWater Demand in southern part of Cyprus
Distribution of Water Demand from various Sectors - Year 2000
Industry1%
Environment5%
Tourism5%
Domestic excl. Tourism
20%
Agriculture69%
Some 69% goes to agriculture (182 MCM). Domestic accounts for 25% or 67.5 MCM (Only 5% goes to Tourism).
Distribution of Agricultural Water Demand
Animal Husbandry
4%
Major Government Water Schemes
55%
Areas Outside the Government
Water Schemes41%
02468
1012141618
Wat
er D
eman
d M
CM
Amm
ocho
stos
*
Larn
aca
Lefk
osia
Lem
esos
Pafos
All Villa
ges
British
Bas
es
Turk
ish S
ecto
r / L
efko
sia
Water Demand of Residents and Tourists - Year 2000
Resident Tourist
RESIDENTIALTOURISM

I.A.CO Environmental and Water Consultants LtdI.A.CO Environmental and Water Consultants Ltd 17
Supply of water from GWWs (1991-2007)Supply of water from GWWs (1991-2007)
Note the steady increase in domestic demand;
Irrigation demand steady but variable according to supply availability

I.A.CO Environmental and Water Consultants LtdI.A.CO Environmental and Water Consultants Ltd 18
Domestic water supply sources (GWWs) Domestic water supply sources (GWWs) (1991-2007)(1991-2007)
Desalination became a new source of supply after 1997 and 2001

I.A.CO Environmental and Water Consultants LtdI.A.CO Environmental and Water Consultants Ltd 19
Irrigation water supply sources (GWWs) Irrigation water supply sources (GWWs) 1991-20071991-2007
Reuse of tertiary treated effluent for irrigation is the new added source; supply variable according to water availability; Better management for reliable but lesser quantities/ year

I.A.CO Environmental and Water Consultants LtdI.A.CO Environmental and Water Consultants Ltd 20
Significant Water Management IssuesSignificant Water Management Issues
Over-exploitation of groundwaters Hydromorphological pressures and quantity – flow of
surface waters (degradation of natural characteristics) Pollution:
Agricultural Urban Other sources (industry, mining, rainwater run-off)
Conservation of protected areas and significant hydrophilous ecosystems
Other issues Administrative issues Water pricing (Financial + Resource + Environmental Cost)
Pressures on coastal water bodies

I.A.CO Environmental and Water Consultants LtdI.A.CO Environmental and Water Consultants Ltd 21
Significant Water Management Issues Significant Water Management Issues ((continuedcontinued))
Desalination (costs relying on imported fossil fuels (0.92 Euro/m3 for Dhekelia and 0.68 for Larnaka) – Intensive use of energy: impact on the environment (indirect greenhouse gas emissions (GHG))
Import of water from Greece or elsewhere (high cost about 5 Euro/m3)
Water Demand Management Reduction of agriculture for the benefit of domestic
supply Control of leakages from distribution networks Developing water awareness Combating desertification Water Scarcity and Drought

I.A.CO Environmental and Water Consultants LtdI.A.CO Environmental and Water Consultants Ltd 22
Desertification is …Desertification is …
Soil losing its productive capacitySoil losing its productive capacity
I.A.CO Environmental and Water Consultants LtdI.A.CO Environmental and Water Consultants Ltd 23
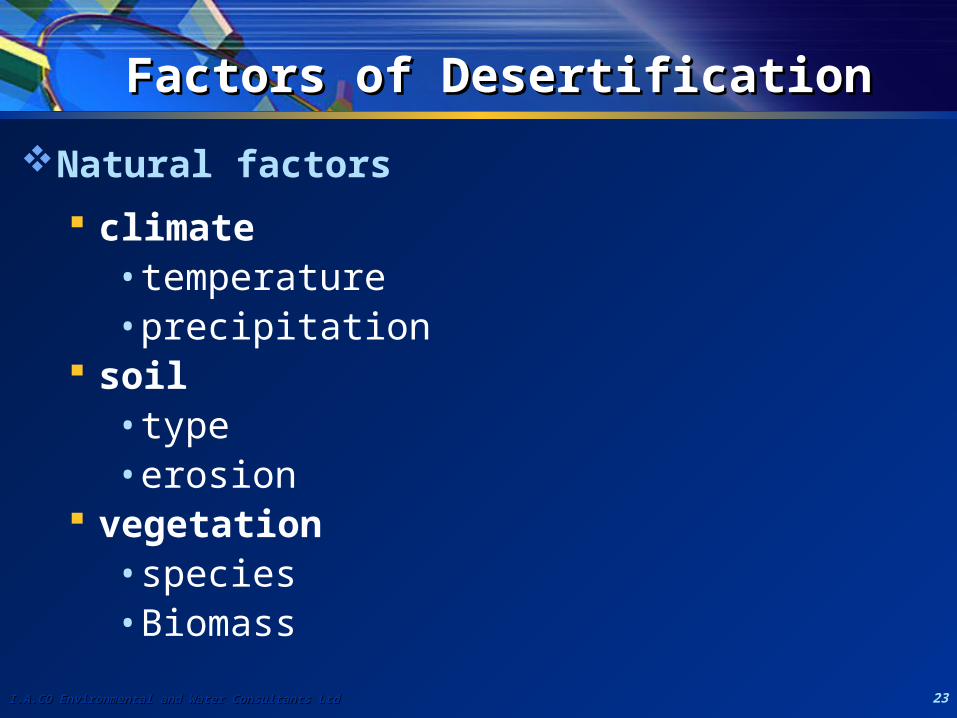
Factors of DesertificationFactors of Desertification
Natural factors
climate • temperature• precipitation
soil • type • erosion
vegetation• species• Biomass

I.A.CO Environmental and Water Consultants LtdI.A.CO Environmental and Water Consultants Ltd 24
Over mining
Overgrazing
Population increasing
Fires & Deforestation
Human factors
Factors of DesertificationFactors of Desertification

I.A.CO Environmental and Water Consultants LtdI.A.CO Environmental and Water Consultants Ltd 25
Desertification conditions in Cyprus Desertification conditions in Cyprus as per UNESCO/FAO classificationas per UNESCO/FAO classification

I.A.CO Environmental and Water Consultants LtdI.A.CO Environmental and Water Consultants Ltd 26
Effect of Climate Change to DesertificationEffect of Climate Change to Desertification
Under climate change desertification INCREASE by 23.5%
Sensitivity Class Index Range
% of land
(under Present conditions)
% of land
(under Climate Change Scenario
– 85% ppt & 1.3°C)
Critical 1.38 to >1.53 57.0 70.4
Sensitive 1.23 to 1.37 42.3 29.5
Potential 1.17 to 1.22 0.7 0.1
Non-affected <1.17 0 0

I.A.CO Environmental and Water Consultants LtdI.A.CO Environmental and Water Consultants Ltd 27
Sensitive areas to DESERTIFICATION: Sensitive areas to DESERTIFICATION: Present conditionsPresent conditions
Critical 57%
Fragile 42.3%

I.A.CO Environmental and Water Consultants LtdI.A.CO Environmental and Water Consultants Ltd 28
Sensitive areas to DESERTIFICATION: Sensitive areas to DESERTIFICATION: Climate ChangeClimate Change
Critical 70.4%
Fragile 29.5%
Scenario: 15% less rainfall and temperature increase by 1.3°C

I.A.CO Environmental and Water Consultants LtdI.A.CO Environmental and Water Consultants Ltd 29
Drought is …Drought is …
Lack of precipitationLack of precipitation
and/orand/or
A period of water shortageA period of water shortage

I.A.CO Environmental and Water Consultants LtdI.A.CO Environmental and Water Consultants Ltd 30
Drought is…Drought is…
WaterDemand
WaterSupply
There is 20% probability that annual rainfall could be 390-470
mm (drier years) and/or <390 mm (driest years)
Drought is a normal, repetitive climatologic feature

I.A.CO Environmental and Water Consultants LtdI.A.CO Environmental and Water Consultants Ltd 31
Trends in recorded rainfall and runoffTrends in recorded rainfall and runoff
Rainfall: Statistical analysis over 1916/1917-1999/2000 shows that the
precipitation displays a step change around 1970. For 1916/1917 to 1969/70 no trend can be detected. For 1970/1971 to 1999/2000 a slight decreasing trend but not
significant is noted. For areas of elevation higher than 500 m, the mean annual
precipitation in the recent period is lower by 100 mm or more than the mean of the older period (or 15% -25%)
There is no proof that this decrease is due to global climate change, but this possibility is not necessarily excluded.
Runoff: The lower rainfall has caused a significant reduction in the water
available on the island as compared to the pre-1970 records. Decreases in runoff for all the dams after 1970 with respect to the
older time series vary between 20 and 60 percent. (13% reduction in ppt results to 34% reduction in runoff for Kouris)

I.A.CO Environmental and Water Consultants LtdI.A.CO Environmental and Water Consultants Ltd 32
Trends in DemandTrends in Demand
Demand: Already the demand is much higher than the supply and is
rising. New sources of water are scarce or very expensive. Water demand management through proper water pricing and reduction of agriculture need to be seriously considered if we are to maintain the acquired standard of living and combat desertification.
Conditions are likely to become worse if the scenarios for Climate Change materialize.
