perspectives on agriculture in a commodity · pdf fileperspectives on agriculture in a...
TRANSCRIPT

Perspectives on Agriculture in a
Commodity Downturn
December 7, 2015
Presented by: Dan Kowalski, Director of Industry ResearchKnowledge Exchange Division, CoBank, ACBE-mail: [email protected]
51st Colorado Business Economic Outlook Forum
Denver, CO
All slides are property of Knowledge Exchange Division, CoBank, ACB (confidential and proprietary).

This is what the media has been telling us about commodities. Is it this simple?
2
March 18, 2015
September 3, 2014
December 30, 2014
March 10, 2015
May 5, 2015

At first glance the Dollar is to blame for commodity price woes
3
U.S. Dollar Index24% from 2014 low;now at 13-year high
S&P GSCI Commodity Index50% from 2014 high
Source: Bloomberg

But the commodity sectors have not all performed the same
4
40
60
80
100
120S&P Commodity Price Indices
Source: Bloomberg
Energy
Ag crops
Industrial Metals
Ag livestock

And individual commodity prices have moved in a wide range
5
40
50
60
70
80
90
100
110
120
130Index of Commodity Prices and the U.S. Dollar
US Dollar Index
CopperGold
AluminumCoalSilver
NatGasWTI
CornSoybeansWheat
CottonRice#16 Sugar
Live CattleLean Hogs
Class 3 Milk
Source: Bloomberg
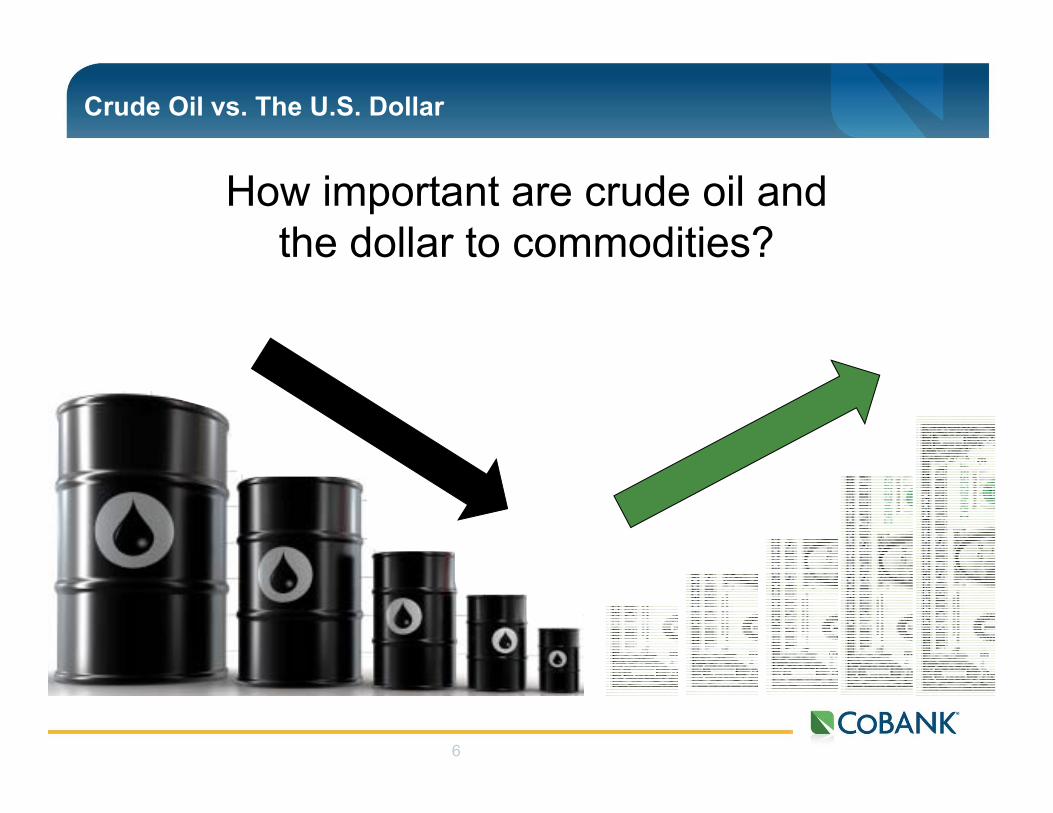
Crude Oil vs. The U.S. Dollar
6
How important are crude oil and the dollar to commodities?

Several commodities have had a strong inverse correlation with the dollar, but others are far less correlated
7
-1
-0.8
-0.6
-0.4
-0.2
0
0.2
1 Year Correlation with US Dollar Index
Sources: CoBank, Bloomberg
0 = No Correlation1 = Perfect Correlation

Several commodities have also been strongly correlated with crude oil, but not all
8
-1.0
-0.7
-0.3
0.0
0.3
0.7
1.0
1 Year Correlation with Crude Oil Prices
Sources: CoBank, Bloomberg
0 = No Correlation1 = Perfect Correlation

How important is China to commodities?
9Sources: WSJ, NY Times

China has a disproportionate impact on metals prices
10
Agriculture – China consumes: 52% of the world’s pork 31% of the world’s cotton 31% of the world’s rice 29% of the world’ soybeans
Energy – China consumes: 12% of the world’s oil 48% of the world’s coal
Metals – China consumes: 40% of the world’s copper 50% of the world’s iron
ore
All 3 sectors are fueled by the rising middle class
But ag and energy consumption continue higher without declines
Metals consumption has fallen since 2014 as China’s economic expansion has slowed
Sources: USDA, BP, WSJ, Censere

China’s GDP has been on a steady decline, dropping to the lowest level since the worst of the financial crisis
11
0
2
4
6
8
10
12
2000
2000
2001
2001
2002
2002
2003
2003
2004
2004
2005
2005
2006
2006
2007
2007
2008
2008
2009
2009
2010
2010
2011
2011
2012
2012
2013
2013
2014
2014
YoY % Change China GDP
Source: China Natl Bureau of Statistics, Economist
The transition from an export-ledeconomy to a consumer-led economy has been bumpy

China’s debt problem - $26 trillion increase since 2000
12
ChinaDebt-to-GDP ratio (%)
Total debt ($ Trillion)
Sources: IMF, McKinsey, WSJ

But despite all the bad news, urban Chinese have more money to spend
13
0
1000
2000
3000
4000
5000
6000
7000
8000
9000
Chinese yuanChina Urban Household Disposable Income (Q3)
Source: National Bureau of Statistics of China

…and they are using some of that extra income to buy pricier food
14
-15%
-10%
-5%
0%
5%
10%
15%
2005 2006 2007 2008 2009 2010 2011 2012 2013 2014 2015*(Thru1H)
China Urban Household 'Real' Food Spending (Year-over-Year)
Source: National Bureau of Statistics of China

Summary: Macro forces are affecting commodities..but the effects vary significantly
15
Macro forces are having disparate effects on commodities Heavy effect on metals (Loss of China growth as production has
increased) Some effect on energy (slow economic growth, slow growth in
energy consumption; but more supply-driven than weak demand) Much less effect on ag (slow econ growth slows EM wealth effect
for meat/dairy, but this is much less pronounced than metals and energy; A supply rebuild story)
Source: CoBank, Cagle

Outlook: Strong dollar and higher interest rates won’t help commodities
16
The dollar is having some effect on all commodities
Outlook for the USD – will remain high in 2016
Fed rate hike; Euro QE, slow growth; Japan easy monetary policy, stimulus; China weakness
Interest rate increases are good for banks, usually not for commodities
Check out CoBank’s 2012 Outlook report

Agricultural commodity outlook
17
Some buying interest likely to return to some commodities in anticipation of supply peak, especially if inflation returns
Ag price volatility will remain lower than past several years with large supplies slow to recede; Cattle is the exception
China economy to struggle, with heavy debt burden, excess capacity, and slower gains from consumer vs. industry. But ag consumption will continue to increase.

Agricultural Supply & Demand
18Sources: UC Davis, NY Times, CoBank

Global ag consumption moved consistently higher through the economic crisis; demand has not been a problem
19
90
100
110
120
130
140
2008 2009 2010 2011 2012 2013 2014 2015
IndexWorld Consumption
CornMilkBeefPorkSoybeansChickenRiceWheat
Sources: CoBank, USDA

0
100
200
300
400
500
600
700
800
MMT Equiv U.S. Agricultural Supply
Wheat
Chicken
Soybeans
Pork
Beef
Milk
Corn
We have transitioned: Demand to supply driven market
20Source: USDA

Most ag markets are oversupplied; 2013 was a historic supply build year for corn
21
-50 0 50 100 150 200
1977-78
2004-05
2007-08
1975-76
2006-07
1985-86
1984-85
1978-79
2012-13
2013-14
MMT
Largest Consecutive Year Increases in World Corn Supply
Sources: CoBank, USDA

The combination of 2013 and 2014 soybean supply increases have swamped the market
22
0 10 20 30 40 50 60 70 80
2001-02
2000-01
1997-98
1977-78
2005-06
2012-13
2004-05
2014-15
2009-10
2013-14
MMT
Largest Consecutive Year Increases in World Soybean Supply
Sources: CoBank, USDA

Same story in dairy: 2015 will be the 3rd consecutive year of significant supply increase
23
0 5 10 15 20 25 30 35 40 45 50
2001-02
1983-84
2002-03
2010-11
2013-14
2011-12
2014-15
1966-67
1982-83
1965-66
MMT
Largest Consecutive Increases in World Milk Supply
Sources: CoBank, USDA

The pork supply increase is a domestic story, but historic nonetheless and caused prices to crater in late 2014
24
0 200 400 600 800 1,000 1,200
1974
1992
1980
2008
1988
1967
1971
2015
1998
1979
Thou MT
Largest 1-Year Increases in U.S. Pork Supply
Sources: CoBank, USDA

Domestic rice supplies increased 11% in 2014; Prices over the past year have fallen 33%
25
0 200 400 600 800 1,000 1,200
2010/11
1976/77
1992/93
1974/75
1978/79
2014/15
2001/02
1981/82
2004/05
1994/95
Thou MT
Largest 1-Year Increases in U.S. Rice Supply
Sources: CoBank, USDA

Price volatility has been record high over the past decade; Will it subside for Colorado ag commodities?
26
50
100
150
200
250
300
D-09 D-10 D-11 D-12 D-13 D-14 D-15
Futures Price Index
CornWheatLive CattleFeeder CattleMilk Class 3Lean Hogs

Corn
27Source: Informa

Wheat
28Source: Informa

Meat supplies are rising; Cattle and beef prices next to fall
29
0
10
20
30
40
50
60
70
80
90
100
2012 2013 2014 2015 2016 2017
Bil Lbs
U.S. Meat and Poultry Production
Beef Pork BroilerSource: Livestock Marketing and Information Center

Dairy
30
Colorado has the fastest growing milk supply of any state in 2015
Source: Informa
Questions?
December 7, 2015
Presented by: Dan Kowalski, Director of Industry ResearchKnowledge Exchange Division, CoBank, ACBE-mail: [email protected]
51st Colorado Business Economic Outlook Forum
Denver, CO