perspectives on health and social policy m6920 september 4, 2001
TRANSCRIPT
Perspectives on health and social policy
M6920September 4, 2001

Columbia University School of Nursing M6920, Fall, 2001
T E X T V E R S IO N O R G A N IZ A T IO N A L C H A R T
> C O M M E N T S & S U G G E S T IO N S < > P R IV A C Y P O L IC Y < >F R E E D O M O F IN F O R M A T IO N A C T <
L A S T R E V IS E D : T U E S D A Y , S E P T E M B E R 2 8 , 1 9 9 9 Attitude toward government:
Society is produced by our wants, and government by our wickedness; the former promotes our happiness positively by uniting our affections; the latter negatively by restraining our vices. . . . government even in its best state is but a necessary evil.
• Thomas Paine, Common Sense, 1776

Columbia University School of Nursing M6920, Fall, 2001
What is policy?
A decision on how to allocate resources to accomplish a purpose
Ideally, it is deliberately adopted after a review of alternatives, and it is intended to be followed.

Columbia University School of Nursing M6920, Fall, 2001
Health policy decisions
are supposed to support health direct response when health is
threatened direct response to treat or cure illness response when beneficiary of current
policy is threatened organize and pay for intended benefits

Columbia University School of Nursing M6920, Fall, 2001
Social policy decisions
are about our life as a community• education • housing• recreation • work
affect how groups relate to one another affect the economic welfare of groups

Columbia University School of Nursing M6920, Fall, 2001
Policy actors
the body politic the intended beneficiaries the stated beneficiaries the managers or organizers the decision-makers

Columbia University School of Nursing M6920, Fall, 2001
Time and place
may be immediate, short term or long term
may be neighborhood, city, state, region, nation, global

Columbia University School of Nursing M6920, Fall, 2001
Population perspective
“Vulnerable population” is for some reason at higher risk of problems, even though • not all members of the population will
experience the problem, and • others outside the population will experience
the problem

Columbia University School of Nursing M6920, Fall, 2001
Possible reasons for vulnerability
Social prejudice• racism• age-ism• able-ism• genderism
geography economics

Columbia University School of Nursing M6920, Fall, 2001
Healthy People 2000 Targets
46%
18%
10%
26%
RightDirection
WrongDirection
No Change
No Data
51%
30%
3%
16%
Total Population Total Population (319 Targets)(319 Targets) Special Populations Special Populations (210 Targets)(210 Targets)

Columbia University School of Nursing M6920, Fall, 2001
Special populations are defined by
Race/Ethnicity Gender SES Disabilities

Columbia University School of Nursing M6920, Fall, 2001
0
20
40
60
80
100
1936
946
1956
1966
1976
1986
1996
Year
Ave
rag
e ag
e at
dea
th
Both Sexes
Male
Female
Changes in life expectancy
Columbia University School of Nursing M6920, Fall, 2001
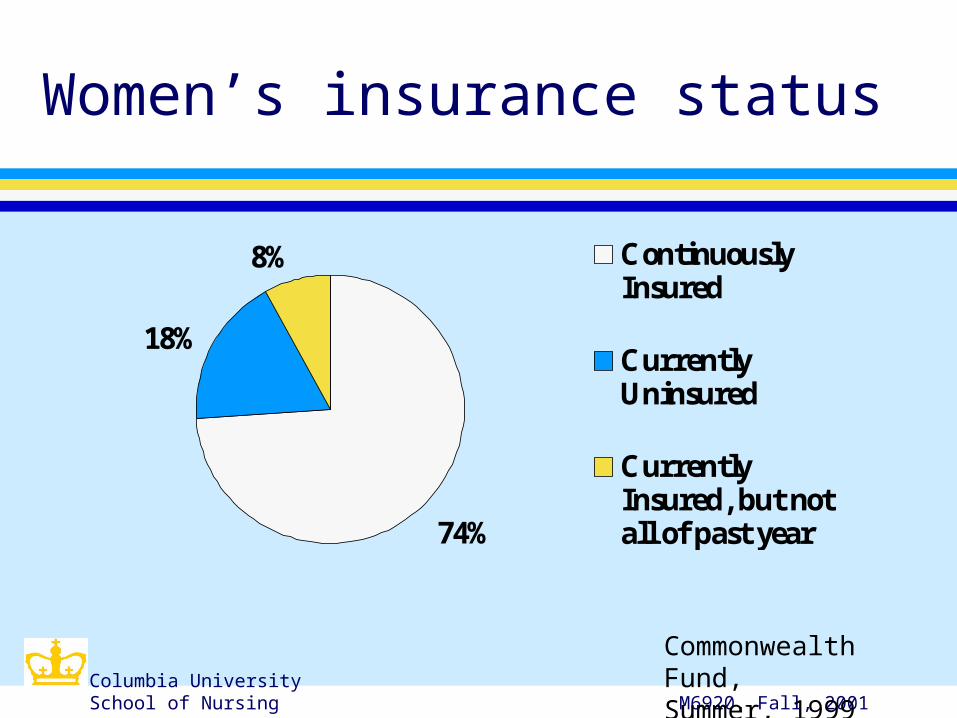
74%
18%
8% ContinuouslyInsured
CurrentlyUninsured
CurrentlyInsured, but notall of past year
Commonwealth Fund, Summer, 1999
Women’s insurance status

Columbia University School of Nursing M6920, Fall, 2001
0% 20% 40% 60%
% r
ep
ortin
g b
arrie
rs to c
are
CurrentlyUninsured
CurrentlyInsured, but notall of past yearContinuouslyInsured
All Women
Commonwealth Fund, Summer, 1999
Insurance and barriers

Columbia University School of Nursing M6920, Fall, 2001
3%
40%
45%
1%
11%
In Community,Under 18In Community,18-64In Community,65 and overNursing Home,under 65Nursing Home,65 and over
Commonwealth Fund, Summer, 1999
Long term care population
In Millions

Columbia University School of Nursing M6920, Fall, 2001
0
10
20
30
40
50
60
70
80
Percen
tag
e
WhiteAll MinorityBlackHispanic
MMWR, January 14, 2000
AIDS Cases/ MSM

Columbia University School of Nursing M6920, Fall, 2001
AIDS Cases Reported in 1999 and Estimated 1999
White, not HispanicBlack, not HispanicHispanic
Asian/Pacific IslanderAmerican Indian/ Alaska Native
*Includes 120 persons with unknown race/ethnicity
4%
1%
71%
12%13%
AIDS Cases
N=46,400*
PopulationN=277,200,000
<1%1%
32%
47%19%
Columbia University School of Nursing M6920, Fall, 2001
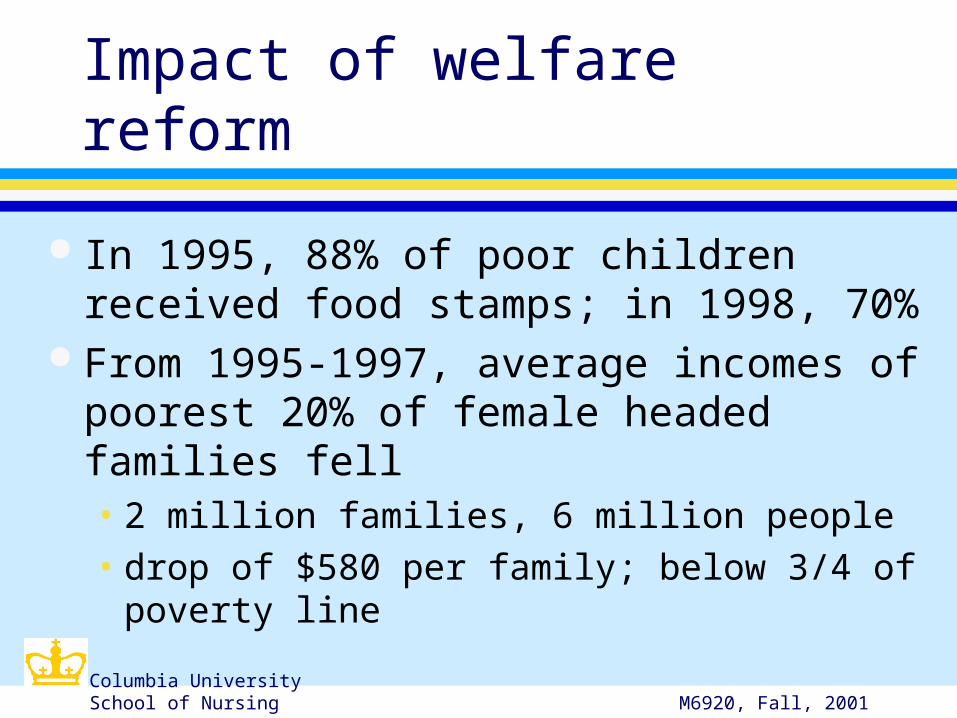
Impact of welfare reform
In 1995, 88% of poor children received food stamps; in 1998, 70%
From 1995-1997, average incomes of poorest 20% of female headed families fell• 2 million families, 6 million people• drop of $580 per family; below 3/4 of
poverty line

Columbia University School of Nursing M6920, Fall, 2001
Welfare Reform and Insurance Coverage
0%
10%
20%
30%
40%
50%
60%
70%
% uninsured (below 200% FPL)
Adults belowpoverty
Children belowpoverty
Adults 100-200%FPL
Children 100-200%FPL
Families USA Chartbook

Columbia University School of Nursing M6920, Fall, 2001
2000 Poverty Guidelines
1 $ 8,3502 11,2503 14,1504 17,0505 19,9506 22,850Each additional Add $2,900
Size of Family Income Guideline

Columbia University School of Nursing M6920, Fall, 2001
Poverty in New York City
10,34414,15016,478
46,83650,600
$0
$10,000
$20,000
$30,000
$40,000
$50,000
$60,000
Income
Welfare & foodstamps, family of 3
Federal povertylevel, family of 3
Full-time minimumwage
Self-sufficiencywage/Queens, familyof 3Median NYC familyof 3
NY Times. 9/13/2000. Pg. B1

Columbia University School of Nursing M6920, Fall, 2001
% non-elderly uninsured
0
5
10
15
20
25
30
US NY State NY City
1990
1998
United Hospital Fund, March, 2000

Columbia University School of Nursing M6920, Fall, 2001
%Uninsured by race, ethnicity
0
5
10
15
20
25
30
35
1990 1998
WhiteAfrican-AmericanHispanic
United Hospital Fund, March, 2000

Columbia University School of Nursing M6920, Fall, 2001
Public coverage for children
0
200,000
400,000
600,000
800,000
1,000,000
1,200,000
1,400,000
1,600,000
1994 1995 1996 1997 1998 1999
MedicaidCHP
United Hospital Fund, March, 2000

Columbia University School of Nursing M6920, Fall, 2001
Percentage of Medicare Recipients, by age
0%
10%
20%
30%
40%
50%
60%
70%
80%
65-74 75-84 85 and up
MenWomen

Columbia University School of Nursing M6920, Fall, 2001
Medicare Recipients with Income $10,000/yr.
0%
10%
20%
30%
40%
50%
60%
65-84 85 and up
MenWomen

Columbia University School of Nursing M6920, Fall, 2001
Income disparity
Top 1% (2.7 million people) has as much to spend as the bottom 40% (100 million people)
The top 1/5 has 50.4% of income. The top 1/5 has had a 15% income
increase while the bottom 1/5 has had a 10% income increase
Columbia University School of Nursing M6920, Fall, 2001
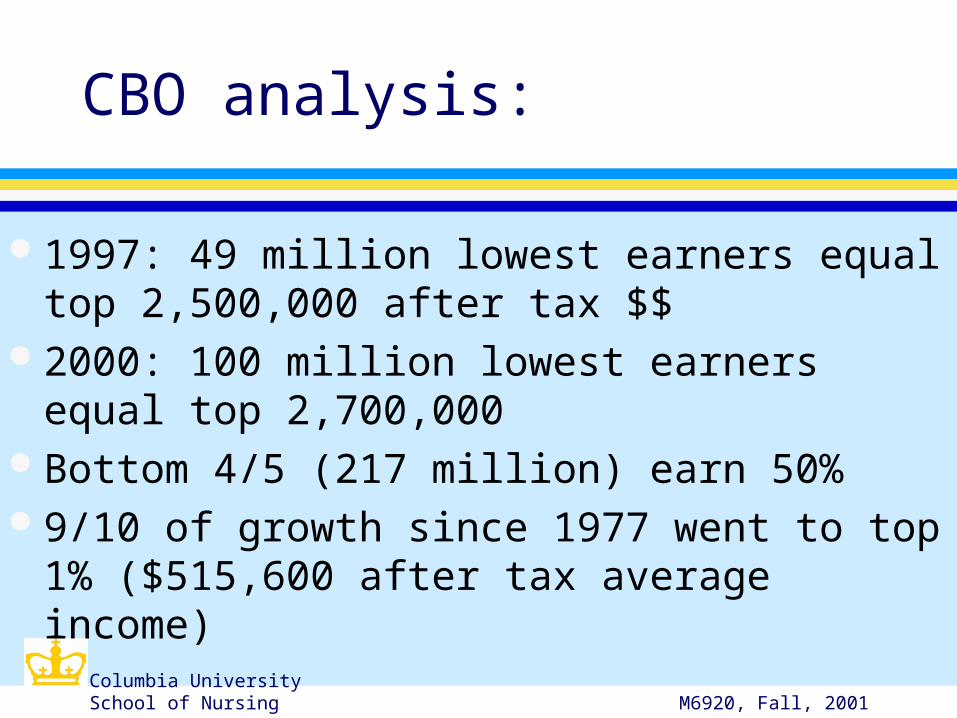
CBO analysis:
1997: 49 million lowest earners equal top 2,500,000 after tax $$
2000: 100 million lowest earners equal top 2,700,000
Bottom 4/5 (217 million) earn 50% 9/10 of growth since 1977 went to top 1%
($515,600 after tax average income)
Columbia University School of Nursing M6920, Fall, 2001
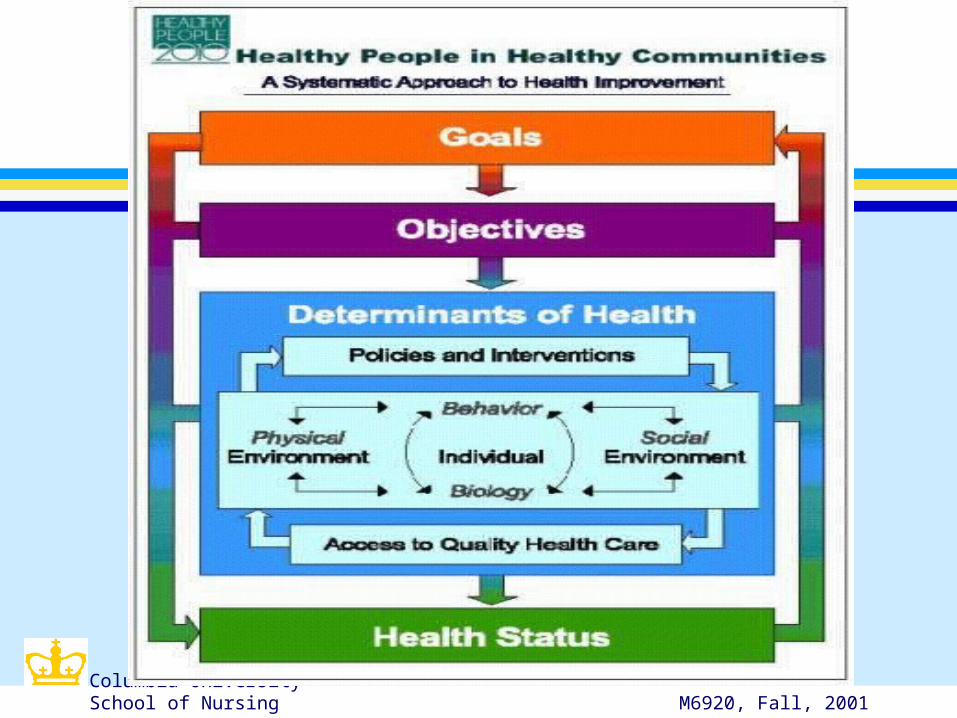
HP2010: a policy example
The development of national health objectives is almost a policy-setting process
The model builds on an the determinants of health model
The national goals attempt to minimize threats to the health of vulnerable populations.
Columbia University School of Nursing M6920, Fall, 2001

Columbia University School of Nursing M6920, Fall, 2001
Questions for this course:
What current policies are having a positive impact on health?
What current policies are having a negative impact on health?
What policy conflicts affect our ability to improve health?
What do I want to do to have an impact on policies?

Columbia University School of Nursing M6920, Fall, 2001
Next week:
Determinants of health Vulnerable populations in the
Unites States