perspectives on retail and supply chain trends in asia services limited- retail and... ·...
TRANSCRIPT

Perspectives on retail and supply chain trends in AsiaMay 2016
Fred Lemoine-Weave Services Limited

2
$10 trillion USD
by 2018

3
Asia pacific region is set to contribute to the highest retail income globally …
Source: pwchk.com.hk/webmedia/doc/635593364676310538_rc_outlook_201516.pdf
6 6.3 6.4 6.8 7.6 8.4 9.3 10.3
0
5
10
15
20
25Asia & Australasia Latin America Middle East , Nth Africa North America Western Europe World
2011 2012 2013 2014 2015 2016 2017 2018
Global retail sales by major geographies
USD-Trillions
4
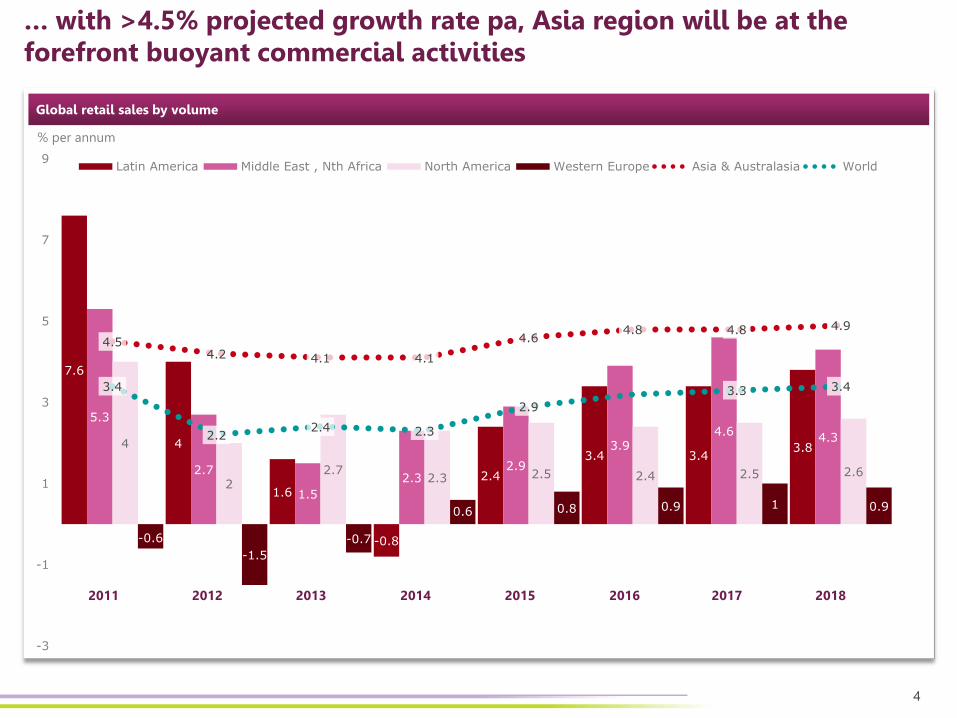
% per annum
7.6
4
1.6
-0.8
2.4
3.4 3.43.8
5.3
2.7
1.5
2.32.9
3.94.6
4.34
22.7
2.3 2.5 2.4 2.5 2.6
-0.6
-1.5
-0.7
0.6 0.8 0.9 1 0.9
4.54.2 4.1 4.1
4.64.8 4.8 4.9
3.4
2.22.4 2.3
2.9
3.3 3.4
-3
-1
1
3
5
7
9Latin America Middle East , Nth Africa North America Western Europe Asia & Australasia World
2011 2012 2013 2014 2015 2016 2017 2018
… with >4.5% projected growth rate pa, Asia region will be at the forefront buoyant commercial activities
Global retail sales by volume

5
4 major consumer-led trends are transforming the industry and supply chain strategies
Illustrations Major consumer-led trends
• Fast-fashion pushes a greater need for value-for-money goods delivered in record times
• Emerging manufacturing markets have flourishing consumer market of their own e.g. CN-4CN, India-4-India
• O2O is removing all physical barriers of the shopping experience
• Consumer behaviors are characterized by viral trends often set within virtual communities

6
3 emerging trends are dominating the boardrooms
“Low hanging
fruits” offered by
classic
procurement
strategies are fast
running out |of
steam
0 20 40 60
Reducing operating costs
Reducing overall inventory levels
Improving the quality of products or services
Improving customer service
Getting products or services to market faster
Reducing capital costs
Reducing risk
Reducing carbon footprint/creating greener supply chain
% of respondents, n=639
Challenges ahead for supply chains-Industry survey
-21
-18
+4
+15
+13
-7
+2
+13
Last 3 years Next 5 years New trends
Source: mckinsey.com/business-functions/operations/our-insights/the-challenges-ahead-for-supply-chains-mckinsey-global-survey-results
7
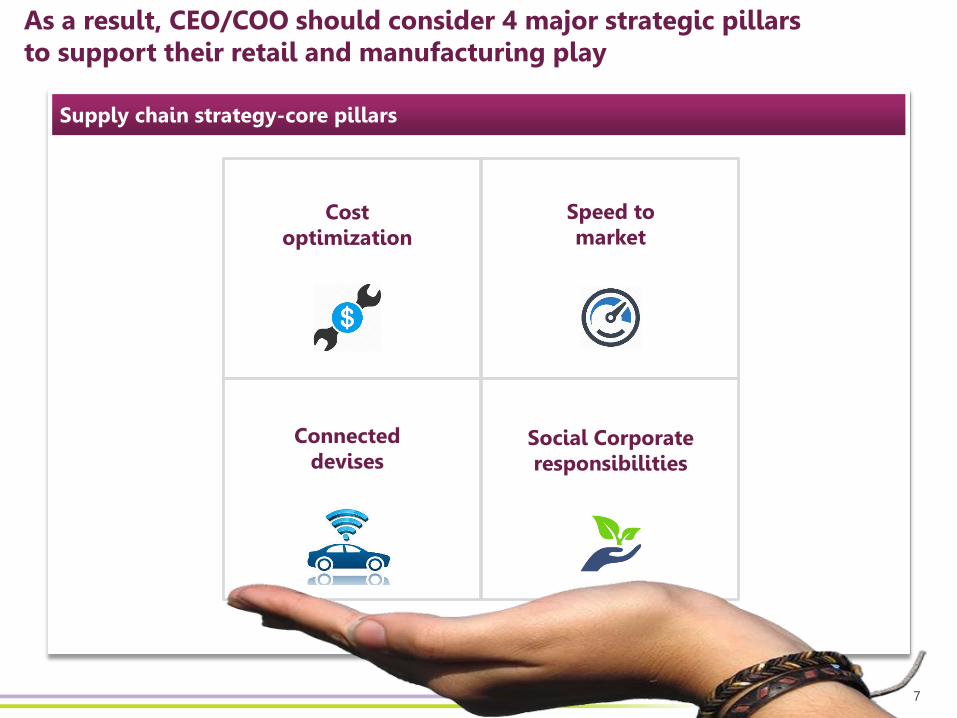
Cost optimization
Speed to market
Connected devises
Social Corporate responsibilities
Supply chain strategy-core pillars
As a result, CEO/COO should consider 4 major strategic pillars to support their retail and manufacturing play

8
UK
US
France
Germany
Italy
Japan
Indonesia
Brazil Mexico
Nicaragua
Ethiopia Vietnam
China
0
20
40
60
80
100
120
0 5 10 15 20 25
Labo
rpr
oduc
tivity
Capital intensity
2013 cross country productivity analysis – World Bank
Thousand USD/worker (2015 Exchange Rate)
Asia is lagging behind in terms of relative productivity
Source: World Bank Data, Weave analysis

9
The soft goods industry has been dormant in the past few years and new trends are now emerging
Brands and manufacturers are stuck in a chicken-and-egg situation New trends are emerging
• Industry is suffering from lack of investment in lean initiatives and machinery
• Large MNC’s behaving like SME’s with shortermism and lack of strategic transformation mindset
• SME’s are lacking capabilities to drive fundamental change within their organizations
• Retailers/brands are deepening their production capabilities
• Industry 4.0 is fuelling investments and new manufacturing models are emerging
• SCM collaboration frameworkbecome very relevant to both retailers and manufacturers

10
23%
41%
52%
-8.5%
Brands are fast growing their manufacturing capabilities to bridge gaps current players cannot fill
Own factories External suppliers Hybrid model
• Manufacturing best practice
• Product-specific expertise
• Capacity flexibility
• Industry-specific expertise
Combined benefits
• Cutting
• Sewing
• Finishing
• Defects
VF obtained tangible benefits on it’s Third Way strategy
1st level benefits 2nd level benefits
Third WaySecond WayFirst Way
Source: Weave analysis

11
Supply chain strategy-core pillars
4 pillars should be at the heart of today’s retail supply chain strategies
Cost optimization
Speed to market
Connected devises
Social Corporate responsibilities

12
0
200
400
600
800
1000
1200
1400
1600
TimeTimeTime
Fashion-driven products fell short (25%) of stock within the season start
Sales units
Potential sales Actual salesPotential Sales can be captured
End of fashion season
Start of fashion season Replenishment
Impacts:
Sales Index*
*Sales Index represents the relative sales amount
0.100.25
1.35
1
Actualsales
Potentialsales canbe captured
Potentialsales cannotbe captured
Total Potential
25%
20-30% sales opportunity by reducing out of stocks
Source: Client example

13
100% 12%
35%
25%
10%
14%
4%
0
20
40
60
80
100
Causes of OOS Store Ordering StoreForecasting
Store Stocking Warehousing PlanningManagement
Others
72% of Out-Of-Stock can be linked to replenishment practices
Linked to replenishment practices
Source: http://itsoutofstock.com/wp-content/uploads/2013/04/GMA_2002_-Worldwide_OOS_Study.pdf
Root cause of Out-Of-Stock (OOS)
Percentage %

14
Out-of-stock root causes “Read and React” model allows the gain of speed through 3 key levers
“Read and React” programs mitigate out of stock issues
• Infrequent replenishments
• Short supply of raw materials from suppliers
• Production issues
Buy Smart!• Gather POS data • Formulate demand forecast • Evaluate risk
Engage with suppliers!
• Develop collaboration model with suppliers
Start planning from materials!
• Develop Time & Action calendar with reorder timeline
• Low forecast accuracy
• Long replenishment leadtime
• Low forecast accuracy
• Long replenishment leadtime
Focusing on ordering POSDCTier 1Tier 2
Planning
15
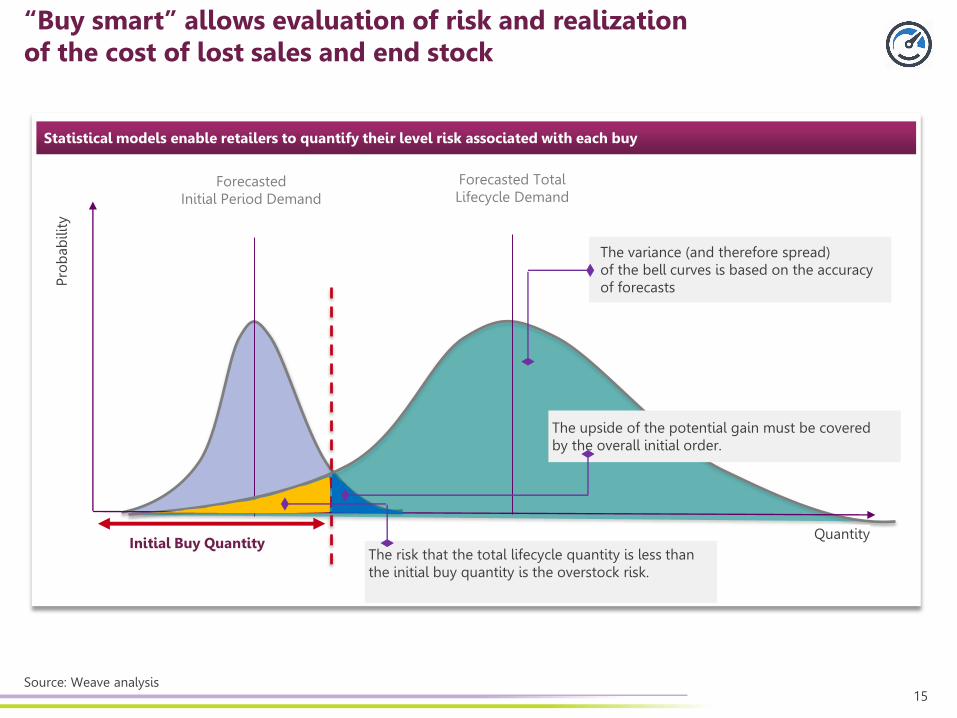
Forecasted Initial Period Demand
Forecasted Total Lifecycle Demand
“Buy smart” allows evaluation of risk and realization of the cost of lost sales and end stock
Statistical models enable retailers to quantify their level risk associated with each buy
Prob
abili
ty
QuantityInitial Buy Quantity
The variance (and therefore spread) of the bell curves is based on the accuracy of forecasts
The upside of the potential gain must be covered by the overall initial order.
The risk that the total lifecycle quantity is less than the initial buy quantity is the overstock risk.
Source: Weave analysis

16
Business are developing disruptive technologies to capture emerging fashions trends
WGSN, Edited, Stylumia, SnapFashion, ASAP54 & Thread
Trend forecasting and anticipatory analytics Speed factories: Glocal & Robotized
• “Robots” deployed online scanning publically available information
• In-street mass-photo shooting by country
• Trend analytics drawn at 2 years horizon
• 1st Speedfactory built in Germany, closer to geographical markets
• >90% robotized and emergence of mass-usage of 3D printing
• Configured to support high customization trends and “batch size 1” model
Source: Weave analysis, www.adidas-group.com/en/magazine/stories/specialty/adidas-future-manufacturing/

17
Supply chain strategy-core pillars
4 pillars should be at the heart of today’s retail supply chain strategies
Cost optimization
Speed to market
Connected devises
Social Corporate responsibilities

18
… by 2020, 38 billionsdevises will be part of our day-
to-day life
In 2015 connected devises
x2 the size of human population …

19
Consumer will demand it soon, but Wall Street wants it now!
• Development of connected cars
• Acquisition of Misfit
• Development of smart home and smart body apps
-1000 4000 9000 14000 19000 24000
2013 2014 2015 2020
Genericbusinesses
VerticallyIntegrated
Consumer
Automotive
High number of initiatives launched in recent years
42% CARG to 2020 projection supports investments from industrialists
CARG
53%
39%
82%
29%
Source: Weave analysis, Gartner November 2014

20
Fundamental changes will transform the industry
“Do-or-Die” moment for manufacturers
Revolution for replenishment specialists
• Increased data points for predetermining demand trends i.e. anticipatory optimization
• New channels available conduct demand shaping
• Greater vertical integration of data through the use of smart tags and smart appliances
• New procurement strategies
• Transformation of assembly and production line arrangements
• Added complexity in managing product life cycle

21
Connected devises will create an eco-system of integrated data that will transform supply chains
Benefits
Examples
New features
Raw materialsManufacturing
Assembly Finished goodsIn-boundLogistics
Last Mile logisticsShops/ platforms Natural environment
• Smart tracking-RFID
• Smart tagging e.g. disposable watermarking
• Cloud logistics • Online-off-line • On-demand delivery e.g. crowd based parcel delivery
• Traceability of RM and components
• Connected devises
• Part of day to day activities from home, work, gym, travels
• Enable nimble reaction to crisis
• Safeguard brand image
• Real time calculation of WIP and productivity
• Increased traceability beyond POS
• Increased predictability e.gexpiration date
• Scalability of IT logistic services via one integrated platform from consolidation to billing
• Offer modular services e.g. pay per use
• Reduction of inventory in store
• Increase range to customers
• Improved demand shaping
• Reduction of assets
• Reach to low density locations
• C2C consumer experience
• Anticipatory optimization
• Increase ability to perform demand shaping
• Data available to manufactures

22
Supply chain strategy-core pillars
4 pillars should be at the heart of today’s retail supply chain strategies
Cost optimization
Speed to market
Connected devises
Social Corporate responsibilities

23
Social Corporate Responsibility cannot be ignored

24
Those who ignore it, are impacting their market reach and sales potential
“We recognize that the frequent use of short term, fixed duration contracts, in the Cambodian garment industry constitutes an illegal breach of workers’ rights”
“The outrage over the disaster threatened to tarnish permanently the names of top High Street firms and spurred the drive among many to cut their dependence on Third World factories and bring manufacturing back to Britain.

25
Case study of Patagonia shows industry best practice
https://www.youtube.com/watch?v=WexueycQgmY
Best practices observed at PatagoniaVideo- case study of Patagonia
• Independent and frequent audits i.e. internal or/and external parties
• 4 decision factors with equal veto rights i.e. sourcing, quality, social and environmental
• Cover the End-2-End supply chain with robust traceability tools
• Maintain database of key metrics and drive continuous improvement programs

26
Root causes
Solutions
3 major roadblocks to embedding SCR into your supply chain strategy
Liability of investment Un-unified world standards
Roles and Responsibilities
• Manufacturers are reluctant to invest without long term commitment
• Retailers cannotoften translate investments into tangible ROI
• Multiple initiatives led by large soft goods organization and global association
• Retail organization often do not know how to integratethis function in a way that drives impact
• Integrate to your vendor balance score card e.g. Nike
• PE firms founding SCR friendly factories
• Align to the highest standards e.g. many retailers see the Higgs index as best in class
• Bring SCR at the board level
• Integrate to your supply chain strategy

27
Supply chain strategy-core pillars
Managing the integration of these 4 pillars is essential to supporting a retail growth strategy in 2016 and beyond
Cost optimization
Speed to market
Connected devises
Social Corporate responsibilities

28
• Resurgence of M&A: Investments in manufacturing across APAC by PE firms and investment founds
• 4CP for MNC’s: Large corporation behaving like SME’s slow down change management
• Technologies and analytics dominate the conversations. More mathematically based decision making processes and tools are yet to be embedded
Cost optimization
Speed to market
Connected devises
Social Corporate responsibilities
So what does that mean for the service industry?
29
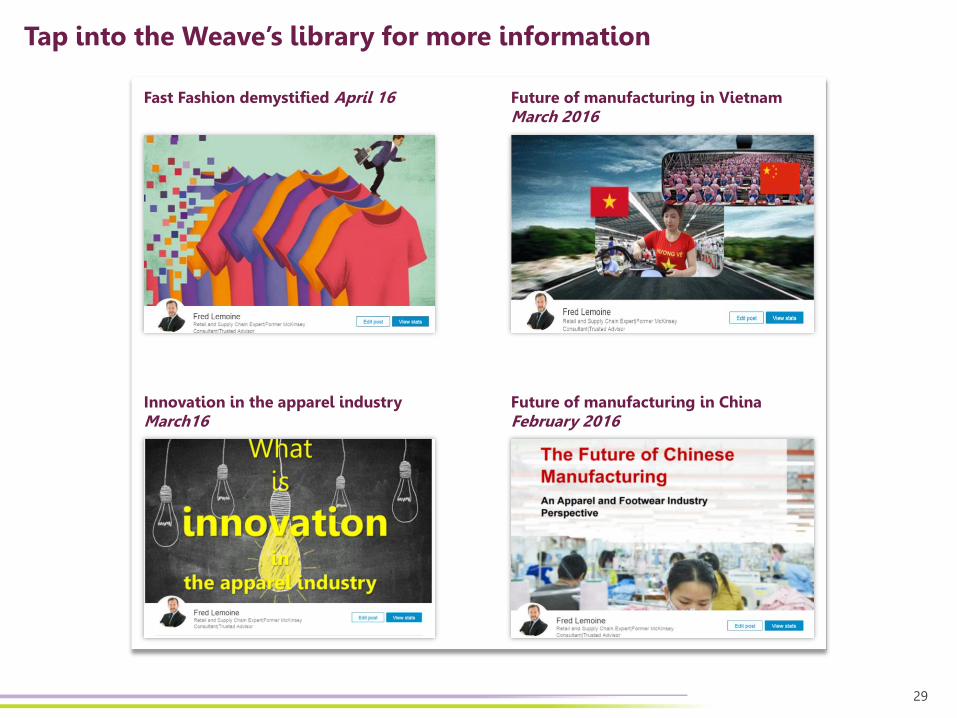
Fast Fashion demystified April 16 Future of manufacturing in Vietnam March 2016
Innovation in the apparel industryMarch16
Future of manufacturing in ChinaFebruary 2016
Tap into the Weave’s library for more information