perspectives on the past - cwts · perspectives on the past 50 years of fsw edited by joop van...
TRANSCRIPT

Vensters op het verleden50 jaar FSW
Perspectives on the past50 years of FSW

Perspectives on the past
50 years of FSW
Edited byJoop van Holsteyn
Reineke MomIneke Smit
Henk TrompGezinus Wolters
Faculty of Social and Behavioural Sciences, Leiden, 2013

EditorsJoop van Holsteyn, Reineke Mom, Ineke Smit, Henk Tromp and Gezinus Wolters
Photo editorPieter Janse
Editor-in-chiefReineke Mom
TranslationsJudith Dijs, Maria Sherwood-Smith and Ineke Smit
Cover designReineke Mom and Carlijn Oudelaar
Interior book design and printUFB/Graphic productions
PublisherBiblioscope, Utrecht
© Faculty of Social and Behavioural Sciences and authors
© All illustrations: Faculty of Social and Behavioural Sciences, unless indicated otherwise.
All rights reserved. No part of this publication may be reproduced, stored in a retrieval system, or transmitted, in any form or
by any means, electronic, mechanical, photocopying, recording, or otherwise, without the prior written permission from the
Faculty or the authors.
ISBN 978-94-6228-332-9
Leiden, December 2013
socialsciences.leiden.edu

86
Perspectives on the past
The Quantitative Study of Science before the Science Citation Index
The quantitative study of science is mostly referred to
as scientometrics. Within scientometrics, the research on
scientific communication, particularly with data from
publications, citations, and journals is called bibliometrics.
Comprehensive overviews of the early developments in the
quantitative study of science are given by Francis Narin in
his seminal report Evaluative Bibliometrics (Narin, 1976),
and in a review by Van Raan (2004a; see also Moed et al.,
1983). In the 1920s, Lotka1 - famous for his Lotka-Volterra
equations in population dynamics - published remarkable
work on the productivity of chemistry researchers.2 It is the
first scientometric finding that can be expressed in a simple
mathematical way: the productivity of scientists follows an
inverse square law. In other words, the number of scientists
producing N papers is proportional to N-2. This ‘law of
scientific productivity’ holds that in a given period of time
the majority of researchers produce only one or two papers;
just a few are prolific writers producing ten papers or more.
It is one of the many examples of science being characterized
by skewed distributions.
Citations, h-Index, Journal Impact and Rankings: Not all Sorrow and MiseryCWTS: A Short History of Measuring Science
Ton F.J. van Raan
Between 1925-1950 there was an increasing interest on the
part of librarians to find out how papers in specific journals
are cited by papers in other journals. The idea came up that
analyzing these ‘journal-to-journal citations’ could be used to
assess the usefulness of journals for university libraries. This
works as follows: given a set of journals already present in a
library, one may analyze which journals outside the set are
frequently cited by the journals within the set. These journals
can then be considered important enough to add to the
library collection.
Another skewed distribution in science was found by
Bradford (Science Museum, London) in the 1930s: literature
on a given subject is heavily concentrated in just a small
core set of journals. This Bradford’s Law of Concentration
of Subject Literature is a convenient way to estimate how
many journals must be checked to obtain a specific level of
coverage of the literature on the subject.
The beginning of the 1950s witnessed the appearance of
the first science maps based on journal-to-journal citations.
Daniel and Louttit constructed such a map for psychology
to show the development of the field on the basis of the
1 For literature references to the early work (until 1973) discussed in Sections 1 and 2, we refer to Narin (1976) and Moed et al. (1983).2 An even earlier scientometric work, assessing the scientific strength of nations by analyzing membership of scientific societies, was published in 1873 by De
Candolle.

87
structure of the literature. After composing a journal-to-
journal-citation matrix, they calculated similarity measures
and applied cluster analysis. In this way they created the
science map shown in Figure 1, and discovered a ‘general’ and
an ‘applied’ nucleus of the psychology literature. All this had
to be done manually, with a huge amount of printed journal
volumes, a hell of a job without computers and automated
databases.
At first, citation analysis was restricted to journals as a whole.
Citation analysis of individual publications, grouped into
fields, countries, universities, departments, research groups,
or individual scientists, was not possible due to the lack of
relevant data sources. All such studies had to wait for the
invention in 1955 of the Science Citation Index.
The Science Citation Index Revolutionized the Study of Science
The invention of the Science Citation Index (SCI) by Eugene
Garfield was undoubtedly a major breakthrough (Wouters,
1999), which completely revolutionized the field. The
systematic collection and registration of all references in all
publications in a large number of scientific journals opened
the way to statistical analyses of the scientific literature on
a very large scale. It marks the rise of bibliometrics as a
powerful empirical field within the study of science. Garfield
created a company, the Institute for Scientific Information
(ISI), to develop the SCI and related databases. The SCI
is the predecessor of the Web of Science (WoS). As almost
all publications are connected to other publications by
citations, the science communication system represented by
publications is in fact a gigantic network, to which currently
more than a million publications per year are added. It is
therefore probably no surprise that nowadays in bibliometric
research projects advanced network analysis methods from
mathematics and physics are used.
Several US scientists immediately recognized the enormous
potential of the SCI. In the early 1960s, the Yale University
physicist and historian of science De Solla Price made a
number of important bibliometric discoveries based on
data from the SCI. We mention here: Price’s Law on the
distribution of publications over authors, stating that 25%
of all authors are responsible for 75% of all published papers
(this is in fact a more accurate revival of the Lotka study
mentioned earlier); the exponential growth of scientific
literature that started in the beginning of the 18th century;
the exponential decay of citations received by publications
as a function of time, which defines a half-life time of
publications; and the power law distribution of citations. It
is particularly this last finding that is an important further
Fig. 1: Map by Daniel and Louttit based on journal-to-journal citations. Lines connect journals which are correlated above a specific threshold.
Citations, h-Index, Journal Impact and Rankings: Not all Sorrow and Misery

88
Perspectives on the past
Fig.2: The primary citation network consists of 4 publications (pa1,.., pa4) in which publications pb1,…., pb5 are cited in the way indicated. By converting such networks into numerical matrices, matrix-algebraic operations can be performed on them.

89
Citations, h-Index, Journal Impact and Rankings: Not all Sorrow and Misery
example of the skewed distributions in science: most
publications receive only few citations (or none), and only
few publications receive many citations.
De Solla Price also coined the idea of cumulative advantage,
which means that publications which are already frequently
cited have a higher probability of receiving even more
citations. In terms of complex network theory this concept
is now better known as preferential attachment. Quite
remarkably, it was found recently that this cumulative
advantage of publications starts to work as soon as a
publication has acquired eight citations. Of course, this is a
statistical outcome, not a guarantee.
As discussed above, the invention of the SCI opened the
way for the analysis of citations at the level of individual
publications. In the early 1960s Kessler at MIT developed the
method of bibliographic coupling (BC): two publications are
bibliographically coupled if they have references in common;
the more common references, the stronger their relation
(bibliographic coupling strength). Ten years later, Small at ISI
developed the ‘mirror’ of bibliographic coupling, which he
named co-citation analysis (CC). In this method, publications
are defined as related if they are cited together by other
papers. The more papers citing a specific pair of papers,
the stronger the co-citation strength. The strength of the
relations between publications provides similarity measures,
and hence the possibility to cluster in such a way that both
BC and CC can be used for mapping.
Figure 2 shows a diagram of both approaches based on
a simple citation network. From this primary citation
network two secondary networks, the co-citation and the
bibliographic coupling networks, can be deduced. To give a
simple explanation: in the co-citation network the strength
between for instance pb1 and pb4 is 3, because there are 3
publications that cite pb1 and pb4 together (pa1, pa2, and
pa3). In the bibliographic coupling network the strength
between for instance pa2 and pa3 is 2, because these
publications have two cited publications in common (pb1
and pb4). The usual citation analysis (i.e., counting citations
of a specific paper) is illustrated by the red arrows: pb1 is
cited three times. In network terms: the in-degree of pb1 as a
node in the network is 3, whereas the out-degree of pa1 is 5.
The SCI also made it possible to use citation analysis for
the assessment of the impact of publications: the more
they are cited, the higher the impact. From the beginning it
was recognized that the process of citation is complex, and
certainly does not provide an ideal monitor on scientific
performance. This is particularly the case at a statistically low
aggregation level, e.g., just one individual publication. But
the application of citation analysis to the work of a group of
researchers as a whole over a longer period of time does yield
(particularly in the natural sciences and the medical fields) a
reliable indicator of scientific performance.
The sociologists Jonathan Cole and Stephen Cole were the
first to use citation analysis to determine scientific impact.

90
Perspectives on the past
They found high positive correlations between receiving
citations, winning awards, membership of scientific
academies, being widely known among colleagues, and
working in prestigious institutes. They also concluded that it
seemed as if only a small number of scientists contribute to
scientific progress.
The 1970s saw a rapid expansion in research on quantitative
aspects of science. Due to the increasing availability of
data, the quantitative appraisal of science gained influence
in national and international organizations as well. It was
the beginning of the development of science indicators on
the basis of publication and citation data. The National
Science Foundation, UNESCO, OECD, and the European
Commission are examples of organizations that started
to systematically collect data to measure and analyze the
development of science and technology. A landmark is the
first publication in 1973 by the US National Science Board
of what was to become the biennial series Science Indicators
Report in 1973.
Meanwhile, the inventor of the SCI, Garfield, launched the
idea of a journal impact factor, in which he used citation
analysis as a tool for journal evaluation. Here, Garfield
recognized another potential application of citation
analysis: journals can be ranked by citation frequency for
science policy purposes. The policy-making implications of
bibliometric analyses were discussed even more explicitly in
the pioneering work by Narin on evaluative bibliometrics
(1976) mentioned earlier. Narin was the first scientist-
entrepreneur who used SCI data for a commercial enterprise,
in a company called Computer Horizons Inc. With a research
contract from the National Science Foundation, Narin
extensively described the use of publication and citation
analysis in the evaluation of scientific activities. The focus
was on creating performance indicators on the basis of the
data of thousands of journals. An analysis on the basis of
millions of individual publications was at that time still a
step too far. However, besides the availability of more and
more data through the SCI, computer power and memory
capacity were rapidly increasing.3 It took only a few years
more to bring about the large-scale citation analysis of (sets
of) individual publications.
Until that time there was not much activity in bibliometrics
outside the United States. But this changed in 1975.
During a four-month working visit at the National Science
Foundation, Cees le Pair, physicist (PhD Leiden) and the
then director of research at FOM4, became interested in
measuring science and got to know Derek de Solla Price and
Eugene Garfield. Back in Utrecht, he started the first citation
analysis studies of two fields of physics: magnetic resonance
and electron microscopy. These studies showed that citation
analysis made it possible to identify the most important basic
3 To give an illustration: by the end of the 1990s the size of computing power and memory storage capacity was about 10,000 times what it was in the early 1980s.
4 FOM: Stichting Fundamenteel Onderzoek der Materie, the physics research council, part of NWO, the Netherlands Organization for Scientific Research.

91
Citations, h-Index, Journal Impact and Rankings: Not all Sorrow and Misery
research contributions to these fields. In the field of magnetic
resonance high correlations were found between the results
of a citation analysis and peer assessments. However, in the
case of applied and technological research - particularly in
the field of electron microscopy - citation analysis did not
work well.
At first, the results of bibliometric research were published
mainly in sociological or general journals, even top journals
such as Science. An important sign of the emancipation of
the field of bibliometrics, however, was the creation of its
first journal, Scientometrics, by the Hungarian chemist Tibor
Braun in 1978. Scientometrics is still one of the core journals
of the field. Braun also created a flourishing bibliometric
research group at the Academy of Sciences in Budapest.
The Take-Off Run to CWTS
How did the field of scientometrics reach Leiden University?
In 1979 the Leiden University Executive Board introduced
a new institutional policy. The money allocation model
used to divide the block financing from the Ministry among
the faculties should no longer be largely dependent on
student numbers, but should also have a research-quality
dependent factor. The crux was to find a reliable method to
assess research quality. At the time, I myself was involved
in the development of this model, and as a physicist, and
knowing Cees le Pair, I proposed using citation analysis
in the assessment of research performance. In 1980 the
first experiments were performed: a citation analysis of
all chemistry departments, followed by a second citation
analysis of the entire Faculty of Sciences and the Faculty of
Medicine, combined with interviews with experts. The report
of this study (Moed et al., 1983), followed by a series of
highly cited papers based on the report, catapulted the Leiden
group to instant fame within the field of scientometrics.
Never before had a bibliometric study been performed on
so many (140) departments within a research-intensive
university. But certainly, shortly before and around the
same time there had also been other important bibliometric
studies, of which the work on radio astronomy by Irvine and
Martin can be considered ground-breaking.
From 1983 onwards the brand-new Leiden group could count
on continuous support of the Executive Board, the Ministry of
Education, Culture and Sciences, and the publishing company
Elsevier, mostly via contract-research projects. Elsevier was
particularly interested in creating new performance indicators
of scientific journals. We also enjoyed a rapidly increasing
international interest followed by more and more contract
research assignments. However, we were not alone in the
world. In the early 1980s there was a rapid rise in the number
of co-citation analyses; an increasing emphasis on important
themes such as advanced statistical analyses of scientometric
parameters; application of bibliometric methods in the social
sciences; comparison of peer opinions and bibliometric
indicators; and development of indicators of interdisciplinary
research (see, e.g., Van Raan, 2004a).

92
Perspectives on the past
A new development was co-word analysis. Mathematically
this is similar to co-citation analysis, but instead of citing
earlier publications it is based on the use of specific concepts.
To put it simply, next to the list of references in publications,
we can also characterize publications by a list of concepts
used in them. After a slow start, co-word analysis went sky-
high and became one of the primary methods to create
science maps. But it took a long time, almost two decades,
before sufficient computer power was available. Our Leiden
group played an important role in this development.
In 1986 the Leiden group became part of the Faculty of
Social and Behavioural Sciences (hereafter FSW) as a research
group within the Leiden Institute of Social Policy Research
(LISBON) which was established by the then Professor of
Sociology Mark van de Vall. Already from the very beginning
our bibliometric work benefited from contacts within FSW.
One of the main pillars of the CWTS work, science mapping,
originated from collaboration with the department of
Data Theory (Jan de Leeuw, Jacqueline Meulman, Willem
Heiser). We collaborated with the department of Sociology
on research proposals in which bibliometrics was presented
as an important instrument in research on the sociology
of science (Kees Bertels, Kees Schuyt). The FSW contract
research department DSWO (Peter van Hoesel) was also a
great help to our group, particularly by providing advice on
how to manage a rapidly growing research group that for
about 90% made its ‘living’ from contracts.
The first international conference on bibliometrics and
the theoretical aspects of information retrieval (the
predecessor of the ISSI5 conference) was organized in 1987
by Leo Egghe in Hasselt (Belgium). The Leiden group was
prominently present at this conference. In 1988 we published
the first Handbook of Quantitative Studies of Science and
Technology (Van Raan, 1988), and CWTS organized the
first international conference on Science and Technology
Indicators in Leiden. The field of bibliometric research
became more and more dynamic - and even heated. As can
be expected, opponents of the use of citation analysis started
to agitate the field, for instance by pointing to the many
different motives authors may have to cite or not to cite, thus
questioning the validity of using citations as a performance
measure. Although such debates can be quite irritating, they
are part of a healthy development of the field. At the same
time, more and more large-scale empirical work was done.
For instance, the Budapest researchers published an extensive
study on the publication output and field-specific citation
impact of scientific work in about a hundred countries. In
1989 the Leiden group acquired its formal name: Centre for
Science and Technology Studies (CWTS), and in the same
year we started with patent analysis in order to create bridges
between science and technology on the basis of citations to
the scientific literature in patents.
By this time CWTS was housed in the new premises of
the FSW, the Pieter de la Court Building. After several
5 ISSI: International Society for Scientometrics and Informetrics, http://www.issi-society.info/.

93
Citations, h-Index, Journal Impact and Rankings: Not all Sorrow and Misery
organizational restructuring operations CWTS became an
autonomous research department. Important work in the
second half of the 1980s focused on, for instance, research
performance in the humanities and social sciences, and the
use of quasi-correspondence and multidimensional scaling
analysis for science mapping. The 1980s can be characterized
as the period of the birth and rapid growth of CWTS.
Particularly in the second half of the decade we were able to
create one of the most active and influential bibliometrics
research institutes worldwide.
What was the secret behind this success? Next to the
competence and ambitions of our staff, I think two elements
were crucial. First, the optimal mix of basic and applied
research, using contract-research data to continuously
investigate new paths: application as a source of innovation.
Second, our heavy investments in computers and ICT
personnel. Bibliometrics is an immensely data-intensive
field that cannot do without massive computing power. In
addition, the fact that the head of CWTS was a physicist may
also have been instrumental in being taken seriously in a
sometimes quite arrogant and averse academic environment.
Next to these content-related elements, the Leiden University
Board has always been well-disposed towards CWTS in terms
of organizational and policy support. After a successful take-
off, our task was to consolidate and further reinforce the
unique position of CWTS.
Life at the Forefront
The 1990s was a decade of numerous CWTS achievements.
From the perspective of institutional academic status the
appointment of Ton van Raan in 1991 to Professor of
Quantitative Studies of Science, probably the first chair in
this field worldwide, was crucial. It put CWTS at the level
of a well-established university department, and enabled us
to organize PhD work largely autonomously.6 The chair was
established by the Leiden University Foundation (LUF), and
was later changed into an ordinary professorship. Next to
the FSW it was particularly the Faculties of Medicine and
Science that strongly supported the establishment of the
chair. Immediately after the appointment an annual series
of lectures for MSc students was established. This series of
lectures has evolved to what is now the CWTS international
Graduate Course on Measuring Science.
The 1990s witnessed a strong increase in contract research
commissioned by organizations and institutions worldwide,
but especially in the European Union (ministries, national
research councils, charities, universities). CWTS’s
involvement with research evaluation practices led directly
to the improvement of bibliometric indicators and maps.
Number and impact of our publications increased steadily.
Highly cited work, basic as well as applied, was published.
From the harvest of new ideas and initiatives in the
first half of the 1990s we mention the idea of the fractal
6 CWTS was never a ‘normal’ institute combining teaching and research: we always had to survive for about 90% of our budget on contract research. Nevertheless, CWTS has realized 12 PhD examinations over the years.

94
Perspectives on the past
structure of co-citation clusters (our first paper in Nature);
combining co-citation and word analysis; classifications
of interdisciplinary research; new approaches in co-
word analysis, leading to improved science mapping; the
correlation between peer review judgements and outcomes of
citation analysis; the measurement of international scientific
collaboration; determinants of citation scores; technology
mapping based on patent analysis, and the study of the
interface of science and technology by analysis of author-
inventor relations.7
In the meantime, elsewhere in the world new developments
also took place. In 1992 Garfield decided to sell his Institute
of Scientific Information. After a few years of different
owners, ISI became part of the information giant Thomson
Reuters. Things began to change gradually, with research
becoming more and more determined by business interests.
As Tibor Braun once noted: this was the end of the romantic
period for the bibliometric world.
A new development was the foundation of the Netherlands
Observatory for Science and Technology (NOWT), established
in 1994 as a joint venture of CWTS and MERIT, Maastricht
University. Its purpose was to compile the biannual Science
and Technology Indicators (WTI) Report for the Ministry of
Education, Culture and Sciences. At CWTS Robert Tijssen
was the NOWT supervisor. CWTS produced the WTI reports
until 2010.
Excursion to the Delta Works during Eugene Garfield’s visit to Leiden in 1991. From right to left: Eugene Garfield; Junjia Liu (Chinese guest worker at CWTS); Cees Le Pair, the chief engineer of the Storm Surge Barrier; Magriet Jansz (colleague of Cees le Pair); youngest son and wife of the author.
7 CWTS collaborators also received some prestigious awards. In 1995 Van Raan received the Derek de Solla award together with American sociologist Robert Merton. In 1999 this award was presented to Henk Moed (CWTS) and Wolfgang Glänzel (PhD Leiden and now University of Leuven).

95
Citations, h-Index, Journal Impact and Rankings: Not all Sorrow and Misery
In the second half of the 1990s further new work was
published on the cognitive resemblance of citing and cited
papers; the inappropriateness of journal impact factors for
research evaluation8; time-dependent co-word analysis;
and, unavoidably, quarrels with theorists, particularly
constructivists and philosophers. In the period 1994-
2000 CWTS was involved in the VSNU national research
assessment procedures.9 For several disciplines, for instance
biology, chemistry, physics, and psychology, we performed
extensive bibliometric analyses of all research groups. The
presentation of our results often evoked (and still does)
strong emotional reactions. To mention a few: “I am far
better than you measured!”; “I am ahead of my time and
you cannot capture this in your silly citations”; “Your work
is horrifying: for me science is like love, you cannot express
its importance quantitatively”; “Your work is dangerous,
it is part of the machinery of Orwell’s Brave New World”;
“Counting citations to assess the value of scientific work is
disgusting”.
Sometimes there is truth is these emotions, often they
are unreasonable. Anyway, we went on and continued to
develop even better indicators of research performance. Let
me show how we actually apply citation analysis. Figure 3
is a schematic presentation of the CWTS basic bibliometric
indicators. These indicators are briefly explained in Text box
1. Table 1 contains a recent real-life example of an application
of these indicators. Prominent in these figures is our crown
indicator cd/cf, which measures the extent to which a research
group, department, institute, etc. performs significantly
above international level. For a comprehensive description
of our bibliometric method we refer to Van Raan (2004a). To
the outsider some of the indicators shown in Figure 3 may
look like ‘just counting numbers’, but reliably establishing
even the two basic indicators (number of publications and
number of citations) is far from trivial. Verification is crucial
in order to remove errors, to detect incompleteness, and to
assure the correct assignment of publications to research
groups and completeness of publications sets. We have
developed standardized procedures for the execution of such
analyses, as conscientiously as possible.
8 ‘Journal impact factors’ concern the average number of citations per paper in the journal over a two-year period after publication. There is no distinction between types of papers, such as ‘normal papers’ and reviews. Therefore, journal impact factors should not be used as surrogates for the actual citation impact of individual publications. An advanced methodology such as developed by CWTS is capable of measuring actual citation impact.
9 VSNU: Vereniging van Samenwerkende Nederlandse Universiteiten, Association of Universities in the Netherlands.

96
Perspectives on the past
Fig. 3: Basic principles of bibliometric indicators..
Text Box 1: A short explanation of Fig. 3.
A university department has 500 publications in the period 2008-2012 (P=500). Within the same period these publications are cited 3,000
times (C=3,000). The average citation impact of the department then is cd = 6. For normalization purposes this impact is compared with
similar measures for (1) all journals used by the department: the journal impact cj (measured over the same 5-year period and taking
article type into account), and (2) all journals in all fields in which the department is active: the field average cf (again measured over the
same 5-year period and taking article type into account). In the example given, cj = 4 and cf=3.
From these figures the following observations can be made: the department performs better than both the journal and the field average
(cd/cj = 1.5; cd/cf = 2.0), and the journals chosen by the department for publications are the better ones in the fields (cj/cf = 1.3). We call
cd/cf our crown indicator because this indicator directly measures the extent to which a research group, department, institute, etc. performs
significantly above the international level.
The above example is a simple representation of the normalization procedure. In reality this is somewhat more complicated (Waltman
et al., 2011). Given the skewness of the distribution of citations over publications, we increasingly apply indicators related to the entire
citation distribution. See for instance the methodology section of the latest version of the Leiden Ranking http://www.leidenranking.com/.
97
Citations, h-Index, Journal Impact and Rankings: Not all Sorrow and Misery
LUMC P C cd %Pnc cd/cf cj/cf %Scit
2000 - 2003 4,146 45,643 8.76 16% 1.38 1.28 20%
2001 - 2004 4,247 49,057 9.17 14% 1.41 1.28 21%
2002 - 2005 4,422 50,595 9.03 13% 1.37 1.28 21%
2003 - 2006 4,738 54,777 9.10 13% 1.37 1.29 21%
2004 - 2007 4,967 64,551 10.35 12% 1.44 1.30 20%
2005 - 2008 5,360 70,540 10.43 11% 1.51 1.31 21%
2006 - 2009 5,522 76,001 10.89 12% 1.54 1.36 21%
2007 - 2010 5,871 85,733 11.47 11% 1.64 1.43 21%
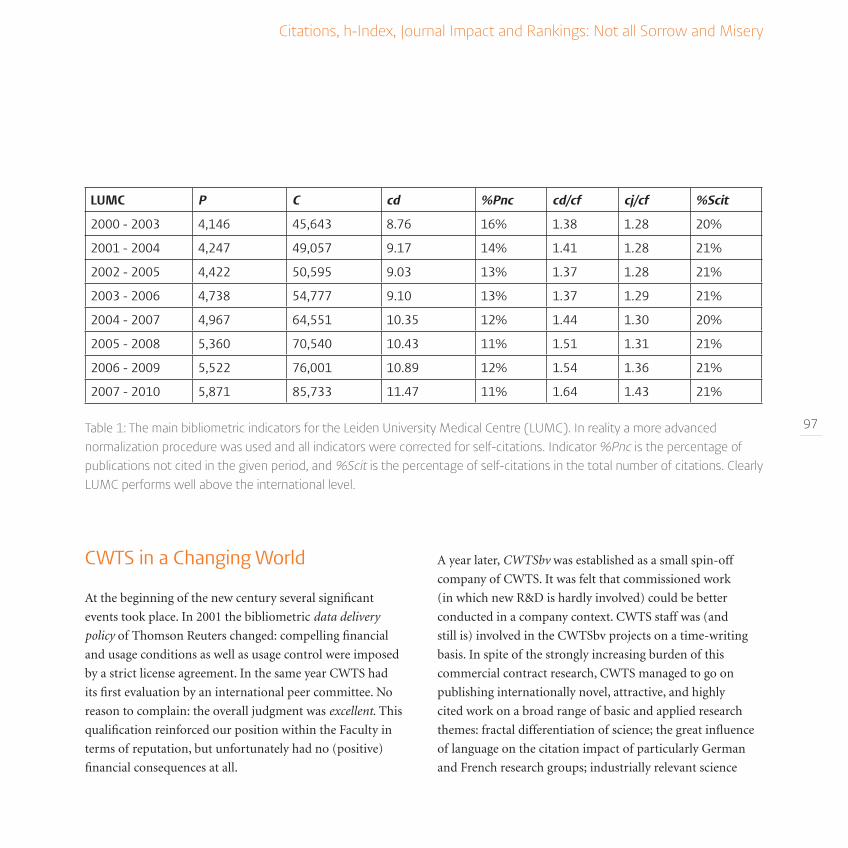
Table 1: The main bibliometric indicators for the Leiden University Medical Centre (LUMC). In reality a more advanced normalization procedure was used and all indicators were corrected for self-citations. Indicator %Pnc is the percentage of publications not cited in the given period, and %Scit is the percentage of self-citations in the total number of citations. Clearly LUMC performs well above the international level.
A year later, CWTSbv was established as a small spin-off
company of CWTS. It was felt that commissioned work
(in which new R&D is hardly involved) could be better
conducted in a company context. CWTS staff was (and
still is) involved in the CWTSbv projects on a time-writing
basis. In spite of the strongly increasing burden of this
commercial contract research, CWTS managed to go on
publishing internationally novel, attractive, and highly
cited work on a broad range of basic and applied research
themes: fractal differentiation of science; the great influence
of language on the citation impact of particularly German
and French research groups; industrially relevant science
CWTS in a Changing World
At the beginning of the new century several significant
events took place. In 2001 the bibliometric data delivery
policy of Thomson Reuters changed: compelling financial
and usage conditions as well as usage control were imposed
by a strict license agreement. In the same year CWTS had
its first evaluation by an international peer committee. No
reason to complain: the overall judgment was excellent. This
qualification reinforced our position within the Faculty in
terms of reputation, but unfortunately had no (positive)
financial consequences at all.

98
Perspectives on the past
and the dependence of technology on science; the rapidly
upcoming scientific performance of China; identification of
scientific excellence; Sleeping Beauties10 (Van Raan, 2004b);
and, after the publication of the first Shanghai Ranking, an
inventory of conceptual and methodological problems in
the construction of university rankings (Van Raan, 2005).
Within a short period three books were produced, one on the
scientific performance of German medical research (Tijssen
et al., 2002), a handbook (Moed et al., 2004), and a book on
citation analysis (Moed, 2005).
Meanwhile, the internet had changed scientific
communication. In addition to the publication and citation
data provided by the WoS database, a vast number of further
publication data included in institutional and personal
websites became available. Thus, next to citation analysis
the use of data provided via the internet, webometrics,
was (and still is) considered to offer interesting additional
opportunities to complement citation-based analysis in
evaluation and mapping approaches (references to early
webometrics work can be found in Moed et al., 2004).
We already mentioned another important event in the
scientometric world: the emergence of university rankings,
with the Shanghai Ranking11 as the first in 2003, soon
followed by the introduction of the Times Higher Education
ranking.12 In 2007 CWTS started its own Leiden Ranking.13
Despite the many problems inherent in the ranking of
universities, this new phenomenon evoked a rapidly
increasing public and political interest in the performance of
universities. It greatly stimulated the application of research
assessment, particularly with bibliometric methods. Another
important event was Elsevier’s start with the development
of Scopus in 2004, the first competitor of Thomson Reuters’s
WoS. After a run-up of a few years Scopus was launched
commercially as the new citation index, marking the end of a
very long period of a strict monopoly of the WoS.
In 2005 the physicist Jorge Hirsch (University of California
at San Diego) introduced the h index14 (Hirsch, 2005).
This new indicator attracted enormous attention. A simple
method for individual scientists to find their h index is to
rank their publications, for instance in the WoS, according
to the number of times the publications are cited (starting
with the highest cited). Somewhere in this ranking there will
be a publication with a number of citations that is the same
as its ranking number. A torrent of publications describing
numerous variants of the h index followed, but hardly any
attempt was made to compare the h index carefully with
existing efficacious indicators - except by the CWTS (Van
10 A Sleeping Beauty in science is a publication that goes unnoticed (i.e., is not cited, “sleeps”) for a long time and then, suddenly, attracts a lot of attention (“is awakened by a prince”), as measured by citations.
11 Version 2013 of the Academic World Universities Ranking (Shanghai Ranking): http://www.ShanghaiRanking.com/. 12 Version 2013 of the Times Higher Education Ranking: http://www.timeshighereducation.co.uk/world-university-rankings/2013/reputation-ranking.13 Version 2013 of the Leiden Ranking: http://www.leidenranking.com/14 A scientist has an h index of h if h of his/her publications each have at least h citations, and the remaining publications each have fewer than h + 1 citations.

99
Citations, h-Index, Journal Impact and Rankings: Not all Sorrow and Misery
Raan, 2006). Because the h index does not take into account
the often large differences in citation density between, and
even within, fields of science, this indicator is in many
situations not appropriate for the assessment of research
performance. Furthermore, it was recently proved that the h
index is mathematically inconsistent (Waltman & van Eck,
2012). A few years ago Google Scholar launched a citation
index including publications from different sources than only
journals (Harzing, 2010); therefore, the h index obtained via
Google Scholar will be different from those obtained via WoS
or Scopus.
The second half of the first decade of the new century
can be characterized as a period of strong increase in
commercialization, competition, new data sources, new
approaches, the influence of Open Access. All these have
proved challenges for CWTS. Therefore, the year 2008
was remarkable for our institute, because the Minister of
Education, Culture and Sciences decided to grant CWTS
a substantial amount of ear-marked financing in order to
improve its innovative power. Fortunately, but in the nick
of time, it had become clear that with the extremely heavy
burden of working on 90% financing from contract research,
CWTS could not adequately maintain - let alone reinforce
- its international position. The then Dean of our Faculty,
Theo Toonen, played a crucial role in the minister’s decision.
The new money also enabled us to establish a second chair
at CWTS: Cornelis van Bochove was appointed Professor
of Science Policy. Also in 2008, a new evaluation by an
international peer committee took place. Next to several
important recommendations, the overall judgment was again
excellent. Finally, in 2008 we also moved to the beautifully
renovated Willem Einthoven building.
CWTS continued to produce highly cited work: bibliometric
analyses of research performance in the social sciences
and humanities; finding the properties of the statistics and
particularly scaling of bibliometric indicators; citation
analysis of publications not covered by the WoS; assessing
the influence of Open Access on citation impact; a new
indicator of journal citation impact, the source normalized
impact per paper (SNIP) (Moed, 2010); new indicator-
normalization procedures - which evoked a fierce dispute in
the international literature (Waltman et al., 2011); and a new
mapping technology (Van Eck & Waltman, 2010).
In 2010 Robert Tijssen was appointed Professor of Science
and Innovation Studies, the third chair at CWTS. In the
same year Ton van Raan retired as Director of CWTS while
keeping his position as research professor. Paul Wouters was
appointed Professor of Scientometrics and became the new
director. He energetically took over the responsibility for
CWTS, whose program now includes new research themes
such as evaluation practices, scientific careers, and the social
impact of science. The last theme is particularly closely
related to new approaches to finding data on the outcomes
of scientific results, ‘altmetrics’ (Priem et al., 2012). Further
important work in recent years includes research on the

100
Perspectives on the past
Figure 4: Science map of neurology. Colors indicate local citation density. This map is based on all publications classified as article or review and published between 2006 and 2010. For each publication citations have been counted until the end of 2011. A detailed discussion of this map can be found in Van Eck et al., (2013).

101
Citations, h-Index, Journal Impact and Rankings: Not all Sorrow and Misery
CWTS University-Industry Research Cooperation Scoreboard;
on the effect of language in rankings (Van Raan et al.,
2011); and on the large differences in citation density within
medical research fields (Van Eck et al., 2013) (see Figure 4 for
an example).
In recent years commercial database producers have started
to launch their own bibliometric products: Elsevier’s Scopus
with SciVal, and Thomson Reuters with InCites. This does
not make life easier for CWTS. But we have a dedicated and
broadly oriented staff and a wide expertise in the application
of bibliometric methods. By further improving our indicator
and mapping products, particularly automated research
performance assessment and mapping tools, by creating the
best possible ranking method (Waltman et al., 2012), and by
our research on the qualitative aspects of scientometrics and
the impact of science on society and on technology, CWTS
will succeed in continuing its forefront position.
Ton F.J. van Raan studied mathematics, physics and
astronomy at Utrecht University. PhD Physics, Utrecht (1973).
Post-doctoral fellow in physics at the University of Bielefeld
(Germany), visiting scientist in the US, UK, and France. From
1977 senior research fellow physics in Leiden, in 1985 ‘field
switch’ from physics to science and technology (S&T) studies.
Since 1991 Professor of Quantitative Studies of Science.
Founder and until 2010 Director of the Centre for Science and
Technology Studies (CWTS), Leiden. As author and co-author
he published around thirty articles in physics and two hundred
in science and technology studies. Ton van Raan also set up
a small company, Science Consult, for advice on research
evaluation and science policy issues. On the occasion of his
retirement as CWTS director he was made a Knight in the Order
of the Dutch Lion by Queen Beatrix of the Netherlands.

102
Perspectives on the past
Literature
De Candolle, A. (1873). Histoire des sciences et des savants
depuis deux siècles. Genève/Basel: H. Georg.
Harzing, A.W. (2010). The Publish or Perish Book. Your
guide to effective and responsible citation analysis.
Melbourne: Tarma Software Research Pty Ltd.
Hirsch, J. E. (2005). An index to quantify an individual’s
scientific research output. Proceedings of the National
Academy of Sciences of the United States of America,
102 , 16569–16572.
Moed, H.F. (2005). Citation Analysis in Research
Evaluation. Dordrecht: Springer.
Moed, H.F. (2010). Measuring contextual citation impact
of scientific journals. Journal of Informetrics 4, 265-
277.
Moed, H.F., Burger, W.J.M., Frankfort, J.G. & Van Raan,
A.F.J. (1983). On the Measurement of Research
Performance: The Use of Bibliometric Indicators.
Leiden: Science Studies Unit.
Moed, H.F. Glänzel, W. & Schmoch, U. (Eds.) (2004).
Handbook of Quantitative Science and Technology
Research. Dordrecht: Kluwer Publishers.
Narin, F. (1976). Evaluative Bibliometrics: The Use of
Publication and Citation Analysis in the Evaluation of
Scientific Activity. Washington D.C.: National Science
Foundation.
Priem, J., Piwowar, H.A. & Hemminger, B.M. (2012).
Altmetrics in the wild: using social media to explore
scholarly impact. http://arxiv.org/abs/1203.4745.
Tijssen, R.J.W., Van Leeuwen, T. N. & Van Raan, A.F.J.
(2002). Mapping the scientific performance of German
medical research. An international comparative
bibliometric study. Stuttgart: Schattauer.
Van Eck, N.J. & Waltman, L. (2010). Software survey:
VOSviewer, a computer program for bibliometric
mapping. Scientometrics 84, 2, 523-538.
Van Eck, N.J., Waltman,L., Van Raan, A.F.J., Klautz, R.J.M.
& Peul, W.C. (2013). Citation analysis may severely
underestimate the impact of clinical research as
compared to basic research. PLOS ONE 8 , e62395.
Van Raan, A.F.J. (1988) (Ed.). Handbook of quantitative
studies of science and technology. Amsterdam: North
Holland.
Van Raan, A.F.J. (2004a). Measuring Science. Capita
Selecta of Current Main Issues. In H.F. Moed,
W. Glänzel & U. Schmoch (Eds.). Handbook of
Quantitative Science and Technology Research, 19-50.
Dordrecht: Kluwer Publishers, 2004.
Van Raan, A.F.J. (2004b). Sleeping Beauties in Science.
Scientometrics, 59, 461-466.
Van Raan, A.F.J. (2005). Fatal Attraction: Conceptual
and methodological problems in the ranking of
universities by bibliometric methods. Scientometrics,
62, 133-143.
Van Raan, A.F.J. (2006). Comparison of the Hirsch-index
with standard bibliometric indicators and with
peer judgment for 147 chemistry research groups.
Scientometrics, 67, 491-502.

103
Citations, h-Index, Journal Impact and Rankings: Not all Sorrow and Misery
Van Raan A.F.J., Van Leeuwen, T.N. & Visser, M.S.
(2011). Severe language effect in university rankings:
particularly Germany and France are wronged in
citation-based rankings. Scientometrics, 88, 495-498.
Waltman, L., Calero-Medina, C., Kosten, J., Noyons,
E.C.M., Tijssen, R.J.W., Van Eck, N.J., Van Leeuwen,
T.N., et.al. (2012). The Leiden Ranking 2011/2012:
data collection, indicators, and interpretation. Journal
of the American Society for Information Science and
Technology, 63, 2419-2432.
Waltman, L. & Van Eck, N.J. (2012). The Inconsistency
of the h-index. Journal of the American Society for
Information Science and Technology 63, 406-415.
Waltman, L., Van Eck, N.J., Van Leeuwen, T.N., Visser,
M.S. & Van Raan, A.F.J. (2011). Towards a new crown
indicator: An empirical analysis. Scientometrics, 87,
467-481.
Wouters, P.F. (1999). The Citation Culture. PhD thesis,
University of Amsterdam.