perspectives on the unchartered global economic...
TRANSCRIPT

Perspectives on the unchartered global economic waters
2/18/2016

Commentary and presentation materials on this occasion are based on the personal views of the speaker and may not coincide with opinions held by Moffatt & Nichol or its employees. 2
Moffatt & Nichol Background
• Established in 1945 in Long Beach, California, currently:• Offices in the Americas, Europe, Middle East and Pacific Rim
• Practices: Goods Movement, Energy, Ports, Coastal, Urban Waterfronts & Marinas, Inspection & Rehabilitation
• Strategic development of marine and freight transportation infrastructure• Freight planning and market analysis
• Investment/privatization analysis
• Cost-benefit analysis to support public private partnerships
• Port selection/network analysis
• Strategic development plans
• Railroads and capacity expansion
• Terminal design for all types of freight and passenger movement
• Coastal engineering
• Port and waterside construction (marinas)
• Environment issues/emission modeling
• Port security

3
The global economy is moving … but which way and how fast?
Transitioning to a more prosperous global economy characterized by a growing middle class
• More people, but older due to healthcare advances, and more urbanized
• Rising productivity (output per capita) from technological advances
• Improving resource recovery
Near term uncertainty due to structural factors
• Emerging markets not yet large or stable enough to offset slowing developed economies
• Growth of the physical stock of capital is characterized by booms and busts
• Technological advances are destroying jobs faster than creation of new ones
• Policy-maker (non-market force) reactions are less predictable
This is the right time to upgrade freight movement infrastructure
• Must keep pace with the changes in global trade logistics – both water and landside
• Interest rates are low and expected to rise only in the US in the near term
• Low input costs: commodities and labor

4
1,762 1,750 1,860
2,070 2,300
2,558
3,043
3,712
4,451
5,288
6,090
6,866
7,631
8,316
8,897
9,376
0
1,000
2,000
3,000
4,000
5,000
6,000
7,000
8,000
9,000
10,000
19
00
19
10
19
20
19
30
19
40
19
50
19
60
19
70
19
80
19
90
20
00
20
10
20
20
20
30
20
40
20
50
20
60
Mill
ion
s
2015 = 7,248
World population is expected to continue increasingWorld population estimates: 1900 to 2050
Source: United Nations, A Maddison
From To Annual Growth
1990 1950 0.7%
1950 1960 1.8%
1960 1970 2.0%
1970 1980 1.8%
1980 1990 1.7%
1990 2000 1.4%
2000 2010 1.2%
2010 2020 1.1%
2020 2030 0.9%
2030 2040 0.7%
2040 2050 0.5%

0
200
400
600
800
1,000
1,200
1,400
1,600
1,800
2,000
0%
5%
10%
15%
20%
25%
1900
1907
1914
1921
1928
1935
1942
1949
1956
1963
1970
1977
1984
1991
1998
2005
2012
2019
2026
2033
2040
2047
Tho
usa
nd
s o
f P
eop
le
Shar
e
65 and Over Share of Population (left) Increase in Over 65 Population (right)
First Boomers Turn 65 (2011)
Last Boomers Turn 65 (2026)
PEOPLE TURNING 65 AND THEIR SHARE OF US POPULATION: 1900 - 2050
Source: Census Bureau, Moffatt & Nichol
0%
10%
20%
30%
40%
50%
60%
1990 2000 2010 2020 2030 2040 2050
Japan
Europe
China
Canada
US
Brazil
Mexico
India
PROPORTION OF POPULATION ABOVE 55 YEARS OF AGE
The “Grey Tsunami”

6
Population distribution by trade laneTRADE LANE SHARES OF THE WORLD POPULATION IN 2010 TRADE LANE SHARES OF THE WORLD POPULATION IN 2050
Source: Census Bureau, Moffatt & Nichol
25.0%
19.8%
9.5%
7.7%
7.0%
4.0%
1.1%
1.7%3.8%
0.4%
0.7%
0.8%
6.6%4.6%
1.8%
0.5%
4.9%17.5%
26.6%
8.7%
4.8%
5.7%
3.6%
1.0%
1.7%4.9%
0.4%
0.7%
0.6%
9.2%7.7%
1.6%
0.4%
4.7%
Larger: South Asia, Middle East, West Africa, East Africa
Smaller: The Americas, Caribbean, Europe, Mediterranean, S Africa,

7
The drivers of global trade growth
From 1950 to 2013, manufactured goods trade has grown twice as fast as real GDP. Among other trends, this is due to:
WORLD REAL GDP AND TRADE INDEXES 1950-2013
Source: WTO, Moffatt & Nichol
• Free Trade Agreements
• Information/Communication Technology
• Maritime and Inland Connectivity Infrastructure
• Demographic Trends
Japan
Korea, Taiwan
China
?
1950 – 2014 CAGR
Manufactured Goods 7.0%
Extraction Goods 3.9%
GDP 3.6%
Agricultural goods 3.6%

8
Divergent global economic growth
Source: IMF WEO, Moffatt & Nichol
TOP 20 COUNTRIES BY NOMINAL GDP IN US$ BILLIONS
Rank Country 1995 Country 2005 Country 2015E
1 US 7,664$ US 13,094$ US 17,968$
2 Japan 5,334$ Japan 4,572$ China 11,385$
3 Germany 2,594$ Germany 2,866$ Japan 4,116$
4 France 1,611$ UK 2,412$ Germany 3,371$
5 UK 1,236$ China 2,269$ UK 2,865$
6 Italy 1,172$ France 2,207$ France 2,423$
7 Brazil 786$ Italy 1,857$ India 2,183$
8 China 732$ Canada 1,164$ Italy 1,819$
9 Spain 612$ Spain 1,159$ Brazil 1,800$
10 Canada 602$ Korea 898$ Canada 1,573$
11 Korea 556$ Brazil 892$ Korea 1,393$
12 Netherlands 447$ Mexico 866$ Australia 1,241$
13 Australia 379$ India 834$ Russia 1,236$
14 India 367$ Russia 764$ Spain 1,221$
15 Mexico 344$ Australia 734$ Mexico 1,161$
16 Switzerland 342$ Netherlands 680$ Indonesia 873$
17 Russia 313$ Turkey 483$ Netherlands 751$
18 Argentina 309$ Switzerland 408$ Turkey 722$
19 Belgium 289$ Sweden 389$ Switzerland 677$
20 Taiwan 279$ Belgium 388$ Saudi Arabia 632$
Share Emerging 12% Emerging 16% Emerging 34%
US 30% US 34% US 30%
ANNUAL REAL GDP GROWTH

9
Growing global middle classWORLD POPULATION AND OECD GLOBAL MIDDLE CLASS PROJECTIONS
Source: OECD, US Census Bureau

10
Cruising is Replacing Containers as the New Growth Industry
CLIA Global Ocean Cruise Passengers (millions) New Ship Build Schedule
Source: CLIA
200917.8M
201019.1M
201120.5M
201220.9M
201321.3M
201422.1M
2015223.0M
Year Ocean River
2015 6 16
2016 9 4
2017 6 2
2018 8 0
2019 3 0
2020 1 0
TOTAL 33 22

11
Increasingly Urbanized, Increasingly Congested
Percentage of urban population and agglomerations by size class: 1980 and 2011
Source: UN Department of Economic and Social Affairs
1980 2011
Three major migration trends in the US are to the south, to the coasts and to urban areas. Rest of the world is urbanizing too. Substitution of capital for labor in rural areas and higher income offered by manufacturing and services in urban areas drive migration to urban areas. Better service supply in urban areas also attracts retirees. In major port cities it is likely that congestion could worsen.
12
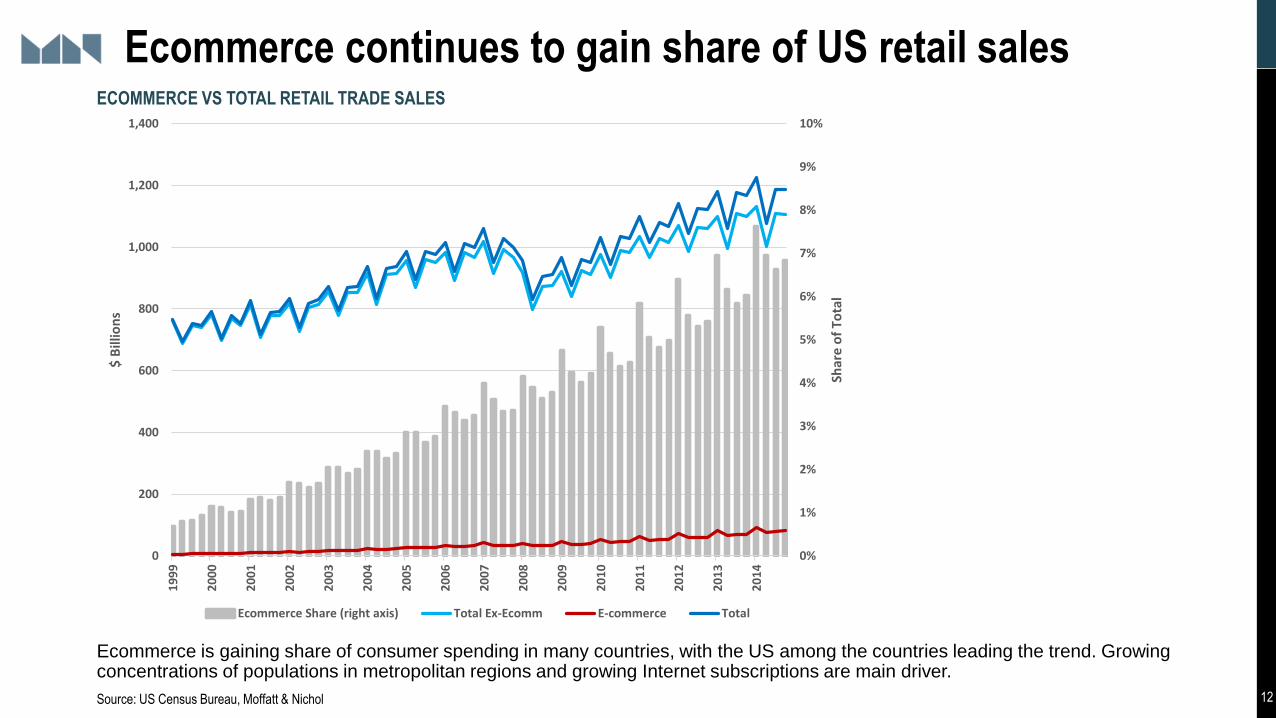
Ecommerce continues to gain share of US retail sales
Ecommerce is gaining share of consumer spending in many countries, with the US among the countries leading the trend. Growingconcentrations of populations in metropolitan regions and growing Internet subscriptions are main driver.
ECOMMERCE VS TOTAL RETAIL TRADE SALES
Source: US Census Bureau, Moffatt & Nichol
0%
1%
2%
3%
4%
5%
6%
7%
8%
9%
10%
0
200
400
600
800
1,000
1,200
1,400
19
99
20
00
20
01
20
02
20
03
20
04
20
05
20
06
20
07
20
08
20
09
20
10
20
11
20
12
20
13
20
14
Shar
e o
f To
tal
$ B
illio
ns
Ecommerce Share (right axis) Total Ex-Ecomm E-commerce Total

13
Supply chain/final delivery evolving and impacting retail strategyECOMMERCE SERVICE SUPPLIERS
Source: UPS presentation at Port of Long Beach Pulse of the Port event
There are many new entrants in the ecommerce market and potentially even more will join. Significant evolution is the only discernible trend.

14
China has a large impact on commodity flowsINVESTMENT SHARE OF GDP AND IMF FORECASTS
Source: IMF, UN Comtrade, Moffatt & Nichol
CHINA’S SHARE OF WORLD COMMODITY IMPORTS
%
The 2011 5-Year Plan called for China’s economy to be less dependent on exports and investment, and more dependent on domestic consumption spending. Since then the share of GDP coming from exports and investment has declined. China continues to have the largest share of global raw materials imports.

15
US has led global growth since 2011REAL GDP GROWTH: MAJOR ECONOMIES
Source: Bloomberg, IMF, Moffatt & Nichol
Between 2011 and 2015 the US is the only major economy to sustain higher growth.

16
Caribbean and Latin America in a global contextREAL GDP GROWTH: ECONOMIC REGIONS
Source: IMF
-6%
-4%
-2%
0%
2%
4%
6%
8%
10%1
98
0
19
82
19
84
19
86
19
88
19
90
19
92
19
94
19
96
19
98
20
00
20
02
20
04
20
06
20
08
20
10
20
12
20
14
20
16
20
18
20
20
World LatAm and the Caribbean
Advanced economies Emerging market economies

17
A virtuous cycle of US employment and consumer spending EMPLOYMENT AND RETAIL SALES VOLUMES
Source: Bureau of Labor Statistics, National Bureau for Economic Research, Moffatt & Nichol

18
US Dollar is cyclically strong but structurally weakDOLLAR-EURO EXCHANGE RATE AND THE SPREAD BETWEEN US AND GERMAN GOVERNMENT BONDS
Source: Trading Economics, Moffatt & Nichol
Generally speaking, a country’s currency gains value in foreign exchange markets when its economy is getting stronger and this is reflected in rising interest rates.
Financial markets under-valued the US Dollar relative to the Euro throughout most of 2014.

19
Stronger USD is correlated with lower commodity pricesS&P GLOBAL GOLDMAN SACHS COMMODITY INDEX AND TRADE-WEIGHTED US DOLLAR INDEX OF EXCHANGE RATES
Source: Bloomberg, Federal Reserve, Moffatt & Nichol

20
Agricultural prices declined less than for other commoditiesABSOLUTE AND RELATIVE PERCENTAGE CHANGE OF COMMODITY PRICES AND COMMODITY PRICE INDEXES
Source: Trading Economics, Moffatt & Nichol
Key Indexes Actual Date Yearly Relative to GSCI Industrial Metals Actual Date Yearly Relative to GSCI Consumer Agriculture Actual Date Yearly Relative to GSCI
Baltic Dry 363 19-Jan -52% -23% Copper 1.97 21-Jan -25% 4% Corn 369 21-Jan 0% 28%
CRB Index 159.99 19-Jan -29% 0% Iron Ore 42.1 19-Jan -38% -9% Soybeans 875.5 21-Jan -10% 19%
GSCI Index 279 18-Jan -29% 0% Lead 1634.5 19-Jan -14% 15% Wheat 471.5 21-Jan -13% 16%
LME Index 2085.1 19-Jan -24% 4% Molybdenum 11650 19-Jan -45% -17% Rice 10.85 21-Jan -5% 24%
Nickel 8563 19-Jan -42% -13% Canola 484.8 21-Jan 8% 36%
Energy Actual Date Yearly Relative to GSCI Aluminum 1470 20-Jan -21% 7% Cocoa 2810 20-Jan -6% 23%
Crude oil 26.78 20-Jan -42% -13% Tin 13380 20-Jan -31% -2% Orange Juice 120.05 20-Jan -18% 11%
Brent crude oil 27.84 21-Jan -41% -13% Zinc 1482.5 20-Jan -31% -2% Coffee 112.2 20-Jan -32% -3%
Natural gas 2.163 21-Jan -26% 2% Coal 48.85 19-Jan -20% 8% Oat 201.25 21-Jan -38% -9%
Gasoline 1.034 21-Jan -20% 9% Cobalt 23750 19-Jan -23% 6% Sugar 14.19 20-Jan -9% 20%
Heating oil 0.8764 21-Jan -47% -18% Steel 210 19-Jan -57% -28%
Ethanol 1.37 21-Jan -4% 25% Livestock Actual Date Yearly Relative to GSCI
Industrial Agriculture Actual Date Yearly Relative to GSCI Feeder Cattle 148.1 21-Jan -28% 1%
Metals Actual Date Yearly Relative to GSCI Cotton 61.83 21-Jan 8% 36% Live Cattle 128.52 20-Jan -16% 13%
Gold 1100.51 20-Jan -15% 14% Rubber 156.6 21-Jan -19% 10% Lean Hogs 67.25 21-Jan -9% 19%
Silver 14.15 20-Jan -21% 8% Lumber 238.4 20-Jan -24% 5% Beef 10.25 19-Jan 13% 42%
Platinum 821 21-Jan -36% -7% Wool 1283 19-Jan 22% 50%
Palladium 497.23 21-Jan -36% -7%
Commodity prices are quoted and traded in US Dollars. In the last 12 months the US Dollar has appreciated against virtually every currency in the world. It is not surprising that commodity prices have declined.
Commodities that have suffered the largest decline in prices were energy and metals. With a few exceptions agricultural commodity prices did not decline as much as energy and industrial commodities’ prices did. Some agricultural commodity prices have actually risen over the last 12 months.

21
China is changing its foreign exchange policy
Source: Wall Street Journal
In the last 12 months the US Dollar has appreciated against virtually other currencies except those that are pegged to it. China’s share of US imports has declined as its currency has appreciated against that of other countries because the Renminbi was pegged to the strengthening US Dollar.
In 2015 China said it was focusing on a new currency basket index. This was largely ignored because in the past, when China mentioned linking its currency to a basket, it did not follow through. Likely because the Dollar was depreciating against the currencies of China’s competitors.
According to the Wall Street Journal, last December on a Friday evening an editorial was posted on the People Bank of China’s website, indicating in vague language that it was tracking the yuan against a basket of trading partners’ currencies and against the US Dollar.
It is likely that China is being vague because if it follows such a formula, currency traders could try to test the PBOC’s ability to do so, which would reduce its ability to support the economy.
Most commodities are priced and traded in US Dollar. Therefore the US Dollar- Chinese Renminbi exchange rate still matters because China is a major commodity importer.
Better explained intentions might reduce increases in market volatility that seem to occur every time the yuan weakens against the dollar.

22
-5%
0%
5%
10%
15%
20%
2010 2011 2012 2013 2014 2015% C
han
ge o
ver
sam
e m
on
th o
ne
ye
ar a
go
US Industrial Production US Retail Sales
Global economy is currently driven by consumers
UNITED STATES
Source: Trading Economics, Moffatt & Nichol
-5%
0%
5%
10%
15%
20%
2010 2011 2012 2013 2014 2015% C
han
ge o
ver
sam
e m
on
th o
ne
ye
ar a
go
EU Industrial Production EU Retail Sales
-5%
0%
5%
10%
15%
20%
2010 2011 2012 2013 2014 2015% C
han
ge o
ver
sam
e m
on
th o
ne
ye
ar a
goChina Industrial Production China Retail Sales
EURO AREA
CHINARetail sales growth data is not adjusted for inflation and includes spending on gasoline. Declines in gasoline prices will lower retail sales spending growth rates
Consumer spending is holding up better than industrial production in all three major economies
Countries that use the Euro as their currency stopped dragging on world economic growth at the end of 2014
US industrial production is impacted more negatively by declining energy and mining activity than in the Euro Area and China

23
40,000
45,000
50,000
55,000
60,000
65,000
1 2 3 4 5 6 7 8 9 10 11 12
Ag/Wood Products
2007 2009 2011 2013 2015
Rail volumes mostly supported by consumer spendingMONTHLY RAIL CARLOADS BY TYPE OF FREIGHT
Source: AAR, Moffatt & Nichol
60,000
70,000
80,000
90,000
100,000
110,000
120,000
130,000
140,000
1 2 3 4 5 6 7 8 9 10 11 12
Industrial
2007 2009 2011 2013 2015
80,000
90,000
100,000
110,000
120,000
130,000
140,000
150,000
160,000
1 2 3 4 5 6 7 8 9 10 11 12
Energy
2007 2009 2011 2013 2015
160,000
180,000
200,000
220,000
240,000
260,000
280,000
300,000
1 2 3 4 5 6 7 8 9 10 11 12
Intermodal
2007 2009 2011 2013 2015

24
US international trade in goods
Between 2011 and 2014, US exports grew faster than imports. Imports are likely to grow faster than exports from 2015 to 2018.
ANNUAL GROWTH RATE OF THE VOLUME OF US IMPORTS AND EXPORTS OF GOODS
Source: BEA, Moffatt & Nichol
-25%
-20%
-15%
-10%
-5%
0%
5%
10%
15%
20%
25%
2000 2001 2002 2003 2004 2005 2006 2007 2008 2009 2010 2011 2012 2013 2014 2015
Goods Exports Volume Goods Imports Volume

25
US Trade deficit remains high despite improving oil tradeUS TRADE DEFICIT
Source: US Census Bureau, Moffatt & Nichol
The US has helped the world economy develop, particularly emerging market economies, by allowing its trade balance to be in deficit. This isn’t sustainable in the long run. Reducing the trade deficit is important for employment and therefore economic growth. The decreasing US oil trade deficit has directly helped strengthen our goods balance and in the process helped US employment recover from the deep 2007-2009 recession. Reversal of oil export ban will also help. But more, a further reduction in the deficit, is needed.
9% of the trade deficit is
due to oil, used to be
more than 40%

26
What can the US can competitively export?
Containerized Score Bulk/Breakbulk Score
Wood Pulp Scrap and Waste 9.4 Oil Seeds (Soy) 32.7
Oil Seeds (Soy) 1.1 Meat and Other Edible Animal Parts 28.7
Raw Hides And Leather 0.8 Cereal Grains 3.9
Cotton - Untreated, Yarn And Woven Fabric 0.7 Animal Feed 3.4
Animal Feed 0.7 Wood And Charcoal 0.4
Meat and Other Edible Animal Parts 0.3 Crude Oil and Refined Petroleum/Natural Gas Products 0.4
Plastics Feedstock and Manufactured Goods 0.2 Live Animals 0.3
Iron And Steel 0.1 Wood Pulp Scrap and Waste 0.2
Paper and Paperboard 0.1 Fish and Crustaceans 0.2
Chemical Products 0.1 Dairy Products, including Eggs and Honey 0.1
Cereals 0.1 Organic Chemicals 0.1
Organic Chemicals 0.1 Plastics Feedstock and Manufactured Goods 0.1
TOP 10 HIGH POTENTIAL US NET EXPORTS
1 Based on relative comparative advantage as defined by Bela Belassi
Source: US Census Bureau, Moffatt & Nichol
Agriculture, Capital goods and Energy. Labor is more expensive and capital is cheaper in the US compared to fast growing emerging market economies such as China. The US has comparative (and competitive) advantages in the production of goods that use little labor. This is shown in the list of goods that the US has been prone to export.

27
US oil production is a major threat to OPEC
Falling oil prices are the result of increasing production as opposed to decreasing consumption.
Saudi Arabia is concerned about rising production in the US and Russia, as well as Iran potentially doubling its output.
CRUDE OIL PRODUCTION – THREE LARGEST PRODUCERS SEVEN LARGEST PRODUCERS (BILLIONS OF BARRELS)
Source: EIA, Moffatt & Nichol
0
2
4
6
8
10
121
96
5
19
67
19
69
19
71
19
73
19
75
19
77
19
79
19
81
19
83
19
85
19
87
19
89
19
91
19
93
19
95
19
97
19
99
20
01
20
03
20
05
20
07
20
09
20
11
20
13
20
15
Mill
ion
Bar
rels
Pe
r D
ay
US Saudi Arabia Russia
2005 2015E Change
US 1.9 3.4 1.5
Saudi Arabia 3.5 3.7 0.2
Russia 3.3 3.7 0.4
Iraq 0.7 1.5 0.8
Iran 1.5 1.2 -0.3
China 1.3 1.6 0.2
Canada 0.9 1.4 0.5

28
US manufacturing is growing but using less laborUS INDUSTRIAL PRODUCTION AND MANUFACTURING EMPLOYMENT: 1950 -2015
Source: Federal Reserve, Labor Department, Moffatt & Nichol
0
100
200
300
400
500
600
700
800
19
50
19
52
19
55
19
58
19
60
19
63
19
66
19
68
19
71
19
74
19
76
19
79
19
82
19
84
19
87
19
90
19
92
19
95
19
98
20
00
20
03
20
06
20
08
20
11
20
14
Ind
ex V
alu
es
(Jan
uar
y 1
95
0 =
10
0)
Industrial Production Manufacturing Employment
US manufacturing output is almost 8x the level of 1950 while employment is 25% lower. This is due to the changing nature of the commodities manufactured in the US (higher technology content) and automation. Using a minimum of relatively expensive US labor allows capital goods to be cost competitive.
29
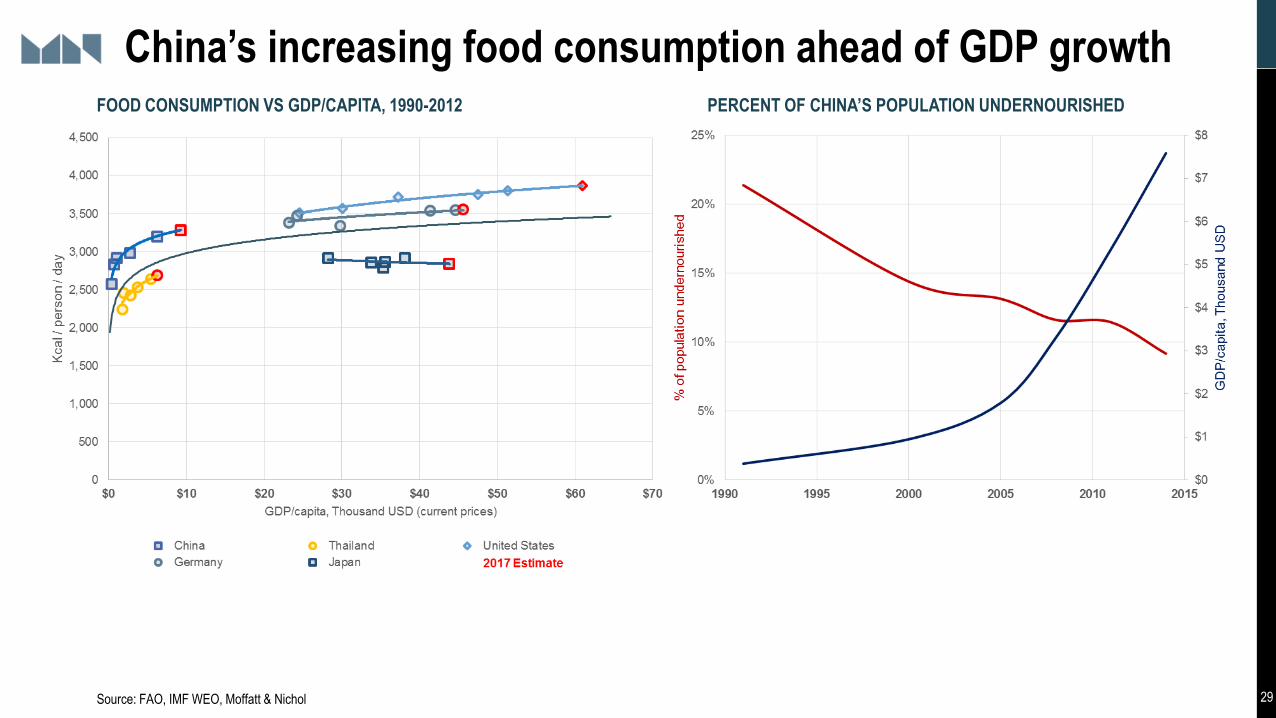
China’s increasing food consumption ahead of GDP growthFOOD CONSUMPTION VS GDP/CAPITA, 1990-2012 PERCENT OF CHINA’S POPULATION UNDERNOURISHED
Source: FAO, IMF WEO, Moffatt & Nichol

30
Water is the overlooked looming resource crisisGLOBAL DISTRIBUTION OF PHYSICAL WATER SCARCITY
Source: UN-FAO, US Government Agencies
Water is becoming increasingly scarce in Asia, the Middle East and in the Western half of the US. The Americas otherwise have abundant water and are likely to grow in importance as the world’s breadbasket.
Changes In The Ogallala Aquifer Water Level

31
Asia is the dominant destination of US grains and oilseedsUS GRAIN AND OILSEED EXPORTS (MILLION METRIC TONS) BY DESTINATION
Source: US Census Bureau, Moffatt & Nichol
2003 2005 2007 2009 2011 2013 2014 +/- Share
Asia - East & Southeast 52% 53% 50% 63% 60% 62% 62% 10%
China 11% 10% 10% 21% 21% 34% 30% 19%
South & Central America 14% 15% 15% 13% 11% 15% 17% 3%
Africa 13% 14% 14% 9% 11% 7% 6% -6%
Europe 9% 5% 7% 4% 4% 6% 6% -3%
North America 9% 7% 6% 7% 7% 7% 6% -3%
Middle East 4% 5% 7% 4% 6% 3% 3% -1%
Asia - South 0% 0% 1% 0% 0% 0% 0% 0%
100% 100% 100% 100% 100% 100% 100%

32
Empty container availability is very poor in less urban areasCONTAINER SHORTAGE INCIDENCE BY CITY
Dry Reefer
20ft 40ft 40ft High Average 20ft Average Average
East
New York 0% 0% 0% 0% 0% 0% 0%
Norfolk 0% 0% 0% 0% 0% 2% 1%
Charleston 2% 0% 0% 1% 4% 4% 4%
Savannah 0% 0% 0% 0% 0% 0% 0%
Nort
hC
entr
al Minneapolis 44% 44% 17% 35% 100% 92% 96%
Chicago 0% 10% 2% 4% 0% 2% 1%
Cincinnati 0% 2% 4% 2% 2% 42% 22%
Columbus 2% 2% 0% 1% 10% 31% 20%
Kansas City 2% 19% 13% 12% 0% 29% 14%
South
Centr
al Memphis 2% 0% 0% 1% 8% 94% 51%
New Orleans 4% 23% 12% 13% 0% 17% 9%
Dallas 0% 0% 0% 0% 0% 98% 49%
Houston 2% 29% 0% 10% 0% 0% 0%
Denver 0% 0% 0% 0% 44% 98% 71%
West
LALB 0% 0% 0% 0% 0% 0% 0%
Oakland 0% 0% 2% 1% 0% 2% 1%
Seattle 4% 0% 17% 7% 0% 0% 0%
Tacoma 0% 6% 19% 8% 48% 12% 30%
Exporters in areas of the Midwest that are not very urban have the least amounts of containers available. This hampers agricultural exports that are best suited for containerization. Less congestion in port gateways could improve container availability in the Midwest.
Source: US Department of Agriculture, Moffatt & Nichol

33
Ships continue to get larger – Need deeper depth and air draftEVOLUTION OF CONTAINERSHIP SIZE
Source: Alphaliner, Panama Canal Authority, Moffatt & Nichol
22%
78%
12%
88%
2015
2012
SHARE OF FLEET CAPACITY VESSEL SHARING ALLIANCES (EAST-WEST TRADES)
What will this share be by 2020?

34
Workload and traffic generation for an 18K TEU service

35
Congestion is a global problem that needs local solutions
PORT OF SHANGHAI, CHINA PORT TRAFFIC IN SOUTHERN CALIFORNIATRUCK TRAFFIC IN ROTTERDAM
US problems are compounded in some areas due to chassis supply and changing industry practices
Highly recommended to read

36
Intermodal capacity is needed to reduce congestionPORT OF NEW YORK AND NEW JERSEY CONTAINER TERMINALS AND INLAND CONNECTIVITY INFRASTRUCTURE

37
Expanded cost-benefit analysis of at-grade separations
Source: NC-DOT, Moffatt & Nichol
• Primary effect costs: Direct, indirect, and intangible costs
associated with property damage, injury, and fatal crashes
(more visible at the time of the crash)
• Injury and Fatality cost
• Highway vehicle damage
• Rail Infrastructure Damage
• Rail Equipment Damage
• HazMat release cost
• Secondary effect costs: Costs accrued to delayed travelers and cargo, and to parties beyond the immediate road and rail travelers and service operators (less visible at the time of the crash)
• Delay and Rerouting Costs
• Supply Chain Transport Costs
• Supply Chain Inventory Cost

38
Ports are investingAt least $28.9 billion of $46 billion infrastructure investment gap needed by 2025 (AAPA)
HMT SPENDING TARGETS IN WRRDA
FY2015 67%
FY2016 69%
FY 2017 71%
FY 2018 74%
FY 2019 77%
FY 2020 80%
FY 2021 83%
FY 2022 87%
FY 2023 91%
FY 2024 95%
FY 2025+ 100%

39
The economy is moving … but which way and how fast?
Transitioning to a more prosperous global economy characterized by a growing middle class
• More people, but older due to healthcare advances, and more urbanized
• Rising productivity (output per capita) from technological advances
• Improving resource recovery
Near term uncertainty due to structural factors
• Emerging markets not yet large or stable enough to offset slowing developed economies
• Growth of the physical stock of capital is characterized by booms and busts
• Technological advances are destroying jobs faster than creation of new ones
• Policy-maker (non-market force) reactions are less predictable
This is the right time to upgrade freight movement infrastructure
• Must keep pace with the changes in global trade logistics – both water and landside
• Interest rates are low and expected to rise only in the US in the near term
• Low input costs: commodities and labor

Dr. Walter Kemmsies, Chief EconomistMoffatt & Nichol, New York
104 West 40th StreetNew YorkNY 10018
T 212.768.7454F 212.768.7936
www.moffattnichol.com
Dr. Walter Kemmsies, Chief EconomistMoffatt & Nichol
529 5th Avenue – 14th FloorNew York, NY 10017
T: 212 768 7454E: [email protected]
www.moffattnichol.com