pertaining to the following scheduled items -...
TRANSCRIPT
SUPPLEMENTAL MATERIAL
WAS ADDED TO THE
BOARD OF DIRECTORS
March 15, 2018
AGENDA PACKET
Pertaining to the following Scheduled Items:
3/14/2018
ITEM NO. 5: STRATEGIC PLANNING 2016-19: BOARD PRIORITIES - Added
ITEM NO. 6: A RESOLUTION OF INTENTION TO APPROVE AN AMENDMENT TO THE CONTRACT WITH
THE BOARD OF ADMINISTRATION OF THE CALIFORNIA PUBLIC EMPLOYEE RETIREMENT
SYSTEM (CALPERS)
ITEM NO. 7: A RESOLUTION APPROVING AN AGREEMENT WITH REPUBLIC SERVICES OF SALINAS
FOR PHASED-IN ORGANICS PROCESSING RATE ADJUSTMENT THROUGH FISCAL YEAR
2021-2022 - Revision of Slide
ITEM NO. 8: A RESOLUTION APPROVING THE DISPOSAL AND SERVICE FEES EFFECTIVE JULY 1, 2018
- Revision and Addition of Slides
ITEM NO. 9: A RESOLUTION APPROVING THE OPERATING BUDGET, PERSONNEL ALLOCATION AND
SALARY SCHEDULE FOR FISCAL YEAR 2018-19
The “Supplemental Materials” have been added to the end of its corresponding agenda
item in the agenda packet.

Page 1 of 2 Board of Directors March 15, 2018
A G E N D A
Regular Meeting
BOARD OF DIRECTORS
March 15, 2018, 6:00 p.m. Gonzales City Council Chambers
117 Fourth Street, Gonzales, California
CALL TO ORDER
PLEDGE OF ALLEGIANCE
ROLL CALL
Board Directors Alternate Directors County: Simon Salinas, President County: Luis Alejo
County: John M. Phillips Salinas: Joseph D. Gunter
Salinas: Gloria De La Rosa, Alt. Vice-President Gonzales: Scott Funk
Salinas: Tony R. Barrera Soledad: Carla Stewart
Salinas: Kimbley Craig Greenfield: Lance Walker
Gonzales: Elizabeth Silva King City: Darlene Acosta
Soledad: Christopher K. Bourke
Greenfield: Avelina T. Torres
King City: Robert S. Cullen, Vice President
TRANSLATION SERVICES AND OTHER MEETING ANNOUNCEMENTS
GENERAL MANAGER/CAO COMMENTS
DEPARTMENT MANAGER COMMENTS
BOARD DIRECTOR COMMENTS
PUBLIC COMMENT Receive public comment from audience on items which are not on the agenda. The public may comment on scheduled agenda items as the Board considers them. Speakers are limited to three minutes at the discretion of the Chair.
CONSENT AGENDA: All matters listed under the Consent Agenda may be enacted by one motion unless a member of the Board, a citizen, or
a staff member requests discussion or a separate vote.
1. Minutes of February 15, 2018, Regular Meeting
2. January 2018 Claims and Financial Reports
3. Member and Interagency Activity Report for February 2018 and Upcoming Events
4. Cost-Benefit Analysis for Processing Construction and Demolition Material by Salinas Valley
Solid Waste Authority or Monterey Regional Waste Management District
PRESENTATION
5. STRATEGIC PLANNING 2016-19: BOARD PRIORITIES
A. Receive Report from Mandy Brooks, Resource Recovery Manager
B. Public Hearing
C. Board Discussion
D. Recommended Action – None; Informational Only
CONSIDERATION
6. A RESOLUTION OF INTENTION TO APPROVE AN AMENDMENT TO THE CONTRACT WITH THE BOARD OF
ADMINISTRATION OF THE CALIFORNIA PUBLIC EMPLOYEE RETIREMENT SYSTEM (CALPERS)
A. Receive Report from Ray Hendricks, Finance and Administration Manager

Page 2 of 2 Board of Directors March 15, 2018
B. Board Discussion
C. Public Comment
D. Recommended Action – Adopt Resolution
7. A RESOLUTION APPROVING AN AGREEMENT WITH REPUBLIC SERVICES OF SALINAS FOR PHASED-IN ORGANICS
PROCESSING RATE ADJUSTMENT THROUGH FISCAL YEAR 2021-2022
A. Receive Report from Patrick Mathews, General Manager/CAO
B. Public Hearing
C. Board Discussion
D. Recommended Action – Adopt Resolution
PUBLIC HEARING
8. A RESOLUTION APPROVING THE DISPOSAL AND SERVICE FEES EFFECTIVE JULY 1, 2018
A. Receive Report from Ray Hendricks, Finance and Administration Manager
B. Public Hearing
C. Board Discussion
D. Recommended Action – Adopt Resolution
CONSIDERATION
9. A RESOLUTION APPROVING THE OPERATING BUDGET, PERSONNEL ALLOCATION AND SALARY SCHEDULE FOR
FISCAL YEAR 2018-19
A. Receive Report from Ray Hendricks, Finance and Administration Manager
B. Board Discussion
C. Public Comment
D. Recommended Action – Adopt Resolution
FUTURE AGENDA ITEMS
10. AGENDA ITEMS – VIEW AHEAD SCHEDULE
ADJOURNMENT
This agenda was posted at the Administration Office of the Salinas Valley Solid Waste Authority, 128 Sun St., Ste 101, Salinas, on the Gonzales Council Chambers Bulletin Board, 117 Fourth Street, Gonzales, and the Authority’s Website on Thursday, March 8, 2018. The Salinas Valley Solid Waste Authority Board will next meet in regular session on, Thursday, April 19, 2018. Staff reports for the Authority Board meetings are available for review at: Salinas Valley Solid Waste Authority: 128 Sun Street, Ste. 101, Salinas, CA 93901, Phone 831-775-3000 Web Site: www.salinasvalleyrecycles.org Public Library Branches in Gonzales, Prunedale and Soledad. In compliance with the Americans with Disabilities Act, if you need special assistance to participate in the meeting, please contact Erika J. Trujillo, Clerk of the Board at 831-775-3000. Notification 48 hours prior to the meeting will enable the Authority to make reasonable arrangements to ensure accessibility to this meeting (28 CFR 35.102-35.104 ADA Title II). Spanish interpretation will be provided at the meeting. Se proporcionará interpretación a Español.
DRAFT Minutes – February 15, 2018
Page 1 of 4
MINUTES OF
THE SALINAS VALLEY SOLID WASTE AUTHORITY
BOARD MEETING
FEBRUARY 15, 2018
CALL TO ORDER
President Salinas called the meeting to order at 6:00 p.m.
ROLL CALL
The following Board Directors were present:
County of Monterey Simon Salinas, President
County of Monterey John M. Phillips
City of Salinas Tony Barrera
City of Salinas Kimbley Craig
City of Salinas Joseph Gunter (Alternate)
City of Gonzales Elizabeth Silva
City of Soledad Christopher K. Bourke
City of King Robert Cullen, Vice President
The following Board Directors were absent:
City of Salinas Gloria De La Rosa, Alt. Vice President
City of Greenfield Avelina Torres
Staff Members Present:
Patrick Mathews, General Manager/CAO
Cesar Zuñiga, Asst. GM/Operations Manager
Brian Kennedy, Engineering & Environmental
Compliance Manager
Mandy Brooks, Resource Recovery Manager
Cindy Iglesias, Administrative Assistant II
Erika J. Trujillo, Clerk of the Board
Scott Gordon, General Counsel
MEETING ANNOUNCEMENTS
(6:01) President Salinas announced translation services were available. No member from the
public requested the service.
GENERAL MANAGER COMMENTS
(6:02) General Manager/CAO Mathews informed the Board that with the remodeling of the
Gonzales City Council Chambers the microphones now need to be turned on before speaking
for the audio to be captured. He provided the flyer for the Special District Leadership Academy
Conference hosted by the California Special District Association, extending an invitation to any
Board member that would be interested in attending on behalf of the Authority. Mr. Mathews
stated that design and engineering for Johnson Canyon Landfill Modules VII & VIII is about to
begin and indicated there is an item in the consent agenda related to that work.
DEPARTMENT MANAGER COMMENTS
(6:03) Asst. General Manager/Operations Manager Zuñiga informed the Board of the
notification received from Waste Management, whom manages the Maddison Lane Transfer
Station, regarding a 20% rate increase effective March 1, 2018. He explained this will have a
significant impact on the cost of the over-flow of the Salinas waste that is redirected to that
facility. Mr. Zuñiga stated staff will be working with Republic Services on analyzing if direct haul
to the Johnson Canyon Landfill will be more cost effective. He indicated he will keep the Board
informed.
ITEM NO. 1
Agenda Item
General Manager/CAO
S. Gordon by et General Counsel Approval
DRAFT Minutes – February 15, 2018
Page 2 of 4
BOARD DIRECTORS COMMENTS
(6:04) Director Cullen reported on his attendance to Farm Day in King City commending the
Authority staff for the set up and great representation of the Authority. He also commended
staff for their participation at the Trash and Show in King City earlier in the day. Director Silva
commented on her attendance as well to the Trash and Show explaining that over 300 people
from Monterey County attended this charity event that benefits Alliance on Aging. Director
Phillips commented on an article in the Weekly newspaper regarding trash becoming a problem
in Monterey County. He stated trash along the highway is a real concern throughout the
county. Director Salinas commented on a letter received from the Farm Bureau regarding
scheduling a meeting to develop a task force to help identify possible solutions for the litter issue.
PUBLIC COMMENT
(6:07) None
CONSENT AGENDA (6:07)
1. Minutes of January 18, 2018, Regular Meeting
2. December 2017 Claims and Financial Reports
3. Member and Interagency Activity Report for January 2108 and Upcoming Events
4. Tonnage and Diversion Report for the Quarter Ended December 31, 2017
5. Resolution 2018-02 Approving an Agreement with Geo-Logic Associates for Consulting
and Engineering Services for Johnson Canyon Landfill for an Amount of $262,123.00
6. Resolution 2018-03 Awarding the Purchase of One Used Caterpillar 938K Loader to
Quinn Company for an Amount of $168,870.93
7. Resolution 2018-04 Awarding the Purchase of Two New 2019 Peterbilt 567 CNG Transfer
Trucks for the Sun Street Transfer Station Operations to Coast Counties Truck and
Equipment for an Amount of $386,276.60
8. Resolution 2018-05 Approving Amendment No. 7 to the Revised and Restated
Agreement Between the Salinas Valley Solid Waste Authority and R. Patrick Mathews
for Services as General Manager/Chief Administrative Office
9. Resolution 2018-06 Approving an Adjustment to the Grant and Capital Improvement
Projects Budget for Fiscal Year 2017-18
10. Resolution 2018-07 Approving the Regular Board of Directors and Executive Meetings
Calendar for 2018
11. Resolution 2018-08 Approving Change Order No. 1 for $21,379.68 to the Professional
Service Agreement with Salinas Pump Company for the Replacement Groundwater
Well Construction Services at the Johnson Canyon Landfill
Board Comments: President Salinas cited the following summary for Item No. 8 in compliance
with Senate Bill 1436, “before the Board of Directors this evening, as part of
agenda Item No. 8 is a recommendation to approve Amendment No. 7 to
the Employment Agreement between the Authority and R. Patrick Mathews
for Services as General Manager and Chief Administrative Officer. The
Amendment before the Board of Directors includes: 1) A 5% merit increase in
current Base Salary effective January 1, 2018. 2) Amended language on the
General Manager’s performance rating system to allow more Board
discretion on merit increases. 3) Adjusting PERS contribution language to
increase the General Manager’s contribution to 8% effective July 1, 2018.”
Director Cullen requested to pull Item No. 10 for separate discussion.
DRAFT Minutes – February 15, 2018
Page 3 of 4
Public Comment: None
Motion: Director Phillips made a motion to approve the consent agenda as
presented with the exception of Item No. 10 to be discussed separately.
Director Gunter seconded the motion.
Votes: Motion carried 8,0
Ayes: Salinas, Cullen, Silva, Barrera, Craig, Bourke, Phillips, Gunter (Alt.)
Noes: None
Abstain: None
Absent: De La Rosa, Torres
10. RESOLUTION 2018-07 APPROVING THE REGULAR BOARD OF DIRECTORS AND EXECUTIVE MEETINGS
CALENDAR FOR 2018 (6:10) Director Cullen reported that the Executive Committee had discussed the October meeting
scheduled to started at 5:00 p.m. that would include a Strategic Planning Session. He stated their
recommendation is that the start time for that meeting be earlier in the day.
Board Comments: Director Craig, Director Bourke, Director Barrera, and Alternate Director
Gunter, commented on their opposition to the Executive Committees
recommendation. Director Salinas, Director Silva, and Director Cullen
commented on their support for the Executive Committee’s
recommendation. Director Phillips stated he has no preference. Public Comment: None
Motion: Director Craig made a motion to approve the item as presented. Director
Bourke seconded the motion.
Votes: Motion carried 8,0
Ayes: Salinas, Cullen, Silva, Barrera, Craig, Bourke, Phillips, Gunter (Alt.)
Noes: None
Abstain: None
Absent: De La Rosa, Torres
PRESENTATION
12. UPDATE ON LONG-TERM FACILITY NEEDS PROJECT ENVIRONMENTAL IMPACT REPORT AND DUE
DILIGENCE STUDIES/ACTIVITIES (6:14) General Manger/CAO Mathews provided a report on the status of the Long-Term Facility
Needs (LTFN) Project activities explaining that the work related to the California Environmental
Quality Act (CEQA) Environmental Impact Report (EIR) is temporarily suspended due to the
elimination of the Harrison/Sala Road project option caused by the termination of the purchase
option agreement for that property and the elimination of the Crazy Horse Landfill option due to
its size. He stated the development of a revised CEQA project description is being considered
and provided information on relevant meetings held. Mr. Mathews explained that the draft
Financial/Rate model preparation will continue on the remaining projects only and is awaiting
information from the CEQA studies and information from MRWMD negotiations to be able to
populate various financial model and CEQA chapter components. The Economic Benefits Report
will not be finalized until the draft EIR and Financial/Rate Impact Analysis are near completion. Mr.
Mathews explained that when development of a revised CEQA project description is completed,
re-noticing would be conducted projecting it could occur after April’s strategic plan discussion.
Board Comments: The Board discussed the presentation inquiring about the funding of CEQA
and the agreement between Global OrganicS and the Authority related to
CEQA with Authority staff and Legal Counsel Gordon responding. Director
Craig requested a copy of the said agreement. Director Phillips commented

DRAFT Minutes – February 15, 2018
Page 4 of 4
on his support for the elimination of the Crazy Horse Landfill from the LTFN
options list. There was consensus to support the potential addition of the
Madison Lane Transfer station to the LTFN option list.
Public Comment: None
Motion: None; Informational Only
CONSIDERATION
13. FISCAL YEAR 2018-19 PRELIMINARY BUDGET (6:50) General Manager/CAO Mathews presented a report with the projected revenues and
expenses for a balanced 2018-19 fiscal year budget. He detailed the foreseen program
increases for the Authority and the limited rate adjustments being recommended that will assist
in the balancing of the budget. Mr. Mathews explained that the Authority is working with
Republic Services on the revised green waste agreement to eliminate the subsidized rates and
presented the organics fee adjustments that anticipate the changes to that agreement.
Board Comments: The Board discussed the report.
Public Comments: Steve McCaffery from Republic Services commented on the company’s
support of the City of Salinas opinion relative of the green waste
agreement between the Authority and Republic Services.
Motion: By consensus the Board accepted the report and directed staff to schedule
the rate hearing and final budget consideration for the March meeting.
FUTURE AGENDA ITEMS
14. AGENDA ITEMS – VIEW AHEAD SCHEDULE (7:31) The Board reviewed the future agenda items.
ADJOURN
(7: 33) President Salinas adjourned the meeting.
APPROVED:
Simón Salinas, President
Attest:
Erika J. Trujillo, Clerk of the Board

Page 1 of 2 Item 2 – Financial Reports
Report to the Board of Directors
ITEM NO. 2
Finance and Administration
Manager/Controller/Treasurer
Date: March 15, 2018
From: C. Ray Hendricks, Finance and Administration
Manager
Title: January 2018 Claims and Financial Reports
General Manager/CAO
N/A General Counsel
RECOMMENDATIONS
The Executive Committee recommends that the Board accept the January 2018 Claims
and Financial Reports
DISCUSSION & ANALYSIS
Please refer to the attached financial reports and checks issued report for the month of
December for a summary of the Authority’s financial position as of January 31, 2018, the
following are highlights of the Authority’s financial activity for the month of December.
Results of Operations (Consolidated Statement of Revenues and Expenditures)
For the month of January 2018, operating revenues exceeded expenditures by $908,028.
Fiscal year 2017-2018 to date operating revenue exceeded expenditures by $4,543,140.
Revenues (Consolidated Statement of Revenues and Expenditures)
After seven months of the fiscal year, (58.333% of the fiscal year), revenues total
$13,406,490 or 70.7% of the total annual revenues forecast of $18,974,750. January Tipping
Fees totaled $1,198,699 and for the year to date totaled $8,491,304 or 69.8% of the
forecasted total of $12,158,750.
Operating Expenditures (Consolidated Statement of Revenues and Expenditures)
As of January 31, (58.333% of the fiscal year), year-to-date operating expenditures total
$8,863,351. This is 51.5% of the operating budget of $17,213,200.
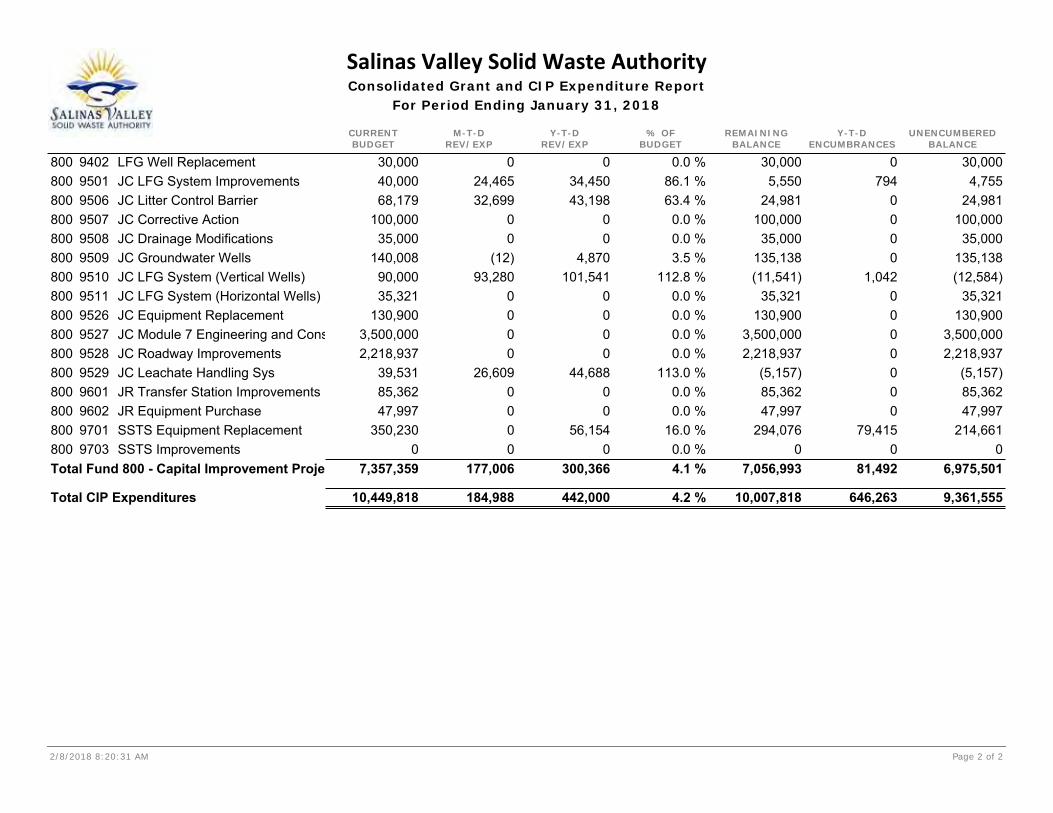
Capital Project Expenditures (Consolidated Grant and CIP Expenditures Report)
For the month of January 2018, capital project expenditures totaled $184,988. $93,280 of
the total was for the JCLF LFG System and $32,669. was for the JCLF Litter Control Barrier.
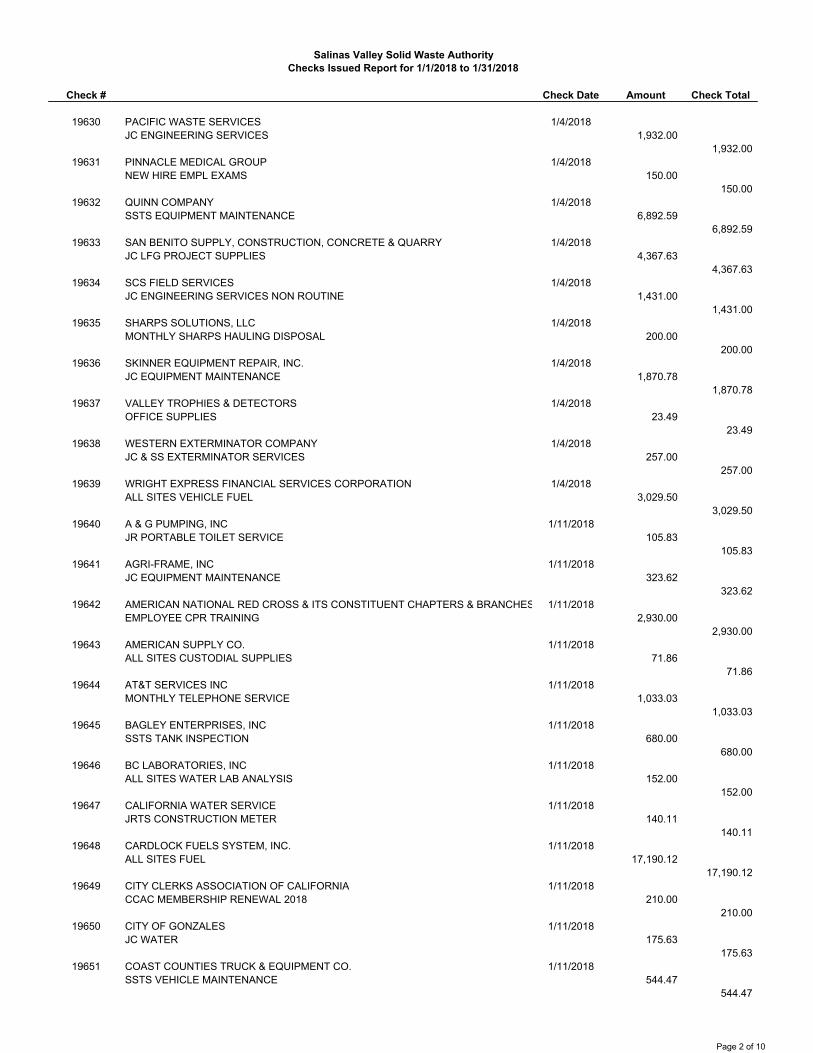
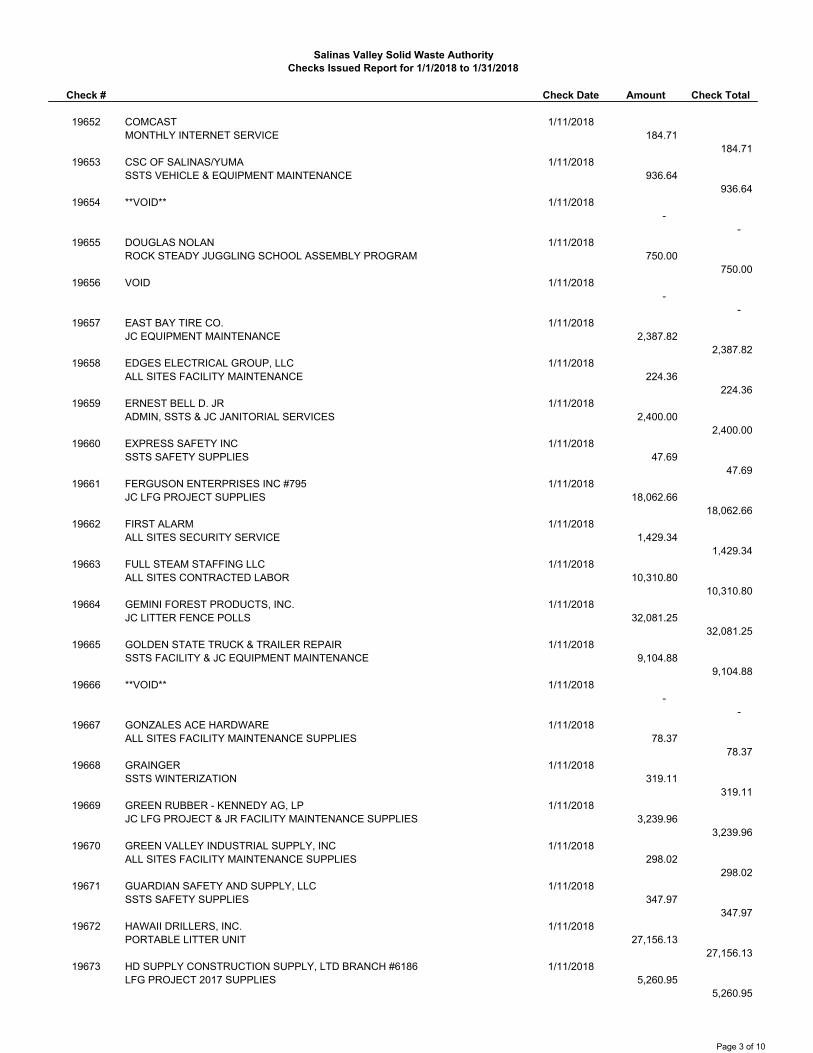
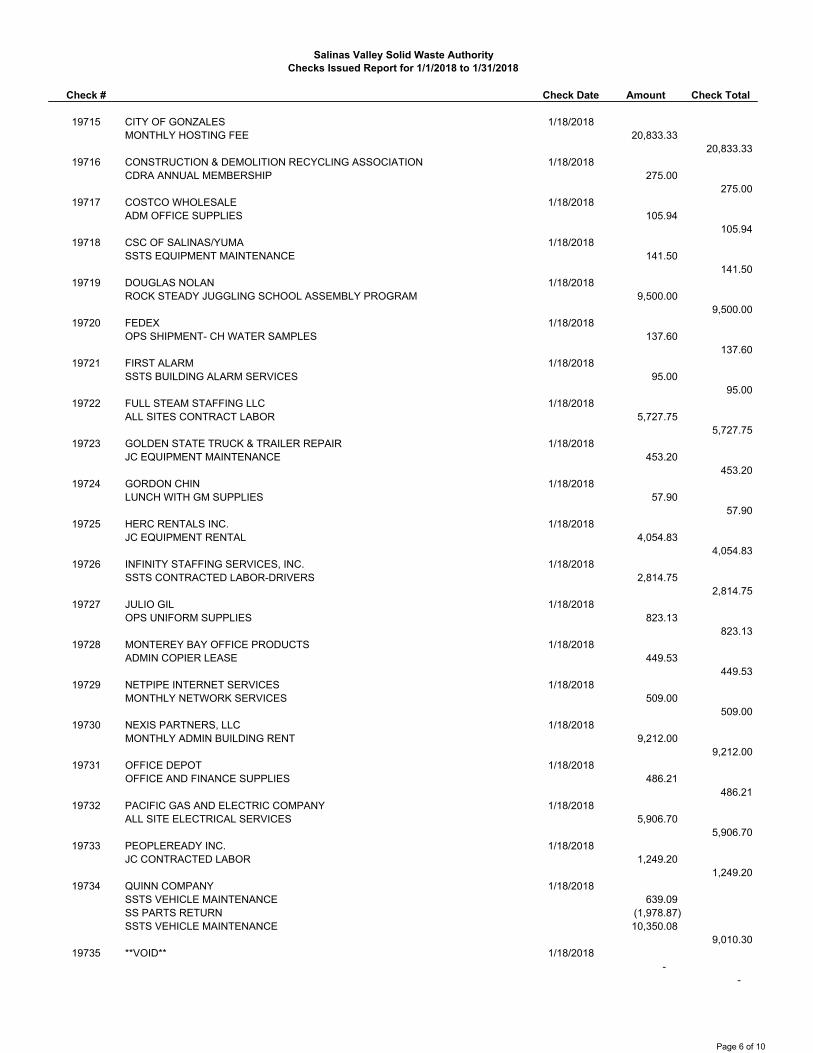
Claims Checks Issued Report
The Authority’s Checks Issued Report for the month of January 2018 is attached for review
and acceptance. December disbursements total $1,302,290.24 of which $487,839.18 was
paid from the payroll checking account for payroll and payroll related benefits.
Page 2 of 2 Item 2 – Financial Reports
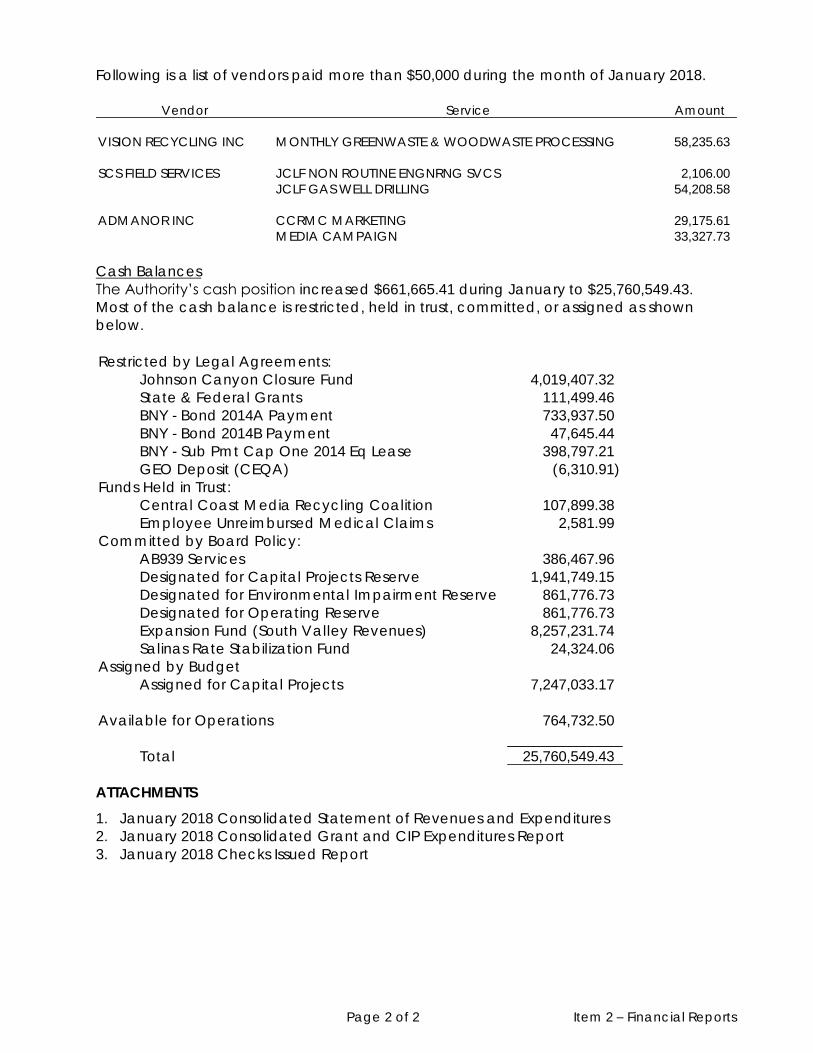
Following is a list of vendors paid more than $50,000 during the month of January 2018.
Cash Balances
The Authority’s cash position increased $661,665.41 during January to $25,760,549.43.
Most of the cash balance is restricted, held in trust, committed, or assigned as shown
below.
ATTACHMENTS
1. January 2018 Consolidated Statement of Revenues and Expenditures
2. January 2018 Consolidated Grant and CIP Expenditures Report
3. January 2018 Checks Issued Report
Vendor Service Amount
VISION RECYCLING INC MONTHLY GREENWASTE & WOODWASTE PROCESSING 58,235.63
SCS FIELD SERVICES JCLF NON ROUTINE ENGNRNG SVCS 2,106.00
JCLF GAS WELL DRILLING 54,208.58
ADMANOR INC CCRMC MARKETING 29,175.61
MEDIA CAMPAIGN 33,327.73
Restricted by Legal Agreements:
Johnson Canyon Closure Fund 4,019,407.32
State & Federal Grants 111,499.46
BNY - Bond 2014A Payment 733,937.50
BNY - Bond 2014B Payment 47,645.44
BNY - Sub Pmt Cap One 2014 Eq Lease 398,797.21
GEO Deposit (CEQA) (6,310.91)
Funds Held in Trust:
Central Coast Media Recycling Coalition 107,899.38
Employee Unreimbursed Medical Claims 2,581.99
Committed by Board Policy:
AB939 Services 386,467.96
Designated for Capital Projects Reserve 1,941,749.15
Designated for Environmental Impairment Reserve 861,776.73
Designated for Operating Reserve 861,776.73
Expansion Fund (South Valley Revenues) 8,257,231.74
Salinas Rate Stabilization Fund 24,324.06
Assigned by Budget
Assigned for Capital Projects 7,247,033.17
Available for Operations 764,732.50
Total 25,760,549.43
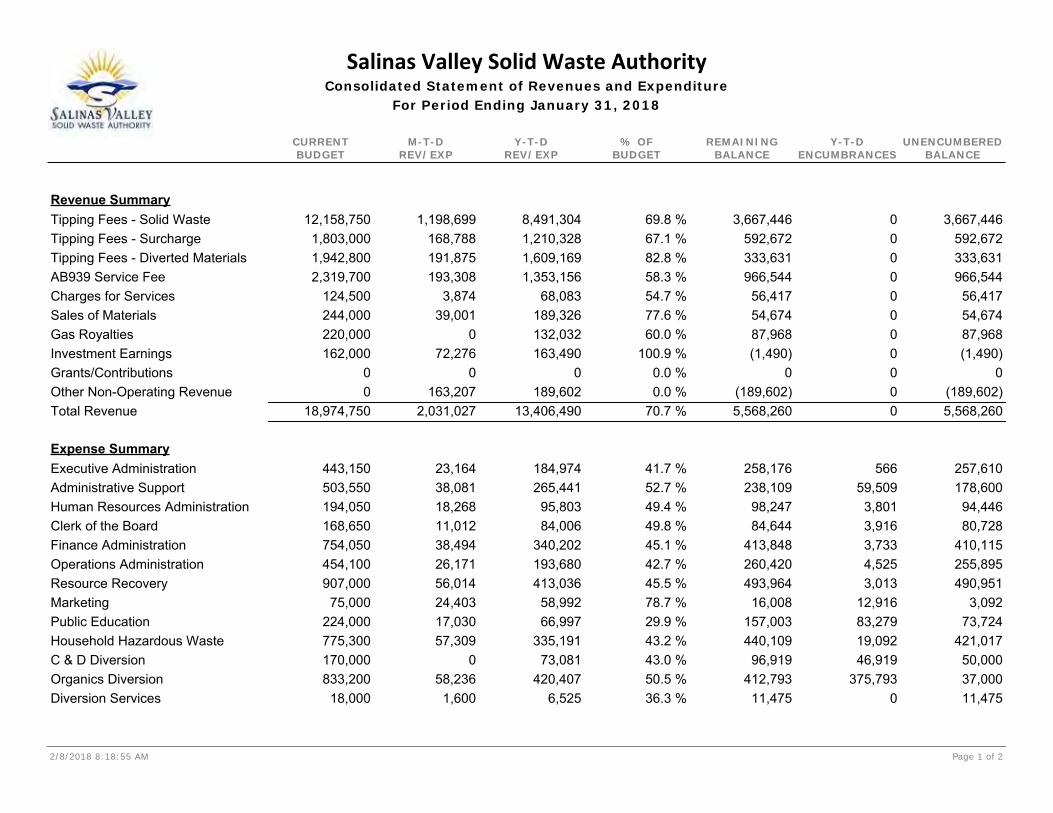
Salinas Valley Solid Waste AuthorityConsolidated Statement of Revenues and Expenditure
For Period Ending January 31, 2018
CURRENTBUDGET
M-T-DREV/EXP
% OFBUDGET
REMAININGBALANCE
Y-T-DENCUMBRANCES
UNENCUMBEREDBALANCE
Y-T-DREV/EXP
2/8/2018 8:18:55 AM Page 1 of 2
Revenue Summary12,158,750Tipping Fees - Solid Waste 1,198,699 8,491,304 069.8 % 3,667,446 3,667,446
1,803,000Tipping Fees - Surcharge 168,788 1,210,328 067.1 % 592,672 592,6721,942,800Tipping Fees - Diverted Materials 191,875 1,609,169 082.8 % 333,631 333,6312,319,700AB939 Service Fee 193,308 1,353,156 058.3 % 966,544 966,544
124,500Charges for Services 3,874 68,083 054.7 % 56,417 56,417244,000Sales of Materials 39,001 189,326 077.6 % 54,674 54,674220,000Gas Royalties 0 132,032 060.0 % 87,968 87,968162,000Investment Earnings 72,276 163,490 0100.9 % (1,490) (1,490)
0Grants/Contributions 0 0 00.0 % 0 00Other Non-Operating Revenue 163,207 189,602 00.0 % (189,602) (189,602)
070.7 %Total Revenue 2,031,02718,974,750 13,406,490 5,568,260 5,568,260
Expense Summary443,150Executive Administration 23,164 184,974 56641.7 % 258,176 257,610503,550Administrative Support 38,081 265,441 59,50952.7 % 238,109 178,600194,050Human Resources Administration 18,268 95,803 3,80149.4 % 98,247 94,446168,650Clerk of the Board 11,012 84,006 3,91649.8 % 84,644 80,728754,050Finance Administration 38,494 340,202 3,73345.1 % 413,848 410,115454,100Operations Administration 26,171 193,680 4,52542.7 % 260,420 255,895907,000Resource Recovery 56,014 413,036 3,01345.5 % 493,964 490,951
75,000Marketing 24,403 58,992 12,91678.7 % 16,008 3,092224,000Public Education 17,030 66,997 83,27929.9 % 157,003 73,724775,300Household Hazardous Waste 57,309 335,191 19,09243.2 % 440,109 421,017170,000C & D Diversion 0 73,081 46,91943.0 % 96,919 50,000833,200Organics Diversion 58,236 420,407 375,79350.5 % 412,793 37,000
18,000Diversion Services 1,600 6,525 036.3 % 11,475 11,475
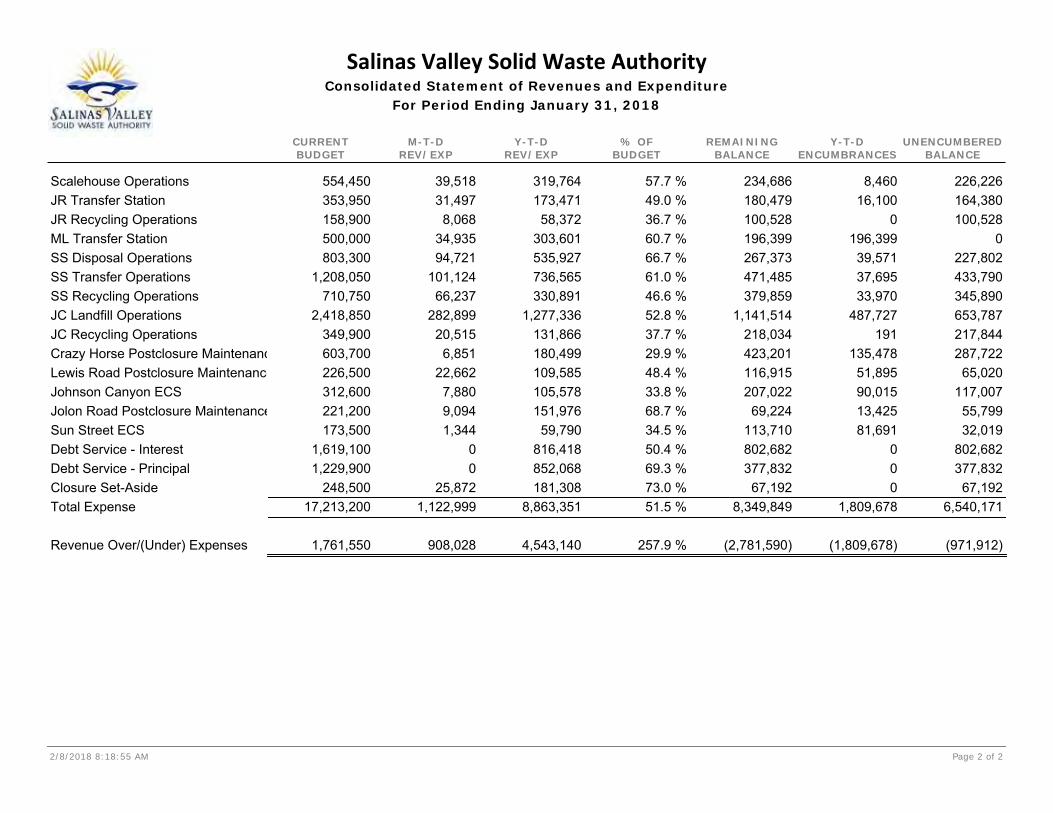
Salinas Valley Solid Waste AuthorityConsolidated Statement of Revenues and Expenditure
For Period Ending January 31, 2018
CURRENTBUDGET
M-T-DREV/EXP
% OFBUDGET
REMAININGBALANCE
Y-T-DENCUMBRANCES
UNENCUMBEREDBALANCE
Y-T-DREV/EXP
2/8/2018 8:18:55 AM Page 2 of 2
554,450Scalehouse Operations 39,518 319,764 8,46057.7 % 234,686 226,226353,950JR Transfer Station 31,497 173,471 16,10049.0 % 180,479 164,380158,900JR Recycling Operations 8,068 58,372 036.7 % 100,528 100,528500,000ML Transfer Station 34,935 303,601 196,39960.7 % 196,399 0803,300SS Disposal Operations 94,721 535,927 39,57166.7 % 267,373 227,802
1,208,050SS Transfer Operations 101,124 736,565 37,69561.0 % 471,485 433,790710,750SS Recycling Operations 66,237 330,891 33,97046.6 % 379,859 345,890
2,418,850JC Landfill Operations 282,899 1,277,336 487,72752.8 % 1,141,514 653,787349,900JC Recycling Operations 20,515 131,866 19137.7 % 218,034 217,844603,700Crazy Horse Postclosure Maintenanc 6,851 180,499 135,47829.9 % 423,201 287,722226,500Lewis Road Postclosure Maintenance 22,662 109,585 51,89548.4 % 116,915 65,020312,600Johnson Canyon ECS 7,880 105,578 90,01533.8 % 207,022 117,007221,200Jolon Road Postclosure Maintenance 9,094 151,976 13,42568.7 % 69,224 55,799173,500Sun Street ECS 1,344 59,790 81,69134.5 % 113,710 32,019
1,619,100Debt Service - Interest 0 816,418 050.4 % 802,682 802,6821,229,900Debt Service - Principal 0 852,068 069.3 % 377,832 377,832
248,500Closure Set-Aside 25,872 181,308 073.0 % 67,192 67,1921,809,67851.5 %Total Expense 1,122,99917,213,200 8,863,351 8,349,849 6,540,171
1,761,550 908,028Revenue Over/(Under) Expenses 4,543,140 257.9 % (2,781,590) (1,809,678) (971,912)
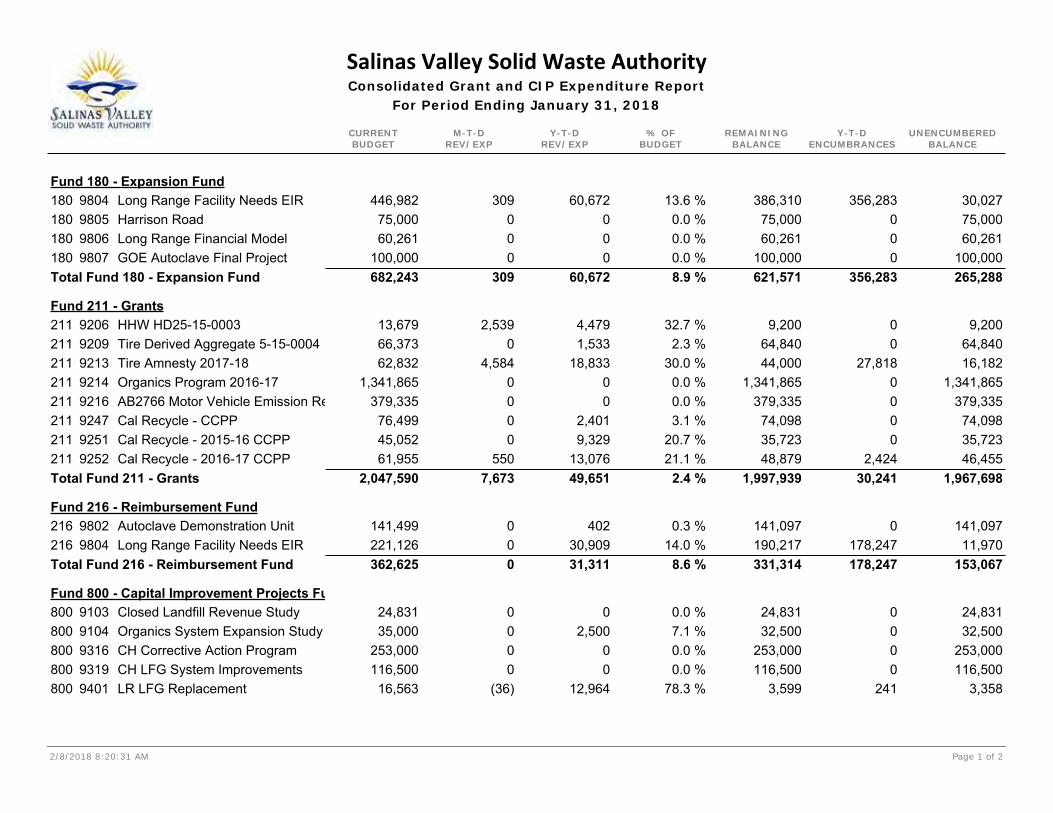
Salinas Valley Solid Waste AuthorityConsolidated Grant and CIP Expenditure Report
For Period Ending January 31, 2018
CURRENTBUDGET
M-T-DREV/EXP
% OFBUDGET
REMAININGBALANCE
Y-T-DENCUMBRANCES
UNENCUMBEREDBALANCE
Y-T-DREV/EXP
2/8/2018 8:20:31 AM Page 1 of 2
Fund 180 - Expansion Fund446,982Long Range Facility Needs EIR 309 60,672 356,28313.6 % 386,310 30,027180 9804
75,000Harrison Road 0 0 00.0 % 75,000 75,000180 980560,261Long Range Financial Model 0 0 00.0 % 60,261 60,261180 9806
100,000GOE Autoclave Final Project 0 0 00.0 % 100,000 100,000180 9807356,2838.9 %Total Fund 180 - Expansion Fund 309682,243 60,672 621,571 265,288
Fund 211 - Grants13,679HHW HD25-15-0003 2,539 4,479 032.7 % 9,200 9,200211 920666,373Tire Derived Aggregate 5-15-0004 0 1,533 02.3 % 64,840 64,840211 920962,832Tire Amnesty 2017-18 4,584 18,833 27,81830.0 % 44,000 16,182211 9213
1,341,865Organics Program 2016-17 0 0 00.0 % 1,341,865 1,341,865211 9214379,335AB2766 Motor Vehicle Emission Re 0 0 00.0 % 379,335 379,335211 9216
76,499Cal Recycle - CCPP 0 2,401 03.1 % 74,098 74,098211 924745,052Cal Recycle - 2015-16 CCPP 0 9,329 020.7 % 35,723 35,723211 925161,955Cal Recycle - 2016-17 CCPP 550 13,076 2,42421.1 % 48,879 46,455211 9252
30,2412.4 %Total Fund 211 - Grants 7,6732,047,590 49,651 1,997,939 1,967,698
Fund 216 - Reimbursement Fund141,499Autoclave Demonstration Unit 0 402 00.3 % 141,097 141,097216 9802221,126Long Range Facility Needs EIR 0 30,909 178,24714.0 % 190,217 11,970216 9804
178,2478.6 %Total Fund 216 - Reimbursement Fund 0362,625 31,311 331,314 153,067
Fund 800 - Capital Improvement Projects Fu24,831Closed Landfill Revenue Study 0 0 00.0 % 24,831 24,831800 910335,000Organics System Expansion Study 0 2,500 07.1 % 32,500 32,500800 9104
253,000CH Corrective Action Program 0 0 00.0 % 253,000 253,000800 9316116,500CH LFG System Improvements 0 0 00.0 % 116,500 116,500800 9319
16,563LR LFG Replacement (36) 12,964 24178.3 % 3,599 3,358800 9401
Salinas Valley Solid Waste AuthorityConsolidated Grant and CIP Expenditure Report
For Period Ending January 31, 2018
CURRENTBUDGET
M-T-DREV/EXP
% OFBUDGET
REMAININGBALANCE
Y-T-DENCUMBRANCES
UNENCUMBEREDBALANCE
Y-T-DREV/EXP
2/8/2018 8:20:31 AM Page 2 of 2
30,000LFG Well Replacement 0 0 00.0 % 30,000 30,000800 940240,000JC LFG System Improvements 24,465 34,450 79486.1 % 5,550 4,755800 950168,179JC Litter Control Barrier 32,699 43,198 063.4 % 24,981 24,981800 9506
100,000JC Corrective Action 0 0 00.0 % 100,000 100,000800 950735,000JC Drainage Modifications 0 0 00.0 % 35,000 35,000800 9508
140,008JC Groundwater Wells (12) 4,870 03.5 % 135,138 135,138800 950990,000JC LFG System (Vertical Wells) 93,280 101,541 1,042112.8 % (11,541) (12,584)800 951035,321JC LFG System (Horizontal Wells) 0 0 00.0 % 35,321 35,321800 9511
130,900JC Equipment Replacement 0 0 00.0 % 130,900 130,900800 95263,500,000JC Module 7 Engineering and Cons 0 0 00.0 % 3,500,000 3,500,000800 95272,218,937JC Roadway Improvements 0 0 00.0 % 2,218,937 2,218,937800 9528
39,531JC Leachate Handling Sys 26,609 44,688 0113.0 % (5,157) (5,157)800 952985,362JR Transfer Station Improvements 0 0 00.0 % 85,362 85,362800 960147,997JR Equipment Purchase 0 0 00.0 % 47,997 47,997800 9602
350,230SSTS Equipment Replacement 0 56,154 79,41516.0 % 294,076 214,661800 97010SSTS Improvements 0 0 00.0 % 0 0800 9703
81,4924.1 %Total Fund 800 - Capital Improvement Proje 177,0067,357,359 300,366 7,056,993 6,975,501
646,2634.2 %Total CIP Expenditures 184,98810,449,818 442,000 10,007,818 9,361,555

Check # Check Date Amount Check Total
19608 ALLIANCE ON AGING, INC. 1/4/2018KING CITY EVENT REGISTRATION 600.00
600.00 19609 ASBURY ENVIRONMENTAL SERVICES 1/4/2018
MONTHLY HHW USED OIL & DISPOSAL 300.00 300.00
19610 CALIFORNIA WATER SERVICE 1/4/2018SSTS & JR WATER SERVICE 611.62
611.62 19611 CARDLOCK FUELS SYSTEM, INC. 1/4/2018
SSTS DYED & CLEARED DIESEL 2,515.23 2,515.23
19612 CSC OF SALINAS/YUMA 1/4/2018SSTS EQUIPMENT MAINTENANCE 626.97
626.97 19613 EAGLE STAR SECURITY 1/4/2018
SSTS SECURITY SERVICES 1,152.00 1,152.00
19614 FULL STEAM STAFFING LLC 1/4/2018JC CONTRACTED LABOR 10,295.16
10,295.16 19615 GOLDEN STATE TRUCK & TRAILER REPAIR 1/4/2018
SSTS VEHICLE & EQUIPMENT MAINTENANCE 5,160.20 5,160.20
19616 **VOID** 1/4/2018-
- 19617 GONZALES ACE HARDWARE 1/4/2018
JC EQUIPMENT MAINTENANCE 55.68 55.68
19618 GREEN VALLEY INDUSTRIAL SUPPLY, INC 1/4/2018JC FACILITY MAINTENANCE 70.27
70.27 19619 GUERITO 1/4/2018
ALL SITES PORTABLE TOILETS 2,056.00 2,056.00
19620 HYDROTURF, INC 1/4/2018JC LFG PROJECT 25.43
25.43 19621 J. S. COLE CO. 1/4/2018
JC RENTAL EQUIPMENT 3,670.80 3,670.80
19622 JOHNSON ASSOCIATES 1/4/2018SSTS EQUIPMENT MAINTENANCE SUPPLIES 65.00
65.00 19623 LIEBERT CASSIDY WHITMORE 1/4/2018
HR LEGAL SERVICES 175.00 175.00
19624 MANUEL TINAJERO 1/4/2018SSTS FACILITY MAINTENANCE 1,500.00
1,500.00 19625 MONTEREY AUTO SUPPLY INC 1/4/2018
SSTS & HHW EQUIPMENT MAINTENANCE 39.31 39.31
19626 MONTEREY COUNTY AGRICULTURAL COMMISSIONER 1/4/2018JC & SSTS ANNUAL COMMERCIAL DEVICE REGISTRATION 1,144.00
1,144.00 19627 MONTEREY COUNTY HEALTH DEPARTMENT 1/4/2018
QUARTERLY MO.CO. REGIONAL FEE 27,005.73 27,005.73
19628 OFFICE DEPOT 1/4/2018ALL SITES OFFICE SUPPLIES 1,001.41
1,001.41 19629 ONE STOP AUTO CARE/V & S AUTO CARE, INC 1/4/2018
ADMIN VEHICLE MAINTENANCE 112.70 112.70
Salinas Valley Solid Waste AuthorityChecks Issued Report for 1/1/2018 to 1/31/2018
Page 1 of 10
Check # Check Date Amount Check Total
Salinas Valley Solid Waste AuthorityChecks Issued Report for 1/1/2018 to 1/31/2018
19630 PACIFIC WASTE SERVICES 1/4/2018JC ENGINEERING SERVICES 1,932.00
1,932.00 19631 PINNACLE MEDICAL GROUP 1/4/2018
NEW HIRE EMPL EXAMS 150.00 150.00
19632 QUINN COMPANY 1/4/2018SSTS EQUIPMENT MAINTENANCE 6,892.59
6,892.59 19633 SAN BENITO SUPPLY, CONSTRUCTION, CONCRETE & QUARRY 1/4/2018
JC LFG PROJECT SUPPLIES 4,367.63 4,367.63
19634 SCS FIELD SERVICES 1/4/2018JC ENGINEERING SERVICES NON ROUTINE 1,431.00
1,431.00 19635 SHARPS SOLUTIONS, LLC 1/4/2018
MONTHLY SHARPS HAULING DISPOSAL 200.00 200.00
19636 SKINNER EQUIPMENT REPAIR, INC. 1/4/2018JC EQUIPMENT MAINTENANCE 1,870.78
1,870.78 19637 VALLEY TROPHIES & DETECTORS 1/4/2018
OFFICE SUPPLIES 23.49 23.49
19638 WESTERN EXTERMINATOR COMPANY 1/4/2018JC & SS EXTERMINATOR SERVICES 257.00
257.00 19639 WRIGHT EXPRESS FINANCIAL SERVICES CORPORATION 1/4/2018
ALL SITES VEHICLE FUEL 3,029.50 3,029.50
19640 A & G PUMPING, INC 1/11/2018JR PORTABLE TOILET SERVICE 105.83
105.83 19641 AGRI-FRAME, INC 1/11/2018
JC EQUIPMENT MAINTENANCE 323.62 323.62
19642 AMERICAN NATIONAL RED CROSS & ITS CONSTITUENT CHAPTERS & BRANCHES 1/11/2018EMPLOYEE CPR TRAINING 2,930.00
2,930.00 19643 AMERICAN SUPPLY CO. 1/11/2018
ALL SITES CUSTODIAL SUPPLIES 71.86 71.86
19644 AT&T SERVICES INC 1/11/2018MONTHLY TELEPHONE SERVICE 1,033.03
1,033.03 19645 BAGLEY ENTERPRISES, INC 1/11/2018
SSTS TANK INSPECTION 680.00 680.00
19646 BC LABORATORIES, INC 1/11/2018ALL SITES WATER LAB ANALYSIS 152.00
152.00 19647 CALIFORNIA WATER SERVICE 1/11/2018
JRTS CONSTRUCTION METER 140.11 140.11
19648 CARDLOCK FUELS SYSTEM, INC. 1/11/2018ALL SITES FUEL 17,190.12
17,190.12 19649 CITY CLERKS ASSOCIATION OF CALIFORNIA 1/11/2018
CCAC MEMBERSHIP RENEWAL 2018 210.00 210.00
19650 CITY OF GONZALES 1/11/2018JC WATER 175.63
175.63 19651 COAST COUNTIES TRUCK & EQUIPMENT CO. 1/11/2018
SSTS VEHICLE MAINTENANCE 544.47 544.47
Page 2 of 10
Check # Check Date Amount Check Total
Salinas Valley Solid Waste AuthorityChecks Issued Report for 1/1/2018 to 1/31/2018
19652 COMCAST 1/11/2018MONTHLY INTERNET SERVICE 184.71
184.71 19653 CSC OF SALINAS/YUMA 1/11/2018
SSTS VEHICLE & EQUIPMENT MAINTENANCE 936.64 936.64
19654 **VOID** 1/11/2018-
- 19655 DOUGLAS NOLAN 1/11/2018
ROCK STEADY JUGGLING SCHOOL ASSEMBLY PROGRAM 750.00 750.00
19656 VOID 1/11/2018-
- 19657 EAST BAY TIRE CO. 1/11/2018
JC EQUIPMENT MAINTENANCE 2,387.82 2,387.82
19658 EDGES ELECTRICAL GROUP, LLC 1/11/2018ALL SITES FACILITY MAINTENANCE 224.36
224.36 19659 ERNEST BELL D. JR 1/11/2018
ADMIN, SSTS & JC JANITORIAL SERVICES 2,400.00 2,400.00
19660 EXPRESS SAFETY INC 1/11/2018SSTS SAFETY SUPPLIES 47.69
47.69 19661 FERGUSON ENTERPRISES INC #795 1/11/2018
JC LFG PROJECT SUPPLIES 18,062.66 18,062.66
19662 FIRST ALARM 1/11/2018ALL SITES SECURITY SERVICE 1,429.34
1,429.34 19663 FULL STEAM STAFFING LLC 1/11/2018
ALL SITES CONTRACTED LABOR 10,310.80 10,310.80
19664 GEMINI FOREST PRODUCTS, INC. 1/11/2018JC LITTER FENCE POLLS 32,081.25
32,081.25 19665 GOLDEN STATE TRUCK & TRAILER REPAIR 1/11/2018
SSTS FACILITY & JC EQUIPMENT MAINTENANCE 9,104.88 9,104.88
19666 **VOID** 1/11/2018-
- 19667 GONZALES ACE HARDWARE 1/11/2018
ALL SITES FACILITY MAINTENANCE SUPPLIES 78.37 78.37
19668 GRAINGER 1/11/2018SSTS WINTERIZATION 319.11
319.11 19669 GREEN RUBBER - KENNEDY AG, LP 1/11/2018
JC LFG PROJECT & JR FACILITY MAINTENANCE SUPPLIES 3,239.96 3,239.96
19670 GREEN VALLEY INDUSTRIAL SUPPLY, INC 1/11/2018ALL SITES FACILITY MAINTENANCE SUPPLIES 298.02
298.02 19671 GUARDIAN SAFETY AND SUPPLY, LLC 1/11/2018
SSTS SAFETY SUPPLIES 347.97 347.97
19672 HAWAII DRILLERS, INC. 1/11/2018PORTABLE LITTER UNIT 27,156.13
27,156.13 19673 HD SUPPLY CONSTRUCTION SUPPLY, LTD BRANCH #6186 1/11/2018
LFG PROJECT 2017 SUPPLIES 5,260.95 5,260.95
Page 3 of 10

Check # Check Date Amount Check Total
Salinas Valley Solid Waste AuthorityChecks Issued Report for 1/1/2018 to 1/31/2018
19674 HERC RENTALS INC. 1/11/2018LFG EQUIPMENT PROJECT RENTAL 1,641.08
1,641.08 19675 HOME DEPOT 1/11/2018
ALL SITES FACILITY MAINTENANCE SUPPLIES 1,376.65 1,376.65
19676 **VOID** 1/11/2018-
- 19677 HYDROTURF, INC 1/11/2018
JC FACILITY MAINTENANCE 23.03 23.03
19678 JENNY MITCHELL 1/11/2018CCRA AIRFARE REIMBURSEMENT 103.20
103.20 19679 JULIO GIL 1/11/2018
SCALEHOUSE VINYL LETTERING 526.63 526.63
19680 KING CITY HARDWARE INC. 1/11/2018JR FACILITY MAINTENANCE 130.33
130.33 19681 LIEBERT CASSIDY WHITMORE 1/11/2018
ERC MEMBERSHIP W/PREMIUM LIEBERT LIBRARY SUBSCRIPTION 4,310.50 4,310.50
19682 MANUEL PEREA TRUCKING, INC. 1/11/2018SSTS & JC EQUIPMENT HAULING SERVICES 1,650.00
1,650.00 19683 MARTA M. GRANADOS 1/11/2018
FY17-18 BD MEETING INTERPRETER 180.00 180.00
19684 MCMASTER-CARR SUPPLY COMPANY 1/11/2018JC LFG PROJECT 2017 106.94
106.94 19685 MONTEREY AUTO SUPPLY INC 1/11/2018
SSTS & HHW EQUIPMENT MAINTENANCE 66.63 66.63
19686 MONTEREY REGIONAL WATER POLLUTION CONTROL AGENCY 1/11/2018SSTS MRWPCA & SEWER FEES 948.07
948.07 19687 NEXTEL OF CALIFORNIA, INC 1/11/2018
SCALEHOUSE, SS & JR CELL PHONE SERVICES 318.78 318.78
19688 OFFICE DEPOT 1/11/2018ALL SITES OFFICE SUPPLIES 963.54
963.54 19689 ONE STOP AUTO CARE/V & S AUTO CARE, INC 1/11/2018
OPS, ADMIN VEHICLE MAINTENANCE 147.61 147.61
19690 ONHOLD EXPERIENCE 1/11/2018PHONE HOLD SERVICE 207.00
207.00 19691 PACIFIC GAS AND ELECTRIC COMPANY 1/11/2018
SSTS & HHW CNG FUEL 483.20 483.20
19692 PEOPLEREADY INC. 1/11/2018JC CONTRACTED LABOR 2,020.91
2,020.91 19693 PHILIP SERVICES CORP 1/11/2018
HHW HAULING & DISPOSAL SUPPLIES 13,276.20 13,276.20
19694 PITNEY BOWES GLOBAL 1/11/2018POSTAGE MACHINE ANNUAL LEASE 308.87 ADMIN POSTAGE & LEASE 354.49
663.36
Page 4 of 10

Check # Check Date Amount Check Total
Salinas Valley Solid Waste AuthorityChecks Issued Report for 1/1/2018 to 1/31/2018
19695 PROBUILD COMPANY LLC 1/11/2018SSTS FACILITY MAINTENANCE 21.81
21.81 19696 PURE WATER BOTTLING 1/11/2018
ALL SITES BOTTLED WATER SERVICE 366.90 366.90
19697 QED ENVIRONMENTAL SYSTEMS INC. 1/11/2018WATER PUMPS FOR GAS WELLS 26,609.48
26,609.48 19698 QUINN COMPANY 1/11/2018
SSTS VEHICLE MAINTENANCE 10,739.58 10,739.58
19699 SAN BENITO SUPPLY, CONSTRUCTION, CONCRETE & QUARRY 1/11/20182017 LFG PROJECT 4,906.02
4,906.02 19700 SECURITY SHORING & STEEL PLATES, INC. 1/11/2018
JRTS EQUIPMENT RENTAL 842.00 842.00
19701 SKINNER EQUIPMENT REPAIR, INC. 1/11/2018JC, JR EQUIPMENT MAINTENANCE 12,445.73
12,445.73 19702 **VOID** 1/11/2018
- -
19703 SOLID WASTE ASSOCIATION OF NORTH AMERICA 1/11/2018SWANA ANNUAL MEMBERSHIP 242.00
242.00 19704 STATE WATER RESOURCES CONTROL BOARD 1/11/2018
LEWIS ROAD ANNUAL PERMIT FEE 21,415.00 JRTS SWRCB PERMIT FEE 8,030.00
29,445.00 19705 STURDY OIL COMPANY 1/11/2018
SSTS VEHICLE MAINTENANCE 781.98 781.98
19706 THOMAS M BRUEN 1/11/2018LEGAL SERVICES DECEMBER 2,811.02
2,811.02 19707 WESTERN EXTERMINATOR COMPANY 1/11/2018
JC & SS EXTERMINATOR SERVICES 514.00 514.00
19708 WILLDAN FINANCIAL SERVICES 1/11/2018ANNUAL BOND CONTINUING DISCLOSURE SERVICES 1,600.00
1,600.00 19709 ADMANOR, INC 1/18/2018
CCRMC MARKETING 11,562.00 HHW GRANT MEDIA CAMPAIGN 2,257.00 MEDIA CAMPAIGN - MARKETING 21,815.00 MEDIA CAMPAIGN - PUBLIC ED 3,509.28 TIRE AMNESTY MEDIA CAMPAIGN 1,684.00
40,827.28 19710 AIA CORPORATION 1/18/2018
PUBLIC OUTREACH UNIFORMS FOR RR STAFF 787.66 787.66
19711 AMERICAN SUPPLY CO. 1/18/2018ALL SITES CUSTODIAL SUPPLIES 465.53
465.53 19712 CALIFORNIA HIGHWAY ADOPTION CO. 1/18/2018
MONTHLY HIGHWAY LITTER CLEANUP SERVICES 550.00 550.00
19713 CALIFORNIA SPECIAL DISTRICTS ASSOCIATION 1/18/2018ANNUAL MEMBERSHIP 541.00
541.00 19714 CARDLOCK FUELS SYSTEM, INC. 1/18/2018
SSTS DYED AND CLEARED DIESEL 5,184.92 5,184.92
Page 5 of 10
Check # Check Date Amount Check Total
Salinas Valley Solid Waste AuthorityChecks Issued Report for 1/1/2018 to 1/31/2018
19715 CITY OF GONZALES 1/18/2018MONTHLY HOSTING FEE 20,833.33
20,833.33 19716 CONSTRUCTION & DEMOLITION RECYCLING ASSOCIATION 1/18/2018
CDRA ANNUAL MEMBERSHIP 275.00 275.00
19717 COSTCO WHOLESALE 1/18/2018ADM OFFICE SUPPLIES 105.94
105.94 19718 CSC OF SALINAS/YUMA 1/18/2018
SSTS EQUIPMENT MAINTENANCE 141.50 141.50
19719 DOUGLAS NOLAN 1/18/2018ROCK STEADY JUGGLING SCHOOL ASSEMBLY PROGRAM 9,500.00
9,500.00 19720 FEDEX 1/18/2018
OPS SHIPMENT- CH WATER SAMPLES 137.60 137.60
19721 FIRST ALARM 1/18/2018SSTS BUILDING ALARM SERVICES 95.00
95.00 19722 FULL STEAM STAFFING LLC 1/18/2018
ALL SITES CONTRACT LABOR 5,727.75 5,727.75
19723 GOLDEN STATE TRUCK & TRAILER REPAIR 1/18/2018JC EQUIPMENT MAINTENANCE 453.20
453.20 19724 GORDON CHIN 1/18/2018
LUNCH WITH GM SUPPLIES 57.90 57.90
19725 HERC RENTALS INC. 1/18/2018JC EQUIPMENT RENTAL 4,054.83
4,054.83 19726 INFINITY STAFFING SERVICES, INC. 1/18/2018
SSTS CONTRACTED LABOR-DRIVERS 2,814.75 2,814.75
19727 JULIO GIL 1/18/2018OPS UNIFORM SUPPLIES 823.13
823.13 19728 MONTEREY BAY OFFICE PRODUCTS 1/18/2018
ADMIN COPIER LEASE 449.53 449.53
19729 NETPIPE INTERNET SERVICES 1/18/2018MONTHLY NETWORK SERVICES 509.00
509.00 19730 NEXIS PARTNERS, LLC 1/18/2018
MONTHLY ADMIN BUILDING RENT 9,212.00 9,212.00
19731 OFFICE DEPOT 1/18/2018OFFICE AND FINANCE SUPPLIES 486.21
486.21 19732 PACIFIC GAS AND ELECTRIC COMPANY 1/18/2018
ALL SITE ELECTRICAL SERVICES 5,906.70 5,906.70
19733 PEOPLEREADY INC. 1/18/2018JC CONTRACTED LABOR 1,249.20
1,249.20 19734 QUINN COMPANY 1/18/2018
SSTS VEHICLE MAINTENANCE 639.09 SS PARTS RETURN (1,978.87) SSTS VEHICLE MAINTENANCE 10,350.08
9,010.30 19735 **VOID** 1/18/2018
- -
Page 6 of 10

Check # Check Date Amount Check Total
Salinas Valley Solid Waste AuthorityChecks Issued Report for 1/1/2018 to 1/31/2018
19736 REPUBLIC SERVICES #471 1/18/2018MONTHLY ADMIN BUILDING TRASH SERVICE PICK UPS 72.88
72.88 19737 SCS FIELD SERVICES 1/18/2018
JC NON ROUTINE ENGINEERING SERVICES 675.00 675.00
19738 SKINNER EQUIPMENT REPAIR, INC. 1/18/2018JC& JR EQUIPMENT MAINTENANCE 1,770.14
1,770.14 19739 VISION RECYCLING INC 1/18/2018
MONTHLY GREENWASTE AND WOODWASTE PROCESSING 58,235.63 58,235.63
19740 WEST COAST RUBBER RECYCLING, INC 1/18/2018TIRE RECYCLING - AMNESTY TRAILERS 1,450.00 TIRE RECYCLING TRAILER 1,600.00
3,050.00 19741 BILL KORETOFF 1/23/2018
SSTS EQUIPMENT MAINTENANCE 409.68 409.68
19742 CALIFORNIA WATER SERVICE 1/23/2018SSTS & JR WATER SERVICE 1,296.67
1,296.67 19743 CARDLOCK FUELS SYSTEM, INC. 1/23/2018
SSTS & JC DYED & CLEAR DIESEL 9,996.05 9,996.05
19744 COAST COUNTIES TRUCK & EQUIPMENT CO. 1/23/2018SSTS VEHICLE MAINTENANCE 696.09
696.09 19745 CSC OF SALINAS/YUMA 1/23/2018
SSTS FACILITY MAINTENANCE 51.81 51.81
19746 EAST BAY TIRE CO. 1/23/2018JC EQUIPMENT MAINTENANCE 895.00
895.00 19747 FERGUSON ENTERPRISES INC #795 1/23/2018
JC LFG PROJECT SUPPLIES 3,086.76 CH FACILITY MAINTENANCE SUPPLIES 64.27
3,151.03 19748 FULL STEAM STAFFING LLC 1/23/2018
JC & JR CONTRACTED LABOR 1,798.86 1,798.86
19749 GOLDEN STATE TRUCK & TRAILER REPAIR 1/23/2018SSTS EQUIPMENT & VEHICLE MAINTENANCE 3,169.06 SSTS VEHICLE MAINTENANCE 1,946.70
5,115.76 19750 GREEN RUBBER - KENNEDY AG, LP 1/23/2018
JC LFG PROJECT 2017 14,559.45 14,559.45
19751 GREEN VALLEY INDUSTRIAL SUPPLY, INC 1/23/2018SSTS VEHICLE MAINTENANCE 22.40
22.40 19752 GUARDIAN SAFETY AND SUPPLY, LLC 1/23/2018
JC & JR SAFETY SUPPLIES 677.72 677.72
19753 HOPE SERVICES 1/23/2018SSTS CONTRACT LABOR 9,306.01
9,306.01 19754 MASKELL PIPE & SUPPLY, INC 1/23/2018
JC EQUIPMENT MAINTENANCE 889.34 889.34
19755 MONTEREY AUTO SUPPLY INC 1/23/2018SST VEHICLE MAINTENANCE 143.83
143.83 19756 NCM ODOR CONTROL 1/23/2018
SSTS FACILITY MAINTENANCE 11,848.47 11,848.47
Page 7 of 10

Check # Check Date Amount Check Total
Salinas Valley Solid Waste AuthorityChecks Issued Report for 1/1/2018 to 1/31/2018
19757 PITNEY BOWES - POSTAGE 1/23/2018ADMIN POSTAGE METER REFILL 320.99
320.99 19758 QUINN COMPANY 1/23/2018
SSTS & JR VEHICLE MAINTENANCE 9,234.15 9,234.15
19759 ROSSI BROS TIRE & AUTO SERVICE 1/23/2018SSTS & JR VEHICLE & EQUIPMENT MAINTENANCE 1,110.45
1,110.45 19760 SCS FIELD SERVICES 1/23/2018
JC GAS WELL DRILLING 54,208.58 54,208.58
19761 SHARPS SOLUTIONS, LLC 1/23/2018MONTHLY SHARPS HAULING DISPOSAL 80.00
80.00 19762 STURDY OIL COMPANY 1/23/2018
SSTS VEHICLE MAINTENANCE 1,183.06 1,183.06
19763 WASTE MANAGEMENT INC 1/23/2018SALINAS FRANCHISE WASTE TRANSFER 34,935.02
34,935.02 19764 WEST COAST RUBBER RECYCLING, INC 1/23/2018
TIRE RECYCLING - AMNESTY TRAILERS 1,450.00 1,450.00
19765 WESTERN EXTERMINATOR COMPANY 1/23/2018JC & SS EXTERMINATOR SERVICES 125.00
125.00 19766 EAGLE STAR SECURITY 1/23/2018
SSTS BUILDING SECURITY SERVICES 4,608.00 4,608.00
19767 A & B FIRE PROTECTION & SAFETY, INC 1/31/2018JR SAFETY SUPPLIES & FACILITY MAINTENANCE 337.32
337.32 19768 ADMANOR, INC 1/31/2018
CCRMC MARKETING 17,613.61 MEDIA CAMPAIGN - MARKETING 1,987.70 MEDIA CAMPAIGN - PUBLIC ED 2,074.75
21,676.06 19769 BC LABORATORIES, INC 1/31/2018
CH WATER STORM SAMPLES 41.20 41.20
19770 CARDLOCK FUELS SYSTEM, INC. 1/31/2018JC DYED FUEL 6,696.84
6,696.84 19771 COAST COUNTIES TRUCK & EQUIPMENT CO. 1/31/2018
SSTS VEHICLE MAINTENANCE 1,204.05 1,204.05
19772 FERGUSON ENTERPRISES INC #795 1/31/2018JC LFP PROJECT 2017 208.17
208.17 19773 GRANITE ROCK CO/PAVEX 1/31/2018
SS FACILITY MAINTENANCE 79.75 79.75
19774 GREEN RUBBER - KENNEDY AG, LP 1/31/2018LFP PROJECT, SSTS & JC FACILITY MAINTENANCE 2,719.81
2,719.81 19775 LARA MITCHELL 1/31/2018
STORAGE SHED FOR GARDEN SUPPLIES 537.67 537.67
19776 LIEBERT CASSIDY WHITMORE 1/31/2018LEGAL SERVICES 645.00
645.00 19777 MASKELL PIPE & SUPPLY, INC 1/31/2018
JC, CH, JR FACILITY MAINTENANCE 306.07 JC, CH, JR FACILITY MAINTENANCE 610.99
917.06
Page 8 of 10

Check # Check Date Amount Check Total
Salinas Valley Solid Waste AuthorityChecks Issued Report for 1/1/2018 to 1/31/2018
19778 OFFICE DEPOT 1/31/2018JC. JR, RR OFFICE SUPPLIES 386.56
386.56 19779 PACIFIC GAS AND ELECTRIC COMPANY 1/31/2018
ALL SITE ELECTRICAL SERVICES 6,053.00 6,053.00
19780 PACIFIC TRUCK PARTS, INC 1/31/2018SSTS VEHICLE MAINTENANCE 179.78
179.78 19781 PINNACLE MEDICAL GROUP 1/31/2018
MEDICAL DOT RENEWAL 130.00 130.00
19782 RETURNS R US, INC. 1/31/2018PHARMACEUTICAL REPLACEMENT KITS - ALLCARE 450.00
450.00 19783 STATE WATER RESOURCES CONTROL BOARD 1/31/2018
JC, CH ANNUAL PERMIT FEE 2,800.00 2,800.00
19784 US BANK CORPORATE PAYMENT SYSTEM 1/31/2018CALCHAMBER:2018 COMPLIANCE POSTERS 458.52 AMAZON: HARD DRIVE FOR SERVER 977.77 SALINAS ACE HARDWARE: RR CLAMPS FOR THE TRAILER 4.88 DESI: OFFICE SUPPLIES 36.00 ADOBE: ANNUAL SOFTWARE RENEWAL 839.88 AMAZON.COM: OFFICE SUPPLIES 33.95 LOGMEIN: ANNUAL HAMACHI SUBSCRIPTION 49.00 NATIONAL SEMINARS: ANNUAL SUBSCRIPTION 249.00 SMART&FINAL: DECEMBER BOARD MEETING SUPPLIES 6.99 SUBWAY: CITIZENS ADVISORY GROUP MEETING 49.16 CITY OF MONTEREY PARKING - CALPELRA ANNUAL CONFERENCE 21.00 CITY OF MONTEREY PARKING - CALPELRA TRAINING 7.00 CITY OF WATSONVILLE: TRAINING PARKING FEE 5.00 AMAZON: OFFICE SUPPLIES 11.99 EXPERIAN: CREDIT CHECKS 49.95 HARBOR FREIGHT TOOLS: WASTE AUDIT SUPPLIES 41.84 SAFEWAY: DECEMBER EXECUTIVE COMMITTEE MEETING 33.57 FENCE SCREEN.COM:SS FENCE REPAIRS 156.17 OFFICE DEPOT: FILE CABINET FOR SCALES HOUSES 340.84 HARBOR FREIGHT: SS TARPS 147.45 SALINAS ACE HARDWARE - FLOAT SUPPLIES 19.41 BASICFOOD: SUPPLIES FOR EMPLOYEE RECOGNITION LUNCH 9.86 GINO'S: SS EMPLOYEE APPRECIATION LUNCH 317.64 HARBOR FREIGHT: SS FACILITY SUPPLIES 127.79 HUGHES: JR & JC SCALEHOUSE MONTHLY INTERNET SERVICE 171.61 LUIGI'S: EMPLOYEE APPRECIATION 161.26 INTERMEDIA: MONTHLY EXCHANGE SERVER HOSTING 367.00 BARNES WELDING SUPPLIES:NPDS SUPPLIES 25.86 OAK AT LAGUNA: SPECIAL DIST. CONF. ROOM RSVTN. 215.50 MONTEREY GARAGE: TRAINING PARKING 12.00 PETERSON PRODUCTS: SS ENVIRONMENTAL MONITORING SUPP 736.12 PORTOLA HOTEL: CONFERENCE PARKING 29.00 PROFESSIONAL WOMEN'S NETWORK: EVENT REGISTRATION 35.00 SMART N FINAL: SS EMPLOYEE APPRECIATION SUPPLIES 9.71 STEEL TOE SHOES: SAFETY SHOES RR TECH 119.99 HARBOR FREIGHT TOOLS: FREON REMOVAL SUPPLIES 35.35 ZIG AUTO PARTS: TRAILER LIGHT BULB 5.25 BARNES WELDING: SS NPDS SUPPLIES 205.32 HOME DEPOT: RR TOOL KIT AND CLAMPS 29.07 AUTOZONE: EQUIPMENT REPAIRS SUPPLIES 32.45 AMAZON: RADIO COMMUNICATIONS SUPPLIES 169.99 VISTAPRINT: BUSINESS CARDS FOR NEW RR TECH 32.74
6,387.88 19785 **VOID** 1/31/2018
- -
Page 9 of 10

Check # Check Date Amount Check Total
Salinas Valley Solid Waste AuthorityChecks Issued Report for 1/1/2018 to 1/31/2018
19786 **VOID** 1/31/2018-
- 19787 **VOID** 1/31/2018
- -
19788 **VOID** 1/31/2018-
- 19789 VALLEY FABRICATION, INC. 1/31/2018
SSTS VEHICLE MAINTENANCE 164.97 164.97
DFT2018285 CA STATE BOARD OF EQUALIZATION 1/25/2018QUARTERLY BOE LANDFILL PAYMENT 73,736.60
73,736.60
Subtotal 814,451.06
Payroll Disbursements 487,839.18
Grand Total 1,302,290.24
Page 10 of 10

Page 1 of 3 Item 3 – Interagency Activity Report
Report to the Board of Directors
ITEM NO. 3
N/A Finance and Administration
Manager/Controller-Treasurer
Date: March 15, 2018
From: Mandy Brooks, Resource Recovery Manager
Title: Member and Interagency Activities Report for
February 2018 and Upcoming Events
General Manager/CAO
N/A General Counsel
RECOMMENDATION
Staff recommends the Board accept the report.
STRATEGIC PLAN RELATIONSHIP
This report relates to the Strategic Plan Goal to promote the value of Salinas Valley Recycles’
services and programs to the community. It is intended to keep the Board apprised of activities
and communication with our member agencies and regulators.
Monterey County Environmental Health Bureau (Local Enforcement Agency - LEA)
The monthly inspection for the Sun Street Transfer Station was conducted on February 28 with
no violations or areas of concern noted.
The monthly inspection for the Johnson Canyon Landfill was conducted on February 28.
No areas of concern noted but a notice of violation was issued for the on-going exceedance
of methane concentration of 5% by volume for the Southern Boundary Probe 23. Staff
submitted the weekly probe reading results from the previous months as requested by the LEA.
Gas levels continue to trend downward however the probe continues to exceed the methane
regulatory limits. The LEA was notified on February 2 of tonnage exceedances at Johnson
Canyon on February 1 due to 390 tons of clean dirt received at the facility from a California
Department of Transportation construction project. No customers were turned away in an
effort to reduce illegal dumping issues.
The monthly inspections of the Jolon Road Transfer Station and Landfill (closed) were
completed on February 26, with no areas of concern or violations observed during the
inspection.
Solid Waste Facilities Permit Revision:
A 60-day waiver for the Johnson Canyon Landfill permit revision has been requested until April
15, 2018. This allows CalRecycle to exercise Title 27 of the regulations to allow compliance with
the State minimum standards for the gases exceeding the compliance levels and for staff to
finish a list of nine steps that must be completed to satisfaction of the LEA and CalRecycle to be
considered in compliance with the State minimum standards. Based on these new findings and
the Authority’s diligent efforts to identify and work to correct the gas exceedance issue, the
Notice to Proceed for the Organics Grant was issued by CalRecycle on February 22.
Gonzales Clothing Closet
During the month of February, the Gonzales Clothing Closet’s four (4) volunteers distributed 296
clothing items to 36 clients, representing eight (8) new clients with a total of 141 family members

Page 2 of 3 Item 3 – Interagency Activity Report
served. The Clothing Closet is a partnership between the Authority, The Salvation Army, and the
Gonzales Community Church to provide free clothing to families in need.
Current and Future Events with SVR Staff Participation (Also, Opportunities for Board Member Community Participation)
Gonzales: 4/14 – 4/28 Tire Amnesty Event, Johnson Canyon Landfill
4/21 Spring Litter Abatement Collection Event
4/29 Dia del Nino Event, Central Park
6/23 & 6/24 Reuse, Recycle Clean Up Event, Fairview Middle School
10/7 Carnival Event, St Theodore’s Church
10/13 & 10/14 Reuse, Recycle Clean Up Event, Fairview Middle School
Greenfield: 4/14 Spring Litter Abatement Collection Event
5/21- 5/26 Clean Up Week, Tri-Cities Disposal Corp Yard
8/26 Dia del Trabajador Agricola Resource Fair, Patriot Park
10/20 Reuse, Recycle & Clean Up Day, Memorial Hall
King City: 3/13 – 3/14 Rava Ranch Employee Health Fair
4/14 – 4/28 Tire Amnesty Event, Jolon Rd Transfer Station
4/21 Spring Cleanup & ABOP Collection Event, High School, Mildred Ave
5/15 AMGEN Tour Event, Downtown
6/30 Summer Clean Up & ABOP Collection Event, Mildred Ave
11/3 Fall Clean Up & ABOP Collection Event, Mildred Ave
Salinas: 3/15 Recycling Presentations, Sherwood School and Head Start Center
3/24 Composting Workshop, Jardin El Sol - 139 Sun St, 10am
3/24 District 6 Neighborhood Clean Up Event
4/7 District 3 Neighborhood Clean Up Event
4/10 Elkhorn School Tour, Sun St Transfer Station
4/11 Recycling Presentations, Fremont Head Start Center
4/14 Composting Workshop, Jardin El Sol - 139 Sun St, 10am
4/14 – 4/28 Tire Amnesty Event, Sun St Transfer Station
4/17 La Joya Elementary School Tours, Sun St Transfer Station
4/21 SVR Earth Day Cleanup Event, Natividad Creek, Las Casitas Dr
4/26 Composting & Recycling Presentations, Salinas High School
5/12 District 2 Neighborhood Clean Up Event
5/19 Composting Workshop Local Urban Gardeners, Nativid. Creek Park
6/2 District 4 Neighborhood Clean Up Event
6/23 Composting Demonstration, Los Olivos-Riker Neighborhood Event
8/25 Mayor’s Neighborhood Clean Up Event
9/15 District 5 Neighborhood Clean Up Event
10/20 City-wide Fall Clean Up Event, multiple locations
11/3 District 1 Neighborhood Clean Up Event
Soledad: 3/24 Spring Litter Abatement Collection Event
5/14 – 5/19 Clean Up Week, Public Works Yard
8/12 Fiesta Event, Our Lady of Solitude Church
9/29 Reuse, Recycle & Clean Up Day, High School Parking Lot
11/3 Fall Litter Abatement Collection Event
Monterey

Page 3 of 3 Item 3 – Interagency Activity Report
County: 3/10 Pajaro Spring Clean Up & ABOP Collection Event, Salinas Rd
3/14 Composting Presentation, Rancho Cielo
4/19 Earth Day Mixer, McShane’s Nursery & Landscape Supply
5/5 Chualar Clean Up & ABOP Collection Event, Lincoln St
5/11 Composting Demonstration, Spreckels Elementary School
6/9 Aromas Clean Up & ABOP Collection Event, Carpenteria Rd
7/14 San Lucas Clean Up & ABOP Collection Event, San Benito St
9/8 San Ardo Clean Up & ABOP Collection Event, Oak Ave
10/6 Bradley Clean Up & ABOP Collection Event, Bradley Rd
11/17 Pajaro Fall Clean Up & ABOP Collection Event, Salinas Rd

Page 1 of 2 Item 4 – C&D Processing Options
Report to the Board of Directors
ITEM NO. 4
N/A Finance and Administration
Manager/Controller-Treasurer
Date: March 15, 2018
From: Cesar Zuñiga, Assistant General Manager /
Operations Manager
Title: Cost-Benefit Analysis for Processing Construction
and Demolition Material by SVR or MRWMD
General Manager/CAO
N/A Legal Counsel
RECOMMENDATION
Staff recommends that the Board accept this informational report.
STRATEGIC PLAN RELATIONSHIP
The development of a Construction and Demolition (C&D) processing program supports
SVR Goal to “Reduce Landfill Disposal Fee Dependence Through Self-Funded Programs
and New Revenue Sources” by processing clean and re-usable wood and other materials
out of C&D materials delivered to our facilities.
FISCAL IMPACT
The current program for C&D processing is self-sustained by the tipping fee collected at
the gate house. Implementing a portable sort line to increase the recovery rate of clean
wood at Authority facilities or delivery of the material to the Monterey Regional Waste
Management District (District) would require an increase in the current tipping fee for C&D
material.
DISCUSSION & ANALYSIS
At the January 25, 2017 Board Retreat, staff was asked to recommend a final decision on
a Construction and Demolition Recycling Program for inclusion in the SVR 2017-2018
budget.
An update was provided at the May 18, 2017 board meeting. At the time of the update
the District had estimated October 2017 for the startup of the New Material Recovery
Facility (MRF) sort line which includes a C&D sort line.
The District has not yet begun to process C&D but is expected to begin mid-March 2018.
The District will need to operate the C&D sort line for a few months to have a better
understanding of the cost associated with processing C&D material so they can
accurately develop contract pricing.
The current C&D program consolidates all C&D material received at SVR facilities at the
Johnson Canyon Landfill. The material is then ground into chips and used as Alternative
Daily Cover (ADC) in the landfill operations. Use of processed waste material to simply cover
waste in the landfill is not supportive of our mission to reduce dependence on landfilling and
conserve landfill space, however it is still an allowed activity and provides some benefit in our

Page 2 of 2 Item 4 – C&D Processing Options
waste diversion calculations under today’s regulations. The current programs cost per ton is
$28.24 per ton, which includes transport, processing, and overhead. This rate is based on the
July 1, 2018 SVR rates and the current Vision Recycling processing contract for grinding C&D.
Staff has also been working with the District and requested a cost to process SVR C&D
material in 2016. At that time the District offered the regular gate rate of $51.75 to process
SVR C&D materials. This rate did not include SVRs transportation cost of $17.50/ton effective
July 1, 2017 to deliver the material to the District from the Sun Street Transfer Station, or
additional cost associated with longer haul times from both Johnson Canyon and Jolon
Road, or SVR overhead. The District increased their tipping fee from $51.75 to $56.00 a ton
effective July 1, 2017. If the Board decided to deliver C&D material to the District for
processing at this time, our cost per ton estimate would be $86.28/ton. At this time the
District has not developed any operational data to establish a long term contractual rate for
C&D processing. We anticipate the District will be able to provide a formal cost by
Summer/Fall 2018.
The current C&D material consist of approximately 75% clean wood. In order to recover the
clean wood, the material would need to be reduced into smaller sections and process
through a basic hand sorting system. Staff has established a rate to sort the C&D material
using a portable 6 station sort-line with a shredder at the front end of the process. The cost
of establishing a C&D processing sort line with a grinder, including consolidation of all
materials at the Johnson Canyon Landfill would be an estimated $77.26/ton effective July 1,
2018. This cost includes purchasing a new sort-line, new C&D slow speed shredder, used
excavator, and contracting with a part-time work force such as HOPE Services 2-3 days a
week of operation.
Staff is recommending the Board hold off on a decision until the District has operated their
new Material Recover Facility and process C&D material for a few months to understand the
recovery rates they can achieve and see if the cost per ton needs to be increased or
reduced based on their start-up process analysis. At that time, staff will re-engage with the
District and request a revised quote to process SVR C&D material.
BACKGROUND
All cities within the SVR service areas are working to or have already implemented C&D
ordinance to divert such materials from the landfill. Our current C&D program allows us to
divert some clean wood and grind the remainder of the materials that can be used as
Alternative Daily Cover (ADC) at the landfill. There has been talk by CalRecycle to restrict
the use of ADC as a diversion activity in the next 3-5 years. To maintain and increase
future diversion rates, reduce landfilling of recoverable waste streams, and meet
increasing State mandates, SVR is looking at programs that could increase the diversion of
all clean wood (and other recyclables) mixed into C&D loads, in lieu of just converting it
into landfill daily cover.
These programs can include the sorting of clean wood that can be re-used as landscape
products or compost feedstock, as well as re-sale of acceptable construction lumber such
as 2x4, 4x4, 2x6 lumber and so on. The re-use of these products allows us to reduce the
amount of waste produced, while re-purposing materials and providing them to the public
at a reduced rate.
ATTACHMENTS
None

Report to the Board of Directors
ITEM NO. 5
N/A Finance and Administration Manager,
Controller/Treasurer
Date: March 15, 2018
From: Patrick Mathews, General Manager/CAO
Mandy Brooks, Resource Recovery Manager
Title: Strategic Planning 2016-19: Board Priorities
N/A General Counsel
N/A General Manager/CAO
A PRESENTATION WILL BE GIVEN
AT THE MEETING
Strategic Planning: Board Priorities Survey Results
March 15, 2018
Item No. 5

Strategic Planning & Priorities
• 6-Month Objectives Completed (July – Dec 2017)
• Board Survey: Input on Priorities for Strategic Planning Process
• Survey Results: Guide Next 6-Month Objectives (April –Oct 2018)
Survey Design
• Staff Strategic Planning Retreat
• EMC Research: Question Development & Design
• # of Questions: 25
• Survey Format: On-line and Hard Copy

Survey Analysis
• Total Responses: 9
• Format Utilized: On-line & Hard Copies
• Average response time: 8 mins.
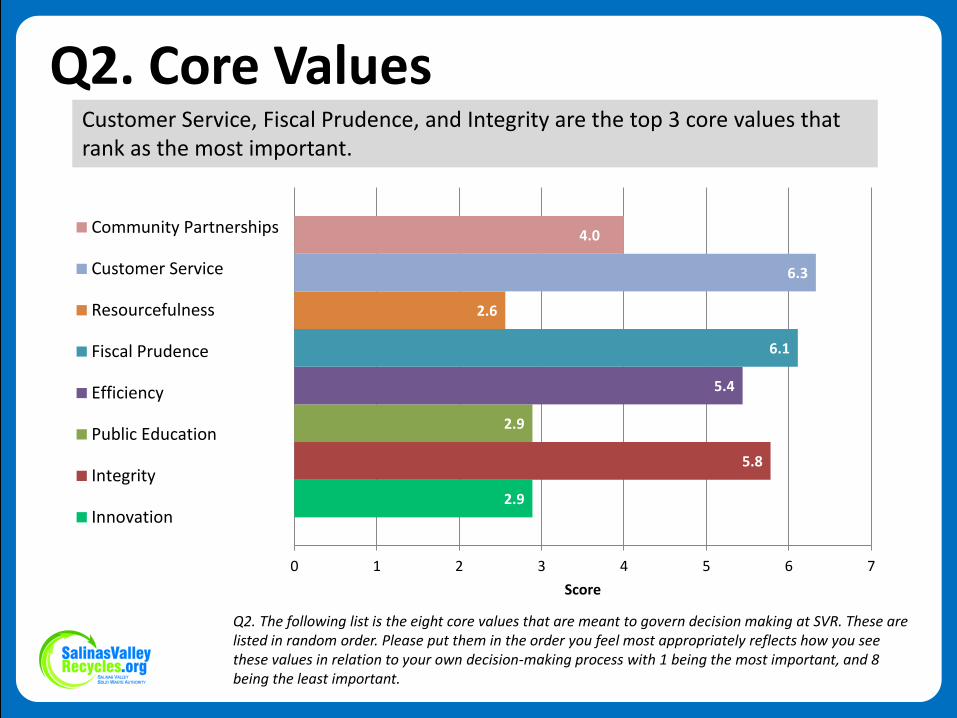
Q2. Core Values
2.9
5.8
2.9
5.4
6.1
2.6
6.3
4.0
0 1 2 3 4 5 6 7
Score
Community Partnerships
Customer Service
Resourcefulness
Fiscal Prudence
Efficiency
Public Education
Integrity
Innovation
Q2. The following list is the eight core values that are meant to govern decision making at SVR. These are listed in random order. Please put them in the order you feel most appropriately reflects how you see these values in relation to your own decision-making process with 1 being the most important, and 8 being the least important.
Customer Service, Fiscal Prudence, and Integrity are the top 3 core values that rank as the most important.

Q3. Priorities
Q3. Please rate how important you as an SVR Board Member think it is for the agency to focus on each of the following priorities in planning for the future of the organization. Please rate each priority on a 1 to 7 scale, with 1 being not at all important, and 7 being extremely important.
More than two-thirds of Board Members indicate that reducing illegal dumping is the top priority.
11%
11%
22%
11%
11%
11%
11%
11%
11%
11%
44%
44%
44%
22%
33%
33%
33%
56%
67%
Minimizing the impact of recycling and waste disposalservices to local water quality
Ensuring local residents and businesses have a safe andconvenient place to drop off recyclables, hazardous
materials and waste
Maintaining adequate funding for environmentalcontrol systems for closed and active facilities tomanage risk for the public and the environment
Reducing the amount of waste that goes into locallandfills by upgrading recycling facilities so they can
recycle more materials
Reducing illegal dumping
1 - Not At All Important 2 3 4 5 6 7 - Extremely Important

Q4. StatementA majority of Board Members indicate that the agency should develop systems that exceed State mandates to reduce landfill dependence.
Q4. If you had to choose, which of the following statements do you most agree with?SVR should maintain the lowest cost system necessary to meet State mandates ORSVR should develop systems that exceed State mandates to reduce landfill dependence as much as possible
33%
67%
Responses
0% 10% 20% 30% 40% 50% 60% 70% 80%
SVR should develop systemsthat exceed State mandatesto reduce landfilldependence as much aspossible
SVR should maintain thelowest cost systemnecessary to meet Statemandates

Q5. Future Facilities Planning
Q5. As SVR considers options for future facilities, there are a number of factors that may impact your thinking about what options to support for the future of the agency. For each of the following, how important is it for you as an SVR Board Member, when thinking about future facilities planning? Please rate each option on a 1 to 7 scale, with 1 being not at all important, and 7 being extremely important.
Ensuring long-term financial sustainability for the agency is the top priority when considering options for future facilities planning
Total Importance
11%
11%
11%
11%
11%
11%
11%
11%
22%
11%
11%
11%
11%
33%
33%
44%
22%
33%
33%
33%
11%
22%
22%
44%
44%
44%
33%
22%
11%
33%
11%
11%
11%
11%
22%
56%
Benefiting the local economy
Preserving local jobs
Expanding services
Improving ease of access forcustomers
Increasing sustainability throughwaste recovery
Controlling increases in operatingcosts
Reducing environmental impacts
Ensuring long-term financialsustainability for the agency
1 -Not At All Important 2 3 4 5 6 7 - Extremely Important
88%
77%
88%
77%
66%
66%
89%
88%

Q6. Top 2 Priorities for Facilities Planning
Q6. Now, thinking of that same list, if you had to choose the top two priorities for facilities planning, which two would you choose? (select only two)
A majority of the Board Members indicate that ensuring long-term financial sustainability for the agency is a top priority for facilities planning.
0%
11%
11%
11%
22%
44%
44%
56%
0% 10% 20% 30% 40% 50% 60%
Ensuring long-term financialsustainability for the agency
Increasing sustainability throughwaste recovery
Controlling increases in operatingcosts
Preserving local jobs
Improving ease of access forcustomers
Benefitting the local economy
Reducing environmental impacts
Expanding services

Questions/Comments?
Thank you

Page 1 of 2 Item 6 – CalPERS Contract
Report to the Board of Directors
ITEM NO. 6
Finance and Administration
Manager/Controller/Treasurer
Date: March 15, 2018
From: C. Ray Hendricks, Finance and Administration
Manager
Title: A Resolution of Intention to Approve an
Amendment to the Contract with the Board of
Administration of the California Public
Employee Retirement System (CalPERS)
General Manager/CAO
N/A General Counsel
RECOMMENDATION
The Executive Committee recommends adoption of the Resolution.
STRATEGIC PLAN RELATIONSHIP
The recommended action does not have a relationship with the Strategic Plan.
DISCUSSION & ANALYSIS
The MOU that was approved on December 21, 2017 calls for CalPERS “Classic Members”
to pay 1% of the Authority portion of contributions in addition to their entire share of 7%.
While amending the contract is not necessary to implement the employees’ 8% share, it
makes it more equitable if we do. Amending the contract ensures that employees’
contributions are kept in their personal retirement allocation which affects some of their
retirement benefits. The Authority still gets the benefit of a 1% reduction of their
contributions.
There is a three-step process required to process the amendment:
1. The Board adopts a resolution of intent to amend the contract
2. Affected employees must vote by secret ballot whether to approve the
amendment.
3. The Board adopts a Resolution to Amend the Contract
The contract cannot be amended if a majority of the affected members vote to
disapprove the proposed plan. Currently, we have 30 Classic Members. For the vote to
disapprove of the proposed plan, 16 will have to vote no. If staff does not approve the
contract change, the additional 1% will be deducted after tax as approved in the MOU.
There must be at least 20 days between the resolution of intent and the resolution to
amend the contract. Additionally, the certified vote must occur in between the resolution
of intent and the resolution to amend. CalPERS will provide the final resolution and
contract amendment once they receive the necessary documents for the first two steps.
The effective date of this amendment will be the pay period beginning July 2, 2018.
Page 2 of 2 Item 6 – CalPERS Contract
BACKGROUND
The MOU that was approved on December 21, 2017 calls for CalPERS “Classic Members”
to pay 1% of Authority portion of contributions in addition to their entire share of 7%. At
the time management indicated that The Authority would amend the CalPERS contract to
have this 1% contribution added to the employees account.
ATTACHMENT(S)
1. Resolution of Intention
2. Draft Amendment to CalPERS Contract
RESOLUTION OF INTENTION
TO APPROVE AN AMENDMENT TO CONTRACT
BETWEEN THE
BOARD OF ADMINISTRATION CALIFORNIA PUBLIC EMPLOYEES' RETIREMENT SYSTEM
AND THE
BOARD OF DIRECTORS SALINAS VALLEY SOLID WASTE AUTHORITY
WHEREAS, the Public Employees' Retirement Law permits the participation of public
agencies and their employees in the Public Employees' Retirement System by the execution of a contract, and sets forth the procedure by which said public agencies may elect to subject themselves and their employees to amendments to said Law; and
WHEREAS, one of the steps in the procedures to amend this contract is the adoption by
the governing body of the public agency of a resolution giving notice of its intention to approve an amendment to said contract, which resolution shall contain a summary of the change proposed in said contract; and
WHEREAS, the following is a statement of the proposed change:
To provide Section 20516 (Employees Sharing Additional Cost) of 1% for classic local miscellaneous members.
NOW, THEREFORE, BE IT RESOLVED that the governing body of the above agency does
hereby give notice of intention to approve an amendment to the contract between said public agency and the Board of Administration of the Public Employees' Retirement System, a copy of said amendment being attached hereto, as an "Exhibit" and by this reference made a part hereof.
By:_________________________________ Presiding Officer
_________________________________ Title
________________________________ Date adopted and approved (Amendment) CON-302 (Rev. 3/9/2016 rc)

CalPERS Contract Amendment
March 15, 2018
ITEM NO. 6

Amendment
• MOU Changes
– Employees to pay 8% on July 1, 2018
• More Equitable
– Entire employee payment remains in their “bank”
– Allows employees to pay additional 1% pre tax
– Authority still saves 1% in PERS rate
Process
1. The Board adopts a resolution of intent to amend the contract
2. Affected employees must vote by secret ballot whether to disapprove the amendment.
3. The Board adopts a Resolution to Amend the Contract
Page 1 of 4 Item 7 – Organics Processing Agreement
Report to the Board of Directors
ITEM NO. 7
Finance and Administration
Manager/Controller/Treasurer
Date: March 15, 2018
From: Patrick Mathews, General Manager/CAO
Title: A Resolution Approving an Agreement with
Republic Services of Salinas for Phased-In
Organics Processing Rate Adjustments Through
Fiscal Year 2021-2022
General Manager/CAO
T. Bruen by PM Legal Counsel
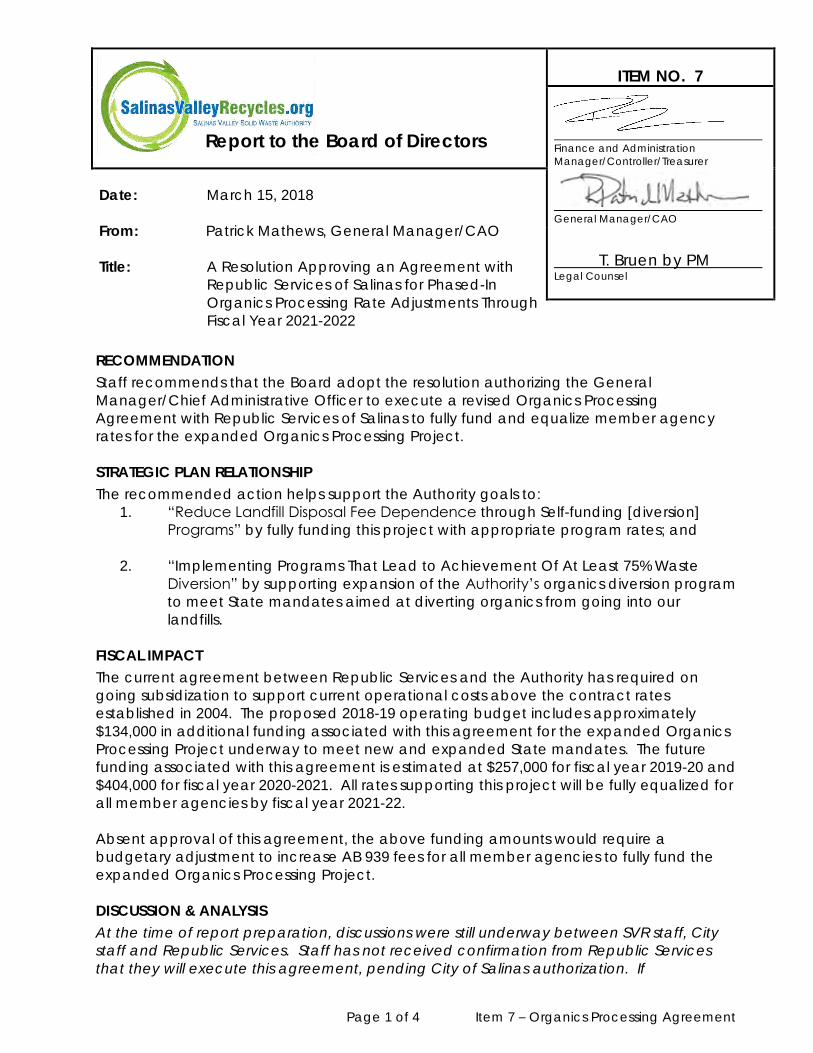
RECOMMENDATION
Staff recommends that the Board adopt the resolution authorizing the General
Manager/Chief Administrative Officer to execute a revised Organics Processing
Agreement with Republic Services of Salinas to fully fund and equalize member agency
rates for the expanded Organics Processing Project.
STRATEGIC PLAN RELATIONSHIP
The recommended action helps support the Authority goals to:
1. “Reduce Landfill Disposal Fee Dependence through Self-funding [diversion]
Programs” by fully funding this project with appropriate program rates; and
2. “Implementing Programs That Lead to Achievement Of At Least 75% Waste
Diversion” by supporting expansion of the Authority’s organics diversion program
to meet State mandates aimed at diverting organics from going into our
landfills.
FISCAL IMPACT
The current agreement between Republic Services and the Authority has required on
going subsidization to support current operational costs above the contract rates
established in 2004. The proposed 2018-19 operating budget includes approximately
$134,000 in additional funding associated with this agreement for the expanded Organics
Processing Project underway to meet new and expanded State mandates. The future
funding associated with this agreement is estimated at $257,000 for fiscal year 2019-20 and
$404,000 for fiscal year 2020-2021. All rates supporting this project will be fully equalized for
all member agencies by fiscal year 2021-22.
Absent approval of this agreement, the above funding amounts would require a
budgetary adjustment to increase AB 939 fees for all member agencies to fully fund the
expanded Organics Processing Project.
DISCUSSION & ANALYSIS
At the time of report preparation, discussions were still underway between SVR staff, City
staff and Republic Services. Staff has not received confirmation from Republic Services
that they will execute this agreement, pending City of Salinas authorization. If
Page 2 of 4 Item 7 – Organics Processing Agreement
confirmation is not received prior to this Board meeting, the rate hearing and final budget
adoption will need to be heard, then continued for final action to the April meeting. This
agreement has significant implications for both the proposed rate adjustments and the
final budget.
This item has been under discussion with the Board since April 2016 in conjunction with the
expanded Organics Processing Project under construction to meet the new state
mandates to reduce organics going to landfills and to reduce associated greenhouse gas
emissions. The Authority was a recipient of a $1.34 million grant from CalRecyle last year
that will fund most of the necessary capital investment for implementing a full-scale
composting operation and help control increasing costs to comply with these new state
mandates.
This action will equalize and phase-in the supporting rates for this expanded program for
all member agencies and provide the funding necessary to increase recovery of
foodwaste and packaged produce and agricultural wastes still going to the Authority’s
Johnson Canyon Landfill.
BACKGROUND
The original 2004 green waste delivery agreement with Republic Services of Salinas
included reduced rates to secure flow of materials prior to the Joint Powers Authority (JPA)
Amendment for flow control of green waste. With the need to expand the organics
program and processing capabilities and adhere to Authority Board policy, the reduced
rates are no longer applicable.
Since 2016, the Authority has been exploring funding opportunities and the expansion of
the current organics recycling operation to achieve the levels of diversion and
greenhouse gas emission reductions required by various state mandates. Two of the most
recent laws, the Mandatory Commercial Organics Recycling Program (Assembly Bill (AB)
1826) and Short-Lived Climate Pollutants and Methane Emissions Reduction Strategy
(Senate Bill (SB) 1383), effectively eliminates the disposal of organic materials (including
food scraps) in landfills by 2025.
The Provisions of AB 1826 are focused on businesses, including multifamily complexes and
schools who are required to divert organic waste on and after April 1, 2016, depending on
the amount of waste they generate per week. AB 1826 also requires local jurisdictions to
implement organic waste recycling programs to divert this waste away from landfills
beginning January 1, 2016.
SB 1383 Short-Lived Climate Pollutants (SLCP) and Methane Emissions Reduction is the most
ambitious disposal reduction mandate since the passage of AB 939. Short-lived climate
pollutants, such as black carbon, fluorinated gases, and methane emissions resulting from
the decomposition of organic waste in landfills, are powerful climate impact forces that
have a dramatic and detrimental effect on air quality, public health, and climate
change. These pollutants create a warming influence on the climate that is many times
more potent than that of carbon dioxide. SB 1383 requires CalRecycle in conjunction with
the California Air Resources Board to develop regulations to reduce organic waste
disposal below 2014 levels by:
• 50% by 2020;
• 75% by 2025; and
• Divert 20% of edible food from the landfill for human consumption by 2025.

Page 3 of 4 Item 7 – Organics Processing Agreement
Achieving these levels of diversion would effectively eliminate most of the organic
materials in landfills in California. This agreement will facilitate the necessary funding and
support to help implement the program expansions necessary to meet these State
mandates.
ATTACHMENT(S)
1. Resolution
2. Exhibit A – Agreement with Republic Services for Organics Processing
Page 4 of 4 Item 7 – Organics Processing Agreement
RESOLUTION NO. 2018 -
A RESOLUTION OF THE SALINAS VALLEY SOLID WASTE AUTHORITY FOR AN AGREEMENT WITH
REPUBLIC SERVICES OF SALINAS FOR PHASED-IN ORGANICS PROCESSING RATE
ADJUSTMENTS THROUGH FISCAL YEAR 2021-2022
BE IT RESOLVED BY THE BOARD OF DIRECTORS OF THE SALINAS VALLEY SOLID WASTE
AUTHORITY, that the General Manager/CAO is hereby authorized and directed for, and on
behalf of, the Salinas Valley Solid Waste Authority to execute an Agreement with Republic
Service of Salinas for phased-in Organics Processing rates through fiscal year 2021-22, as
attached hereto and marked “Exhibit A.”
PASSED AND ADOPTED by the Board of Directors of the Salinas Valley Solid Waste
Authority at its regular meeting duly held on the 15th day of March 2018, by the following
vote:
AYES: BOARD MEMBERS:
NOES: BOARD MEMBERS:
ABSENT: BOARD MEMBERS:
ABSTAIN: BOARD MEMBERS:
________________________________
Simón Salinas, President
ATTEST:
Erika J. Trujillo, Clerk of the Board
Page 1 of 4
EXHIBIT A
REVISED AGREEMENT BETWEEN
SALINAS VALLEY SOLID WASTE AUTHORITY
AND
REPUBLIC SERVICES OF SALINAS
FOR
ORGANICS PROCESSING
March 15, 2018
Replaces Original “Green Waste Delivery Agreement” dated November 18, 2004

Page 2 of 4
THIS REVISED AGREEMENT FOR ORGANICS PROCESSING (the “Agreement”) is made and entered into as of the 15th day of March 2018 by and between the Republic Services of Salinas (“Contractor”), a private corporation, and the Salinas Valley Solid Waste Authority (“Authority”), a joint exercise of powers entity.
RECITALS
Whereas, in December 1996, Monterey County and the cities of Gonzales,
Greenfield, King City, Salinas and Soledad (“Member Agencies”) formed the Authority to promote the environmental health of the Salinas Valley through planning, public education and management of an innovative municipal solid waste (MSW) management system; and.
Whereas, the Authority owns, manages and operates an MSW management
system for the diversion and disposal of MSW generated by the cities and unincorporated area within the Authority boundaries. This system includes one active landfill and two transfer stations; and,
Whereas, The Authority Joint Powers Agreement provides for development of
waste diversion facilities, specifically expanded composting facilities to provide for mandated organics waste diversion activities for its members; and,
Whereas, this Agreement when originally executed in 2004, did not anticipate the
significant changes in markets, environmental regulation and State mandates to increase all forms of organic waste diversion from landfills and the resulting increases in costs well beyond the 2004 contracted rate structure; and,
Whereas, the Authority Joint Powers Agreement provides for establishing a
schedule of uniform and equalized rates that will not differentiate between geographical or jurisdictional areas within the boundaries of the Authority; and
Whereas, the projected and future organics diversion program rates for the
Contractor, under the original agreement are not equivalent with those of the other member agencies; and
Whereas, the Authority is expanding processing operations for the current source separated green waste diversion at its Johnson Canyon Landfill to include source separated food waste and mixed organics; and,
Whereas, the Authority Joint Powers Agreement provides for designation of
facilities to deliver the source separated green waste and food waste, and mixed organics that is collected as part of member agency franchise agreements to meet State mandate for management of these materials,
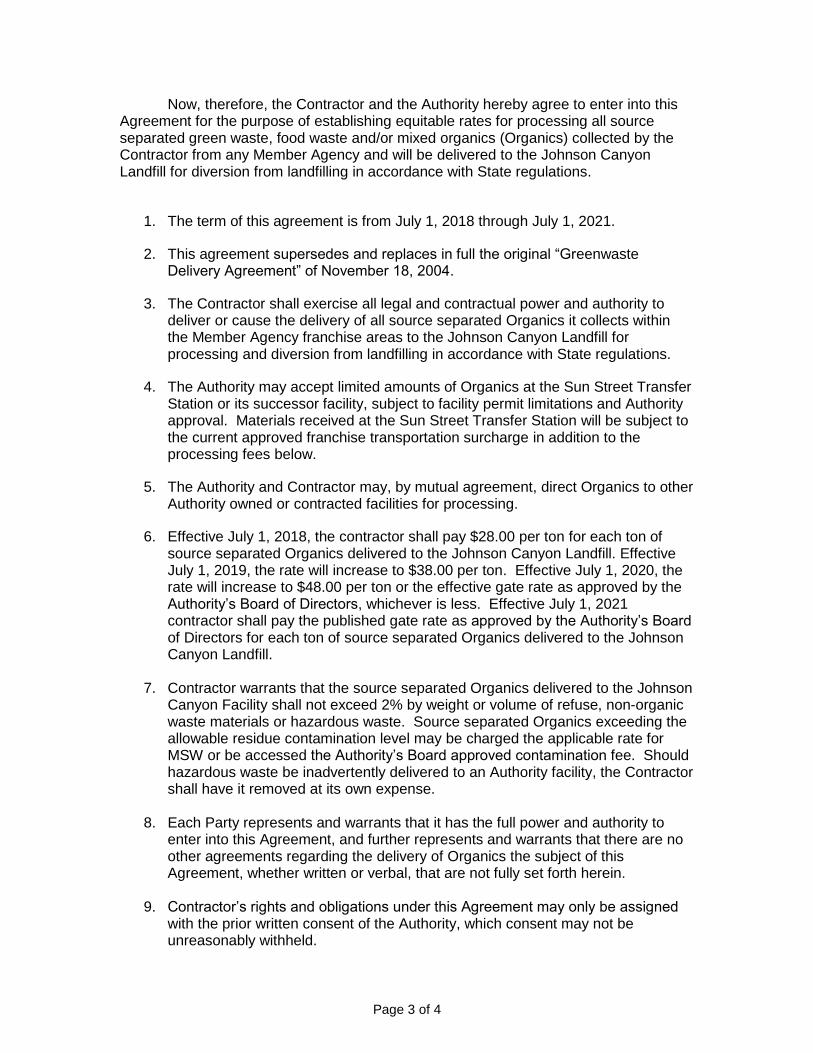
Page 3 of 4
Now, therefore, the Contractor and the Authority hereby agree to enter into this Agreement for the purpose of establishing equitable rates for processing all source separated green waste, food waste and/or mixed organics (Organics) collected by the Contractor from any Member Agency and will be delivered to the Johnson Canyon Landfill for diversion from landfilling in accordance with State regulations.
1. The term of this agreement is from July 1, 2018 through July 1, 2021.
2. This agreement supersedes and replaces in full the original “Greenwaste Delivery Agreement” of November 18, 2004.
3. The Contractor shall exercise all legal and contractual power and authority to deliver or cause the delivery of all source separated Organics it collects within the Member Agency franchise areas to the Johnson Canyon Landfill for processing and diversion from landfilling in accordance with State regulations.
4. The Authority may accept limited amounts of Organics at the Sun Street Transfer Station or its successor facility, subject to facility permit limitations and Authority approval. Materials received at the Sun Street Transfer Station will be subject to the current approved franchise transportation surcharge in addition to the processing fees below.
5. The Authority and Contractor may, by mutual agreement, direct Organics to other Authority owned or contracted facilities for processing.
6. Effective July 1, 2018, the contractor shall pay $28.00 per ton for each ton of source separated Organics delivered to the Johnson Canyon Landfill. Effective July 1, 2019, the rate will increase to $38.00 per ton. Effective July 1, 2020, the rate will increase to $48.00 per ton or the effective gate rate as approved by the Authority’s Board of Directors, whichever is less. Effective July 1, 2021 contractor shall pay the published gate rate as approved by the Authority’s Board of Directors for each ton of source separated Organics delivered to the Johnson Canyon Landfill.
7. Contractor warrants that the source separated Organics delivered to the Johnson
Canyon Facility shall not exceed 2% by weight or volume of refuse, non-organic waste materials or hazardous waste. Source separated Organics exceeding the allowable residue contamination level may be charged the applicable rate for MSW or be accessed the Authority’s Board approved contamination fee. Should hazardous waste be inadvertently delivered to an Authority facility, the Contractor shall have it removed at its own expense.
8. Each Party represents and warrants that it has the full power and authority to enter into this Agreement, and further represents and warrants that there are no other agreements regarding the delivery of Organics the subject of this Agreement, whether written or verbal, that are not fully set forth herein.
9. Contractor’s rights and obligations under this Agreement may only be assigned
with the prior written consent of the Authority, which consent may not be unreasonably withheld.

Page 4 of 4
10. In the event that any legal action or proceeding is necessary to enforce any term or condition of this Agreement, the prevailing party in any such action or proceeding shall be entitled to an award of reasonable attorney’s fees and costs, including expert witness fees, as determined by a court.
CONTRACTOR By: ___________________________ Republic Services General Manager SALINAS VALLEY SOLID WASTE AUTHORITY By: ____________________________ General Manager/CAO APPROVED AS TO FORM By: ____________________________ Authority Counsel ATTEST: By: _____________________________ Clerk of the Board
PHASED-IN ORGANICS
RATE AGREEMENT WITH
REPUBLIC SERVICES
Board of Directors
March 15, 2018
ITEM NO. 7
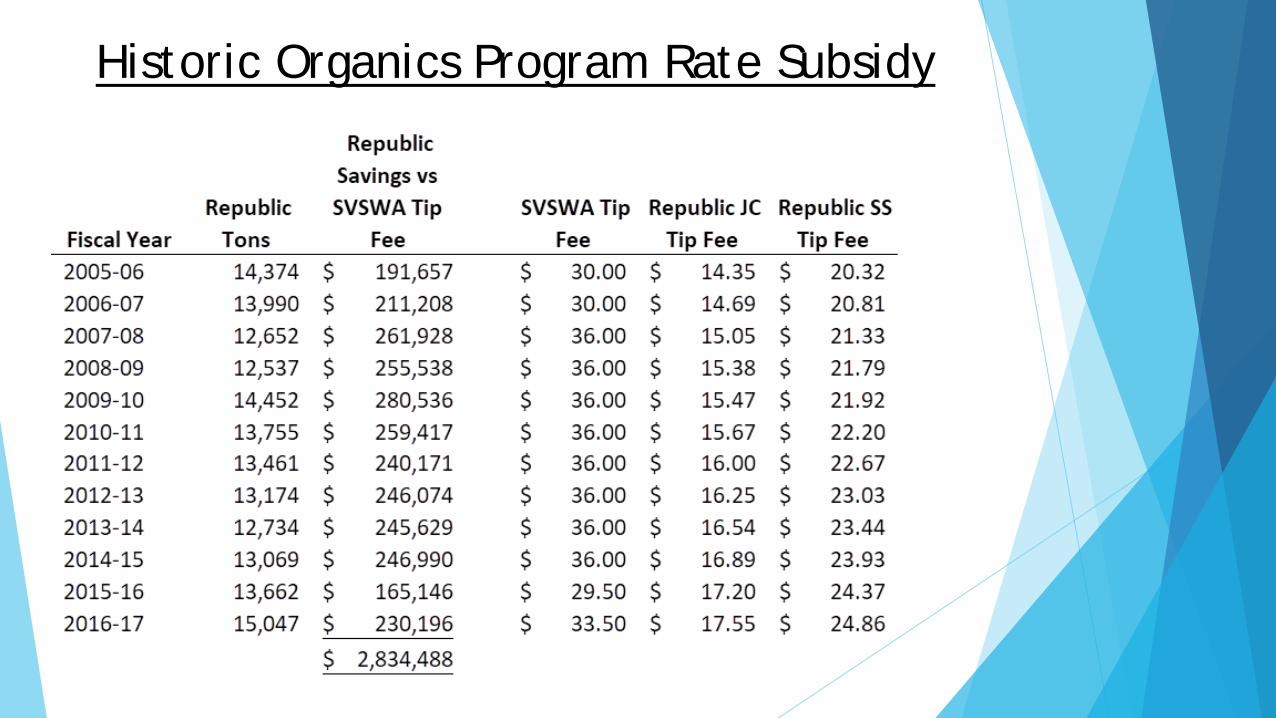
Historic Organics Program Rate Subsidy

Residential Rate Impacts (estimate)
Hauler
Service
Level
Rate
Increase w/o
Agreement
Rate Increase
with
Agreement Difference
Republic 32 gal $0.07 $0.13* ($0.06)*
Tri Cities 48 gal $0.30 $0.21 $0.09
WM- County 35 gal $0.26 $0.14 $0.12
WM- King City 35 gal $0.22 $0.12 $0.10
• Does not include jurisdiction fees (i.e. franchise fees) outside of SVSWA
control
Growing Rate Subsidy to Support Expanded Organics w/o Rate Adjustments:
2018/19 - $277,060 2019/20 - $337,060 2020/21 - $401,800
* Revised on 3/14/18

Revised Agreement Benefits
Phases out rate subsidy
Sustainably funds full cost of State mandated program
expansion
Eliminates need to raise AB 939 fees for FY 2018-19
Brings program into compliance with JPA Section 15.
EQUALIZATION OF RATES: The Authority Board shall establish a schedule of uniform
and equalized rates that will not differentiate between geographical or
jurisdictional areas within the boundaries of the Authority…
QUESTIONS?

Page 1 of 2 Item 8 – Disposal & Service Fees
Report to the Board of Directors
ITEM NO. 8
Finance and Administration
Manager/Controller/Treasurer
Date: March 15, 2018
From: C. Ray Hendricks, Finance and Administration
Manager
Title: A Resolution Approving the Disposal and Service
Fees Effective July 1, 2018
General Manager/CAO
N/A General Counsel
RECOMMENDATION
The Executive Committee recommends approval of the service fees effective July 1, 2018.
STRATEGIC PLAN RELATIONSHIP
This is a routine operational item. It does not directly relate to the Board’s Strategic Plan.
FISCAL IMPACT
Approval of the proposed rate schedule will result in no increase in solid waste tipping fees
due to an increased projected tonnage, an increase in organics, and an increase to the
Transfer Station Surcharge of $ 0.25.
DISCUSSION & ANALYSIS
Reallocation of AB939 Fee
The AB939 fee is not proposed to increase. However, each member agency’s share of the
AB939 fee is being reallocated using the total tonnage landfilled over the prior three fiscal
years. The table below shows the FY 2018-19 AB939 allocation based on the FYE 2015-17
landfilled tonnage.
Increase tipping fees for Expanded Organics Program
This would increase our budgeted revenue by $165,025.
On September 21, 2017, the Board approved the expanded organics program to meet
new State mandates for organics diversion from landfills which will include the addition of
food and recovered agricultural waste composting. A phased-in rate increase over a

Page 2 of 2 Item 8 – Disposal & Service Fees
three-year period was recommended to buffer the impact to rate payers. This will also
allow the Authority to run the operations for a couple of years and evaluate the program
and long-term needs for new waste streams such as cannabis and agricultural cull wastes
that may increase system processing demands. The Authority is working with Republic
Services to phase out the discounted greenwaste contract signed in 2004 to allow for full
and equal funding of the program by all members. Following is the schedule of rate
increases approved in concept when the organics program was considered by the Board
in September 2017.
Salinas Organics Mixed Organics Wood Waste
FY 2017-18 18.05 33.50 33.50
FY 2018-19 28.00 38.25 36.25
FY 2019-20 38.00 43.00 39.00
FY 2020-21 48.00 48.00 42.00
Increase Franchise Transportation Surcharge by 1.4% ($0.25/ton)
This would increase our budgeted revenue by $46,550. The transportation surcharge was
last increased in FY 2017-18 to $17.50. During FY 2016-17 the Authority spent $17.79/ton to
transport Salinas Franchise Waste. This increase will partially offset the increase in Madison
Lane Transfer costs due to the ongoing increases in Salinas area waste. The increase will
also support the Board’s goal of establishing rates that fully support program costs and do
not rely on landfill tipping fee subsidy.
Clean Soil
Johnson Canyon has a surplus of clean fill dirt. The tipping fee for clean dirt was increased
from $10 per ton to $12 per ton in FY 2016-17, then again to $14 per ton in FY 2017-18. SVR
staff intended to gradually increase the tip fee to $28 per ton, which is the same rate
charged for other cover material at the site. However, since tonnage has continued to
increase staff proposed to increase the rate to $28 per ton effective immediately.
The Board voiced concerns about the effects to local projects and companies. To
address these concerns, staff recommends an increase to this rate of $2 per ton to $16 per
ton, and creating a new out of service area rate of $28 per ton. Staff is currently working
on the long-term development plans for the landfill and will readdress this item when the
amount of excess soil at the site is better estimated.
BACKGROUND
The preliminary budget included in this month’s agenda was presented to the Board on
February 15, 2018. The proposed FY 2018-19 rates reflect the needs that the Authority
need to meet regulatory fees, processing services, employment cost obligations, legacy
landfill liabilities and capital improvement project needs. A Public Hearing is scheduled for
March 15, 2018 to consider the proposed rates.
ATTACHMENT(S)
1. Resolution and Fee Schedule
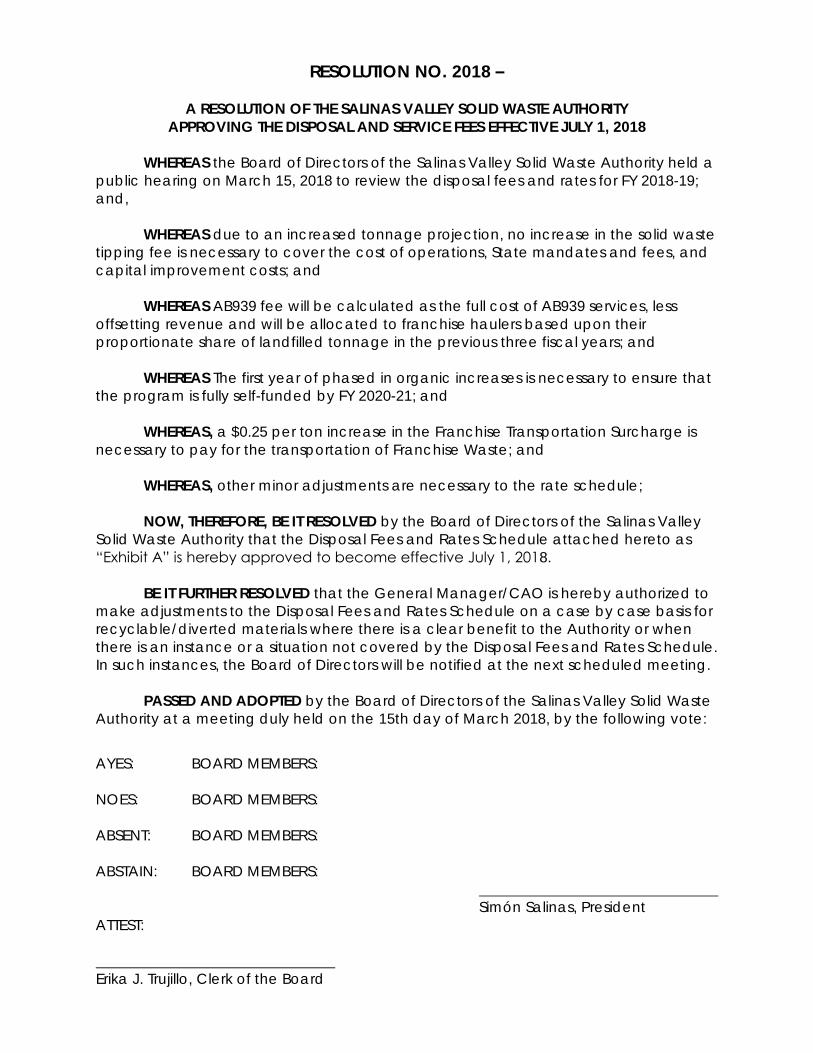
RESOLUTION NO. 2018 –
A RESOLUTION OF THE SALINAS VALLEY SOLID WASTE AUTHORITY
APPROVING THE DISPOSAL AND SERVICE FEES EFFECTIVE JULY 1, 2018
WHEREAS the Board of Directors of the Salinas Valley Solid Waste Authority held a
public hearing on March 15, 2018 to review the disposal fees and rates for FY 2018-19;
and,
WHEREAS due to an increased tonnage projection, no increase in the solid waste
tipping fee is necessary to cover the cost of operations, State mandates and fees, and
capital improvement costs; and
WHEREAS AB939 fee will be calculated as the full cost of AB939 services, less
offsetting revenue and will be allocated to franchise haulers based upon their
proportionate share of landfilled tonnage in the previous three fiscal years; and
WHEREAS The first year of phased in organic increases is necessary to ensure that
the program is fully self-funded by FY 2020-21; and
WHEREAS, a $0.25 per ton increase in the Franchise Transportation Surcharge is
necessary to pay for the transportation of Franchise Waste; and
WHEREAS, other minor adjustments are necessary to the rate schedule;
NOW, THEREFORE, BE IT RESOLVED by the Board of Directors of the Salinas Valley
Solid Waste Authority that the Disposal Fees and Rates Schedule attached hereto as
“Exhibit A” is hereby approved to become effective July 1, 2018.
BE IT FURTHER RESOLVED that the General Manager/CAO is hereby authorized to
make adjustments to the Disposal Fees and Rates Schedule on a case by case basis for
recyclable/diverted materials where there is a clear benefit to the Authority or when
there is an instance or a situation not covered by the Disposal Fees and Rates Schedule.
In such instances, the Board of Directors will be notified at the next scheduled meeting.
PASSED AND ADOPTED by the Board of Directors of the Salinas Valley Solid Waste
Authority at a meeting duly held on the 15th day of March 2018, by the following vote:
AYES: BOARD MEMBERS:
NOES: BOARD MEMBERS:
ABSENT: BOARD MEMBERS:
ABSTAIN: BOARD MEMBERS:
Simón Salinas, President
ATTEST:
Erika J. Trujillo, Clerk of the Board

Exhibit A
Note: Usefulness and suitability of materials is subject to scale house personnel's discretion.
Franchise Haulers (Class III Solid Waste) 68.50$ Per Ton
Self Haul Loads at all Sites
Minimum charge per load (up to 500 lbs.) 16.00$ Per Load 17.00$ Per Load
Loads weighing between 501 and 999 lbs. 32.00$ Per Load 34.00$ Per Load
Loads weighing 1,000 lbs. and above 68.50$ Per Ton
Fumigation or Mulch Plastic/Drip Tape - Johnson Canyon only
Loads weighing 500 lbs. or less 18.75$ Per Load
Loads weighing between 501 and 999 lbs. 37.50$ Per Load
Loads weighing 1,000 pounds and above 75.00$ Per Ton
Nonfriable Asbestos 90.00$ Per Ton
Up to 1 cubic yard w/o pre-approval) wetted and double bagged
Special Handling Charge (in addition to cost per ton) - Johnson Canyon only
Remediated Soil Handling 100.00$ Each
Certified Burials (under 20' trailer) 105.00$ Each
Certified Burials (20' and over trailer) 210.00$ Each
Special Handling Charge (in addition to cost per ton)
Unloading Assistance (Per Person, 1 hour minimum) 75.00$ Hour
Pull Off / Push Off Assistance 50.00$ Each
Tarps 10.00$ Each
Untarped Loads Additional 50% of the Required Fee
Compost Bins 49.95$ Each
*Soil (Loaded by the Customer) - Johnson Canyon 1.00$
AB939 Fees Total 2,319,700$ Annual
Fee is charged to franchise haulers based on prior three years of tonnage:
Fee allocation is as follows:
SALINAS VALLEY SOLID WASTE AUTHORITY
PROPOSED DISPOSAL AND SERVICE FEES
Effective July 1, 2018
Current Proposed
AB939 Fees
Fee or Rate Changes
LANDFILLED MATERIALS
Per Cubic
Yard Up to 500
C.Y.
Reallocation
March 15, 2018 Board of Directors Meeting
Item 8b - Rates Exhibit A Disposal Rates and Fees Schedule
page 1 of 4
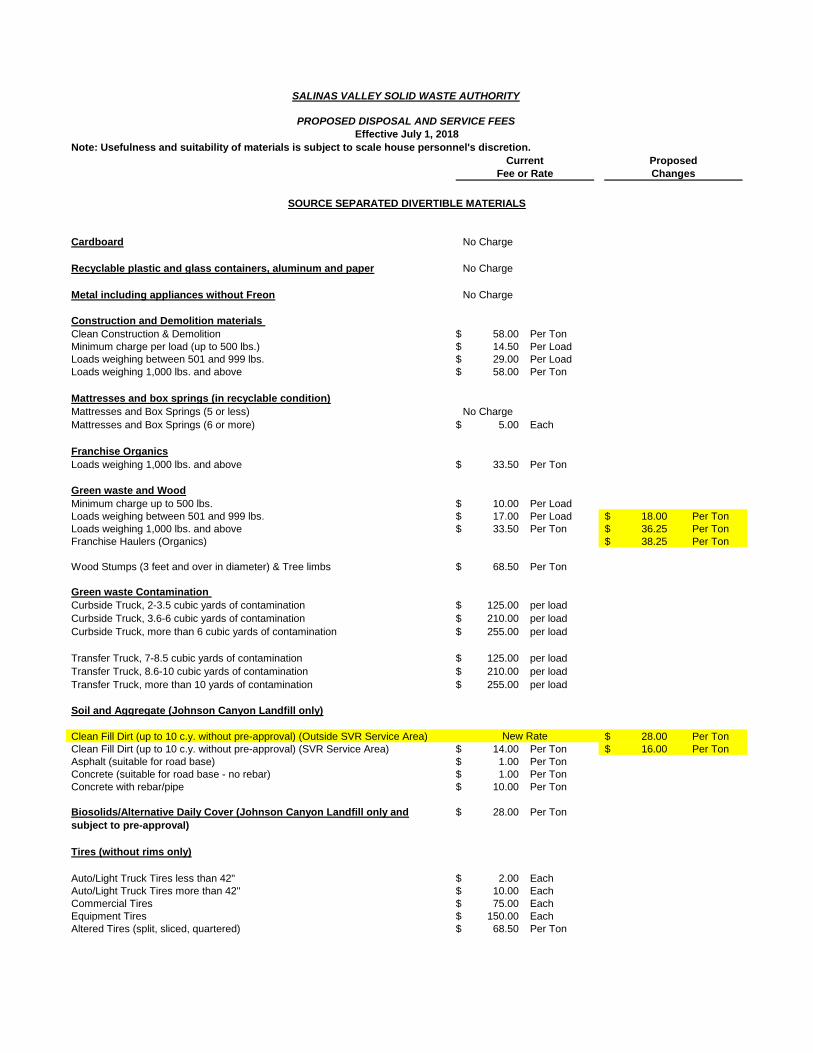
Note: Usefulness and suitability of materials is subject to scale house personnel's discretion.
SALINAS VALLEY SOLID WASTE AUTHORITY
PROPOSED DISPOSAL AND SERVICE FEES
Effective July 1, 2018
Current Proposed
Fee or Rate Changes
Cardboard No Charge
Recyclable plastic and glass containers, aluminum and paper No Charge
Metal including appliances without Freon No Charge
Construction and Demolition materials
Clean Construction & Demolition 58.00$ Per Ton
Minimum charge per load (up to 500 lbs.) 14.50$ Per Load
Loads weighing between 501 and 999 lbs. 29.00$ Per Load
Loads weighing 1,000 lbs. and above 58.00$ Per Ton
Mattresses and box springs (in recyclable condition)
Mattresses and Box Springs (5 or less) No Charge
Mattresses and Box Springs (6 or more) 5.00$ Each
Franchise Organics
Loads weighing 1,000 lbs. and above 33.50$ Per Ton
Green waste and Wood
Minimum charge up to 500 lbs. 10.00$ Per Load
Loads weighing between 501 and 999 lbs. 17.00$ Per Load 18.00$ Per Ton
Loads weighing 1,000 lbs. and above 33.50$ Per Ton 36.25$ Per Ton
Franchise Haulers (Organics) 38.25$ Per Ton
Wood Stumps (3 feet and over in diameter) & Tree limbs 68.50$ Per Ton
Green waste Contamination
Curbside Truck, 2-3.5 cubic yards of contamination 125.00$ per load
Curbside Truck, 3.6-6 cubic yards of contamination 210.00$ per load
Curbside Truck, more than 6 cubic yards of contamination 255.00$ per load
Transfer Truck, 7-8.5 cubic yards of contamination 125.00$ per load
Transfer Truck, 8.6-10 cubic yards of contamination 210.00$ per load
Transfer Truck, more than 10 yards of contamination 255.00$ per load
Soil and Aggregate (Johnson Canyon Landfill only)
Clean Fill Dirt (up to 10 c.y. without pre-approval) (Outside SVR Service Area) 28.00$ Per Ton
Clean Fill Dirt (up to 10 c.y. without pre-approval) (SVR Service Area) 14.00$ Per Ton 16.00$ Per Ton
Asphalt (suitable for road base) 1.00$ Per Ton
Concrete (suitable for road base - no rebar) 1.00$ Per Ton
Concrete with rebar/pipe 10.00$ Per Ton
Biosolids/Alternative Daily Cover (Johnson Canyon Landfill only and 28.00$ Per Ton
subject to pre-approval)
Tires (without rims only)
Auto/Light Truck Tires less than 42" 2.00$ Each
Auto/Light Truck Tires more than 42" 10.00$ Each
Commercial Tires 75.00$ Each
Equipment Tires 150.00$ Each
Altered Tires (split, sliced, quartered) 68.50$ Per Ton
SOURCE SEPARATED DIVERTIBLE MATERIALS
New Rate
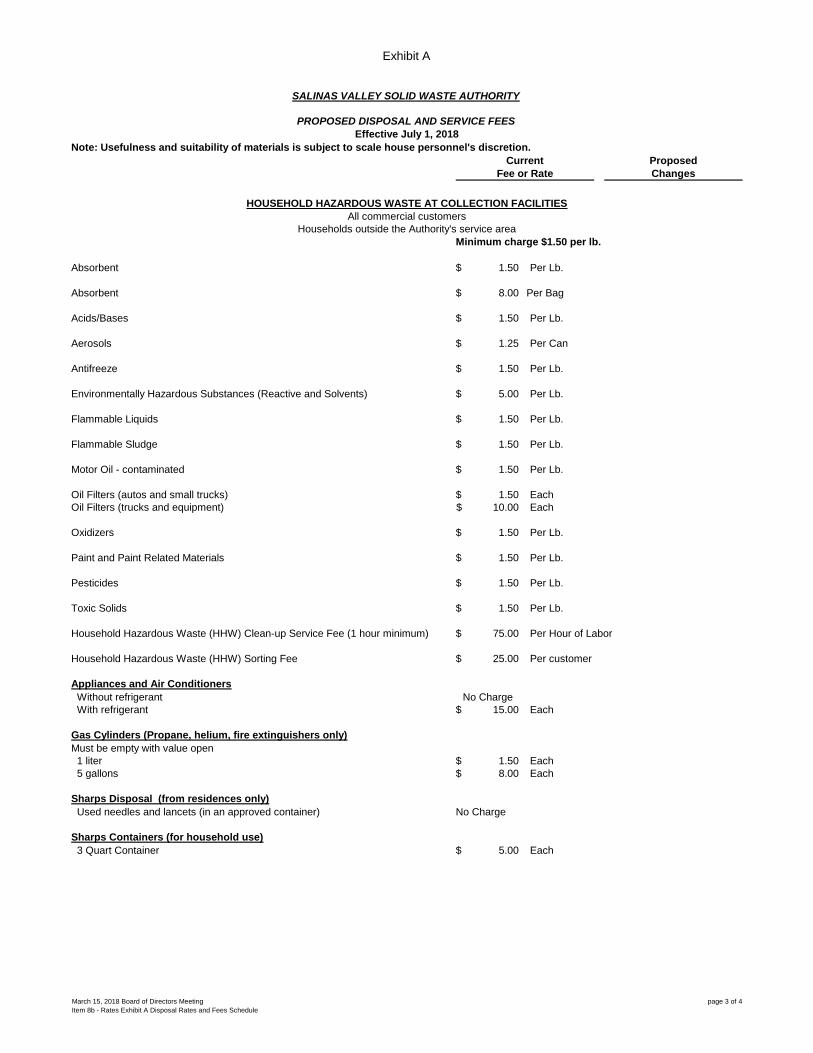
Exhibit A
Note: Usefulness and suitability of materials is subject to scale house personnel's discretion.
SALINAS VALLEY SOLID WASTE AUTHORITY
PROPOSED DISPOSAL AND SERVICE FEES
Effective July 1, 2018
Current Proposed
Fee or Rate Changes
Minimum charge $1.50 per lb.
Absorbent 1.50$ Per Lb.
Absorbent 8.00$ Per Bag
Acids/Bases 1.50$ Per Lb.
Aerosols 1.25$ Per Can
Antifreeze 1.50$ Per Lb.
Environmentally Hazardous Substances (Reactive and Solvents) 5.00$ Per Lb.
Flammable Liquids 1.50$ Per Lb.
Flammable Sludge 1.50$ Per Lb.
Motor Oil - contaminated 1.50$ Per Lb.
Oil Filters (autos and small trucks) 1.50$ Each
Oil Filters (trucks and equipment) 10.00$ Each
Oxidizers 1.50$ Per Lb.
Paint and Paint Related Materials 1.50$ Per Lb.
Pesticides 1.50$ Per Lb.
Toxic Solids 1.50$ Per Lb.
Household Hazardous Waste (HHW) Clean-up Service Fee (1 hour minimum) 75.00$ Per Hour of Labor
Household Hazardous Waste (HHW) Sorting Fee 25.00$ Per customer
Appliances and Air Conditioners
Without refrigerant No Charge
With refrigerant 15.00$ Each
Gas Cylinders (Propane, helium, fire extinguishers only)
Must be empty with value open
1 liter 1.50$ Each
5 gallons 8.00$ Each
Sharps Disposal (from residences only)
Used needles and lancets (in an approved container) No Charge
Sharps Containers (for household use)
3 Quart Container 5.00$ Each
Households outside the Authority's service area
HOUSEHOLD HAZARDOUS WASTE AT COLLECTION FACILITIES
All commercial customers
March 15, 2018 Board of Directors Meeting
Item 8b - Rates Exhibit A Disposal Rates and Fees Schedule
page 3 of 4

Note: Usefulness and suitability of materials is subject to scale house personnel's discretion.
SALINAS VALLEY SOLID WASTE AUTHORITY
PROPOSED DISPOSAL AND SERVICE FEES
Effective July 1, 2018
Current Proposed
Fee or Rate Changes
Minimum charge $1.50 per pound
Batteries
Alkaline or Rechargeable A, AA, AAA, B, C, D and 6 volt 1.50$ Per Lb.
Nickel-Cadmium, Lithium, Silver Oxide-Hydride Cells,
Lead Gel Cells, Nickel-Metal, and Lithium
UPS/Automobile and Light Truck Batteries No Charge
CRT (televisions and computer monitors) No Charge
Cell Phones No Charge
Computers, keyboard and printers No Charge
Copiers, mimeographs, facsimile machines No Charge
Compact Fluorescent Bulbs 1.50$ Per Lb.
Fluorescent Lamps 1.50$ Per Lb.
Halogen, High Pressure Soldium Tubes 1.50$ Per Lb.
Fluorescent Ballasts (PCB) 2.00$ Per Lb.
Kitchen appliances: microwaves, toaster, toaster ovens No Charge
Mercury 7.00$ Per Lb.
Mercury thermostats, thermometers or switches 1.00$ Each
Toner, developer, ink cartridges (office use) 1.50$ Per Lb.
Toner and developer (industrial use) 1.50$ Per Lb.
Franchise Transportation Surcharge 17.50$ Per Ton 17.75$ Per Ton
Agenda Packets for Board or Executive Committee 116.00$ Annually
Agendas Only 26.00$ Annually
Agendas Only for Public Agencies 18.00$ Annually
Reproduction of Public Records 0.10$ Per Page
Copies of Weight Tags 20.00$ Each
Returned Check Fee 25.00$ Each
Finance Charge on accounts 30+ Days Past Due 1.5% per mo., 18% annually
Media duplication for disks, cds, tapes
Actual Cost
$5.00 Min. Each
Plans & Specifications for Construction Projects
Actual Cost
$15.00 Min. Per Set
Full Size Plans for Construction Projects
Actual Cost
$15.00 Min Per Set
UNIVERSAL WASTE AT HHW COLLECTION FACILITIES
ADMINISTRATIVE & SPECIAL FEES
Fiscal Year 2018-19Rates and Fee Schedule
March 15, 2018
ITEM NO. 8

Rate Adjustments
Self Haul Loads at all Sites
Minimum charge per load (up to 500 lbs.) 16.00$ Per Load 17.00$ Per Load
Loads weighing between 501 and 999 lbs. 32.00$ Per Load 34.00$ Per Load
Loads weighing 1,000 lbs. and above 68.50$ Per Ton
Green waste and Wood
Minimum charge up to 500 lbs. 10.00$ Per Load
Loads weighing between 501 and 999 lbs. 17.00$ Per Load 18.00$ Per Ton
Loads weighing 1,000 lbs. and above 33.50$ Per Ton 36.25$ Per Ton
Franchise Haulers (Organics) 38.25$ Per Ton
Soil and Aggregate (Johnson Canyon Landfill only)
Clean Fill Dirt (up to 10 c.y. without pre-approval) (Outside SVR Service Area) 28.00$ Per Ton
Clean Fill Dirt (up to 10 c.y. without pre-approval) (SVR Service Area) 14.00$ Per Ton 16.00$ Per Ton
Franchise Transportation Surcharge 17.50$ Per Ton 17.75$ Per Ton
ADMINISTRATIVE & SPECIAL FEES
Fee or Rate Changes
New Rate
Current Proposed

AB939 Fees (Reallocation)Current Rates Proposed Changes
AB939 Fees Total $ 2,319,700 Annual $ 2,319,700 Annual
Fee is charged to franchise haulers based on prior three years average tonnage:
FYE June 2015 through 2017 Franchise Tons
Total Tonnage FYE 2015-17
Allocation Percentage
Annual AB939 Fee
Monthly AB939 Fee
Salinas 280,306 62.3% 1,444,709 120,392 Monterey 97,312 21.6% 501,550 41,796 Tri Cities (Combined) 48,889 10.9% 251,976 Soledad 8,788 Greenfield 8,177 Gonzales 4,033 King City 23,567 5.2% 121,465 10,122
434,182 2,319,700 193,308

Residential Rates (Estimate)
Hauler
Service
Level
Disposal/
Organics
Fee
Increases
Transport
Increase
AB939
Increase
Total
Increase*
Republic 32 gal .13* .02 ( .02) $ .13*
Tri Cities 48 gal .19 .02 $ .21
WM- County 35 gal .08 .02 .04 $ .14
WM- King City 35 gal .07 .02 .03 $ .12
• Does not include jurisdiction fees (i.e. franchise fees) outside of SVSWA control
* Revised on 3/14/18

Total Estimated Residential Rates
Hauler
Service
Level
Hauler CPI*
Increase
SVSWA Fee
Increases
Franchise
Fee
Increase
Total
Increase*
Republic 32 gal $ .27 $ .13 $ .14 $ .54
Tri Cities 48 gal $ .49 $ .21 $ .14 $ .84
WM- County 35 gal $ .69 $ .14 $ .08 $ .91
WM- King City 35 gal $ .47 $ .12 $ .11 $ .70
Feb CPI 3.56%Republic is 75% of CPI
* Slide Added on 3/14/18
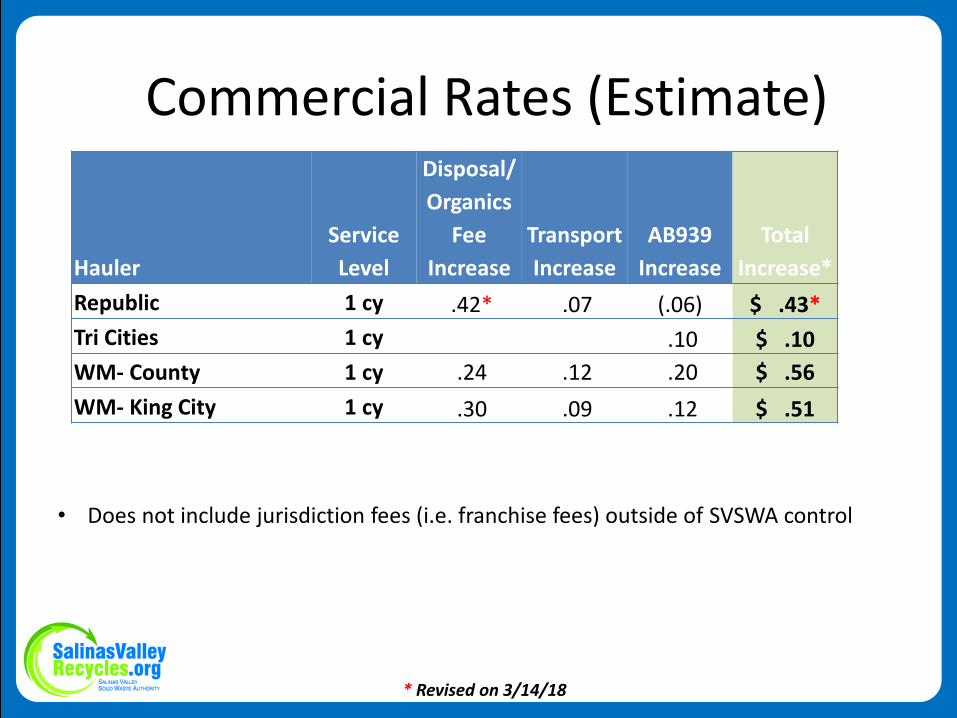
Commercial Rates (Estimate)
Hauler
Service
Level
Disposal/
Organics
Fee
Increase
Transport
Increase
AB939
Increase
Total
Increase*
Republic 1 cy .42* .07 (.06) $ .43*
Tri Cities 1 cy .10 $ .10
WM- County 1 cy .24 .12 .20 $ .56
WM- King City 1 cy .30 .09 .12 $ .51
• Does not include jurisdiction fees (i.e. franchise fees) outside of SVSWA control
* Revised on 3/14/18

Total Estimated Commercial Rates
Hauler
Service
Level
Hauler CPI*
Increase
SVSWA Fee
Increases
Franchise
Fee
Increase
Total
Increase*
Republic 1 cy $ 4.96 $ .43 $ 1.89 $ 7.28
Tri Cities 1 cy $ 3.33 $ .10 $ .69 $ 4.12
WM- County 1 cy $ 4.00 $ .56 $ .46 $ 5.02
WM- King City 1 cy $ 1.98 $ .51 $ .45 $ 2.94
Feb CPI 3.56% Republic is 75% of CPI
* Slide Added on 3/14/18
Questions/Comments
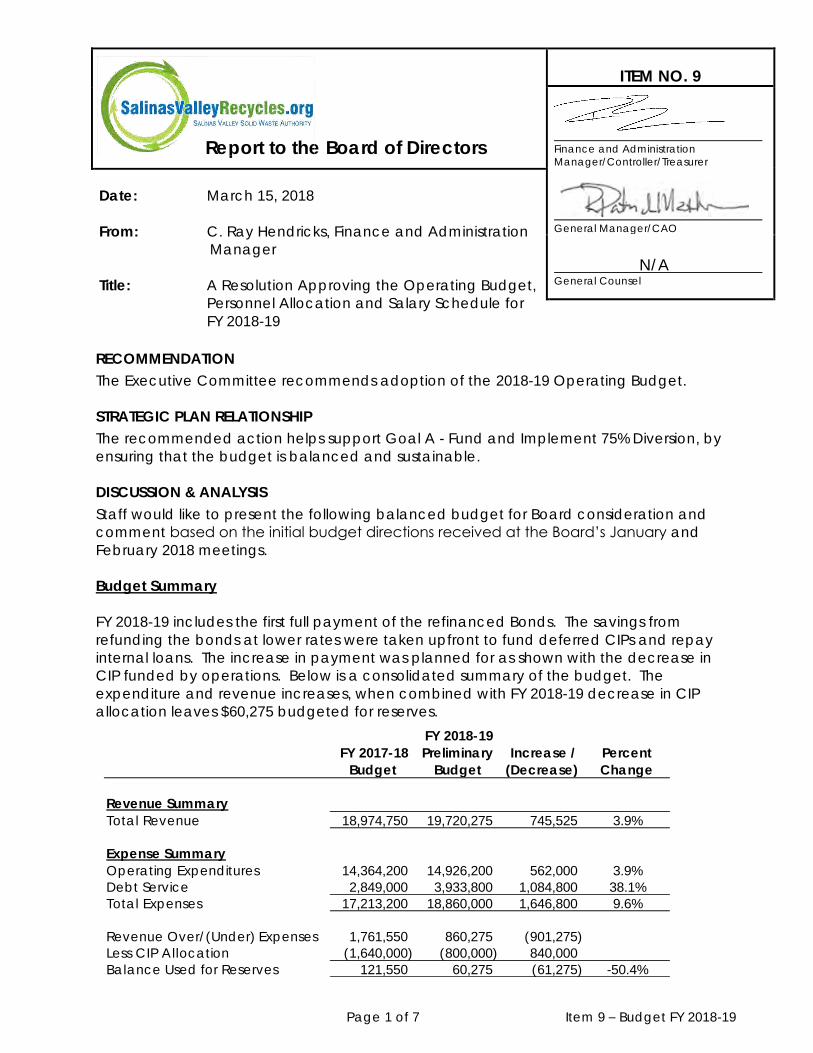
Page 1 of 7 Item 9 – Budget FY 2018-19
Report to the Board of Directors
ITEM NO. 9
Finance and Administration
Manager/Controller/Treasurer
Date: March 15, 2018
From: C. Ray Hendricks, Finance and Administration
Manager
Title: A Resolution Approving the Operating Budget,
Personnel Allocation and Salary Schedule for
FY 2018-19
General Manager/CAO
N/A General Counsel
RECOMMENDATION
The Executive Committee recommends adoption of the 2018-19 Operating Budget.
STRATEGIC PLAN RELATIONSHIP
The recommended action helps support Goal A - Fund and Implement 75% Diversion, by
ensuring that the budget is balanced and sustainable.
DISCUSSION & ANALYSIS
Staff would like to present the following balanced budget for Board consideration and
comment based on the initial budget directions received at the Board’s January and
February 2018 meetings.
Budget Summary
FY 2018-19 includes the first full payment of the refinanced Bonds. The savings from
refunding the bonds at lower rates were taken upfront to fund deferred CIPs and repay
internal loans. The increase in payment was planned for as shown with the decrease in
CIP funded by operations. Below is a consolidated summary of the budget. The
expenditure and revenue increases, when combined with FY 2018-19 decrease in CIP
allocation leaves $60,275 budgeted for reserves.
FY 2017-18
Budget
FY 2018-19
Preliminary
Budget
Increase /
(Decrease)
Percent
Change
Revenue Summary
Total Revenue 18,974,750 19,720,275 745,525 3.9%
Expense Summary
Operating Expenditures 14,364,200 14,926,200 562,000 3.9%
Debt Service 2,849,000 3,933,800 1,084,800 38.1%
Total Expenses 17,213,200 18,860,000 1,646,800 9.6%
Revenue Over/(Under) Expenses 1,761,550 860,275 (901,275)
Less CIP Allocation (1,640,000) (800,000) 840,000
Balance Used for Reserves 121,550 60,275 (61,275) -50.4%
Salinas Valley Solid Waste Authority
FY 2017-18 Budget with Adjustments

Page 2 of 7 Item 9 – Budget FY 2018-19
Revenue Increases ($745,525)
The following options are available to balance the budget.
FY 2018-19 Projected Operating Revenue Increase
7,500-ton increase in solid waste tonnage projection 513,550
Expanded Organics Program Increase to tipping fees 165,025
1.4% Increase to Franchise Transportation Surcharge 46,550
Net all other Revenue Increases/(Decreases) 20,200
Total Revenue Increase 745,525
Increasing the projected tonnage by 7,500 tons
This would increase the budgeted revenue by $513,550. The Authority has sustained
several years of increasing tonnage since 2013. Staff remains cognizant of the effects a
future recession could have on the Authority’s tonnage, however the sustained increases
in tonnage over the last several years provides a comfort level that a conservative
tonnage projection of 185,000 is reasonable. Increases in tonnage will increase some
tonnage related fees and closure funding expense, but amounts are minimal and are
incorporated in the budget.
Increase tipping fees for Expanded Organics Program
This would increase our budgeted revenue by $165,025.
On September 21, 2017, the Board approved the expanded organics program to meet
new State mandates for organics diversion from landfills which will include the addition of
food and recovered agricultural waste composting. A phased-in rate increase over a
three-year period was recommended to buffer the impact to rate payers. This will also
allow the Authority to run the operations for a couple of years and evaluate the program
and long-term needs for new waste streams such as cannabis and agricultural cull wastes
that may increase system processing demands. The Authority will need to work with
Republic Services to phase out the discounted greenwaste contract signed in 2004 to
allow for full and equal funding of the program by all members. Following is the schedule
of rate increases approved in concept when the organics program was considered by
the Board in September 2017.
Salinas Organics Mixed Organics Wood Waste
FY 2017-18 18.05 33.50 33.50
FY 2018-19 28.00 38.25 36.25
FY 2019-20 38.00 43.00 39.00
FY 2020-21 48.00 48.00 42.00
Increase Franchise Transportation Surcharge by 1.4% ($0.25/ton)
This would increase our budgeted revenue by $46,550. The transportation surcharge was
last increased in FY 2017-18 to $17.50. During FY 2016-17 the Authority spent $17.79/ton to
transport Salinas Franchise Waste. This increase will partially offset the increase in Madison
Lane Transfer costs due to the ongoing increases in Salinas area waste. The increase will
also support the Board’s goal of establishing rates that fully support program costs and do
not rely on landfill tipping fee subsidy.

Page 3 of 7 Item 9 – Budget FY 2018-19
Clean Soil
Johnson Canyon has a surplus of clean fill dirt. The tipping fee for clean dirt was increased
from $10 per ton to $12 per ton in FY 2016-17, then again to $14 per ton in FY 2017-18. SVR
staff intended to gradually increase the tip fee to $28 per ton, which is the same rate
charged for other cover material at the site. However, since tonnage has continued to
increase staff proposed to increase the rate to $28 per ton effective immediately.
The Board voiced concerns about the effects to local projects and companies. In order
to address these concerns, staff recommends an increase to this rate of $2 per ton to $16
per ton, and creating a new out of service area rate of $28 per ton. Staff is currently
working on the long-term development plans for the landfill and will readdress this item
when the amount of excess soil at the site is better estimated.
Operational Increases ($1,649,000)
FY 2017-18 Projected Operating Budget Increase
Debt Service Increase $1,084,800
Payroll Increases 225,550
Expanded Organics Processing 204,700
Facility Maintenance 34,300
Contract Labor 32,100
Closure Costs 19,800
Repair & Maintenance Supplies 18,000
Litter Abatement 16,000
All Other Increases / (Decreases) 13,750
Total Increase $ 1,649,000
Debt Service
Debt Service is scheduled to increase $1,084,800 in FY 2018-19. When the Bonds were
refinanced in 2014, the savings were taken upfront to fund deferred CIPs and payback
internal loans taken to fund CIPs during the Great Recession. In FY 2018-19, the Bond
Payments will return to the amount that was being paid before the refinancing
(approximately $3.13 million). Bond Payments will continue at this level through 2026-27.
The final Bond payment is scheduled for August 1, 2031.
When the Authority took over the operations of Johnson Canyon Landfill it took a $3.6
million Capital Lease Loan to purchase the initial equipment needed for operations. The
final payment is scheduled for August 1, 2019. The money currently used for Capital Lease
payments will be used to fund future capital equipment needs. This should minimize the
need to take out loans for future capital equipment needs.
The following table shows the schedule for all outstanding debt service including interest.
Scheduled debt service payments for FY 2018-19 are $3,933,600.
Fiscal Year Bond Payment Capital Lease Total Debt Service
2014-15 1,920,876 414,811 2,335,686
2015-16 1,908,648 960,373 2,869,021
2016-17 1,907,820 797,594 2,705,415
2017-18 2,051,271 797,594 2,848,866
2018-19 3,135,978 797,594 3,933,572
2019-20 3,134,015 215,938 3,349,952
2020-21 3,136,699 3,136,699

Page 4 of 7 Item 9 – Budget FY 2018-19
2021-22 3,133,956 3,133,956
2022-23 3,135,730 3,135,730
2023-24 3,136,791 3,136,791
2024-25 3,137,000 3,137,000
2025-26 3,130,838 3,130,838
2026-27 3,132,688 3,132,688
2027-28 2,942,613 2,942,613
2028-29 2,750,975 2,750,975
2029-30 2,752,550 2,752,550
2030-31 2,751,838 2,751,838
2031-32 2,748,563 2,748,563
Payroll Increase
The net increase to payroll is scheduled to be $225,550 (1.2% of proposed operating
budget). Increases are due to annual merit increases, as well as changes due to the
approved MOU, such as a 3% COLA and increases to the diversion workers’ salary
schedule. The Payroll increases are partially offset by increased employee contributions to
retirement and medical insurance costs included in the new MOUs. Staff is also requesting
two staff allocation adjustments that total $20,000.
Description
Payroll Budget
Increases
COLA (MOU) $ 141,800
Merit Increases 106,400
Diversion Workers (MOU) 44,800
Worker’s Comp Insurance 43,800
Position Changes 19,840
Health Premiums (MOU) (71,900)
Net All Other Increases/(Decreases) (15,390)
Net Payroll Increases $ 225,550
Unfreeze Business Services Supervisor
The Authority’s Accountant is scheduled to retire during FY 2018-19. One of the Authority’s
Goals is to “Maintain a High Performance and Flexible Workforce and Promote the Value
of Salinas Valley Recycles Services and Programs to the Community.” Anytime a
supervisor or manager leaves, the agency management reassesses options for
reorganization, cost savings and staff resource improvements. Management requests that
the Business Services Supervisor position that was frozen in 2015 is reallocated. This position
is classified at the same level as the Accountant and would supervise routine day to day
operations. The Accountant position would remain unfilled and subsequently eliminated
during a future staffing action after the Accountant retirement. To allow for training, staff
would like to fill this position a month before the Accountant retires. The cost of this
overlap is $8,640.
Reclassify Equipment Operator to Equipment Operator Lead
Staff request the reclassification of the Jolon Road Transfer Station Equipment Operator /
Driver to Equipment Operator / Driver / Lead. The remote location and busy operations at
Johnson Canyon make it difficult for the Supervisor to be at both facilities throughout the
day. Making this change will allow the Authority to have a designated lead operator to
handle day to day issues such as supervision, onsite projects, oversight of contractors and
meeting with regulators. The cost of this reclassification is $11,200.

Page 5 of 7 Item 9 – Budget FY 2018-19
Expanded Organics Processing
On September 21, 2017, the Board approved the expanded organics program to meet
the levels of diversion and greenhouse gas emission reductions required by various state
mandates, including the Global Warming Solutions Act (Assembly Bill (AB) 32), the
Mandatory Commercial Organics Recycling Program (AB 1826), and Short-Lived Climate
Pollutants and Methane Emissions Reduction Strategy (Senate Bill 1383), which effectively
eliminates the disposal of organic materials (including food scraps) in landfills by 2025 with
interim reduction mandates. An Organics grant in the amount $1.3 million was awarded
and accepted from CalRecycle to fund the infrastructure needed for the new program.
The program is expected to be up and running around January 1, 2019. The increase in
cost of the program for the first six months is $204,700, and includes two diversion workers
to operate the de-packaging equipment, a capital replacement reserve for the de-
packaging machine and skid loader, materials and supplies, equipment maintenance,
site maintenance, and operations and agency overhead allocations.
Operational Increases
The remaining $133,950 in increases are due to operational needs due to increasing
tonnages accepted at the facilities.
Facility Maintenance $ 34,300
Contract Labor 32,100
Closure Costs 19,800
Repair & Maintenance Supplies 18,000
Litter Abatement 16,000
All Other Increases / (Decreases) 13,750
$ 133,950
Capital Improvement Projects Budget
The following Projects are to be budgeted in FY 2017-18
Johnson Canyon LFG System (Vertical Wells) 30,000
Johnson Canyon LFG System (Horizontal Wells) 30,000
Johnson Canyon Litter Control Fence 50,000
Johnson Canyon Corrective Action Program 125,000
Johnson Canyon Module Construction 250,000
Concrete Grinding 20,000
Jolon Road Transfer Station Replacement Well 75,000
Jolon Road Equipment Purchase/Replacement (Repayment) 120,000
SSTS Equipment Replacement 100,000
Total Operating Surplus Allocations 800,000
Johnson Canyon Landfill ($110,000)
As landfill operations continue at the Johnson Canyon Landfill, so is the need to assure an
effective environmental control system is in place. For example, installing landfill gas wells
in areas of new waste disposal, addressing drainage to continue with storm water pollution
prevention, and expanding the litter control fence along the property boundary are some
of the features required to for effective landfill operations.

Page 6 of 7 Item 9 – Budget FY 2018-19
Johnson Canyon Corrective Action Program ($125,000)
Groundwater monitoring wells are part of the Corrective Action Workplan for Johnson
Canyon Landfill as required by the Regional Water Quality Control Board. Several of the
existing monitoring wells have gone dry during the drought, and it was hoped that the
extreme wet rainy season we had last year would bring the water table up so these wells
would have enough water to monitor. It is now becoming evident that the aquifer is not
adequately recharging to enable us to continue to use these wells and they will have to
be replaced.
JC Module 7 Engineering and Construction ($250,000)
As the agency works towards deciding its long-range facility needs, it is time to begin
planning for the next cell at Johnson Canyon. Initial Engineer estimates have the new cell
being built in FY 2020-21 at a cost of $4-6 million. Staff is in the process of working with
consultants in order to determine what options are available for the construction schedule
as well as revisiting the original estimates. We may be able to spread out the construction
of the cell over a longer period to spread out the needed funding. It is critical that we
continually fund this project to ensure that there is adequate funding available when the
construction of a new cell is necessary.
Jolon Road Transfer Station ($195,000)
Staff took-over of the Jolon Road Transfer Station in September 2016. Rather than take out
a private loan, the Board approved borrowing $398,500 from CIP reserve funds with the
remaining $201,500 coming from operating surpluses in 2016-17. Repayment of these
funds are budgeted at $120,000 per year. Once these funds are repaid, the funds will be
allocated to a Capital Equipment Replacement CIP in order to have cash available when
the equipment purchased in FY 2016-17 requires replacement.
In addition, the existing water supply well at the Jolon Road Transfer Station produces a
low flow rate of water that is non-potable due to the shallow nature of the well. As
concluded by the water supply study performed by staff last year, this well needs to be
replaced to supply adequate water for use as site dust control, domestic use, and to have
capacity in the event of a fire event.
Sun Street Transfer Station Equipment Replacement ($100,000)
The Board approved the Sun Street Equipment replacement plan on August 22, 2013. In
order to meet CIP requirements, some of the equipment replacement has been delayed.
To replace necessary equipment, money is set aside every year.
BACKGROUND
As part of SVRs three-part budget process, the Executive Committee and the Board of
Directors received a report requesting budget direction in January summarizing the
various issues, expenses and revenue changes identified by staff that effect the upcoming
budget. The second step in this process was to present the draft budget in February
based on the Board’s January budget directions. At its February meeting, the Board
directed staff to prepare the final budget and schedule the rate hearing with the
requested changes and directions to the draft Budget. The final step of the process is
approval of the final budget and rates in March.
This structured budget approval schedule is necessary to support the member agency’s
franchise hauler rate setting processes that occur in April and May of each year. The
haulers need to know what SVR’s rates will be in order to complete their rate package
Page 7 of 7 Item 9 – Budget FY 2018-19
submittals for each jurisdiction. This structured process has worked very well in the last
several budget cycles and allowed for timely approval of the final franchise rates and
distribution of advanced public noticing by the haulers.
ATTACHMENT(S)
1. Resolution
2. FY 2018-19 Proposed Budget
3. FY 2018-19 Proposed Personnel Allocation
4. FY 2018-19 Proposed Salary Schedule
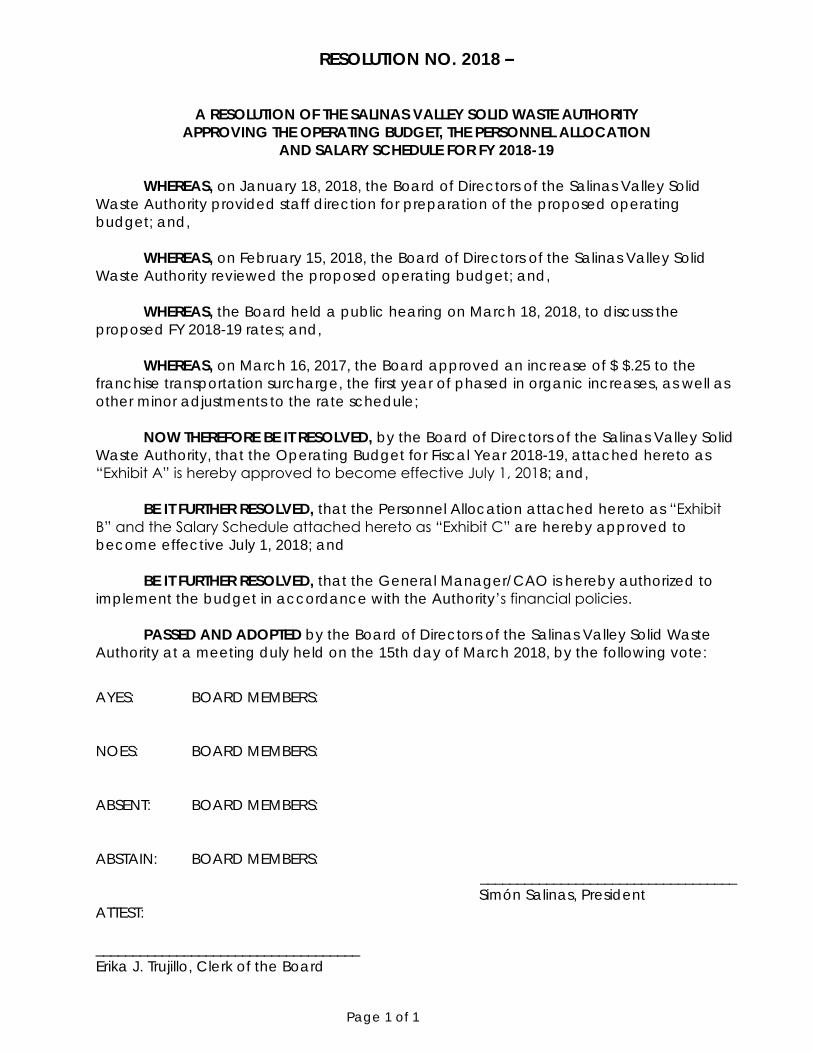
Page 1 of 1
RESOLUTION NO. 2018 –
A RESOLUTION OF THE SALINAS VALLEY SOLID WASTE AUTHORITY
APPROVING THE OPERATING BUDGET, THE PERSONNEL ALLOCATION
AND SALARY SCHEDULE FOR FY 2018-19
WHEREAS, on January 18, 2018, the Board of Directors of the Salinas Valley Solid
Waste Authority provided staff direction for preparation of the proposed operating
budget; and,
WHEREAS, on February 15, 2018, the Board of Directors of the Salinas Valley Solid
Waste Authority reviewed the proposed operating budget; and,
WHEREAS, the Board held a public hearing on March 18, 2018, to discuss the
proposed FY 2018-19 rates; and,
WHEREAS, on March 16, 2017, the Board approved an increase of $ $.25 to the
franchise transportation surcharge, the first year of phased in organic increases, as well as
other minor adjustments to the rate schedule;
NOW THEREFORE BE IT RESOLVED, by the Board of Directors of the Salinas Valley Solid
Waste Authority, that the Operating Budget for Fiscal Year 2018-19, attached hereto as
“Exhibit A” is hereby approved to become effective July 1, 2018; and,
BE IT FURTHER RESOLVED, that the Personnel Allocation attached hereto as “Exhibit
B” and the Salary Schedule attached hereto as “Exhibit C” are hereby approved to
become effective July 1, 2018; and
BE IT FURTHER RESOLVED, that the General Manager/CAO is hereby authorized to
implement the budget in accordance with the Authority’s financial policies.
PASSED AND ADOPTED by the Board of Directors of the Salinas Valley Solid Waste
Authority at a meeting duly held on the 15th day of March 2018, by the following vote:
AYES: BOARD MEMBERS:
NOES: BOARD MEMBERS:
ABSENT: BOARD MEMBERS:
ABSTAIN: BOARD MEMBERS:
___________________________________
Simón Salinas, President
ATTEST:
____________________________________
Erika J. Trujillo, Clerk of the Board

6DOLQDV�9DOOH\�6ROLG�:DVWH�$XWKRULW\ 3URSRVHG�$QQXDO�%XGJHW )LVFDO�<HDU�����-�� �����������
tŽƌŬŝŶŐ�dŽǁĂƌĚƐ�Ă�&ƵƚƵƌĞ�tŝƚŚŽƵƚ�>ĂŶĚĮůůƐ

This page intentionally left blank

SALINAS VALLEY SOLID WASTE AUTHORITY
Budget Document Fiscal Year
2018-19
Prepared by:
The Authority’s Finance Division
C. Ray Hendricks Finance & Administration
Manager / Treasurer / Controller
128 Sun St., Suite 101 Salinas, CA 93901
This page intentionally left blank
SALINAS VALLEY SOLID WASTE AUTHORITY Budget
FY 2018-19 Table of Contents
Page
BUDGET MESSAGE ................................................................................................... 01
LIST OF PRINCIPAL OFFICIALS ................................................................................ 21
SALINAS VALLEY SOLID WASTE AUTHORITY SERVICE AREA ............................ 23
ORGANIZATION CHART ............................................................................................. 25
BUDGET SUMMARIES
TWO-YEAR BUDGET COMPARISON ................................................................................. 27
BUDGET BY CATEGORY ................................................................................................. 29
BUDGET BY PROGRAM .................................................................................................. 31
FULL COST OF SERVICES BY PROGRAM .......................................................................... 33
FULL COST OF SERVICES BY MAJOR CATEGORIES ........................................................... 35
BUDGET BY CATEGORY WITH LINE ITEM DETAIL ............................................................... 37
OPERATING BUDGET WORKSHEETS
EXECUTIVE ADMINISTRATION (1110) .............................................................................. 41
ADMINISTRATIVE SUPPORT (1120) ................................................................................. 41
HUMAN RESOURCES ADMINISTRATION (1130) ................................................................ 42
CLERK OF THE BOARD (1140)........................................................................................ 43
FINANCE ADMINISTRATION (1200) .................................................................................. 44
OPERATIONS ADMINISTRATION (1300) ........................................................................... 45
RESOURCE RECOVERY (2100) ...................................................................................... 47
MARKETING (2150) ....................................................................................................... 48
PUBLIC EDUCATION (2200) ........................................................................................... 48
HOUSEHOLD HAZARDOUS WASTE (2300) ....................................................................... 48
C&D DIVERSION (2400) ................................................................................................ 51
ORGANICS DIVERSION (2500) ....................................................................................... 51
DIVERSION SERVICES (2600) ........................................................................................ 51
SCALEHOUSE OPERATIONS (3100) ................................................................................ 51
JOLON ROAD TRANSFER STATION (3600) ....................................................................... 55
JOLON ROAD RECYCLING OPERATIONS (3630) ............................................................... 49
MADISON LANE TRANSFER STATION (3650) .................................................................... 56
SALINAS VALLEY SOLID WASTE AUTHORITY Budget
FY 2018-19 Table of Contents
Page
SUN STREET DISPOSAL OPERATIONS (3710) .................................................................. 56
SUN STREET TRANSFER OPERATIONS (3720) ................................................................. 49
SUN STREET RECYCLING OPERATIONS (3730) ............................................................... 52
JOHNSON CANYON LANDFILL OPERATIONS (4500) .......................................................... 53
JOHNSON CANYON RECYCLING OPERATIONS (4530) ....................................................... 50
CRAZY HORSE POSTCLOSURE (5300) ............................................................................ 51
LEWIS ROAD POSTCLOSURE (5400) ............................................................................... 52
JOHNSON CANYON LANDFILL ENVIRONMENTAL CONTROL SYSTEMS (5500) ...................... 54
JOLON ROAD POSTCLOSURE (5600) .............................................................................. 55
SUN STREET ENVIRONMENT CONTROL SYSTEMS (5700) ................................................. 58
DEBT SERVICE – INTEREST (6100)................................................................................. 59
DEBT SERVICE – PRINCIPAL (6200) ............................................................................... 59
CLOSURE SET-ASIDE (6605) ......................................................................................... 59
APPENDICES
A. RESOLUTION 2014-11 FINANCIAL POLICIES 04/17/14.............................................. 65
B. RESOLUTION 2018-XX APPROVING FEES AND RATES EFFECTIVE 07/1/18 ................ 89
C. RESOLUTION 2018-XX APPROVING FY 2018-19 BUDGET & PERSONNEL ALLOCATION
EFFECTIVE 07/01/18 ............................................................................................. 95
D. PROPOSED SALARY SCHEDULE EFFECTIVE 07/01/18 .............................................. 99
E. DEBT SERVICE SCHEDULE - REVENUE BONDS, SERIES 2014A ............................... 109
F. DEBT SERVICE SCHEDULE - REVENUE BONDS, SERIES 2014B ............................... 111
G. EQUIPMENT LEASE PURCHASE AGREEMENT PAYMENT SCHEDULE .......................... 113
H. LANDFILL TONNAGE HISTORY ............................................................................... 115
I. PROJECTED LANDFILLED TONNAGE ...................................................................... 117
J. BOND DEBT COVERAGE RATIO............................................................................. 119

March 15, 2018 Salinas Valley Recycles (SVR) Board Members: We are pleased to present the Operating Budget for Fiscal Year 2018-19. The $18,860,000 operating budget represents a 9.6% increase over the FY 2017-18 budget. The budget is financed by $19,720,275 in operating revenues, which would generate an operating surplus of $860,275. The proposed use of this surplus is $800,000 in Capital Improvement Projects (CIPs) of which, $120,000 is a repayment to the Capital Improvement Reserves used to purchase new equipment for Jolon Road Transfer Station operations in FY 2016-17. The remaining $60,275 will be allocated to reserves designated in the Board approved Financial Policies. The combined Operating Budget and Capital allocation represents an estimated $74.70 per capita annual expenditure for SVR’s delivery of community services to our member agencies (service pop. ~264,000). The Capital Improvement Projects requires budget allocations of $800,000 that will be funded from the $860,275 in operating budget surplus mentioned above. The $68.50/ton tipping fee will not increase this year and is used to fund operations, as well as liabilities from our closed landfills. The following chart shows how the tipping fee is being spent after the Capital Improvement Projects and Debt Service payments have been allocated to the appropriate category.
Page 1 of 122

Achieving a Balanced Budget To achieve a balanced budget, this document incorporates the following items: No increase to the solid waste tipping fee Projected 7,500-ton increase of landfilled tonnage (4.2%) Increase in organics program tipping fees that will be phased in over 3 years A $.25/ton increase to the transportation surcharge (2.9%) Beginning on the following page is a summary of the proposed budget followed by a discussion of how it was developed.
Page 2 of 122

2017-18 Budget
Proposed 2018-19 Budget
Increase/ (Decrease) % Change
Revenues51.1 - Tipping Fees - Solid Waste 12,158,750 12,672,500 513,750 4.2%51.2 - Tipping Fees - Surcharge 1,803,000 1,849,550 46,550 2.6%51.3 - Tipping Fees - Diverted Materials 1,942,800 2,029,525 86,725 4.5%51.4 - AB939 Service Fee 2,319,700 2,319,700 - 0.0%52.1 - Charges for Services 124,500 144,000 19,500 15.7%53.1 - Sales of Materials 244,000 265,000 21,000 8.6%53.2 - Gas Royalties 220,000 240,000 20,000 9.1%54.1 - Investment Earnings 162,000 200,000 38,000 23.5%
Total Revenues 18,974,750 19,720,275 745,525 3.9%
Expenditures1110 - Executive Administration 443,150 453,500 10,350 2.3%1120 - Administrative Support 503,550 519,200 15,650 3.1%1130 - Human Resources Administration 194,050 201,000 6,950 3.6%1140 - Clerk of the Board 168,600 175,300 6,700 4.0%1200 - Finance Administration 754,050 686,000 (68,050) -9.0%1300 - Operations Administration 454,100 466,400 12,300 2.7%2100 - Resource Recovery 907,050 927,500 20,450 2.3%2150 - Marketing 75,000 75,000 - 0.0%2200 - Public Education 224,150 228,500 4,350 1.9%2300 - Household Hazardous Waste 775,200 797,700 22,500 2.9%2400 - C & D Diversion 170,000 150,000 (20,000) -11.8%2500 - Organics Diversion 833,200 1,037,900 204,700 24.6%2600 - Diversion Services 18,000 20,000 2,000 11.1%3100 - Scalehouse Operations 554,450 564,000 9,550 1.7%3600 - JR Transfer Station 353,950 367,100 13,150 3.7%3630 - JR Recycling Operations 158,900 173,000 14,100 8.9%3650 - ML Transfer Station 500,000 500,000 - 0.0%3710 - SS Disposal Operations 768,400 858,900 90,500 11.8%3720 - SS Transfer Operations 1,183,050 1,215,400 32,350 2.7%3730 - SS Recycling Operations 700,150 757,000 56,850 8.1%4500 - JC Landfill Operations 2,465,850 2,519,900 54,050 2.2%4530 - JC Recycling Operations 360,400 392,000 31,600 8.8%5300 - Crazy Horse Postclosure Maintenance 609,800 547,300 (62,500) -10.2%5400 - Lewis Road Postclosure Maintenance 226,500 250,300 23,800 10.5%5500 - Johnson Canyon ECS 312,600 333,400 20,800 6.7%5600 - Jolon Road Postclosure Maintenance 215,050 238,000 22,950 10.7%5700 - Sun Street ECS 186,500 203,600 17,100 9.2%6100 - Debt Service - Interest 1,619,100 1,550,600 (68,500) -4.2%6200 - Debt Service - Principal 1,229,900 2,383,200 1,153,300 93.8%6605 - Closure Set-Aside 248,500 268,300 19,800 8.0%
Total Expenditures 17,213,200 18,860,000 1,646,800 9.6%
Operating Budget Surplus 1,761,550 860,275 Less New CIP Allocation (1,144,000) (680,000) Repayment of Expansion Fund (376,000) Jolon Road Equipment Repayment (120,000) (120,000)
Balance Used to Fund Reserves 121,550 60,275
Page 3 of 122

FY 2017-18 BUDGET AT A GLANCE Operating Revenues Operating revenues are proposed to increase by $745,525, a 3.9% increase. The major reasons for the increase are as follows: $ 513,750 7,500-ton increase in solid waste tonnage projection. $ 165,025 Expanded Organics Program Phased Increase to tipping fees $ 46,550 Increase in franchise transportation revenue due to $.25/ton increase $ 20,200 Miscellaneous Revenue Adjustments $ 745,525 Net increase in revenues Increasing the projected tonnage by 7,500 tons This would increase the budgeted revenue by $513,750. The Authority has sustained several years of increasing tonnage since 2013. Staff remains cognizant of the effects a future recession could have on the Authority’s tonnage, however the sustained increases in tonnage over the last several years provides a comfort level that a conservative tonnage projection of 185,000 is reasonable. Increases in tonnage will increase some tonnage related fees and closure funding expense, but amounts are minimal and are incorporated in the budget. Increase tipping fees for Expanded Organics Program This would increase our budgeted revenue by $165,025. On September 21, 2017, the Board approved the expanded organics program to meet new State mandates for organics diversion from landfills which will include the addition of food and recovered agricultural waste composting. A phased-in rate increase over a three-year period was recommended to buffer the impact to rate payers. This will also allow the Authority to run the operations for a couple of years and evaluate the program and long-term needs for new waste streams such as cannabis and agricultural cull wastes that may increase system processing demands. The Authority will need to work with Republic Services to phase out the discounted greenwaste contract signed in 2004 to allow for full and equitable funding of the program by all members, as envisioned under the Agency’s Joint Powers Agreement, Section 15, “Equalization of Rates”. Following is the schedule of rate increases approved in concept when the organics program was considered by the Board in September 2017.
Salinas Organics Franchise Organics Wood Waste
FY 2017-18 18.05 33.50 33.50 FY 2018-19 28.00 38.25 36.25 FY 2019-20 38.00 43.00 39.00 FY 2020-21 48.00 48.00 42.00
Page 4 of 122

Increase Franchise Transportation Surcharge by 1.4% ($0.25/ton) This would increase our budgeted revenue by $46,550. The transportation surcharge was last increased in FY 2017-18 to $17.50. During FY 2016-17 the Authority spent $17.79/ton to transport Salinas Franchise Waste. This increase will partially offset the increase in Madison Lane Transfer costs due to the ongoing increases in Salinas area waste. The increase will also support the Board’s goal of establishing rates that fully support program costs and do not rely on landfill tipping fee subsidy Operating Expenditures The proposed operating budget of $18,860,000 reflects an increase of $1,646,800 (9.6%) over the current appropriations. The budget includes three new positions; a Business Services Supervisor, which will replace the Accountant at the time of his retirement. Finance staff duties will be reallocated between the staff and the Accountant position will remain unfilled. Additionally, two new diversion workers will be hired starting approximately January 1, 2019 to support the expanded organics processing operations. The budget also includes the planned increase of $1,084,800 for debt service. SVR took the savings up front when it refinanced the Bonds in 2014 to fund deferred Capital Improvements form prior years. FY 2018-19 is the first year of full payments that will continue until 2032. Use of Operating Budget Surplus for Capital Improvements The $860,275 operating surplus is proposed to fund $680,000 in Capital Improvement Projects (CIPs), and a $120,000 repayment to the Capital Improvement Reserves used to purchase new equipment in FY 2016-17. The details of the projects are included on page 11.
Page 5 of 122

OPERATING EXPENDITURES BUDGET HIGHLIGHTS Following is a comparison of the operating budget expenditures by category.
CategoryTotal 2017-18
BudgetTotal 2018-19
BudgetIncrease/
(Decrease) % ChangeEmployee Services 6,581,350 6,806,900 225,550 3.4%Supplies 967,820 1,008,600 40,780 4.2%Contract Services 4,932,080 5,210,800 278,720 5.7%Other Expenses 1,593,050 1,595,200 2,150 0.1%Debt Service 2,849,000 3,933,800 1,084,800 38.1%Capital Outlay 41,400 36,400 (5,000) -12.1%Closure 248,500 268,300 19,800 8.0%Grand Total 17,213,200 18,860,000 1,646,800 9.6%
Page 6 of 122
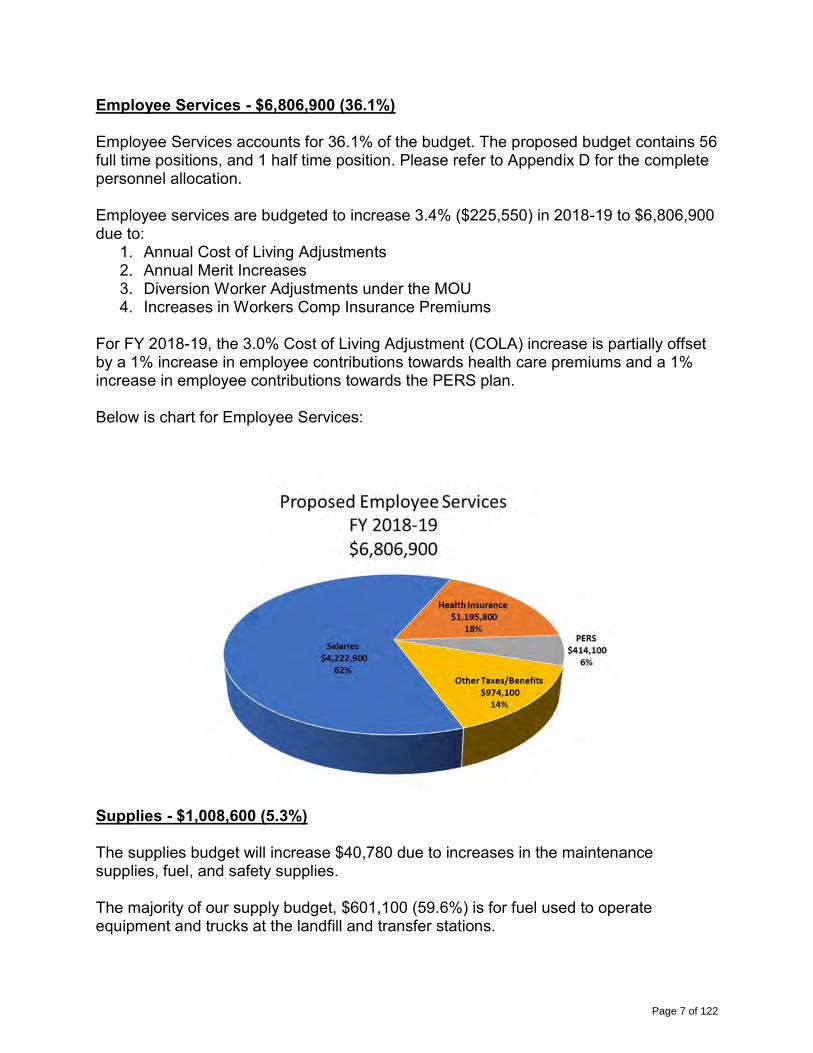
Employee Services - $6,806,900 (36.1%) Employee Services accounts for 36.1% of the budget. The proposed budget contains 56 full time positions, and 1 half time position. Please refer to Appendix D for the complete personnel allocation. Employee services are budgeted to increase 3.4% ($225,550) in 2018-19 to $6,806,900 due to:
1. Annual Cost of Living Adjustments 2. Annual Merit Increases 3. Diversion Worker Adjustments under the MOU 4. Increases in Workers Comp Insurance Premiums
For FY 2018-19, the 3.0% Cost of Living Adjustment (COLA) increase is partially offset by a 1% increase in employee contributions towards health care premiums and a 1% increase in employee contributions towards the PERS plan. Below is chart for Employee Services:
Supplies - $1,008,600 (5.3%) The supplies budget will increase $40,780 due to increases in the maintenance supplies, fuel, and safety supplies. The majority of our supply budget, $601,100 (59.6%) is for fuel used to operate equipment and trucks at the landfill and transfer stations.
Page 7 of 122

Contract Services (Business Partnerships) - $5,210,800 (27.6%) Contract Services pays for regulatory compliance and environmental monitoring, as well as processing and other services. Contract services are budgeted to increase $278,720 (5.7%) to $5,210,800. This is due to the updates to the organics program scheduled to begin around January 1, 2019 and recent increases in transfer costs by Waste Management at Madison Lane Transfer Station. Following is a summary of the major expenses in this category: Vision Recycling (organics contractor) will be compensated $1,037,900 for
processing organics and wood waste at Johnson Canyon Landfill. This is the single largest recycling program for SVR. This program keeps over 32,000 tons of organic material from the landfill.
Waste Management will be compensated $500,000 for handling and transporting Republic Services materials overflow delivered to the Madison Lane Transfer Station. Waste Management will handle an average 40 tons per day. This is financed using part of the $17.75 per ton surcharge on Salinas franchise materials for 2018-19.
The City of Gonzales will receive $250,000 in mitigation fees for hosting the landfill near its city limits.
Other Expenses - $1,595,200 (8.5%) This category covers other expenses not included in the above categories. Most of the expenses included in this category are regulatory or for mitigation related activities: California Integrated Waste Management Fees - $375,000. All landfills are
required to pay the State a regulatory fee based on tonnage landfilled.
Phillip Services will be compensated $160,000 for Household Hazardous Waste (HHW) hauling, recycling and disposal. This is one of the mandated services paid by AB939 fees.
Monterey County Environmental Health Bureau Regional Fees - $130,000. The Monterey County Environmental Health Bureau expects to receive $496,080 in total fees from SVR and Monterey Regional Waste Management District (MRWMD) based proportionally on tonnage landfilled at each site. Ending importation of waste to SVR landfills and increases in outside waste import to the MRWMD has shifted a larger share of this regulatory fee to the MRWMD.
Page 8 of 122

Monterey County Environmental Health Bureau, Local Enforcement Agency (LEA) - $79,700. The Monterey County Environmental Health Bureau LEA charges various permit fees for active and closed landfill permit activities. In total, SVR expects to pay $209,700 to Monterey County Environmental Health.
The State Water Resources Control Board will receive $104,000 in fees for providing regulatory oversight under California Code of Regulations Title 27.
Debt Service - $3,933,800 (20.9%) At $3,933,800, Debt Service is the third largest expense category at 20.9% of the budget. The refinancing of the 2002 Revenue Bonds and the Salinas Installment Purchase Agreement for the Crazy Horse Landfill in January 2014 resulted in a short-term decrease. Beginning in FY 2018-19, debt service will increase as scheduled to $3.1 million, the amount of debt service being paid prior to the refinancing. It will continue at $3.1 million until 2027-28 after which debt service will decrease to $2.8 million through FY 2031-32 when all bonded debt is paid in full. The debt service payments were structured so the savings from the refinancing would be taken upfront over the first few years instead of spreading out the savings annually over the life of the bond issue to provide funding to complete underfunded or deferred capital improvements at our four landfills. An Equipment Lease-Purchase loan was used to buy the initial start-up equipment for the operations at Johnson Canyon Landfill. After the Equipment Lease-Purchase loan is fully paid in FY 2019-20, a CIP budget will begin to be established to allow cash funding (Pay-As-You-Go) for future equipment replacement needs. Landfill operations require many pieces of heavy equipment. The equipment was purchased at a savings of $162,778 over original estimates. These remaining unexpended loan proceeds were re-applied to the principal resulting in a savings of $20,000 in interest over the life of the loan, and reducing the final payment in FY 2019-20 by $182,000. Following is a summary of SVR’s bond debt service requirements for the next five fiscal years:
2014A (AMT) 2014B (Taxable)
Fiscal Year Ended June 30, Principal Interest Principal Interest
Total Debt Service
Requirement 2019 1,265,000 1,436,250 345,000 89,728 3,135,978 2020 1,330,000 1,371,375 355,000 77,640 3,134,015 2021 1,400,000 1,303,125 370,000 63,574 3,136,699 2022 1,470,000 1,231,375 385,000 47,581 3,133,956 2023 1,545,000 1,156,000 405,000 29,730 3,135,730
Page 9 of 122
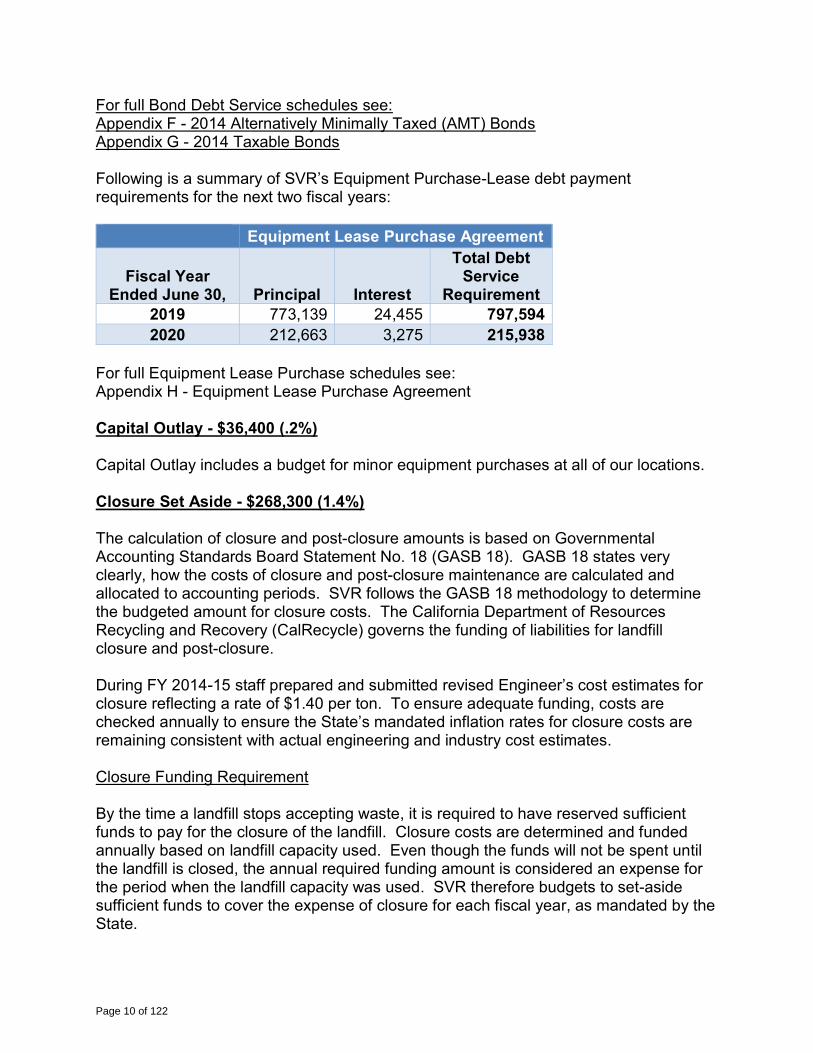
For full Bond Debt Service schedules see: Appendix F - 2014 Alternatively Minimally Taxed (AMT) Bonds Appendix G - 2014 Taxable Bonds Following is a summary of SVR’s Equipment Purchase-Lease debt payment requirements for the next two fiscal years: Equipment Lease Purchase Agreement
Fiscal Year Ended June 30, Principal Interest
Total Debt Service
Requirement 2019 773,139 24,455 797,594 2020 212,663 3,275 215,938
For full Equipment Lease Purchase schedules see: Appendix H - Equipment Lease Purchase Agreement Capital Outlay - $36,400 (.2%) Capital Outlay includes a budget for minor equipment purchases at all of our locations. Closure Set Aside - $268,300 (1.4%) The calculation of closure and post-closure amounts is based on Governmental Accounting Standards Board Statement No. 18 (GASB 18). GASB 18 states very clearly, how the costs of closure and post-closure maintenance are calculated and allocated to accounting periods. SVR follows the GASB 18 methodology to determine the budgeted amount for closure costs. The California Department of Resources Recycling and Recovery (CalRecycle) governs the funding of liabilities for landfill closure and post-closure. During FY 2014-15 staff prepared and submitted revised Engineer’s cost estimates for closure reflecting a rate of $1.40 per ton. To ensure adequate funding, costs are checked annually to ensure the State’s mandated inflation rates for closure costs are remaining consistent with actual engineering and industry cost estimates. Closure Funding Requirement By the time a landfill stops accepting waste, it is required to have reserved sufficient funds to pay for the closure of the landfill. Closure costs are determined and funded annually based on landfill capacity used. Even though the funds will not be spent until the landfill is closed, the annual required funding amount is considered an expense for the period when the landfill capacity was used. SVR therefore budgets to set-aside sufficient funds to cover the expense of closure for each fiscal year, as mandated by the State.
Page 10 of 122
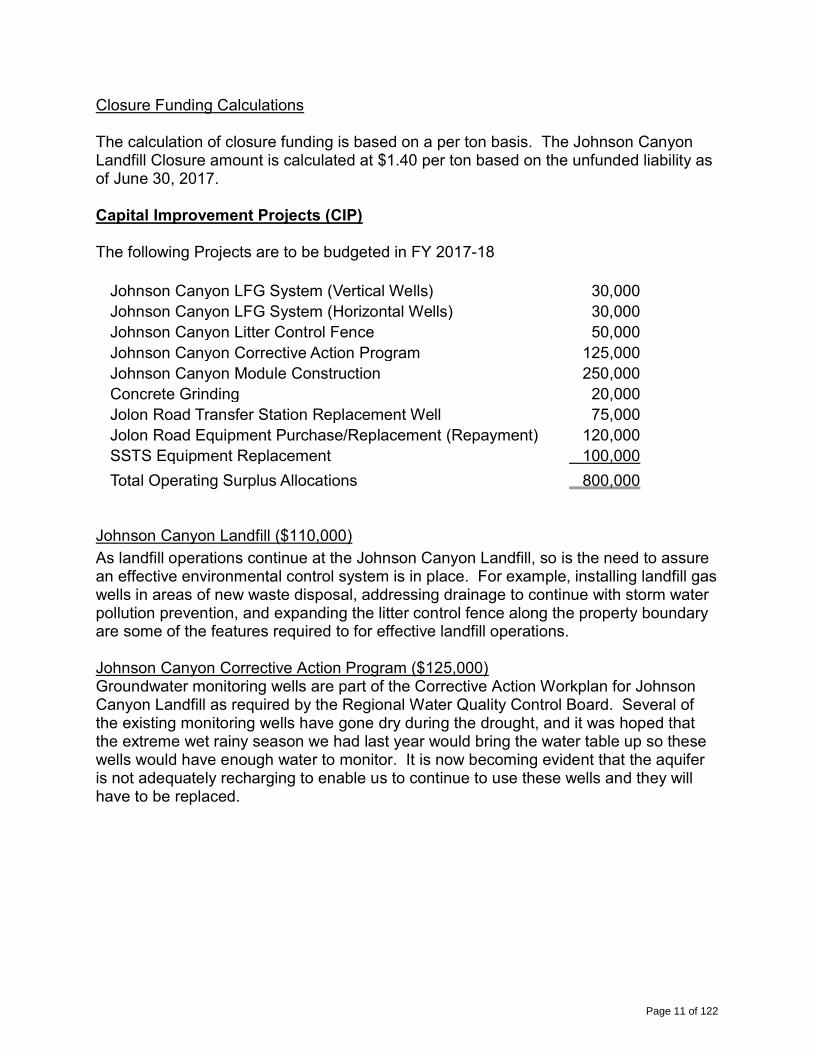
Closure Funding Calculations The calculation of closure funding is based on a per ton basis. The Johnson Canyon Landfill Closure amount is calculated at $1.40 per ton based on the unfunded liability as of June 30, 2017. Capital Improvement Projects (CIP) The following Projects are to be budgeted in FY 2017-18
Johnson Canyon LFG System (Vertical Wells) 30,000 Johnson Canyon LFG System (Horizontal Wells) 30,000 Johnson Canyon Litter Control Fence 50,000 Johnson Canyon Corrective Action Program 125,000 Johnson Canyon Module Construction 250,000 Concrete Grinding 20,000 Jolon Road Transfer Station Replacement Well 75,000 Jolon Road Equipment Purchase/Replacement (Repayment) 120,000 SSTS Equipment Replacement 100,000
Total Operating Surplus Allocations 800,000
Johnson Canyon Landfill ($110,000)
As landfill operations continue at the Johnson Canyon Landfill, so is the need to assure an effective environmental control system is in place. For example, installing landfill gas wells in areas of new waste disposal, addressing drainage to continue with storm water pollution prevention, and expanding the litter control fence along the property boundary are some of the features required to for effective landfill operations. Johnson Canyon Corrective Action Program ($125,000) Groundwater monitoring wells are part of the Corrective Action Workplan for Johnson Canyon Landfill as required by the Regional Water Quality Control Board. Several of the existing monitoring wells have gone dry during the drought, and it was hoped that the extreme wet rainy season we had last year would bring the water table up so these wells would have enough water to monitor. It is now becoming evident that the aquifer is not adequately recharging to enable us to continue to use these wells and they will have to be replaced.
Page 11 of 122

JC Module 7 Engineering and Construction ($250,000) As the agency works towards deciding its long-range facility needs, it is time to begin planning for the next cell at Johnson Canyon. Initial Engineer estimates have the new cell being built in FY 2020-21 at a cost of $4-6 million. Staff is in the process of working with consultants to determine what options are available for the construction schedule as well as revisiting the original estimates. It is critical that we continually fund this project to ensure that there is adequate funding available when the construction of a new cell is necessary (Pay-As-You-Go). With this capital allocation, current funding for the next landfill cell will be at $3.75 million. Jolon Road Transfer Station ($195,000) Staff took-over of the Jolon Road Transfer Station in September 2016. Rather than take out a private loan, the Board approved borrowing $398,500 from CIP reserve funds with the remaining $201,500 coming from operating surpluses in 2016-17. Repayment of these funds are budgeted at $120,000 per year. Once these funds are repaid, the funds will be allocated to a Capital Equipment Replacement CIP in order to have cash available when the equipment purchased in FY 2016-17 requires replacement. In addition, the existing water supply well at the Jolon Road Transfer Station produces a low flow rate of water that is non-potable due to the shallow nature of the well. As concluded by the water supply study performed by staff last year, this well needs to be replaced to supply adequate water for use as site dust control, domestic use, and to have capacity in the event of a fire event. Sun Street Transfer Station Equipment Replacement ($100,000)
The Board approved the Sun Street Equipment replacement plan on August 22, 2013. In order to meet CIP requirements, some of the equipment replacement has been delayed. To replace necessary equipment, money is set aside every year.
Page 12 of 122

SOLID WASTE ORIGIN The chart below shows the origin of the solid waste landfilled from the SVR service area for FY 2016-17. The origin of waste has historically been about the same.
LANDFILL CAPACITY SVR is operating the Johnson Canyon Landfill located outside of Gonzales. Our remaining capacity at June 30, 2017 is estimated 7.92 million tons. Thanks to ending waste importation and improved recycling and operational efforts, the remaining capacity is approximately 40 years at last year’s fill rate. Johnson Canyon Landfill Rate of Fill In FY 2016-17, 199,457 tons of solid waste were buried at Johnson Canyon Landfill. Based on current year to date information for FY 2017-18, over 190,000 tons are conservatively expected to be received for landfilling, all from the SVR service area. The budget for FY 2018-19 requires 185,000 tons of solid waste. The life of the landfill could be further extended if mandatory recycling and new diversion programs are implemented to reduce landfill tonnage. If advanced waste processing and/or conversion technology is implemented in the near future, it would have a more dramatic impact on buried tonnage, further extending the landfill capacity and life, and reducing the annual closure fund contribution by spreading these mandatory payments over a longer accrual period.
Page 13 of 122

Johnson Canyon Landfill Capital Improvements In order to fully utilize the permitted capacity, Johnson Canyon Landfill will require capital improvements totaling $17,500,000 over the next 30+ years. At this time, SVR cannot anticipate all the improvements, as changes in technology and State/Federal mandates are expected to influence the amount of waste that must to be landfilled. MRWMD has also expressed interest in accepting SVR waste or waste recovery residues under contract for disposal in its Monterey Peninsula Landfill, which has an excess of 100 years of capacity. The SVR long-range facilities studies to this effect are currently underway. REVENUES AND TONNAGE Landfilled Tonnage The following chart shows that as of June 30, 2017, solid waste tonnage landfilled has stabilized and showing a modest projected increase. After a fluctuation of less than 500 tons between 2012 and 2014, the Authority has saw its first substantial tonnage increase in more than ten years in 2015. Tonnage increased again in 2016, and the storms in 2017 caused a substantial increase. Tonnage is expected to decrease in 2018, but remain above 2016 tonnage.
Page 14 of 122
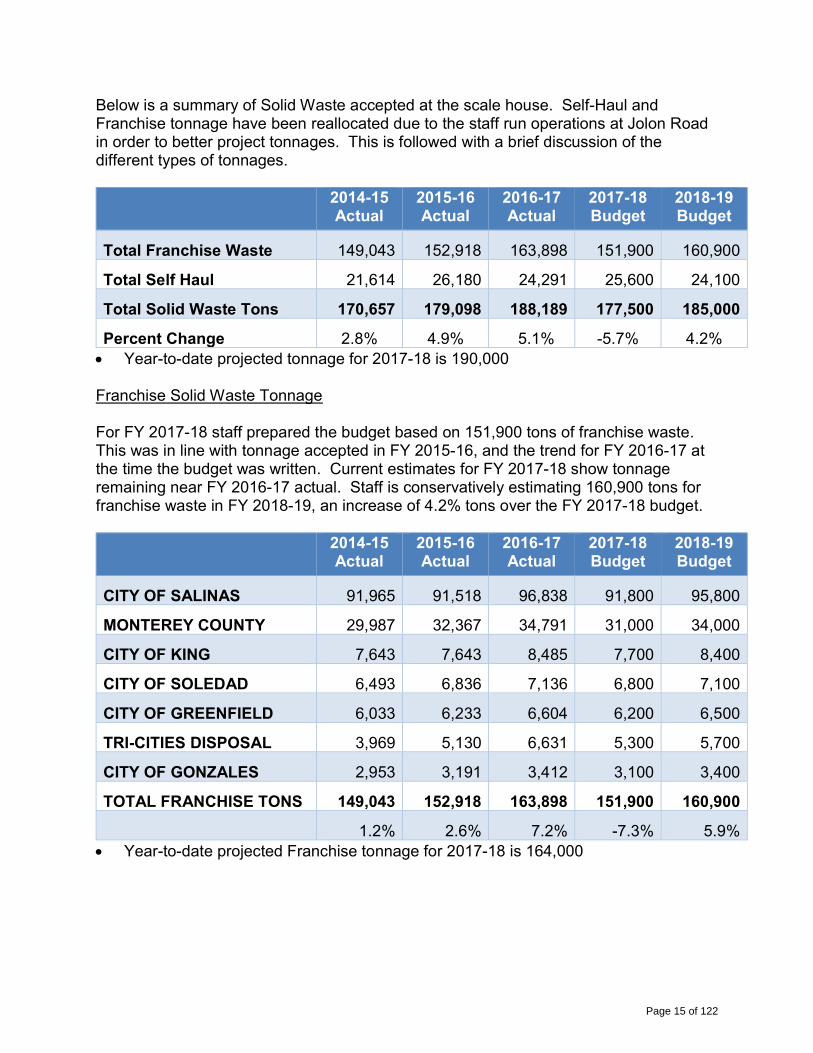
Below is a summary of Solid Waste accepted at the scale house. Self-Haul and Franchise tonnage have been reallocated due to the staff run operations at Jolon Road in order to better project tonnages. This is followed with a brief discussion of the different types of tonnages.
2014-15 Actual
2015-16 Actual
2016-17 Actual
2017-18 Budget
2018-19 Budget
Total Franchise Waste 149,043 152,918 163,898 151,900 160,900
Total Self Haul 21,614 26,180 24,291 25,600 24,100
Total Solid Waste Tons 170,657 179,098 188,189 177,500 185,000
Percent Change 2.8% 4.9% 5.1% -5.7% 4.2% Year-to-date projected tonnage for 2017-18 is 190,000
Franchise Solid Waste Tonnage For FY 2017-18 staff prepared the budget based on 151,900 tons of franchise waste. This was in line with tonnage accepted in FY 2015-16, and the trend for FY 2016-17 at the time the budget was written. Current estimates for FY 2017-18 show tonnage remaining near FY 2016-17 actual. Staff is conservatively estimating 160,900 tons for franchise waste in FY 2018-19, an increase of 4.2% tons over the FY 2017-18 budget.
2014-15 Actual
2015-16 Actual
2016-17 Actual
2017-18 Budget
2018-19 Budget
CITY OF SALINAS 91,965 91,518 96,838 91,800 95,800
MONTEREY COUNTY 29,987 32,367 34,791 31,000 34,000
CITY OF KING 7,643 7,643 8,485 7,700 8,400
CITY OF SOLEDAD 6,493 6,836 7,136 6,800 7,100
CITY OF GREENFIELD 6,033 6,233 6,604 6,200 6,500
TRI-CITIES DISPOSAL 3,969 5,130 6,631 5,300 5,700
CITY OF GONZALES 2,953 3,191 3,412 3,100 3,400
TOTAL FRANCHISE TONS 149,043 152,918 163,898 151,900 160,900
1.2% 2.6% 7.2% -7.3% 5.9% Year-to-date projected Franchise tonnage for 2017-18 is 164,000
Page 15 of 122

Self-Haul Solid Waste Tonnage The second largest source of income for SVR is self-haul solid waste. These customers bring their own solid waste to SVR facilities. These customers can go wherever they choose. Staff is conservatively estimating 25,600 tons for self-haul waste in FY 2017-18, an increase of 4.4% tons over the FY 2016-17 budget.
2014-15 Actual
2015-16 Actual
2016-17 Actual
2017-18 Budget
2018-19 Budget
Self-Haul 21,614 25,810 24,291 25,600 24,100
15.3% 19.4% -5.9% 5.4% -5.9% Year-to-date projected self-haul tonnage for 2017-18 is 26,000 Transportation Surcharge The Transportation Surcharge is used to partially offset the costs for the handling and transporting of franchise waste to Johnson Canyon Landfill from Authority operated transfer stations as well as Salinas overflow tonnage directed to Madison Lane Transfer Station. The surcharge was originally $6.00 per ton in FY 2009-10. It decreased to $5.00 per ton in FY 2010-11 to offset a $1.00 per ton tipping fee increase. Beginning in FY 2012-13, the surcharge has been increased by $3.00 per ton every year with the goal of eventually fully funding this franchise specific service benefit and reducing required subsidy from other revenue sources. In FY 2016-17 SVR spent an average of $17.79 per ton to transport Salinas Franchise Waste. For FY 2018-19 the surcharge is being increased by $.25 to $17.75 per ton. The surcharge will result in $1,849,550 in direct service related fees that will be used to cover the cost of using Madison Lane Transfer Station for overflow waste, and transferring franchise waste from Sun Street and Jolon Road Transfer Stations to the Johnson Canyon Landfill. EXPANSION FUND – (RECOLOGY SOUTH VALLEY TONNAGE) The Expansion Fund was used to account for revenue from the sale of landfill capacity to Recology South Santa Clara Valley Disposal (Recology South Valley). All revenues from this contract ceased on December 31, 2014. SVR has chosen to end the importation of solid waste to finance operations and extend the life of the last remaining operational landfill. By taking this critical step towards more sustainable funding of services, SVR is closer to achieving its Vision of “A Future Without Landfills.” At June 30, 2018, the Expansion Fund is projected to have an available fund balance of $7,592,721 after remaining appropriations for Capital Improvement Projects. The only revenue expected to be received in the Expansion Fund is accrued interest on the remaining balance.
Page 16 of 122

The Expansion Fund, per current Board policy, is to be used for developing 50 years of sustainable landfill capacity, including future infrastructure investments that reduce landfill dependence and extends the current life of Johnson Canyon Landfill. REVENUE BOND RATE COVENANT Pursuant to the Master Indenture for the 2014 Refunding Revenue Bonds, SVR agreed “to fix, prescribe and collect rates, fees and charges and manage the operation of the System for each fiscal year so as to yield Net Revenues during such fiscal year equal to at least one hundred fifteen percent (115%) of the Annual Debt Service in such fiscal year.” After paying for operations, SVR must have available 115% of the amount of debt service. This ensures the bondholders that there is a 15% cushion to make debt service payments in the event changes are necessary during the year, which would affect revenues or expenditures. For FY 2018-19, the debt service coverage ratio is 127%. For the Debt Service Coverage Ratio Calculations refer to Appendix J. LIABILITIES One of the primary reasons that the Authority was formed was to manage the long-term landfill liabilities of its member agencies. As of June 30, 2017, the Authority holds $86 million in long-term liabilities related to its landfills, both opened and closed on behalf of all its member agencies. The chart below shows how these liabilities would be broken down based on FY 2015-17 franchise waste buried at the Johnson Canyon Landfill.
PROJECTIONS In order to make financial decisions, it is important to see what expenses for operations and Capital Improvement Projects needs are for the next few years. In order to project SVR rates, staff used the following assumption:
• Tonnage remains flat at 185,000 tons • Implementation of new organics program on January 1, 2019 with phased in
rate adjustments through FY 2020/2021. • No other changes to services • CPI increases of 2% to the Operating Budget for the next 5 years.
FYE 2015-17 Franchise
Tons Landfilled
Percent of Landfilled
Closure Payable*
Post Closure Payable
Debt Service Principal
Debt Service Interest
Corrective Action
Total Liabilities
City of Salinas 280,306 62.3% 6,905,335 9,593,324 20,032,772 8,630,114 8,428,597 53,590,141 County of Monterey 97,312 21.6% 2,397,280 3,330,451 6,954,646 2,996,060 2,926,101 18,604,539 City of King 23,567 5.2% 580,573 806,568 1,684,275 725,585 708,643 4,505,643 City of Soledad 20,465 4.5% 504,155 700,404 1,462,583 630,080 615,368 3,912,589 City of Greenfield 18,867 4.2% 464,788 645,713 1,348,378 580,881 567,317 3,607,077
City of Gonzales 9,557 2.1% 235,437 327,083 683,015 294,243 287,372 1,827,150
450,074 11,087,567 15,403,543 32,165,668 13,856,963 13,533,397 86,047,138
* Total Unfunded Estimated Cost for Closing Johnson Canyon Landfill @ 06-30-2017
Page 17 of 122

Debt service coverage of 115% is required to meet our bond covenants. As shown below, our debt service coverage is expected to be near 127% in FY 2018-19. The debt service will slowly increase as we finish paying off the Capital Lease and remain near 150%.
Capital Improvements are constantly needed at landfills and transfer stations. Both monitoring and disposal equipment must be constantly upgraded and/or replaced. A capital lease loan was taken out in order to purchase equipment needed to operate Johnson Canyon Landfill. The final payment is scheduled to occur in FY 2019-20. In FY 2016-17 the Board directed staff to borrow funds from capital reserves to fund initial equipment purchases needed to operate the transfer station at Jolon Road. Repayment of these funds are budgeted at $120,000 per year. Once both of these loans are repaid, the funds will be allocated to a Capital Equipment Replacement CIP in order to have cash available when the equipment purchased requires replacement(Pay-As-You-Go).
Page 18 of 122
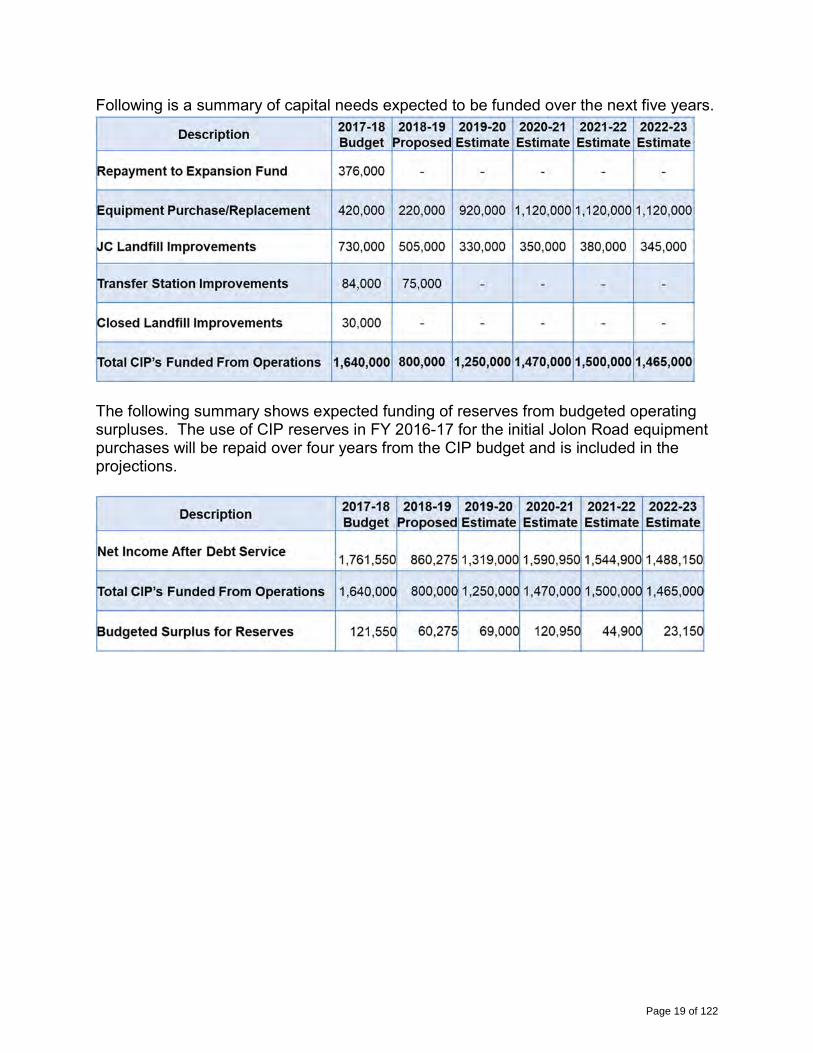
Following is a summary of capital needs expected to be funded over the next five years.
The following summary shows expected funding of reserves from budgeted operating surpluses. The use of CIP reserves in FY 2016-17 for the initial Jolon Road equipment purchases will be repaid over four years from the CIP budget and is included in the projections.
Page 19 of 122

CONCLUSION The budget as presented funds all required operating expenditures, debt service payments, and transfers, leaving an operating budget net income of $860,275, which will fund necessary capital improvements and fund Board designated reserves. The Board’s approval of refinancing the 2002 Revenue Bonds and the Crazy Horse Installment Purchase Agreement has allowed SVR to fund much needed Capital Improvement Projects. This has provided the continued funding of some much-needed and previously deferred Capital Improvements, and put us in a position to forecast an operating surplus during FY 2018-19, as we continue to work on ways to handle the solid waste disposal needs of the Salinas Valley in a “Future without Landfills”. Respectfully submitted,
R. Patrick Mathews C. Ray Hendricks General Manager/CAO Finance and Administration
Manager/Treasurer/CFO
Page 20 of 122
List of Principal Officials
Simon Salinas, County of Monterey President
Robert Cullen, City of King Vice President
Gloria De La Rosa, City of Salinas Alternate Vice President
Tony R. Barrera, City of Salinas
Board Member
Christopher K. Bourke, City of Soledad Board Member
Kimbley Craig, City of Salinas Board Member
John M. Phillips, County of Monterey Board Member
Liz Silva, City of Gonzales
Board Member Avelina Torres, City of Greenfield
Board Member
Thomas M. Bruen General Counsel
R. Patrick Mathews General Manager /
Chief Administrative Officer
Cesar Zuniga Assistant General Manager /
Operations Manager
Mandy Brooks Resource Recovery Manager
C. Ray Hendricks Finance & Administration
Manager / Treasurer / Controller
Brian Kennedy Engineering & Environmental
Compliance Manager
Page 21 of 122

This page intentionally left blank
Page 22 of 122

Crazy Horse Landfill (CLOSED)
Lewis Road Landfill (CLOSED)
Jolon Road Landfill (CLOSED)
Jolon Road Transfer Sta on
Sun Street Transfer Sta on &
Household Hazardous Waste Collec on Facility
Johnson Canyon Landfill
Service Area
Page 23 of 122

This page intentionally left blank
Page 24 of 122
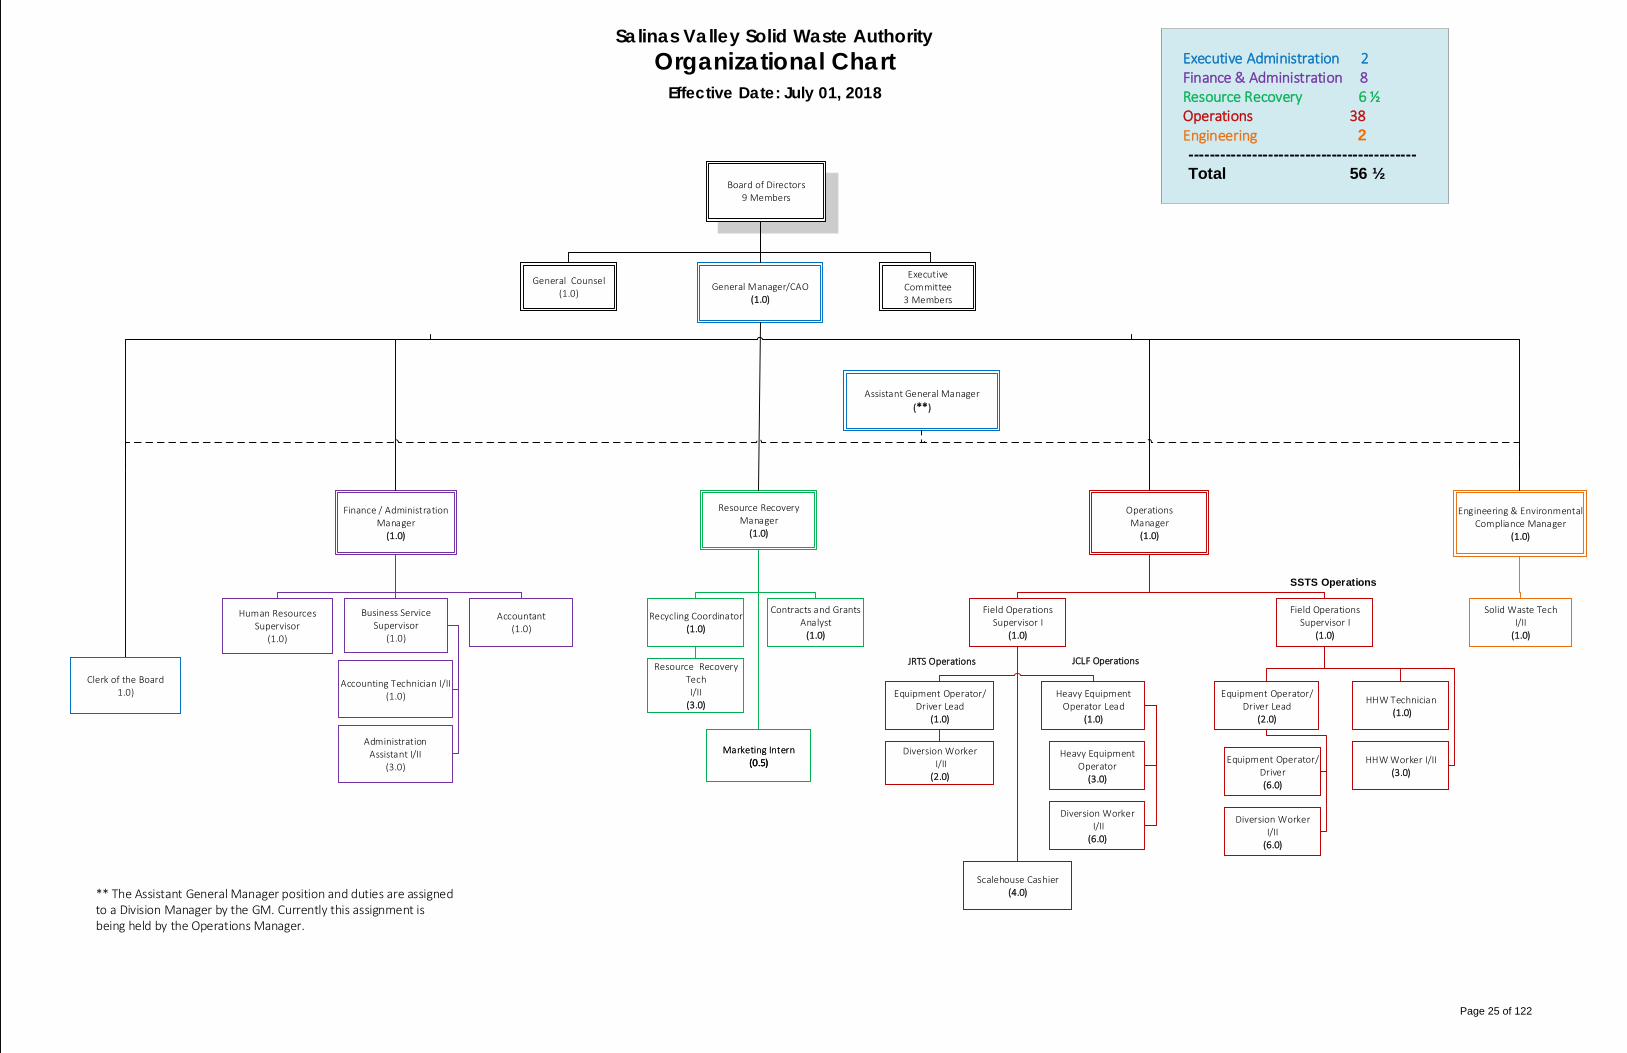
Board of Directors9 Members
Board of Directors9 Members
General Manager/CAO(1.0)
General Manager/CAO(1.0)
Executive Committee3 Members
Executive Committee3 Members
General Counsel(1.0)
General Counsel(1.0)
Assistant General Manager
(**)
Assistant General Manager
(**)
Contracts and Grants Analyst
(1.0)
Contracts and Grants Analyst
(1.0)
HHW Technician (1.0)
HHW Technician (1.0)
Recycling Coordinator(1.0)
Recycling Coordinator(1.0)
Resource Recovery Tech I/II
(3.0)
Resource Recovery Tech I/II
(3.0)
HHW Worker I/II(3.0)
HHW Worker I/II(3.0)
Engineering & Environmental Compliance Manager
(1.0)
Engineering & Environmental Compliance Manager
(1.0)
Operations Manager
(1.0)
Operations Manager
(1.0)
Heavy Equipment Operator Lead
(1.0)
Heavy Equipment Operator Lead
(1.0)
Heavy Equipment Operator
(3.0)
Heavy Equipment Operator
(3.0)
Executive Administration 2 Finance & Administration 8 Resource Recovery 6 ½ Operations 38 Engineering 2 -------------------------------------------
Total 56 ½
Scalehouse Cashier(4.0)
Scalehouse Cashier(4.0)
Diversion Worker I/II
(6.0)
Diversion Worker I/II
(6.0)
Salinas Valley Solid Waste Authority
Organizational Chart
Effective Date: July 01, 2018
Solid Waste TechI/II
(1.0)
Solid Waste TechI/II
(1.0)
Field Operations Supervisor I
(1.0)
Field Operations Supervisor I
(1.0)
Field Operations Supervisor I
(1.0)
Field Operations Supervisor I
(1.0)
JCLF Operations
SSTS Operations
Equipment Operator/Driver Lead
(2.0)
Equipment Operator/Driver Lead
(2.0)
Equipment Operator/Driver (6.0)
Equipment Operator/Driver (6.0)
Diversion Worker I/II
(6.0)
Diversion Worker I/II
(6.0)
Resource Recovery Manager
(1.0)
Resource Recovery Manager
(1.0)
** The Assistant General Manager position and duties are assigned to a Division Manager by the GM. Currently this assignment is being held by the Operations Manager.
JRTS Operations
Marketing Intern(0.5)
Marketing Intern(0.5)
Finance / Administration Manager
(1.0)
Finance / Administration Manager
(1.0)
Human Resources Supervisor
(1.0)
Human Resources Supervisor
(1.0)
Business Service Supervisor
(1.0)
Business Service Supervisor
(1.0)
Accountant(1.0)
Accountant(1.0)
Accounting Technician I/II(1.0)
Accounting Technician I/II(1.0)
Administration Assistant I/II
(3.0)
Administration Assistant I/II
(3.0)
Diversion Worker I/II
(2.0)
Diversion Worker I/II
(2.0)
Equipment Operator/Driver Lead
(1.0)
Equipment Operator/Driver Lead
(1.0)
Clerk of the Board1.0)
Clerk of the Board1.0)
Page 25 of 122

This page intentionally left blank
Page 26 of 122

2017-18 BUDGET
2018-19 PROPOSED
Increase/ (Decrease) % Change
Revenues
51.1 - Tipping Fees - Solid Waste 12,158,750 12,672,500 513,750 4.2%51.2 - Tipping Fees - Surcharge 1,803,000 1,849,550 46,550 2.6%51.3 - Tipping Fees - Diverted Materials 1,942,800 2,029,525 86,725 4.5%51.4 - AB939 Service Fee 2,319,700 2,319,700 - 0.0%52.1 - Charges for Services 124,500 144,000 19,500 15.7%53.1 - Sales of Materials 244,000 265,000 21,000 8.6%53.2 - Gas Royalties 220,000 240,000 20,000 9.1%54.1 - Investment Earnings 162,000 200,000 38,000 23.5%Total Revenues 18,974,750 19,720,275 745,525 3.9%
Expenditures
1110 - Executive Administration 443,150 453,500 10,350 2.3%1120 - Administrative Support 503,550 519,200 15,650 3.1%1130 - Human Resources Administration 194,050 201,000 6,950 3.6%1140 - Clerk of the Board 168,600 175,300 6,700 4.0%1200 - Finance Administration 754,050 686,000 (68,050) -9.0%1300 - Operations Administration 454,100 466,400 12,300 2.7%2100 - Resource Recovery 907,050 927,500 20,450 2.3%2150 - Marketing 75,000 75,000 - 0.0%2200 - Public Education 224,150 228,500 4,350 1.9%2300 - Household Hazardous Waste 775,200 797,700 22,500 2.9%2400 - C & D Diversion 170,000 150,000 (20,000) -11.8%2500 - Organics Diversion 833,200 1,037,900 204,700 24.6%2600 - Diversion Services 18,000 20,000 2,000 11.1%3100 - Scalehouse Operations 554,450 564,000 9,550 1.7%3600 - JR Transfer Station 353,950 367,100 13,150 3.7%3630 - JR Recycling Operations 158,900 173,000 14,100 8.9%3650 - ML Transfer Station 500,000 500,000 - 0.0%3710 - SS Disposal Operations 768,400 858,900 90,500 11.8%3720 - SS Transfer Operations 1,183,050 1,215,400 32,350 2.7%3730 - SS Recycling Operations 700,150 757,000 56,850 8.1%4500 - JC Landfill Operations 2,465,850 2,519,900 54,050 2.2%4530 - JC Recycling Operations 360,400 392,000 31,600 8.8%5300 - Crazy Horse Postclosure Maintenance 609,800 547,300 (62,500) -10.2%5400 - Lewis Road Postclosure Maintenance 226,500 250,300 23,800 10.5%5500 - Johnson Canyon ECS 312,600 333,400 20,800 6.7%5600 - Jolon Road Postclosure Maintenance 215,050 238,000 22,950 10.7%5700 - Sun Street ECS 186,500 203,600 17,100 9.2%6100 - Debt Service - Interest 1,619,100 1,550,600 (68,500) -4.2%6200 - Debt Service - Principal 1,229,900 2,383,200 1,153,300 93.8%6605 - Closure Set-Aside 248,500 268,300 19,800 8.0%Total Expenditures 17,213,200 18,860,000 1,646,800 9.6%
Operating Budget Surplus 1,761,550 860,275 Less New CIP Allocation (1,144,000) (680,000) Repayment of Expansion Fund (376,000) Jolon Road Equipment Repayment (120,000) (120,000) Balance Used for Reserves 121,550 60,275
Salinas Valley RecyclesTwo-Year Budget Comparison
FY 2018-19
Page 27 of 122
This page intentionally left blank
Page 28 of 122
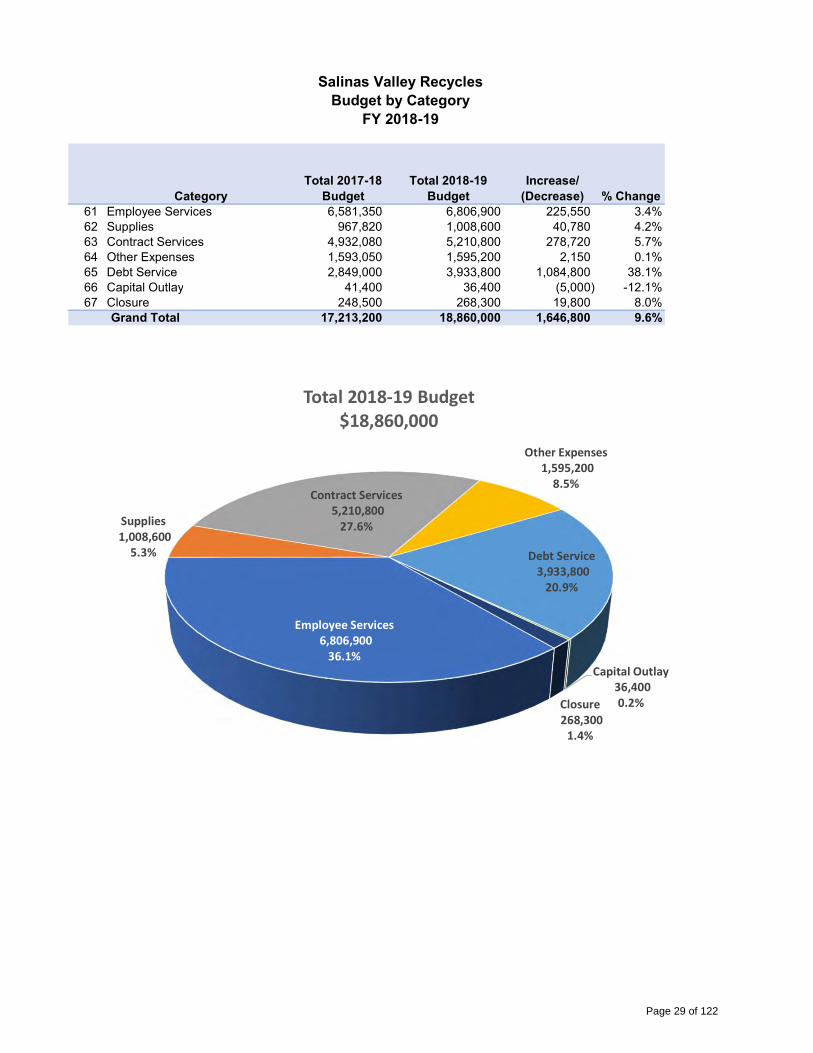
CategoryTotal 2017-18
BudgetTotal 2018-19
BudgetIncrease/
(Decrease) % Change61 Employee Services 6,581,350 6,806,900 225,550 3.4%62 Supplies 967,820 1,008,600 40,780 4.2%63 Contract Services 4,932,080 5,210,800 278,720 5.7%64 Other Expenses 1,593,050 1,595,200 2,150 0.1%65 Debt Service 2,849,000 3,933,800 1,084,800 38.1%66 Capital Outlay 41,400 36,400 (5,000) -12.1%67 Closure 248,500 268,300 19,800 8.0%
Grand Total 17,213,200 18,860,000 1,646,800 9.6%
Salinas Valley RecyclesBudget by Category
FY 2018-19
Employee Services6,806,900
36.1%
Supplies1,008,600
5.3%
Contract Services5,210,800
27.6%
Other Expenses1,595,200
8.5%
Debt Service3,933,800
20.9%
Capital Outlay36,400 0.2%Closure
268,300 1.4%
Total 2018-19 Budget$18,860,000
Page 29 of 122

This page intentionally left blank
Page 30 of 122

Operating Expenditures 2017-18 Budget
Proposed2018-19Budget
Increase/ (Decrease) % Change
1110 - Executive Administration 443,150 453,500 10,350 2.3%1120 - Administrative Support 503,550 519,200 15,650 3.1%1130 - Human Resources Administration 194,050 201,000 6,950 3.6%1140 - Clerk of the Board 168,600 175,300 6,700 4.0%1200 - Finance Administration 754,050 686,000 (68,050) -9.0%1300 - Operations Administration 454,100 466,400 12,300 2.7%2100 - Resource Recovery 907,050 927,500 20,450 2.3%2150 - Marketing 75,000 75,000 - 0.0%2200 - Public Education 224,150 228,500 4,350 1.9%2300 - Household Hazardous Waste 775,200 797,700 22,500 2.9%2400 - C & D Diversion 170,000 150,000 (20,000) -11.8%2500 - Organics Diversion 833,200 1,037,900 204,700 24.6%2600 - Diversion Services 18,000 20,000 2,000 11.1%3100 - Scalehouse Operations 554,450 564,000 9,550 1.7%3600 - JR Transfer Station 353,950 367,100 13,150 3.7%3630 - JR Recycling Operations 158,900 173,000 14,100 8.9%3650 - ML Transfer Station 500,000 500,000 - 0.0%3710 - SS Disposal Operations 768,400 858,900 90,500 11.8%3720 - SS Transfer Operations 1,183,050 1,215,400 32,350 2.7%3730 - SS Recycling Operations 700,150 757,000 56,850 8.1%4500 - JC Landfill Operations 2,465,850 2,519,900 54,050 2.2%4530 - JC Recycling Operations 360,400 392,000 31,600 8.8%5300 - Crazy Horse Postclosure Maintenance 609,800 547,300 (62,500) -10.2%5400 - Lewis Road Postclosure Maintenance 226,500 250,300 23,800 10.5%5500 - Johnson Canyon ECS 312,600 333,400 20,800 6.7%5600 - Jolon Road Postclosure Maintenance 215,050 238,000 22,950 10.7%5700 - Sun Street ECS 186,500 203,600 17,100 9.2%6100 - Debt Service - Interest 1,619,100 1,550,600 (68,500) -4.2%6200 - Debt Service - Principal 1,229,900 2,383,200 1,153,300 93.8%6605 - Closure Set-Aside 248,500 268,300 19,800 8.0%
Grand Total 17,213,200 18,860,000 1,646,800 9.6%
Salinas Valley RecyclesBudget by Program
FY 2018-19
Page 31 of 122

This page intentionally left blank
Page 32 of 122

Row Labels
Proposed2018-19Budget
Scalehouse Allocation
Operations Allocation
Budget with Allocations
Overhead Allocation
Debt Service Allocation
CIP Allocations
Net Cost of Services
1110 - Executive Administration 453,500 453,500 (453,500) - 1120 - Administrative Support 519,200 519,200 (519,200) - 1130 - Human Resources Administration 201,000 201,000 (201,000) - 1140 - Clerk of the Board 175,300 175,300 (175,300) - 1200 - Finance Administration 686,000 686,000 (686,000) - 1300 - Operations Administration 466,400 (466,400) - - - 3100 - Scalehouse Operations 564,000 (564,000) - - - 2100 - Resource Recovery 927,500 927,500 149,527 1,077,027 2150 - Marketing 75,000 75,000 12,091 87,091 2200 - Public Education 228,500 10,063 238,563 38,460 277,023 2300 - Household Hazardous Waste 797,700 35,132 832,832 134,265 967,097 2400 - C & D Diversion 150,000 6,606 156,606 25,247 181,853 2500 - Organics Diversion 1,037,900 45,711 1,083,611 174,694 1,258,305 2600 - Diversion Services 20,000 881 20,881 3,366 20,000 44,247 3600 - JR Transfer Station 367,100 188,000 16,168 571,268 92,097 195,000 858,365 3630 - JR Recycling Operations 173,000 7,619 180,619 29,119 209,738 3650 - ML Transfer Station 500,000 22,021 522,021 84,158 606,178 3710 - SS Disposal Operations 858,900 188,000 37,827 1,084,727 174,874 1,259,602 3720 - SS Transfer Operations 1,215,400 53,528 1,268,928 204,570 100,000 1,573,498 3730 - SS Recycling Operations 757,000 33,339 790,339 127,415 917,754 5700 - Sun Street ECS 203,600 8,967 212,567 34,269 246,836 4530 - JC Recycling Operations 392,000 17,264 409,264 65,980 475,244 4500 - JC Landfill Operations 2,519,900 188,000 110,980 2,818,880 454,446 2,048,000 485,000 5,806,325 5500 - Johnson Canyon ECS 333,400 14,683 348,083 56,116 404,200 5300 - Crazy Horse Postclosure Maintenance 547,300 24,104 571,404 92,119 1,357,663 2,021,186 5400 - Lewis Road Postclosure Maintenance 243,800 10,737 254,537 41,035 361,291 656,863 5600 - Jolon Road Postclosure Maintenance 244,500 10,768 255,268 41,153 166,846 463,267 6100 - Debt Service - Interest 1,550,600 1,550,600 - (1,550,600) - 6200 - Debt Service - Principal 2,383,200 2,383,200 - (2,383,200) - 6605 - Closure Set-Aside 268,300 268,300 - 268,300 Grand Total 18,860,000 - 0 18,860,000 (0) - 800,000 19,660,000
Salinas Valley RecyclesCost of Services by Program
FY 2018-19
* Full Cost of Services includes agency overhead and distribution of debt service and CIP Budget.
Page 33 of 122

This page intentionally left blank
Page 34 of 122
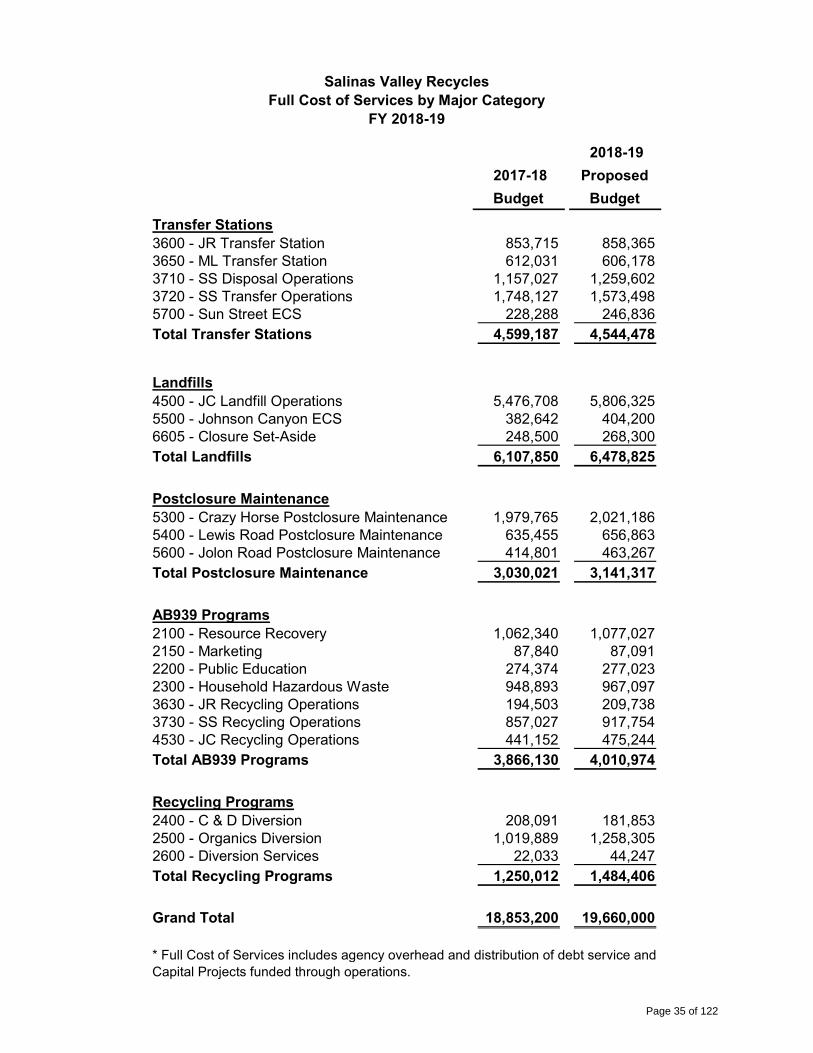
2017-18
Budget
2018-19
Proposed
Budget
Transfer Stations3600 - JR Transfer Station 853,715 858,365 3650 - ML Transfer Station 612,031 606,178 3710 - SS Disposal Operations 1,157,027 1,259,602 3720 - SS Transfer Operations 1,748,127 1,573,498 5700 - Sun Street ECS 228,288 246,836 Total Transfer Stations 4,599,187 4,544,478
Landfills4500 - JC Landfill Operations 5,476,708 5,806,325 5500 - Johnson Canyon ECS 382,642 404,200 6605 - Closure Set-Aside 248,500 268,300 Total Landfills 6,107,850 6,478,825
Postclosure Maintenance5300 - Crazy Horse Postclosure Maintenance 1,979,765 2,021,186 5400 - Lewis Road Postclosure Maintenance 635,455 656,863 5600 - Jolon Road Postclosure Maintenance 414,801 463,267 Total Postclosure Maintenance 3,030,021 3,141,317
AB939 Programs2100 - Resource Recovery 1,062,340 1,077,027 2150 - Marketing 87,840 87,091 2200 - Public Education 274,374 277,023 2300 - Household Hazardous Waste 948,893 967,097 3630 - JR Recycling Operations 194,503 209,738 3730 - SS Recycling Operations 857,027 917,754 4530 - JC Recycling Operations 441,152 475,244 Total AB939 Programs 3,866,130 4,010,974
Recycling Programs2400 - C & D Diversion 208,091 181,853 2500 - Organics Diversion 1,019,889 1,258,305 2600 - Diversion Services 22,033 44,247 Total Recycling Programs 1,250,012 1,484,406
Grand Total 18,853,200 19,660,000
Salinas Valley RecyclesFull Cost of Services by Major Category
FY 2018-19
* Full Cost of Services includes agency overhead and distribution of debt service and Capital Projects funded through operations.
Page 35 of 122

This page intentionally left blank
Page 36 of 122

Row Labels 2017-18 Budget
Proposed2018-19Budget
Increase/ (Decrease) % Change
61.0 - Personnel Services61110 - Regular Pay 3,706,400 3,941,000 234,600 6.3%61115 - Board Member Stipends 17,400 17,400 - 0.0%61120 - Paid Time Off 137,300 145,900 8,600 6.3%61130 - Safety Awards 8,900 8,900 - 0.0%61300 - Overtime - Regular 246,900 264,500 17,600 7.1%61400 - Education Assistance 92,750 106,000 13,250 14.3%61410 - Wellness Program 26,500 26,500 - 0.0%61600 - Other Payroll Costs 56,000 - (56,000) -100.0%61700 - Flexible Leave 86,700 92,200 5,500 6.3%61705 - Management Leave 20,700 21,800 1,100 5.3%61815 - Auto Allowance 31,200 31,200 - 0.0%61816 - Cell Phone 12,900 12,700 (200) -1.6%61822 - PERS Employer Classic 220,400 219,000 (1,400) -0.6%61825 - Medicare 59,000 64,600 5,600 9.5%61826 - FICA 2,100 2,100 - 0.0%61827 - PERS - 1959 Survivor Benefit 2,500 2,500 - 0.0%61828 - PERS Employer PEPRA 82,000 92,600 10,600 12.9%61829 - PERS Unfunded Liability Payment 100,000 100,000 - 0.0%61830 - Health Insurance - Admin Fees 3,800 4,000 200 5.3%61831 - Health Insurance 1,259,700 1,187,800 (71,900) -5.7%61832 - Health Insurance - Retired 4,000 4,000 - 0.0%61833 - Long-Term Disability 20,200 21,900 1,700 8.4%61834 - Unemployment 19,600 19,600 - 0.0%61836 - Life Insurance 10,700 11,000 300 2.8%61837 - Insurance - Workers Compensation 207,100 250,900 43,800 21.1%69810 - Transfers Out - OPEB Reserve 146,600 158,800 12,200 8.3%
61.0 - Personnel Services Total 6,581,350 6,806,900 225,550 3.4%62.0 - Supplies
62100 - Office Supplies & Materials 28,130 28,200 70 0.2%62120 - Reproduction Costs 3,000 3,000 - 0.0%62130 - Copier/Printer Supplies 11,000 11,000 - 0.0%62140 - Janitorial Supplies 7,000 7,000 - 0.0%62230 - Rolling Stock Supplies 4,350 4,500 150 3.4%62230 - Vehicle Supplies 10,400 10,400 - 0.0%62290 - Other Repair & Maintenance Supplies 50,500 68,500 18,000 35.6%62330 - Fuel 148,550 156,500 7,950 5.4%62335 - Biodiesel Fuel 442,200 444,600 2,400 0.5%62510 - Uniforms 10,000 16,500 6,500 65.0%62800 - Special Dept Supplies 125,400 128,350 2,950 2.4%62801 - Graffiti Removal Supplies 2,000 2,000 - 0.0%62802 - MoCo Clean Up Vouchers 2,500 2,500 - 0.0%62810 - Software/License Renewals 28,540 27,950 (590) -2.1%62840 - Safety Supplies 24,500 28,000 3,500 14.3%62850 - Small Tools 20,800 20,800 - 0.0%62910 - Minor Capital Outlay 44,950 44,800 (150) -0.3%62915 - Minor Computer Equipment 4,000 4,000 - 0.0%
62.0 - Supplies Total 967,820 1,008,600 40,780 4.2%63.0 - Contractual Services
63250 - Exterminator Service 6,450 6,500 50 0.8%63261 - Vector Control 500 1,000 500 100.0%63270 - Garbage/Recycling Pickup 1,250 1,500 250 20.0%63410 - Vehicle Maintenance 369,200 363,500 (5,700) -1.5%63416 - Building Alarm Service 24,700 24,700 - 0.0%63418 - Security Service 16,000 16,000 - 0.0%
Salinas Valley RecyclesBudget by Category with Line Item Detail
FY 2018-19
Page 37 of 122
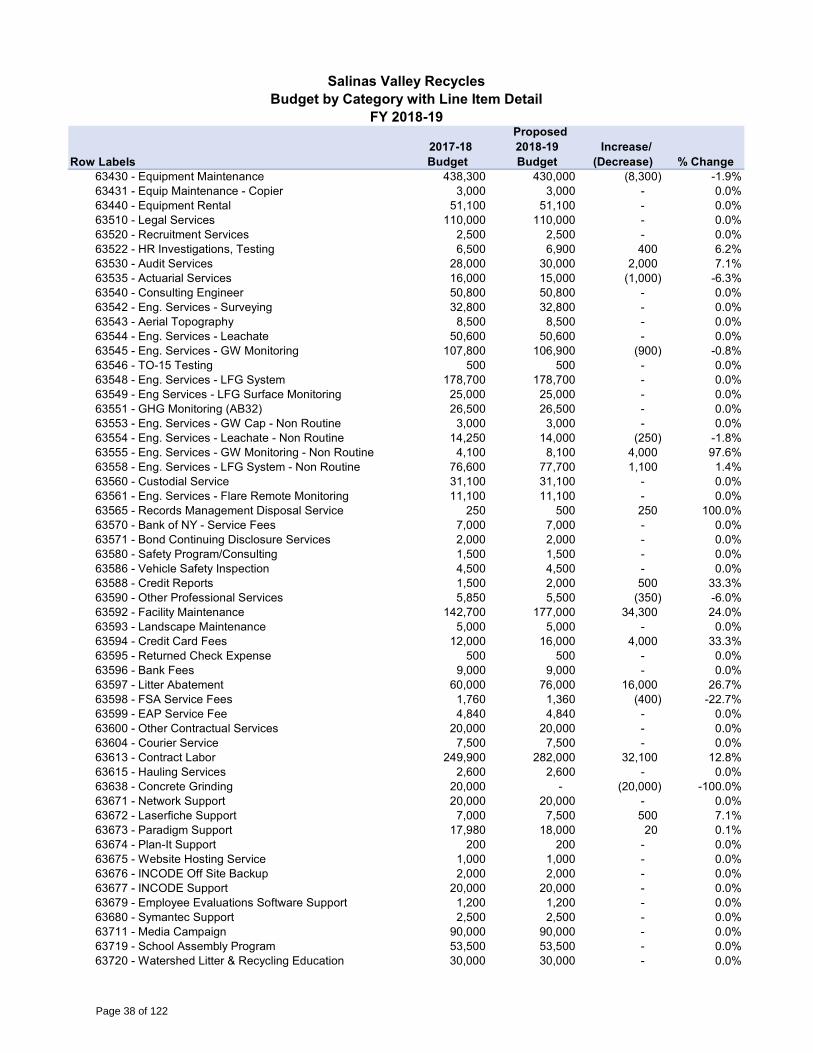
Row Labels 2017-18 Budget
Proposed2018-19Budget
Increase/ (Decrease) % Change
Salinas Valley RecyclesBudget by Category with Line Item Detail
FY 2018-19
63430 - Equipment Maintenance 438,300 430,000 (8,300) -1.9%63431 - Equip Maintenance - Copier 3,000 3,000 - 0.0%63440 - Equipment Rental 51,100 51,100 - 0.0%63510 - Legal Services 110,000 110,000 - 0.0%63520 - Recruitment Services 2,500 2,500 - 0.0%63522 - HR Investigations, Testing 6,500 6,900 400 6.2%63530 - Audit Services 28,000 30,000 2,000 7.1%63535 - Actuarial Services 16,000 15,000 (1,000) -6.3%63540 - Consulting Engineer 50,800 50,800 - 0.0%63542 - Eng. Services - Surveying 32,800 32,800 - 0.0%63543 - Aerial Topography 8,500 8,500 - 0.0%63544 - Eng. Services - Leachate 50,600 50,600 - 0.0%63545 - Eng. Services - GW Monitoring 107,800 106,900 (900) -0.8%63546 - TO-15 Testing 500 500 - 0.0%63548 - Eng. Services - LFG System 178,700 178,700 - 0.0%63549 - Eng Services - LFG Surface Monitoring 25,000 25,000 - 0.0%63551 - GHG Monitoring (AB32) 26,500 26,500 - 0.0%63553 - Eng. Services - GW Cap - Non Routine 3,000 3,000 - 0.0%63554 - Eng. Services - Leachate - Non Routine 14,250 14,000 (250) -1.8%63555 - Eng. Services - GW Monitoring - Non Routine 4,100 8,100 4,000 97.6%63558 - Eng. Services - LFG System - Non Routine 76,600 77,700 1,100 1.4%63560 - Custodial Service 31,100 31,100 - 0.0%63561 - Eng. Services - Flare Remote Monitoring 11,100 11,100 - 0.0%63565 - Records Management Disposal Service 250 500 250 100.0%63570 - Bank of NY - Service Fees 7,000 7,000 - 0.0%63571 - Bond Continuing Disclosure Services 2,000 2,000 - 0.0%63580 - Safety Program/Consulting 1,500 1,500 - 0.0%63586 - Vehicle Safety Inspection 4,500 4,500 - 0.0%63588 - Credit Reports 1,500 2,000 500 33.3%63590 - Other Professional Services 5,850 5,500 (350) -6.0%63592 - Facility Maintenance 142,700 177,000 34,300 24.0%63593 - Landscape Maintenance 5,000 5,000 - 0.0%63594 - Credit Card Fees 12,000 16,000 4,000 33.3%63595 - Returned Check Expense 500 500 - 0.0%63596 - Bank Fees 9,000 9,000 - 0.0%63597 - Litter Abatement 60,000 76,000 16,000 26.7%63598 - FSA Service Fees 1,760 1,360 (400) -22.7%63599 - EAP Service Fee 4,840 4,840 - 0.0%63600 - Other Contractual Services 20,000 20,000 - 0.0%63604 - Courier Service 7,500 7,500 - 0.0%63613 - Contract Labor 249,900 282,000 32,100 12.8%63615 - Hauling Services 2,600 2,600 - 0.0%63638 - Concrete Grinding 20,000 - (20,000) -100.0%63671 - Network Support 20,000 20,000 - 0.0%63672 - Laserfiche Support 7,000 7,500 500 7.1%63673 - Paradigm Support 17,980 18,000 20 0.1%63674 - Plan-It Support 200 200 - 0.0%63675 - Website Hosting Service 1,000 1,000 - 0.0%63676 - INCODE Off Site Backup 2,000 2,000 - 0.0%63677 - INCODE Support 20,000 20,000 - 0.0%63679 - Employee Evaluations Software Support 1,200 1,200 - 0.0%63680 - Symantec Support 2,500 2,500 - 0.0%63711 - Media Campaign 90,000 90,000 - 0.0%63719 - School Assembly Program 53,500 53,500 - 0.0%63720 - Watershed Litter & Recycling Education 30,000 30,000 - 0.0%
Page 38 of 122
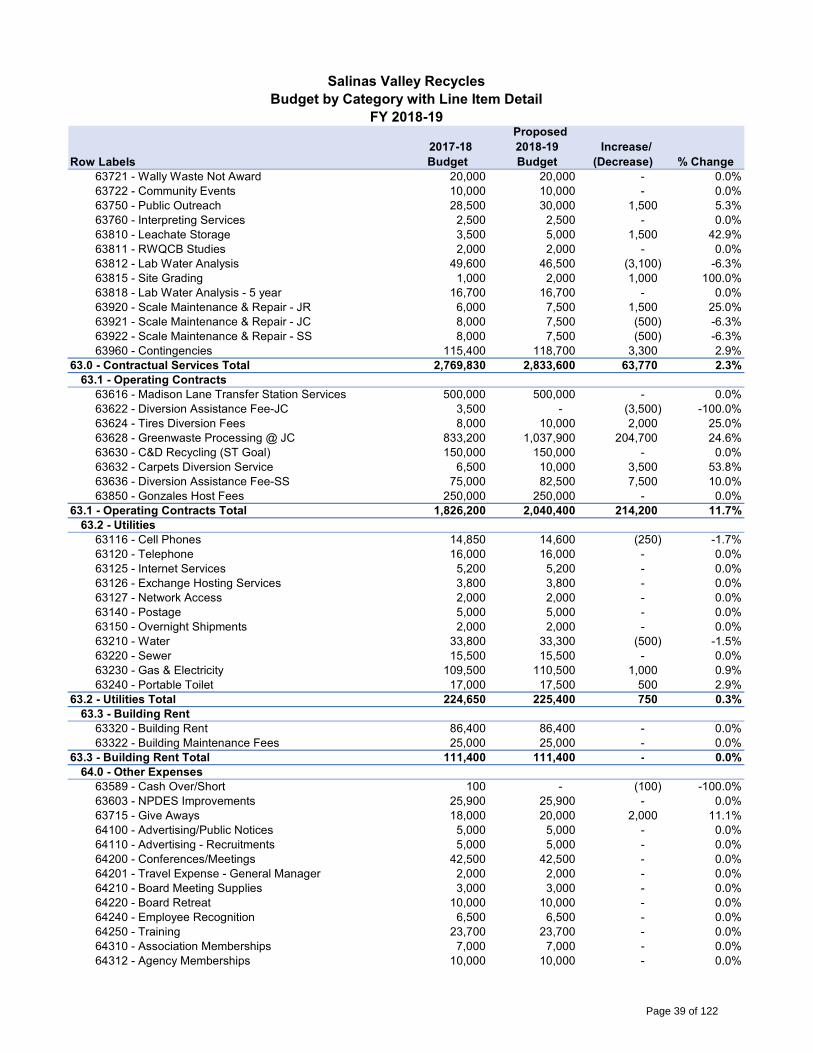
Row Labels 2017-18 Budget
Proposed2018-19Budget
Increase/ (Decrease) % Change
Salinas Valley RecyclesBudget by Category with Line Item Detail
FY 2018-19
63721 - Wally Waste Not Award 20,000 20,000 - 0.0%63722 - Community Events 10,000 10,000 - 0.0%63750 - Public Outreach 28,500 30,000 1,500 5.3%63760 - Interpreting Services 2,500 2,500 - 0.0%63810 - Leachate Storage 3,500 5,000 1,500 42.9%63811 - RWQCB Studies 2,000 2,000 - 0.0%63812 - Lab Water Analysis 49,600 46,500 (3,100) -6.3%63815 - Site Grading 1,000 2,000 1,000 100.0%63818 - Lab Water Analysis - 5 year 16,700 16,700 - 0.0%63920 - Scale Maintenance & Repair - JR 6,000 7,500 1,500 25.0%63921 - Scale Maintenance & Repair - JC 8,000 7,500 (500) -6.3%63922 - Scale Maintenance & Repair - SS 8,000 7,500 (500) -6.3%63960 - Contingencies 115,400 118,700 3,300 2.9%
63.0 - Contractual Services Total 2,769,830 2,833,600 63,770 2.3%63.1 - Operating Contracts
63616 - Madison Lane Transfer Station Services 500,000 500,000 - 0.0%63622 - Diversion Assistance Fee-JC 3,500 - (3,500) -100.0%63624 - Tires Diversion Fees 8,000 10,000 2,000 25.0%63628 - Greenwaste Processing @ JC 833,200 1,037,900 204,700 24.6%63630 - C&D Recycling (ST Goal) 150,000 150,000 - 0.0%63632 - Carpets Diversion Service 6,500 10,000 3,500 53.8%63636 - Diversion Assistance Fee-SS 75,000 82,500 7,500 10.0%63850 - Gonzales Host Fees 250,000 250,000 - 0.0%
63.1 - Operating Contracts Total 1,826,200 2,040,400 214,200 11.7%63.2 - Utilities
63116 - Cell Phones 14,850 14,600 (250) -1.7%63120 - Telephone 16,000 16,000 - 0.0%63125 - Internet Services 5,200 5,200 - 0.0%63126 - Exchange Hosting Services 3,800 3,800 - 0.0%63127 - Network Access 2,000 2,000 - 0.0%63140 - Postage 5,000 5,000 - 0.0%63150 - Overnight Shipments 2,000 2,000 - 0.0%63210 - Water 33,800 33,300 (500) -1.5%63220 - Sewer 15,500 15,500 - 0.0%63230 - Gas & Electricity 109,500 110,500 1,000 0.9%63240 - Portable Toilet 17,000 17,500 500 2.9%
63.2 - Utilities Total 224,650 225,400 750 0.3%63.3 - Building Rent
63320 - Building Rent 86,400 86,400 - 0.0%63322 - Building Maintenance Fees 25,000 25,000 - 0.0%
63.3 - Building Rent Total 111,400 111,400 - 0.0%64.0 - Other Expenses
63589 - Cash Over/Short 100 - (100) -100.0%63603 - NPDES Improvements 25,900 25,900 - 0.0%63715 - Give Aways 18,000 20,000 2,000 11.1%64100 - Advertising/Public Notices 5,000 5,000 - 0.0%64110 - Advertising - Recruitments 5,000 5,000 - 0.0%64200 - Conferences/Meetings 42,500 42,500 - 0.0%64201 - Travel Expense - General Manager 2,000 2,000 - 0.0%64210 - Board Meeting Supplies 3,000 3,000 - 0.0%64220 - Board Retreat 10,000 10,000 - 0.0%64240 - Employee Recognition 6,500 6,500 - 0.0%64250 - Training 23,700 23,700 - 0.0%64310 - Association Memberships 7,000 7,000 - 0.0%64312 - Agency Memberships 10,000 10,000 - 0.0%
Page 39 of 122

Row Labels 2017-18 Budget
Proposed2018-19Budget
Increase/ (Decrease) % Change
Salinas Valley RecyclesBudget by Category with Line Item Detail
FY 2018-19
64320 - Publications & Trade Journals 5,250 5,500 250 4.8%64700 - Refunds & Reimbursement 1,000 1,000 - 0.0%
64.0 - Other Expenses Total 164,950 167,100 2,150 1.3%64.4 - Insurance
64410 - Insurance 51,000 20,000 (31,000) -60.8%64411 - Insurance - Commercial Auto 18,400 19,900 1,500 8.2%64412 - Insurance - Crime 6,800 6,900 100 1.5%64413 - Insurance - Environmental Impairment Liability 62,400 68,600 6,200 9.9%64414 - Insurance - General Liability 110,100 121,000 10,900 9.9%64415 - Insurance - Public Officials and Employment Liabil 19,400 20,800 1,400 7.2%64416 - Insurance - Property Damage 23,200 25,500 2,300 9.9%64417 - Insurance - Excess Liability 41,400 45,600 4,200 10.1%64418 - Insurance - Surety Bond 5,600 5,600 - 0.0%64420 - Insurance - Deductible 7,500 7,500 - 0.0%64422 - Insurance - Earthquake 12,700 14,000 1,300 10.2%
64.4 - Insurance Total 358,500 355,400 (3,100) -0.9%64.5 - Hazardous Waste
63651 - HHW Hauling & Disposal 160,000 160,000 - 0.0%63653 - ABOP Disposal 5,000 5,000 - 0.0%63654 - Freon Removal 2,500 2,500 - 0.0%63655 - HHW Disposal Supplies 35,600 35,600 - 0.0%
64.5 - Hazardous Waste Total 203,100 203,100 - 0.0%64.9 - Taxes and Permits
63817 - NPDES - Permitting 41,100 41,100 - 0.0%63905 - Fees & Permits 3,700 3,700 - 0.0%64903 - Fees & Permits 800 1,700 900 112.5%64904 - Property Taxes 27,700 30,400 2,700 9.7%64905 - Mo.Co. LEA Fees 67,400 79,700 12,300 18.2%64906 - Mo.Co. Regional Fees 130,000 130,000 - 0.0%64910 - SBOE - CIWMB Fees 374,900 375,000 100 0.0%64920 - MBUAPCD-Air Board Fees 44,000 50,000 6,000 13.6%64925 - SWRCB Fees 125,900 104,000 (21,900) -17.4%64927 - MRWPA Fees (Stormwater Discharge) 50,000 50,000 - 0.0%64943 - Fees and Permits 1,000 4,000 3,000 300.0%
64.9 - Taxes and Permits Total 866,500 869,600 3,100 0.4%65.0 - Debt Service
65230 - 2014A Rev Bonds Principal 145,000 1,265,000 1,120,000 772.4%65240 - 2014B Rev Bonds Principal 335,000 345,000 10,000 3.0%65250 - Equipment Lease/Purchase 749,900 773,200 23,300 3.1%
65.0 - Debt Service Total 1,229,900 2,383,200 1,153,300 93.8%65.1 - Interest Expense
65130 - 2014A Rev Bonds Interest 1,471,500 1,436,300 (35,200) -2.4%65140 - 2014B Rev Bonds Interest 99,800 89,800 (10,000) -10.0%65150 - Capital One Eq Lease Interest 47,800 24,500 (23,300) -48.7%
65.1 - Interest Expense Total 1,619,100 1,550,600 (68,500) -4.2%66.0 - Capital Outlay
66520 - Equipment 32,400 32,400 - 0.0%66530 - Office Equipment 4,000 4,000 - 0.0%66550 - Rolling Equipment 5,000 - (5,000) -100.0%
66.0 - Capital Outlay Total 41,400 36,400 (5,000) -12.1%67.0 - Closure/Postclosure
69520 - Transfers Out - Closure Costs 248,500 268,300 19,800 8.0%67.0 - Closure/Postclosure Total 248,500 268,300 19,800 8.0%Grand Total 17,213,200 18,860,000 1,646,800 9.6%
Page 40 of 122
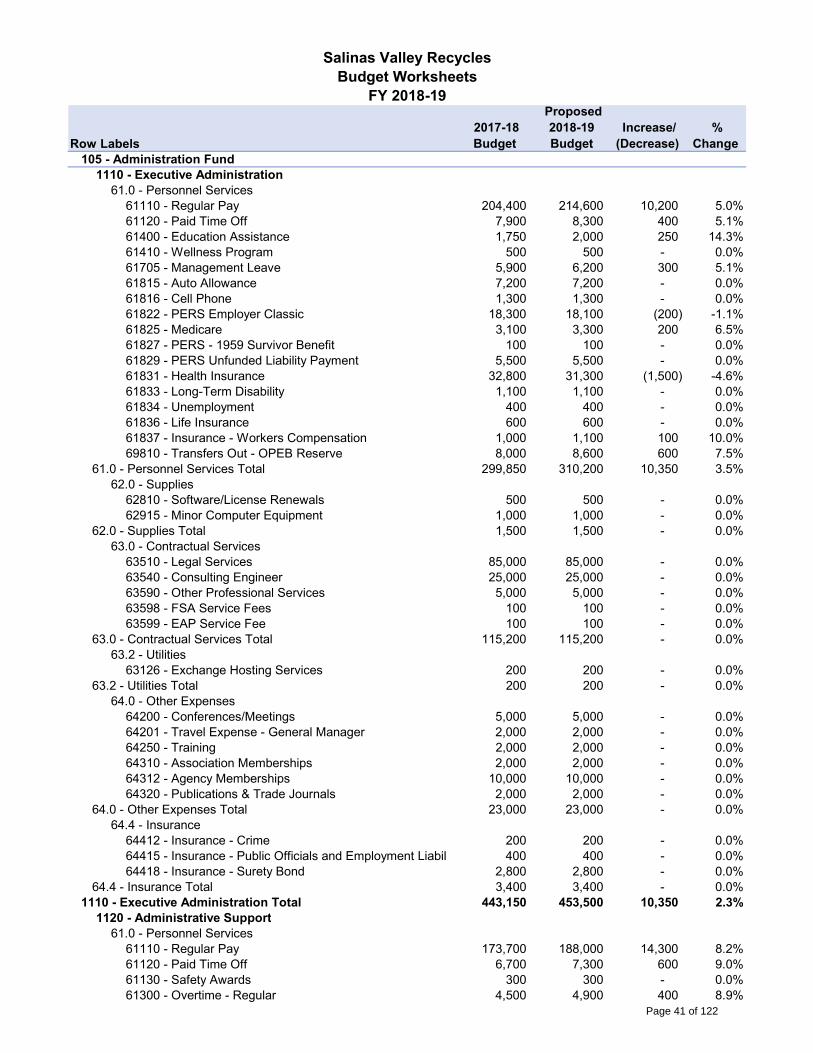
Row Labels 2017-18 Budget
Proposed2018-19Budget
Increase/ (Decrease)
% Change
105 - Administration Fund1110 - Executive Administration
61.0 - Personnel Services61110 - Regular Pay 204,400 214,600 10,200 5.0%61120 - Paid Time Off 7,900 8,300 400 5.1%61400 - Education Assistance 1,750 2,000 250 14.3%61410 - Wellness Program 500 500 - 0.0%61705 - Management Leave 5,900 6,200 300 5.1%61815 - Auto Allowance 7,200 7,200 - 0.0%61816 - Cell Phone 1,300 1,300 - 0.0%61822 - PERS Employer Classic 18,300 18,100 (200) -1.1%61825 - Medicare 3,100 3,300 200 6.5%61827 - PERS - 1959 Survivor Benefit 100 100 - 0.0%61829 - PERS Unfunded Liability Payment 5,500 5,500 - 0.0%61831 - Health Insurance 32,800 31,300 (1,500) -4.6%61833 - Long-Term Disability 1,100 1,100 - 0.0%61834 - Unemployment 400 400 - 0.0%61836 - Life Insurance 600 600 - 0.0%61837 - Insurance - Workers Compensation 1,000 1,100 100 10.0%69810 - Transfers Out - OPEB Reserve 8,000 8,600 600 7.5%
61.0 - Personnel Services Total 299,850 310,200 10,350 3.5%62.0 - Supplies
62810 - Software/License Renewals 500 500 - 0.0%62915 - Minor Computer Equipment 1,000 1,000 - 0.0%
62.0 - Supplies Total 1,500 1,500 - 0.0%63.0 - Contractual Services
63510 - Legal Services 85,000 85,000 - 0.0%63540 - Consulting Engineer 25,000 25,000 - 0.0%63590 - Other Professional Services 5,000 5,000 - 0.0%63598 - FSA Service Fees 100 100 - 0.0%63599 - EAP Service Fee 100 100 - 0.0%
63.0 - Contractual Services Total 115,200 115,200 - 0.0%63.2 - Utilities
63126 - Exchange Hosting Services 200 200 - 0.0%63.2 - Utilities Total 200 200 - 0.0%
64.0 - Other Expenses64200 - Conferences/Meetings 5,000 5,000 - 0.0%64201 - Travel Expense - General Manager 2,000 2,000 - 0.0%64250 - Training 2,000 2,000 - 0.0%64310 - Association Memberships 2,000 2,000 - 0.0%64312 - Agency Memberships 10,000 10,000 - 0.0%64320 - Publications & Trade Journals 2,000 2,000 - 0.0%
64.0 - Other Expenses Total 23,000 23,000 - 0.0%64.4 - Insurance
64412 - Insurance - Crime 200 200 - 0.0%64415 - Insurance - Public Officials and Employment Liabil 400 400 - 0.0%64418 - Insurance - Surety Bond 2,800 2,800 - 0.0%
64.4 - Insurance Total 3,400 3,400 - 0.0%1110 - Executive Administration Total 443,150 453,500 10,350 2.3%
1120 - Administrative Support61.0 - Personnel Services
61110 - Regular Pay 173,700 188,000 14,300 8.2%61120 - Paid Time Off 6,700 7,300 600 9.0%61130 - Safety Awards 300 300 - 0.0%61300 - Overtime - Regular 4,500 4,900 400 8.9%
Salinas Valley RecyclesBudget Worksheets
FY 2018-19
Page 41 of 122
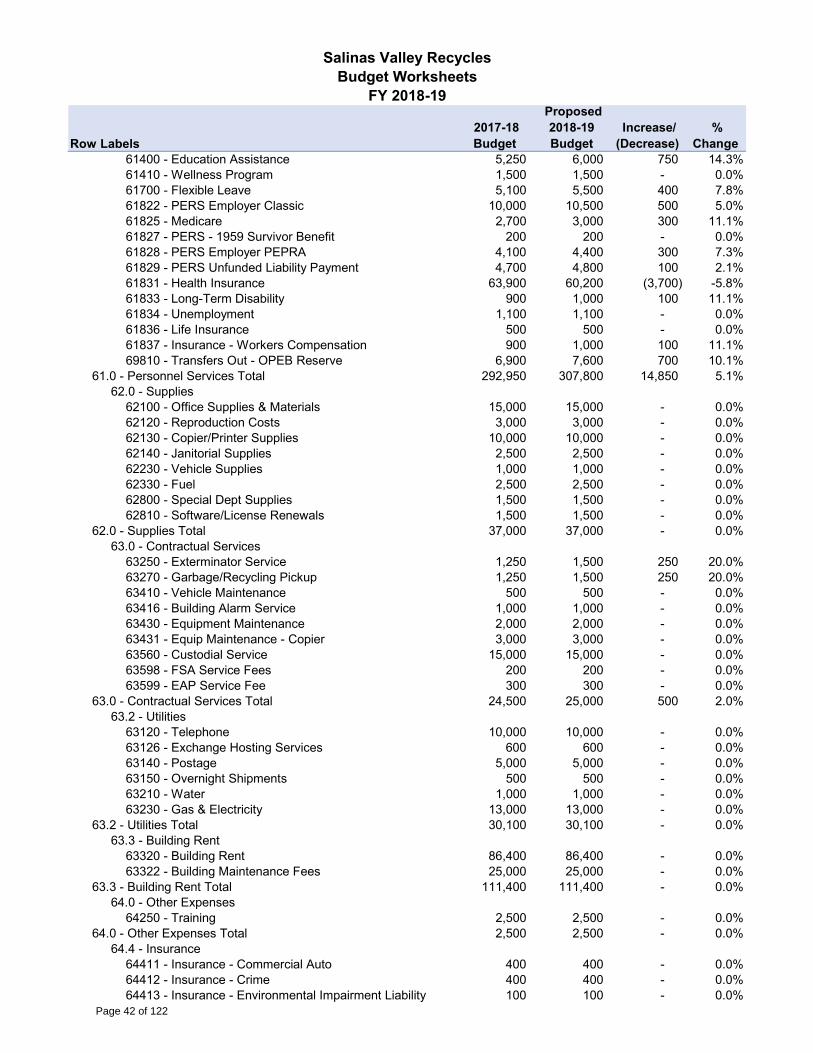
Row Labels 2017-18 Budget
Proposed2018-19Budget
Increase/ (Decrease)
% Change
Salinas Valley RecyclesBudget Worksheets
FY 2018-19
61400 - Education Assistance 5,250 6,000 750 14.3%61410 - Wellness Program 1,500 1,500 - 0.0%61700 - Flexible Leave 5,100 5,500 400 7.8%61822 - PERS Employer Classic 10,000 10,500 500 5.0%61825 - Medicare 2,700 3,000 300 11.1%61827 - PERS - 1959 Survivor Benefit 200 200 - 0.0%61828 - PERS Employer PEPRA 4,100 4,400 300 7.3%61829 - PERS Unfunded Liability Payment 4,700 4,800 100 2.1%61831 - Health Insurance 63,900 60,200 (3,700) -5.8%61833 - Long-Term Disability 900 1,000 100 11.1%61834 - Unemployment 1,100 1,100 - 0.0%61836 - Life Insurance 500 500 - 0.0%61837 - Insurance - Workers Compensation 900 1,000 100 11.1%69810 - Transfers Out - OPEB Reserve 6,900 7,600 700 10.1%
61.0 - Personnel Services Total 292,950 307,800 14,850 5.1%62.0 - Supplies
62100 - Office Supplies & Materials 15,000 15,000 - 0.0%62120 - Reproduction Costs 3,000 3,000 - 0.0%62130 - Copier/Printer Supplies 10,000 10,000 - 0.0%62140 - Janitorial Supplies 2,500 2,500 - 0.0%62230 - Vehicle Supplies 1,000 1,000 - 0.0%62330 - Fuel 2,500 2,500 - 0.0%62800 - Special Dept Supplies 1,500 1,500 - 0.0%62810 - Software/License Renewals 1,500 1,500 - 0.0%
62.0 - Supplies Total 37,000 37,000 - 0.0%63.0 - Contractual Services
63250 - Exterminator Service 1,250 1,500 250 20.0%63270 - Garbage/Recycling Pickup 1,250 1,500 250 20.0%63410 - Vehicle Maintenance 500 500 - 0.0%63416 - Building Alarm Service 1,000 1,000 - 0.0%63430 - Equipment Maintenance 2,000 2,000 - 0.0%63431 - Equip Maintenance - Copier 3,000 3,000 - 0.0%63560 - Custodial Service 15,000 15,000 - 0.0%63598 - FSA Service Fees 200 200 - 0.0%63599 - EAP Service Fee 300 300 - 0.0%
63.0 - Contractual Services Total 24,500 25,000 500 2.0%63.2 - Utilities
63120 - Telephone 10,000 10,000 - 0.0%63126 - Exchange Hosting Services 600 600 - 0.0%63140 - Postage 5,000 5,000 - 0.0%63150 - Overnight Shipments 500 500 - 0.0%63210 - Water 1,000 1,000 - 0.0%63230 - Gas & Electricity 13,000 13,000 - 0.0%
63.2 - Utilities Total 30,100 30,100 - 0.0%63.3 - Building Rent
63320 - Building Rent 86,400 86,400 - 0.0%63322 - Building Maintenance Fees 25,000 25,000 - 0.0%
63.3 - Building Rent Total 111,400 111,400 - 0.0%64.0 - Other Expenses
64250 - Training 2,500 2,500 - 0.0%64.0 - Other Expenses Total 2,500 2,500 - 0.0%
64.4 - Insurance64411 - Insurance - Commercial Auto 400 400 - 0.0%64412 - Insurance - Crime 400 400 - 0.0%64413 - Insurance - Environmental Impairment Liability 100 100 - 0.0%
Page 42 of 122

Row Labels 2017-18 Budget
Proposed2018-19Budget
Increase/ (Decrease)
% Change
Salinas Valley RecyclesBudget Worksheets
FY 2018-19
64414 - Insurance - General Liability 100 100 - 0.0%64415 - Insurance - Public Officials and Employment Liabil 1,100 1,200 100 9.1%64416 - Insurance - Property Damage 1,900 2,000 100 5.3%64417 - Insurance - Excess Liability 100 100 - 0.0%64422 - Insurance - Earthquake 1,000 1,100 100 10.0%
64.4 - Insurance Total 5,100 5,400 300 5.9%1120 - Administrative Support Total 503,550 519,200 15,650 3.1%
1130 - Human Resources Administration61.0 - Personnel Services
61110 - Regular Pay 82,000 88,700 6,700 8.2%61120 - Paid Time Off 3,200 3,500 300 9.4%61130 - Safety Awards 100 100 - 0.0%61300 - Overtime - Regular 2,100 2,300 200 9.5%61400 - Education Assistance 1,750 2,000 250 14.3%61410 - Wellness Program 500 500 - 0.0%61700 - Flexible Leave 2,400 2,600 200 8.3%61816 - Cell Phone 1,000 800 (200) -20.0%61822 - PERS Employer Classic 7,400 7,500 100 1.4%61825 - Medicare 1,300 1,400 100 7.7%61827 - PERS - 1959 Survivor Benefit 100 100 - 0.0%61829 - PERS Unfunded Liability Payment 2,300 2,300 - 0.0%61830 - Health Insurance - Admin Fees 3,800 4,000 200 5.3%61831 - Health Insurance 29,900 28,200 (1,700) -5.7%61833 - Long-Term Disability 500 500 - 0.0%61834 - Unemployment 400 400 - 0.0%61836 - Life Insurance 300 300 - 0.0%61837 - Insurance - Workers Compensation 400 500 100 25.0%69810 - Transfers Out - OPEB Reserve 3,300 3,600 300 9.1%
61.0 - Personnel Services Total 142,750 149,300 6,550 4.6%62.0 - Supplies
62810 - Software/License Renewals 500 500 - 0.0%62915 - Minor Computer Equipment 1,000 1,000 - 0.0%
62.0 - Supplies Total 1,500 1,500 - 0.0%63.0 - Contractual Services
63510 - Legal Services 20,000 20,000 - 0.0%63520 - Recruitment Services 2,500 2,500 - 0.0%63522 - HR Investigations, Testing 1,600 2,000 400 25.0%63580 - Safety Program/Consulting 1,500 1,500 - 0.0%63598 - FSA Service Fees 100 100 - 0.0%63599 - EAP Service Fee 100 100 - 0.0%63679 - Employee Evaluations Software Support 1,200 1,200 - 0.0%
63.0 - Contractual Services Total 27,000 27,400 400 1.5%63.2 - Utilities
63126 - Exchange Hosting Services 200 200 - 0.0%63.2 - Utilities Total 200 200 - 0.0%
64.0 - Other Expenses64110 - Advertising - Recruitments 5,000 5,000 - 0.0%64200 - Conferences/Meetings 5,000 5,000 - 0.0%64240 - Employee Recognition 5,000 5,000 - 0.0%64250 - Training 5,000 5,000 - 0.0%64310 - Association Memberships 1,000 1,000 - 0.0%64320 - Publications & Trade Journals 1,000 1,000 - 0.0%
64.0 - Other Expenses Total 22,000 22,000 - 0.0%64.4 - Insurance
64412 - Insurance - Crime 200 200 - 0.0%Page 43 of 122
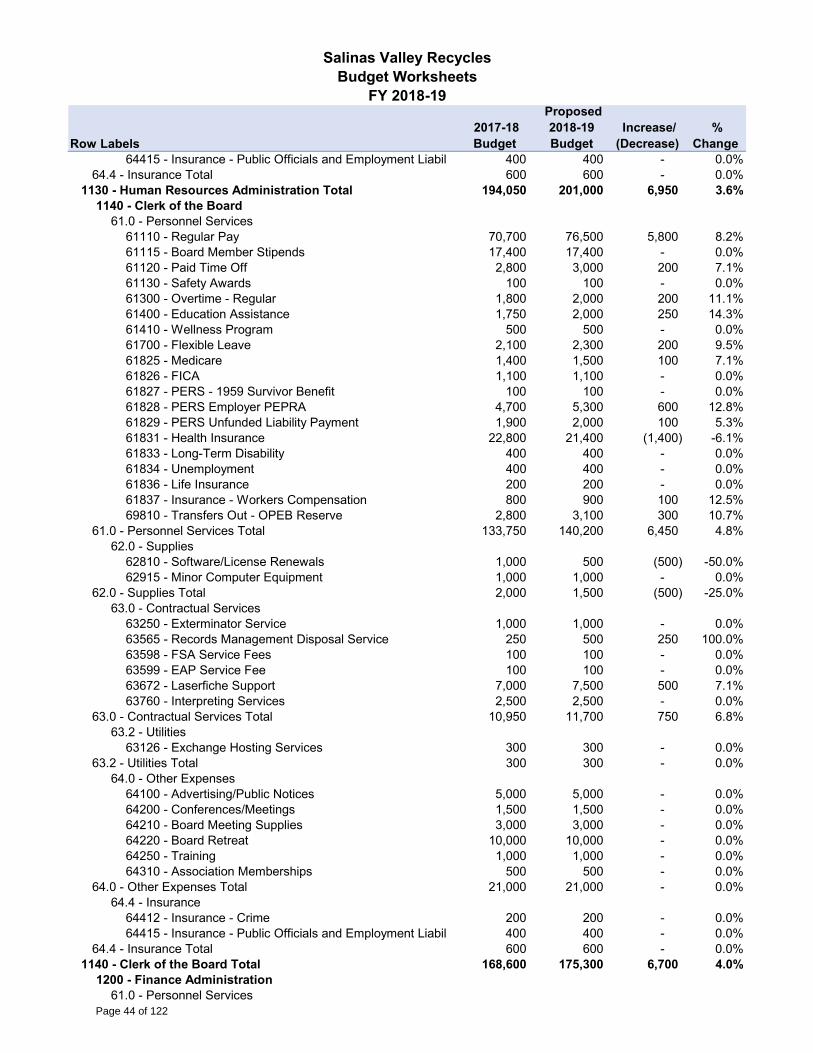
Row Labels 2017-18 Budget
Proposed2018-19Budget
Increase/ (Decrease)
% Change
Salinas Valley RecyclesBudget Worksheets
FY 2018-19
64415 - Insurance - Public Officials and Employment Liabil 400 400 - 0.0%64.4 - Insurance Total 600 600 - 0.0%
1130 - Human Resources Administration Total 194,050 201,000 6,950 3.6%1140 - Clerk of the Board
61.0 - Personnel Services61110 - Regular Pay 70,700 76,500 5,800 8.2%61115 - Board Member Stipends 17,400 17,400 - 0.0%61120 - Paid Time Off 2,800 3,000 200 7.1%61130 - Safety Awards 100 100 - 0.0%61300 - Overtime - Regular 1,800 2,000 200 11.1%61400 - Education Assistance 1,750 2,000 250 14.3%61410 - Wellness Program 500 500 - 0.0%61700 - Flexible Leave 2,100 2,300 200 9.5%61825 - Medicare 1,400 1,500 100 7.1%61826 - FICA 1,100 1,100 - 0.0%61827 - PERS - 1959 Survivor Benefit 100 100 - 0.0%61828 - PERS Employer PEPRA 4,700 5,300 600 12.8%61829 - PERS Unfunded Liability Payment 1,900 2,000 100 5.3%61831 - Health Insurance 22,800 21,400 (1,400) -6.1%61833 - Long-Term Disability 400 400 - 0.0%61834 - Unemployment 400 400 - 0.0%61836 - Life Insurance 200 200 - 0.0%61837 - Insurance - Workers Compensation 800 900 100 12.5%69810 - Transfers Out - OPEB Reserve 2,800 3,100 300 10.7%
61.0 - Personnel Services Total 133,750 140,200 6,450 4.8%62.0 - Supplies
62810 - Software/License Renewals 1,000 500 (500) -50.0%62915 - Minor Computer Equipment 1,000 1,000 - 0.0%
62.0 - Supplies Total 2,000 1,500 (500) -25.0%63.0 - Contractual Services
63250 - Exterminator Service 1,000 1,000 - 0.0%63565 - Records Management Disposal Service 250 500 250 100.0%63598 - FSA Service Fees 100 100 - 0.0%63599 - EAP Service Fee 100 100 - 0.0%63672 - Laserfiche Support 7,000 7,500 500 7.1%63760 - Interpreting Services 2,500 2,500 - 0.0%
63.0 - Contractual Services Total 10,950 11,700 750 6.8%63.2 - Utilities
63126 - Exchange Hosting Services 300 300 - 0.0%63.2 - Utilities Total 300 300 - 0.0%
64.0 - Other Expenses64100 - Advertising/Public Notices 5,000 5,000 - 0.0%64200 - Conferences/Meetings 1,500 1,500 - 0.0%64210 - Board Meeting Supplies 3,000 3,000 - 0.0%64220 - Board Retreat 10,000 10,000 - 0.0%64250 - Training 1,000 1,000 - 0.0%64310 - Association Memberships 500 500 - 0.0%
64.0 - Other Expenses Total 21,000 21,000 - 0.0%64.4 - Insurance
64412 - Insurance - Crime 200 200 - 0.0%64415 - Insurance - Public Officials and Employment Liabil 400 400 - 0.0%
64.4 - Insurance Total 600 600 - 0.0%1140 - Clerk of the Board Total 168,600 175,300 6,700 4.0%
1200 - Finance Administration61.0 - Personnel Services
Page 44 of 122

Row Labels 2017-18 Budget
Proposed2018-19Budget
Increase/ (Decrease)
% Change
Salinas Valley RecyclesBudget Worksheets
FY 2018-19
61110 - Regular Pay 311,700 328,800 17,100 5.5%61120 - Paid Time Off 12,000 12,400 400 3.3%61130 - Safety Awards 200 200 - 0.0%61300 - Overtime - Regular 4,600 4,600 - 0.0%61400 - Education Assistance 5,250 6,000 750 14.3%61410 - Wellness Program 1,500 1,500 - 0.0%61600 - Other Payroll Costs 56,000 - (56,000) -100.0%61700 - Flexible Leave 5,200 5,300 100 1.9%61705 - Management Leave 3,900 4,000 100 2.6%61815 - Auto Allowance 6,000 6,000 - 0.0%61816 - Cell Phone 2,000 2,000 - 0.0%61822 - PERS Employer Classic 27,900 27,700 (200) -0.7%61825 - Medicare 4,800 5,100 300 6.3%61827 - PERS - 1959 Survivor Benefit 200 200 - 0.0%61829 - PERS Unfunded Liability Payment 8,400 8,200 (200) -2.4%61831 - Health Insurance 89,500 84,400 (5,100) -5.7%61832 - Health Insurance - Retired 1,000 1,000 - 0.0%61833 - Long-Term Disability 1,600 1,700 100 6.3%61834 - Unemployment 1,100 1,100 - 0.0%61836 - Life Insurance 800 900 100 12.5%61837 - Insurance - Workers Compensation 1,500 1,700 200 13.3%69810 - Transfers Out - OPEB Reserve 12,300 12,900 600 4.9%
61.0 - Personnel Services Total 557,450 515,700 (41,750) -7.5%62.0 - Supplies
62100 - Office Supplies & Materials 1,000 1,000 - 0.0%62800 - Special Dept Supplies 1,000 1,000 - 0.0%62810 - Software/License Renewals 5,000 5,000 - 0.0%62910 - Minor Capital Outlay 1,000 1,000 - 0.0%62915 - Minor Computer Equipment 1,000 1,000 - 0.0%
62.0 - Supplies Total 9,000 9,000 - 0.0%63.0 - Contractual Services
63430 - Equipment Maintenance 1,000 1,000 - 0.0%63530 - Audit Services 28,000 30,000 2,000 7.1%63535 - Actuarial Services 16,000 15,000 (1,000) -6.3%63570 - Bank of NY - Service Fees 7,000 7,000 - 0.0%63571 - Bond Continuing Disclosure Services 2,000 2,000 - 0.0%63588 - Credit Reports 1,500 2,000 500 33.3%63595 - Returned Check Expense 500 500 - 0.0%63596 - Bank Fees 4,000 5,000 1,000 25.0%63598 - FSA Service Fees 200 200 - 0.0%63599 - EAP Service Fee 300 300 - 0.0%63671 - Network Support 20,000 20,000 - 0.0%63674 - Plan-It Support 200 200 - 0.0%63675 - Website Hosting Service 1,000 1,000 - 0.0%63676 - INCODE Off Site Backup 2,000 2,000 - 0.0%63677 - INCODE Support 20,000 20,000 - 0.0%63680 - Symantec Support 2,500 2,500 - 0.0%63960 - Contingencies - 2,100 2,100 #DIV/0!
63.0 - Contractual Services Total 106,200 110,800 4,600 4.3%63.2 - Utilities
63125 - Internet Services 3,200 3,200 - 0.0%63126 - Exchange Hosting Services 400 400 - 0.0%63127 - Network Access 2,000 2,000 - 0.0%63150 - Overnight Shipments 500 500 - 0.0%
63.2 - Utilities Total 6,100 6,100 - 0.0%Page 45 of 122

Row Labels 2017-18 Budget
Proposed2018-19Budget
Increase/ (Decrease)
% Change
Salinas Valley RecyclesBudget Worksheets
FY 2018-19
64.0 - Other Expenses64200 - Conferences/Meetings 10,000 10,000 - 0.0%64250 - Training 3,000 3,000 - 0.0%64310 - Association Memberships 1,000 1,000 - 0.0%64320 - Publications & Trade Journals 1,000 1,000 - 0.0%64700 - Refunds & Reimbursement 1,000 1,000 - 0.0%
64.0 - Other Expenses Total 16,000 16,000 - 0.0%64.4 - Insurance
64410 - Insurance 51,000 20,000 (31,000) -60.8%64412 - Insurance - Crime 400 400 - 0.0%64415 - Insurance - Public Officials and Employment Liabil 1,100 1,200 100 9.1%64418 - Insurance - Surety Bond 2,800 2,800 - 0.0%
64.4 - Insurance Total 55,300 24,400 (30,900) -55.9%66.0 - Capital Outlay
66530 - Office Equipment 4,000 4,000 - 0.0%66.0 - Capital Outlay Total 4,000 4,000 - 0.0%
1200 - Finance Administration Total 754,050 686,000 (68,050) -9.0%1300 - Operations Administration
61.0 - Personnel Services61110 - Regular Pay 261,000 274,400 13,400 5.1%61120 - Paid Time Off 10,100 10,600 500 5.0%61400 - Education Assistance 3,500 4,000 500 14.3%61410 - Wellness Program 1,000 1,000 - 0.0%61705 - Management Leave 7,600 8,000 400 5.3%61815 - Auto Allowance 12,000 12,000 - 0.0%61816 - Cell Phone 2,500 2,500 - 0.0%61822 - PERS Employer Classic 13,500 13,100 (400) -3.0%61825 - Medicare 4,000 4,200 200 5.0%61827 - PERS - 1959 Survivor Benefit 100 100 - 0.0%61828 - PERS Employer PEPRA 7,300 8,200 900 12.3%61829 - PERS Unfunded Liability Payment 7,100 7,000 (100) -1.4%61831 - Health Insurance 52,600 49,600 (3,000) -5.7%61832 - Health Insurance - Retired 1,000 1,000 - 0.0%61833 - Long-Term Disability 1,400 1,400 - 0.0%61834 - Unemployment 700 700 - 0.0%61836 - Life Insurance 700 700 - 0.0%61837 - Insurance - Workers Compensation 1,300 1,400 100 7.7%69810 - Transfers Out - OPEB Reserve 10,300 11,000 700 6.8%
61.0 - Personnel Services Total 397,700 410,900 13,200 3.3%62.0 - Supplies
62100 - Office Supplies & Materials 1,200 1,200 - 0.0%62230 - Rolling Stock Supplies 1,300 1,300 - 0.0%62330 - Fuel 14,000 14,000 - 0.0%62800 - Special Dept Supplies 2,000 2,000 - 0.0%62810 - Software/License Renewals 4,000 4,000 - 0.0%62840 - Safety Supplies 1,000 1,000 - 0.0%
62.0 - Supplies Total 23,500 23,500 - 0.0%63.0 - Contractual Services
63410 - Vehicle Maintenance 1,500 500 (1,000) -66.7%63430 - Equipment Maintenance 2,500 2,500 - 0.0%63540 - Consulting Engineer 5,000 5,000 - 0.0%63598 - FSA Service Fees 120 120 - 0.0%63599 - EAP Service Fee 180 180 - 0.0%
63.0 - Contractual Services Total 9,300 8,300 (1,000) -10.8%63.2 - Utilities
Page 46 of 122

Row Labels 2017-18 Budget
Proposed2018-19Budget
Increase/ (Decrease)
% Change
Salinas Valley RecyclesBudget Worksheets
FY 2018-19
63116 - Cell Phones 1,000 1,000 - 0.0%63126 - Exchange Hosting Services 300 300 - 0.0%63150 - Overnight Shipments 1,000 1,000 - 0.0%
63.2 - Utilities Total 2,300 2,300 - 0.0%64.0 - Other Expenses
64200 - Conferences/Meetings 11,000 11,000 - 0.0%64240 - Employee Recognition 1,500 1,500 - 0.0%64250 - Training 4,000 4,000 - 0.0%64310 - Association Memberships 2,000 2,000 - 0.0%64320 - Publications & Trade Journals 1,000 1,000 - 0.0%
64.0 - Other Expenses Total 19,500 19,500 - 0.0%64.4 - Insurance
64411 - Insurance - Commercial Auto 700 800 100 14.3%64412 - Insurance - Crime 300 300 - 0.0%64415 - Insurance - Public Officials and Employment Liabil 800 800 - 0.0%
64.4 - Insurance Total 1,800 1,900 100 5.6%1300 - Operations Administration Total 454,100 466,400 12,300 2.7%
3100 - Scalehouse Operations61.0 - Personnel Services
61110 - Regular Pay 251,900 259,400 7,500 3.0%61120 - Paid Time Off 9,700 10,000 300 3.1%61130 - Safety Awards 800 800 - 0.0%61300 - Overtime - Regular 12,800 13,200 400 3.1%61400 - Education Assistance 7,000 8,000 1,000 14.3%61410 - Wellness Program 2,000 2,000 - 0.0%61700 - Flexible Leave 7,300 7,500 200 2.7%61822 - PERS Employer Classic 22,500 21,900 (600) -2.7%61825 - Medicare 4,000 4,100 100 2.5%61827 - PERS - 1959 Survivor Benefit 200 200 - 0.0%61829 - PERS Unfunded Liability Payment 6,800 6,600 (200) -2.9%61831 - Health Insurance 93,700 88,300 (5,400) -5.8%61833 - Long-Term Disability 1,400 1,400 - 0.0%61834 - Unemployment 1,400 1,400 - 0.0%61836 - Life Insurance 700 700 - 0.0%61837 - Insurance - Workers Compensation 24,200 27,400 3,200 13.2%69810 - Transfers Out - OPEB Reserve 9,900 10,400 500 5.1%
61.0 - Personnel Services Total 456,300 463,300 7,000 1.5%62.0 - Supplies
62100 - Office Supplies & Materials 3,000 3,000 - 0.0%62130 - Copier/Printer Supplies 1,000 1,000 - 0.0%62290 - Other Repair & Maintenance Supplies 2,000 1,000 (1,000) -50.0%62510 - Uniforms 1,000 2,000 1,000 100.0%62800 - Special Dept Supplies 2,000 2,000 - 0.0%62810 - Software/License Renewals 11,520 11,500 (20) -0.2%62840 - Safety Supplies 500 500 - 0.0%62910 - Minor Capital Outlay 500 500 - 0.0%
62.0 - Supplies Total 21,520 21,500 (20) -0.1%63.0 - Contractual Services
63416 - Building Alarm Service 2,500 2,500 - 0.0%63594 - Credit Card Fees 12,000 16,000 4,000 33.3%63596 - Bank Fees 5,000 4,000 (1,000) -20.0%63598 - FSA Service Fees 400 - (400) -100.0%63599 - EAP Service Fee 400 400 - 0.0%63604 - Courier Service 7,500 7,500 - 0.0%63673 - Paradigm Support 17,980 18,000 20 0.1%
Page 47 of 122

Row Labels 2017-18 Budget
Proposed2018-19Budget
Increase/ (Decrease)
% Change
Salinas Valley RecyclesBudget Worksheets
FY 2018-19
63920 - Scale Maintenance & Repair - JR 6,000 7,500 1,500 25.0%63921 - Scale Maintenance & Repair - JC 8,000 7,500 (500) -6.3%63922 - Scale Maintenance & Repair - SS 8,000 7,500 (500) -6.3%
63.0 - Contractual Services Total 67,780 70,900 3,120 4.6%63.2 - Utilities
63116 - Cell Phones 750 500 (250) -33.3%63125 - Internet Services 2,000 2,000 - 0.0%63210 - Water 500 - (500) -100.0%63240 - Portable Toilet 3,000 2,500 (500) -16.7%
63.2 - Utilities Total 6,250 5,000 (1,250) -20.0%64.0 - Other Expenses
63589 - Cash Over/Short 100 - (100) -100.0%64250 - Training 500 500 - 0.0%
64.0 - Other Expenses Total 600 500 (100) -16.7%64.4 - Insurance
64412 - Insurance - Crime 500 500 - 0.0%64415 - Insurance - Public Officials and Employment Liabil 1,500 1,600 100 6.7%
64.4 - Insurance Total 2,000 2,100 100 5.0%64.9 - Taxes and Permits
64905 - Mo.Co. LEA Fees - 700 700 #DIV/0!64.9 - Taxes and Permits Total - 700 700 #DIV/0!
3100 - Scalehouse Operations Total 554,450 564,000 9,550 1.7%105 - Administration Fund Total 3,071,950 3,065,400 (6,550) -0.2%
106 - AB939 Fund2100 - Resource Recovery
61.0 - Personnel Services61110 - Regular Pay 545,800 569,900 24,100 4.4%61120 - Paid Time Off 20,500 21,400 900 4.4%61130 - Safety Awards 1,000 1,000 - 0.0%61300 - Overtime - Regular 10,700 10,900 200 1.9%61400 - Education Assistance 10,500 12,000 1,500 14.3%61410 - Wellness Program 3,000 3,000 - 0.0%61700 - Flexible Leave 12,100 12,500 400 3.3%61705 - Management Leave 3,300 3,600 300 9.1%61815 - Auto Allowance 6,000 6,000 - 0.0%61816 - Cell Phone 2,500 2,500 - 0.0%61822 - PERS Employer Classic 42,200 41,400 (800) -1.9%61825 - Medicare 8,400 8,800 400 4.8%61826 - FICA 1,000 1,000 - 0.0%61827 - PERS - 1959 Survivor Benefit 300 300 - 0.0%61828 - PERS Employer PEPRA 3,800 4,300 500 13.2%61829 - PERS Unfunded Liability Payment 14,300 14,100 (200) -1.4%61831 - Health Insurance 160,400 151,300 (9,100) -5.7%61832 - Health Insurance - Retired 2,000 2,000 - 0.0%61833 - Long-Term Disability 2,800 3,000 200 7.1%61834 - Unemployment 2,300 2,300 - 0.0%61836 - Life Insurance 1,400 1,400 - 0.0%61837 - Insurance - Workers Compensation 2,900 3,300 400 13.8%69810 - Transfers Out - OPEB Reserve 22,000 23,500 1,500 6.8%
61.0 - Personnel Services Total 879,200 899,500 20,300 2.3%62.0 - Supplies
62100 - Office Supplies & Materials 2,500 2,500 - 0.0%62230 - Rolling Stock Supplies 850 1,000 150 17.6%62330 - Fuel 1,650 1,500 (150) -9.1%62800 - Special Dept Supplies 2,000 2,000 - 0.0%
Page 48 of 122
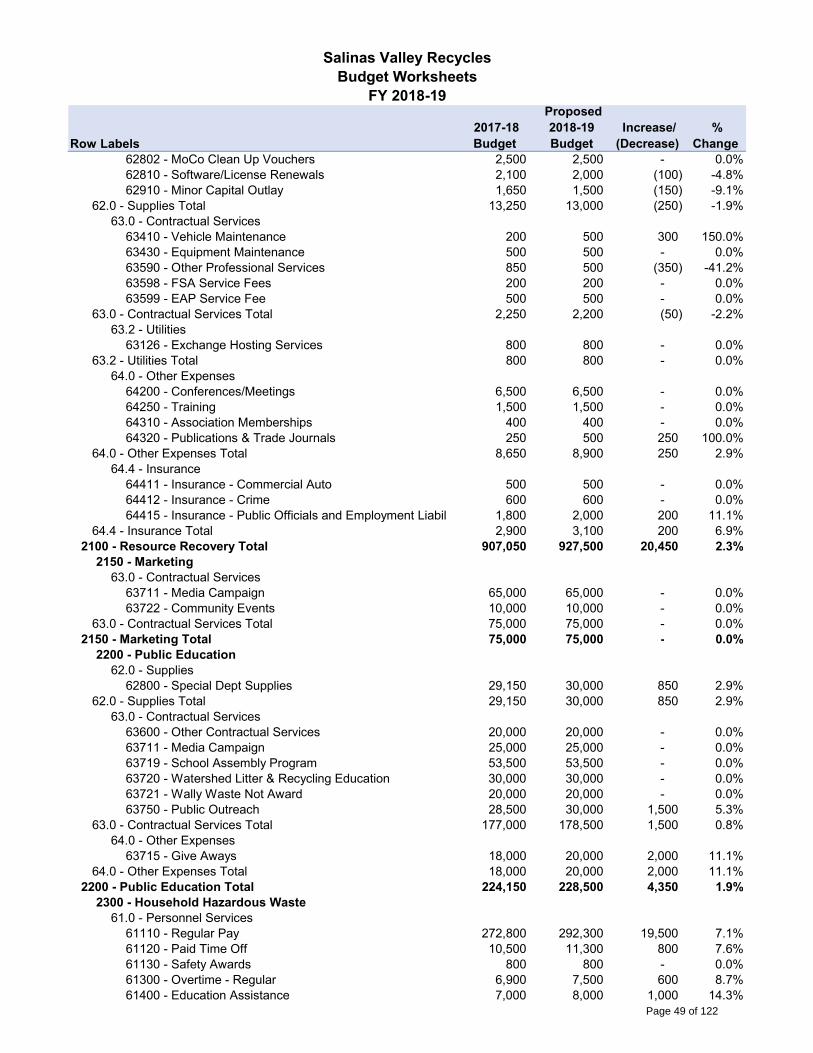
Row Labels 2017-18 Budget
Proposed2018-19Budget
Increase/ (Decrease)
% Change
Salinas Valley RecyclesBudget Worksheets
FY 2018-19
62802 - MoCo Clean Up Vouchers 2,500 2,500 - 0.0%62810 - Software/License Renewals 2,100 2,000 (100) -4.8%62910 - Minor Capital Outlay 1,650 1,500 (150) -9.1%
62.0 - Supplies Total 13,250 13,000 (250) -1.9%63.0 - Contractual Services
63410 - Vehicle Maintenance 200 500 300 150.0%63430 - Equipment Maintenance 500 500 - 0.0%63590 - Other Professional Services 850 500 (350) -41.2%63598 - FSA Service Fees 200 200 - 0.0%63599 - EAP Service Fee 500 500 - 0.0%
63.0 - Contractual Services Total 2,250 2,200 (50) -2.2%63.2 - Utilities
63126 - Exchange Hosting Services 800 800 - 0.0%63.2 - Utilities Total 800 800 - 0.0%
64.0 - Other Expenses64200 - Conferences/Meetings 6,500 6,500 - 0.0%64250 - Training 1,500 1,500 - 0.0%64310 - Association Memberships 400 400 - 0.0%64320 - Publications & Trade Journals 250 500 250 100.0%
64.0 - Other Expenses Total 8,650 8,900 250 2.9%64.4 - Insurance
64411 - Insurance - Commercial Auto 500 500 - 0.0%64412 - Insurance - Crime 600 600 - 0.0%64415 - Insurance - Public Officials and Employment Liabil 1,800 2,000 200 11.1%
64.4 - Insurance Total 2,900 3,100 200 6.9%2100 - Resource Recovery Total 907,050 927,500 20,450 2.3%
2150 - Marketing63.0 - Contractual Services
63711 - Media Campaign 65,000 65,000 - 0.0%63722 - Community Events 10,000 10,000 - 0.0%
63.0 - Contractual Services Total 75,000 75,000 - 0.0%2150 - Marketing Total 75,000 75,000 - 0.0%
2200 - Public Education62.0 - Supplies
62800 - Special Dept Supplies 29,150 30,000 850 2.9%62.0 - Supplies Total 29,150 30,000 850 2.9%
63.0 - Contractual Services63600 - Other Contractual Services 20,000 20,000 - 0.0%63711 - Media Campaign 25,000 25,000 - 0.0%63719 - School Assembly Program 53,500 53,500 - 0.0%63720 - Watershed Litter & Recycling Education 30,000 30,000 - 0.0%63721 - Wally Waste Not Award 20,000 20,000 - 0.0%63750 - Public Outreach 28,500 30,000 1,500 5.3%
63.0 - Contractual Services Total 177,000 178,500 1,500 0.8%64.0 - Other Expenses
63715 - Give Aways 18,000 20,000 2,000 11.1%64.0 - Other Expenses Total 18,000 20,000 2,000 11.1%
2200 - Public Education Total 224,150 228,500 4,350 1.9%2300 - Household Hazardous Waste
61.0 - Personnel Services61110 - Regular Pay 272,800 292,300 19,500 7.1%61120 - Paid Time Off 10,500 11,300 800 7.6%61130 - Safety Awards 800 800 - 0.0%61300 - Overtime - Regular 6,900 7,500 600 8.7%61400 - Education Assistance 7,000 8,000 1,000 14.3%
Page 49 of 122

Row Labels 2017-18 Budget
Proposed2018-19Budget
Increase/ (Decrease)
% Change
Salinas Valley RecyclesBudget Worksheets
FY 2018-19
61410 - Wellness Program 2,000 2,000 - 0.0%61700 - Flexible Leave 7,900 8,500 600 7.6%61816 - Cell Phone 700 700 - 0.0%61822 - PERS Employer Classic 24,400 24,600 200 0.8%61825 - Medicare 4,300 4,600 300 7.0%61827 - PERS - 1959 Survivor Benefit 200 200 - 0.0%61829 - PERS Unfunded Liability Payment 7,400 7,500 100 1.4%61831 - Health Insurance 112,200 105,800 (6,400) -5.7%61833 - Long-Term Disability 1,400 1,500 100 7.1%61834 - Unemployment 1,400 1,400 - 0.0%61836 - Life Insurance 700 800 100 14.3%61837 - Insurance - Workers Compensation 25,700 30,300 4,600 17.9%69810 - Transfers Out - OPEB Reserve 10,700 11,700 1,000 9.3%
61.0 - Personnel Services Total 497,000 519,500 22,500 4.5%62.0 - Supplies
62100 - Office Supplies & Materials 1,800 1,800 - 0.0%62230 - Rolling Stock Supplies 2,200 2,200 - 0.0%62330 - Fuel 5,600 5,600 - 0.0%62510 - Uniforms 1,000 1,000 - 0.0%62800 - Special Dept Supplies 4,000 4,000 - 0.0%62801 - Graffiti Removal Supplies 2,000 2,000 - 0.0%62810 - Software/License Renewals 200 200 - 0.0%62840 - Safety Supplies 6,000 7,500 1,500 25.0%62910 - Minor Capital Outlay 4,800 4,800 - 0.0%
62.0 - Supplies Total 27,600 29,100 1,500 5.4%63.0 - Contractual Services
63416 - Building Alarm Service 700 700 - 0.0%63430 - Equipment Maintenance 5,000 7,500 2,500 50.0%63522 - HR Investigations, Testing 1,000 1,000 - 0.0%63592 - Facility Maintenance 2,000 2,000 - 0.0%63598 - FSA Service Fees 120 120 - 0.0%63599 - EAP Service Fee 380 380 - 0.0%63613 - Contract Labor 2,500 2,500 - 0.0%
63.0 - Contractual Services Total 11,700 14,200 2,500 21.4%63.2 - Utilities
63120 - Telephone 3,800 3,800 - 0.0%63126 - Exchange Hosting Services 200 200 - 0.0%63230 - Gas & Electricity 17,000 18,000 1,000 5.9%
63.2 - Utilities Total 21,000 22,000 1,000 4.8%64.0 - Other Expenses
64200 - Conferences/Meetings 3,500 3,500 - 0.0%64250 - Training 1,500 1,500 - 0.0%64310 - Association Memberships 100 100 - 0.0%
64.0 - Other Expenses Total 5,100 5,100 - 0.0%64.4 - Insurance
64411 - Insurance - Commercial Auto 700 800 100 14.3%64412 - Insurance - Crime 500 500 - 0.0%64415 - Insurance - Public Officials and Employment Liabil 1,500 1,600 100 6.7%
64.4 - Insurance Total 2,700 2,900 200 7.4%64.5 - Hazardous Waste
63651 - HHW Hauling & Disposal 160,000 160,000 - 0.0%63653 - ABOP Disposal 5,000 5,000 - 0.0%63654 - Freon Removal 2,500 2,500 - 0.0%63655 - HHW Disposal Supplies 35,600 35,600 - 0.0%
64.5 - Hazardous Waste Total 203,100 203,100 - 0.0%Page 50 of 122
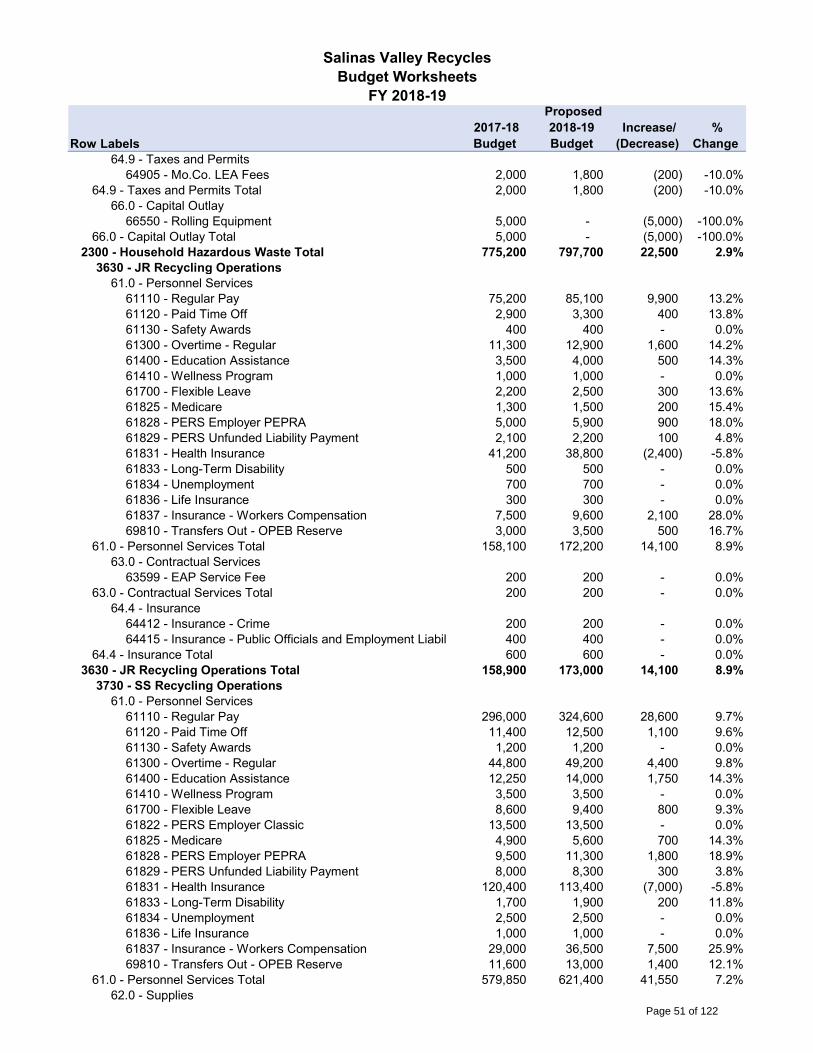
Row Labels 2017-18 Budget
Proposed2018-19Budget
Increase/ (Decrease)
% Change
Salinas Valley RecyclesBudget Worksheets
FY 2018-19
64.9 - Taxes and Permits64905 - Mo.Co. LEA Fees 2,000 1,800 (200) -10.0%
64.9 - Taxes and Permits Total 2,000 1,800 (200) -10.0%66.0 - Capital Outlay
66550 - Rolling Equipment 5,000 - (5,000) -100.0%66.0 - Capital Outlay Total 5,000 - (5,000) -100.0%
2300 - Household Hazardous Waste Total 775,200 797,700 22,500 2.9%3630 - JR Recycling Operations
61.0 - Personnel Services61110 - Regular Pay 75,200 85,100 9,900 13.2%61120 - Paid Time Off 2,900 3,300 400 13.8%61130 - Safety Awards 400 400 - 0.0%61300 - Overtime - Regular 11,300 12,900 1,600 14.2%61400 - Education Assistance 3,500 4,000 500 14.3%61410 - Wellness Program 1,000 1,000 - 0.0%61700 - Flexible Leave 2,200 2,500 300 13.6%61825 - Medicare 1,300 1,500 200 15.4%61828 - PERS Employer PEPRA 5,000 5,900 900 18.0%61829 - PERS Unfunded Liability Payment 2,100 2,200 100 4.8%61831 - Health Insurance 41,200 38,800 (2,400) -5.8%61833 - Long-Term Disability 500 500 - 0.0%61834 - Unemployment 700 700 - 0.0%61836 - Life Insurance 300 300 - 0.0%61837 - Insurance - Workers Compensation 7,500 9,600 2,100 28.0%69810 - Transfers Out - OPEB Reserve 3,000 3,500 500 16.7%
61.0 - Personnel Services Total 158,100 172,200 14,100 8.9%63.0 - Contractual Services
63599 - EAP Service Fee 200 200 - 0.0%63.0 - Contractual Services Total 200 200 - 0.0%
64.4 - Insurance64412 - Insurance - Crime 200 200 - 0.0%64415 - Insurance - Public Officials and Employment Liabil 400 400 - 0.0%
64.4 - Insurance Total 600 600 - 0.0%3630 - JR Recycling Operations Total 158,900 173,000 14,100 8.9%
3730 - SS Recycling Operations61.0 - Personnel Services
61110 - Regular Pay 296,000 324,600 28,600 9.7%61120 - Paid Time Off 11,400 12,500 1,100 9.6%61130 - Safety Awards 1,200 1,200 - 0.0%61300 - Overtime - Regular 44,800 49,200 4,400 9.8%61400 - Education Assistance 12,250 14,000 1,750 14.3%61410 - Wellness Program 3,500 3,500 - 0.0%61700 - Flexible Leave 8,600 9,400 800 9.3%61822 - PERS Employer Classic 13,500 13,500 - 0.0%61825 - Medicare 4,900 5,600 700 14.3%61828 - PERS Employer PEPRA 9,500 11,300 1,800 18.9%61829 - PERS Unfunded Liability Payment 8,000 8,300 300 3.8%61831 - Health Insurance 120,400 113,400 (7,000) -5.8%61833 - Long-Term Disability 1,700 1,900 200 11.8%61834 - Unemployment 2,500 2,500 - 0.0%61836 - Life Insurance 1,000 1,000 - 0.0%61837 - Insurance - Workers Compensation 29,000 36,500 7,500 25.9%69810 - Transfers Out - OPEB Reserve 11,600 13,000 1,400 12.1%
61.0 - Personnel Services Total 579,850 621,400 41,550 7.2%62.0 - Supplies
Page 51 of 122

Row Labels 2017-18 Budget
Proposed2018-19Budget
Increase/ (Decrease)
% Change
Salinas Valley RecyclesBudget Worksheets
FY 2018-19
62800 - Special Dept Supplies 2,600 2,600 - 0.0%62840 - Safety Supplies 2,500 2,500 - 0.0%
62.0 - Supplies Total 5,100 5,100 - 0.0%63.0 - Contractual Services
63599 - EAP Service Fee 600 600 - 0.0%63613 - Contract Labor 32,500 40,000 7,500 23.1%
63.0 - Contractual Services Total 33,100 40,600 7,500 22.7%63.1 - Operating Contracts
63636 - Diversion Assistance Fee-SS 75,000 82,500 7,500 10.0%63.1 - Operating Contracts Total 75,000 82,500 7,500 10.0%
64.4 - Insurance64412 - Insurance - Crime 800 900 100 12.5%64415 - Insurance - Public Officials and Employment Liabil 2,600 2,800 200 7.7%
64.4 - Insurance Total 3,400 3,700 300 8.8%64.9 - Taxes and Permits
63905 - Fees & Permits 3,700 3,700 - 0.0%64.9 - Taxes and Permits Total 3,700 3,700 - 0.0%
3730 - SS Recycling Operations Total 700,150 757,000 56,850 8.1%4530 - JC Recycling Operations
61.0 - Personnel Services61110 - Regular Pay 142,500 161,300 18,800 13.2%61120 - Paid Time Off 5,500 6,300 800 14.5%61130 - Safety Awards 800 800 - 0.0%61300 - Overtime - Regular 21,600 24,400 2,800 13.0%61400 - Education Assistance 7,000 8,000 1,000 14.3%61410 - Wellness Program 2,000 2,000 - 0.0%61700 - Flexible Leave 4,200 4,700 500 11.9%61825 - Medicare 2,400 2,800 400 16.7%61827 - PERS - 1959 Survivor Benefit 100 100 - 0.0%61828 - PERS Employer PEPRA 9,400 11,100 1,700 18.1%61829 - PERS Unfunded Liability Payment 3,900 4,100 200 5.1%61831 - Health Insurance 68,000 64,100 (3,900) -5.7%61833 - Long-Term Disability 800 1,000 200 25.0%61834 - Unemployment 1,400 1,400 - 0.0%61836 - Life Insurance 500 500 - 0.0%61837 - Insurance - Workers Compensation 14,100 18,100 4,000 28.4%69810 - Transfers Out - OPEB Reserve 5,600 6,500 900 16.1%
61.0 - Personnel Services Total 289,800 317,200 27,400 9.5%62.0 - Supplies
62290 - Other Repair & Maintenance Supplies 4,000 4,000 - 0.0%62335 - Biodiesel Fuel 20,000 25,000 5,000 25.0%62800 - Special Dept Supplies 5,400 7,500 2,100 38.9%62850 - Small Tools 7,500 7,500 - 0.0%
62.0 - Supplies Total 36,900 44,000 7,100 19.2%63.0 - Contractual Services
63410 - Vehicle Maintenance 2,000 2,000 - 0.0%63430 - Equipment Maintenance 8,000 5,000 (3,000) -37.5%63440 - Equipment Rental 3,000 3,000 - 0.0%63592 - Facility Maintenance 3,000 3,000 - 0.0%63599 - EAP Service Fee 400 400 - 0.0%63613 - Contract Labor 4,500 4,500 - 0.0%63960 - Contingencies 10,000 10,000 - 0.0%
63.0 - Contractual Services Total 30,900 27,900 (3,000) -9.7%63.2 - Utilities
63116 - Cell Phones 800 800 - 0.0%Page 52 of 122
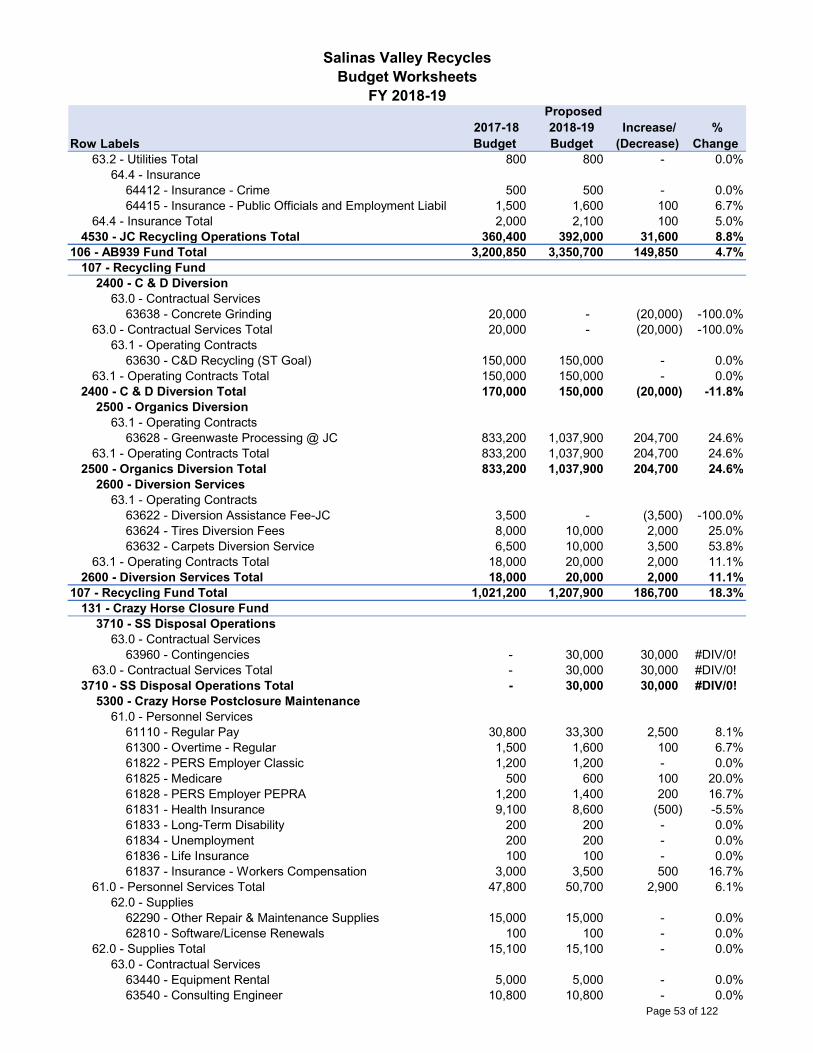
Row Labels 2017-18 Budget
Proposed2018-19Budget
Increase/ (Decrease)
% Change
Salinas Valley RecyclesBudget Worksheets
FY 2018-19
63.2 - Utilities Total 800 800 - 0.0%64.4 - Insurance
64412 - Insurance - Crime 500 500 - 0.0%64415 - Insurance - Public Officials and Employment Liabil 1,500 1,600 100 6.7%
64.4 - Insurance Total 2,000 2,100 100 5.0%4530 - JC Recycling Operations Total 360,400 392,000 31,600 8.8%
106 - AB939 Fund Total 3,200,850 3,350,700 149,850 4.7%107 - Recycling Fund
2400 - C & D Diversion63.0 - Contractual Services
63638 - Concrete Grinding 20,000 - (20,000) -100.0%63.0 - Contractual Services Total 20,000 - (20,000) -100.0%
63.1 - Operating Contracts63630 - C&D Recycling (ST Goal) 150,000 150,000 - 0.0%
63.1 - Operating Contracts Total 150,000 150,000 - 0.0%2400 - C & D Diversion Total 170,000 150,000 (20,000) -11.8%
2500 - Organics Diversion63.1 - Operating Contracts
63628 - Greenwaste Processing @ JC 833,200 1,037,900 204,700 24.6%63.1 - Operating Contracts Total 833,200 1,037,900 204,700 24.6%
2500 - Organics Diversion Total 833,200 1,037,900 204,700 24.6%2600 - Diversion Services
63.1 - Operating Contracts63622 - Diversion Assistance Fee-JC 3,500 - (3,500) -100.0%63624 - Tires Diversion Fees 8,000 10,000 2,000 25.0%63632 - Carpets Diversion Service 6,500 10,000 3,500 53.8%
63.1 - Operating Contracts Total 18,000 20,000 2,000 11.1%2600 - Diversion Services Total 18,000 20,000 2,000 11.1%
107 - Recycling Fund Total 1,021,200 1,207,900 186,700 18.3%131 - Crazy Horse Closure Fund
3710 - SS Disposal Operations63.0 - Contractual Services
63960 - Contingencies - 30,000 30,000 #DIV/0!63.0 - Contractual Services Total - 30,000 30,000 #DIV/0!
3710 - SS Disposal Operations Total - 30,000 30,000 #DIV/0!5300 - Crazy Horse Postclosure Maintenance
61.0 - Personnel Services61110 - Regular Pay 30,800 33,300 2,500 8.1%61300 - Overtime - Regular 1,500 1,600 100 6.7%61822 - PERS Employer Classic 1,200 1,200 - 0.0%61825 - Medicare 500 600 100 20.0%61828 - PERS Employer PEPRA 1,200 1,400 200 16.7%61831 - Health Insurance 9,100 8,600 (500) -5.5%61833 - Long-Term Disability 200 200 - 0.0%61834 - Unemployment 200 200 - 0.0%61836 - Life Insurance 100 100 - 0.0%61837 - Insurance - Workers Compensation 3,000 3,500 500 16.7%
61.0 - Personnel Services Total 47,800 50,700 2,900 6.1%62.0 - Supplies
62290 - Other Repair & Maintenance Supplies 15,000 15,000 - 0.0%62810 - Software/License Renewals 100 100 - 0.0%
62.0 - Supplies Total 15,100 15,100 - 0.0%63.0 - Contractual Services
63440 - Equipment Rental 5,000 5,000 - 0.0%63540 - Consulting Engineer 10,800 10,800 - 0.0%
Page 53 of 122
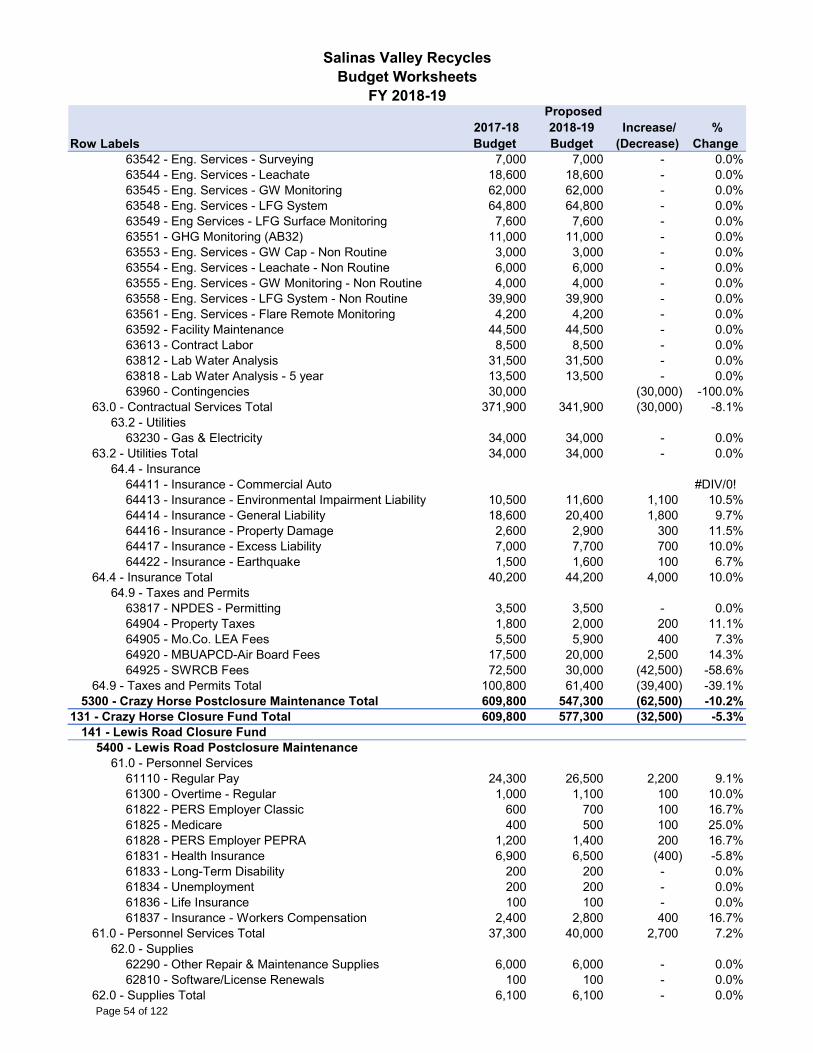
Row Labels 2017-18 Budget
Proposed2018-19Budget
Increase/ (Decrease)
% Change
Salinas Valley RecyclesBudget Worksheets
FY 2018-19
63542 - Eng. Services - Surveying 7,000 7,000 - 0.0%63544 - Eng. Services - Leachate 18,600 18,600 - 0.0%63545 - Eng. Services - GW Monitoring 62,000 62,000 - 0.0%63548 - Eng. Services - LFG System 64,800 64,800 - 0.0%63549 - Eng Services - LFG Surface Monitoring 7,600 7,600 - 0.0%63551 - GHG Monitoring (AB32) 11,000 11,000 - 0.0%63553 - Eng. Services - GW Cap - Non Routine 3,000 3,000 - 0.0%63554 - Eng. Services - Leachate - Non Routine 6,000 6,000 - 0.0%63555 - Eng. Services - GW Monitoring - Non Routine 4,000 4,000 - 0.0%63558 - Eng. Services - LFG System - Non Routine 39,900 39,900 - 0.0%63561 - Eng. Services - Flare Remote Monitoring 4,200 4,200 - 0.0%63592 - Facility Maintenance 44,500 44,500 - 0.0%63613 - Contract Labor 8,500 8,500 - 0.0%63812 - Lab Water Analysis 31,500 31,500 - 0.0%63818 - Lab Water Analysis - 5 year 13,500 13,500 - 0.0%63960 - Contingencies 30,000 (30,000) -100.0%
63.0 - Contractual Services Total 371,900 341,900 (30,000) -8.1%63.2 - Utilities
63230 - Gas & Electricity 34,000 34,000 - 0.0%63.2 - Utilities Total 34,000 34,000 - 0.0%
64.4 - Insurance64411 - Insurance - Commercial Auto #DIV/0!64413 - Insurance - Environmental Impairment Liability 10,500 11,600 1,100 10.5%64414 - Insurance - General Liability 18,600 20,400 1,800 9.7%64416 - Insurance - Property Damage 2,600 2,900 300 11.5%64417 - Insurance - Excess Liability 7,000 7,700 700 10.0%64422 - Insurance - Earthquake 1,500 1,600 100 6.7%
64.4 - Insurance Total 40,200 44,200 4,000 10.0%64.9 - Taxes and Permits
63817 - NPDES - Permitting 3,500 3,500 - 0.0%64904 - Property Taxes 1,800 2,000 200 11.1%64905 - Mo.Co. LEA Fees 5,500 5,900 400 7.3%64920 - MBUAPCD-Air Board Fees 17,500 20,000 2,500 14.3%64925 - SWRCB Fees 72,500 30,000 (42,500) -58.6%
64.9 - Taxes and Permits Total 100,800 61,400 (39,400) -39.1%5300 - Crazy Horse Postclosure Maintenance Total 609,800 547,300 (62,500) -10.2%
131 - Crazy Horse Closure Fund Total 609,800 577,300 (32,500) -5.3%141 - Lewis Road Closure Fund
5400 - Lewis Road Postclosure Maintenance61.0 - Personnel Services
61110 - Regular Pay 24,300 26,500 2,200 9.1%61300 - Overtime - Regular 1,000 1,100 100 10.0%61822 - PERS Employer Classic 600 700 100 16.7%61825 - Medicare 400 500 100 25.0%61828 - PERS Employer PEPRA 1,200 1,400 200 16.7%61831 - Health Insurance 6,900 6,500 (400) -5.8%61833 - Long-Term Disability 200 200 - 0.0%61834 - Unemployment 200 200 - 0.0%61836 - Life Insurance 100 100 - 0.0%61837 - Insurance - Workers Compensation 2,400 2,800 400 16.7%
61.0 - Personnel Services Total 37,300 40,000 2,700 7.2%62.0 - Supplies
62290 - Other Repair & Maintenance Supplies 6,000 6,000 - 0.0%62810 - Software/License Renewals 100 100 - 0.0%
62.0 - Supplies Total 6,100 6,100 - 0.0%Page 54 of 122

Row Labels 2017-18 Budget
Proposed2018-19Budget
Increase/ (Decrease)
% Change
Salinas Valley RecyclesBudget Worksheets
FY 2018-19
63.0 - Contractual Services63430 - Equipment Maintenance 1,500 1,500 - 0.0%63440 - Equipment Rental 1,500 1,500 - 0.0%63542 - Eng. Services - Surveying 5,000 5,000 - 0.0%63545 - Eng. Services - GW Monitoring 14,400 13,500 (900) -6.3%63548 - Eng. Services - LFG System 50,400 50,400 - 0.0%63551 - GHG Monitoring (AB32) 5,000 5,000 - 0.0%63555 - Eng. Services - GW Monitoring - Non Routine - 4,000 4,000 #DIV/0!63558 - Eng. Services - LFG System - Non Routine 13,900 15,000 1,100 7.9%63561 - Eng. Services - Flare Remote Monitoring 4,200 4,200 - 0.0%63613 - Contract Labor 400 1,500 1,100 275.0%63615 - Hauling Services 600 600 - 0.0%63812 - Lab Water Analysis 8,100 5,000 (3,100) -38.3%63815 - Site Grading 1,000 2,000 1,000 100.0%63960 - Contingencies 1,000 11,500 10,500 1050.0%
63.0 - Contractual Services Total 107,000 120,700 13,700 12.8%63.2 - Utilities
63230 - Gas & Electricity 5,200 5,200 - 0.0%63.2 - Utilities Total 5,200 5,200 - 0.0%
64.4 - Insurance64413 - Insurance - Environmental Impairment Liability 8,200 9,000 800 9.8%64414 - Insurance - General Liability 14,400 15,800 1,400 9.7%64416 - Insurance - Property Damage 800 900 100 12.5%64417 - Insurance - Excess Liability 5,400 6,000 600 11.1%64422 - Insurance - Earthquake 400 500 100 25.0%
64.4 - Insurance Total 29,200 32,200 3,000 10.3%64.9 - Taxes and Permits
63817 - NPDES - Permitting 100 100 - 0.0%64904 - Property Taxes 2,500 2,800 300 12.0%64905 - Mo.Co. LEA Fees 4,900 3,200 (1,700) -34.7%64920 - MBUAPCD-Air Board Fees 9,500 10,000 500 5.3%64925 - SWRCB Fees 24,700 30,000 5,300 21.5%
64.9 - Taxes and Permits Total 41,700 46,100 4,400 10.6%5400 - Lewis Road Postclosure Maintenance Total 226,500 250,300 23,800 10.5%
141 - Lewis Road Closure Fund Total 226,500 250,300 23,800 10.5%150 - Johnson Cyn Project Fund
4500 - JC Landfill Operations61.0 - Personnel Services
61110 - Regular Pay 322,000 332,000 10,000 3.1%61120 - Paid Time Off 14,200 14,600 400 2.8%61130 - Safety Awards 1,000 1,000 - 0.0%61300 - Overtime - Regular 41,700 43,000 1,300 3.1%61400 - Education Assistance 8,750 10,000 1,250 14.3%61410 - Wellness Program 2,500 2,500 - 0.0%61700 - Flexible Leave 10,700 11,000 300 2.8%61816 - Cell Phone 900 900 - 0.0%61822 - PERS Employer Classic 5,300 5,200 (100) -1.9%61825 - Medicare 5,100 5,700 600 11.8%61827 - PERS - 1959 Survivor Benefit 300 300 - 0.0%61828 - PERS Employer PEPRA 17,200 18,600 1,400 8.1%61829 - PERS Unfunded Liability Payment 9,900 9,600 (300) -3.0%61831 - Health Insurance 93,100 87,700 (5,400) -5.8%61833 - Long-Term Disability 1,700 1,900 200 11.8%61834 - Unemployment 1,700 1,700 - 0.0%61836 - Life Insurance 900 900 - 0.0%
Page 55 of 122

Row Labels 2017-18 Budget
Proposed2018-19Budget
Increase/ (Decrease)
% Change
Salinas Valley RecyclesBudget Worksheets
FY 2018-19
61837 - Insurance - Workers Compensation 30,800 36,800 6,000 19.5%69810 - Transfers Out - OPEB Reserve 14,500 15,200 700 4.8%
61.0 - Personnel Services Total 582,250 598,600 16,350 2.8%62.0 - Supplies
62100 - Office Supplies & Materials 1,830 1,900 70 3.8%62140 - Janitorial Supplies 2,000 2,000 - 0.0%62230 - Vehicle Supplies 2,500 2,500 - 0.0%62290 - Other Repair & Maintenance Supplies 8,500 10,000 1,500 17.6%62330 - Fuel 31,500 35,000 3,500 11.1%62335 - Biodiesel Fuel 194,000 194,000 - 0.0%62510 - Uniforms 2,500 4,500 2,000 80.0%62800 - Special Dept Supplies 64,200 64,200 - 0.0%62810 - Software/License Renewals 470 500 30 6.4%62840 - Safety Supplies 7,500 7,500 - 0.0%62850 - Small Tools 7,500 7,500 - 0.0%62910 - Minor Capital Outlay 35,000 35,000 - 0.0%
62.0 - Supplies Total 357,500 364,600 7,100 2.0%63.0 - Contractual Services
63250 - Exterminator Service 1,200 1,000 (200) -16.7%63410 - Vehicle Maintenance 30,000 25,000 (5,000) -16.7%63416 - Building Alarm Service 1,500 1,500 - 0.0%63430 - Equipment Maintenance 306,600 300,000 (6,600) -2.2%63440 - Equipment Rental 25,000 25,000 - 0.0%63522 - HR Investigations, Testing 1,000 1,000 - 0.0%63540 - Consulting Engineer 10,000 10,000 - 0.0%63542 - Eng. Services - Surveying 19,400 19,400 - 0.0%63543 - Aerial Topography 8,500 8,500 - 0.0%63560 - Custodial Service 5,300 5,300 - 0.0%63592 - Facility Maintenance 13,000 25,000 12,000 92.3%63593 - Landscape Maintenance 2,000 2,000 - 0.0%63598 - FSA Service Fees 100 100 - 0.0%63599 - EAP Service Fee 500 500 - 0.0%63613 - Contract Labor 160,000 160,000 - 0.0%63615 - Hauling Services 2,000 2,000 - 0.0%63960 - Contingencies 20,100 20,100 - 0.0%
63.0 - Contractual Services Total 606,200 606,400 200 0.0%63.1 - Operating Contracts
63850 - Gonzales Host Fees 250,000 250,000 - 0.0%63.1 - Operating Contracts Total 250,000 250,000 - 0.0%
63.2 - Utilities63116 - Cell Phones 6,500 6,500 - 0.0%63126 - Exchange Hosting Services 200 200 - 0.0%63210 - Water 12,300 12,300 - 0.0%63230 - Gas & Electricity 300 300 - 0.0%63240 - Portable Toilet 6,500 7,500 1,000 15.4%
63.2 - Utilities Total 25,800 26,800 1,000 3.9%64.0 - Other Expenses
64250 - Training 1,100 1,100 - 0.0%64.0 - Other Expenses Total 1,100 1,100 - 0.0%
64.4 - Insurance64411 - Insurance - Commercial Auto 3,400 3,700 300 8.8%64412 - Insurance - Crime 600 600 - 0.0%64413 - Insurance - Environmental Impairment Liability 10,700 11,800 1,100 10.3%64414 - Insurance - General Liability 18,900 20,800 1,900 10.1%64415 - Insurance - Public Officials and Employment Liabil 1,800 2,000 200 11.1%
Page 56 of 122
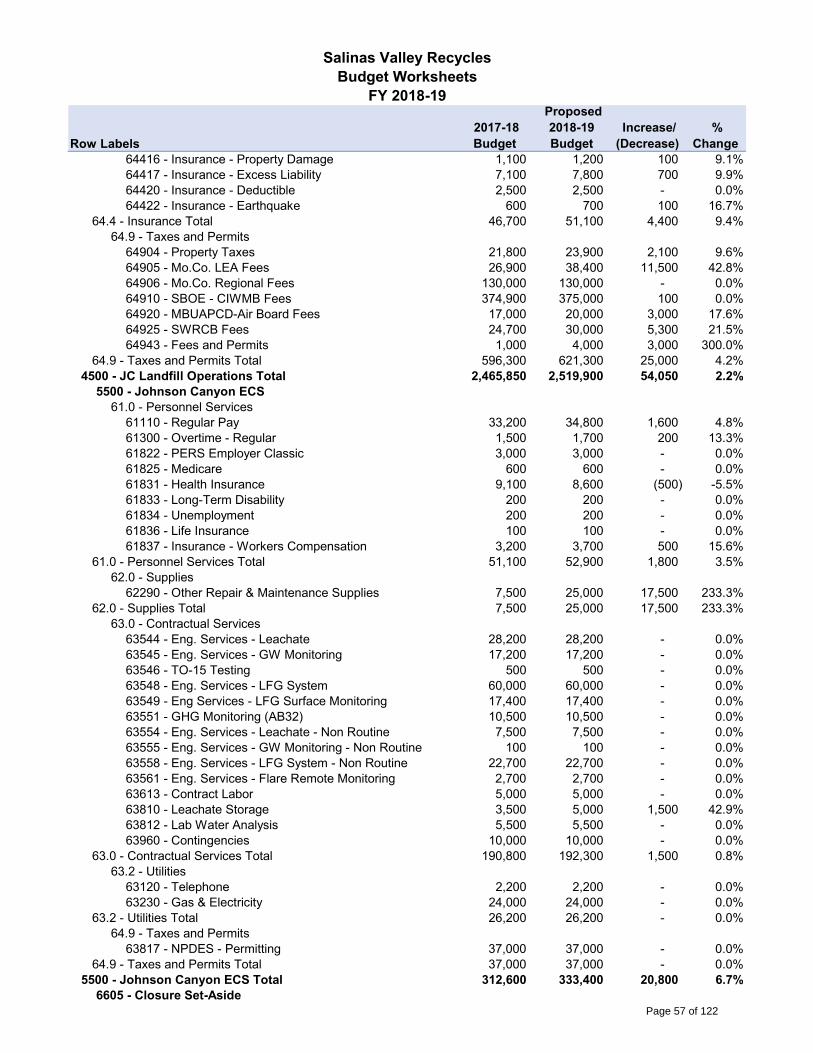
Row Labels 2017-18 Budget
Proposed2018-19Budget
Increase/ (Decrease)
% Change
Salinas Valley RecyclesBudget Worksheets
FY 2018-19
64416 - Insurance - Property Damage 1,100 1,200 100 9.1%64417 - Insurance - Excess Liability 7,100 7,800 700 9.9%64420 - Insurance - Deductible 2,500 2,500 - 0.0%64422 - Insurance - Earthquake 600 700 100 16.7%
64.4 - Insurance Total 46,700 51,100 4,400 9.4%64.9 - Taxes and Permits
64904 - Property Taxes 21,800 23,900 2,100 9.6%64905 - Mo.Co. LEA Fees 26,900 38,400 11,500 42.8%64906 - Mo.Co. Regional Fees 130,000 130,000 - 0.0%64910 - SBOE - CIWMB Fees 374,900 375,000 100 0.0%64920 - MBUAPCD-Air Board Fees 17,000 20,000 3,000 17.6%64925 - SWRCB Fees 24,700 30,000 5,300 21.5%64943 - Fees and Permits 1,000 4,000 3,000 300.0%
64.9 - Taxes and Permits Total 596,300 621,300 25,000 4.2%4500 - JC Landfill Operations Total 2,465,850 2,519,900 54,050 2.2%
5500 - Johnson Canyon ECS61.0 - Personnel Services
61110 - Regular Pay 33,200 34,800 1,600 4.8%61300 - Overtime - Regular 1,500 1,700 200 13.3%61822 - PERS Employer Classic 3,000 3,000 - 0.0%61825 - Medicare 600 600 - 0.0%61831 - Health Insurance 9,100 8,600 (500) -5.5%61833 - Long-Term Disability 200 200 - 0.0%61834 - Unemployment 200 200 - 0.0%61836 - Life Insurance 100 100 - 0.0%61837 - Insurance - Workers Compensation 3,200 3,700 500 15.6%
61.0 - Personnel Services Total 51,100 52,900 1,800 3.5%62.0 - Supplies
62290 - Other Repair & Maintenance Supplies 7,500 25,000 17,500 233.3%62.0 - Supplies Total 7,500 25,000 17,500 233.3%
63.0 - Contractual Services63544 - Eng. Services - Leachate 28,200 28,200 - 0.0%63545 - Eng. Services - GW Monitoring 17,200 17,200 - 0.0%63546 - TO-15 Testing 500 500 - 0.0%63548 - Eng. Services - LFG System 60,000 60,000 - 0.0%63549 - Eng Services - LFG Surface Monitoring 17,400 17,400 - 0.0%63551 - GHG Monitoring (AB32) 10,500 10,500 - 0.0%63554 - Eng. Services - Leachate - Non Routine 7,500 7,500 - 0.0%63555 - Eng. Services - GW Monitoring - Non Routine 100 100 - 0.0%63558 - Eng. Services - LFG System - Non Routine 22,700 22,700 - 0.0%63561 - Eng. Services - Flare Remote Monitoring 2,700 2,700 - 0.0%63613 - Contract Labor 5,000 5,000 - 0.0%63810 - Leachate Storage 3,500 5,000 1,500 42.9%63812 - Lab Water Analysis 5,500 5,500 - 0.0%63960 - Contingencies 10,000 10,000 - 0.0%
63.0 - Contractual Services Total 190,800 192,300 1,500 0.8%63.2 - Utilities
63120 - Telephone 2,200 2,200 - 0.0%63230 - Gas & Electricity 24,000 24,000 - 0.0%
63.2 - Utilities Total 26,200 26,200 - 0.0%64.9 - Taxes and Permits
63817 - NPDES - Permitting 37,000 37,000 - 0.0%64.9 - Taxes and Permits Total 37,000 37,000 - 0.0%
5500 - Johnson Canyon ECS Total 312,600 333,400 20,800 6.7%6605 - Closure Set-Aside
Page 57 of 122

Row Labels 2017-18 Budget
Proposed2018-19Budget
Increase/ (Decrease)
% Change
Salinas Valley RecyclesBudget Worksheets
FY 2018-19
67.0 - Closure/Postclosure69520 - Transfers Out - Closure Costs 248,500 268,300 19,800 8.0%
67.0 - Closure/Postclosure Total 248,500 268,300 19,800 8.0%6605 - Closure Set-Aside Total 248,500 268,300 19,800 8.0%
150 - Johnson Cyn Project Fund Total 3,026,950 3,121,600 94,650 3.1%160 - Jolon Road Project Fund
3600 - JR Transfer Station61.0 - Personnel Services
61110 - Regular Pay 78,900 88,600 9,700 12.3%61120 - Paid Time Off 2,700 3,100 400 14.8%61130 - Safety Awards 200 200 - 0.0%61300 - Overtime - Regular 10,700 12,100 1,400 13.1%61400 - Education Assistance 1,750 2,000 250 14.3%61410 - Wellness Program 500 500 - 0.0%61700 - Flexible Leave 2,000 2,300 300 15.0%61822 - PERS Employer Classic 7,100 7,500 400 5.6%61825 - Medicare 1,300 1,600 300 23.1%61829 - PERS Unfunded Liability Payment 1,900 2,000 100 5.3%61831 - Health Insurance 32,100 30,300 (1,800) -5.6%61833 - Long-Term Disability 500 600 100 20.0%61834 - Unemployment 400 400 - 0.0%61836 - Life Insurance 200 300 100 50.0%61837 - Insurance - Workers Compensation 7,600 9,900 2,300 30.3%69810 - Transfers Out - OPEB Reserve 2,700 3,200 500 18.5%
61.0 - Personnel Services Total 150,550 164,600 14,050 9.3%62.0 - Supplies
62100 - Office Supplies & Materials 800 800 - 0.0%62230 - Vehicle Supplies 2,000 2,000 - 0.0%62330 - Fuel 14,000 14,000 - 0.0%62335 - Biodiesel Fuel 10,000 10,000 - 0.0%62510 - Uniforms 2,500 2,500 - 0.0%62800 - Special Dept Supplies 4,000 4,000 - 0.0%62840 - Safety Supplies 2,000 2,000 - 0.0%62850 - Small Tools 1,000 1,000 - 0.0%62910 - Minor Capital Outlay 2,000 2,000 - 0.0%
62.0 - Supplies Total 38,300 38,300 - 0.0%63.0 - Contractual Services
63410 - Vehicle Maintenance 25,000 25,000 - 0.0%63416 - Building Alarm Service 2,000 2,000 - 0.0%63430 - Equipment Maintenance 15,000 10,000 (5,000) -33.3%63440 - Equipment Rental 5,000 5,000 - 0.0%63522 - HR Investigations, Testing 1,000 1,000 - 0.0%63592 - Facility Maintenance 25,000 25,000 - 0.0%63599 - EAP Service Fee 200 200 - 0.0%63613 - Contract Labor 11,500 25,000 13,500 117.4%63960 - Contingencies 44,300 35,000 (9,300) -21.0%
63.0 - Contractual Services Total 129,000 128,200 (800) -0.6%63.2 - Utilities
63116 - Cell Phones 1,800 1,800 - 0.0%63210 - Water 11,200 11,200 - 0.0%63230 - Gas & Electricity 6,000 6,000 - 0.0%63240 - Portable Toilet 2,500 2,500 - 0.0%
63.2 - Utilities Total 21,500 21,500 - 0.0%64.4 - Insurance
64411 - Insurance - Commercial Auto 1,700 1,800 100 5.9%Page 58 of 122
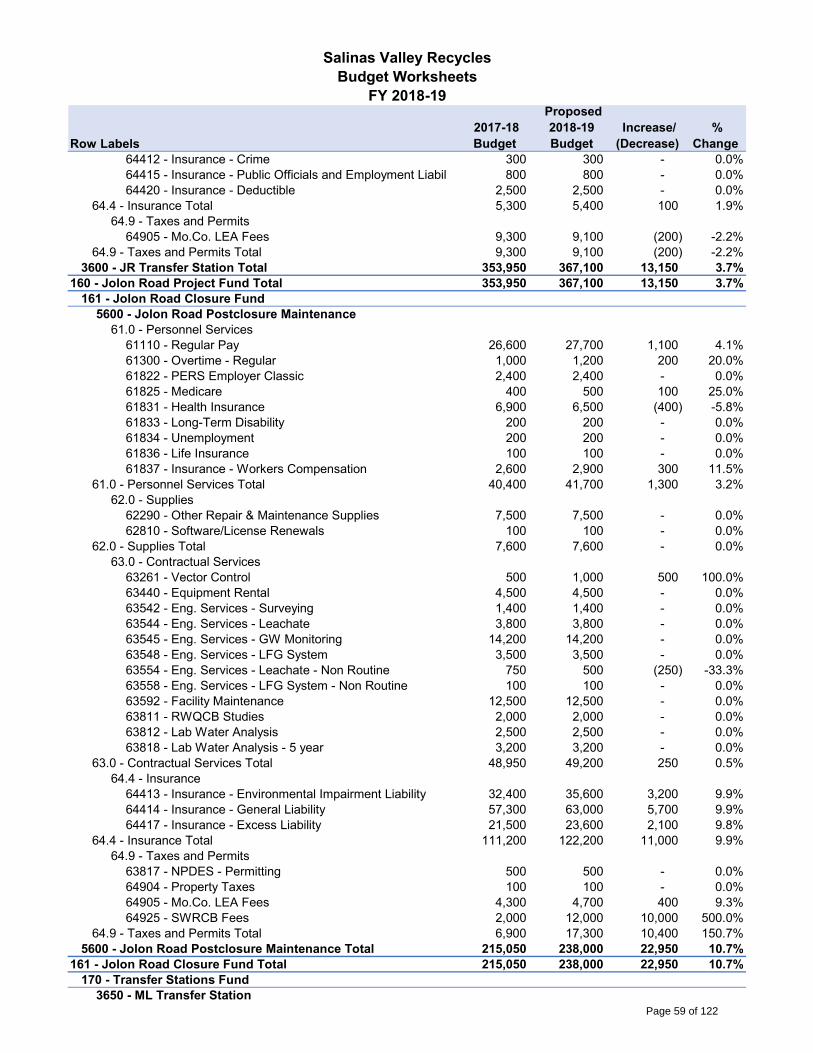
Row Labels 2017-18 Budget
Proposed2018-19Budget
Increase/ (Decrease)
% Change
Salinas Valley RecyclesBudget Worksheets
FY 2018-19
64412 - Insurance - Crime 300 300 - 0.0%64415 - Insurance - Public Officials and Employment Liabil 800 800 - 0.0%64420 - Insurance - Deductible 2,500 2,500 - 0.0%
64.4 - Insurance Total 5,300 5,400 100 1.9%64.9 - Taxes and Permits
64905 - Mo.Co. LEA Fees 9,300 9,100 (200) -2.2%64.9 - Taxes and Permits Total 9,300 9,100 (200) -2.2%
3600 - JR Transfer Station Total 353,950 367,100 13,150 3.7%160 - Jolon Road Project Fund Total 353,950 367,100 13,150 3.7%
161 - Jolon Road Closure Fund5600 - Jolon Road Postclosure Maintenance
61.0 - Personnel Services61110 - Regular Pay 26,600 27,700 1,100 4.1%61300 - Overtime - Regular 1,000 1,200 200 20.0%61822 - PERS Employer Classic 2,400 2,400 - 0.0%61825 - Medicare 400 500 100 25.0%61831 - Health Insurance 6,900 6,500 (400) -5.8%61833 - Long-Term Disability 200 200 - 0.0%61834 - Unemployment 200 200 - 0.0%61836 - Life Insurance 100 100 - 0.0%61837 - Insurance - Workers Compensation 2,600 2,900 300 11.5%
61.0 - Personnel Services Total 40,400 41,700 1,300 3.2%62.0 - Supplies
62290 - Other Repair & Maintenance Supplies 7,500 7,500 - 0.0%62810 - Software/License Renewals 100 100 - 0.0%
62.0 - Supplies Total 7,600 7,600 - 0.0%63.0 - Contractual Services
63261 - Vector Control 500 1,000 500 100.0%63440 - Equipment Rental 4,500 4,500 - 0.0%63542 - Eng. Services - Surveying 1,400 1,400 - 0.0%63544 - Eng. Services - Leachate 3,800 3,800 - 0.0%63545 - Eng. Services - GW Monitoring 14,200 14,200 - 0.0%63548 - Eng. Services - LFG System 3,500 3,500 - 0.0%63554 - Eng. Services - Leachate - Non Routine 750 500 (250) -33.3%63558 - Eng. Services - LFG System - Non Routine 100 100 - 0.0%63592 - Facility Maintenance 12,500 12,500 - 0.0%63811 - RWQCB Studies 2,000 2,000 - 0.0%63812 - Lab Water Analysis 2,500 2,500 - 0.0%63818 - Lab Water Analysis - 5 year 3,200 3,200 - 0.0%
63.0 - Contractual Services Total 48,950 49,200 250 0.5%64.4 - Insurance
64413 - Insurance - Environmental Impairment Liability 32,400 35,600 3,200 9.9%64414 - Insurance - General Liability 57,300 63,000 5,700 9.9%64417 - Insurance - Excess Liability 21,500 23,600 2,100 9.8%
64.4 - Insurance Total 111,200 122,200 11,000 9.9%64.9 - Taxes and Permits
63817 - NPDES - Permitting 500 500 - 0.0%64904 - Property Taxes 100 100 - 0.0%64905 - Mo.Co. LEA Fees 4,300 4,700 400 9.3%64925 - SWRCB Fees 2,000 12,000 10,000 500.0%
64.9 - Taxes and Permits Total 6,900 17,300 10,400 150.7%5600 - Jolon Road Postclosure Maintenance Total 215,050 238,000 22,950 10.7%
161 - Jolon Road Closure Fund Total 215,050 238,000 22,950 10.7%170 - Transfer Stations Fund
3650 - ML Transfer StationPage 59 of 122

Row Labels 2017-18 Budget
Proposed2018-19Budget
Increase/ (Decrease)
% Change
Salinas Valley RecyclesBudget Worksheets
FY 2018-19
63.1 - Operating Contracts63616 - Madison Lane Transfer Station Services 500,000 500,000 - 0.0%
63.1 - Operating Contracts Total 500,000 500,000 - 0.0%3650 - ML Transfer Station Total 500,000 500,000 - 0.0%
3710 - SS Disposal Operations61.0 - Personnel Services
61110 - Regular Pay 207,600 218,400 10,800 5.2%61120 - Paid Time Off 6,400 6,700 300 4.7%61130 - Safety Awards 800 800 - 0.0%61300 - Overtime - Regular 24,900 25,900 1,000 4.0%61400 - Education Assistance 7,000 8,000 1,000 14.3%61410 - Wellness Program 2,000 2,000 - 0.0%61700 - Flexible Leave 8,800 9,400 600 6.8%61816 - Cell Phone 2,000 2,000 - 0.0%61822 - PERS Employer Classic 14,600 14,400 (200) -1.4%61825 - Medicare 3,300 3,700 400 12.1%61827 - PERS - 1959 Survivor Benefit 300 300 - 0.0%61828 - PERS Employer PEPRA 4,000 4,100 100 2.5%61829 - PERS Unfunded Liability Payment 8,200 8,200 - 0.0%61831 - Health Insurance 75,600 71,300 (4,300) -5.7%61833 - Long-Term Disability 1,100 1,300 200 18.2%61834 - Unemployment 1,000 1,000 - 0.0%61836 - Life Insurance 600 600 - 0.0%61837 - Insurance - Workers Compensation 19,900 24,100 4,200 21.1%69810 - Transfers Out - OPEB Reserve 12,000 13,000 1,000 8.3%
61.0 - Personnel Services Total 400,100 415,200 15,100 3.8%62.0 - Supplies
62100 - Office Supplies & Materials 1,000 1,000 - 0.0%62140 - Janitorial Supplies 2,500 2,500 - 0.0%62230 - Vehicle Supplies 900 900 - 0.0%62330 - Fuel 8,100 8,100 - 0.0%62335 - Biodiesel Fuel 45,600 45,600 - 0.0%62510 - Uniforms 1,500 3,500 2,000 133.3%62800 - Special Dept Supplies 7,550 7,550 - 0.0%62810 - Software/License Renewals 1,450 1,450 - 0.0%62840 - Safety Supplies 2,500 4,500 2,000 80.0%62850 - Small Tools 4,800 4,800 - 0.0%
62.0 - Supplies Total 75,900 79,900 4,000 5.3%63.0 - Contractual Services
63250 - Exterminator Service 3,000 3,000 - 0.0%63410 - Vehicle Maintenance 10,000 10,000 - 0.0%63416 - Building Alarm Service 17,000 17,000 - 0.0%63418 - Security Service 16,000 16,000 - 0.0%63430 - Equipment Maintenance 96,200 100,000 3,800 4.0%63440 - Equipment Rental 5,000 5,000 - 0.0%63522 - HR Investigations, Testing 500 500 - 0.0%63560 - Custodial Service 10,800 10,800 - 0.0%63592 - Facility Maintenance 42,700 65,000 22,300 52.2%63593 - Landscape Maintenance 3,000 3,000 - 0.0%63598 - FSA Service Fees 120 120 - 0.0%63599 - EAP Service Fee 180 180 - 0.0%63613 - Contract Labor 10,000 20,000 10,000 100.0%
63.0 - Contractual Services Total 214,500 250,600 36,100 16.8%63.2 - Utilities
63116 - Cell Phones 2,000 2,000 - 0.0%Page 60 of 122

Row Labels 2017-18 Budget
Proposed2018-19Budget
Increase/ (Decrease)
% Change
Salinas Valley RecyclesBudget Worksheets
FY 2018-19
63126 - Exchange Hosting Services 600 600 - 0.0%63210 - Water 8,800 8,800 - 0.0%63220 - Sewer 500 500 - 0.0%63230 - Gas & Electricity 10,000 10,000 - 0.0%63240 - Portable Toilet 5,000 5,000 - 0.0%
63.2 - Utilities Total 26,900 26,900 - 0.0%64.0 - Other Expenses
64250 - Training 1,100 1,100 - 0.0%64.0 - Other Expenses Total 1,100 1,100 - 0.0%
64.4 - Insurance64411 - Insurance - Commercial Auto 1,000 1,000 - 0.0%64412 - Insurance - Crime 500 500 - 0.0%64413 - Insurance - Environmental Impairment Liability 500 500 - 0.0%64414 - Insurance - General Liability 800 900 100 12.5%64415 - Insurance - Public Officials and Employment Liabil 1,500 1,600 100 6.7%64416 - Insurance - Property Damage 16,800 18,500 1,700 10.1%64417 - Insurance - Excess Liability 300 400 100 33.3%64420 - Insurance - Deductible 2,500 2,500 - 0.0%64422 - Insurance - Earthquake 9,200 10,100 900 9.8%
64.4 - Insurance Total 33,100 36,000 2,900 8.8%64.9 - Taxes and Permits
64903 - Fees & Permits 800 1,700 900 112.5%64904 - Property Taxes 1,500 1,600 100 6.7%64905 - Mo.Co. LEA Fees 14,500 15,900 1,400 9.7%
64.9 - Taxes and Permits Total 16,800 19,200 2,400 14.3%3710 - SS Disposal Operations Total 768,400 828,900 60,500 7.9%
3720 - SS Transfer Operations61.0 - Personnel Services
61110 - Regular Pay 279,900 299,400 19,500 7.0%61120 - Paid Time Off 10,800 11,600 800 7.4%61130 - Safety Awards 1,200 1,200 - 0.0%61300 - Overtime - Regular 42,300 45,100 2,800 6.6%61400 - Education Assistance 8,750 10,000 1,250 14.3%61410 - Wellness Program 2,500 2,500 - 0.0%61700 - Flexible Leave 8,100 8,700 600 7.4%61822 - PERS Employer Classic 5,900 5,700 (200) -3.4%61825 - Medicare 4,500 5,200 700 15.6%61827 - PERS - 1959 Survivor Benefit 300 300 - 0.0%61828 - PERS Employer PEPRA 14,000 15,900 1,900 13.6%61829 - PERS Unfunded Liability Payment 7,600 7,600 - 0.0%61831 - Health Insurance 134,900 127,200 (7,700) -5.7%61833 - Long-Term Disability 1,500 1,800 300 20.0%61834 - Unemployment 1,800 1,800 - 0.0%61836 - Life Insurance 800 800 - 0.0%61837 - Insurance - Workers Compensation 26,800 33,600 6,800 25.4%69810 - Transfers Out - OPEB Reserve 11,000 12,000 1,000 9.1%
61.0 - Personnel Services Total 562,650 590,400 27,750 4.9%62.0 - Supplies
62230 - Vehicle Supplies 4,000 4,000 - 0.0%62330 - Fuel 71,200 75,800 4,600 6.5%62335 - Biodiesel Fuel 172,600 170,000 (2,600) -1.5%62510 - Uniforms 1,500 3,000 1,500 100.0%62840 - Safety Supplies 2,500 2,500 - 0.0%
62.0 - Supplies Total 251,800 255,300 3,500 1.4%63.0 - Contractual Services
Page 61 of 122
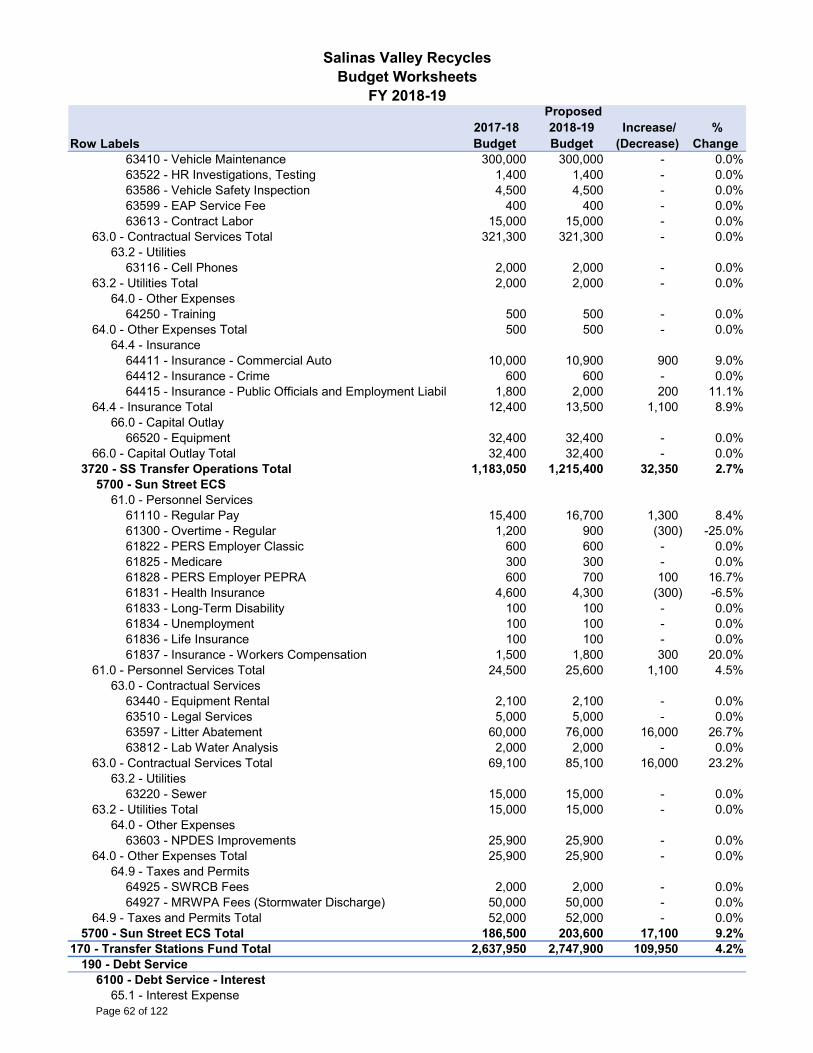
Row Labels 2017-18 Budget
Proposed2018-19Budget
Increase/ (Decrease)
% Change
Salinas Valley RecyclesBudget Worksheets
FY 2018-19
63410 - Vehicle Maintenance 300,000 300,000 - 0.0%63522 - HR Investigations, Testing 1,400 1,400 - 0.0%63586 - Vehicle Safety Inspection 4,500 4,500 - 0.0%63599 - EAP Service Fee 400 400 - 0.0%63613 - Contract Labor 15,000 15,000 - 0.0%
63.0 - Contractual Services Total 321,300 321,300 - 0.0%63.2 - Utilities
63116 - Cell Phones 2,000 2,000 - 0.0%63.2 - Utilities Total 2,000 2,000 - 0.0%
64.0 - Other Expenses64250 - Training 500 500 - 0.0%
64.0 - Other Expenses Total 500 500 - 0.0%64.4 - Insurance
64411 - Insurance - Commercial Auto 10,000 10,900 900 9.0%64412 - Insurance - Crime 600 600 - 0.0%64415 - Insurance - Public Officials and Employment Liabil 1,800 2,000 200 11.1%
64.4 - Insurance Total 12,400 13,500 1,100 8.9%66.0 - Capital Outlay
66520 - Equipment 32,400 32,400 - 0.0%66.0 - Capital Outlay Total 32,400 32,400 - 0.0%
3720 - SS Transfer Operations Total 1,183,050 1,215,400 32,350 2.7%5700 - Sun Street ECS
61.0 - Personnel Services61110 - Regular Pay 15,400 16,700 1,300 8.4%61300 - Overtime - Regular 1,200 900 (300) -25.0%61822 - PERS Employer Classic 600 600 - 0.0%61825 - Medicare 300 300 - 0.0%61828 - PERS Employer PEPRA 600 700 100 16.7%61831 - Health Insurance 4,600 4,300 (300) -6.5%61833 - Long-Term Disability 100 100 - 0.0%61834 - Unemployment 100 100 - 0.0%61836 - Life Insurance 100 100 - 0.0%61837 - Insurance - Workers Compensation 1,500 1,800 300 20.0%
61.0 - Personnel Services Total 24,500 25,600 1,100 4.5%63.0 - Contractual Services
63440 - Equipment Rental 2,100 2,100 - 0.0%63510 - Legal Services 5,000 5,000 - 0.0%63597 - Litter Abatement 60,000 76,000 16,000 26.7%63812 - Lab Water Analysis 2,000 2,000 - 0.0%
63.0 - Contractual Services Total 69,100 85,100 16,000 23.2%63.2 - Utilities
63220 - Sewer 15,000 15,000 - 0.0%63.2 - Utilities Total 15,000 15,000 - 0.0%
64.0 - Other Expenses63603 - NPDES Improvements 25,900 25,900 - 0.0%
64.0 - Other Expenses Total 25,900 25,900 - 0.0%64.9 - Taxes and Permits
64925 - SWRCB Fees 2,000 2,000 - 0.0%64927 - MRWPA Fees (Stormwater Discharge) 50,000 50,000 - 0.0%
64.9 - Taxes and Permits Total 52,000 52,000 - 0.0%5700 - Sun Street ECS Total 186,500 203,600 17,100 9.2%
170 - Transfer Stations Fund Total 2,637,950 2,747,900 109,950 4.2%190 - Debt Service
6100 - Debt Service - Interest65.1 - Interest Expense
Page 62 of 122
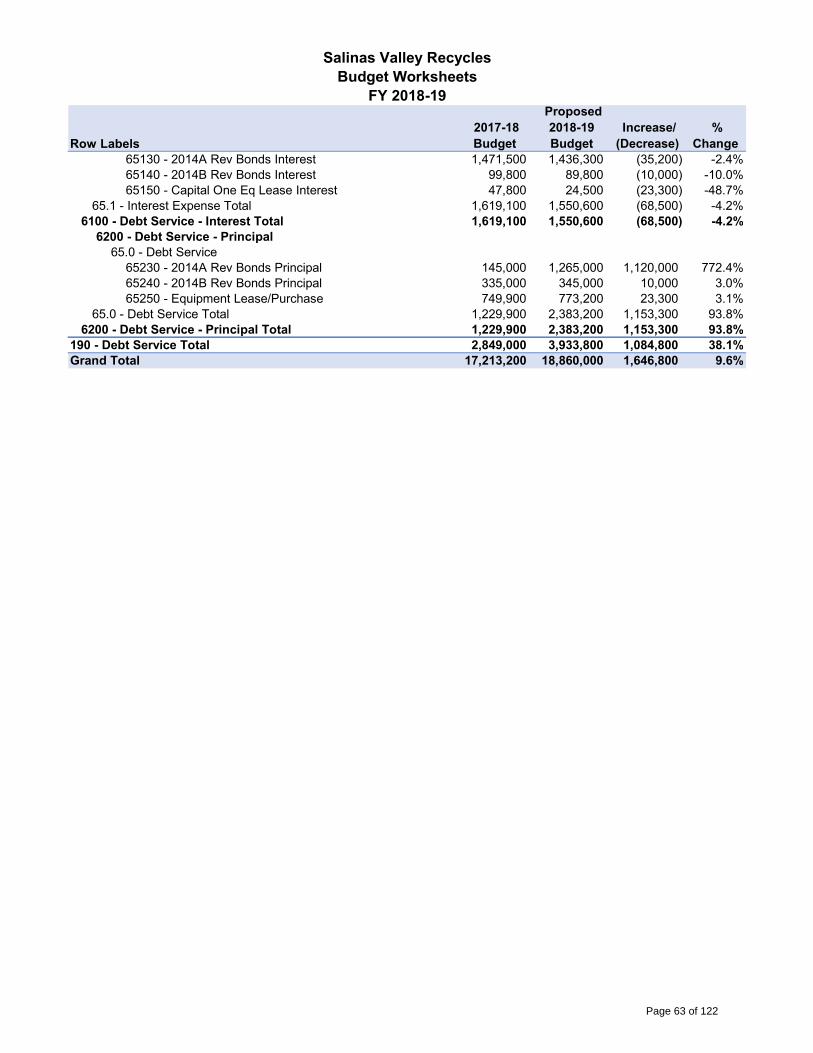
Row Labels 2017-18 Budget
Proposed2018-19Budget
Increase/ (Decrease)
% Change
Salinas Valley RecyclesBudget Worksheets
FY 2018-19
65130 - 2014A Rev Bonds Interest 1,471,500 1,436,300 (35,200) -2.4%65140 - 2014B Rev Bonds Interest 99,800 89,800 (10,000) -10.0%65150 - Capital One Eq Lease Interest 47,800 24,500 (23,300) -48.7%
65.1 - Interest Expense Total 1,619,100 1,550,600 (68,500) -4.2%6100 - Debt Service - Interest Total 1,619,100 1,550,600 (68,500) -4.2%
6200 - Debt Service - Principal65.0 - Debt Service
65230 - 2014A Rev Bonds Principal 145,000 1,265,000 1,120,000 772.4%65240 - 2014B Rev Bonds Principal 335,000 345,000 10,000 3.0%65250 - Equipment Lease/Purchase 749,900 773,200 23,300 3.1%
65.0 - Debt Service Total 1,229,900 2,383,200 1,153,300 93.8%6200 - Debt Service - Principal Total 1,229,900 2,383,200 1,153,300 93.8%
190 - Debt Service Total 2,849,000 3,933,800 1,084,800 38.1%Grand Total 17,213,200 18,860,000 1,646,800 9.6%
Page 63 of 122

This page intentionally left blank
Page 64 of 122
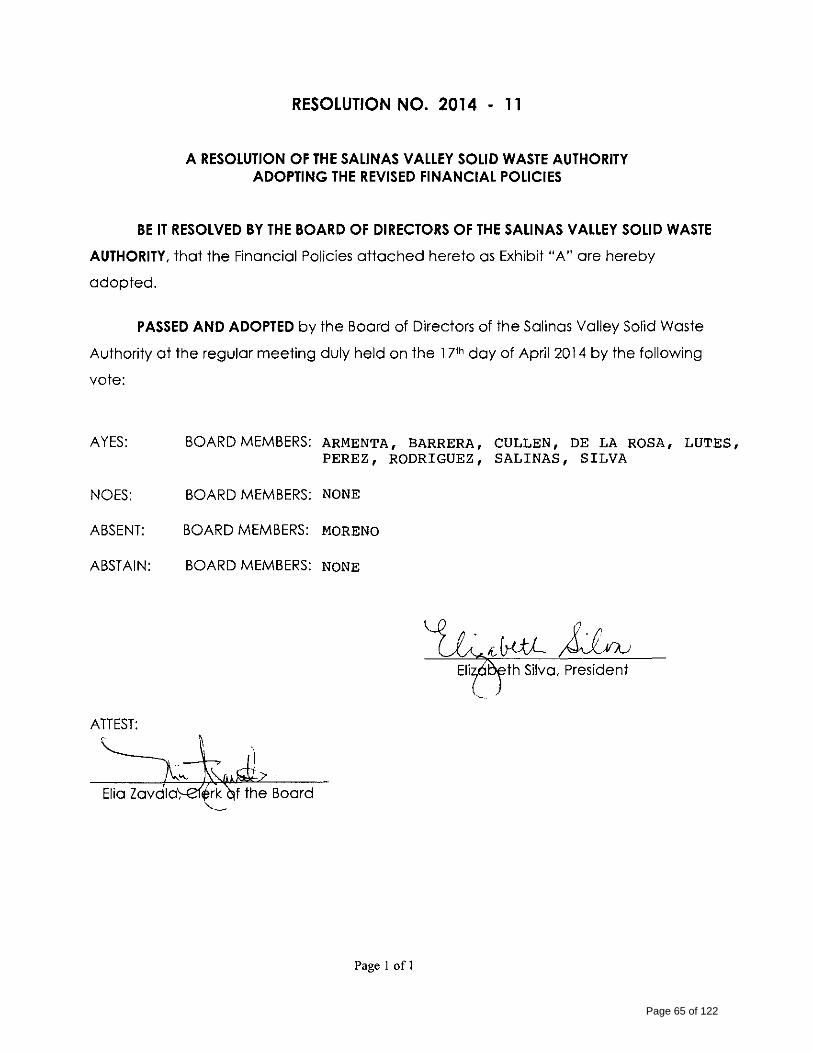
RESOLUTION NO. 2014 - 11
A RESOLUTION OF THE SALINAS VALLEY SOLID WASTE AUTHORITY ADOPTING THE REVISED FINANCIAL POLICIES
BE IT RESOLVED BY THE BOARD OF DIRECTORS OF THE SALINAS VALLEY SOLID WASTE
AUTHORITY, that the Financial Policies attached hereto as Exhibit "A" are hereby
adopted.
PASSED AND ADOPTED by the Board of Directors of the Salinas Valley Solid Waste
Authority at the regular meeting duly held on the l 71h day of April 2014 by the following
vote:
AYES:
NOES:
ABSENT:
ABSTAIN:
ATIEST:
BOARD MEMBERS: ARMENTA, BARRERA, CULLEN, DE LA ROSA, LUTES, PEREZ, RODRIGUEZ, SALINAS, SILVA
BOARD MEMBERS: NONE
BOARD MEMBERS: MORENO
BOARD MEMBERS: NONE
th Silva, President
Page I of 1
Page 65 of 122

Salinas Valley Solid Waste Authority Financial Policies
Revised April 17, 2014
SUMMARY The SVSWA Board of Directors recognizes their fiduciary responsibility by virtue of their appointment to the Board. In an effort to promote transparency in the fiscal affairs of the Authority and to promote fiscal accountability, it hereby adopts the following financial policies to guide the Authority’s finances:
1. Revenues: The Authority will maintain a revenue system that will assure a reliable,
equitable, predictable revenue stream to support Authority services.
2. Expenditures: The Authority shall assure fiscal stability and the effective and efficient
delivery of services, through the identification of necessary services, establishment of
appropriate service levels, and careful administration of the expenditure of available
resources.
3. Fund Balance/Reserves: The Authority shall maintain a fund balance at a level sufficient
to protect the Authority's creditworthiness as well as its financial position from
unforeseeable occurrences or emergencies.
4. Capital Expenditures and Improvements: The Authority shall annually review the state of
its capital assets, setting priorities for its replacement and renovation based on needs,
funding, alternatives and availability of resources.
5. Debt: The Authority shall utilize debt financing only to provide needed capital equipment
and improvements while minimizing the impact of debt payments on current revenues.
6. Investments: The Authority's cash will be invested in such a manner so as to ensure the
absolute safety of principal and interest, meet the liquidity needs of the Authority, and
achieve the highest possible yield.
7. Grants: The Authority shall seek, apply for and effectively administer federal, state and
foundation grants that address the Authority's current priorities and policy objectives.
8. Closure Funding: The Authority shall properly fund all closure and postclosure costs in
accordance with California Integrated Waste Management Board (CIWMB) requirements.
9. Fiscal Monitoring: Authority staff shall prepare and present to the Board regular reports
that analyze, evaluate and forecast the Authority's financial performance and economic
condition.
10. Accounting, Auditing and Financial Reporting: The Authority’s accounting, auditing and financial reporting shall comply with prevailing local, state, and federal regulations, as well as current professional principles and practices as promulgated by authoritative bodies.
Page 66 of 122

Salinas Valley Solid Waste Authority Financial Policies
Revised April 17, 2014
11. Internal Controls: The Authority shall establish and maintain an internal control structure
designed to provide reasonable assurance that Authority assets are safeguarded and that
the possibilities for material errors in the Authority's financial records are minimized.
12. Operating Budget: The Authority’s operating budget will implement the policy decisions of
the Board. It will provide a clear picture of the Authority’s resources and their use.
13. Capital Assets: The Authority will capitalize all capital assets in accordance with Generally Accepted Accounting Principles so as to maintain proper control of all capital assets.
Page 67 of 122

Salinas Valley Solid Waste Authority Financial Policies
Revised April 17, 2014
1 - REVENUES
The Authority will maintain a revenue system that will assure a reliable, equitable, predictable
revenue stream to support Authority services.
A. User Fees
The Authority shall establish and collect fees to recover the costs of handling specific
items that benefit only specific users. The Authority Board shall determine the appropriate
cost recovery level and establish the fees. Where feasible and desirable, the Authority
shall seek to recover full direct and indirect costs. User fees shall be reviewed on a
regular basis to calculate their full cost recovery levels, to compare them to the current
fee structure, and to recommend adjustments where necessary.
B. Tipping Fees
Tipping fees shall be set at levels sufficient to cover operating expenditures, meet debt
obligations, provide additional funding for capital improvements, and provide adequate
levels of working capital. Tipping Fees are not expected to cover depreciation/depletion.
C. One Time Revenues
One-time revenues shall be used only for one-time expenditures.
D. Revenue Estimates
The Authority shall use a conservative, objective, and analytical approach when
preparing revenue estimates. The process shall include analysis of probable economic
changes and their impacts on revenues, historical collection rates, and trends in
revenues. This approach should reduce the likelihood of actual revenues falling short of
budget estimates during the year and thus avoid mid-year service reductions.
E. Revenue Collection and Administration
The Authority shall pursue to the full extent allowed by state law all delinquent ratepayers
and others overdue in payments to the Authority. Since a revenue should exceed the
cost of producing it, the Authority shall strive to control and reduce administrative
collection costs.
Page 68 of 122

Salinas Valley Solid Waste Authority Financial Policies
Revised April 17, 2014
2 - EXPENDITURES
The Authority shall assure fiscal stability and the effective and efficient delivery of services,
through the identification of necessary services, establishment of appropriate service levels, and
careful administration of the expenditure of available resources.
A. Current Funding Basis
The Authority shall operate on a current funding basis. Expenditures shall be budgeted
and controlled so as not to exceed current revenues.
B. Avoidance of Operating Deficits
The Authority shall take immediate corrective actions if at any time during the fiscal year
expenditure and revenue estimates are such that an operating deficit (i.e., projected
expenditures in excess of projected revenues) is projected at year-end. Corrective
actions can include a hiring freeze, expenditure reductions, fee increases, or use of fund
balance within the Fund Balance/Reserves Policy. Expenditure deferrals into the
following fiscal year, short-term loans, or use of one-time revenue sources shall be
avoided to balance the budget.
C. Maintenance of Capital Assets
Within the resources available each fiscal year, the Authority shall maintain capital assets
and infrastructure at a sufficient level to protect the Authority's investment, to minimize
future replacement and maintenance costs, and to continue current service levels.
D. Periodic Program Reviews
The General Manager shall undertake periodic staff and third-party reviews of Authority
programs for both efficiency and effectiveness. Privatization and contracting with other
governmental agencies will be evaluated as alternative approaches to service delivery.
Programs which are determined to be inefficient and/or ineffective shall be reduced in
scope or eliminated.
E. Purchasing
The Authority shall make every effort to maximize any discounts offered by
creditors/vendors. Staff shall use competitive bidding whenever possible to attain the best
possible price on goods and services.
Page 69 of 122

Salinas Valley Solid Waste Authority Financial Policies
Revised April 17, 2014
3 - FUND BALANCE/RESERVES
The Authority shall maintain a fund balance at a level sufficient to protect the Authority's
creditworthiness as well as its financial position from unforeseeable emergencies.
A. Operating Reserve
The Authority shall strive to maintain an Operating Reserve equal to fifteen percent (15%)
of the current year operating expenditures, to provide sufficient reserves for unforeseen
occurrences and revenue shortfalls. Operating expenditures for reserve purposes is
defined as the total budget less capital project expenditures.
B. Funding the Reserves
After completion of the annual audit, any undesignated fund balance will be allocated to
reserves using the following methodology:
1. Operating Reserve (20%) 2. Capital Projects Reserve (60%) 3. Environmental Impairment Reserve (20%)
Any allocation outside of the prescribed methodology or transfers between reserves must be approved by the Board.
C. Capital Projects Reserve
Due to the capital intensive nature of the Authority’s landfill operations the Authority will
develop a Capital Projects Reserve for the purpose of funding future capital projects and
replacement of existing capital infrastructure in accordance with the Capital
Improvements Financial Policies. The target amount of the reserve will be based on the
capital needs of the Authority.
E. Use of Operating Reserve
The Operating Reserve shall be used only for its designated purpose - emergencies, non-
recurring expenditures, or major capital purchases that can not be accommodated
through current year savings. Should such use reduce the balance below the appropriate
level set as the objective, restoration recommendations will accompany the decision to
utilize said reserve.
F. Environmental Impairment Reserve
Page 70 of 122
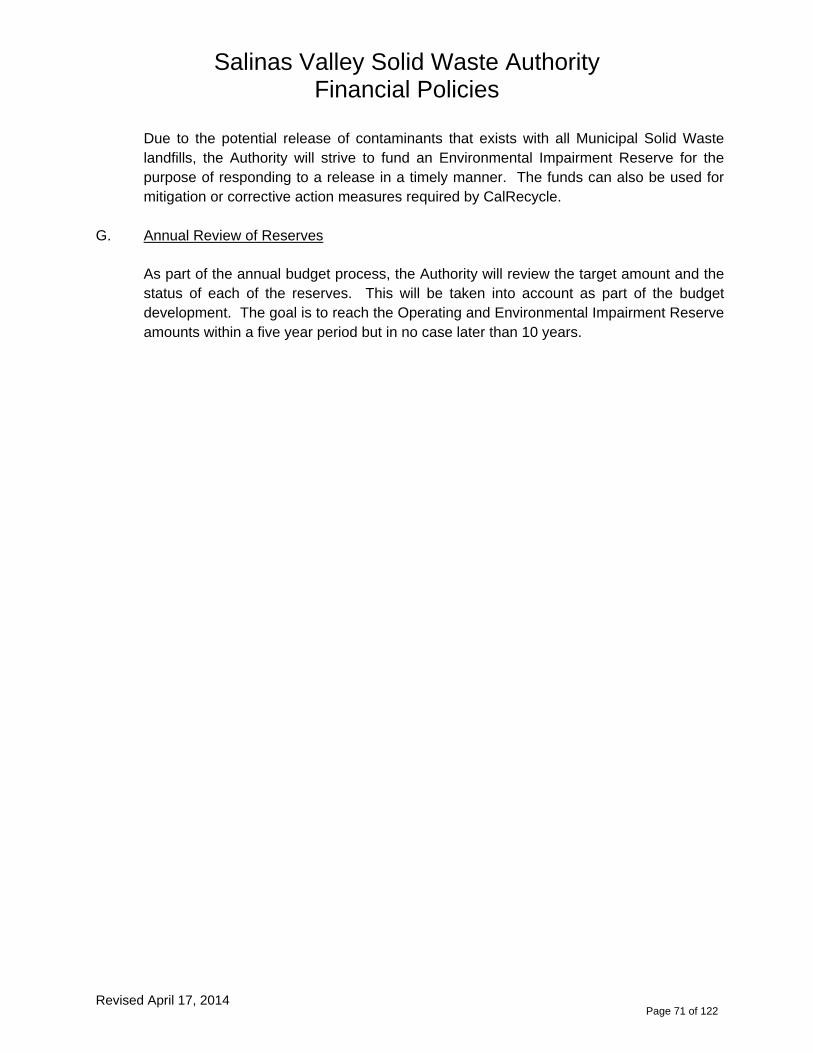
Salinas Valley Solid Waste Authority Financial Policies
Revised April 17, 2014
Due to the potential release of contaminants that exists with all Municipal Solid Waste
landfills, the Authority will strive to fund an Environmental Impairment Reserve for the
purpose of responding to a release in a timely manner. The funds can also be used for
mitigation or corrective action measures required by CalRecycle.
G. Annual Review of Reserves
As part of the annual budget process, the Authority will review the target amount and the
status of each of the reserves. This will be taken into account as part of the budget
development. The goal is to reach the Operating and Environmental Impairment Reserve
amounts within a five year period but in no case later than 10 years.
Page 71 of 122
Salinas Valley Solid Waste Authority Financial Policies
Revised April 17, 2014
4 - CAPITAL EXPENDITURES AND IMPROVEMENTS
The Authority shall annually review the state of its capital assets, setting priorities for their
replacement and renovation based on needs, funding, alternatives and availability of resources.
A. Capital Improvement Plan
The Authority shall prepare a 10-Year Capital Improvement Plan (CIP) which will detail
the Authority’s capital needs financing requirements. The CIP will be reviewed and
approved every two (2) years before discussions of the operating budget take place. It
will include budget financing for the first two years. The CAO will develop guidelines for
what projects to include in the CIP. All projects, ongoing and proposed, shall be
prioritized based on an analysis of current needs and resource availability. For every
capital project, all operation, maintenance and replacement costs shall be fully disclosed.
The CIP will be in conformance with and support the Authority’s major planning
documents and 3-year Strategic Plans..
B. Capital Improvement Budget
The CIP will be the basis for which projects will be included in the following year’s budget.
Appropriations will be approved annually using the following criteria:
1. Linkage with needs identified in the Authority’s planning documents. 2. Cost/benefit analysis identifying all economic or financial impacts of the project. 3. Identification of available funding resources.
CIP funding will be based on the following priorities:
1. Projects that comply with regulatory requirements. 2. Projects that maintain health and safety standards.
3. Projects that maintain and preserve existing facilities. 4. Projects that replace existing facilities that can no longer be maintained. 5. Projects that improve operations.
C. Capital Expenditure Financing
Projects will be financed using the following preferred order:
1. Use current revenues; 2. Use the Capital Projects Reserve; 3. Borrow money through debt issuance.
Debt financing includes revenue bonds, certificates of obligation, lease/purchase
agreements, and other obligations permitted to be issued or incurred under California
law. Guidelines for assuming debt are set forth in the Debt Policy Statements.
D. Capital Projects Reserve Fund
Page 72 of 122
Salinas Valley Solid Waste Authority Financial Policies
Revised April 17, 2014
A Capital Projects Reserve Fund shall be established and maintained to accumulate
funds transferred from the undesignated fund balance. This fund shall only be used to
pay for non-routine and one-time capital expenditures such as land and building
purchases or construction and maintenance projects with a 10-year life. Expenditures
from this Fund shall be aimed at protecting the health and safety of residents, employees
and the environment, and protecting the existing assets of the Authority.
E. Capital Projects Management
The Authority will fund and manage its capital projects in a phased approach. The project
phases will become a framework for appropriate decision points and reporting. The
phasing will consist of:
1. Conceptual/schematic proposal 2. Preliminary design and cost estimate 3. Engineering and final design 4. Bid administration 5. Acquisition/construction 6. Project closeout
Each project will have a project manager who will prepare the project proposal, ensure
that required phases are completed on schedule, authorize all project expenditures,
ensure that all regulations and laws are observed, periodically report project status and
track project expenditures.
Page 73 of 122

Salinas Valley Solid Waste Authority Financial Policies
Revised April 17, 2014
5 - DEBT
The Authority shall utilize debt financing only to provide needed capital equipment and
improvements while minimizing the impact of debt payments on current revenues.
A. Use of Debt Financing
. The issuance of long-term debt will be only for the acquisition of land, capital improvements or equipment. Debt financing is not considered appropriate for current operations, maintenance expenses, or for any recurring purposes.
B. Conditions for Debt Issuance The Authority may use long-term debt to finance major equipment acquisition or capital project only if it is established through a cost/benefit analysis that the financial and community benefits of the financing exceed the financing costs. Benefits would include, but not be limited to, the following:
1. Present value benefit: The current cost plus the financing cost is less than the future cost of the project. 2. Maintenance value benefit: The financing cost is less than the maintenance cost
of deferring the project. 3. Equity benefit: Financing provides a method of spreading the cost of a facility
back to the users of the facility over time. 4. Community benefit: Debt financing of the project enables the Authority to meet an
immediate community need. Debt financing will be used only when project revenues or other identified revenue
sources are sufficient to service the debt.
C. Debt Structure
The Authority’s preference is to issue fixed-rate, long-term debt with level debt service,
but variable rate debt or other debt service structure may be considered if an economic
advantage is identified for a particular project.
Bond proceeds, for debt service, will be held by an independent bank acting as trustee or
paying agent.
Page 74 of 122

Salinas Valley Solid Waste Authority Financial Policies
Revised April 17, 2014
The Authority's minimum bond rating objective for all debt issues is a Moody's and Standard & Poor's rating of A (upper medium grade). Credit enhancements will be used to achieve higher ratings when there is an economic benefit.
The Authority may retain the following contract advisors for the issuance of debt:
1. Financial Advisor - To be selected, when appropriate, by negotiation to provide financial analysis and advice related to the feasibility and structure of the proposed debt.
2. Bond Counsel - To be selected by negotiation for each debt issue.
3. Underwriters - To be selected by negotiation or competitive bid for each bond issue
based upon the proposed structure for each issue.
D. Call Provisions
Call provisions for bond issues shall be made as short as possible consistent with the
lowest interest cost to the Authority. When possible, all bonds shall be callable only at
par.
E. Debt Refunding
Authority staff and the financial advisor shall monitor the municipal bond market for
opportunities to obtain interest savings by refunding outstanding debt. As a general rule,
the present value savings of a particular refunding should exceed 3.5% of the refunded
maturities.
F. Interest Earnings
Interest earnings received on the investment of bond proceeds shall be used to assist in
paying the interest due on bond issues, to the extent permitted by law.
G. Lease/Purchase Agreements
Over the lifetime of a lease, the total cost to the Authority will generally be higher than
purchasing the asset outright. As a result, the use of lease/purchase agreements and
certificates of participation in the acquisition of vehicles, equipment and other capital
assets shall generally be avoided, particularly if smaller quantities of the capital asset(s)
can be purchased on a "pay-as-you-go" basis.
Page 75 of 122
Salinas Valley Solid Waste Authority Financial Policies
Revised April 17, 2014
6 - INVESTMENTS
The Authority's cash will be invested in such a manner so as to insure the absolute safety of
principal and interest, meet the liquidity needs of the Authority, and achieve the highest possible
yield after meeting the first two requirements.
A. Investment Policy
The Authority Treasurer is both authorized and required to promulgate a written
Statement of Investment Policy which shall be presented to the Board annually.
B. Interest Earnings
Interest earned from investments shall be distributed to the operating funds from which
the money was provided, with the exception that interest earnings received on the
investment of bond proceeds shall be attributed and allocated to those debt service funds
responsible for paying the principal and interest due on the particular bond issue.
.
Page 76 of 122
Salinas Valley Solid Waste Authority Financial Policies
Revised April 17, 2014
7 - GRANTS
The Authority shall seek, apply for and effectively administer federal, state and foundation
grants-in-aid that address the Authority's current priorities and policy objectives.
A. Grant Guidelines
The Authority shall apply, and facilitate the application by others, for only those grants
that are consistent with the objectives and high priority needs previously identified by
the Board. The potential for incurring ongoing costs, to include the assumption of
support for grant-funded positions from local revenues, will be considered prior to
applying for a grant.
B. Indirect Costs
The Authority shall recover full indirect costs unless the funding agency does not
permit it. The Authority may waive or reduce indirect costs if doing so will significantly
increase the effectiveness of the grant.
C. Grant Review
All grant submittals shall be reviewed for their cash match requirements, their potential
impact on the operating budget, and the extent to which they meet the Authority's
policy objectives. Departments shall seek Board approval prior to submission of a
grant application. Should time constraints under the grant program make this
impossible, the department shall obtain approval to submit an application from the
CAO and then, at the earliest feasible time, seek formal Board approval. If there are
cash match requirements, the source of funding shall be identified prior to application.
An annual report on the status of grant programs and their effectiveness shall also be
prepared.
D. Grant Program Termination
The Authority shall terminate grant-funded programs and associated positions when
grant funds are no longer available unless alternate funding is identified.
Page 77 of 122

Salinas Valley Solid Waste Authority Financial Policies
Revised April 17, 2014
8 - CLOSURE FUNDING
The Authority shall properly fund all closure and postclosure costs in accordance with CIWMB
requirements.
A. Closure Funding
In accordance with CIWMB requirements, the Authority shall annually set aside
sufficient funds to fully fund all accrued closure costs liability. These funds will be held
in a separate Closure Fund restricted specifically for this purpose.
B. Postclosure Funding
In accordance with the Financial Assurances, the Authority shall fund postclosure costs
from future revenues when those costs are incurred. The Authority will not pre-fund
postclosure costs in its operating budget. The Authority has entered into Pledge of
Revenue with the CIWMB for this purpose.
C. Closure Funding Calculations
The Authority shall, as part of the budget process, annually recalculate the closure
costs on a per ton basis. Funds will be transferred on a monthly basis to the Closure
funds based on tonnage land-filled. Post closure expense incurred as a result of
current fiscal year solid waste disposal will be recorded as an expense on the
Authority’s financial statements with a corresponding liability.
Page 78 of 122
Salinas Valley Solid Waste Authority Financial Policies
Revised April 17, 2014
9 - FISCAL MONITORING
Authority staff shall prepare and present to the Board regular reports that analyze, evaluate and
forecast the Authority's financial performance and economic condition.
A. Financial Status and Performance Reports
Monthly reports comparing expenditures and revenues to current budget, noting the
status of fund balances, and outlining any remedial actions necessary to maintain the
Authority's financial position shall be prepared for review by the Board.
B. Five-year Forecast of Revenues and Expenditures
A five-year forecast of revenues and expenditures, to include a discussion of major
trends affecting the Authority's financial position, shall be prepared in anticipation of the
annual budget process. The forecast shall also examine critical issues facing the
Authority, economic conditions, and the outlook for the upcoming budget year. The
document shall provide insight into the Authority's financial position and alert the Board
to potential problem areas requiring attention.
C. Semi-Annual Status Report on Capital Projects
A summary report on the contracts awarded, capital projects completed and the status
of the Authority's various capital projects will be prepared at least semi-annually and
presented to the Board.
D. Compliance with Board Policy Statements
The Financial Policies will be reviewed annually by the Board and updated, revised or
refined as deemed necessary. Policy statements adopted by the Board are guidelines,
and occasionally, exceptions may be appropriate and required. However, exceptions to
stated policies will be specifically identified, and the need for the exception will be
documented and fully explained.
Page 79 of 122
Salinas Valley Solid Waste Authority Financial Policies
Revised April 17, 2014
10 - ACCOUNTING, AUDITING, AND FINANCIAL REPORTING
The Authority’s accounting, auditing and financial reporting shall comply with prevailing local,
state, and federal regulations, as well as current professional principles and practices as
promulgated by authoritative bodies.
A. Conformance to Accounting Principles
The Authority's accounting practices and financial reporting shall conform to generally
accepted accounting principles (GAAP) as promulgated by the Governmental
Accounting Standards Board (GASB), the American Institute of Certified Public
Accountants (AICPA), and the Government Finance Officers Association (GFOA).
B. Popular Reporting
In addition to issuing a comprehensive annual financial report (CAFR) in conformity with
GAAP, the Authority shall supplement its CAFR with a simpler, "popular" report
designed to assist those residents who need or desire a less detailed overview of the
Authority's financial activities. This report should be issued no later than six months
after the close of the fiscal year.
Page 80 of 122

Salinas Valley Solid Waste Authority Financial Policies
Revised April 17, 2014
11 - INTERNAL CONTROLS
The Authority shall establish and maintain an internal control structure designed to provide
reasonable assurance that Authority assets are safeguarded and that the possibilities for
material errors in the Authority's financial records are minimized.
A. Proper Authorizations
Procedures shall be designed, implemented and maintained to ensure that financial
transactions and activities are properly reviewed and authorized.
B. Separation of Duties
Job duties will be adequately separated to reduce, to an acceptable level, the
opportunities for any person to be in a position to both perpetrate and conceal errors or
irregularities in the normal course of assigned duties.
C. Proper Recording
Procedures shall be developed and maintained that will ensure financial transactions
and events are properly recorded and that all financial reports may be relied upon as
accurate, complete and up-to-date.
D. Access to Assets and Records
Procedures shall be designed and maintained to ensure that adequate safeguards exist
over the access to and use of financial assets and records.
E. Independent Checks
Independent checks and audits will be made on staff performance to ensure compliance
with established procedures and proper valuation of recorded amounts.
F. Costs and Benefits
Internal control systems and procedures must have an apparent benefit in terms of
reducing and/or preventing losses. The cost of implementing and maintaining any
control system should be evaluated against the expected benefits to be derived from
that system.
Page 81 of 122

Salinas Valley Solid Waste Authority Financial Policies
Revised April 17, 2014
12 - OPERATING BUDGET
The Authority’s operating budget will implement the policy decisions of the Board. It will provide a clear picture of the Authority’s resources and their use.
A. Budget Format
The budget shall provide a complete financial plan of all Authority funds and activities for the ensuing fiscal year and shall be in such form as the Chief Administrative Officer deems desirable or that the Board may require. The budget shall begin with a clear general summary of its contents. It shall show in detail all estimated revenues, all carry-over fund balances and reserves, and all proposed expenditures, including debt service, for the ensuing fiscal year. The total of proposed expenditures shall not exceed the total of estimated revenues plus the un-appropriated fund balance, exclusive of reserves, for any fund. The budget will be organized on a program/service level format. The budget development process will include the identification and evaluation of policy options for increasing and decreasing service levels.
B. Estimated Revenues
The Authority will annually update its revenue forecast to enhance the budgetary decision-making process. In its budget projections, the Authority will attempt to match current expense to current revenue. If it becomes apparent that revenue shortfalls will create a deficit, efforts will be made first to reduce the deficiency through budgetary reductions. If appropriate reductions are insufficient, the Board may decide, on an exception basis, to use an appropriate existing reserve, which is in excess of minimum reserve requirements.
C. Appropriations
In evaluating the level of appropriations for program enhancements, or reductions, the Authority will apply the following principles in the priority order given:
1. Essential services, which provide for the health and safety of residents will be
funded to maintain current dollar levels.
2. The budget will provide for adequate ongoing maintenance of facilities and equipment.
3. Appropriations for program enhancements or reductions will be evaluated on a
case-by-case basis rather than across the board.
Page 82 of 122

Salinas Valley Solid Waste Authority Financial Policies
Revised April 17, 2014
4. When reductions in personnel are necessary to reduce expenditures, they shall be
consistent with the Authority Board's established service level priorities and, when possible, shall be accomplished through normal attrition.
5. Programs, which are self-supported by special revenues or fees, shall be
separately evaluated. Prior to the Authority Board making any supplemental appropriation, the CAO or Finance Manager shall certify that funds in excess of those estimated in the budget are available for appropriation. Any such supplemental appropriations shall be made for the fiscal year by Board action up to the amount of any excess.
Appropriations may be reduced any time during the fiscal year by the Authority Board upon recommendation of the CAO. When appropriation reductions are recommended, the CAO shall provide specific recommendations to the Board, indicating the estimated amount of the reduction, any remedial actions taken, and recommendations as to any other steps to be taken.
The CAO may transfer appropriations between divisions, and division managers may transfer appropriations between programs and accounts within their individual divisions, but only the Board by resolution may appropriate funds from reserves or fund balances.
All appropriations, except for Capital Improvement Program and Grant Programs appropriations, shall lapse at the end of the fiscal year to the extent that they have not been expended or encumbered. An appropriation in the Capital Improvement Program shall continue in force until expended, revised, or cancelled.
The Authority will endeavor to budget an appropriated contingency account in all Divisions operating budget equal to one percent of the total Operating Budget to meet changing operational requirements during the fiscal year.
Page 83 of 122

Salinas Valley Solid Waste Authority Financial Policies
Revised April 17, 2014
13 - CAPITAL ASSETS
The Authority will capitalize all capital assets in accordance with Generally Accepted Accounting Principles so as to maintain proper control of all capital assets. A. Overview – The Finance Division will maintain a capital asset management system that
will meet external financial reporting requirements and the needs of the Authority in line with these policies.
1. Capital assets are recorded as expenditures in governmental funds at the time the assets are received and the liability is incurred. These assets will be capitalized at cost on the government wide financial statements. Enterprise fixed assets are recorded as assets within the fund when purchased and a liability is incurred.
i. GASB 34 defines Capital Assets as land, improvements to land, easements, buildings, building improvements, vehicles, machinery, equipment, works of art and historical treasures, infrastructure, and all other tangible or intangible assets that are used in operations and that have initial useful lives extending beyond a single reporting period.
ii. GASB 34 defines Infrastructure Assets as long-lived capital assets that normally are stationary in nature and normally can be preserved for a significantly greater number of years than most capital assets. Examples include roads, bridges, tunnels, drainage systems, water and sewer systems, dams and lighting systems. Buildings that are an ancillary part of a network of infrastructure assets are included.
The Authority uses the most current edition of GOVERNMENTAL ACCOUNTING, AUDITING, AND FINANCIAL REPORTING (GAAFR) published by the Government Finance Officers Association (GFOA) as its authoritative guide in setting policy and establishing accounting procedures regarding capital assets.
B. Capitalization – Generally all capital assets with an original cost of $25,000 or more will be capitalized (recorded as an asset on the balance sheet versus expensing the item). Infrastructure Assets with an original cost of $150,000 or more will be capitalized. This capitalization policy addresses financial reporting, not control. The Authority follows the GFOA recommended practices for establishing capitalization thresholds. Specific capitalization requirements are described as follows:
1. The asset must cost $25,000 or more.
2. The asset must have a useful life of two (2) or more years.
3. The capitalization threshold is applied to individual units of capital assets rather than groups. For example, ten items purchased for $10,000 each will not be capitalized even though the total ($100,000) exceeds the threshold of $25,000.
4. For purposes of capitalization, the threshold will generally not be applied to components of capital assets. For example a keyboard, monitor and central processing unit purchased as components of a computer system will not be evaluated individually against the capitalization threshold. The entire computer system will be treated as a single asset. The capitalization threshold will be applied to a network if all component parts are required to make the asset
Page 84 of 122
Salinas Valley Solid Waste Authority Financial Policies
Revised April 17, 2014
functional.
5. Repairs to existing capital assets will generally not be subject to capitalization unless the repair extends the useful life of the asset. In this case the repair represents an improvement and is subject to the requirements described number 6 below.
6. Improvements to existing capital assets will be presumed by definition to extend the useful life of the related capital asset and therefore will be subject to capitalization if the cost exceeds $5,000.
7. Capital projects will be capitalized as “construction in progress” until completed. Personal computers will not be capitalized:
C. Leased Assets-
Operating leased assets are usually short term and cancelable at anytime. The recording of an operating lease as a fixed asset is not required because the item is not purchased.
Capital leases will be capitalized if one or more of the following criteria are met and the chance of cancellation is low:
a. Ownership is transferred by the end of the lease term b. The lease contains a bargain purchase option
c. The lease term is greater than or equal to 75 percent of the asset’s service life
d. The present value of the minimum lease payment is greater than or equal to ninety percent (90%) of the fair market value of the asset at the inception of the lease.
Capital lease items are capitalized at the beginning of the lease period, regardless of when the title transfers. Capital leases are recorded at net present value of lease payments.
D. Capital Asset Recording - It is the responsibility of the Finance Division to record, monitor and inventory all fixed assets. Each division will assign appropriate staff members to respond to verification, inventories, and filling out the necessary forms for recording transfers, dispositions or retired fixed assets.
E. Acquisition of Capital Assets - Fixed assets may be acquired through direct purchase, lease-purchase or capital lease, construction, eminent domain, donations, and gifts.
When a capital asset is acquired the funding source will be identified.
If funds are provided by a specific funding source, a record will be made of that specific source such as:
Bond Proceeds State Grants
F. Measuring the Cost and/or Value - Capital assets are recorded at their “historical cost”, which is the original cost of the assets. Donations accepted by the Authority will be valued at the fair market value at the time of donation. Costs include purchase price (less discounts) and any other reasonable and necessary costs incurred to place the asset in its intended location and prepare it for service. Costs could include the following:
Page 85 of 122
Salinas Valley Solid Waste Authority Financial Policies
Revised April 17, 2014
Sales Tax Freight charges Legal and title fees Closing costs Appraisal and negotiation fees Surveying fees Land-preparation costs Demolition costs Relocation costs Architect and accounting fees Insurance premiums and interest costs during construction
G. Establishing Cost in the Absence of Historical Records - According to the GASB 34, an estimate of the original cost is allowable. Standard costing is one method of estimating historical cost using a known average installed cost for a like unit at the estimated date of acquisition. Another recognized method is normal costing wherein an estimate of historical cost is based on current cost of reproduction new indexed by a reciprocal factor of the price increase of a specific item or classification from the appraisal date to the estimated date acquired. When necessary the Authority will use whichever method gives the most reasonable amount based on available information.
H. Recording Costs Incurred After Acquisition - Expenditures/expenses for replacing a component part of an asset are not capitalized. However, expenditures/expenses that either enhance a capital asset’s functionality (effectiveness or efficiency), or that extend a capital asset’s expected useful life are capitalized. For example, periodically slurry sealing a street would be treated as a repair (the cost would not be capitalized), while an overlay or reconstruction would be capitalized. Adding a new lane constitutes an addition and would therefore also be capitalized.
I. Disposition or Retirement of Fixed Assets - It is the Authority’s policy that divisions wishing to dispose of surplus, damaged or inoperative equipment must notify the Finance Division.
The Authority will conduct public auctions, as necessary, for the purpose of disposing of surplus property. Auctions will be conducted by the Finance Division. The original cost less depreciation will then be removed from the Authority’s capital asset management system.
J. Transfer of Assets - The transfer of fixed assets between divisions requires notification to the Finance Department.
K. Depreciation - In accordance with GASB Statement No. 34 the Authority will record depreciation expense on all capital assets, except for inexhaustible assets.
The Authority will use straight-line depreciation using the half-year convention or mid month as appropriate. Depreciation will be calculated for half a year in the year of acquisition and the year of disposition. Depreciation will be calculated over the estimated useful life of the asset.
L. Recommended Lives - The Authority follows GFOA Recommended Practices when establishing recommended lives for capitalized assets. In accordance with GASB 34 the Authority will rely on “general guidelines obtained from professional or industry organizations.” In particular the Authority will rely on estimated useful lives published by GFOA. If the life of a particular asset is estimated to be different than these guidelines, it
Page 86 of 122
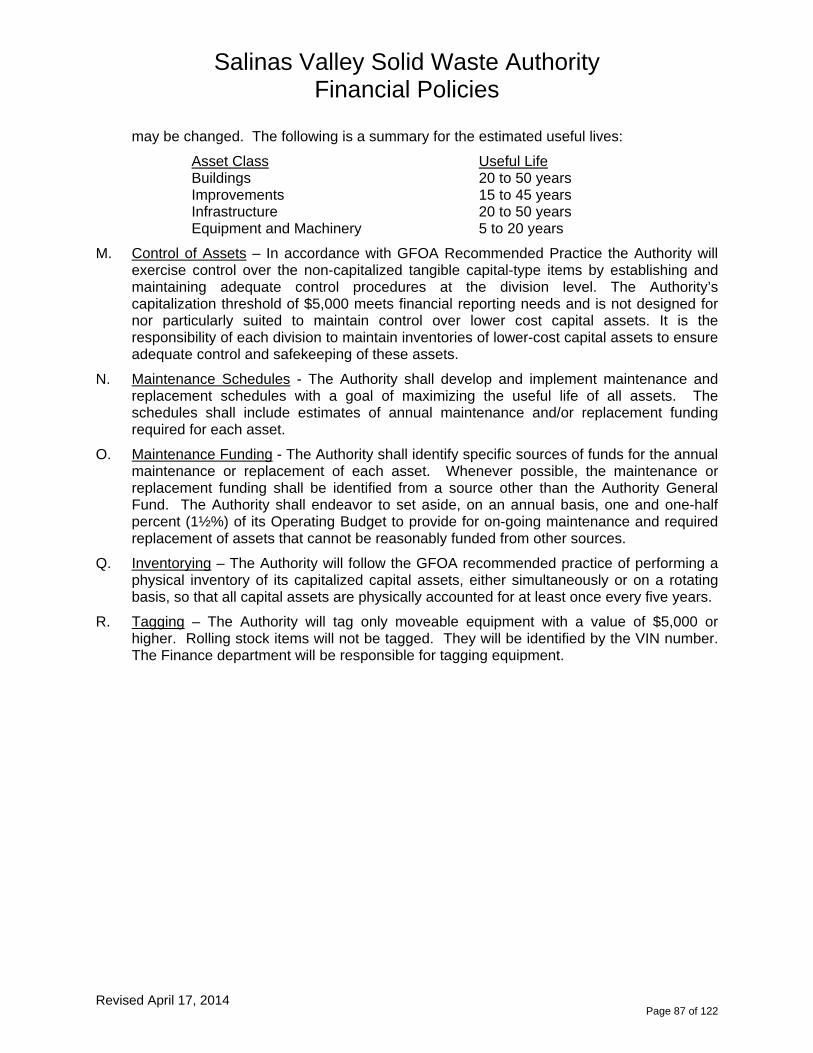
Salinas Valley Solid Waste Authority Financial Policies
Revised April 17, 2014
may be changed. The following is a summary for the estimated useful lives:
Asset Class Useful Life Buildings 20 to 50 years Improvements 15 to 45 years Infrastructure 20 to 50 years Equipment and Machinery 5 to 20 years
M. Control of Assets – In accordance with GFOA Recommended Practice the Authority will exercise control over the non-capitalized tangible capital-type items by establishing and maintaining adequate control procedures at the division level. The Authority’s capitalization threshold of $5,000 meets financial reporting needs and is not designed for nor particularly suited to maintain control over lower cost capital assets. It is the responsibility of each division to maintain inventories of lower-cost capital assets to ensure adequate control and safekeeping of these assets.
N. Maintenance Schedules - The Authority shall develop and implement maintenance and replacement schedules with a goal of maximizing the useful life of all assets. The schedules shall include estimates of annual maintenance and/or replacement funding required for each asset.
O. Maintenance Funding - The Authority shall identify specific sources of funds for the annual maintenance or replacement of each asset. Whenever possible, the maintenance or replacement funding shall be identified from a source other than the Authority General Fund. The Authority shall endeavor to set aside, on an annual basis, one and one-half percent (1½%) of its Operating Budget to provide for on-going maintenance and required replacement of assets that cannot be reasonably funded from other sources.
Q. Inventorying – The Authority will follow the GFOA recommended practice of performing a physical inventory of its capitalized capital assets, either simultaneously or on a rotating basis, so that all capital assets are physically accounted for at least once every five years.
R. Tagging – The Authority will tag only moveable equipment with a value of $5,000 or higher. Rolling stock items will not be tagged. They will be identified by the VIN number. The Finance department will be responsible for tagging equipment.
Page 87 of 122

This page intentionally left blank
Page 88 of 122
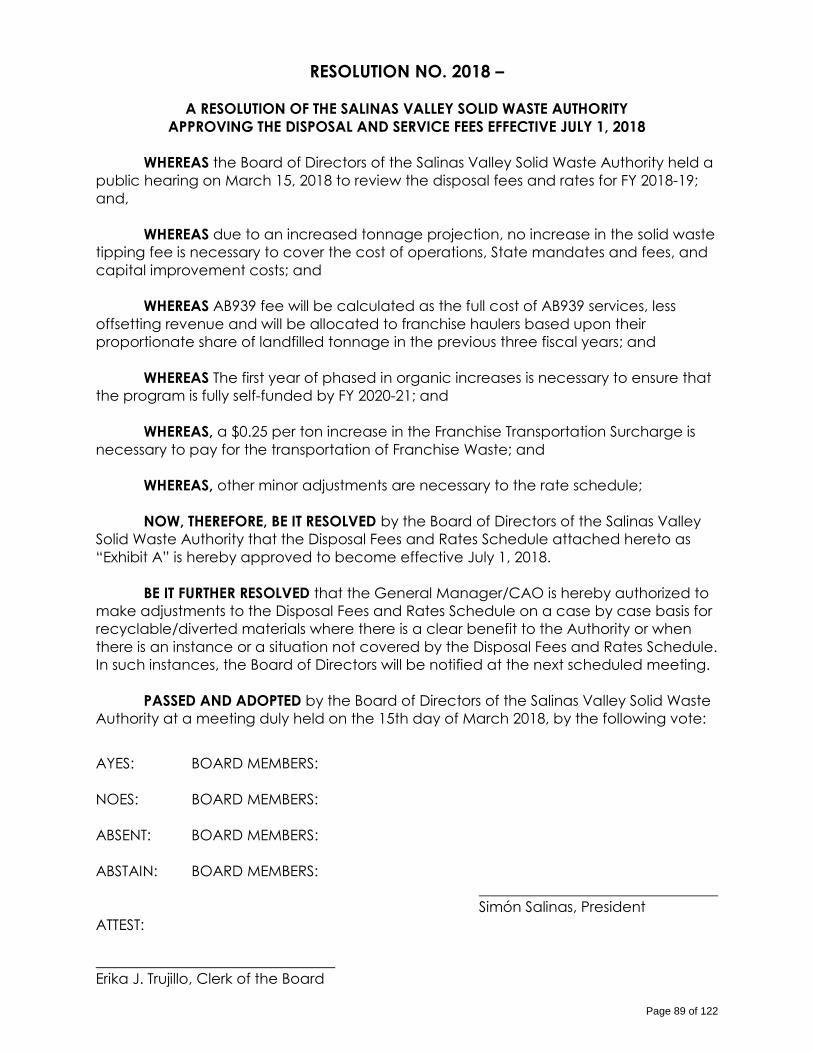
RESOLUTION NO. 2018 –
A RESOLUTION OF THE SALINAS VALLEY SOLID WASTE AUTHORITY APPROVING THE DISPOSAL AND SERVICE FEES EFFECTIVE JULY 1, 2018
WHEREAS the Board of Directors of the Salinas Valley Solid Waste Authority held a public hearing on March 15, 2018 to review the disposal fees and rates for FY 2018-19; and, WHEREAS due to an increased tonnage projection, no increase in the solid waste tipping fee is necessary to cover the cost of operations, State mandates and fees, and capital improvement costs; and
WHEREAS AB939 fee will be calculated as the full cost of AB939 services, less
offsetting revenue and will be allocated to franchise haulers based upon their proportionate share of landfilled tonnage in the previous three fiscal years; and
WHEREAS The first year of phased in organic increases is necessary to ensure that
the program is fully self-funded by FY 2020-21; and WHEREAS, a $0.25 per ton increase in the Franchise Transportation Surcharge is
necessary to pay for the transportation of Franchise Waste; and WHEREAS, other minor adjustments are necessary to the rate schedule; NOW, THEREFORE, BE IT RESOLVED by the Board of Directors of the Salinas Valley
Solid Waste Authority that the Disposal Fees and Rates Schedule attached hereto as “Exhibit A” is hereby approved to become effective July 1, 2018. BE IT FURTHER RESOLVED that the General Manager/CAO is hereby authorized to make adjustments to the Disposal Fees and Rates Schedule on a case by case basis for recyclable/diverted materials where there is a clear benefit to the Authority or when there is an instance or a situation not covered by the Disposal Fees and Rates Schedule. In such instances, the Board of Directors will be notified at the next scheduled meeting. PASSED AND ADOPTED by the Board of Directors of the Salinas Valley Solid Waste Authority at a meeting duly held on the 15th day of March 2018, by the following vote:
AYES: BOARD MEMBERS: NOES: BOARD MEMBERS: ABSENT: BOARD MEMBERS: ABSTAIN: BOARD MEMBERS: Simón Salinas, President ATTEST: Erika J. Trujillo, Clerk of the Board
Page 89 of 122

Note: Usefulness and suitability of materials is subject to scale house personnel's discretion.
Franchise Haulers (Class III Solid Waste) 68.50$ Per Ton
Self Haul Loads at all Sites Minimum charge per load (up to 500 lbs.) 16.00$ Per Load 17.00$ Per LoadLoads weighing between 501 and 999 lbs. 32.00$ Per Load 34.00$ Per LoadLoads weighing 1,000 lbs. and above 68.50$ Per Ton
Fumigation or Mulch Plastic/Drip Tape - Johnson Canyon onlyLoads weighing 500 lbs. or less 18.75$ Per LoadLoads weighing between 501 and 999 lbs. 37.50$ Per LoadLoads weighing 1,000 pounds and above 75.00$ Per Ton
Nonfriable Asbestos 90.00$ Per TonUp to 1 cubic yard w/o pre-approval) wetted and double bagged Special Handling Charge (in addition to cost per ton) - Johnson Canyon only
Remediated Soil Handling 100.00$ EachCertified Burials (under 20' trailer) 105.00$ EachCertified Burials (20' and over trailer) 210.00$ Each
Special Handling Charge (in addition to cost per ton)
Unloading Assistance (Per Person, 1 hour minimum) 75.00$ HourPull Off / Push Off Assistance 50.00$ Each
Tarps 10.00$ EachUntarped Loads Additional 50% of the Required Fee
Compost Bins 49.95$ Each
*Soil (Loaded by the Customer) - Johnson Canyon 1.00$
AB939 Fees Total 2,319,700$ Annual
Fee is charged to franchise haulers based on prior three years of tonnage:Fee allocation is as follows:
SALINAS VALLEY SOLID WASTE AUTHORITY
PROPOSED DISPOSAL AND SERVICE FEESEffective July 1, 2018
Current Proposed
AB939 Fees
Fee or Rate ChangesLANDFILLED MATERIALS
Per Cubic Yard Up to 500 C.Y.
Reallocation
FY 2014‐15 FY 2015‐16 FY 2016‐17Total Tonnage FYE 2015‐17
Allocation Percentage
Annual AB939 Fee
Monthly AB939 Fee
Soledad 6,493 6,836 7,136 20,465 105,456 8,788
Greenfield 6,030 6,233 6,604 18,867 98,124 8,177
Gonzales 2,953 3,191 3,412 9,557 48,396 4,033
Tri Cities (Combined 15,476 16,260 17,153 48,889 10.9% 251,976 20,998
Salinas 91,950 91,518 96,838 280,306 62.3% 1,444,709 120,392
Monterey 30,154 32,367 34,791 97,312 21.6% 501,550 41,796
King City 7,439 7,643 8,485 23,567 5.2% 121,465 10,122
145,019 147,789 157,267 450,074 100.0% 2,319,700 193,308
March 20, 2014 Board of Directors MeetingItemX Rates Exhibit A Disposal Rates and Fees Schedule
page 1 of 4Page 90 of 122

Note: Usefulness and suitability of materials is subject to scale house personnel's discretion.
SALINAS VALLEY SOLID WASTE AUTHORITY
PROPOSED DISPOSAL AND SERVICE FEESEffective July 1, 2018
Current ProposedFee or Rate Changes
Cardboard No Charge
Recyclable plastic and glass containers, aluminum and paper No Charge
Metal including appliances without Freon No Charge
Construction and Demolition materials Clean Construction & Demolition 58.00$ Per TonMinimum charge per load (up to 500 lbs.) 14.50$ Per LoadLoads weighing between 501 and 999 lbs. 29.00$ Per LoadLoads weighing 1,000 lbs. and above 58.00$ Per Ton
Mattresses and box springs (in recyclable condition)Mattresses and Box Springs (5 or less) No ChargeMattresses and Box Springs (6 or more) 5.00$ Each
Franchise OrganicsLoads weighing 1,000 lbs. and above 33.50$ Per Ton
Green waste and WoodMinimum charge up to 500 lbs. 10.00$ Per LoadLoads weighing between 501 and 999 lbs. 17.00$ Per Load 18.00$ Per TonLoads weighing 1,000 lbs. and above 33.50$ Per Ton 36.25$ Per TonFranchise Haulers (Organics) 38.25$ Per Ton
Wood Stumps (3 feet and over in diameter) & Tree limbs 68.50$ Per Ton
Green waste Contamination Curbside Truck, 2-3.5 cubic yards of contamination 125.00$ per loadCurbside Truck, 3.6-6 cubic yards of contamination 210.00$ per loadCurbside Truck, more than 6 cubic yards of contamination 255.00$ per load
Transfer Truck, 7-8.5 cubic yards of contamination 125.00$ per loadTransfer Truck, 8.6-10 cubic yards of contamination 210.00$ per loadTransfer Truck, more than 10 yards of contamination 255.00$ per load
Soil and Aggregate (Johnson Canyon Landfill only)
Clean Fill Dirt (up to 10 c.y. without pre-approval) (Outside SVR Service Area) 28.00$ Per TonClean Fill Dirt (up to 10 c.y. without pre-approval) (SVR Service Area) 14.00$ Per Ton 16.00$ Per TonAsphalt (suitable for road base) 1.00$ Per TonConcrete (suitable for road base - no rebar) 1.00$ Per Ton Concrete with rebar/pipe 10.00$ Per Ton
Biosolids/Alternative Daily Cover (Johnson Canyon Landfill only and 28.00$ Per Ton subject to pre-approval)
Tires (without rims only)
Auto/Light Truck Tires less than 42" 2.00$ EachAuto/Light Truck Tires more than 42" 10.00$ EachCommercial Tires 75.00$ EachEquipment Tires 150.00$ EachAltered Tires (split, sliced, quartered) 68.50$ Per Ton
SOURCE SEPARATED DIVERTIBLE MATERIALS
New Rate
Page 91 of 122
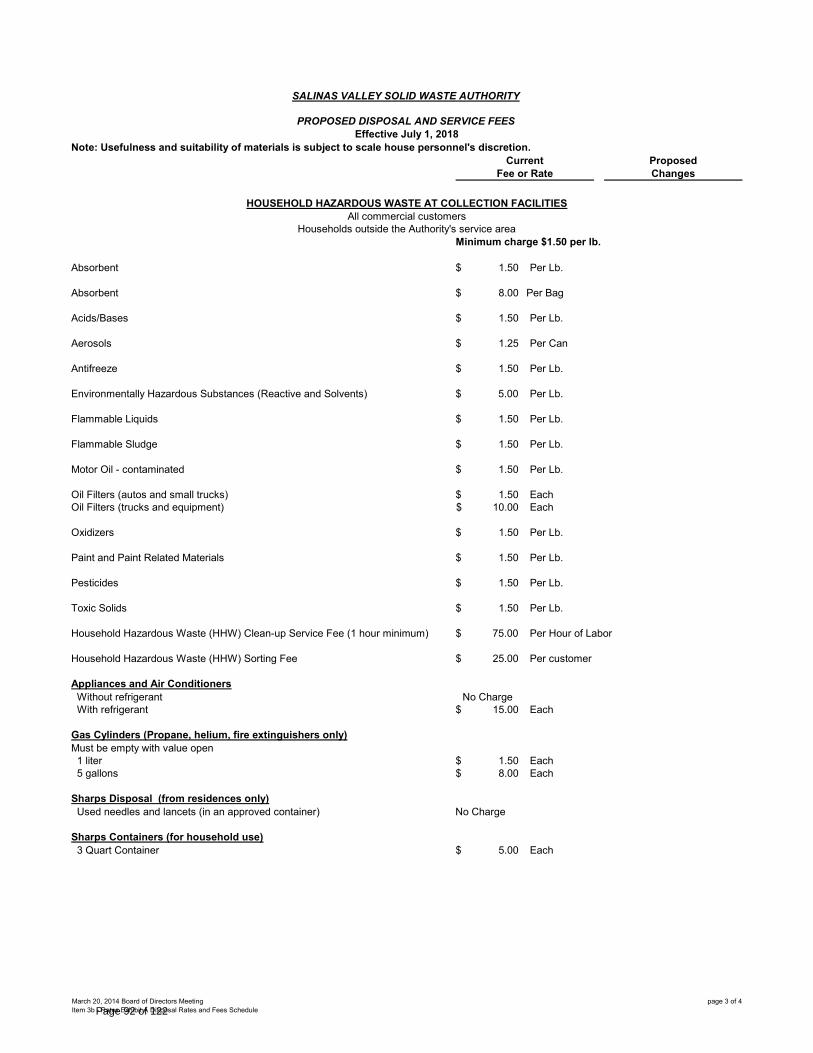
Note: Usefulness and suitability of materials is subject to scale house personnel's discretion.
SALINAS VALLEY SOLID WASTE AUTHORITY
PROPOSED DISPOSAL AND SERVICE FEESEffective July 1, 2018
Current ProposedFee or Rate Changes
Minimum charge $1.50 per lb.
Absorbent 1.50$ Per Lb.
Absorbent 8.00$ Per Bag
Acids/Bases 1.50$ Per Lb.
Aerosols 1.25$ Per Can
Antifreeze 1.50$ Per Lb.
Environmentally Hazardous Substances (Reactive and Solvents) 5.00$ Per Lb.
Flammable Liquids 1.50$ Per Lb.
Flammable Sludge 1.50$ Per Lb.
Motor Oil - contaminated 1.50$ Per Lb.
Oil Filters (autos and small trucks) 1.50$ EachOil Filters (trucks and equipment) 10.00$ Each
Oxidizers 1.50$ Per Lb.
Paint and Paint Related Materials 1.50$ Per Lb.
Pesticides 1.50$ Per Lb.
Toxic Solids 1.50$ Per Lb.
Household Hazardous Waste (HHW) Clean-up Service Fee (1 hour minimum) 75.00$ Per Hour of Labor
Household Hazardous Waste (HHW) Sorting Fee 25.00$ Per customer
Appliances and Air Conditioners Without refrigerant No Charge With refrigerant 15.00$ Each
Gas Cylinders (Propane, helium, fire extinguishers only)Must be empty with value open 1 liter 1.50$ Each 5 gallons 8.00$ Each
Sharps Disposal (from residences only) Used needles and lancets (in an approved container) No Charge
Sharps Containers (for household use) 3 Quart Container 5.00$ Each
Households outside the Authority's service area
HOUSEHOLD HAZARDOUS WASTE AT COLLECTION FACILITIESAll commercial customers
March 20, 2014 Board of Directors MeetingItem 3b - Rates Exhibit A Disposal Rates and Fees Schedule
page 3 of 4
Page 92 of 122

Note: Usefulness and suitability of materials is subject to scale house personnel's discretion.
SALINAS VALLEY SOLID WASTE AUTHORITY
PROPOSED DISPOSAL AND SERVICE FEESEffective July 1, 2018
Current ProposedFee or Rate Changes
Minimum charge $1.50 per pound
Batteries Alkaline or Rechargeable A, AA, AAA, B, C, D and 6 volt 1.50$ Per Lb. Nickel-Cadmium, Lithium, Silver Oxide-Hydride Cells, Lead Gel Cells, Nickel-Metal, and Lithium UPS/Automobile and Light Truck Batteries No Charge
CRT (televisions and computer monitors) No Charge
Cell Phones No Charge
Computers, keyboard and printers No Charge
Copiers, mimeographs, facsimile machines No Charge
Compact Fluorescent Bulbs 1.50$ Per Lb.Fluorescent Lamps 1.50$ Per Lb.Halogen, High Pressure Soldium Tubes 1.50$ Per Lb.Fluorescent Ballasts (PCB) 2.00$ Per Lb.
Kitchen appliances: microwaves, toaster, toaster ovens No Charge
Mercury 7.00$ Per Lb.Mercury thermostats, thermometers or switches 1.00$ EachToner, developer, ink cartridges (office use) 1.50$ Per Lb.Toner and developer (industrial use) 1.50$ Per Lb.
Franchise Transportation Surcharge 17.50$ Per Ton 17.75$ Per TonAgenda Packets for Board or Executive Committee 116.00$ AnnuallyAgendas Only 26.00$ AnnuallyAgendas Only for Public Agencies 18.00$ AnnuallyReproduction of Public Records 0.10$ Per PageCopies of Weight Tags 20.00$ EachReturned Check Fee 25.00$ EachFinance Charge on accounts 30+ Days Past Due 1.5% per mo., 18% annually
Media duplication for disks, cds, tapes Actual Cost$5.00 Min. Each
Plans & Specifications for Construction Projects Actual Cost$15.00 Min. Per Set
Full Size Plans for Construction Projects Actual Cost$15.00 Min Per Set
UNIVERSAL WASTE AT HHW COLLECTION FACILITIES
ADMINISTRATIVE & SPECIAL FEES
Page 93 of 122

This page intentionally left blank
Page 94 of 122

Page 1 of 1
RESOLUTION NO. 2018 –
A RESOLUTION OF THE SALINAS VALLEY SOLID WASTE AUTHORITY
APPROVING THE OPERATING BUDGET, THE PERSONNEL ALLOCATION AND SALARY SCHEDULE FOR FY 2018-19
WHEREAS, on January 18, 2018, the Board of Directors of the Salinas Valley Solid Waste Authority provided staff direction for preparation of the proposed operating budget; and,
WHEREAS, on February 15, 2018, the Board of Directors of the Salinas Valley Solid Waste Authority reviewed the proposed operating budget; and,
WHEREAS, the Board held a public hearing on March 18, 2018, to discuss the
proposed FY 2018-19 rates; and,
WHEREAS, on March 16, 2017, the Board approved an increase of $ $.25 to the franchise transportation surcharge, the first year of phased in organic increases, as well as other minor adjustments to the rate schedule;
NOW THEREFORE BE IT RESOLVED, by the Board of Directors of the Salinas Valley Solid
Waste Authority, that the Operating Budget for Fiscal Year 2018-19, attached hereto as “Exhibit A” is hereby approved to become effective July 1, 2018; and,
BE IT FURTHER RESOLVED, that the Personnel Allocation attached hereto as “Exhibit B” and the Salary Schedule attached hereto as “Exhibit C” are hereby approved to become effective July 1, 2018; and
BE IT FURTHER RESOLVED, that the General Manager/CAO is hereby authorized to
implement the budget in accordance with the Authority’s financial policies.
PASSED AND ADOPTED by the Board of Directors of the Salinas Valley Solid Waste Authority at a meeting duly held on the 15th day of March 2018, by the following vote:
AYES: BOARD MEMBERS: NOES: BOARD MEMBERS: ABSENT: BOARD MEMBERS: ABSTAIN: BOARD MEMBERS:
___________________________________ Simón Salinas, President ATTEST: ____________________________________ Erika J. Trujillo, Clerk of the Board
Page 95 of 122

This page intentionally left blank
Page 96 of 122

Program and Position
15-16
Approved
11/19/15
16-17
Approved
07/01/16
16-17
Approved
8/22/16
16-17
Approved
11/01/16
17-18
Approved
03/16/17
17-18
Approved
08/17/17
18-19
Proposed
07/01/18
Executive Administration
General Manager/CAO 1.0 1.0 1.0 1.0 1.0 1.0 1.0
Assistant General Manager 1.0 ** ** ** ** ** **
Clerk of the Board 1.0 1.0 1.0 1.0 1.0 1.0 1.0
Total Executive Administration 3.0 2.0 2.0 2.0 2.0 2.0 2.0
Finance and Administration
Finance and Administration Manager - - - - - 1.0 1.0
Finance Manager 1.0 1.0 1.0 1.0 1.0 - -
Human Resources/Organizational Development Mgr. 1.0 1.0 1.0 1.0 1.0 - -
Accountant 1.0 1.0 1.0 1.0 1.0 1.0 1.0
Business Services Supervisor - - - - - - 1.0
Human Resources Supervisor - - - - - 1.0 1.0
Accounting Technician I/II - - - 1.0 1.0 1.0 1.0
Accounting Technician I 1.0 1.0 1.0 - - - -
Human Resources Generalist 1.0 1.0 1.0 1.0 1.0 - -
Administrative Support Assistant I/II - - - 3.0 3.0 3.0 3.0
Administrative Support Assistant II 2.0 2.0 2.0 - - - -
Administrative Support Assistant I 1.0 1.0 1.0 - - - -
Total Finance and Administration 8.0 8.0 8.0 8.0 8.0 7.0 8.0
Resource Recovery
Diversion Manager - 1.0 1.0 - - - -
Resource Recovery Manager - - - 1.0 1.0 1.0 1.0
Contracts & Grants Analyst 1.0 1.0 1.0 1.0 1.0 1.0 1.0
Recycling Coordinator 1.0 1.0 1.0 1.0 1.0 1.0 1.0
Resource Recovery Technician I/II - - - 2.0 2.0 3.0 3.0
Resource Recovery Technician I 2.0 2.0 2.0 - - - -
Marketing Intern - - - 0.5 0.5 0.5 0.5
Total Resource Recovery 4.0 5.0 5.0 5.5 5.5 6.5 6.5
Engineering
Authority Engineer 1.0 - - - - - -
Engineering and Environmental Compliance Manager 1.0 1.0 1.0 1.0 1.0 1.0 1.0
Solid Waste Technician I/II - - - 1.0 1.0 1.0 1.0
Solid Waste Technician I 1.0 1.0 1.0 - - - -
Total Engineering 3.0 2.0 2.0 2.0 2.0 2.0 2.0
Operations
Operations Manager 1.0 1.0 1.0 1.0 1.0 1.0 1.0
Field Operations Supervisor I 2.0 2.0 2.0 2.0 2.0 2.0 2.0
Household Hazardous Waste Technician 1.0 1.0 1.0 1.0 1.0 1.0 1.0
Equipment Operator/Driver/Lead 2.0 2.0 2.0 2.0 2.0 2.0 3.0
Heavy Equipment Operator/Lead 1.0 1.0 1.0 1.0 1.0 1.0 1.0
Equipment Operator/Driver 5.0 5.0 6.0 6.0 7.0 7.0 6.0
Heavy Equipment Operator 3.0 3.0 3.0 3.0 3.0 3.0 3.0
HHW Maintenance Worker II 3.0 3.0 3.0 - - - -
HHW Maintenance Worker I/II - - - 3.0 3.0 3.0 3.0
Scalehouse Cashier 4.0 4.0 4.0 4.0 4.0 4.0 4.0
Diversion Worker I/II - - - 11.0 12.0 12.0 14.0
Diversion Worker II 2.0 2.0 3.0 - - - -
Diversion Worker I 6.0 6.0 8.0 - - - -
Total Operations 30.0 30.0 34.0 34.0 36.0 36.0 38.0
Frozen Positions
Business Services Supervisor 1.0 1.0 1.0 1.0 1.0 1.0 -
Diversion Driver 2.0 2.0 2.0 2.0 2.0 2.0 -
Total Frozen Positions 3.0 3.0 3.0 3.0 3.0 3.0 -
Total Full Time Equivalents 51.0 50.0 54.0 54.5 56.5 56.5 56.5
** The Assistant General Manager position and duties are
assigned to a Division Manager by the GM. Currently this
assignment is being held by the Operations Manager.
SALINAS VALLEY SOLID WASTE AUTHORITY
PERSONNEL ALLOCATION
EFFECTIVE DATE 07/01/2018
Page 97 of 122

This page intentionally left blank
Page 98 of 122

SALARY STEP 1 STEP 2 STEP 3 STEP 4 STEP 5 STEP 6 STEP 7 STEP 8 STEP 9 STEP 10 STEP 11RANGE
Hourly 9.002 9.227 9.458 9.694 9.936 10.184 10.439 10.700 10.968 11.242 11.467 1.0 Bi-Weekly 720.16 738.16 756.64 775.52 794.88 814.72 835.12 856.00 877.44 899.36 917.36
Monthly 1,560.35 1,599.35 1,639.39 1,680.29 1,722.24 1,765.23 1,809.43 1,854.67 1,901.12 1,948.61 1,987.61 Annual 18,724.16 19,192.16 19,672.64 20,163.52 20,666.88 21,182.72 21,713.12 22,256.00 22,813.44 23,383.36 23,851.36
Hourly 9.227 9.458 9.694 9.936 10.184 10.439 10.700 10.968 11.242 11.523 11.753 1.5 Bi-Weekly 738.16 756.64 775.52 794.88 814.72 835.12 856.00 877.44 899.36 921.84 940.24
Monthly 1,599.35 1,639.39 1,680.29 1,722.24 1,765.23 1,809.43 1,854.67 1,901.12 1,948.61 1,997.32 2,037.19 Annual 19,192.16 19,672.64 20,163.52 20,666.88 21,182.72 21,713.12 22,256.00 22,813.44 23,383.36 23,967.84 24,446.24
Hourly 9.458 9.694 9.936 10.184 10.439 10.700 10.968 11.242 11.523 11.811 12.047 2.0 Bi-Weekly 756.64 775.52 794.88 814.72 835.12 856.00 877.44 899.36 921.84 944.88 963.76
Monthly 1,639.39 1,680.29 1,722.24 1,765.23 1,809.43 1,854.67 1,901.12 1,948.61 1,997.32 2,047.24 2,088.15 Annual 19,672.64 20,163.52 20,666.88 21,182.72 21,713.12 22,256.00 22,813.44 23,383.36 23,967.84 24,566.88 25,057.76
Hourly 9.694 9.936 10.184 10.439 10.700 10.968 11.242 11.523 11.811 12.106 12.348 2.5 Bi-Weekly 775.52 794.88 814.72 835.12 856.00 877.44 899.36 921.84 944.88 968.48 987.84
Monthly 1,680.29 1,722.24 1,765.23 1,809.43 1,854.67 1,901.12 1,948.61 1,997.32 2,047.24 2,098.37 2,140.32 Annual 20,163.52 20,666.88 21,182.72 21,713.12 22,256.00 22,813.44 23,383.36 23,967.84 24,566.88 25,180.48 25,683.84
Hourly 9.936 10.184 10.439 10.700 10.968 11.242 11.523 11.811 12.106 12.409 12.657 3.0 Bi-Weekly 794.88 814.72 835.12 856.00 877.44 899.36 921.84 944.88 968.48 992.72 1,012.56
Monthly 1,722.24 1,765.23 1,809.43 1,854.67 1,901.12 1,948.61 1,997.32 2,047.24 2,098.37 2,150.89 2,193.88 Annual 20,666.88 21,182.72 21,713.12 22,256.00 22,813.44 23,383.36 23,967.84 24,566.88 25,180.48 25,810.72 26,326.56
Hourly 10.184 10.439 10.700 10.968 11.242 11.523 11.811 12.106 12.409 12.719 12.973 3.5 Bi-Weekly 814.72 835.12 856.00 877.44 899.36 921.84 944.88 968.48 992.72 1,017.52 1,037.84
Monthly 1,765.23 1,809.43 1,854.67 1,901.12 1,948.61 1,997.32 2,047.24 2,098.37 2,150.89 2,204.63 2,248.65 Annual 21,182.72 21,713.12 22,256.00 22,813.44 23,383.36 23,967.84 24,566.88 25,180.48 25,810.72 26,455.52 26,983.84
Hourly 10.439 10.700 10.968 11.242 11.523 11.811 12.106 12.409 12.719 13.037 13.298 4.0 Bi-Weekly 835.12 856.00 877.44 899.36 921.84 944.88 968.48 992.72 1,017.52 1,042.96 1,063.84
Monthly 1,809.43 1,854.67 1,901.12 1,948.61 1,997.32 2,047.24 2,098.37 2,150.89 2,204.63 2,259.75 2,304.99 Annual 21,713.12 22,256.00 22,813.44 23,383.36 23,967.84 24,566.88 25,180.48 25,810.72 26,455.52 27,116.96 27,659.84
Hourly 10.700 10.968 11.242 11.523 11.811 12.106 12.409 12.719 13.037 13.363 13.630 4.5 Bi-Weekly 856.00 877.44 899.36 921.84 944.88 968.48 992.72 1,017.52 1,042.96 1,069.04 1,090.40
Monthly 1,854.67 1,901.12 1,948.61 1,997.32 2,047.24 2,098.37 2,150.89 2,204.63 2,259.75 2,316.25 2,362.53 Annual 22,256.00 22,813.44 23,383.36 23,967.84 24,566.88 25,180.48 25,810.72 26,455.52 27,116.96 27,795.04 28,350.40
Hourly 10.968 11.242 11.523 11.811 12.106 12.409 12.719 13.037 13.363 13.697 13.971 5.0 Bi-Weekly 877.44 899.36 921.84 944.88 968.48 992.72 1,017.52 1,042.96 1,069.04 1,095.76 1,117.68
Monthly 1,901.12 1,948.61 1,997.32 2,047.24 2,098.37 2,150.89 2,204.63 2,259.75 2,316.25 2,374.15 2,421.64 Annual 22,813.44 23,383.36 23,967.84 24,566.88 25,180.48 25,810.72 26,455.52 27,116.96 27,795.04 28,489.76 29,059.68
POSITION
SALINAS VALLEY SOLID WASTE AUTHORITYSALARY SCHEDULE
EFFECTIVE July 1, 2018
Page 99 of 122

SALARY STEP 1 STEP 2 STEP 3 STEP 4 STEP 5 STEP 6 STEP 7 STEP 8 STEP 9 STEP 10 STEP 11RANGEPOSITION
SALINAS VALLEY SOLID WASTE AUTHORITYSALARY SCHEDULE
EFFECTIVE July 1, 2018
Hourly 11.242 11.523 11.811 12.106 12.409 12.719 13.037 13.363 13.697 14.039 14.320 5.5 Bi-Weekly 899.36 921.84 944.88 968.48 992.72 1,017.52 1,042.96 1,069.04 1,095.76 1,123.12 1,145.60
Monthly 1,948.61 1,997.32 2,047.24 2,098.37 2,150.89 2,204.63 2,259.75 2,316.25 2,374.15 2,433.43 2,482.13 Annual 23,383.36 23,967.84 24,566.88 25,180.48 25,810.72 26,455.52 27,116.96 27,795.04 28,489.76 29,201.12 29,785.60
Hourly 11.523 11.811 12.106 12.409 12.719 13.037 13.363 13.697 14.039 14.390 14.678 6.0 Bi-Weekly 921.84 944.88 968.48 992.72 1,017.52 1,042.96 1,069.04 1,095.76 1,123.12 1,151.20 1,174.24
Monthly 1,997.32 2,047.24 2,098.37 2,150.89 2,204.63 2,259.75 2,316.25 2,374.15 2,433.43 2,494.27 2,544.19 Annual 23,967.84 24,566.88 25,180.48 25,810.72 26,455.52 27,116.96 27,795.04 28,489.76 29,201.12 29,931.20 30,530.24
Hourly 11.811 12.106 12.409 12.719 13.037 13.363 13.697 14.039 14.390 14.750 15.045 6.5 Bi-Weekly 944.88 968.48 992.72 1,017.52 1,042.96 1,069.04 1,095.76 1,123.12 1,151.20 1,180.00 1,203.60
Monthly 2,047.24 2,098.37 2,150.89 2,204.63 2,259.75 2,316.25 2,374.15 2,433.43 2,494.27 2,556.67 2,607.80 Annual 24,566.88 25,180.48 25,810.72 26,455.52 27,116.96 27,795.04 28,489.76 29,201.12 29,931.20 30,680.00 31,293.60
Hourly 12.106 12.409 12.719 13.037 13.363 13.697 14.039 14.390 14.750 15.119 15.421 7.0 Bi-Weekly 968.48 992.72 1,017.52 1,042.96 1,069.04 1,095.76 1,123.12 1,151.20 1,180.00 1,209.52 1,233.68
Monthly 2,098.37 2,150.89 2,204.63 2,259.75 2,316.25 2,374.15 2,433.43 2,494.27 2,556.67 2,620.63 2,672.97 Annual 25,180.48 25,810.72 26,455.52 27,116.96 27,795.04 28,489.76 29,201.12 29,931.20 30,680.00 31,447.52 32,075.68
Hourly 12.409 12.719 13.037 13.363 13.697 14.039 14.390 14.750 15.119 15.497 15.807 7.5 Bi-Weekly 992.72 1,017.52 1,042.96 1,069.04 1,095.76 1,123.12 1,151.20 1,180.00 1,209.52 1,239.76 1,264.56
Monthly 2,150.89 2,204.63 2,259.75 2,316.25 2,374.15 2,433.43 2,494.27 2,556.67 2,620.63 2,686.15 2,739.88 Annual 25,810.72 26,455.52 27,116.96 27,795.04 28,489.76 29,201.12 29,931.20 30,680.00 31,447.52 32,233.76 32,878.56
Hourly 12.719 13.037 13.363 13.697 14.039 14.390 14.750 15.119 15.497 15.884 16.202 Student Intern 8.0 Bi-Weekly 1,017.52 1,042.96 1,069.04 1,095.76 1,123.12 1,151.20 1,180.00 1,209.52 1,239.76 1,270.72 1,296.16
Monthly 2,204.63 2,259.75 2,316.25 2,374.15 2,433.43 2,494.27 2,556.67 2,620.63 2,686.15 2,753.23 2,808.35 Annual 26,455.52 27,116.96 27,795.04 28,489.76 29,201.12 29,931.20 30,680.00 31,447.52 32,233.76 33,038.72 33,700.16
Hourly 13.037 13.363 13.697 14.039 14.390 14.750 15.119 15.497 15.884 16.281 16.607 8.5 Bi-Weekly 1,042.96 1,069.04 1,095.76 1,123.12 1,151.20 1,180.00 1,209.52 1,239.76 1,270.72 1,302.48 1,328.56
Monthly 2,259.75 2,316.25 2,374.15 2,433.43 2,494.27 2,556.67 2,620.63 2,686.15 2,753.23 2,822.04 2,878.55 Annual 27,116.96 27,795.04 28,489.76 29,201.12 29,931.20 30,680.00 31,447.52 32,233.76 33,038.72 33,864.48 34,542.56
Hourly 13.363 13.697 14.039 14.390 14.750 15.119 15.497 15.884 16.281 16.688 17.022 9.0 Bi-Weekly 1,069.04 1,095.76 1,123.12 1,151.20 1,180.00 1,209.52 1,239.76 1,270.72 1,302.48 1,335.04 1,361.76
Monthly 2,316.25 2,374.15 2,433.43 2,494.27 2,556.67 2,620.63 2,686.15 2,753.23 2,822.04 2,892.59 2,950.48 Annual 27,795.04 28,489.76 29,201.12 29,931.20 30,680.00 31,447.52 32,233.76 33,038.72 33,864.48 34,711.04 35,405.76
Hourly 13.697 14.039 14.390 14.750 15.119 15.497 15.884 16.281 16.688 17.105 17.447 9.5 Bi-Weekly 1,095.76 1,123.12 1,151.20 1,180.00 1,209.52 1,239.76 1,270.72 1,302.48 1,335.04 1,368.40 1,395.76
Monthly 2,374.15 2,433.43 2,494.27 2,556.67 2,620.63 2,686.15 2,753.23 2,822.04 2,892.59 2,964.87 3,024.15 Annual 28,489.76 29,201.12 29,931.20 30,680.00 31,447.52 32,233.76 33,038.72 33,864.48 34,711.04 35,578.40 36,289.76
Page 100 of 122
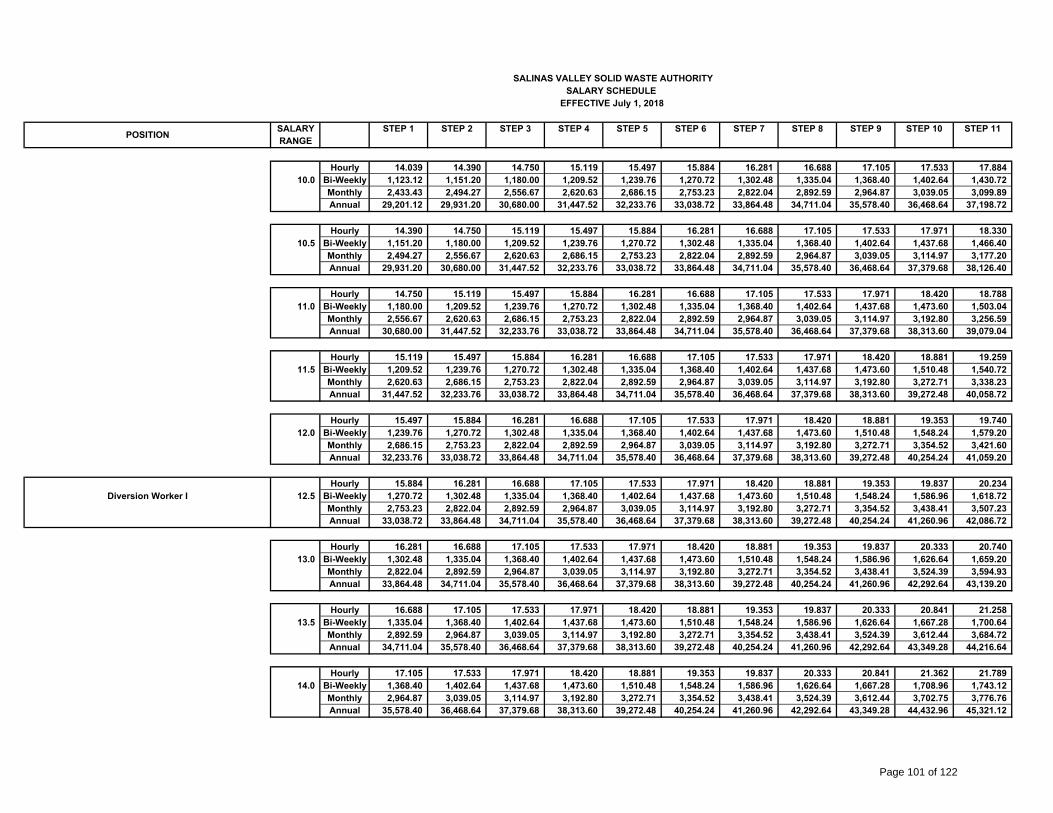
SALARY STEP 1 STEP 2 STEP 3 STEP 4 STEP 5 STEP 6 STEP 7 STEP 8 STEP 9 STEP 10 STEP 11RANGEPOSITION
SALINAS VALLEY SOLID WASTE AUTHORITYSALARY SCHEDULE
EFFECTIVE July 1, 2018
Hourly 14.039 14.390 14.750 15.119 15.497 15.884 16.281 16.688 17.105 17.533 17.884 10.0 Bi-Weekly 1,123.12 1,151.20 1,180.00 1,209.52 1,239.76 1,270.72 1,302.48 1,335.04 1,368.40 1,402.64 1,430.72
Monthly 2,433.43 2,494.27 2,556.67 2,620.63 2,686.15 2,753.23 2,822.04 2,892.59 2,964.87 3,039.05 3,099.89 Annual 29,201.12 29,931.20 30,680.00 31,447.52 32,233.76 33,038.72 33,864.48 34,711.04 35,578.40 36,468.64 37,198.72
Hourly 14.390 14.750 15.119 15.497 15.884 16.281 16.688 17.105 17.533 17.971 18.330 10.5 Bi-Weekly 1,151.20 1,180.00 1,209.52 1,239.76 1,270.72 1,302.48 1,335.04 1,368.40 1,402.64 1,437.68 1,466.40
Monthly 2,494.27 2,556.67 2,620.63 2,686.15 2,753.23 2,822.04 2,892.59 2,964.87 3,039.05 3,114.97 3,177.20 Annual 29,931.20 30,680.00 31,447.52 32,233.76 33,038.72 33,864.48 34,711.04 35,578.40 36,468.64 37,379.68 38,126.40
Hourly 14.750 15.119 15.497 15.884 16.281 16.688 17.105 17.533 17.971 18.420 18.788 11.0 Bi-Weekly 1,180.00 1,209.52 1,239.76 1,270.72 1,302.48 1,335.04 1,368.40 1,402.64 1,437.68 1,473.60 1,503.04
Monthly 2,556.67 2,620.63 2,686.15 2,753.23 2,822.04 2,892.59 2,964.87 3,039.05 3,114.97 3,192.80 3,256.59 Annual 30,680.00 31,447.52 32,233.76 33,038.72 33,864.48 34,711.04 35,578.40 36,468.64 37,379.68 38,313.60 39,079.04
Hourly 15.119 15.497 15.884 16.281 16.688 17.105 17.533 17.971 18.420 18.881 19.259 11.5 Bi-Weekly 1,209.52 1,239.76 1,270.72 1,302.48 1,335.04 1,368.40 1,402.64 1,437.68 1,473.60 1,510.48 1,540.72
Monthly 2,620.63 2,686.15 2,753.23 2,822.04 2,892.59 2,964.87 3,039.05 3,114.97 3,192.80 3,272.71 3,338.23 Annual 31,447.52 32,233.76 33,038.72 33,864.48 34,711.04 35,578.40 36,468.64 37,379.68 38,313.60 39,272.48 40,058.72
Hourly 15.497 15.884 16.281 16.688 17.105 17.533 17.971 18.420 18.881 19.353 19.740 12.0 Bi-Weekly 1,239.76 1,270.72 1,302.48 1,335.04 1,368.40 1,402.64 1,437.68 1,473.60 1,510.48 1,548.24 1,579.20
Monthly 2,686.15 2,753.23 2,822.04 2,892.59 2,964.87 3,039.05 3,114.97 3,192.80 3,272.71 3,354.52 3,421.60 Annual 32,233.76 33,038.72 33,864.48 34,711.04 35,578.40 36,468.64 37,379.68 38,313.60 39,272.48 40,254.24 41,059.20
Hourly 15.884 16.281 16.688 17.105 17.533 17.971 18.420 18.881 19.353 19.837 20.234 Diversion Worker I 12.5 Bi-Weekly 1,270.72 1,302.48 1,335.04 1,368.40 1,402.64 1,437.68 1,473.60 1,510.48 1,548.24 1,586.96 1,618.72
Monthly 2,753.23 2,822.04 2,892.59 2,964.87 3,039.05 3,114.97 3,192.80 3,272.71 3,354.52 3,438.41 3,507.23 Annual 33,038.72 33,864.48 34,711.04 35,578.40 36,468.64 37,379.68 38,313.60 39,272.48 40,254.24 41,260.96 42,086.72
Hourly 16.281 16.688 17.105 17.533 17.971 18.420 18.881 19.353 19.837 20.333 20.740 13.0 Bi-Weekly 1,302.48 1,335.04 1,368.40 1,402.64 1,437.68 1,473.60 1,510.48 1,548.24 1,586.96 1,626.64 1,659.20
Monthly 2,822.04 2,892.59 2,964.87 3,039.05 3,114.97 3,192.80 3,272.71 3,354.52 3,438.41 3,524.39 3,594.93 Annual 33,864.48 34,711.04 35,578.40 36,468.64 37,379.68 38,313.60 39,272.48 40,254.24 41,260.96 42,292.64 43,139.20
Hourly 16.688 17.105 17.533 17.971 18.420 18.881 19.353 19.837 20.333 20.841 21.258 13.5 Bi-Weekly 1,335.04 1,368.40 1,402.64 1,437.68 1,473.60 1,510.48 1,548.24 1,586.96 1,626.64 1,667.28 1,700.64
Monthly 2,892.59 2,964.87 3,039.05 3,114.97 3,192.80 3,272.71 3,354.52 3,438.41 3,524.39 3,612.44 3,684.72 Annual 34,711.04 35,578.40 36,468.64 37,379.68 38,313.60 39,272.48 40,254.24 41,260.96 42,292.64 43,349.28 44,216.64
Hourly 17.105 17.533 17.971 18.420 18.881 19.353 19.837 20.333 20.841 21.362 21.789 14.0 Bi-Weekly 1,368.40 1,402.64 1,437.68 1,473.60 1,510.48 1,548.24 1,586.96 1,626.64 1,667.28 1,708.96 1,743.12
Monthly 2,964.87 3,039.05 3,114.97 3,192.80 3,272.71 3,354.52 3,438.41 3,524.39 3,612.44 3,702.75 3,776.76 Annual 35,578.40 36,468.64 37,379.68 38,313.60 39,272.48 40,254.24 41,260.96 42,292.64 43,349.28 44,432.96 45,321.12
Page 101 of 122
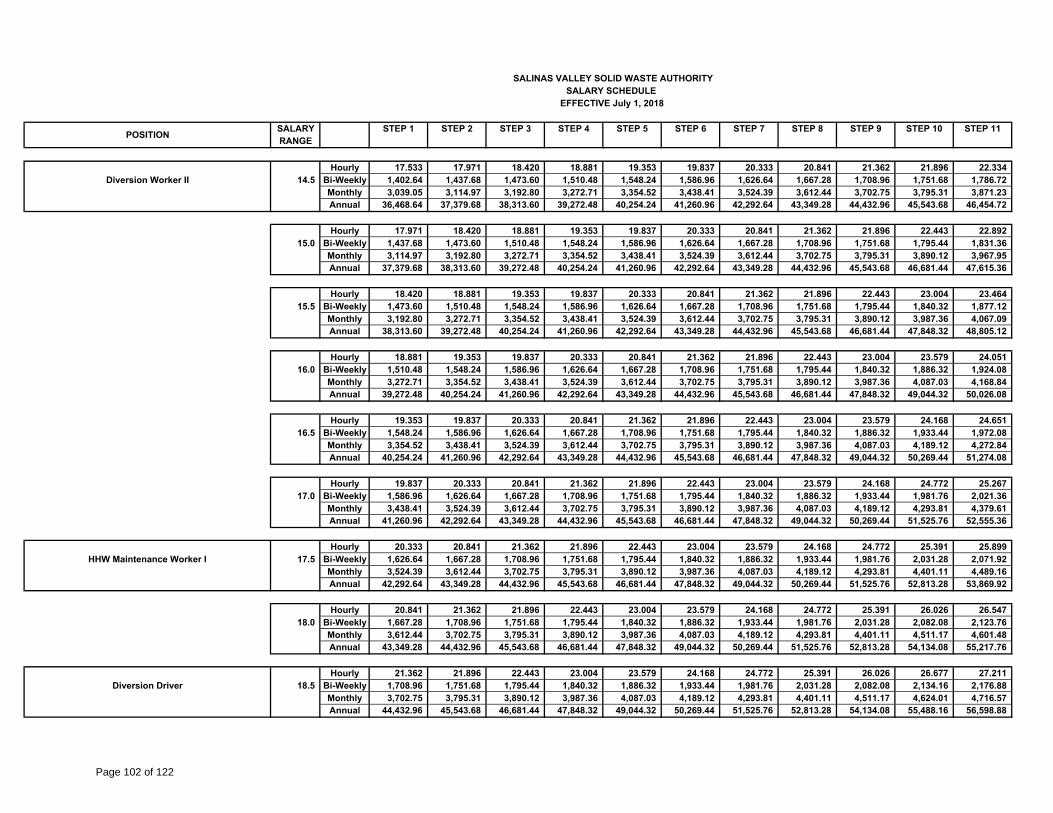
SALARY STEP 1 STEP 2 STEP 3 STEP 4 STEP 5 STEP 6 STEP 7 STEP 8 STEP 9 STEP 10 STEP 11RANGEPOSITION
SALINAS VALLEY SOLID WASTE AUTHORITYSALARY SCHEDULE
EFFECTIVE July 1, 2018
Hourly 17.533 17.971 18.420 18.881 19.353 19.837 20.333 20.841 21.362 21.896 22.334 Diversion Worker II 14.5 Bi-Weekly 1,402.64 1,437.68 1,473.60 1,510.48 1,548.24 1,586.96 1,626.64 1,667.28 1,708.96 1,751.68 1,786.72
Monthly 3,039.05 3,114.97 3,192.80 3,272.71 3,354.52 3,438.41 3,524.39 3,612.44 3,702.75 3,795.31 3,871.23 Annual 36,468.64 37,379.68 38,313.60 39,272.48 40,254.24 41,260.96 42,292.64 43,349.28 44,432.96 45,543.68 46,454.72
Hourly 17.971 18.420 18.881 19.353 19.837 20.333 20.841 21.362 21.896 22.443 22.892 15.0 Bi-Weekly 1,437.68 1,473.60 1,510.48 1,548.24 1,586.96 1,626.64 1,667.28 1,708.96 1,751.68 1,795.44 1,831.36
Monthly 3,114.97 3,192.80 3,272.71 3,354.52 3,438.41 3,524.39 3,612.44 3,702.75 3,795.31 3,890.12 3,967.95 Annual 37,379.68 38,313.60 39,272.48 40,254.24 41,260.96 42,292.64 43,349.28 44,432.96 45,543.68 46,681.44 47,615.36
Hourly 18.420 18.881 19.353 19.837 20.333 20.841 21.362 21.896 22.443 23.004 23.464 15.5 Bi-Weekly 1,473.60 1,510.48 1,548.24 1,586.96 1,626.64 1,667.28 1,708.96 1,751.68 1,795.44 1,840.32 1,877.12
Monthly 3,192.80 3,272.71 3,354.52 3,438.41 3,524.39 3,612.44 3,702.75 3,795.31 3,890.12 3,987.36 4,067.09 Annual 38,313.60 39,272.48 40,254.24 41,260.96 42,292.64 43,349.28 44,432.96 45,543.68 46,681.44 47,848.32 48,805.12
Hourly 18.881 19.353 19.837 20.333 20.841 21.362 21.896 22.443 23.004 23.579 24.051 16.0 Bi-Weekly 1,510.48 1,548.24 1,586.96 1,626.64 1,667.28 1,708.96 1,751.68 1,795.44 1,840.32 1,886.32 1,924.08
Monthly 3,272.71 3,354.52 3,438.41 3,524.39 3,612.44 3,702.75 3,795.31 3,890.12 3,987.36 4,087.03 4,168.84 Annual 39,272.48 40,254.24 41,260.96 42,292.64 43,349.28 44,432.96 45,543.68 46,681.44 47,848.32 49,044.32 50,026.08
Hourly 19.353 19.837 20.333 20.841 21.362 21.896 22.443 23.004 23.579 24.168 24.651 16.5 Bi-Weekly 1,548.24 1,586.96 1,626.64 1,667.28 1,708.96 1,751.68 1,795.44 1,840.32 1,886.32 1,933.44 1,972.08
Monthly 3,354.52 3,438.41 3,524.39 3,612.44 3,702.75 3,795.31 3,890.12 3,987.36 4,087.03 4,189.12 4,272.84 Annual 40,254.24 41,260.96 42,292.64 43,349.28 44,432.96 45,543.68 46,681.44 47,848.32 49,044.32 50,269.44 51,274.08
Hourly 19.837 20.333 20.841 21.362 21.896 22.443 23.004 23.579 24.168 24.772 25.267 17.0 Bi-Weekly 1,586.96 1,626.64 1,667.28 1,708.96 1,751.68 1,795.44 1,840.32 1,886.32 1,933.44 1,981.76 2,021.36
Monthly 3,438.41 3,524.39 3,612.44 3,702.75 3,795.31 3,890.12 3,987.36 4,087.03 4,189.12 4,293.81 4,379.61 Annual 41,260.96 42,292.64 43,349.28 44,432.96 45,543.68 46,681.44 47,848.32 49,044.32 50,269.44 51,525.76 52,555.36
Hourly 20.333 20.841 21.362 21.896 22.443 23.004 23.579 24.168 24.772 25.391 25.899 HHW Maintenance Worker I 17.5 Bi-Weekly 1,626.64 1,667.28 1,708.96 1,751.68 1,795.44 1,840.32 1,886.32 1,933.44 1,981.76 2,031.28 2,071.92
Monthly 3,524.39 3,612.44 3,702.75 3,795.31 3,890.12 3,987.36 4,087.03 4,189.12 4,293.81 4,401.11 4,489.16 Annual 42,292.64 43,349.28 44,432.96 45,543.68 46,681.44 47,848.32 49,044.32 50,269.44 51,525.76 52,813.28 53,869.92
Hourly 20.841 21.362 21.896 22.443 23.004 23.579 24.168 24.772 25.391 26.026 26.547 18.0 Bi-Weekly 1,667.28 1,708.96 1,751.68 1,795.44 1,840.32 1,886.32 1,933.44 1,981.76 2,031.28 2,082.08 2,123.76
Monthly 3,612.44 3,702.75 3,795.31 3,890.12 3,987.36 4,087.03 4,189.12 4,293.81 4,401.11 4,511.17 4,601.48 Annual 43,349.28 44,432.96 45,543.68 46,681.44 47,848.32 49,044.32 50,269.44 51,525.76 52,813.28 54,134.08 55,217.76
Hourly 21.362 21.896 22.443 23.004 23.579 24.168 24.772 25.391 26.026 26.677 27.211 Diversion Driver 18.5 Bi-Weekly 1,708.96 1,751.68 1,795.44 1,840.32 1,886.32 1,933.44 1,981.76 2,031.28 2,082.08 2,134.16 2,176.88
Monthly 3,702.75 3,795.31 3,890.12 3,987.36 4,087.03 4,189.12 4,293.81 4,401.11 4,511.17 4,624.01 4,716.57 Annual 44,432.96 45,543.68 46,681.44 47,848.32 49,044.32 50,269.44 51,525.76 52,813.28 54,134.08 55,488.16 56,598.88
Page 102 of 122
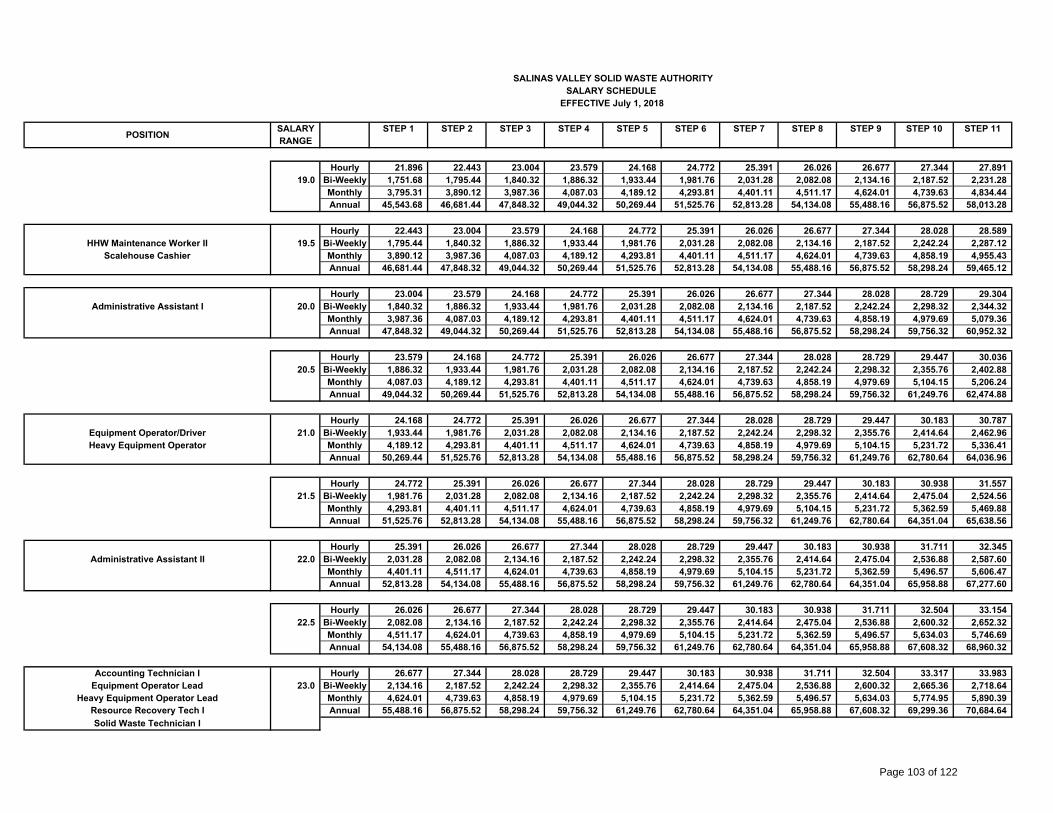
SALARY STEP 1 STEP 2 STEP 3 STEP 4 STEP 5 STEP 6 STEP 7 STEP 8 STEP 9 STEP 10 STEP 11RANGEPOSITION
SALINAS VALLEY SOLID WASTE AUTHORITYSALARY SCHEDULE
EFFECTIVE July 1, 2018
Hourly 21.896 22.443 23.004 23.579 24.168 24.772 25.391 26.026 26.677 27.344 27.891 19.0 Bi-Weekly 1,751.68 1,795.44 1,840.32 1,886.32 1,933.44 1,981.76 2,031.28 2,082.08 2,134.16 2,187.52 2,231.28
Monthly 3,795.31 3,890.12 3,987.36 4,087.03 4,189.12 4,293.81 4,401.11 4,511.17 4,624.01 4,739.63 4,834.44 Annual 45,543.68 46,681.44 47,848.32 49,044.32 50,269.44 51,525.76 52,813.28 54,134.08 55,488.16 56,875.52 58,013.28
Hourly 22.443 23.004 23.579 24.168 24.772 25.391 26.026 26.677 27.344 28.028 28.589 HHW Maintenance Worker II 19.5 Bi-Weekly 1,795.44 1,840.32 1,886.32 1,933.44 1,981.76 2,031.28 2,082.08 2,134.16 2,187.52 2,242.24 2,287.12
Scalehouse Cashier Monthly 3,890.12 3,987.36 4,087.03 4,189.12 4,293.81 4,401.11 4,511.17 4,624.01 4,739.63 4,858.19 4,955.43 Annual 46,681.44 47,848.32 49,044.32 50,269.44 51,525.76 52,813.28 54,134.08 55,488.16 56,875.52 58,298.24 59,465.12
Hourly 23.004 23.579 24.168 24.772 25.391 26.026 26.677 27.344 28.028 28.729 29.304 Administrative Assistant I 20.0 Bi-Weekly 1,840.32 1,886.32 1,933.44 1,981.76 2,031.28 2,082.08 2,134.16 2,187.52 2,242.24 2,298.32 2,344.32
Monthly 3,987.36 4,087.03 4,189.12 4,293.81 4,401.11 4,511.17 4,624.01 4,739.63 4,858.19 4,979.69 5,079.36 Annual 47,848.32 49,044.32 50,269.44 51,525.76 52,813.28 54,134.08 55,488.16 56,875.52 58,298.24 59,756.32 60,952.32
Hourly 23.579 24.168 24.772 25.391 26.026 26.677 27.344 28.028 28.729 29.447 30.036 20.5 Bi-Weekly 1,886.32 1,933.44 1,981.76 2,031.28 2,082.08 2,134.16 2,187.52 2,242.24 2,298.32 2,355.76 2,402.88
Monthly 4,087.03 4,189.12 4,293.81 4,401.11 4,511.17 4,624.01 4,739.63 4,858.19 4,979.69 5,104.15 5,206.24 Annual 49,044.32 50,269.44 51,525.76 52,813.28 54,134.08 55,488.16 56,875.52 58,298.24 59,756.32 61,249.76 62,474.88
Hourly 24.168 24.772 25.391 26.026 26.677 27.344 28.028 28.729 29.447 30.183 30.787 Equipment Operator/Driver 21.0 Bi-Weekly 1,933.44 1,981.76 2,031.28 2,082.08 2,134.16 2,187.52 2,242.24 2,298.32 2,355.76 2,414.64 2,462.96 Heavy Equipment Operator Monthly 4,189.12 4,293.81 4,401.11 4,511.17 4,624.01 4,739.63 4,858.19 4,979.69 5,104.15 5,231.72 5,336.41
Annual 50,269.44 51,525.76 52,813.28 54,134.08 55,488.16 56,875.52 58,298.24 59,756.32 61,249.76 62,780.64 64,036.96
Hourly 24.772 25.391 26.026 26.677 27.344 28.028 28.729 29.447 30.183 30.938 31.557 21.5 Bi-Weekly 1,981.76 2,031.28 2,082.08 2,134.16 2,187.52 2,242.24 2,298.32 2,355.76 2,414.64 2,475.04 2,524.56
Monthly 4,293.81 4,401.11 4,511.17 4,624.01 4,739.63 4,858.19 4,979.69 5,104.15 5,231.72 5,362.59 5,469.88 Annual 51,525.76 52,813.28 54,134.08 55,488.16 56,875.52 58,298.24 59,756.32 61,249.76 62,780.64 64,351.04 65,638.56
Hourly 25.391 26.026 26.677 27.344 28.028 28.729 29.447 30.183 30.938 31.711 32.345 Administrative Assistant II 22.0 Bi-Weekly 2,031.28 2,082.08 2,134.16 2,187.52 2,242.24 2,298.32 2,355.76 2,414.64 2,475.04 2,536.88 2,587.60
Monthly 4,401.11 4,511.17 4,624.01 4,739.63 4,858.19 4,979.69 5,104.15 5,231.72 5,362.59 5,496.57 5,606.47 Annual 52,813.28 54,134.08 55,488.16 56,875.52 58,298.24 59,756.32 61,249.76 62,780.64 64,351.04 65,958.88 67,277.60
Hourly 26.026 26.677 27.344 28.028 28.729 29.447 30.183 30.938 31.711 32.504 33.154 22.5 Bi-Weekly 2,082.08 2,134.16 2,187.52 2,242.24 2,298.32 2,355.76 2,414.64 2,475.04 2,536.88 2,600.32 2,652.32
Monthly 4,511.17 4,624.01 4,739.63 4,858.19 4,979.69 5,104.15 5,231.72 5,362.59 5,496.57 5,634.03 5,746.69 Annual 54,134.08 55,488.16 56,875.52 58,298.24 59,756.32 61,249.76 62,780.64 64,351.04 65,958.88 67,608.32 68,960.32
Accounting Technician I Hourly 26.677 27.344 28.028 28.729 29.447 30.183 30.938 31.711 32.504 33.317 33.983 Equipment Operator Lead 23.0 Bi-Weekly 2,134.16 2,187.52 2,242.24 2,298.32 2,355.76 2,414.64 2,475.04 2,536.88 2,600.32 2,665.36 2,718.64
Heavy Equipment Operator Lead Monthly 4,624.01 4,739.63 4,858.19 4,979.69 5,104.15 5,231.72 5,362.59 5,496.57 5,634.03 5,774.95 5,890.39 Resource Recovery Tech I Annual 55,488.16 56,875.52 58,298.24 59,756.32 61,249.76 62,780.64 64,351.04 65,958.88 67,608.32 69,299.36 70,684.64 Solid Waste Technician I
Page 103 of 122

SALARY STEP 1 STEP 2 STEP 3 STEP 4 STEP 5 STEP 6 STEP 7 STEP 8 STEP 9 STEP 10 STEP 11RANGEPOSITION
SALINAS VALLEY SOLID WASTE AUTHORITYSALARY SCHEDULE
EFFECTIVE July 1, 2018
Hourly 27.344 28.028 28.729 29.447 30.183 30.938 31.711 32.504 33.317 34.150 34.833 23.5 Bi-Weekly 2,187.52 2,242.24 2,298.32 2,355.76 2,414.64 2,475.04 2,536.88 2,600.32 2,665.36 2,732.00 2,786.64
Monthly 4,739.63 4,858.19 4,979.69 5,104.15 5,231.72 5,362.59 5,496.57 5,634.03 5,774.95 5,919.33 6,037.72 Annual 56,875.52 58,298.24 59,756.32 61,249.76 62,780.64 64,351.04 65,958.88 67,608.32 69,299.36 71,032.00 72,452.64
Hourly 28.028 28.729 29.447 30.183 30.938 31.711 32.504 33.317 34.150 35.004 35.704 24.0 Bi-Weekly 2,242.24 2,298.32 2,355.76 2,414.64 2,475.04 2,536.88 2,600.32 2,665.36 2,732.00 2,800.32 2,856.32
Monthly 4,858.19 4,979.69 5,104.15 5,231.72 5,362.59 5,496.57 5,634.03 5,774.95 5,919.33 6,067.36 6,188.69 Annual 58,298.24 59,756.32 61,249.76 62,780.64 64,351.04 65,958.88 67,608.32 69,299.36 71,032.00 72,808.32 74,264.32
Hourly 28.729 29.447 30.183 30.938 31.711 32.504 33.317 34.150 35.004 35.879 36.597 HHW Technician 24.5 Bi-Weekly 2,298.32 2,355.76 2,414.64 2,475.04 2,536.88 2,600.32 2,665.36 2,732.00 2,800.32 2,870.32 2,927.76
Monthly 4,979.69 5,104.15 5,231.72 5,362.59 5,496.57 5,634.03 5,774.95 5,919.33 6,067.36 6,219.03 6,343.48 Annual 59,756.32 61,249.76 62,780.64 64,351.04 65,958.88 67,608.32 69,299.36 71,032.00 72,808.32 74,628.32 76,121.76
Accounting Technician II Hourly 29.447 30.183 30.938 31.711 32.504 33.317 34.150 35.004 35.879 36.776 37.512 Resource Recovery Tech II 25.0 Bi-Weekly 2,355.76 2,414.64 2,475.04 2,536.88 2,600.32 2,665.36 2,732.00 2,800.32 2,870.32 2,942.08 3,000.96 Solid Waste Technician II Monthly 5,104.15 5,231.72 5,362.59 5,496.57 5,634.03 5,774.95 5,919.33 6,067.36 6,219.03 6,374.51 6,502.08
Annual 61,249.76 62,780.64 64,351.04 65,958.88 67,608.32 69,299.36 71,032.00 72,808.32 74,628.32 76,494.08 78,024.96
Hourly 30.183 30.938 31.711 32.504 33.317 34.150 35.004 35.879 36.776 37.695 38.449 Clerk of the Board 25.5 Bi-Weekly 2,414.64 2,475.04 2,536.88 2,600.32 2,665.36 2,732.00 2,800.32 2,870.32 2,942.08 3,015.60 3,075.92
Monthly 5,231.72 5,362.59 5,496.57 5,634.03 5,774.95 5,919.33 6,067.36 6,219.03 6,374.51 6,533.80 6,664.49 Annual 62,780.64 64,351.04 65,958.88 67,608.32 69,299.36 71,032.00 72,808.32 74,628.32 76,494.08 78,405.60 79,973.92
Hourly 30.938 31.711 32.504 33.317 34.150 35.004 35.879 36.776 37.695 38.637 39.410 26.0 Bi-Weekly 2,475.04 2,536.88 2,600.32 2,665.36 2,732.00 2,800.32 2,870.32 2,942.08 3,015.60 3,090.96 3,152.80
Monthly 5,362.59 5,496.57 5,634.03 5,774.95 5,919.33 6,067.36 6,219.03 6,374.51 6,533.80 6,697.08 6,831.07 Annual 64,351.04 65,958.88 67,608.32 69,299.36 71,032.00 72,808.32 74,628.32 76,494.08 78,405.60 80,364.96 81,972.80
Hourly 31.711 32.504 33.317 34.150 35.004 35.879 36.776 37.695 38.637 39.603 40.395 26.5 Bi-Weekly 2,536.88 2,600.32 2,665.36 2,732.00 2,800.32 2,870.32 2,942.08 3,015.60 3,090.96 3,168.24 3,231.60
Monthly 5,496.57 5,634.03 5,774.95 5,919.33 6,067.36 6,219.03 6,374.51 6,533.80 6,697.08 6,864.52 7,001.80 Annual 65,958.88 67,608.32 69,299.36 71,032.00 72,808.32 74,628.32 76,494.08 78,405.60 80,364.96 82,374.24 84,021.60
Hourly 32.504 33.317 34.150 35.004 35.879 36.776 37.695 38.637 39.603 40.593 41.405 27.0 Bi-Weekly 2,600.32 2,665.36 2,732.00 2,800.32 2,870.32 2,942.08 3,015.60 3,090.96 3,168.24 3,247.44 3,312.40
Monthly 5,634.03 5,774.95 5,919.33 6,067.36 6,219.03 6,374.51 6,533.80 6,697.08 6,864.52 7,036.12 7,176.87 Annual 67,608.32 69,299.36 71,032.00 72,808.32 74,628.32 76,494.08 78,405.60 80,364.96 82,374.24 84,433.44 86,122.40
Hourly 33.317 34.150 35.004 35.879 36.776 37.695 38.637 39.603 40.593 41.608 42.440 27.5 Bi-Weekly 2,665.36 2,732.00 2,800.32 2,870.32 2,942.08 3,015.60 3,090.96 3,168.24 3,247.44 3,328.64 3,395.20
Monthly 5,774.95 5,919.33 6,067.36 6,219.03 6,374.51 6,533.80 6,697.08 6,864.52 7,036.12 7,212.05 7,356.27 Annual 69,299.36 71,032.00 72,808.32 74,628.32 76,494.08 78,405.60 80,364.96 82,374.24 84,433.44 86,544.64 88,275.20
Page 104 of 122
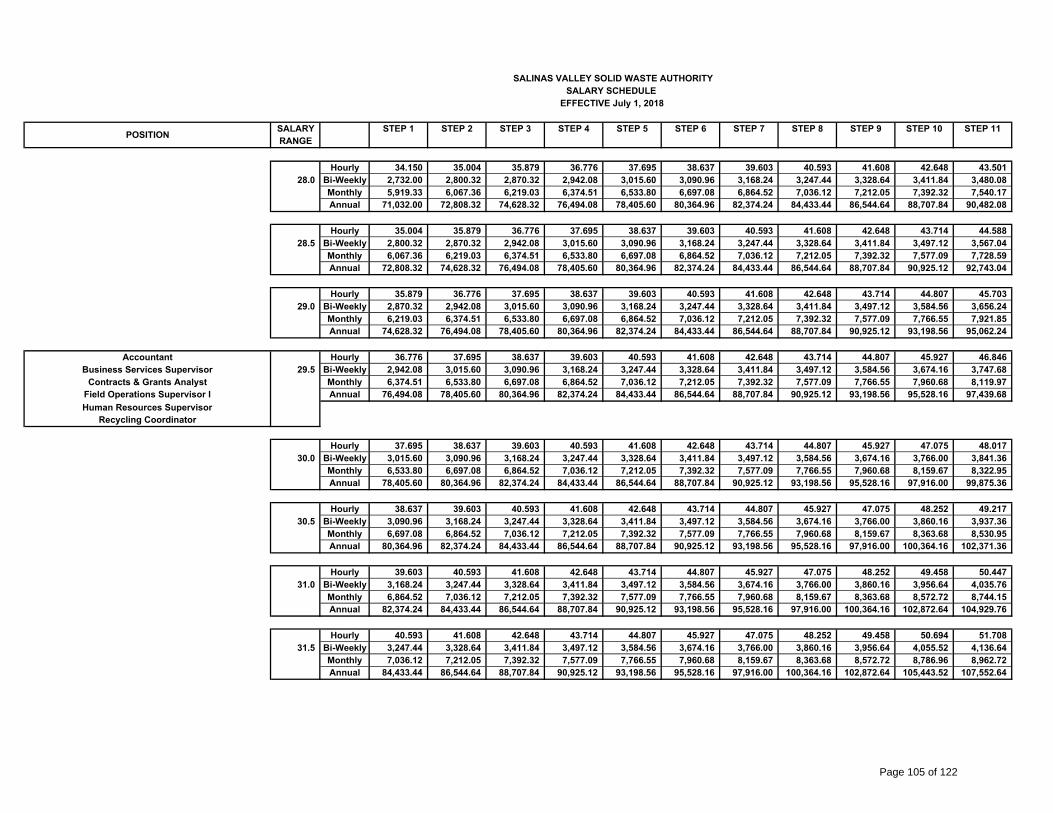
SALARY STEP 1 STEP 2 STEP 3 STEP 4 STEP 5 STEP 6 STEP 7 STEP 8 STEP 9 STEP 10 STEP 11RANGEPOSITION
SALINAS VALLEY SOLID WASTE AUTHORITYSALARY SCHEDULE
EFFECTIVE July 1, 2018
Hourly 34.150 35.004 35.879 36.776 37.695 38.637 39.603 40.593 41.608 42.648 43.501 28.0 Bi-Weekly 2,732.00 2,800.32 2,870.32 2,942.08 3,015.60 3,090.96 3,168.24 3,247.44 3,328.64 3,411.84 3,480.08
Monthly 5,919.33 6,067.36 6,219.03 6,374.51 6,533.80 6,697.08 6,864.52 7,036.12 7,212.05 7,392.32 7,540.17 Annual 71,032.00 72,808.32 74,628.32 76,494.08 78,405.60 80,364.96 82,374.24 84,433.44 86,544.64 88,707.84 90,482.08
Hourly 35.004 35.879 36.776 37.695 38.637 39.603 40.593 41.608 42.648 43.714 44.588 28.5 Bi-Weekly 2,800.32 2,870.32 2,942.08 3,015.60 3,090.96 3,168.24 3,247.44 3,328.64 3,411.84 3,497.12 3,567.04
Monthly 6,067.36 6,219.03 6,374.51 6,533.80 6,697.08 6,864.52 7,036.12 7,212.05 7,392.32 7,577.09 7,728.59 Annual 72,808.32 74,628.32 76,494.08 78,405.60 80,364.96 82,374.24 84,433.44 86,544.64 88,707.84 90,925.12 92,743.04
Hourly 35.879 36.776 37.695 38.637 39.603 40.593 41.608 42.648 43.714 44.807 45.703 29.0 Bi-Weekly 2,870.32 2,942.08 3,015.60 3,090.96 3,168.24 3,247.44 3,328.64 3,411.84 3,497.12 3,584.56 3,656.24
Monthly 6,219.03 6,374.51 6,533.80 6,697.08 6,864.52 7,036.12 7,212.05 7,392.32 7,577.09 7,766.55 7,921.85 Annual 74,628.32 76,494.08 78,405.60 80,364.96 82,374.24 84,433.44 86,544.64 88,707.84 90,925.12 93,198.56 95,062.24
Accountant Hourly 36.776 37.695 38.637 39.603 40.593 41.608 42.648 43.714 44.807 45.927 46.846 Business Services Supervisor 29.5 Bi-Weekly 2,942.08 3,015.60 3,090.96 3,168.24 3,247.44 3,328.64 3,411.84 3,497.12 3,584.56 3,674.16 3,747.68
Contracts & Grants Analyst Monthly 6,374.51 6,533.80 6,697.08 6,864.52 7,036.12 7,212.05 7,392.32 7,577.09 7,766.55 7,960.68 8,119.97 Field Operations Supervisor I Annual 76,494.08 78,405.60 80,364.96 82,374.24 84,433.44 86,544.64 88,707.84 90,925.12 93,198.56 95,528.16 97,439.68 Human Resources Supervisor
Recycling Coordinator
Hourly 37.695 38.637 39.603 40.593 41.608 42.648 43.714 44.807 45.927 47.075 48.017 30.0 Bi-Weekly 3,015.60 3,090.96 3,168.24 3,247.44 3,328.64 3,411.84 3,497.12 3,584.56 3,674.16 3,766.00 3,841.36
Monthly 6,533.80 6,697.08 6,864.52 7,036.12 7,212.05 7,392.32 7,577.09 7,766.55 7,960.68 8,159.67 8,322.95 Annual 78,405.60 80,364.96 82,374.24 84,433.44 86,544.64 88,707.84 90,925.12 93,198.56 95,528.16 97,916.00 99,875.36
Hourly 38.637 39.603 40.593 41.608 42.648 43.714 44.807 45.927 47.075 48.252 49.217 30.5 Bi-Weekly 3,090.96 3,168.24 3,247.44 3,328.64 3,411.84 3,497.12 3,584.56 3,674.16 3,766.00 3,860.16 3,937.36
Monthly 6,697.08 6,864.52 7,036.12 7,212.05 7,392.32 7,577.09 7,766.55 7,960.68 8,159.67 8,363.68 8,530.95 Annual 80,364.96 82,374.24 84,433.44 86,544.64 88,707.84 90,925.12 93,198.56 95,528.16 97,916.00 100,364.16 102,371.36
Hourly 39.603 40.593 41.608 42.648 43.714 44.807 45.927 47.075 48.252 49.458 50.447 31.0 Bi-Weekly 3,168.24 3,247.44 3,328.64 3,411.84 3,497.12 3,584.56 3,674.16 3,766.00 3,860.16 3,956.64 4,035.76
Monthly 6,864.52 7,036.12 7,212.05 7,392.32 7,577.09 7,766.55 7,960.68 8,159.67 8,363.68 8,572.72 8,744.15 Annual 82,374.24 84,433.44 86,544.64 88,707.84 90,925.12 93,198.56 95,528.16 97,916.00 100,364.16 102,872.64 104,929.76
Hourly 40.593 41.608 42.648 43.714 44.807 45.927 47.075 48.252 49.458 50.694 51.708 31.5 Bi-Weekly 3,247.44 3,328.64 3,411.84 3,497.12 3,584.56 3,674.16 3,766.00 3,860.16 3,956.64 4,055.52 4,136.64
Monthly 7,036.12 7,212.05 7,392.32 7,577.09 7,766.55 7,960.68 8,159.67 8,363.68 8,572.72 8,786.96 8,962.72 Annual 84,433.44 86,544.64 88,707.84 90,925.12 93,198.56 95,528.16 97,916.00 100,364.16 102,872.64 105,443.52 107,552.64
Page 105 of 122

SALARY STEP 1 STEP 2 STEP 3 STEP 4 STEP 5 STEP 6 STEP 7 STEP 8 STEP 9 STEP 10 STEP 11RANGEPOSITION
SALINAS VALLEY SOLID WASTE AUTHORITYSALARY SCHEDULE
EFFECTIVE July 1, 2018
Hourly 41.608 42.648 43.714 44.807 45.927 47.075 48.252 49.458 50.694 51.961 53.000 32.0 Bi-Weekly 3,328.64 3,411.84 3,497.12 3,584.56 3,674.16 3,766.00 3,860.16 3,956.64 4,055.52 4,156.88 4,240.00
Monthly 7,212.05 7,392.32 7,577.09 7,766.55 7,960.68 8,159.67 8,363.68 8,572.72 8,786.96 9,006.57 9,186.67 Annual 86,544.64 88,707.84 90,925.12 93,198.56 95,528.16 97,916.00 100,364.16 102,872.64 105,443.52 108,078.88 110,240.00
Hourly 42.648 43.714 44.807 45.927 47.075 48.252 49.458 50.694 51.961 53.260 54.325 32.5 Bi-Weekly 3,411.84 3,497.12 3,584.56 3,674.16 3,766.00 3,860.16 3,956.64 4,055.52 4,156.88 4,260.80 4,346.00
Monthly 7,392.32 7,577.09 7,766.55 7,960.68 8,159.67 8,363.68 8,572.72 8,786.96 9,006.57 9,231.73 9,416.33 Annual 88,707.84 90,925.12 93,198.56 95,528.16 97,916.00 100,364.16 102,872.64 105,443.52 108,078.88 110,780.80 112,996.00
Hourly 43.714 44.807 45.927 47.075 48.252 49.458 50.694 51.961 53.260 54.592 55.684 33.0 Bi-Weekly 3,497.12 3,584.56 3,674.16 3,766.00 3,860.16 3,956.64 4,055.52 4,156.88 4,260.80 4,367.36 4,454.72
Monthly 7,577.09 7,766.55 7,960.68 8,159.67 8,363.68 8,572.72 8,786.96 9,006.57 9,231.73 9,462.61 9,651.89 Annual 90,925.12 93,198.56 95,528.16 97,916.00 100,364.16 102,872.64 105,443.52 108,078.88 110,780.80 113,551.36 115,822.72
Hourly 44.807 45.927 47.075 48.252 49.458 50.694 51.961 53.260 54.592 55.957 57.076 33.5 Bi-Weekly 3,584.56 3,674.16 3,766.00 3,860.16 3,956.64 4,055.52 4,156.88 4,260.80 4,367.36 4,476.56 4,566.08
Monthly 7,766.55 7,960.68 8,159.67 8,363.68 8,572.72 8,786.96 9,006.57 9,231.73 9,462.61 9,699.21 9,893.17 Annual 93,198.56 95,528.16 97,916.00 100,364.16 102,872.64 105,443.52 108,078.88 110,780.80 113,551.36 116,390.56 118,718.08
Hourly 45.927 47.075 48.252 49.458 50.694 51.961 53.260 54.592 55.957 57.356 58.503 34.0 Bi-Weekly 3,674.16 3,766.00 3,860.16 3,956.64 4,055.52 4,156.88 4,260.80 4,367.36 4,476.56 4,588.48 4,680.24
Monthly 7,960.68 8,159.67 8,363.68 8,572.72 8,786.96 9,006.57 9,231.73 9,462.61 9,699.21 9,941.71 10,140.52 Annual 95,528.16 97,916.00 100,364.16 102,872.64 105,443.52 108,078.88 110,780.80 113,551.36 116,390.56 119,300.48 121,686.24
Hourly 47.075 48.252 49.458 50.694 51.961 53.260 54.592 55.957 57.356 58.790 59.966 34.5 Bi-Weekly 3,766.00 3,860.16 3,956.64 4,055.52 4,156.88 4,260.80 4,367.36 4,476.56 4,588.48 4,703.20 4,797.28
Monthly 8,159.67 8,363.68 8,572.72 8,786.96 9,006.57 9,231.73 9,462.61 9,699.21 9,941.71 10,190.27 10,394.11 Annual 97,916.00 100,364.16 102,872.64 105,443.52 108,078.88 110,780.80 113,551.36 116,390.56 119,300.48 122,283.20 124,729.28
Engineering and Environmental Compliance Manager Hourly 48.252 49.458 50.694 51.961 53.260 54.592 55.957 57.356 58.790 60.260 61.465 Finance and Administration Manager 35.0 Bi-Weekly 3,860.16 3,956.64 4,055.52 4,156.88 4,260.80 4,367.36 4,476.56 4,588.48 4,703.20 4,820.80 4,917.20
Operations Manager Monthly 8,363.68 8,572.72 8,786.96 9,006.57 9,231.73 9,462.61 9,699.21 9,941.71 10,190.27 10,445.07 10,653.93 Resource Recovery Manager Annual 100,364.16 102,872.64 105,443.52 108,078.88 110,780.80 113,551.36 116,390.56 119,300.48 122,283.20 125,340.80 127,847.20
Hourly 49.458 50.694 51.961 53.260 54.592 55.957 57.356 58.790 60.260 61.767 63.002 35.5 Bi-Weekly 3,956.64 4,055.52 4,156.88 4,260.80 4,367.36 4,476.56 4,588.48 4,703.20 4,820.80 4,941.36 5,040.16
Monthly 8,572.72 8,786.96 9,006.57 9,231.73 9,462.61 9,699.21 9,941.71 10,190.27 10,445.07 10,706.28 10,920.35 Annual 102,872.64 105,443.52 108,078.88 110,780.80 113,551.36 116,390.56 119,300.48 122,283.20 125,340.80 128,475.36 131,044.16
Hourly 50.694 51.961 53.260 54.592 55.957 57.356 58.790 60.260 61.767 63.311 64.577 36.0 Bi-Weekly 4,055.52 4,156.88 4,260.80 4,367.36 4,476.56 4,588.48 4,703.20 4,820.80 4,941.36 5,064.88 5,166.16
Monthly 8,786.96 9,006.57 9,231.73 9,462.61 9,699.21 9,941.71 10,190.27 10,445.07 10,706.28 10,973.91 11,193.35 Annual 105,443.52 108,078.88 110,780.80 113,551.36 116,390.56 119,300.48 122,283.20 125,340.80 128,475.36 131,686.88 134,320.16
Page 106 of 122
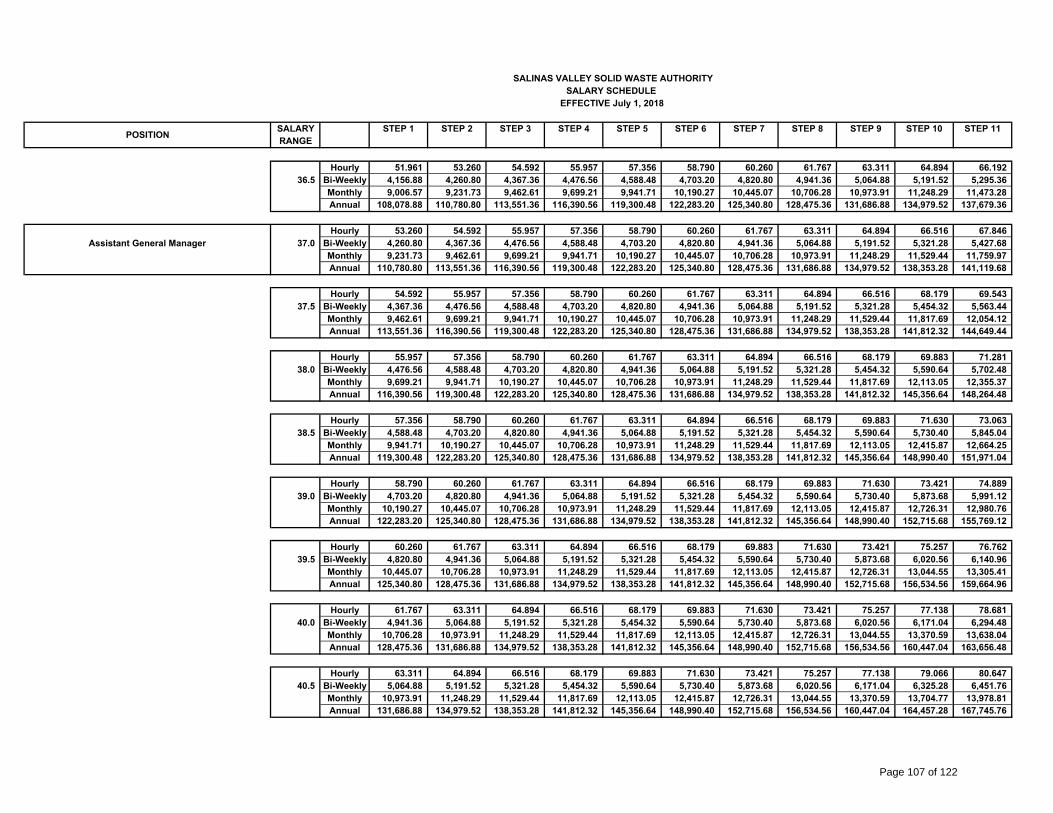
SALARY STEP 1 STEP 2 STEP 3 STEP 4 STEP 5 STEP 6 STEP 7 STEP 8 STEP 9 STEP 10 STEP 11RANGEPOSITION
SALINAS VALLEY SOLID WASTE AUTHORITYSALARY SCHEDULE
EFFECTIVE July 1, 2018
Hourly 51.961 53.260 54.592 55.957 57.356 58.790 60.260 61.767 63.311 64.894 66.192 36.5 Bi-Weekly 4,156.88 4,260.80 4,367.36 4,476.56 4,588.48 4,703.20 4,820.80 4,941.36 5,064.88 5,191.52 5,295.36
Monthly 9,006.57 9,231.73 9,462.61 9,699.21 9,941.71 10,190.27 10,445.07 10,706.28 10,973.91 11,248.29 11,473.28 Annual 108,078.88 110,780.80 113,551.36 116,390.56 119,300.48 122,283.20 125,340.80 128,475.36 131,686.88 134,979.52 137,679.36
Hourly 53.260 54.592 55.957 57.356 58.790 60.260 61.767 63.311 64.894 66.516 67.846 Assistant General Manager 37.0 Bi-Weekly 4,260.80 4,367.36 4,476.56 4,588.48 4,703.20 4,820.80 4,941.36 5,064.88 5,191.52 5,321.28 5,427.68
Monthly 9,231.73 9,462.61 9,699.21 9,941.71 10,190.27 10,445.07 10,706.28 10,973.91 11,248.29 11,529.44 11,759.97 Annual 110,780.80 113,551.36 116,390.56 119,300.48 122,283.20 125,340.80 128,475.36 131,686.88 134,979.52 138,353.28 141,119.68
Hourly 54.592 55.957 57.356 58.790 60.260 61.767 63.311 64.894 66.516 68.179 69.543 37.5 Bi-Weekly 4,367.36 4,476.56 4,588.48 4,703.20 4,820.80 4,941.36 5,064.88 5,191.52 5,321.28 5,454.32 5,563.44
Monthly 9,462.61 9,699.21 9,941.71 10,190.27 10,445.07 10,706.28 10,973.91 11,248.29 11,529.44 11,817.69 12,054.12 Annual 113,551.36 116,390.56 119,300.48 122,283.20 125,340.80 128,475.36 131,686.88 134,979.52 138,353.28 141,812.32 144,649.44
Hourly 55.957 57.356 58.790 60.260 61.767 63.311 64.894 66.516 68.179 69.883 71.281 38.0 Bi-Weekly 4,476.56 4,588.48 4,703.20 4,820.80 4,941.36 5,064.88 5,191.52 5,321.28 5,454.32 5,590.64 5,702.48
Monthly 9,699.21 9,941.71 10,190.27 10,445.07 10,706.28 10,973.91 11,248.29 11,529.44 11,817.69 12,113.05 12,355.37 Annual 116,390.56 119,300.48 122,283.20 125,340.80 128,475.36 131,686.88 134,979.52 138,353.28 141,812.32 145,356.64 148,264.48
Hourly 57.356 58.790 60.260 61.767 63.311 64.894 66.516 68.179 69.883 71.630 73.063 38.5 Bi-Weekly 4,588.48 4,703.20 4,820.80 4,941.36 5,064.88 5,191.52 5,321.28 5,454.32 5,590.64 5,730.40 5,845.04
Monthly 9,941.71 10,190.27 10,445.07 10,706.28 10,973.91 11,248.29 11,529.44 11,817.69 12,113.05 12,415.87 12,664.25 Annual 119,300.48 122,283.20 125,340.80 128,475.36 131,686.88 134,979.52 138,353.28 141,812.32 145,356.64 148,990.40 151,971.04
Hourly 58.790 60.260 61.767 63.311 64.894 66.516 68.179 69.883 71.630 73.421 74.889 39.0 Bi-Weekly 4,703.20 4,820.80 4,941.36 5,064.88 5,191.52 5,321.28 5,454.32 5,590.64 5,730.40 5,873.68 5,991.12
Monthly 10,190.27 10,445.07 10,706.28 10,973.91 11,248.29 11,529.44 11,817.69 12,113.05 12,415.87 12,726.31 12,980.76 Annual 122,283.20 125,340.80 128,475.36 131,686.88 134,979.52 138,353.28 141,812.32 145,356.64 148,990.40 152,715.68 155,769.12
Hourly 60.260 61.767 63.311 64.894 66.516 68.179 69.883 71.630 73.421 75.257 76.762 39.5 Bi-Weekly 4,820.80 4,941.36 5,064.88 5,191.52 5,321.28 5,454.32 5,590.64 5,730.40 5,873.68 6,020.56 6,140.96
Monthly 10,445.07 10,706.28 10,973.91 11,248.29 11,529.44 11,817.69 12,113.05 12,415.87 12,726.31 13,044.55 13,305.41 Annual 125,340.80 128,475.36 131,686.88 134,979.52 138,353.28 141,812.32 145,356.64 148,990.40 152,715.68 156,534.56 159,664.96
Hourly 61.767 63.311 64.894 66.516 68.179 69.883 71.630 73.421 75.257 77.138 78.681 40.0 Bi-Weekly 4,941.36 5,064.88 5,191.52 5,321.28 5,454.32 5,590.64 5,730.40 5,873.68 6,020.56 6,171.04 6,294.48
Monthly 10,706.28 10,973.91 11,248.29 11,529.44 11,817.69 12,113.05 12,415.87 12,726.31 13,044.55 13,370.59 13,638.04 Annual 128,475.36 131,686.88 134,979.52 138,353.28 141,812.32 145,356.64 148,990.40 152,715.68 156,534.56 160,447.04 163,656.48
Hourly 63.311 64.894 66.516 68.179 69.883 71.630 73.421 75.257 77.138 79.066 80.647 40.5 Bi-Weekly 5,064.88 5,191.52 5,321.28 5,454.32 5,590.64 5,730.40 5,873.68 6,020.56 6,171.04 6,325.28 6,451.76
Monthly 10,973.91 11,248.29 11,529.44 11,817.69 12,113.05 12,415.87 12,726.31 13,044.55 13,370.59 13,704.77 13,978.81 Annual 131,686.88 134,979.52 138,353.28 141,812.32 145,356.64 148,990.40 152,715.68 156,534.56 160,447.04 164,457.28 167,745.76
Page 107 of 122
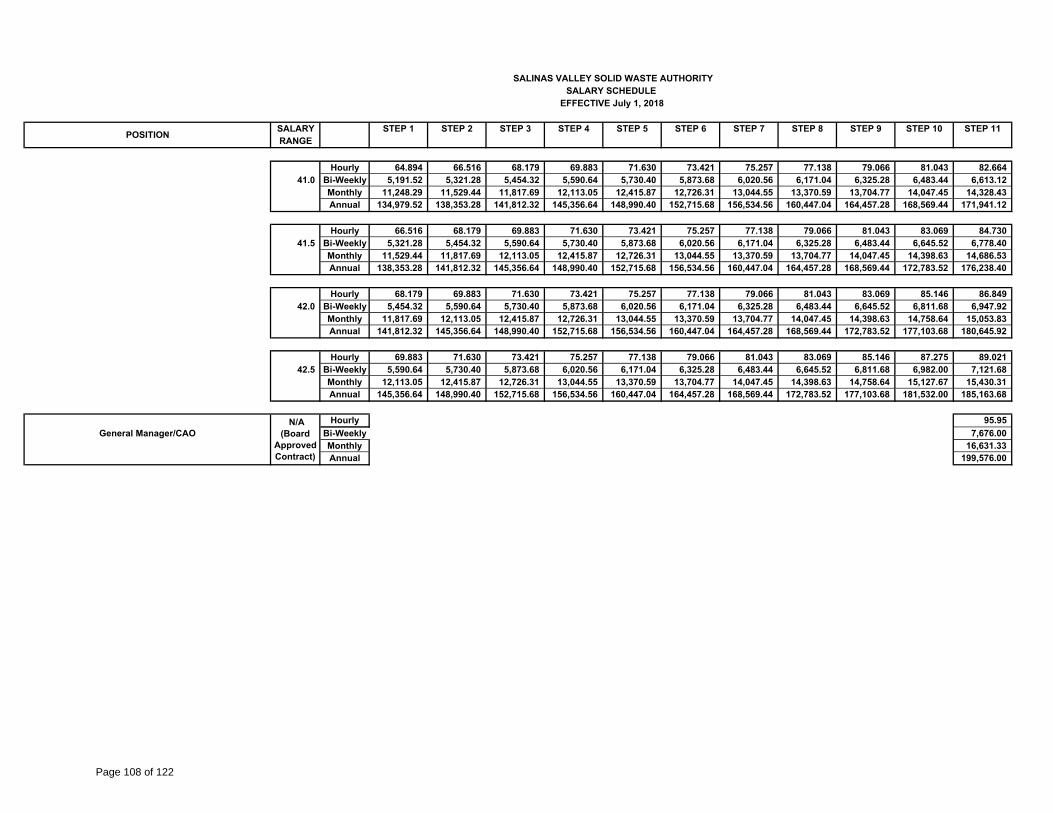
SALARY STEP 1 STEP 2 STEP 3 STEP 4 STEP 5 STEP 6 STEP 7 STEP 8 STEP 9 STEP 10 STEP 11RANGEPOSITION
SALINAS VALLEY SOLID WASTE AUTHORITYSALARY SCHEDULE
EFFECTIVE July 1, 2018
Hourly 64.894 66.516 68.179 69.883 71.630 73.421 75.257 77.138 79.066 81.043 82.664 41.0 Bi-Weekly 5,191.52 5,321.28 5,454.32 5,590.64 5,730.40 5,873.68 6,020.56 6,171.04 6,325.28 6,483.44 6,613.12
Monthly 11,248.29 11,529.44 11,817.69 12,113.05 12,415.87 12,726.31 13,044.55 13,370.59 13,704.77 14,047.45 14,328.43 Annual 134,979.52 138,353.28 141,812.32 145,356.64 148,990.40 152,715.68 156,534.56 160,447.04 164,457.28 168,569.44 171,941.12
Hourly 66.516 68.179 69.883 71.630 73.421 75.257 77.138 79.066 81.043 83.069 84.730 41.5 Bi-Weekly 5,321.28 5,454.32 5,590.64 5,730.40 5,873.68 6,020.56 6,171.04 6,325.28 6,483.44 6,645.52 6,778.40
Monthly 11,529.44 11,817.69 12,113.05 12,415.87 12,726.31 13,044.55 13,370.59 13,704.77 14,047.45 14,398.63 14,686.53 Annual 138,353.28 141,812.32 145,356.64 148,990.40 152,715.68 156,534.56 160,447.04 164,457.28 168,569.44 172,783.52 176,238.40
Hourly 68.179 69.883 71.630 73.421 75.257 77.138 79.066 81.043 83.069 85.146 86.849 42.0 Bi-Weekly 5,454.32 5,590.64 5,730.40 5,873.68 6,020.56 6,171.04 6,325.28 6,483.44 6,645.52 6,811.68 6,947.92
Monthly 11,817.69 12,113.05 12,415.87 12,726.31 13,044.55 13,370.59 13,704.77 14,047.45 14,398.63 14,758.64 15,053.83 Annual 141,812.32 145,356.64 148,990.40 152,715.68 156,534.56 160,447.04 164,457.28 168,569.44 172,783.52 177,103.68 180,645.92
Hourly 69.883 71.630 73.421 75.257 77.138 79.066 81.043 83.069 85.146 87.275 89.021 42.5 Bi-Weekly 5,590.64 5,730.40 5,873.68 6,020.56 6,171.04 6,325.28 6,483.44 6,645.52 6,811.68 6,982.00 7,121.68
Monthly 12,113.05 12,415.87 12,726.31 13,044.55 13,370.59 13,704.77 14,047.45 14,398.63 14,758.64 15,127.67 15,430.31 Annual 145,356.64 148,990.40 152,715.68 156,534.56 160,447.04 164,457.28 168,569.44 172,783.52 177,103.68 181,532.00 185,163.68
Hourly 95.95 General Manager/CAO Bi-Weekly 7,676.00
Monthly 16,631.33 Annual 199,576.00
N/A (Board
Approved Contract)
Page 108 of 122

Period Fiscal Year Fiscal YearEnding Principal Interest Total Ended Total8/1/2018 1,265,000 733,937.50 1,998,937.50 2/1/2019 - 702,312.50 702,312.50 6/30/2019 2,701,250.00 8/1/2019 1,330,000 702,312.50 2,032,312.50 2/1/2020 - 669,062.50 669,062.50 6/30/2020 2,701,375.00 8/1/2020 1,400,000 669,062.50 2,069,062.50 2/1/2021 - 634,062.50 634,062.50 6/30/2021 2,703,125.00 8/1/2021 1,470,000 634,062.50 2,104,062.50 2/1/2022 - 597,312.50 597,312.50 6/30/2022 2,701,375.00 8/1/2022 1,545,000 597,312.50 2,142,312.50 2/1/2023 - 558,687.50 558,687.50 6/30/2023 2,701,000.00 8/1/2023 1,630,000 558,687.50 2,188,687.50 2/1/2024 - 517,937.50 517,937.50 6/30/2024 2,706,625.00 8/1/2024 2,155,000 517,937.50 2,672,937.50 2/1/2025 - 464,062.50 464,062.50 6/30/2025 3,137,000.00 8/1/2025 2,265,000 464,062.50 2,729,062.50 2/1/2026 - 401,775.00 401,775.00 6/30/2026 3,130,837.50 8/1/2026 2,395,000 401,775.00 2,796,775.00 2/1/2027 335,912.50 335,912.50 6/30/2027 3,132,687.50 8/1/2027 2,335,000 335,912.50 2,670,912.50 2/1/2028 271,700.00 271,700.00 6/30/2028 2,942,612.50 8/1/2028 2,270,000 271,700.00 2,541,700.00 2/1/2029 - 209,275.00 209,275.00 6/30/2029 2,750,975.00 8/1/2029 2,400,000 209,275.00 2,609,275.00 2/1/2030 - 143,275.00 143,275.00 6/30/2030 2,752,550.00 8/1/2030 2,535,000 143,275.00 2,678,275.00 2/1/2031 - 73,562.50 73,562.50 6/30/2031 2,751,837.50 8/1/2031 2,675,000 73,562.50 2,748,562.50 6/30/2032 2,748,562.50
27,670,000 11,891,812.50 39,561,812.50 39,561,812.50
Bond Deb ServiceSalinas Valley Solid Waste Authority
Refunding Revenue BondsSeries 2014A (AMT)
Page 109 of 122

This page intentionally left blank
Page 110 of 122
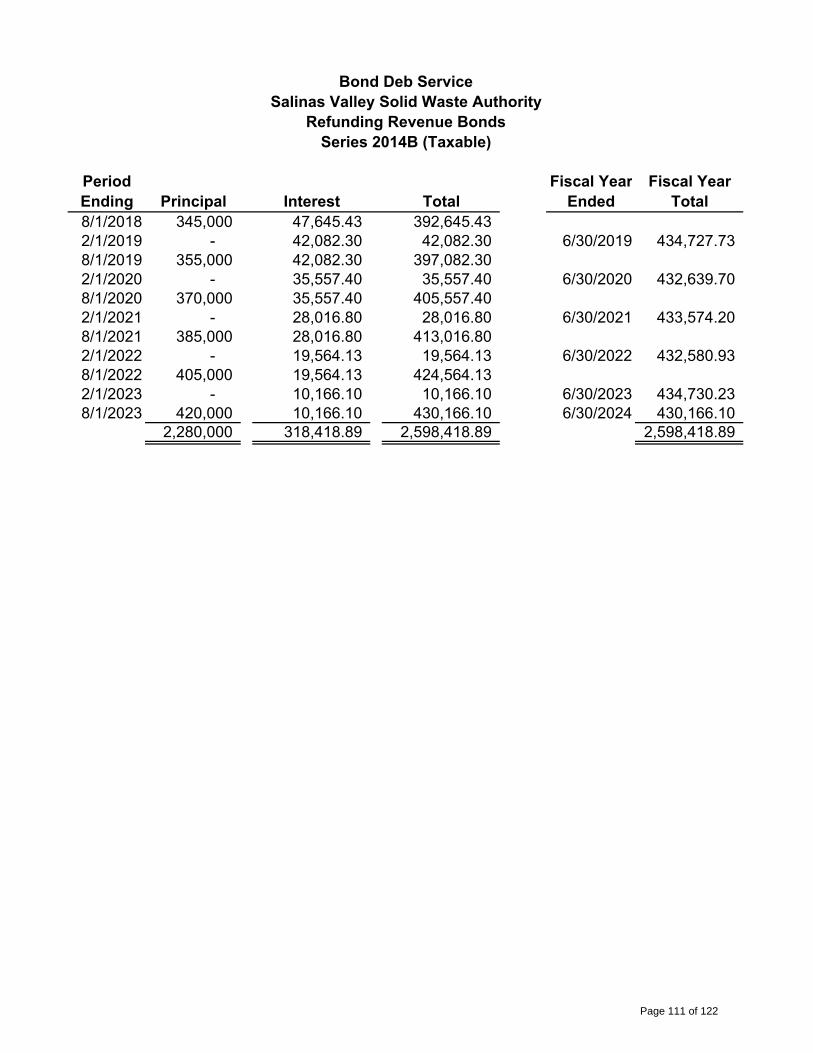
Period Fiscal Year Fiscal YearEnding Principal Interest Total Ended Total8/1/2018 345,000 47,645.43 392,645.43 2/1/2019 - 42,082.30 42,082.30 6/30/2019 434,727.73 8/1/2019 355,000 42,082.30 397,082.30 2/1/2020 - 35,557.40 35,557.40 6/30/2020 432,639.70 8/1/2020 370,000 35,557.40 405,557.40 2/1/2021 - 28,016.80 28,016.80 6/30/2021 433,574.20 8/1/2021 385,000 28,016.80 413,016.80 2/1/2022 - 19,564.13 19,564.13 6/30/2022 432,580.93 8/1/2022 405,000 19,564.13 424,564.13 2/1/2023 - 10,166.10 10,166.10 6/30/2023 434,730.23 8/1/2023 420,000 10,166.10 430,166.10 6/30/2024 430,166.10
2,280,000 318,418.89 2,598,418.89 2,598,418.89
Bond Deb ServiceSalinas Valley Solid Waste Authority
Refunding Revenue BondsSeries 2014B (Taxable)
Page 111 of 122

This page intentionally left blank
Page 112 of 122

Period Fiscal Year Fiscal YearEnding Principal Interest Total Ended Total8/1/2018 383,615.85 15,181.35 398,797.20
2/1/2019 389,523.53 9,273.67 398,797.20 6/30/2019 797,594.40
8/1/2019 212,662.55 3,275.00 215,937.55 6/30/2020 215,937.55
985,801.93 27,730.02 1,013,531.95 1,013,531.95
EQUIPMENT LEASE PURCHASE AGREEMENTPAYMENT SCHEDULE
Page 113 of 122

This page intentionally left blank
Page 114 of 122
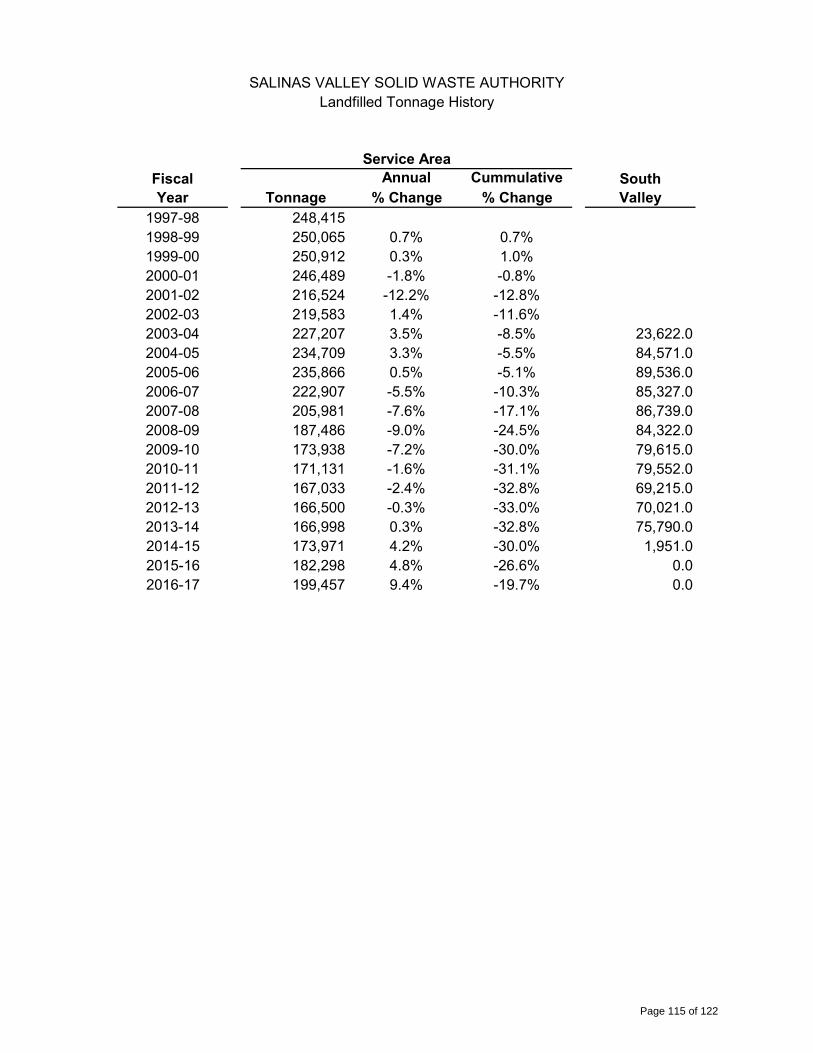
Annual Cummulative% Change % Change
1997-98 248,415 1998-99 250,065 0.7% 0.7%1999-00 250,912 0.3% 1.0%2000-01 246,489 -1.8% -0.8%2001-02 216,524 -12.2% -12.8%2002-03 219,583 1.4% -11.6%2003-04 227,207 3.5% -8.5% 23,622.0 2004-05 234,709 3.3% -5.5% 84,571.0 2005-06 235,866 0.5% -5.1% 89,536.0 2006-07 222,907 -5.5% -10.3% 85,327.0 2007-08 205,981 -7.6% -17.1% 86,739.0 2008-09 187,486 -9.0% -24.5% 84,322.0 2009-10 173,938 -7.2% -30.0% 79,615.0 2010-11 171,131 -1.6% -31.1% 79,552.0 2011-12 167,033 -2.4% -32.8% 69,215.0 2012-13 166,500 -0.3% -33.0% 70,021.0 2013-14 166,998 0.3% -32.8% 75,790.0 2014-15 173,971 4.2% -30.0% 1,951.0 2015-16 182,298 4.8% -26.6% 0.0 2016-17 199,457 9.4% -19.7% 0.0
SALINAS VALLEY SOLID WASTE AUTHORITY
FiscalYear
Landfilled Tonnage History
SouthValleyTonnage
Service Area
Page 115 of 122

This page intentionally left blank
Page 116 of 122
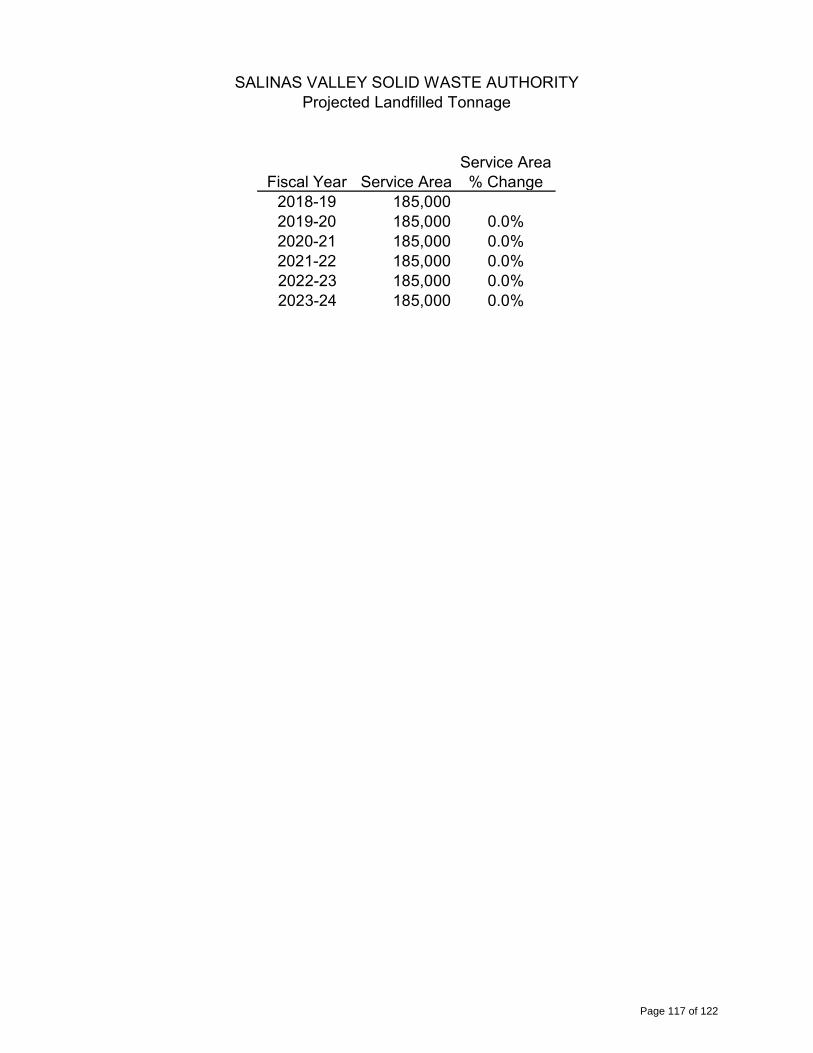
Fiscal Year Service AreaService Area % Change
2018-19 185,000 2019-20 185,000 0.0%2020-21 185,000 0.0%2021-22 185,000 0.0%2022-23 185,000 0.0%2023-24 185,000 0.0%
SALINAS VALLEY SOLID WASTE AUTHORITYProjected Landfilled Tonnage
Page 117 of 122

This page intentionally left blank
Page 118 of 122
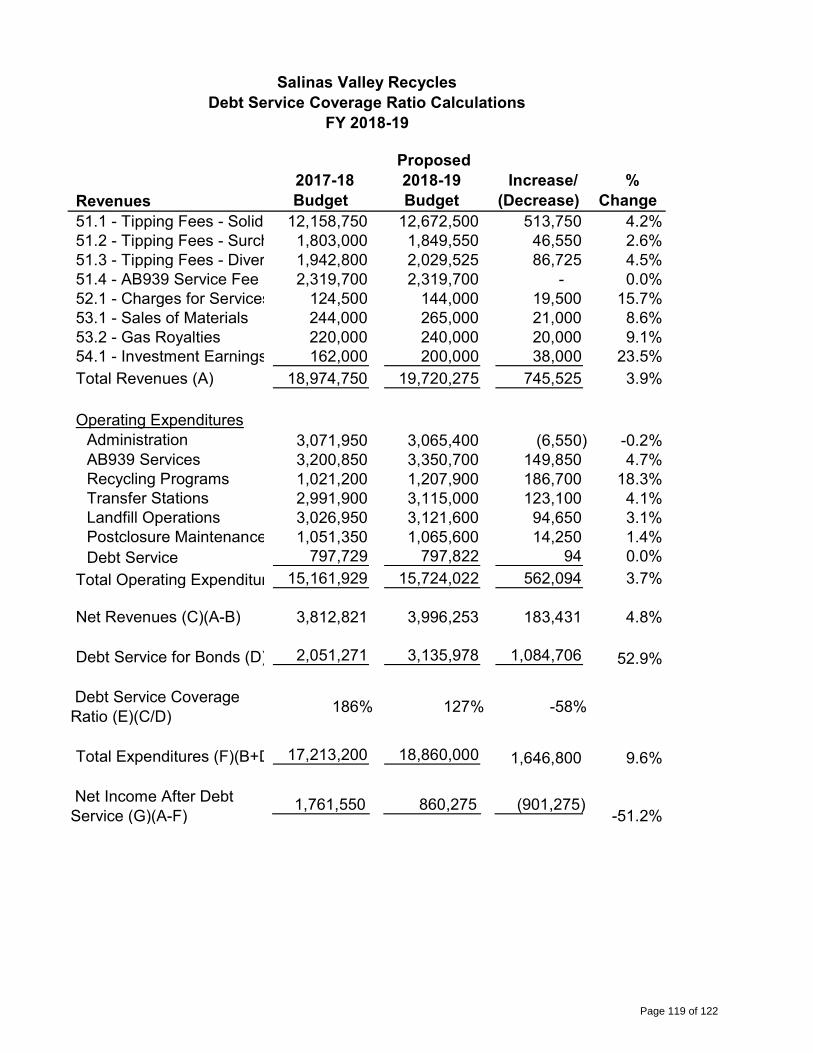
Revenues 2017-18 Budget
Proposed 2018-19 Budget
Increase/ (Decrease)
% Change
51.1 - Tipping Fees - Solid Waste 12,158,750 12,672,500 513,750 4.2%51.2 - Tipping Fees - Surcharge1,803,000 1,849,550 46,550 2.6%51.3 - Tipping Fees - Diverted Materials1,942,800 2,029,525 86,725 4.5%51.4 - AB939 Service Fee 2,319,700 2,319,700 - 0.0%52.1 - Charges for Services 124,500 144,000 19,500 15.7%53.1 - Sales of Materials 244,000 265,000 21,000 8.6%53.2 - Gas Royalties 220,000 240,000 20,000 9.1%54.1 - Investment Earnings 162,000 200,000 38,000 23.5%Total Revenues (A) 18,974,750 19,720,275 745,525 3.9%
Operating ExpendituresAdministration 3,071,950 3,065,400 (6,550) -0.2%AB939 Services 3,200,850 3,350,700 149,850 4.7%Recycling Programs 1,021,200 1,207,900 186,700 18.3%Transfer Stations 2,991,900 3,115,000 123,100 4.1%Landfill Operations 3,026,950 3,121,600 94,650 3.1%Postclosure Maintenance 1,051,350 1,065,600 14,250 1.4%Debt Service 797,729 797,822 94 0.0%
Total Operating Expenditures (B)15,161,929 15,724,022 562,094 3.7%
Net Revenues (C)(A-B) 3,812,821 3,996,253 183,431 4.8%
Debt Service for Bonds (D) 2,051,271 3,135,978 1,084,706 52.9%
Debt Service Coverage Ratio (E)(C/D)
186% 127% -58%
Total Expenditures (F)(B+D) 17,213,200 18,860,000 1,646,800 9.6%
Net Income After Debt Service (G)(A-F)
1,761,550 860,275 (901,275)-51.2%
Salinas Valley RecyclesDebt Service Coverage Ratio Calculations
FY 2018-19
Page 119 of 122

This page intentionally left blank
Page 120 of 122

This page intentionally left blank
Page 121 of 122
Promoting a Future Without Landfills
Mail Us 128 Sun Street, Suite 101 Salinas, CA 93901
Email Us
Call Us (831)775‐3000
SalinasValleyRecycles.org
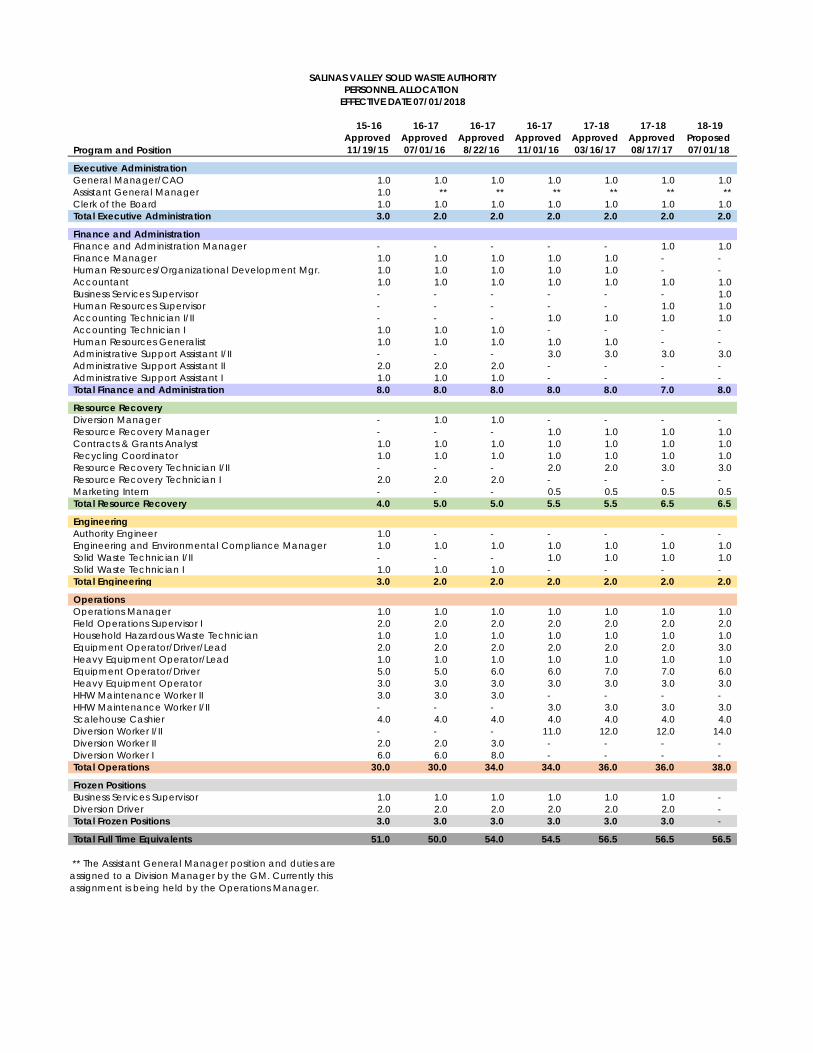
Program and Position
15-16
Approved
11/19/15
16-17
Approved
07/01/16
16-17
Approved
8/22/16
16-17
Approved
11/01/16
17-18
Approved
03/16/17
17-18
Approved
08/17/17
18-19
Proposed
07/01/18
Executive Administration
General Manager/CAO 1.0 1.0 1.0 1.0 1.0 1.0 1.0
Assistant General Manager 1.0 ** ** ** ** ** **
Clerk of the Board 1.0 1.0 1.0 1.0 1.0 1.0 1.0
Total Executive Administration 3.0 2.0 2.0 2.0 2.0 2.0 2.0
Finance and Administration
Finance and Administration Manager - - - - - 1.0 1.0
Finance Manager 1.0 1.0 1.0 1.0 1.0 - -
Human Resources/Organizational Development Mgr. 1.0 1.0 1.0 1.0 1.0 - -
Accountant 1.0 1.0 1.0 1.0 1.0 1.0 1.0
Business Services Supervisor - - - - - - 1.0
Human Resources Supervisor - - - - - 1.0 1.0
Accounting Technician I/II - - - 1.0 1.0 1.0 1.0
Accounting Technician I 1.0 1.0 1.0 - - - -
Human Resources Generalist 1.0 1.0 1.0 1.0 1.0 - -
Administrative Support Assistant I/II - - - 3.0 3.0 3.0 3.0
Administrative Support Assistant II 2.0 2.0 2.0 - - - -
Administrative Support Assistant I 1.0 1.0 1.0 - - - -
Total Finance and Administration 8.0 8.0 8.0 8.0 8.0 7.0 8.0
Resource Recovery
Diversion Manager - 1.0 1.0 - - - -
Resource Recovery Manager - - - 1.0 1.0 1.0 1.0
Contracts & Grants Analyst 1.0 1.0 1.0 1.0 1.0 1.0 1.0
Recycling Coordinator 1.0 1.0 1.0 1.0 1.0 1.0 1.0
Resource Recovery Technician I/II - - - 2.0 2.0 3.0 3.0
Resource Recovery Technician I 2.0 2.0 2.0 - - - -
Marketing Intern - - - 0.5 0.5 0.5 0.5
Total Resource Recovery 4.0 5.0 5.0 5.5 5.5 6.5 6.5
Engineering
Authority Engineer 1.0 - - - - - -
Engineering and Environmental Compliance Manager 1.0 1.0 1.0 1.0 1.0 1.0 1.0
Solid Waste Technician I/II - - - 1.0 1.0 1.0 1.0
Solid Waste Technician I 1.0 1.0 1.0 - - - -
Total Engineering 3.0 2.0 2.0 2.0 2.0 2.0 2.0
Operations
Operations Manager 1.0 1.0 1.0 1.0 1.0 1.0 1.0
Field Operations Supervisor I 2.0 2.0 2.0 2.0 2.0 2.0 2.0
Household Hazardous Waste Technician 1.0 1.0 1.0 1.0 1.0 1.0 1.0
Equipment Operator/Driver/Lead 2.0 2.0 2.0 2.0 2.0 2.0 3.0
Heavy Equipment Operator/Lead 1.0 1.0 1.0 1.0 1.0 1.0 1.0
Equipment Operator/Driver 5.0 5.0 6.0 6.0 7.0 7.0 6.0
Heavy Equipment Operator 3.0 3.0 3.0 3.0 3.0 3.0 3.0
HHW Maintenance Worker II 3.0 3.0 3.0 - - - -
HHW Maintenance Worker I/II - - - 3.0 3.0 3.0 3.0
Scalehouse Cashier 4.0 4.0 4.0 4.0 4.0 4.0 4.0
Diversion Worker I/II - - - 11.0 12.0 12.0 14.0
Diversion Worker II 2.0 2.0 3.0 - - - -
Diversion Worker I 6.0 6.0 8.0 - - - -
Total Operations 30.0 30.0 34.0 34.0 36.0 36.0 38.0
Frozen Positions
Business Services Supervisor 1.0 1.0 1.0 1.0 1.0 1.0 -
Diversion Driver 2.0 2.0 2.0 2.0 2.0 2.0 -
Total Frozen Positions 3.0 3.0 3.0 3.0 3.0 3.0 -
Total Full Time Equivalents 51.0 50.0 54.0 54.5 56.5 56.5 56.5
** The Assistant General Manager position and duties are
assigned to a Division Manager by the GM. Currently this
assignment is being held by the Operations Manager.
SALINAS VALLEY SOLID WASTE AUTHORITY
PERSONNEL ALLOCATION
EFFECTIVE DATE 07/01/2018
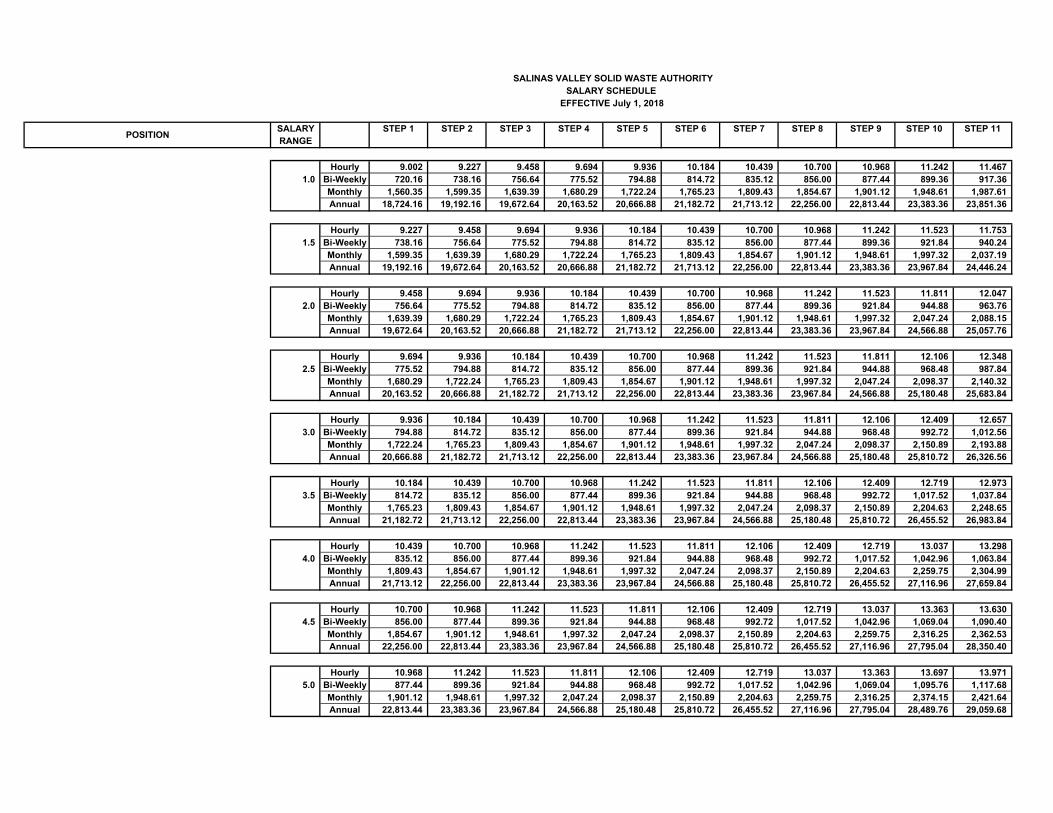
SALARY STEP 1 STEP 2 STEP 3 STEP 4 STEP 5 STEP 6 STEP 7 STEP 8 STEP 9 STEP 10 STEP 11RANGE
Hourly 9.002 9.227 9.458 9.694 9.936 10.184 10.439 10.700 10.968 11.242 11.467 1.0 Bi-Weekly 720.16 738.16 756.64 775.52 794.88 814.72 835.12 856.00 877.44 899.36 917.36
Monthly 1,560.35 1,599.35 1,639.39 1,680.29 1,722.24 1,765.23 1,809.43 1,854.67 1,901.12 1,948.61 1,987.61 Annual 18,724.16 19,192.16 19,672.64 20,163.52 20,666.88 21,182.72 21,713.12 22,256.00 22,813.44 23,383.36 23,851.36
Hourly 9.227 9.458 9.694 9.936 10.184 10.439 10.700 10.968 11.242 11.523 11.753 1.5 Bi-Weekly 738.16 756.64 775.52 794.88 814.72 835.12 856.00 877.44 899.36 921.84 940.24
Monthly 1,599.35 1,639.39 1,680.29 1,722.24 1,765.23 1,809.43 1,854.67 1,901.12 1,948.61 1,997.32 2,037.19 Annual 19,192.16 19,672.64 20,163.52 20,666.88 21,182.72 21,713.12 22,256.00 22,813.44 23,383.36 23,967.84 24,446.24
Hourly 9.458 9.694 9.936 10.184 10.439 10.700 10.968 11.242 11.523 11.811 12.047 2.0 Bi-Weekly 756.64 775.52 794.88 814.72 835.12 856.00 877.44 899.36 921.84 944.88 963.76
Monthly 1,639.39 1,680.29 1,722.24 1,765.23 1,809.43 1,854.67 1,901.12 1,948.61 1,997.32 2,047.24 2,088.15 Annual 19,672.64 20,163.52 20,666.88 21,182.72 21,713.12 22,256.00 22,813.44 23,383.36 23,967.84 24,566.88 25,057.76
Hourly 9.694 9.936 10.184 10.439 10.700 10.968 11.242 11.523 11.811 12.106 12.348 2.5 Bi-Weekly 775.52 794.88 814.72 835.12 856.00 877.44 899.36 921.84 944.88 968.48 987.84
Monthly 1,680.29 1,722.24 1,765.23 1,809.43 1,854.67 1,901.12 1,948.61 1,997.32 2,047.24 2,098.37 2,140.32 Annual 20,163.52 20,666.88 21,182.72 21,713.12 22,256.00 22,813.44 23,383.36 23,967.84 24,566.88 25,180.48 25,683.84
Hourly 9.936 10.184 10.439 10.700 10.968 11.242 11.523 11.811 12.106 12.409 12.657 3.0 Bi-Weekly 794.88 814.72 835.12 856.00 877.44 899.36 921.84 944.88 968.48 992.72 1,012.56
Monthly 1,722.24 1,765.23 1,809.43 1,854.67 1,901.12 1,948.61 1,997.32 2,047.24 2,098.37 2,150.89 2,193.88 Annual 20,666.88 21,182.72 21,713.12 22,256.00 22,813.44 23,383.36 23,967.84 24,566.88 25,180.48 25,810.72 26,326.56
Hourly 10.184 10.439 10.700 10.968 11.242 11.523 11.811 12.106 12.409 12.719 12.973 3.5 Bi-Weekly 814.72 835.12 856.00 877.44 899.36 921.84 944.88 968.48 992.72 1,017.52 1,037.84
Monthly 1,765.23 1,809.43 1,854.67 1,901.12 1,948.61 1,997.32 2,047.24 2,098.37 2,150.89 2,204.63 2,248.65 Annual 21,182.72 21,713.12 22,256.00 22,813.44 23,383.36 23,967.84 24,566.88 25,180.48 25,810.72 26,455.52 26,983.84
Hourly 10.439 10.700 10.968 11.242 11.523 11.811 12.106 12.409 12.719 13.037 13.298 4.0 Bi-Weekly 835.12 856.00 877.44 899.36 921.84 944.88 968.48 992.72 1,017.52 1,042.96 1,063.84
Monthly 1,809.43 1,854.67 1,901.12 1,948.61 1,997.32 2,047.24 2,098.37 2,150.89 2,204.63 2,259.75 2,304.99 Annual 21,713.12 22,256.00 22,813.44 23,383.36 23,967.84 24,566.88 25,180.48 25,810.72 26,455.52 27,116.96 27,659.84
Hourly 10.700 10.968 11.242 11.523 11.811 12.106 12.409 12.719 13.037 13.363 13.630 4.5 Bi-Weekly 856.00 877.44 899.36 921.84 944.88 968.48 992.72 1,017.52 1,042.96 1,069.04 1,090.40
Monthly 1,854.67 1,901.12 1,948.61 1,997.32 2,047.24 2,098.37 2,150.89 2,204.63 2,259.75 2,316.25 2,362.53 Annual 22,256.00 22,813.44 23,383.36 23,967.84 24,566.88 25,180.48 25,810.72 26,455.52 27,116.96 27,795.04 28,350.40
Hourly 10.968 11.242 11.523 11.811 12.106 12.409 12.719 13.037 13.363 13.697 13.971 5.0 Bi-Weekly 877.44 899.36 921.84 944.88 968.48 992.72 1,017.52 1,042.96 1,069.04 1,095.76 1,117.68
Monthly 1,901.12 1,948.61 1,997.32 2,047.24 2,098.37 2,150.89 2,204.63 2,259.75 2,316.25 2,374.15 2,421.64 Annual 22,813.44 23,383.36 23,967.84 24,566.88 25,180.48 25,810.72 26,455.52 27,116.96 27,795.04 28,489.76 29,059.68
SALINAS VALLEY SOLID WASTE AUTHORITYSALARY SCHEDULE
EFFECTIVE July 1, 2018
POSITION

SALARY STEP 1 STEP 2 STEP 3 STEP 4 STEP 5 STEP 6 STEP 7 STEP 8 STEP 9 STEP 10 STEP 11RANGE
SALINAS VALLEY SOLID WASTE AUTHORITYSALARY SCHEDULE
EFFECTIVE July 1, 2018
POSITION
Hourly 11.242 11.523 11.811 12.106 12.409 12.719 13.037 13.363 13.697 14.039 14.320 5.5 Bi-Weekly 899.36 921.84 944.88 968.48 992.72 1,017.52 1,042.96 1,069.04 1,095.76 1,123.12 1,145.60
Monthly 1,948.61 1,997.32 2,047.24 2,098.37 2,150.89 2,204.63 2,259.75 2,316.25 2,374.15 2,433.43 2,482.13 Annual 23,383.36 23,967.84 24,566.88 25,180.48 25,810.72 26,455.52 27,116.96 27,795.04 28,489.76 29,201.12 29,785.60
Hourly 11.523 11.811 12.106 12.409 12.719 13.037 13.363 13.697 14.039 14.390 14.678 6.0 Bi-Weekly 921.84 944.88 968.48 992.72 1,017.52 1,042.96 1,069.04 1,095.76 1,123.12 1,151.20 1,174.24
Monthly 1,997.32 2,047.24 2,098.37 2,150.89 2,204.63 2,259.75 2,316.25 2,374.15 2,433.43 2,494.27 2,544.19 Annual 23,967.84 24,566.88 25,180.48 25,810.72 26,455.52 27,116.96 27,795.04 28,489.76 29,201.12 29,931.20 30,530.24
Hourly 11.811 12.106 12.409 12.719 13.037 13.363 13.697 14.039 14.390 14.750 15.045 6.5 Bi-Weekly 944.88 968.48 992.72 1,017.52 1,042.96 1,069.04 1,095.76 1,123.12 1,151.20 1,180.00 1,203.60
Monthly 2,047.24 2,098.37 2,150.89 2,204.63 2,259.75 2,316.25 2,374.15 2,433.43 2,494.27 2,556.67 2,607.80 Annual 24,566.88 25,180.48 25,810.72 26,455.52 27,116.96 27,795.04 28,489.76 29,201.12 29,931.20 30,680.00 31,293.60
Hourly 12.106 12.409 12.719 13.037 13.363 13.697 14.039 14.390 14.750 15.119 15.421 7.0 Bi-Weekly 968.48 992.72 1,017.52 1,042.96 1,069.04 1,095.76 1,123.12 1,151.20 1,180.00 1,209.52 1,233.68
Monthly 2,098.37 2,150.89 2,204.63 2,259.75 2,316.25 2,374.15 2,433.43 2,494.27 2,556.67 2,620.63 2,672.97 Annual 25,180.48 25,810.72 26,455.52 27,116.96 27,795.04 28,489.76 29,201.12 29,931.20 30,680.00 31,447.52 32,075.68
Hourly 12.409 12.719 13.037 13.363 13.697 14.039 14.390 14.750 15.119 15.497 15.807 7.5 Bi-Weekly 992.72 1,017.52 1,042.96 1,069.04 1,095.76 1,123.12 1,151.20 1,180.00 1,209.52 1,239.76 1,264.56
Monthly 2,150.89 2,204.63 2,259.75 2,316.25 2,374.15 2,433.43 2,494.27 2,556.67 2,620.63 2,686.15 2,739.88 Annual 25,810.72 26,455.52 27,116.96 27,795.04 28,489.76 29,201.12 29,931.20 30,680.00 31,447.52 32,233.76 32,878.56
Hourly 12.719 13.037 13.363 13.697 14.039 14.390 14.750 15.119 15.497 15.884 16.202 Student Intern 8.0 Bi-Weekly 1,017.52 1,042.96 1,069.04 1,095.76 1,123.12 1,151.20 1,180.00 1,209.52 1,239.76 1,270.72 1,296.16
Monthly 2,204.63 2,259.75 2,316.25 2,374.15 2,433.43 2,494.27 2,556.67 2,620.63 2,686.15 2,753.23 2,808.35 Annual 26,455.52 27,116.96 27,795.04 28,489.76 29,201.12 29,931.20 30,680.00 31,447.52 32,233.76 33,038.72 33,700.16
Hourly 13.037 13.363 13.697 14.039 14.390 14.750 15.119 15.497 15.884 16.281 16.607 8.5 Bi-Weekly 1,042.96 1,069.04 1,095.76 1,123.12 1,151.20 1,180.00 1,209.52 1,239.76 1,270.72 1,302.48 1,328.56
Monthly 2,259.75 2,316.25 2,374.15 2,433.43 2,494.27 2,556.67 2,620.63 2,686.15 2,753.23 2,822.04 2,878.55 Annual 27,116.96 27,795.04 28,489.76 29,201.12 29,931.20 30,680.00 31,447.52 32,233.76 33,038.72 33,864.48 34,542.56
Hourly 13.363 13.697 14.039 14.390 14.750 15.119 15.497 15.884 16.281 16.688 17.022 9.0 Bi-Weekly 1,069.04 1,095.76 1,123.12 1,151.20 1,180.00 1,209.52 1,239.76 1,270.72 1,302.48 1,335.04 1,361.76
Monthly 2,316.25 2,374.15 2,433.43 2,494.27 2,556.67 2,620.63 2,686.15 2,753.23 2,822.04 2,892.59 2,950.48 Annual 27,795.04 28,489.76 29,201.12 29,931.20 30,680.00 31,447.52 32,233.76 33,038.72 33,864.48 34,711.04 35,405.76
Hourly 13.697 14.039 14.390 14.750 15.119 15.497 15.884 16.281 16.688 17.105 17.447 9.5 Bi-Weekly 1,095.76 1,123.12 1,151.20 1,180.00 1,209.52 1,239.76 1,270.72 1,302.48 1,335.04 1,368.40 1,395.76
Monthly 2,374.15 2,433.43 2,494.27 2,556.67 2,620.63 2,686.15 2,753.23 2,822.04 2,892.59 2,964.87 3,024.15 Annual 28,489.76 29,201.12 29,931.20 30,680.00 31,447.52 32,233.76 33,038.72 33,864.48 34,711.04 35,578.40 36,289.76

SALARY STEP 1 STEP 2 STEP 3 STEP 4 STEP 5 STEP 6 STEP 7 STEP 8 STEP 9 STEP 10 STEP 11RANGE
SALINAS VALLEY SOLID WASTE AUTHORITYSALARY SCHEDULE
EFFECTIVE July 1, 2018
POSITION
Hourly 14.039 14.390 14.750 15.119 15.497 15.884 16.281 16.688 17.105 17.533 17.884 10.0 Bi-Weekly 1,123.12 1,151.20 1,180.00 1,209.52 1,239.76 1,270.72 1,302.48 1,335.04 1,368.40 1,402.64 1,430.72
Monthly 2,433.43 2,494.27 2,556.67 2,620.63 2,686.15 2,753.23 2,822.04 2,892.59 2,964.87 3,039.05 3,099.89 Annual 29,201.12 29,931.20 30,680.00 31,447.52 32,233.76 33,038.72 33,864.48 34,711.04 35,578.40 36,468.64 37,198.72
Hourly 14.390 14.750 15.119 15.497 15.884 16.281 16.688 17.105 17.533 17.971 18.330 10.5 Bi-Weekly 1,151.20 1,180.00 1,209.52 1,239.76 1,270.72 1,302.48 1,335.04 1,368.40 1,402.64 1,437.68 1,466.40
Monthly 2,494.27 2,556.67 2,620.63 2,686.15 2,753.23 2,822.04 2,892.59 2,964.87 3,039.05 3,114.97 3,177.20 Annual 29,931.20 30,680.00 31,447.52 32,233.76 33,038.72 33,864.48 34,711.04 35,578.40 36,468.64 37,379.68 38,126.40
Hourly 14.750 15.119 15.497 15.884 16.281 16.688 17.105 17.533 17.971 18.420 18.788 11.0 Bi-Weekly 1,180.00 1,209.52 1,239.76 1,270.72 1,302.48 1,335.04 1,368.40 1,402.64 1,437.68 1,473.60 1,503.04
Monthly 2,556.67 2,620.63 2,686.15 2,753.23 2,822.04 2,892.59 2,964.87 3,039.05 3,114.97 3,192.80 3,256.59 Annual 30,680.00 31,447.52 32,233.76 33,038.72 33,864.48 34,711.04 35,578.40 36,468.64 37,379.68 38,313.60 39,079.04
Hourly 15.119 15.497 15.884 16.281 16.688 17.105 17.533 17.971 18.420 18.881 19.259 11.5 Bi-Weekly 1,209.52 1,239.76 1,270.72 1,302.48 1,335.04 1,368.40 1,402.64 1,437.68 1,473.60 1,510.48 1,540.72
Monthly 2,620.63 2,686.15 2,753.23 2,822.04 2,892.59 2,964.87 3,039.05 3,114.97 3,192.80 3,272.71 3,338.23 Annual 31,447.52 32,233.76 33,038.72 33,864.48 34,711.04 35,578.40 36,468.64 37,379.68 38,313.60 39,272.48 40,058.72
Hourly 15.497 15.884 16.281 16.688 17.105 17.533 17.971 18.420 18.881 19.353 19.740 12.0 Bi-Weekly 1,239.76 1,270.72 1,302.48 1,335.04 1,368.40 1,402.64 1,437.68 1,473.60 1,510.48 1,548.24 1,579.20
Monthly 2,686.15 2,753.23 2,822.04 2,892.59 2,964.87 3,039.05 3,114.97 3,192.80 3,272.71 3,354.52 3,421.60 Annual 32,233.76 33,038.72 33,864.48 34,711.04 35,578.40 36,468.64 37,379.68 38,313.60 39,272.48 40,254.24 41,059.20
Hourly 15.884 16.281 16.688 17.105 17.533 17.971 18.420 18.881 19.353 19.837 20.234 Diversion Worker I 12.5 Bi-Weekly 1,270.72 1,302.48 1,335.04 1,368.40 1,402.64 1,437.68 1,473.60 1,510.48 1,548.24 1,586.96 1,618.72
Monthly 2,753.23 2,822.04 2,892.59 2,964.87 3,039.05 3,114.97 3,192.80 3,272.71 3,354.52 3,438.41 3,507.23 Annual 33,038.72 33,864.48 34,711.04 35,578.40 36,468.64 37,379.68 38,313.60 39,272.48 40,254.24 41,260.96 42,086.72
Hourly 16.281 16.688 17.105 17.533 17.971 18.420 18.881 19.353 19.837 20.333 20.740 13.0 Bi-Weekly 1,302.48 1,335.04 1,368.40 1,402.64 1,437.68 1,473.60 1,510.48 1,548.24 1,586.96 1,626.64 1,659.20
Monthly 2,822.04 2,892.59 2,964.87 3,039.05 3,114.97 3,192.80 3,272.71 3,354.52 3,438.41 3,524.39 3,594.93 Annual 33,864.48 34,711.04 35,578.40 36,468.64 37,379.68 38,313.60 39,272.48 40,254.24 41,260.96 42,292.64 43,139.20
Hourly 16.688 17.105 17.533 17.971 18.420 18.881 19.353 19.837 20.333 20.841 21.258 13.5 Bi-Weekly 1,335.04 1,368.40 1,402.64 1,437.68 1,473.60 1,510.48 1,548.24 1,586.96 1,626.64 1,667.28 1,700.64
Monthly 2,892.59 2,964.87 3,039.05 3,114.97 3,192.80 3,272.71 3,354.52 3,438.41 3,524.39 3,612.44 3,684.72 Annual 34,711.04 35,578.40 36,468.64 37,379.68 38,313.60 39,272.48 40,254.24 41,260.96 42,292.64 43,349.28 44,216.64
Hourly 17.105 17.533 17.971 18.420 18.881 19.353 19.837 20.333 20.841 21.362 21.789 14.0 Bi-Weekly 1,368.40 1,402.64 1,437.68 1,473.60 1,510.48 1,548.24 1,586.96 1,626.64 1,667.28 1,708.96 1,743.12
Monthly 2,964.87 3,039.05 3,114.97 3,192.80 3,272.71 3,354.52 3,438.41 3,524.39 3,612.44 3,702.75 3,776.76 Annual 35,578.40 36,468.64 37,379.68 38,313.60 39,272.48 40,254.24 41,260.96 42,292.64 43,349.28 44,432.96 45,321.12

SALARY STEP 1 STEP 2 STEP 3 STEP 4 STEP 5 STEP 6 STEP 7 STEP 8 STEP 9 STEP 10 STEP 11RANGE
SALINAS VALLEY SOLID WASTE AUTHORITYSALARY SCHEDULE
EFFECTIVE July 1, 2018
POSITION
Hourly 17.533 17.971 18.420 18.881 19.353 19.837 20.333 20.841 21.362 21.896 22.334 Diversion Worker II 14.5 Bi-Weekly 1,402.64 1,437.68 1,473.60 1,510.48 1,548.24 1,586.96 1,626.64 1,667.28 1,708.96 1,751.68 1,786.72
Monthly 3,039.05 3,114.97 3,192.80 3,272.71 3,354.52 3,438.41 3,524.39 3,612.44 3,702.75 3,795.31 3,871.23 Annual 36,468.64 37,379.68 38,313.60 39,272.48 40,254.24 41,260.96 42,292.64 43,349.28 44,432.96 45,543.68 46,454.72
Hourly 17.971 18.420 18.881 19.353 19.837 20.333 20.841 21.362 21.896 22.443 22.892 15.0 Bi-Weekly 1,437.68 1,473.60 1,510.48 1,548.24 1,586.96 1,626.64 1,667.28 1,708.96 1,751.68 1,795.44 1,831.36
Monthly 3,114.97 3,192.80 3,272.71 3,354.52 3,438.41 3,524.39 3,612.44 3,702.75 3,795.31 3,890.12 3,967.95 Annual 37,379.68 38,313.60 39,272.48 40,254.24 41,260.96 42,292.64 43,349.28 44,432.96 45,543.68 46,681.44 47,615.36
Hourly 18.420 18.881 19.353 19.837 20.333 20.841 21.362 21.896 22.443 23.004 23.464 15.5 Bi-Weekly 1,473.60 1,510.48 1,548.24 1,586.96 1,626.64 1,667.28 1,708.96 1,751.68 1,795.44 1,840.32 1,877.12
Monthly 3,192.80 3,272.71 3,354.52 3,438.41 3,524.39 3,612.44 3,702.75 3,795.31 3,890.12 3,987.36 4,067.09 Annual 38,313.60 39,272.48 40,254.24 41,260.96 42,292.64 43,349.28 44,432.96 45,543.68 46,681.44 47,848.32 48,805.12
Hourly 18.881 19.353 19.837 20.333 20.841 21.362 21.896 22.443 23.004 23.579 24.051 16.0 Bi-Weekly 1,510.48 1,548.24 1,586.96 1,626.64 1,667.28 1,708.96 1,751.68 1,795.44 1,840.32 1,886.32 1,924.08
Monthly 3,272.71 3,354.52 3,438.41 3,524.39 3,612.44 3,702.75 3,795.31 3,890.12 3,987.36 4,087.03 4,168.84 Annual 39,272.48 40,254.24 41,260.96 42,292.64 43,349.28 44,432.96 45,543.68 46,681.44 47,848.32 49,044.32 50,026.08
Hourly 19.353 19.837 20.333 20.841 21.362 21.896 22.443 23.004 23.579 24.168 24.651 16.5 Bi-Weekly 1,548.24 1,586.96 1,626.64 1,667.28 1,708.96 1,751.68 1,795.44 1,840.32 1,886.32 1,933.44 1,972.08
Monthly 3,354.52 3,438.41 3,524.39 3,612.44 3,702.75 3,795.31 3,890.12 3,987.36 4,087.03 4,189.12 4,272.84 Annual 40,254.24 41,260.96 42,292.64 43,349.28 44,432.96 45,543.68 46,681.44 47,848.32 49,044.32 50,269.44 51,274.08
Hourly 19.837 20.333 20.841 21.362 21.896 22.443 23.004 23.579 24.168 24.772 25.267 17.0 Bi-Weekly 1,586.96 1,626.64 1,667.28 1,708.96 1,751.68 1,795.44 1,840.32 1,886.32 1,933.44 1,981.76 2,021.36
Monthly 3,438.41 3,524.39 3,612.44 3,702.75 3,795.31 3,890.12 3,987.36 4,087.03 4,189.12 4,293.81 4,379.61 Annual 41,260.96 42,292.64 43,349.28 44,432.96 45,543.68 46,681.44 47,848.32 49,044.32 50,269.44 51,525.76 52,555.36
Hourly 20.333 20.841 21.362 21.896 22.443 23.004 23.579 24.168 24.772 25.391 25.899 HHW Maintenance Worker I 17.5 Bi-Weekly 1,626.64 1,667.28 1,708.96 1,751.68 1,795.44 1,840.32 1,886.32 1,933.44 1,981.76 2,031.28 2,071.92
Monthly 3,524.39 3,612.44 3,702.75 3,795.31 3,890.12 3,987.36 4,087.03 4,189.12 4,293.81 4,401.11 4,489.16 Annual 42,292.64 43,349.28 44,432.96 45,543.68 46,681.44 47,848.32 49,044.32 50,269.44 51,525.76 52,813.28 53,869.92
Hourly 20.841 21.362 21.896 22.443 23.004 23.579 24.168 24.772 25.391 26.026 26.547 18.0 Bi-Weekly 1,667.28 1,708.96 1,751.68 1,795.44 1,840.32 1,886.32 1,933.44 1,981.76 2,031.28 2,082.08 2,123.76
Monthly 3,612.44 3,702.75 3,795.31 3,890.12 3,987.36 4,087.03 4,189.12 4,293.81 4,401.11 4,511.17 4,601.48 Annual 43,349.28 44,432.96 45,543.68 46,681.44 47,848.32 49,044.32 50,269.44 51,525.76 52,813.28 54,134.08 55,217.76
Hourly 21.362 21.896 22.443 23.004 23.579 24.168 24.772 25.391 26.026 26.677 27.211 Diversion Driver 18.5 Bi-Weekly 1,708.96 1,751.68 1,795.44 1,840.32 1,886.32 1,933.44 1,981.76 2,031.28 2,082.08 2,134.16 2,176.88
Monthly 3,702.75 3,795.31 3,890.12 3,987.36 4,087.03 4,189.12 4,293.81 4,401.11 4,511.17 4,624.01 4,716.57 Annual 44,432.96 45,543.68 46,681.44 47,848.32 49,044.32 50,269.44 51,525.76 52,813.28 54,134.08 55,488.16 56,598.88
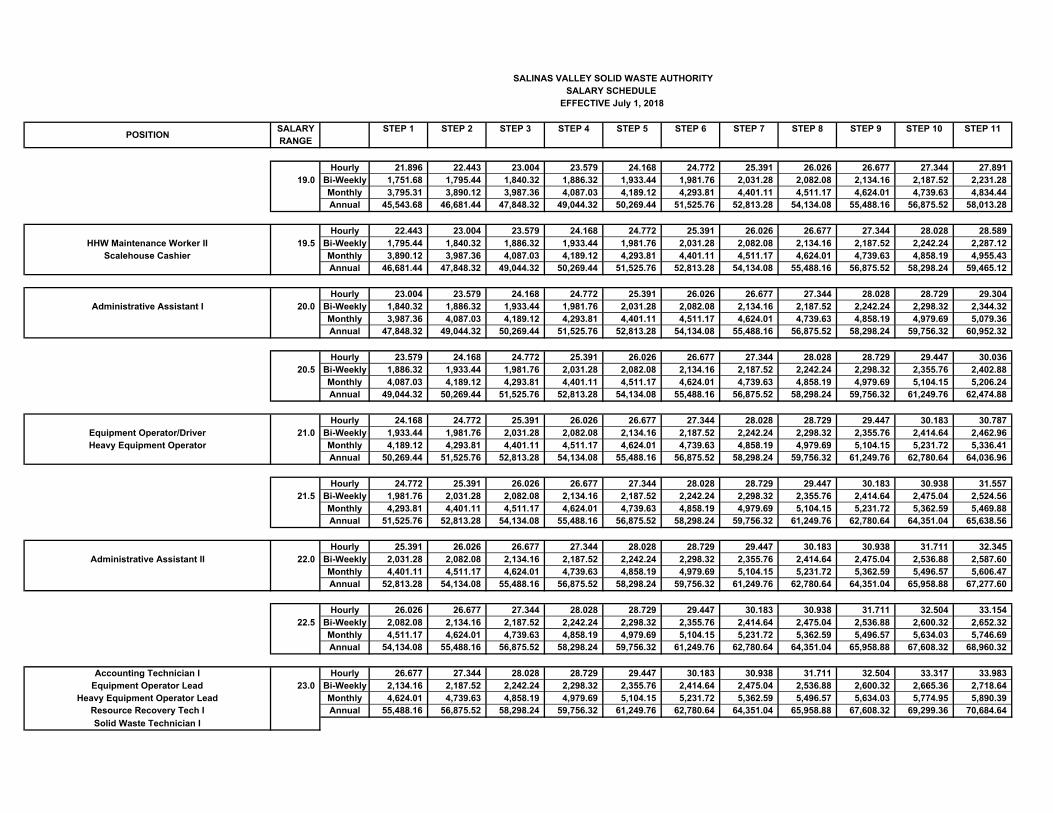
SALARY STEP 1 STEP 2 STEP 3 STEP 4 STEP 5 STEP 6 STEP 7 STEP 8 STEP 9 STEP 10 STEP 11RANGE
SALINAS VALLEY SOLID WASTE AUTHORITYSALARY SCHEDULE
EFFECTIVE July 1, 2018
POSITION
Hourly 21.896 22.443 23.004 23.579 24.168 24.772 25.391 26.026 26.677 27.344 27.891 19.0 Bi-Weekly 1,751.68 1,795.44 1,840.32 1,886.32 1,933.44 1,981.76 2,031.28 2,082.08 2,134.16 2,187.52 2,231.28
Monthly 3,795.31 3,890.12 3,987.36 4,087.03 4,189.12 4,293.81 4,401.11 4,511.17 4,624.01 4,739.63 4,834.44 Annual 45,543.68 46,681.44 47,848.32 49,044.32 50,269.44 51,525.76 52,813.28 54,134.08 55,488.16 56,875.52 58,013.28
Hourly 22.443 23.004 23.579 24.168 24.772 25.391 26.026 26.677 27.344 28.028 28.589 HHW Maintenance Worker II 19.5 Bi-Weekly 1,795.44 1,840.32 1,886.32 1,933.44 1,981.76 2,031.28 2,082.08 2,134.16 2,187.52 2,242.24 2,287.12
Scalehouse Cashier Monthly 3,890.12 3,987.36 4,087.03 4,189.12 4,293.81 4,401.11 4,511.17 4,624.01 4,739.63 4,858.19 4,955.43 Annual 46,681.44 47,848.32 49,044.32 50,269.44 51,525.76 52,813.28 54,134.08 55,488.16 56,875.52 58,298.24 59,465.12
Hourly 23.004 23.579 24.168 24.772 25.391 26.026 26.677 27.344 28.028 28.729 29.304 Administrative Assistant I 20.0 Bi-Weekly 1,840.32 1,886.32 1,933.44 1,981.76 2,031.28 2,082.08 2,134.16 2,187.52 2,242.24 2,298.32 2,344.32
Monthly 3,987.36 4,087.03 4,189.12 4,293.81 4,401.11 4,511.17 4,624.01 4,739.63 4,858.19 4,979.69 5,079.36 Annual 47,848.32 49,044.32 50,269.44 51,525.76 52,813.28 54,134.08 55,488.16 56,875.52 58,298.24 59,756.32 60,952.32
Hourly 23.579 24.168 24.772 25.391 26.026 26.677 27.344 28.028 28.729 29.447 30.036 20.5 Bi-Weekly 1,886.32 1,933.44 1,981.76 2,031.28 2,082.08 2,134.16 2,187.52 2,242.24 2,298.32 2,355.76 2,402.88
Monthly 4,087.03 4,189.12 4,293.81 4,401.11 4,511.17 4,624.01 4,739.63 4,858.19 4,979.69 5,104.15 5,206.24 Annual 49,044.32 50,269.44 51,525.76 52,813.28 54,134.08 55,488.16 56,875.52 58,298.24 59,756.32 61,249.76 62,474.88
Hourly 24.168 24.772 25.391 26.026 26.677 27.344 28.028 28.729 29.447 30.183 30.787 Equipment Operator/Driver 21.0 Bi-Weekly 1,933.44 1,981.76 2,031.28 2,082.08 2,134.16 2,187.52 2,242.24 2,298.32 2,355.76 2,414.64 2,462.96 Heavy Equipment Operator Monthly 4,189.12 4,293.81 4,401.11 4,511.17 4,624.01 4,739.63 4,858.19 4,979.69 5,104.15 5,231.72 5,336.41
Annual 50,269.44 51,525.76 52,813.28 54,134.08 55,488.16 56,875.52 58,298.24 59,756.32 61,249.76 62,780.64 64,036.96
Hourly 24.772 25.391 26.026 26.677 27.344 28.028 28.729 29.447 30.183 30.938 31.557 21.5 Bi-Weekly 1,981.76 2,031.28 2,082.08 2,134.16 2,187.52 2,242.24 2,298.32 2,355.76 2,414.64 2,475.04 2,524.56
Monthly 4,293.81 4,401.11 4,511.17 4,624.01 4,739.63 4,858.19 4,979.69 5,104.15 5,231.72 5,362.59 5,469.88 Annual 51,525.76 52,813.28 54,134.08 55,488.16 56,875.52 58,298.24 59,756.32 61,249.76 62,780.64 64,351.04 65,638.56
Hourly 25.391 26.026 26.677 27.344 28.028 28.729 29.447 30.183 30.938 31.711 32.345 Administrative Assistant II 22.0 Bi-Weekly 2,031.28 2,082.08 2,134.16 2,187.52 2,242.24 2,298.32 2,355.76 2,414.64 2,475.04 2,536.88 2,587.60
Monthly 4,401.11 4,511.17 4,624.01 4,739.63 4,858.19 4,979.69 5,104.15 5,231.72 5,362.59 5,496.57 5,606.47 Annual 52,813.28 54,134.08 55,488.16 56,875.52 58,298.24 59,756.32 61,249.76 62,780.64 64,351.04 65,958.88 67,277.60
Hourly 26.026 26.677 27.344 28.028 28.729 29.447 30.183 30.938 31.711 32.504 33.154 22.5 Bi-Weekly 2,082.08 2,134.16 2,187.52 2,242.24 2,298.32 2,355.76 2,414.64 2,475.04 2,536.88 2,600.32 2,652.32
Monthly 4,511.17 4,624.01 4,739.63 4,858.19 4,979.69 5,104.15 5,231.72 5,362.59 5,496.57 5,634.03 5,746.69 Annual 54,134.08 55,488.16 56,875.52 58,298.24 59,756.32 61,249.76 62,780.64 64,351.04 65,958.88 67,608.32 68,960.32
Accounting Technician I Hourly 26.677 27.344 28.028 28.729 29.447 30.183 30.938 31.711 32.504 33.317 33.983 Equipment Operator Lead 23.0 Bi-Weekly 2,134.16 2,187.52 2,242.24 2,298.32 2,355.76 2,414.64 2,475.04 2,536.88 2,600.32 2,665.36 2,718.64
Heavy Equipment Operator Lead Monthly 4,624.01 4,739.63 4,858.19 4,979.69 5,104.15 5,231.72 5,362.59 5,496.57 5,634.03 5,774.95 5,890.39 Resource Recovery Tech I Annual 55,488.16 56,875.52 58,298.24 59,756.32 61,249.76 62,780.64 64,351.04 65,958.88 67,608.32 69,299.36 70,684.64 Solid Waste Technician I

SALARY STEP 1 STEP 2 STEP 3 STEP 4 STEP 5 STEP 6 STEP 7 STEP 8 STEP 9 STEP 10 STEP 11RANGE
SALINAS VALLEY SOLID WASTE AUTHORITYSALARY SCHEDULE
EFFECTIVE July 1, 2018
POSITION
Hourly 27.344 28.028 28.729 29.447 30.183 30.938 31.711 32.504 33.317 34.150 34.833 23.5 Bi-Weekly 2,187.52 2,242.24 2,298.32 2,355.76 2,414.64 2,475.04 2,536.88 2,600.32 2,665.36 2,732.00 2,786.64
Monthly 4,739.63 4,858.19 4,979.69 5,104.15 5,231.72 5,362.59 5,496.57 5,634.03 5,774.95 5,919.33 6,037.72 Annual 56,875.52 58,298.24 59,756.32 61,249.76 62,780.64 64,351.04 65,958.88 67,608.32 69,299.36 71,032.00 72,452.64
Hourly 28.028 28.729 29.447 30.183 30.938 31.711 32.504 33.317 34.150 35.004 35.704 24.0 Bi-Weekly 2,242.24 2,298.32 2,355.76 2,414.64 2,475.04 2,536.88 2,600.32 2,665.36 2,732.00 2,800.32 2,856.32
Monthly 4,858.19 4,979.69 5,104.15 5,231.72 5,362.59 5,496.57 5,634.03 5,774.95 5,919.33 6,067.36 6,188.69 Annual 58,298.24 59,756.32 61,249.76 62,780.64 64,351.04 65,958.88 67,608.32 69,299.36 71,032.00 72,808.32 74,264.32
Hourly 28.729 29.447 30.183 30.938 31.711 32.504 33.317 34.150 35.004 35.879 36.597 HHW Technician 24.5 Bi-Weekly 2,298.32 2,355.76 2,414.64 2,475.04 2,536.88 2,600.32 2,665.36 2,732.00 2,800.32 2,870.32 2,927.76
Monthly 4,979.69 5,104.15 5,231.72 5,362.59 5,496.57 5,634.03 5,774.95 5,919.33 6,067.36 6,219.03 6,343.48 Annual 59,756.32 61,249.76 62,780.64 64,351.04 65,958.88 67,608.32 69,299.36 71,032.00 72,808.32 74,628.32 76,121.76
Accounting Technician II Hourly 29.447 30.183 30.938 31.711 32.504 33.317 34.150 35.004 35.879 36.776 37.512 Resource Recovery Tech II 25.0 Bi-Weekly 2,355.76 2,414.64 2,475.04 2,536.88 2,600.32 2,665.36 2,732.00 2,800.32 2,870.32 2,942.08 3,000.96 Solid Waste Technician II Monthly 5,104.15 5,231.72 5,362.59 5,496.57 5,634.03 5,774.95 5,919.33 6,067.36 6,219.03 6,374.51 6,502.08
Annual 61,249.76 62,780.64 64,351.04 65,958.88 67,608.32 69,299.36 71,032.00 72,808.32 74,628.32 76,494.08 78,024.96
Hourly 30.183 30.938 31.711 32.504 33.317 34.150 35.004 35.879 36.776 37.695 38.449 Clerk of the Board 25.5 Bi-Weekly 2,414.64 2,475.04 2,536.88 2,600.32 2,665.36 2,732.00 2,800.32 2,870.32 2,942.08 3,015.60 3,075.92
Monthly 5,231.72 5,362.59 5,496.57 5,634.03 5,774.95 5,919.33 6,067.36 6,219.03 6,374.51 6,533.80 6,664.49 Annual 62,780.64 64,351.04 65,958.88 67,608.32 69,299.36 71,032.00 72,808.32 74,628.32 76,494.08 78,405.60 79,973.92
Hourly 30.938 31.711 32.504 33.317 34.150 35.004 35.879 36.776 37.695 38.637 39.410 26.0 Bi-Weekly 2,475.04 2,536.88 2,600.32 2,665.36 2,732.00 2,800.32 2,870.32 2,942.08 3,015.60 3,090.96 3,152.80
Monthly 5,362.59 5,496.57 5,634.03 5,774.95 5,919.33 6,067.36 6,219.03 6,374.51 6,533.80 6,697.08 6,831.07 Annual 64,351.04 65,958.88 67,608.32 69,299.36 71,032.00 72,808.32 74,628.32 76,494.08 78,405.60 80,364.96 81,972.80
Hourly 31.711 32.504 33.317 34.150 35.004 35.879 36.776 37.695 38.637 39.603 40.395 26.5 Bi-Weekly 2,536.88 2,600.32 2,665.36 2,732.00 2,800.32 2,870.32 2,942.08 3,015.60 3,090.96 3,168.24 3,231.60
Monthly 5,496.57 5,634.03 5,774.95 5,919.33 6,067.36 6,219.03 6,374.51 6,533.80 6,697.08 6,864.52 7,001.80 Annual 65,958.88 67,608.32 69,299.36 71,032.00 72,808.32 74,628.32 76,494.08 78,405.60 80,364.96 82,374.24 84,021.60
Hourly 32.504 33.317 34.150 35.004 35.879 36.776 37.695 38.637 39.603 40.593 41.405 27.0 Bi-Weekly 2,600.32 2,665.36 2,732.00 2,800.32 2,870.32 2,942.08 3,015.60 3,090.96 3,168.24 3,247.44 3,312.40
Monthly 5,634.03 5,774.95 5,919.33 6,067.36 6,219.03 6,374.51 6,533.80 6,697.08 6,864.52 7,036.12 7,176.87 Annual 67,608.32 69,299.36 71,032.00 72,808.32 74,628.32 76,494.08 78,405.60 80,364.96 82,374.24 84,433.44 86,122.40
Hourly 33.317 34.150 35.004 35.879 36.776 37.695 38.637 39.603 40.593 41.608 42.440 27.5 Bi-Weekly 2,665.36 2,732.00 2,800.32 2,870.32 2,942.08 3,015.60 3,090.96 3,168.24 3,247.44 3,328.64 3,395.20
Monthly 5,774.95 5,919.33 6,067.36 6,219.03 6,374.51 6,533.80 6,697.08 6,864.52 7,036.12 7,212.05 7,356.27 Annual 69,299.36 71,032.00 72,808.32 74,628.32 76,494.08 78,405.60 80,364.96 82,374.24 84,433.44 86,544.64 88,275.20

SALARY STEP 1 STEP 2 STEP 3 STEP 4 STEP 5 STEP 6 STEP 7 STEP 8 STEP 9 STEP 10 STEP 11RANGE
SALINAS VALLEY SOLID WASTE AUTHORITYSALARY SCHEDULE
EFFECTIVE July 1, 2018
POSITION
Hourly 34.150 35.004 35.879 36.776 37.695 38.637 39.603 40.593 41.608 42.648 43.501 28.0 Bi-Weekly 2,732.00 2,800.32 2,870.32 2,942.08 3,015.60 3,090.96 3,168.24 3,247.44 3,328.64 3,411.84 3,480.08
Monthly 5,919.33 6,067.36 6,219.03 6,374.51 6,533.80 6,697.08 6,864.52 7,036.12 7,212.05 7,392.32 7,540.17 Annual 71,032.00 72,808.32 74,628.32 76,494.08 78,405.60 80,364.96 82,374.24 84,433.44 86,544.64 88,707.84 90,482.08
Hourly 35.004 35.879 36.776 37.695 38.637 39.603 40.593 41.608 42.648 43.714 44.588 28.5 Bi-Weekly 2,800.32 2,870.32 2,942.08 3,015.60 3,090.96 3,168.24 3,247.44 3,328.64 3,411.84 3,497.12 3,567.04
Monthly 6,067.36 6,219.03 6,374.51 6,533.80 6,697.08 6,864.52 7,036.12 7,212.05 7,392.32 7,577.09 7,728.59 Annual 72,808.32 74,628.32 76,494.08 78,405.60 80,364.96 82,374.24 84,433.44 86,544.64 88,707.84 90,925.12 92,743.04
Hourly 35.879 36.776 37.695 38.637 39.603 40.593 41.608 42.648 43.714 44.807 45.703 29.0 Bi-Weekly 2,870.32 2,942.08 3,015.60 3,090.96 3,168.24 3,247.44 3,328.64 3,411.84 3,497.12 3,584.56 3,656.24
Monthly 6,219.03 6,374.51 6,533.80 6,697.08 6,864.52 7,036.12 7,212.05 7,392.32 7,577.09 7,766.55 7,921.85 Annual 74,628.32 76,494.08 78,405.60 80,364.96 82,374.24 84,433.44 86,544.64 88,707.84 90,925.12 93,198.56 95,062.24
Accountant Hourly 36.776 37.695 38.637 39.603 40.593 41.608 42.648 43.714 44.807 45.927 46.846 Business Services Supervisor 29.5 Bi-Weekly 2,942.08 3,015.60 3,090.96 3,168.24 3,247.44 3,328.64 3,411.84 3,497.12 3,584.56 3,674.16 3,747.68
Contracts & Grants Analyst Monthly 6,374.51 6,533.80 6,697.08 6,864.52 7,036.12 7,212.05 7,392.32 7,577.09 7,766.55 7,960.68 8,119.97 Field Operations Supervisor I Annual 76,494.08 78,405.60 80,364.96 82,374.24 84,433.44 86,544.64 88,707.84 90,925.12 93,198.56 95,528.16 97,439.68 Human Resources Supervisor
Recycling Coordinator
Hourly 37.695 38.637 39.603 40.593 41.608 42.648 43.714 44.807 45.927 47.075 48.017 30.0 Bi-Weekly 3,015.60 3,090.96 3,168.24 3,247.44 3,328.64 3,411.84 3,497.12 3,584.56 3,674.16 3,766.00 3,841.36
Monthly 6,533.80 6,697.08 6,864.52 7,036.12 7,212.05 7,392.32 7,577.09 7,766.55 7,960.68 8,159.67 8,322.95 Annual 78,405.60 80,364.96 82,374.24 84,433.44 86,544.64 88,707.84 90,925.12 93,198.56 95,528.16 97,916.00 99,875.36
Hourly 38.637 39.603 40.593 41.608 42.648 43.714 44.807 45.927 47.075 48.252 49.217 30.5 Bi-Weekly 3,090.96 3,168.24 3,247.44 3,328.64 3,411.84 3,497.12 3,584.56 3,674.16 3,766.00 3,860.16 3,937.36
Monthly 6,697.08 6,864.52 7,036.12 7,212.05 7,392.32 7,577.09 7,766.55 7,960.68 8,159.67 8,363.68 8,530.95 Annual 80,364.96 82,374.24 84,433.44 86,544.64 88,707.84 90,925.12 93,198.56 95,528.16 97,916.00 100,364.16 102,371.36
Hourly 39.603 40.593 41.608 42.648 43.714 44.807 45.927 47.075 48.252 49.458 50.447 31.0 Bi-Weekly 3,168.24 3,247.44 3,328.64 3,411.84 3,497.12 3,584.56 3,674.16 3,766.00 3,860.16 3,956.64 4,035.76
Monthly 6,864.52 7,036.12 7,212.05 7,392.32 7,577.09 7,766.55 7,960.68 8,159.67 8,363.68 8,572.72 8,744.15 Annual 82,374.24 84,433.44 86,544.64 88,707.84 90,925.12 93,198.56 95,528.16 97,916.00 100,364.16 102,872.64 104,929.76
Hourly 40.593 41.608 42.648 43.714 44.807 45.927 47.075 48.252 49.458 50.694 51.708 31.5 Bi-Weekly 3,247.44 3,328.64 3,411.84 3,497.12 3,584.56 3,674.16 3,766.00 3,860.16 3,956.64 4,055.52 4,136.64
Monthly 7,036.12 7,212.05 7,392.32 7,577.09 7,766.55 7,960.68 8,159.67 8,363.68 8,572.72 8,786.96 8,962.72 Annual 84,433.44 86,544.64 88,707.84 90,925.12 93,198.56 95,528.16 97,916.00 100,364.16 102,872.64 105,443.52 107,552.64
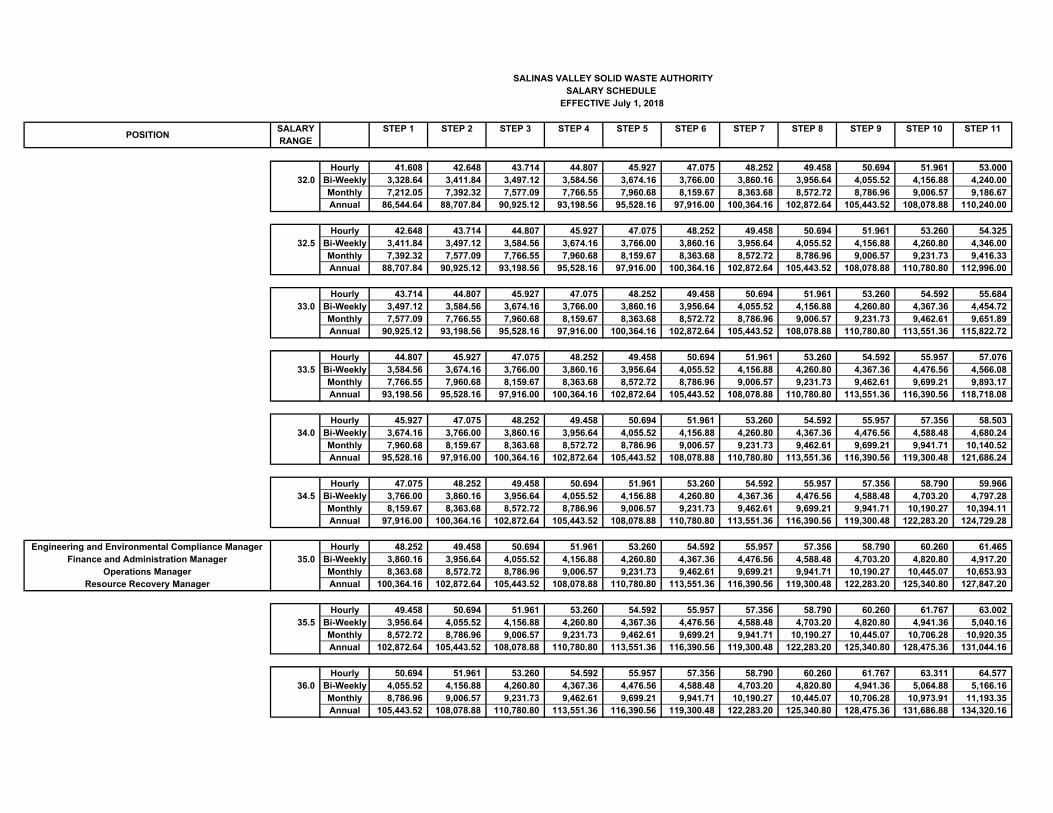
SALARY STEP 1 STEP 2 STEP 3 STEP 4 STEP 5 STEP 6 STEP 7 STEP 8 STEP 9 STEP 10 STEP 11RANGE
SALINAS VALLEY SOLID WASTE AUTHORITYSALARY SCHEDULE
EFFECTIVE July 1, 2018
POSITION
Hourly 41.608 42.648 43.714 44.807 45.927 47.075 48.252 49.458 50.694 51.961 53.000 32.0 Bi-Weekly 3,328.64 3,411.84 3,497.12 3,584.56 3,674.16 3,766.00 3,860.16 3,956.64 4,055.52 4,156.88 4,240.00
Monthly 7,212.05 7,392.32 7,577.09 7,766.55 7,960.68 8,159.67 8,363.68 8,572.72 8,786.96 9,006.57 9,186.67 Annual 86,544.64 88,707.84 90,925.12 93,198.56 95,528.16 97,916.00 100,364.16 102,872.64 105,443.52 108,078.88 110,240.00
Hourly 42.648 43.714 44.807 45.927 47.075 48.252 49.458 50.694 51.961 53.260 54.325 32.5 Bi-Weekly 3,411.84 3,497.12 3,584.56 3,674.16 3,766.00 3,860.16 3,956.64 4,055.52 4,156.88 4,260.80 4,346.00
Monthly 7,392.32 7,577.09 7,766.55 7,960.68 8,159.67 8,363.68 8,572.72 8,786.96 9,006.57 9,231.73 9,416.33 Annual 88,707.84 90,925.12 93,198.56 95,528.16 97,916.00 100,364.16 102,872.64 105,443.52 108,078.88 110,780.80 112,996.00
Hourly 43.714 44.807 45.927 47.075 48.252 49.458 50.694 51.961 53.260 54.592 55.684 33.0 Bi-Weekly 3,497.12 3,584.56 3,674.16 3,766.00 3,860.16 3,956.64 4,055.52 4,156.88 4,260.80 4,367.36 4,454.72
Monthly 7,577.09 7,766.55 7,960.68 8,159.67 8,363.68 8,572.72 8,786.96 9,006.57 9,231.73 9,462.61 9,651.89 Annual 90,925.12 93,198.56 95,528.16 97,916.00 100,364.16 102,872.64 105,443.52 108,078.88 110,780.80 113,551.36 115,822.72
Hourly 44.807 45.927 47.075 48.252 49.458 50.694 51.961 53.260 54.592 55.957 57.076 33.5 Bi-Weekly 3,584.56 3,674.16 3,766.00 3,860.16 3,956.64 4,055.52 4,156.88 4,260.80 4,367.36 4,476.56 4,566.08
Monthly 7,766.55 7,960.68 8,159.67 8,363.68 8,572.72 8,786.96 9,006.57 9,231.73 9,462.61 9,699.21 9,893.17 Annual 93,198.56 95,528.16 97,916.00 100,364.16 102,872.64 105,443.52 108,078.88 110,780.80 113,551.36 116,390.56 118,718.08
Hourly 45.927 47.075 48.252 49.458 50.694 51.961 53.260 54.592 55.957 57.356 58.503 34.0 Bi-Weekly 3,674.16 3,766.00 3,860.16 3,956.64 4,055.52 4,156.88 4,260.80 4,367.36 4,476.56 4,588.48 4,680.24
Monthly 7,960.68 8,159.67 8,363.68 8,572.72 8,786.96 9,006.57 9,231.73 9,462.61 9,699.21 9,941.71 10,140.52 Annual 95,528.16 97,916.00 100,364.16 102,872.64 105,443.52 108,078.88 110,780.80 113,551.36 116,390.56 119,300.48 121,686.24
Hourly 47.075 48.252 49.458 50.694 51.961 53.260 54.592 55.957 57.356 58.790 59.966 34.5 Bi-Weekly 3,766.00 3,860.16 3,956.64 4,055.52 4,156.88 4,260.80 4,367.36 4,476.56 4,588.48 4,703.20 4,797.28
Monthly 8,159.67 8,363.68 8,572.72 8,786.96 9,006.57 9,231.73 9,462.61 9,699.21 9,941.71 10,190.27 10,394.11 Annual 97,916.00 100,364.16 102,872.64 105,443.52 108,078.88 110,780.80 113,551.36 116,390.56 119,300.48 122,283.20 124,729.28
Engineering and Environmental Compliance Manager Hourly 48.252 49.458 50.694 51.961 53.260 54.592 55.957 57.356 58.790 60.260 61.465 Finance and Administration Manager 35.0 Bi-Weekly 3,860.16 3,956.64 4,055.52 4,156.88 4,260.80 4,367.36 4,476.56 4,588.48 4,703.20 4,820.80 4,917.20
Operations Manager Monthly 8,363.68 8,572.72 8,786.96 9,006.57 9,231.73 9,462.61 9,699.21 9,941.71 10,190.27 10,445.07 10,653.93 Resource Recovery Manager Annual 100,364.16 102,872.64 105,443.52 108,078.88 110,780.80 113,551.36 116,390.56 119,300.48 122,283.20 125,340.80 127,847.20
Hourly 49.458 50.694 51.961 53.260 54.592 55.957 57.356 58.790 60.260 61.767 63.002 35.5 Bi-Weekly 3,956.64 4,055.52 4,156.88 4,260.80 4,367.36 4,476.56 4,588.48 4,703.20 4,820.80 4,941.36 5,040.16
Monthly 8,572.72 8,786.96 9,006.57 9,231.73 9,462.61 9,699.21 9,941.71 10,190.27 10,445.07 10,706.28 10,920.35 Annual 102,872.64 105,443.52 108,078.88 110,780.80 113,551.36 116,390.56 119,300.48 122,283.20 125,340.80 128,475.36 131,044.16
Hourly 50.694 51.961 53.260 54.592 55.957 57.356 58.790 60.260 61.767 63.311 64.577 36.0 Bi-Weekly 4,055.52 4,156.88 4,260.80 4,367.36 4,476.56 4,588.48 4,703.20 4,820.80 4,941.36 5,064.88 5,166.16
Monthly 8,786.96 9,006.57 9,231.73 9,462.61 9,699.21 9,941.71 10,190.27 10,445.07 10,706.28 10,973.91 11,193.35 Annual 105,443.52 108,078.88 110,780.80 113,551.36 116,390.56 119,300.48 122,283.20 125,340.80 128,475.36 131,686.88 134,320.16
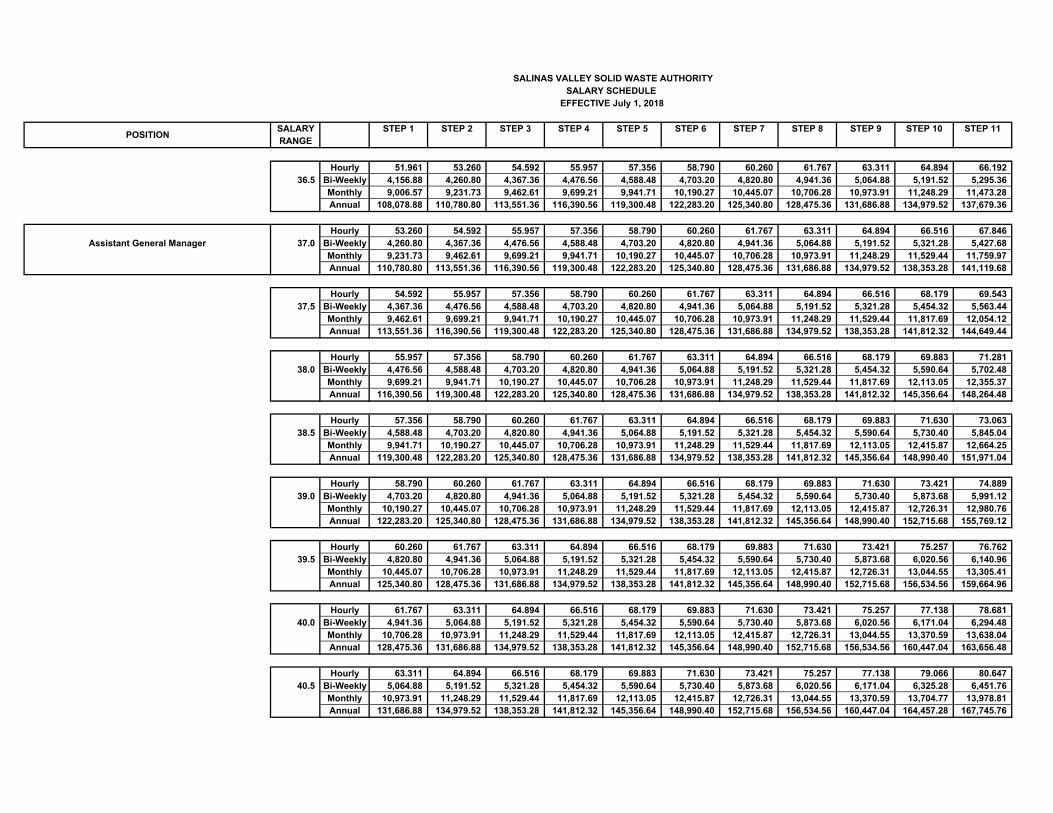
SALARY STEP 1 STEP 2 STEP 3 STEP 4 STEP 5 STEP 6 STEP 7 STEP 8 STEP 9 STEP 10 STEP 11RANGE
SALINAS VALLEY SOLID WASTE AUTHORITYSALARY SCHEDULE
EFFECTIVE July 1, 2018
POSITION
Hourly 51.961 53.260 54.592 55.957 57.356 58.790 60.260 61.767 63.311 64.894 66.192 36.5 Bi-Weekly 4,156.88 4,260.80 4,367.36 4,476.56 4,588.48 4,703.20 4,820.80 4,941.36 5,064.88 5,191.52 5,295.36
Monthly 9,006.57 9,231.73 9,462.61 9,699.21 9,941.71 10,190.27 10,445.07 10,706.28 10,973.91 11,248.29 11,473.28 Annual 108,078.88 110,780.80 113,551.36 116,390.56 119,300.48 122,283.20 125,340.80 128,475.36 131,686.88 134,979.52 137,679.36
Hourly 53.260 54.592 55.957 57.356 58.790 60.260 61.767 63.311 64.894 66.516 67.846 Assistant General Manager 37.0 Bi-Weekly 4,260.80 4,367.36 4,476.56 4,588.48 4,703.20 4,820.80 4,941.36 5,064.88 5,191.52 5,321.28 5,427.68
Monthly 9,231.73 9,462.61 9,699.21 9,941.71 10,190.27 10,445.07 10,706.28 10,973.91 11,248.29 11,529.44 11,759.97 Annual 110,780.80 113,551.36 116,390.56 119,300.48 122,283.20 125,340.80 128,475.36 131,686.88 134,979.52 138,353.28 141,119.68
Hourly 54.592 55.957 57.356 58.790 60.260 61.767 63.311 64.894 66.516 68.179 69.543 37.5 Bi-Weekly 4,367.36 4,476.56 4,588.48 4,703.20 4,820.80 4,941.36 5,064.88 5,191.52 5,321.28 5,454.32 5,563.44
Monthly 9,462.61 9,699.21 9,941.71 10,190.27 10,445.07 10,706.28 10,973.91 11,248.29 11,529.44 11,817.69 12,054.12 Annual 113,551.36 116,390.56 119,300.48 122,283.20 125,340.80 128,475.36 131,686.88 134,979.52 138,353.28 141,812.32 144,649.44
Hourly 55.957 57.356 58.790 60.260 61.767 63.311 64.894 66.516 68.179 69.883 71.281 38.0 Bi-Weekly 4,476.56 4,588.48 4,703.20 4,820.80 4,941.36 5,064.88 5,191.52 5,321.28 5,454.32 5,590.64 5,702.48
Monthly 9,699.21 9,941.71 10,190.27 10,445.07 10,706.28 10,973.91 11,248.29 11,529.44 11,817.69 12,113.05 12,355.37 Annual 116,390.56 119,300.48 122,283.20 125,340.80 128,475.36 131,686.88 134,979.52 138,353.28 141,812.32 145,356.64 148,264.48
Hourly 57.356 58.790 60.260 61.767 63.311 64.894 66.516 68.179 69.883 71.630 73.063 38.5 Bi-Weekly 4,588.48 4,703.20 4,820.80 4,941.36 5,064.88 5,191.52 5,321.28 5,454.32 5,590.64 5,730.40 5,845.04
Monthly 9,941.71 10,190.27 10,445.07 10,706.28 10,973.91 11,248.29 11,529.44 11,817.69 12,113.05 12,415.87 12,664.25 Annual 119,300.48 122,283.20 125,340.80 128,475.36 131,686.88 134,979.52 138,353.28 141,812.32 145,356.64 148,990.40 151,971.04
Hourly 58.790 60.260 61.767 63.311 64.894 66.516 68.179 69.883 71.630 73.421 74.889 39.0 Bi-Weekly 4,703.20 4,820.80 4,941.36 5,064.88 5,191.52 5,321.28 5,454.32 5,590.64 5,730.40 5,873.68 5,991.12
Monthly 10,190.27 10,445.07 10,706.28 10,973.91 11,248.29 11,529.44 11,817.69 12,113.05 12,415.87 12,726.31 12,980.76 Annual 122,283.20 125,340.80 128,475.36 131,686.88 134,979.52 138,353.28 141,812.32 145,356.64 148,990.40 152,715.68 155,769.12
Hourly 60.260 61.767 63.311 64.894 66.516 68.179 69.883 71.630 73.421 75.257 76.762 39.5 Bi-Weekly 4,820.80 4,941.36 5,064.88 5,191.52 5,321.28 5,454.32 5,590.64 5,730.40 5,873.68 6,020.56 6,140.96
Monthly 10,445.07 10,706.28 10,973.91 11,248.29 11,529.44 11,817.69 12,113.05 12,415.87 12,726.31 13,044.55 13,305.41 Annual 125,340.80 128,475.36 131,686.88 134,979.52 138,353.28 141,812.32 145,356.64 148,990.40 152,715.68 156,534.56 159,664.96
Hourly 61.767 63.311 64.894 66.516 68.179 69.883 71.630 73.421 75.257 77.138 78.681 40.0 Bi-Weekly 4,941.36 5,064.88 5,191.52 5,321.28 5,454.32 5,590.64 5,730.40 5,873.68 6,020.56 6,171.04 6,294.48
Monthly 10,706.28 10,973.91 11,248.29 11,529.44 11,817.69 12,113.05 12,415.87 12,726.31 13,044.55 13,370.59 13,638.04 Annual 128,475.36 131,686.88 134,979.52 138,353.28 141,812.32 145,356.64 148,990.40 152,715.68 156,534.56 160,447.04 163,656.48
Hourly 63.311 64.894 66.516 68.179 69.883 71.630 73.421 75.257 77.138 79.066 80.647 40.5 Bi-Weekly 5,064.88 5,191.52 5,321.28 5,454.32 5,590.64 5,730.40 5,873.68 6,020.56 6,171.04 6,325.28 6,451.76
Monthly 10,973.91 11,248.29 11,529.44 11,817.69 12,113.05 12,415.87 12,726.31 13,044.55 13,370.59 13,704.77 13,978.81 Annual 131,686.88 134,979.52 138,353.28 141,812.32 145,356.64 148,990.40 152,715.68 156,534.56 160,447.04 164,457.28 167,745.76

SALARY STEP 1 STEP 2 STEP 3 STEP 4 STEP 5 STEP 6 STEP 7 STEP 8 STEP 9 STEP 10 STEP 11RANGE
SALINAS VALLEY SOLID WASTE AUTHORITYSALARY SCHEDULE
EFFECTIVE July 1, 2018
POSITION
Hourly 64.894 66.516 68.179 69.883 71.630 73.421 75.257 77.138 79.066 81.043 82.664 41.0 Bi-Weekly 5,191.52 5,321.28 5,454.32 5,590.64 5,730.40 5,873.68 6,020.56 6,171.04 6,325.28 6,483.44 6,613.12
Monthly 11,248.29 11,529.44 11,817.69 12,113.05 12,415.87 12,726.31 13,044.55 13,370.59 13,704.77 14,047.45 14,328.43 Annual 134,979.52 138,353.28 141,812.32 145,356.64 148,990.40 152,715.68 156,534.56 160,447.04 164,457.28 168,569.44 171,941.12
Hourly 66.516 68.179 69.883 71.630 73.421 75.257 77.138 79.066 81.043 83.069 84.730 41.5 Bi-Weekly 5,321.28 5,454.32 5,590.64 5,730.40 5,873.68 6,020.56 6,171.04 6,325.28 6,483.44 6,645.52 6,778.40
Monthly 11,529.44 11,817.69 12,113.05 12,415.87 12,726.31 13,044.55 13,370.59 13,704.77 14,047.45 14,398.63 14,686.53 Annual 138,353.28 141,812.32 145,356.64 148,990.40 152,715.68 156,534.56 160,447.04 164,457.28 168,569.44 172,783.52 176,238.40
Hourly 68.179 69.883 71.630 73.421 75.257 77.138 79.066 81.043 83.069 85.146 86.849 42.0 Bi-Weekly 5,454.32 5,590.64 5,730.40 5,873.68 6,020.56 6,171.04 6,325.28 6,483.44 6,645.52 6,811.68 6,947.92
Monthly 11,817.69 12,113.05 12,415.87 12,726.31 13,044.55 13,370.59 13,704.77 14,047.45 14,398.63 14,758.64 15,053.83 Annual 141,812.32 145,356.64 148,990.40 152,715.68 156,534.56 160,447.04 164,457.28 168,569.44 172,783.52 177,103.68 180,645.92
Hourly 69.883 71.630 73.421 75.257 77.138 79.066 81.043 83.069 85.146 87.275 89.021 42.5 Bi-Weekly 5,590.64 5,730.40 5,873.68 6,020.56 6,171.04 6,325.28 6,483.44 6,645.52 6,811.68 6,982.00 7,121.68
Monthly 12,113.05 12,415.87 12,726.31 13,044.55 13,370.59 13,704.77 14,047.45 14,398.63 14,758.64 15,127.67 15,430.31 Annual 145,356.64 148,990.40 152,715.68 156,534.56 160,447.04 164,457.28 168,569.44 172,783.52 177,103.68 181,532.00 185,163.68
Hourly 95.95 General Manager/CAO Bi-Weekly 7,676.00
Monthly 16,631.33 Annual 199,576.00
N/A (Board
Approved Contract)
Proposed BudgetFY 2018-19
March 15, 2018
ITEM NO. 9

Budget Assumptions
• Status Quo
– No program changes other than organics program approved in September 2017.
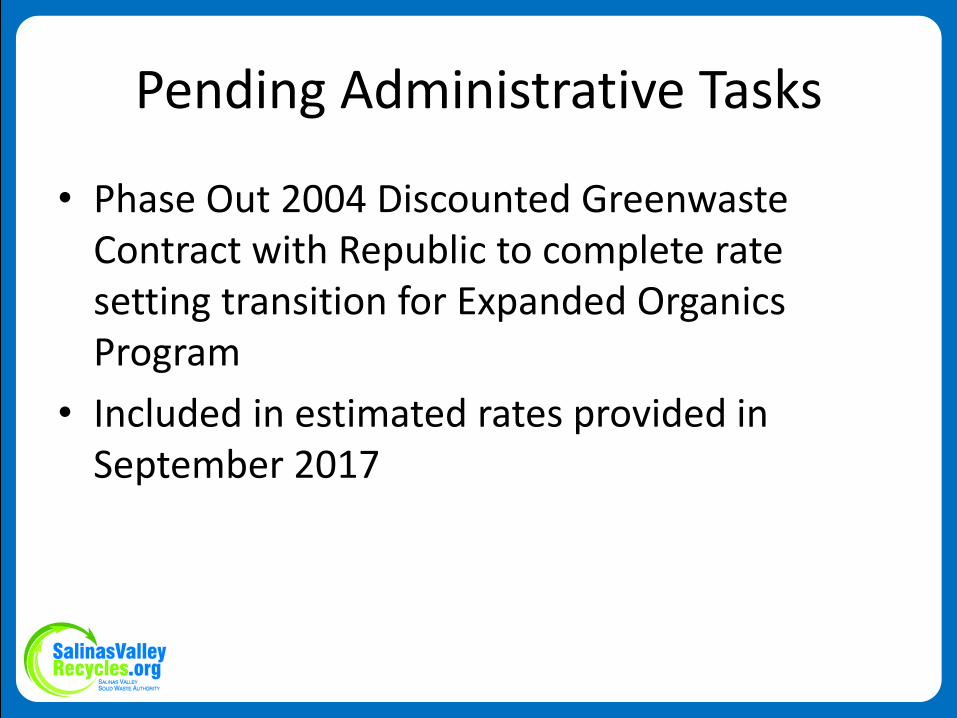
Pending Administrative Tasks
• Phase Out 2004 Discounted Greenwaste Contract with Republic to complete rate setting transition for Expanded Organics Program
• Included in estimated rates provided in September 2017

Projected Revenue Increase
7,500-ton increase in solid waste tonnage projection $ 513,750
Expanded Organics Program Phased Increase to tipping fees 165,025
$ .25 Transportation Surcharge Increase 46,550
Net all other Revenue Increases/(Decreases) 20,200
Total Revenue Increase 745,525

FY 2018-19 Projected Operating Budget Increase
Debt Service Increase $ 1,084,800
Payroll Increases 225,550
Expanded Organics Processing
Includes 2 Diversion Workers (6 months) 204,700
Facility Maintenance 34,300
Contract Labor 32,100
Closure Costs 19,800
Repair & Maintenance Supplies 18,000
Litter Abatement 16,000
All Other Increases / (Decreases) 13,750
Total Increase $ 1,649,000
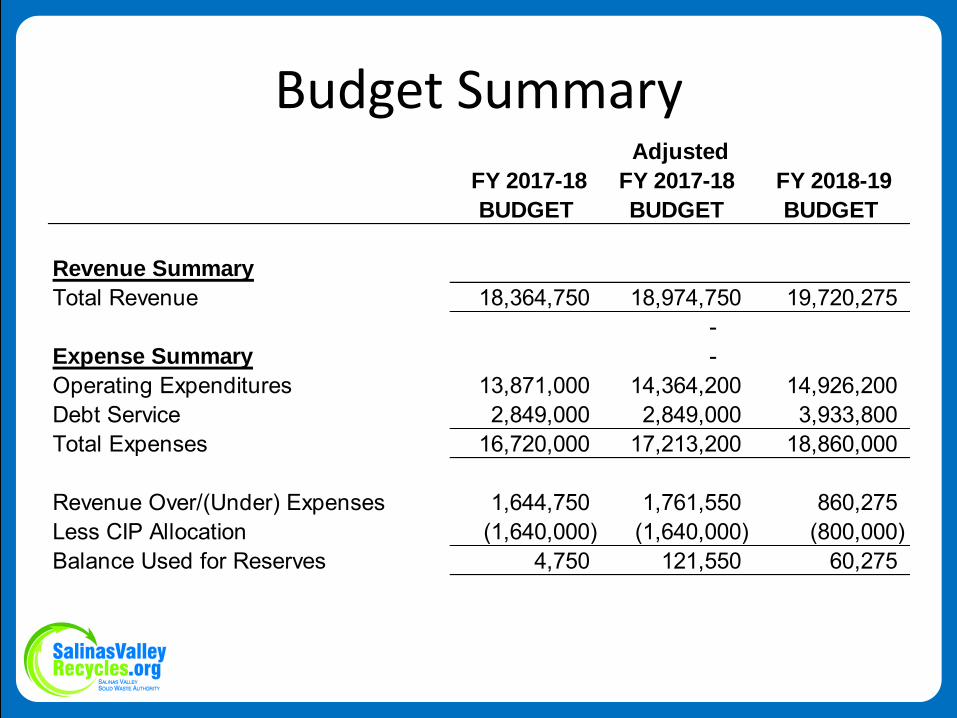
Budget Summary
FY 2017-18
BUDGET
Adjusted
FY 2017-18
BUDGET
FY 2018-19
BUDGET
Revenue Summary
Total Revenue 18,364,750 18,974,750 19,720,275 -
Expense Summary - Operating Expenditures 13,871,000 14,364,200 14,926,200 Debt Service 2,849,000 2,849,000 3,933,800 Total Expenses 16,720,000 17,213,200 18,860,000
Revenue Over/(Under) Expenses 1,644,750 1,761,550 860,275 Less CIP Allocation (1,640,000) (1,640,000) (800,000) Balance Used for Reserves 4,750 121,550 60,275

CIP Budget
Johnson Canyon LFG System (Vertical Wells) 30,000
Johnson Canyon Corrective Action Program 125,000
Johnson Canyon LFG System (Horizontal Wells) 30,000
Johnson Canyon Litter Control Fence 50,000
Johnson Canyon Module Construction 250,000
Concrete Grinding 20,000
Jolon Road Transfer Station Replacement Well 75,000
Jolon Road Equipment Purchase/Replacement (Repayment) 120,000
SSTS Equipment Replacement 100,000
Total Operating Surplus Allocations 800,000


Apr May Jun Jul Aug Sep
A
1 Minutes Minutes Minutes Minutes Minutes
2 Claims/Financials (EC) Claims/Financials (EC)Claims/Financials
(EC)
May
Claims/Financials (EC)
Claims/Financials (EC)
3Member Agencies
Activities Report
Member Agencies
Activities Report
Member Agencies
Activities Report/BD
Public Outreach
Participation (sp)
QTE June Cash &
Investments
Member Agencies
Activities Report
4QTE March
Cash & InvestmentsStrategic Plan Update Strategic Plan Update
June
Claims/Financials (EC)
Strategic Plan Update
5
1st Qtr
Facilities Customer
Survey
1st Qtr
Tonnage & Diversion
Report
LTFN EIR Qtrly
Update (sp)
Member Agencies
Activities Report
CCPP Supplemental
Appropriations (EC)
6QTE CAG
Update
Financial Policies
(EC)
Board Policy
Updates (EC)
2nd Qtr
Tonnage & Diversion
Report
Tire Amnesty Grant
Supplemental
Appropriation (EC)
7Wally-Waste-Not
Award
FY Investment Policy (EC)
3rd QTE
Facilities Customer
Survey
LTFN EIR Qtrly
Update (sp)
8CalPERS Resolution
Adoption
New/Ext Agreements
& Contracts
QTE CAG
Update
2016-2017 SVR
Annual Report
9
STRATEGIC PLAN
NEW
6-MONTH
OBJECTIVES
Strategic Plan
Approval & Update
Annual Tonnage &
Diversion Performance
Report
New FY Grants &
CIP Budget
10 Recycling Recognition
Annual Franchise
Haulers Performance
Rpt
C&D Recycling
Program
(EC) (sp)
11
12
13
14
15
16
SVR Agenda Items - View Ahead 2018
MEE
TIN
GS R
ECES
S
Item No. 10