peru economic outlook 2q18 - bbvaresearch.com · funds’ investments abroad and the impact of ......
TRANSCRIPT

Peru Economic Outlook Second quarter 2018
Peru Unit

Peru Economic Outlook - Second quarter 2018 2
Contents
1. Summary 3
2. Global economy: growth rate holds firm, but risks of protectionism intensify 5
3. Peru: we are projecting GDP to grow by 3.2% in 2018 and 3.5% in 2019 7
4. Fiscal policy: increase revenues and stabilize current spending to ensure the stability of public finances 15
5. External sector: we foresee a record trade surplus for this year 18
6. Domestic financial markets: resistance to episodes of stress 19
7. Inflation: no problems in sight 22
8. Monetary policy: pause in the short term 23
9. Risks to our growth forecasts for 2018 and 2019, balanced 24
10. Tables 25
Closing date: 12 April 2018

Peru Economic Outlook - Second quarter 2018 3
1. Summary
The Peruvian economy picked up pace in the first quarter. According to our estimates, growth in these first months
of 2018 was 3.2% in year-on-year terms, the best growth rate in a year and a half. On the demand side, the main
support to growth was public spending, which at sector level was reflected in the positive performance of the
Construction sector. Admittedly much of the increase in public spending was due to the low year-on-year basis for
comparison, but it is also the case that the Peruvian economy faced significant difficulties in the first quarter: a
notable increase in political noise, which ended with the president’s resignation and the investigations into the
alleged cases of corruption in which several construction companies are said to have been involved in order to
obtain awards of public works, an environment that is inhibiting the flow of financing to the sector. To this must be
added such negative events as the rupturing of an important gas pipeline and the decrease in mining extraction
(due to maintenance work on some units and diminishing yields). It was in spite of all these factors that the
Peruvian economy picked up pace in the early part of the year, albeit not as much as we anticipated in our previous
report (4.4%).
Our baseline scenario assumes that GDP, having grown by 2.5% last year, will increase by 3.2% in 2018. This
acceleration is based, on the external side, on an environment that will continue to be positive for the Peruvian
economy, with metal prices still at attractive levels (which will favour private investment in the mining sector). On
the domestic front, weather conditions will return to normal following the El Niño Costero weather pattern of the
beginning of last year. Furthermore, public spending will increase to rebuild infrastructure damaged by that weather
event and to construct the infrastructure needed for the 2019 Pan American Games. The forecast also assumes
that the political tensions will ease, at least during the first few months of the Vizcarra administration. In comparison
with what we anticipated last January, we now estimate that GDP growth in 2018 will be 0.3 pp less, a revision that
is basically explained by the negative surprise of the first quarter of the year. For 2019 we expect GDP to continue
accelerating and to grow by about 3.5%. This forecast is underpinned by the start of construction of a number of
small and medium-size mines, which will be reflected in increased private investment in the mining sector.
As regards the fiscal situation, we are forecasting a deficit equivalent to 3.4% of GDP in 2018, more than last year
(3.1%). The increase is explained by the expansion of public spending on infrastructure (reconstruction and next
year’s Pan American Games for example) and in the financial outflow we estimate there will be by way of interest
on the public debt. Revenues also improve - for the first time since 2012 - but not enough to offset the increased
spending. This improvement will reflect the increased dynamism of domestic demand, higher metal prices on
average over the year, lower tax refunds and the absence of the downward effect of last year’s “IGV Justo”
programme allowing small companies to defer payment of sales tax. In this context, we see the balance of gross
public debt reaching a level equivalent to 26.5% of GDP. Further ahead, our baseline scenario includes some fiscal
consolidation, although more conservative than that which the government has imposed upon itself, so that there
will be more room for current spending while at the same time keeping to the commitment to bring the fiscal
accounts to a sustainable level in the medium term.
As for the financial markets, in general Peruvian assets turned in an attractive performance in the first few months
of the year, despite the high and persistent level of political noise. Following the change of president, risk indicators
declined, stock market indices rose and the national currency appreciated. As regards this last-mentioned variable,
our forecast is for the exchange rate to end the year at between 3.20 and 3.25 soles to the dollar. This implies a
certain appreciation of the national currency compared with the level at which it stood at the end of 2017. Behind
this forecast is the influx of dollars on the trade side (we anticipate a trade surplus of nearly US$7 billion) and the
financial side, which will probably be moderated by central bank intervention in the currency market. The influx of
dollars on the financial side comes from the reinvestment of profits by mining companies, in a context of attractive
metal prices, and increased holdings of sovereign bonds by foreign investors, given the greater supply of public

Peru Economic Outlook - Second quarter 2018 4
debt to finance the bigger fiscal deficit - all of which will more than offset the raising of the limit on AFP pension
funds’ investments abroad and the impact of higher interest rates in the US due to the continuing process of
monetary normalisation.
As for prices, inflation has fallen significantly and quickly in the past few months, and is now at 0.4%, below the
target range. This is the lowest reading since the end of 2009. The declining trend in inflation was due mainly to the
fall in food prices after the effects of El Niño Costero dissipated, and in some cases to overproduction. Other
factors contributing to the decline in inflation were the absence of demand pressures on prices (given the cyclical
position of the economy) and the appreciation of the Peruvian currency. Nevertheless the current level of inflation is
temporary. Going forward, year-on-year inflation will tend to move gradually towards the middle of the target range,
in a context in which the rate of increase in food prices will return to normal (it is currently at -5% YoY, whereas the
monthly average for the past five years has been around 3%), which will more than offset the downward pressures
on inflation produced by the slack in various sectors of the economy. On balance, we foresee inflation ending the
year at 2.0%.
In this environment of significantly falling inflation, downward correction of inflationary expectations and cyclical
weakness of the economy, the Central Bank has continued to reduce its monetary policy reference interest rate. It
currently stands at 2.75%. Our baseline scenario envisages a recovery in domestic demand, with inflation gradually
moving towards the middle of the target range, which is consistent with the reference rate being held at 2.75% for
the remainder of the year. This view is supported by the facts that: the various measurements of inflationary trends,
and inflationary expectations themselves, are at around 2%; headline inflation is below the target range, but only
temporarily (because of the high base for comparison YoY due to El Niño Costero at the beginning of 2017); all
economic activities that may be affected by monetary policy (non-primary GDP) continue to recover gradually and
are currently growing at somewhat more than 3% YoY; the political noise has abated; in our baseline scenario we
assume that the implementing regulations of the law replacing DU30737 will soon be published (which will help
unblock activity in the Construction sector); and the position of monetary policy right now is clearly expansive (the
ex-ante real interest rate is around 0.6%, while the neutral rate is around 1.5% according to our estimates).
Lastly, as with any projection, there are risks that economic growth may deviate from what we are anticipating. The
main factors that could lead to such deviation are: intensification of US protectionist measures, leading to retaliation
by the rest of the world; more aggressive monetary adjustment in the US than we have assumed in our baseline
scenario, due to a more pronounced acceleration in inflation; and a more marked slowing of growth in China. All
these are external, downside risks. On the home front, and still downside, there is the risk of a delay in publishing
the implementing regulations of Law 30737, which would hold up the flow of financing to the Construction sector for
longer; on the upside, however, we have two domestic risks: the first is that of construction of the Quellaveco
copper mining project starting in the second half of the year, which would have a direct, positive impact on private
investment and could also favour business confidence, and the second is that of the current political détente also
being translated into improved business confidence (which would thus be higher than in our baseline scenario) or
even of its possibly providing room for agreement on measures to facilitate growth in activity.

Peru Economic Outlook - Second quarter 2018 5
2. Global economy: growth rate holds firm, but risks of protectionism intensify
The global economy is currently being subjected to divergent forces. The new fiscal stimulus measures approved
by the US administration will prolong the favourable phase in the world economic cycle, which has so far been
supported by high levels of confidence and the positive tone of industrial activity and international trade, which also
benefit China and Europe. On the other hand, the increased vulnerability of the US public accounts brought about
by these fiscal stimulus measures, combined with the prospect of financial markets facing greater volatility than in
2017, make this scenario more uncertain. Added to this is the ratcheting up of protectionist rhetoric in the US,
which has started to find expression in specific measures. All this is in a context of the normalisation of monetary
policies following years of exceptional stimulus measures, which may also give rise to additional doubts.
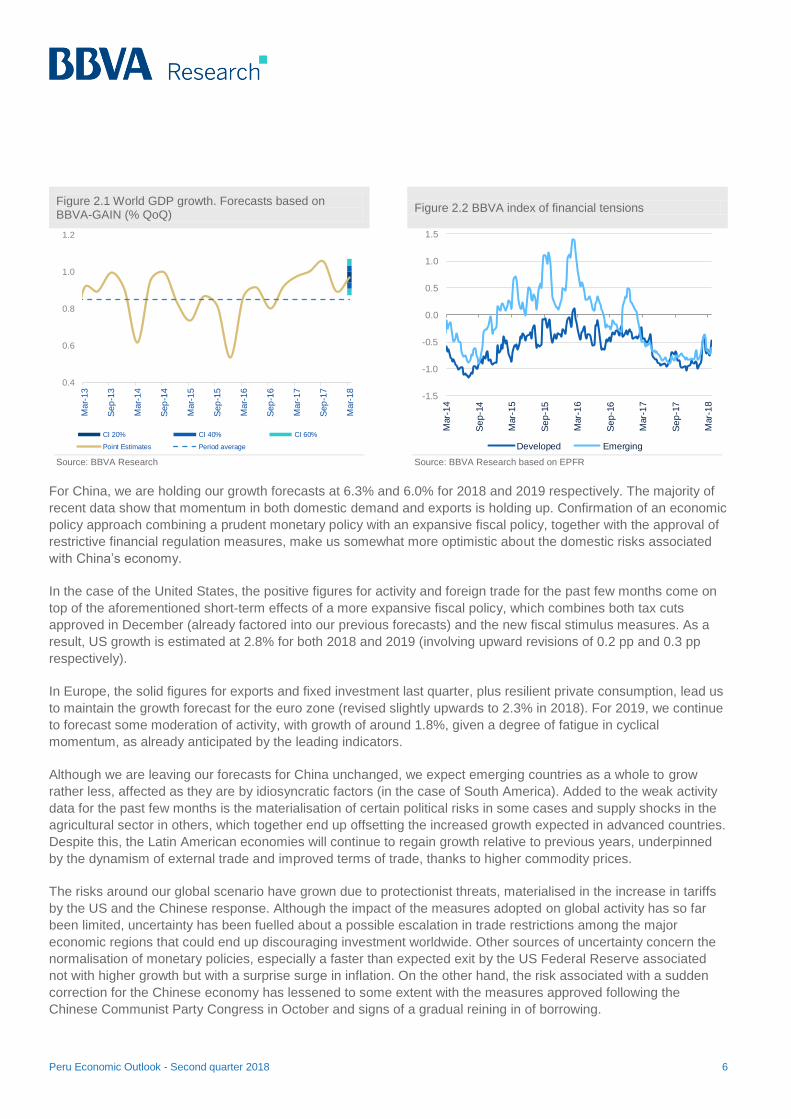
Growth has held stable at the beginning of 2018 (Figure 2.1), with greater dynamism in the emerging economies
and some signs of slowing in the developed countries. Data available for the first two months of the year suggest
that global growth in the first quarter will have been at a similar rate to the average for 2017 (1% QoQ). This growth
has been favoured firstly by the good performance of world trade, which picked up substantially, especially as
regards exports of emerging economies, and in particular (in February) of Asian countries (mainly China and India).
A second factor is the sound growth in industrial production, likewise particularly in the emerging markets.
Probably the biggest news in the past three months in the global context has been the fiscal stimulus approved in
the United States in February. This should have a moderate effect on growth in the short term (since the US
economy is already very close to full employment) and could exert upward pressure on interest rates (in the midst
of normalisation by the US Federal Reserve). For all these reasons, we estimate that this will exert a small
multiplier effect on activity (of around 0.4), which would involve an upward revision in GDP growth of around 0.2 to
0.3 pp in both 2018 and 2019.
That said, in the short term the US fiscal stimulus might prolong the global expansionary phase, extending the
cyclical recovery and leading to an increase in global demand. However, this effect will be countered in our
scenario by the increase in volatility globally or by the resurgence of greater political uncertainty in some areas, as
well as by the possible negative effect of the uncertainty associated with protectionist measures.
Following a year dominated by optimism and risk-taking in financial markets, the first quarter of 2018 has shown a
more cautious tone. On the one hand, financial conditions, which have been highly accommodative, have started to
tighten. And above all, volatility, which has been unusually low, seems to be transitioning towards a more “normal”
situation (higher volatility and possibly more persistent volatility shocks), while monetary policy continues to
normalise. Specifically in the US Federal Reserve’s case we expect the process to speed up a little (with four 25 bp
reference rate hikes in 2018, as against the three previously forecast) following the fiscal boost. Furthermore, long-
term interest rates are settling at higher levels, especially in the US, due to the increased growth and fiscal
deterioration, which implies greater financing needs and adds a risk premium to the financing of the US Treasury.
On the other hand the bout of volatility in early February, which prompted a sharp correction on the stock markets
of the developed countries, has for the time being led to very little spill-over to other kinds of assets. All this has
contributed to pushing up our financial stress indicator in both developed and emerging economies (Figure 2.2).
Given this scenario, we are standing by our forecast for world growth of 3.8% for the 2018-19 period. This does
however involve an upward revision of growth prospects for both the US and the euro zone, offset by slightly less
buoyancy in emerging economies, especially in South America.
Peru Economic Outlook - Second quarter 2018 6
Figure 2.1 World GDP growth. Forecasts based on BBVA-GAIN (% QoQ)
Figure 2.2 BBVA index of financial tensions
Source: BBVA Research
Source: BBVA Research based on EPFR
For China, we are holding our growth forecasts at 6.3% and 6.0% for 2018 and 2019 respectively. The majority of
recent data show that momentum in both domestic demand and exports is holding up. Confirmation of an economic
policy approach combining a prudent monetary policy with an expansive fiscal policy, together with the approval of
restrictive financial regulation measures, make us somewhat more optimistic about the domestic risks associated
with China’s economy.
In the case of the United States, the positive figures for activity and foreign trade for the past few months come on
top of the aforementioned short-term effects of a more expansive fiscal policy, which combines both tax cuts
approved in December (already factored into our previous forecasts) and the new fiscal stimulus measures. As a
result, US growth is estimated at 2.8% for both 2018 and 2019 (involving upward revisions of 0.2 pp and 0.3 pp
respectively).
In Europe, the solid figures for exports and fixed investment last quarter, plus resilient private consumption, lead us
to maintain the growth forecast for the euro zone (revised slightly upwards to 2.3% in 2018). For 2019, we continue
to forecast some moderation of activity, with growth of around 1.8%, given a degree of fatigue in cyclical
momentum, as already anticipated by the leading indicators.
Although we are leaving our forecasts for China unchanged, we expect emerging countries as a whole to grow
rather less, affected as they are by idiosyncratic factors (in the case of South America). Added to the weak activity
data for the past few months is the materialisation of certain political risks in some cases and supply shocks in the
agricultural sector in others, which together end up offsetting the increased growth expected in advanced countries.
Despite this, the Latin American economies will continue to regain growth relative to previous years, underpinned
by the dynamism of external trade and improved terms of trade, thanks to higher commodity prices.
The risks around our global scenario have grown due to protectionist threats, materialised in the increase in tariffs
by the US and the Chinese response. Although the impact of the measures adopted on global activity has so far
been limited, uncertainty has been fuelled about a possible escalation in trade restrictions among the major
economic regions that could end up discouraging investment worldwide. Other sources of uncertainty concern the
normalisation of monetary policies, especially a faster than expected exit by the US Federal Reserve associated
not with higher growth but with a surprise surge in inflation. On the other hand, the risk associated with a sudden
correction for the Chinese economy has lessened to some extent with the measures approved following the
Chinese Communist Party Congress in October and signs of a gradual reining in of borrowing.
0.4
0.6
0.8
1.0
1.2
Mar-
13
Sep
-13
Mar-
14
Sep
-14
Mar-
15
Sep
-15
Mar-
16
Sep
-16
Mar-
17
Sep
-17
Mar-
18
CI 20% CI 40% CI 60%
Point Estimates Period average
-1.5
-1.0
-0.5
0.0
0.5
1.0
1.5
Mar-
14
Se
p-1
4
Mar-
15
Se
p-1
5
Mar-
16
Se
p-1
6
Mar-
17
Se
p-1
7
Mar-
18
Developed Emerging

Peru Economic Outlook - Second quarter 2018 7
3. Peru: we are projecting GDP to grow by 3.2% in 2018 and 3.5% in 2019
Growth seems to have accelerated in the first quarter
In the first quarter of this year GDP looks to have grown by about 3.2% year on year. This is the highest growth
rate in a year and a half (see Figure 3.1). On the demand side, public spending (both consumption and investment
by the government) gave support to growth in the first three months of the year, in large part due to the low base
for YoY comparison (see Figure 3.2). At sector level, fiscal expansion was reflected in the favourable performance
of the Construction sector. The Agriculture and Livestock and Primary Manufacturing sectors appear also to have
posted good results.
Figure 3.1 GDP* (change % YoY)
Figure 3.2 GDP on the expenditure side* (in real terms, change % YoY)
* Estimated for the first quarter of 2018
Source: Central Reserve Bank of Peru and BBVA Research
* Excludes change in inventories. Figures for the first quarter of 2018 are estimated. Source: Central Reserve Bank of Peru and BBVA Research
Relative to the projections that we published in January, we now estimate that first quarter growth will have been
less (3.2% as against 4.4%). The difference is explained mainly by lower than forecast growth in Metal Mining due
to lower yields; in Oil & Gas due to the rupturing in February of TGP’s gas pipeline that goes from Camisea (Cusco
province) to the coast; and in Construction due to the investigation into allegations of corruption involving various
construction companies with experience in carrying out public works and infrastructure projects. The lower GDP
growth in the first quarter gives our full-year growth projection a downward bias of 0.3 pp.
GDP could have performed better in the early part of the year were it not for the political noise and the problems in the construction sector
Between December 2017 and March of this year, political tensions increased considerably in Peru (see Figure 3.3).
In this period, the country went through two presidential impeachment processes (the first was voted on in
Congress but did not pass, while the second was cut short), a pardon for former president Fujimori, which sparked
great controversy, and finally the resignation of President Pedro Pablo Kuczynski (PPK). On top of this came the
investigations into alleged corruption involving various companies in the Construction sector in the awarding of

Peru Economic Outlook - Second quarter 2018 8
public works contracts. This case, which has come to be known as “The Construction Club”, comes on top of, and
is connected with, ‘Lava Jato’ (‘Operation Car Wash’, a Brazilian investigation into money laundering and
corruption, with implications for Peru via construction company Odebrecht) which has had repercussions in Peru
since the beginning of last year.
Figure 3.3 Indicator of political tensions in Peru (100 = 27 March 2018, the highest point in the sample)
Source: GDELT (Global Database of Events, Language, and Tone) and BBVA Research.
Both the increased political tensions and the alleged illegal practices of certain construction companies have had
negative repercussions on the performance of the economy. The persistent political noise and the precarious
position of some of the most senior state officials bred great uncertainty during the first quarter, accompanied by
falling confidence and possibly greater circumspection in spending decisions in both the private and public sectors.
Added to this is the case of the “Construction Club”, which, not unnaturally, has held back the flow of financing to
construction companies, thus jeopardising the sector’s carrying on of its normal business, particularly that relating
to public works and infrastructure projects.
The situation and challenges inherited by the new government
Although political tensions and sector problems have characterised the context of the past few months, it is worth
pointing out that the new administration of President Martín Vizcarra is taking over a country with solid economic
fundamentals (see Figure 3.4). In this regard, and despite the volatile domestic environment, in March Fitch
maintained its credit rating and outlook for Peruvian government debt (at BBB+, outlook stable). The other major
rating agencies did the same: Moody’s (A3, outlook stable), Standard & Poor’s (BBB+, outlook stable). The fact that
Peru’s government debt rating and outlook were maintained contrasts with the downward revisions of various other
countries in the region in the past few months.
0
20
40
60
80
100
120
Jul-15 Oct-15 Jan-16 Apr-16 Jul-16 Oct-16 Jan-17 Apr-17 Jul-17 Oct-17 Jan-18
Indicator of political tensions moving three-month average
Odebrecht
Preventivedetention of
Ollanta Humala
and Nadine
Start of impeachment
proceedings
Resigation of Kuczynski

Peru Economic Outlook - Second quarter 2018 9
Figure 3.4 Peru: macroeconomic fundamentals (% of GDP)
* Pacific Alliance excluding Peru (i.e. Chile, Colombia and Mexico) Source: IMF, central banks, World Bank and BBVA Research
Needless to say the new administration also faces significant challenges to which it will have to give its immediate
attention. In our opinion the two most important ones are accelerating growth and ensuring fiscal sustainability. For
the boosting of economic activity we do not see much room at present for implementing long-term measures such
as reforms of basic markets that are not working appropriately, like the labour market, or institutional improvements
(to the judicial system for example). However, for the short term, some very specific actions can be taken, such as
publishing the implementing regulations of Law 30737, which will help to normalise (or even supercharge) activity
in the Construction sector and reduce the risk of a slowdown in the execution of public works and in investment.
The government could also ensure appropriate conditions (in an environment of attractive metal prices) for major
mining projects currently being evaluated to be carried out.
On the fiscal front, the deficit needs to be reduced in the next few years. To achieve this consolidation it will be
necessary on the one hand to increase government revenues as a percentage of GDP, and on the other to contain
current spending, which has risen in recent years and displaced capital expenditure.
To boost tax revenues, the new authorities could continue with their predecessors’ efforts to implement anti-tax
avoidance laws. It would also be desirable to reach a consensus on rationalising tax exemptions (which are
currently equivalent to 2.2% of GDP). As for containing current spending, greater coordination with the legislative
arm is required regarding the proclamation of laws involving substantial increases in short-term outflows. Along the
same lines, the executive will have to insist on gradual implementation of the proposals for incorporating public
sector employees currently on temporary administrative service contracts (CAS) and for bringing Police and Armed
Forces pensions into line with one another (additional details on these issues in the Fiscal Policy section).
Lastly, another priority item on the new government’s agenda will be the fight against corruption, a persistent
problem that has negatively affected growth in the past few years (among other things by paralysing various
infrastructure projects, and also because bribes can be seen as a tax on investment). Combating corruption will
require strengthening control mechanisms and institutional improvements (judicial system, administrative
simplification, greater transparency in competitive bidding processes, etc.), but at the same time care must be
taken not to allow this effort to hamper public sector decision making.
2.3
-3.1
-2.9
2012 2017
Fiscal Result
20.4
24.8
41.9
2012 2017
Public Debt
-2.8
-1.3
-2.5
2012 2017
Current Account
Peru Pacif ic Alliance*

Peru Economic Outlook - Second quarter 2018 10
Our forecasts for this year and next take account of a favourable external environment and assume a reduction in political tensions on the domestic front
On the external front, the baseline scenario for 2018 and 2019 assumes conditions that, on balance, are
favourable and in fact better than those foreseen three months ago.
We have revised our GDP growth projections for the US upwards. The increase in fiscal spending leads to
upward revision of GDP growth of 0.2 pp in 2018 and 0.3 pp in 2019, to 2.8% in both cases (see Figure 3.5). In
the euro zone, activity remains strong, although the confidence data suggest that there are signs of moderation
in industrial activity in the first quarter of 2018. Finally, in China, growth is moderating only slightly, in line with
our projections. In general, this environment with positive surprises should have a drag-along effect on Peru’s
economic activity.
Figure 3.5 World growth (change % YoY)
Source: BBVA Research
We have revised upwards the prices of the metals that Peru exports, particularly that of copper. For 2018,
for example, we are projecting the annual average price of copper to increase by just over 8% to US$3.03/lb, a
higher level than that forecast three months ago, largely due to the high levels seen in the first quarter of the
year. This average level for the year implies that in the remainder of 2018 the price of copper will fall
(moderation in China’s growth, withdrawal of monetary stimulus in more developed economies) and that at year-
end it will be just over US$2.90/lb (see Figure 3.6).
Dow n
Up
Unchanged
2018
3.82019
3.8
World
2018
2.82019
2.8
USA
2018
2.02019
2.2
Mexico
2018
1.22019
2.6
South America
2018
2.32019
1.8
Eurozone
2018
6.32019
6.0
China

Peru Economic Outlook - Second quarter 2018 11
Figure 3.6 Price of copper (US$/lb.)
Figure 3.7 Mining investment and Price of copper (change % YoY; US$¢/lb)
Source: Bloomberg and BBVA Research Source: Central Reserve Bank of Peru, MINEM (Ministry of Energy & Mines) and BBVA Research
It is worth pointing out that the recovery shown by international metal prices in the past few months has been
accompanied by a recovery in mining investment in Peru (see Figure 3.7). In this context, small- and medium-size
mining projects representing more than US$2.3 billion have become viable for 2018 and 2019. We estimate that
construction starts will have a positive economic impact in 2018 and appreciably more so from the following year
(see Table 3.1).
Table 3.1 Mining investment in new concession projects (US$ millions)
Figure 3.8 Price of oil WTI (US$/barrel)
Source: MINEM and BBVA Research Source: Bloomberg and BBVA Research
As for the price of oil (Peru is a net oil importer) our baseline scenario assumes that on average it will be around
US$61 a barrel in 2018, above the average level of last year (US$51), but unchanged from our forecast of three
months ago (see Figure 3.8). This is because we consider that the fundamentals have not changed significantly.
Although oil prices still have room to rise in the coming months, the recovery in production in the US and other non-
OPEC producing countries will subsequently bring prices down to US$60 a barrel at year-end. The forecast also
assumes that the agreement between OPEC and non-OPEC producers on production cuts will continue throughout
2.0
2.2
2.4
2.6
2.8
3.0
3.2
3.4
4Q14 3Q15 2Q16 1Q17 4Q17 3Q18 2Q19 1Q20 4Q20
Three months ago Pro jection
Projection
180
200
220
240
260
280
300
320
340
-60
-40
-20
0
20
40
60
2Q14 4Q14 2Q15 4Q15 2Q16 4Q16 2Q17 4Q17
Mining investment ( left axis) Price (¢US$/lb.)
Investment
USD Millions 2018 2019
Mina Justa 110000 TMF/Cu 1,348 236 636
Amp.Toromocho 75000 TMF/Cu 1,300 650
San Gabriel 150000 OZ/Au 450 250
Pukaqaqa 40600 TMF/Cu 706 353
Magistral 60000TMF/Cu 480 250
Total 4,284 236 2,139
Project Annual production
Year
20
40
60
80
100
4Q14 3Q15 2Q16 1Q17 4Q17 3Q18 2Q19 1Q20 4Q20
Three months ago Projection
Projection

Peru Economic Outlook - Second quarter 2018 12
the remainder of the year; admittedly there will be a review in June, but the agreement is very likely to remain in
place given the continuing increases in US production.
The US Federal Reserve will raise its monetary policy rate three more times in the remainder of this year
and twice more in 2019. This trend in the Federal Reserve rate implies a slightly bigger adjustment than the
one we foresaw three months ago and is explained by the increased fiscal expenditure which, in an economy
close to full employment, may lead to some increase in inflation. As a result of this greater adjustment, Peru’s
external borrowing terms will become somewhat more expensive.
On the domestic front, relative to our forecast of three months ago, we are assuming a context of greater political
stability, more favourable to growth, characterised by the following features:
Fewer political frictions. We assume that the first months of the new Vizcarra administration will unfold in an
atmosphere of political détente.
Accordingly we take it as a working assumption that there will be no further weakening of business confidence,
which in the remainder of this year and in 2019 will remain at similar levels to now (around 55 points in the last
three months, see Figure 3.9).
Fiscal boost from (i) reconstruction in the regions affected at the beginning of last year by El Niño Costero, (ii)
the 2019 Pan American Games (construction/refurbishment of venues, facilities and infrastructure), and (iii)
execution of major infrastructure projects (most notably the second line of the Lima Metro and the Talara
refinery). However, spending on these items this year will be less than was forecast three months ago because
we are incorporating new information published by the government and because of the delay in spending
decisions due to the change of government. We should mention that our baseline scenario assumes that the
implementing regulations for Law 30737 will be published soon, which will favour the flow of financing to the
Construction sector.
Figure 3.9 Business confidence (index, in points)
Figure 3.10 Fiscal boost (equivalent in pp of GDP growth)
Source: Central Reserve Bank of Peru and BBVA Research
(*) In the form of a PPP
Source: Ministry of Economy and Finance of Peru, Central Reserve Bank of Peru and BBVA Research
35
40
45
50
55
60
65
Feb-16 Jul-16 Dec-16 May-17 Oct-17 Mar-18
Pessimistic
Optimistic
0.0
0.2
0.4
0.6
0.8
1.0
1.2
2018 2019 2018 2019 2018 2019
Public Infrastructure Projects*
Reconstruction Pan American Games

Peru Economic Outlook - Second quarter 2018 13
In this way, the supports for growth in 2018 will be the improved external conditions and public spending (despite
the more conservative forecasts for this last-mentioned variable). For next year, GDP growth will be buttressed by
the start of work on various medium-size mining projects (see Table 3.1), which will account for about 1 pp of
growth in 2019.
In the baseline scenario described, we see GDP growing by 3.2% in 2018, less than our January forecast of 3.5%,
due mainly to the fact that we now anticipate more moderate growth in the first quarter, as explained previously.
At sector level, we estimate that in 2018 primary activities as a whole, i.e. those linked most closely to the
extraction of natural resources1, will be the most dynamic, growing by around 3.7% (see Table 3.2). Within primary
activities, the sector progressing most will be Fisheries. Here we are assuming two relatively good anchoveta
fishing seasons in the central-north coastal zone which will each yield close to 4.5 million metric tons. This will also
favour the preparation of fish-meal and oil, i.e. Primary Manufacturing. Our baseline scenario also envisages the
northern oil pipeline being operative from the beginning of the year, which will have a positive effect on oil
production (extraction will increase by about 20%), and greater growth in agricultural and livestock production once
the effects of El Niño Costero have dissipated and in an environment of more normal weather conditions.
As for non-primary activities, which are more geared to attending to domestic demand, and which together
represent more than 70% of the production of goods and services, we estimate that as a whole they will perform
better than last year. Construction will stand out, this being the activity through which the greatest amounts of
public spending are channelled. This in turn will stimulate connected activities such as those of suppliers of goods
and service providers to the Construction sector.
Table 3.2 GDP by productive sector (change % YoY)
Table 3.3 GDP on the expenditure side (change % YoY)
* Excludes import duties and taxes Source: Central Reserve Bank of Peru and BBVA Research Source: Central Reserve Bank of Peru and BBVA Research
This sector performance will be reflected on the expenditure side in greater dynamism of domestic demand
compared with last year (see Table 3.3), underpinned by the increase in public spending and private investment,
1: Agriculture and Livestock, Fisheries, Mining, Oil & Gas and Primary Manufacturing.
2017 2018 (e) 2019 (p)
Agriculture and livestock 2.6 3.5 3.4
Fishing 4.8 21.2 0.7
Mining and fuel 3.2 2.0 4.7
Metals 4.2 1.4 4.3
Fuel -2.4 5.7 7.0
Manufacturing -0.3 3.7 2.6
Primary 1.5 10.1 1.6
Non primary -0.9 1.5 3.0
Electricity and w ater 1.1 4.0 4.0
Construction 2.2 4.1 4.5
Commerce 1.0 1.8 2.2
Other Services 3.3 3.7 4.0
GDP 2.5 3.2 3.5
Primary sectors 2.9 3.7 3.9
Non primary sectors 2.2 3.1 3.6
2017 2018 (e) 2019 (p)
1. Domestic Demand 1.6 3.7 3.2
a. Private Consumption 2.5 2.7 3.0
b. Public Consumption 1.0 6.1 2.3
c. Gross Domestic Investment -0.5 5.3 4.2
Gross Fixed Investment -0.4 3.6 4.4
- Private 0.3 3.0 4.5
- Public -2.8 6.0 3.8
2. Exports 7.2 1.5 4.6
3. GDP 2.5 3.2 3.5
4. Imports 4.0 3.4 3.4
Note:
Domestic Demand (less
inventoriess)1.7 3.3 3.3
Private Expense (less
inventoriess)2.0 2.8 3.4
Public Expense (consumption
and investment)-0.1 6.1 2.7

Peru Economic Outlook - Second quarter 2018 14
especially in mining. In qualitative terms, there are thus no major changes relative to our forecast of three months
ago. We have however made adjustments within private investment. The pace of growth in mining is now greater
than we predicted in our previous report, due to the fact that we now expect prices of metals, particularly copper, to
be higher throughout the forecast period. Non-mining investment on the other hand has corrected downwards due
to deterioration in the domestic political environment at the beginning of the year.
For 2019, our forecast is at 3.5%, below the 3.8% we projected three months ago. This is because private
spending will be less dynamic (less growth in investment and consumption) in a context in which, after the high
tensions seen at the beginning of the year, there will probably be greater caution. Despite this, private sector
spending will continue to gain traction throughout 2019, especially investment in mining, with the construction of
small and medium-size projects (see Table 3.1). Public sector spending on the other hand will slow, which is
consistent with the start of the process of fiscal consolidation to which the government has pointed.
We must not lose sight of the medium term
The uncertainty associated with the increase in political noise could have implications for medium-term growth if it
translates into a lack of consensus on approving and implementing measures to boost productivity and
competitiveness. The increased degree of uncertainty also implies a less favourable environment for doing
business and accumulating capital.
Our forecasts for the period 2020-2022 assume average annual growth of 3.4%, 0.2 pp below our forecast of three
months ago. Gross fixed investment (private and public), as a percentage of GDP, will stabilise at around 22%,
below the highest levels (of approximately 27%) seen in the period of strong growth from 2002 to 2013, and also
below those recorded by economies that experienced phases of rapid growth, such as those of East Asia.

Peru Economic Outlook - Second quarter 2018 15
4. Fiscal policy: increase revenues and stabilise current spending to ensure the stability of public finances
Between 2012 and 2017 the Peruvian economy went from a fiscal surplus equivalent to rather more than 2% of
GDP to a deficit of around 3% (see Figure 4.1). The deterioration in the fiscal result was explained by the reduction
in fiscal revenues by about 5 pp of GDP (from 23% to 18%). This decline was the result of worsening terms of
trade, increased tax avoidance, and the tax measures implemented between 2012 and 20162 (see Table 4.1).
Figure 4.1 Fiscal result (% of GDP)
Table 4.1 Factors explaining the deterioration in revenues (as a percentage of GDP)
Source: Central Reserve Bank of Peru Source: Central Bank’s Report on Inflation (December 2017).
Going forward we expect the falling trend in fiscal revenues (as % of GDP) to level out and even to improve
somewhat (see Figure 4.2). This is explained by the cyclical recovery of the economy, which means that revenue
from the IGV sales tax3 will increase, and by the improved prices of metals. However, we estimate that this passive
recovery (passive in the sense of without adopting any measures) will not be enough to recover the ground lost
between 2012 and 2017 (revenues will stabilise around a level equivalent to 19% of GDP in the medium term). Nor
will it allow attainment of the fiscal consolidation plan announced by the authorities of the Kuczynski administration,
which involved taking the fiscal deficit from a projected maximum of 3.5% in 2018 to 1.0% in 2021.
2: In that period measures were implemented with a view to stimulating the economy or promoting incorporation/conversion to the formal economy. 3: Since October last year we have been observing a positive trend in the collection of the IGV sales tax (equivalent to VAT).
2.3
0.9
-0.3
-2.1
-2.6
-3.1
2012 2013 2014 2015 2016 2017
Fiscal revenues % of GDP 2012 23
Terms of trade -2.2
Greater evasion (IGV) -0.9
Tax Reforms -0.5
Tax refund -0.4
Economic Activity -0.3
Others -0.3
Fiscal revenues % of GDP 2017 18

Peru Economic Outlook - Second quarter 2018 16
In our baseline scenario we assume a more conservative (gradual) fiscal consolidation, leaving more room for
current spending while at the same time keeping to the government’s commitment to bring the fiscal accounts to a
sustainable level such that the deficit comes to 2.0% of GDP towards 2021/22 (see Figure 4.3). As a result, gross
public debt will reach 29% of GDP (close to the 30% limit established in the fiscal rule). This more gradual
reduction in the deficit assumes a passive scenario, that is to say without measures that substantially increase tax
revenues.
Figure 4.2 General Government revenues (% of GDP) Figure 4.3 Fiscal result (% of GDP)
Source: Central Reserve Bank of Peru and BBVA Research Source: Central Reserve Bank of Peru and BBVA Research
As regards public spending, we would point out that in the period 2012-2017 it held relatively steady (at around
20% of GDP, see Figure 4.4). However, we see that the composition of the government’s outflows has changed:
the current component has increased (due to a sharp increase in remuneration expenses, see Figure 4.5), while
public investment has declined. Thus current spending has displaced public investment, such that the composition
of expenditure is less efficient. These trends reveal the need to contain the increase in current spending and leave
room for investment.
Figure 4.4 General government spending (% of GDP)
Figure 4.5 Composition of current spending (% of GDP)
(1) Comprises Remuneration, Goods and Services and Transfers. (2) Gross Capital Formation and other capital expenditure. Source: Central Reserve Bank of Peru and BBVA Research
Source: Central Reserve Bank of Peru and BBVA Research
22,822,2
20,0
18,018,4
19,0 18,8
2012 2014 2016 2018 2020 2022
2,3
0,9
-0,3
-2,1
-2,6
-3,1-3,4
-3,0
-2,5
-2,0
2012 2014 2016 2018 2020
MEF
13.815.3
5.84.7
2012 2017
Current Expenditure (1) Capital expenditure (2)
5.16.1
5.7
6.0
3.1
3.3
2012 2017
Wage and salaries Goods and services Transfers

Peru Economic Outlook - Second quarter 2018 17
What can be done in the short term? On the revenue side, approval is still pending of the regulations for the anti-
tax avoidance law 4. There is also a need to rationalise the tax exemptions that cause the government to miss out
on the equivalent of 2.2% of GDP in revenues. In many cases these exemptions do not fulfil the purpose for which
they were approved (which is to encourage investment). The implementation of actions of this kind to increase tax
revenues would reduce the likelihood of having to raise the rates of certain taxes or create new ones introducing
distortions that would have a negative effect on the growth of activity in the medium term. And to contain further
increase in current spending the government must review with Congress the proposed legislation that could
substantially increase spending on remuneration and pensions. Such is the case with the incorporation of 276,000
CAS (temporary service contract) workers into the State workforce (at an annual fiscal cost equivalent to 0.4% of
GDP5) and the review of the levelling of pensions of the Police and Armed Forces (with an annual fiscal cost
equivalent to 0.2% of GDP).
In general, it will be important to start showing clear signs from this year on that efforts will be made towards fiscal
consolidation. Otherwise the Peruvian government’s credit rating could be downgraded.
4: 2012 saw the approval of the Legislative Decree amending the tax code and introducing Rule XVI for Peru to start punishing tax avoidance (a sophisticated way of
not paying taxes, but without breaking the law). The complementary rules that will allow the anti-avoidance law to become operative are currently being drawn up. The MEF is working on the regulations and the SUNAT (roughly equivalent to the Internal Revenue Service) is working on the application mechanisms. 5: The CAS (administrative service contract) regime came into existence as a temporary regime in 2008 and was supposed to be gradually replaced by the Civil Service Law (Law No. 30057) regime. The objective of this latter law is to establish a single and exclusive regime for persons providing services to State public entities.

Peru Economic Outlook - Second quarter 2018 18
5. External sector: we foresee a record trade surplus for this year
We see the balance of trade continuing to improve this year thanks to the strong increase in exports by value,
which will reach record levels of around US$48 billion (see Figure 5.1). The higher export prices and the continuing
improvement in world demand will be the two main factors favouring this performance. The former will have a
positive effect on exports of traditional products, in particular mining products, while the latter will be more relevant
for non-traditional exports. In this context Peru’s trade surplus will be around US$7 billion this year, the biggest
since 2011. The higher export prices however will also mean more profit for mining companies and consequently,
at the macroeconomic level, more repatriation of profits and dividend payments. Our balance of greater trade
surplus and greater payments of dividends and profit remittances leads us to a current account deficit that will hold
relatively steady at a level equivalent to 1.3% of GDP.
On the financial side, we estimate that this year capital inflows will increase, mainly as a result of mining companies
reinvesting profits and the increase in holdings of Peruvian bonds by foreign investors (greater supply of public
debt to finance the fiscal deficit). It is worth mentioning that inflows under both these headings will be attenuated by
higher US interest rates, in a context of continuing monetary normalisation by the Federal Reserve and increased
limits on Peruvian pension funds’ investments abroad. Moreover, we do not rule out central bank intervention in the
currency market in order to moderate excessive fluctuations in the exchange rate. On balance, we forecast a
positive balance in the financial account component of the balance of payments equivalent to 2.3% of GDP, which
would mean a dollar inflow of close to US$5.3 billion (see Figure 5.2).
Figure 5.1 Balance of trade (USD billions)
Figure 5.2 Financial account and Current account deficit (% of GDP)
Source: Central Reserve Bank of Peru and BBVA Research *Includes errors and omissions. Source: Central Reserve Bank of Peru and BBVA Research
36
47
40
4849
29
41
41
4243
2010 2011 2012 2013 2014 2015 2016 2017 2018 2019
Exports Imports
Projection
2018:USD 7billion2011:
USD 9 billion
0.0
0.5
1.0
1.5
2.0
2.5
3.0
2016 2017 2018 2019
Financial account* Current account
Projection

Peru Economic Outlook - Second quarter 2018 19
6. Domestic financial markets: resistance to episodes of stress
Peruvian financial assets posted an attractive performance in the first few months of the year, despite the loud
political noise (see Figure 3.3). The political tensions leading to the resignation of President Kuczynski, the
assumption of the presidency by then Vice-President Martín Vizcarra and the major cabinet reshuffle did not cause
any major disturbances in the financial variables. Indeed, the returns demanded on sovereign debt securities fell by
between 10 and 50 basis points relative to year-end 2017, despite a few isolated bouts of stress (see Figure 6.1).
In line with this easing trend, risk indicators declined (see Figure 6.2) and equities rallied (see Figure 6.3) following
the change of president.
Figure 6.1 Yield on Sovereign Bond 2023 (%)
Figure 6.2 Risk indicators (basis points)
Source: Bloomberg Source: Bloomberg
The national currency for its part showed similar behaviour: following the change of president it returned to 3.23
soles to the dollar, even lower than the 3.24 at which it had ended last year (see Figure 6.4). The strengthening of
the PEN so far this year has taken place in an environment not just of loud and persistent political noise, which was
reflected for example in the decline in holdings of sovereign bonds by foreign investors by an amount equivalent to
more than US$1.3 billion (see Figure 6.5), but also of increased limits on domestic private pension funds’
investments abroad (see Figure 6.6) and repatriation of profits by multinationals.
3.5
3.6
3.7
3.8
3.9
4.0
4.1
4.2
4.3
4.4
4.5
Oct-17 Nov-17 Dec-17 Jan-18 Feb-18 Mar-18 Apr-18
dec-31-17
New President
mar-22-18
60
80
100
120
140
160
180
60
65
70
75
80
85
90
95
100
105
110
Se
p-1
7
Oc
t-1
7
No
v-1
7
De
c-1
7
Ja
n-1
8
Fe
b-1
8
Ma
r-1
8CDS 5years Peru EMBI Peru (eje der.)
dec-31-17 New presidentmar-22-18

Peru Economic Outlook - Second quarter 2018 20
Figure 6.3 General Index of the Lima Stock Exchange (1 Oct. 2017 = 100)
Figure 6.4 Exchange rate (USD/PEN)
Source: Bloomberg Source: Bloomberg
In this context, net foreign reserves decreased by approximately US$2 billion, which was explained almost entirely
by banks withdrawing foreign currency deposits held with the Central Bank to attend to the transactions described
above.
Figure 6.5 Holdings of sovereign bonds by foreign investors (billions of soles and percentage of total balance of sovereign bonds)
Figure 6.6 Domestic private pension funds’ investments abroad (% of fund)
Source: MEF Source: Central Reserve Bank of Peru
For 2018 we anticipate some appreciation of the PEN, with it ending the year at between 3.20 and 3.25 to the
dollar. This will come about in an environment of dollar inflows on both the trade and the financial sides as
described in the previous section, but probably also of central bank interventions to prevent excessive fluctuations.
In 2019, as central banks of the most developed countries continue with the process of monetary normalisation
(see Figure 6.7), metal prices moderate and domestic demand gains traction (which will tend to increase imports),
the currency will come under a certain amount of pressure, which we estimate will bring the exchange rate to
between 3.25 and 3.30 at the end of the year (see Figure 6.8).
90
95
100
105
110
115
120
Oct-17 Dec-17 Feb-18 Apr-18
dec-31-17 New presidentmar-22-18
3.16
3.18
3.20
3.22
3.24
3.26
3.28
3.30
3.32
Oct-
17
No
v-1
7
De
c-1
7
Ja
n-1
8
Feb-1
8
Ma
r-1
8
Apr-
18
dec-31-17 New presidentmar-22-18
38.6
34.1
45%
39%
0%
5%
10%
15%
20%
25%
30%
35%
40%
45%
50%
0
10
20
30
40
50
Feb-17 May-17 Aug-17 Nov-17 Feb-18
billions of soles - left axis
% Sovereign bonds - right axis
42.0
43.0
46.046.5
48.0
38.8
39.7
41.4
Dic-1743.3
Mar-1845.0
Jan-17 May-17 Sep-17 Jan-18 May-18
Legal l imit Investments abroad (%)
Represents S/ 4.7 billion

Peru Economic Outlook - Second quarter 2018 21
Figure 6.7 Projected US Federal Reserve rate (%)
Figure 6.8 Exchange rate projection (USD/PEN)
Source: Bloomberg and BBVA Source: Bloomberg and BBVA Research
1.0
1.5
2.0
2.5
3.0
3.5
Nov-17 Jun-18 Jan-19 Aug-19
3,20
3,25
3,25
3,30
3,00
3,05
3,10
3,15
3,20
3,25
3,30
3,35
3,40
3,45
3,50
3,55
Dec-15 Dec-16 Dec-17 Dec-18 Dec-19

Peru Economic Outlook - Second quarter 2018 22
7. Inflation: no problems in sight
Between March 2017 and March 2018, year-on-year inflation fell significantly, from 4.0% to 0.4%, its lowest reading
since December 2009. It is currently below the Central Bank’s target range of 1% to 3%. This declining trend in
inflation was due mainly to the fall in food prices as the effects of El Niño Costero, which battered the country in the
first quarter of last year, dissipated (see Figure 7.1), and to overproduction (excess supply) of potatoes. Other
factors contributing to the decline in inflation were the absence of demand pressures on prices (given the cyclical
position of the economy as verified by the downward trend seen in the various inflation indicators) and, for much of
2017, the appreciation of the Peruvian currency. In this context, inflationary expectations have been corrected
downwards, from 3.0% to 2.2%.
We estimate that the current low level of inflation is temporary. Going forward, year-on-year inflation will tend to
move gradually towards the middle of the target range, in a context in which the rate of increase in food prices will
return to normal (it is currently at -5% YoY, whereas the monthly average for the past five years has been around
3%), which will more than offset the slower pace of YoY increase we foresee for oil prices and the downward
pressures on inflation produced by the slack in various sectors of the economy. On balance, inflation will end this
year at 2.0% and next year at 2.4% (see Figure 7.2).
Figure 7.1 Inflation: total; without food and energy; and only food and energy (change % YoY)
Figure 7.2 Inflation (change % YoY CPI)
Source: INEI (National Statistics & IT Institute) and BBVA Research Source: INEI (National Statistics & IT Institute) and BBVA Research
-1.5
0.4
2.0
-2
-1
0
1
2
3
4
5
6
nov.-15 jun.-16 ene.-17 ago.-17 mar.-18
Food and energy Tota l in flation
Ex. food and energy
Target range
0,4
2,0
2,4
0
1
2
3
4
5
Dec-14 Dec-15 Dec-16 Dec-17 Dec-18 Dec-19
Projection
BCRP target range

Peru Economic Outlook - Second quarter 2018 23
8. Monetary policy: pause in the short term
In March the Central Bank cut its monetary policy reference interest rate by 25 bps, to 2.75%. This reduction brings
the Central Bank’s total cuts since May last year to 150 bps (from 4.25% to 2.75%), which have gone hand in hand
with a significant decline in inflation (see previous section), downward correction of inflationary expectations, and
cyclical weakness of the economy. According to our estimates, the position of monetary policy has become clearly
expansive; however it is also the case that since the fourth quarter of last year monetary stimulus (measured as the
reference interest rate adjusted for inflationary expectations, from which the difference relative to the neutral level is
then taken, see Figure 8.1) has not increased much.
In any case, since our baseline scenario envisages a recovery in domestic demand, with inflation gradually moving
towards the middle of the target range (from low points), we anticipate that in the remainder of this year the
reference rate will be held at 2.75%. This view is supported by the facts that: the various measurements of
inflationary trends, and inflationary expectations themselves, are at around 2% (middle of the target range);
headline inflation is below the target range, but only temporarily (because of the high base for comparison YoY due
to the Niño Costero at the beginning of 2017); all economic activities that may be affected by monetary policy (non-
primary GDP) continue to recover gradually and are currently growing at somewhat more than 3% YoY; the political
noise has abated; it seems that the implementing regulations of the law replacing DU-003 will soon be published
(which will help unblock activity in the Construction sector); and the position of monetary policy right now is rather
expansive (the ex ante real interest rate is around 0.6%, while the neutral rate is around 1.5% according to our
estimates).
Figure 8.1 Real interest rate* and Position of monetary policy** (% and pp respectively)
Figure 8.2 Reference interest rate (%)
*Ex ante (with inflationary expectations at one year) **Difference between the real rate and the neutral rate. Source: Central Reserve Bank of Peru and BBVA Research
Source: Central Reserve Bank of Peru and BBVA Research
-1.2
-0.6
0.0
0.6
1.2
1.8
Jan-16 Sep-16 May-17 Jan-18
Monetary policy position Real interest rate
Contractive
Expansive
3,00
2,75
3,25
2,0
2,5
3,0
3,5
4,0
4,5
5,0
Dec-13 Dec-14 Dec-15 Dec-16 Dec-17 Dec-18 Dec-19
Projection

Peru Economic Outlook - Second quarter 2018 24
9. Risks to our growth forecasts for 2018 and 2019, balanced
Among the main external risk factors that could cause growth to deviate from our forecasts, we would highlight the
following:
A surprise increase in aggressiveness of the US Federal Reserve’s monetary policy adjustment, due to an
acceleration of inflation. In this scenario we would have a stronger dollar, increases in the global interest rates
relevant to Peru, lower copper prices and less global growth. We consider that this risk factor introduces a
limited downside bias to the growth forecasts for the Peruvian economy and that its probability of occurrence is
medium-low.
A more pronounced slowdown in China’s economy, introducing a medium-impact downward bias to GDP
growth forecasts for Peru. Bearing in mind the resilience shown by China’s economy so far, we see the
probability of occurrence of this scenario as low.
A roll-out of protectionist measures by the Trump administration, with possible retaliation by countries affected.
In this context, we would have a trade war, which would reduce the exchange of goods and services globally,
and which among other things would slow world economic activity, and with it the positive drag-along effect it
has on Peru.
On the domestic front, the risk factors that could cause growth to deviate from our forecasts are:
Greater political détente, which would allow consensus to be reached on certain measures to boost growth
(upward bias). We would point out that in general the new government has been well received by all political
sectors. Also, following the fierce clashes over the issue of impeachment, which damaged the approval ratings
of practically all parties, we believe there is no lack of incentive to reduce the political noise. We assign a
medium probability of occurrence to this scenario, which if it did materialise would have a strong impact.
With the same tone as the previous factor, an upside risk to growth in 2018, but above all in 2019, is that of the
operator of the Quellaveco copper project deciding soon (end of the first half of the year) to start construction of
the mine. This construction involves investment of around US$5 billion.
A slower return to normal by the Construction sector due to delays in the implementing regulations of Law
30737. This is a downside risk to our growth forecasts. We consider that the probability of occurrence of this risk
is low, but if it did materialise it would have a medium impact.
We consider that these risk factors are balanced, so in the baseline scenario our growth forecasts do not present
any bias.

Peru Economic Outlook - Second quarter 2018 25
10. Tables
Table 10.1 Macroeconomic forecasts
2015 2016 2017 2018 2019
GDP (change % YoY) 3.3 4.0 2.5 3.2 3.5
Domestic demand (change % YoY) 2.9 1.1 1.6 3.7 3.2
Private consumption (change % YoY) 4.0 3.3 2.5 2.7 3.0
Public consumption (change % YoY) 9.8 -0.5 1.0 6.1 2.3
Gross fixed investment (change % YoY) -5.2 -4.6 -0.4 3.6 4.4
Inflation (YoY, %, EOP) 4.4 3.2 1.4 2.0 2.4
Exchange rate (vs. USD, EOP) 3.39 3.40 3.25 3.20 – 3.25 3.25 – 3.30
Policy interest rate (%, EOP) 3.75 4.25 3.25 2.75 3.25
Fiscal balance (% of GDP) -2.1 -2.6 -3.1 -3.4 -3.0
Current account (% of GDP) -4.8 -2.7 -1.3 -1.3 -1.8
Balance of Trade (USD billions) -2.9 1.9 6.3 6.6 5.9
Forecast closing date: 12 April 2018. Source: Central Reserve Bank of Peru and BBVA Research Peru
Table 10.2 Quarterly macroeconomic forecasts
GDP (change % YoY)
Inflation (YoY, %, EOP)
Exchange rate (vs. USD, EOP)
Policy interest rate (%, EOP)
Q1 16 4.6 4.3 3.41 4.25
Q2 16 3.9 3.3 3.32 4.25
Q3 16 4.7 3.1 3.38 4.25
Q4 16 3.1 3.2 3.40 4.25
Q1 17 2.3 4.0 3.27 4.25
Q2 17 2.6 2.7 3.27 4.00
Q3 17 2.9 2.9 3.25 3.50
Q4 17 2.2 1.4 3.25 3.25
Q1 18 3.2 0.4 3.25 2.75
Q2 18 3.9 1.6 3.23 2.75
Q3 18 2.1 1.2 3.23 2.75
Q4 18 3.5 2.0 3.23 2.75
Q1 19 4.6 2.0 3.24 2.75
Q2 19 3.3 2.1 3.25 3.00
Q3 19 3.1 2.2 3.25 3.00
Q4 19 3.3 2.4 3.26 3.25
Forecast closing date: 12 April 2018. Source: Central Reserve Bank of Peru and BBVA Research Peru

Peru Economic Outlook - Second quarter 2018 26
DISCLAIMER
This document, prepared by BBVA Research Department, is informative in nature and contains data, opinions or
estimates as at the date of its publication. These derive from the department’s own research or are based on
sources believed to be reliable, and have not been independently verified by BBVA. BBVA therefore makes no
guarantee, either express or implied, as to the document's accuracy, completeness or correctness.
Any estimates contained in this document have been made in accordance with generally accepted methods and
are to be taken as such, i.e. as forecasts or projections. Historical trends in economic variables (positive or
negative) are no guarantee that they will move in the same way in the future.
The contents of this document are subject to change without prior notice, depending on (for example) the economic
context or market fluctuations. BBVA does not give any undertaking to update any of the content or communicate
such changes.
BBVA assumes no liability for any loss, direct or indirect, that may result from the use of this document or its
contents.
Neither this document nor its contents constitute an offer, invitation or solicitation to acquire, disinvest or obtain any
interest in assets or financial instruments, nor can they form the basis of any contract, undertaking or decision of
any kind.
In particular as regards investment in financial assets that could be related to the economic variables referred to in
this document, readers should note that in no case should investment decisions be made based on the contents of
this document; and that any persons or entities who may potentially offer them investment products are legally
obliged to provide all the information they need to take such decisions.
The contents of this document are protected by intellectual property law. The reproduction, processing, distribution,
public dissemination, making available, taking of excerpts, reuse, forwarding or use of the document in any way
and by any means or process is expressly prohibited, except where this is legally permitted or expressly authorised
by BBVA.

CONTACT DETAILS: Av. República de Panamá 3055, San Isidro, Lima 27, Peru. Tel: + 51 [email protected] www.bbvaresearch.com
This report has been produced by Peru Unit
Chief Economist Peru Hugo Perea [email protected] Francisco Grippa [email protected]
Yalina Crispín [email protected]
Vanessa Belapatiño vanessa.belapatiñ[email protected]
Ismael Mendoza [email protected]
Marlon Broncano [email protected]
BBVA Research
Group Chief Economist Jorge Sicilia Serrano
Macroeconomic Analysis Rafael Doménech [email protected]
Digital Economy Alejandro Neut [email protected]
Global Macroeconomic Scenarios Miguel Jiménez [email protected]
Global Financial Markets Sonsoles Castillo [email protected]
Long term Global Modelling and Analysis Julián Cubero [email protected]
Innovation and Processes Oscar de las Peñas [email protected]
Financial Systems and Regulation Santiago Fernández de Lis [email protected]
Digital Regulation and Trends Álvaro Martín [email protected]
Regulation Ana Rubio [email protected]
Financial Systems Olga Cerqueira [email protected]
Spain and Portugal Miguel Cardoso [email protected]
United States Nathaniel Karp [email protected]
Mexico Carlos Serrano [email protected]
Middle East, Asia and Big Data Álvaro Ortiz [email protected]
Turkey Álvaro Ortiz [email protected]
Asia Le Xia [email protected]
South America Juan Manuel Ruiz [email protected]
Argentina Gloria Sorensen [email protected]
Chile Jorge Selaive [email protected]
Colombia Juana Téllez [email protected]
Peru Hugo Perea [email protected]
Venezuela Julio Pineda [email protected]