pesticide user habits: public purchasing, use, … user habits: public purchasing, use, storage and...
TRANSCRIPT

Pesticide user habits: public purchasing, use, storage and disposal of pesticides

Pesticide user habits: public purchasing, use, storage and disposal of pesticides
Prepared for Pesticide Safety Directorate / Defra
Defra Project ref: PS2012
RF project no: 174
August 2007
Resource Futures
74 Kirkgate
Leeds
LS2 7DJ
www.resourcefutures.co.uk

Document details/quality control sheet RF 174
Report prepared for:
Karen Trott Consumer Safety and European Policy Pesticides Safety Directorate Room 308 Mallard House Kings Pool, 3 Peasholme Green York YO1 7PX Tel.: 01904 455750 Email: [email protected]
Report prepared by:
David Luckin Senior Consultant Resource Futures 74 Kirkgate Leeds LS2 7DJ Tel: 0113 200 3965 E-mail: [email protected]
Report checked by:
Ashley Robb Resource Futures Signed:
File name: Pesticide User Habits Version: FINAL Status: confidential Date: 13 August 2007

Contents
1. Introduction.......................................................................................................................1 2. Background ......................................................................................................................1 3. Objectives.........................................................................................................................2 4. Methods ...........................................................................................................................2
4.1 Questionnaire development .........................................................................................2 4.2 Survey locations ..........................................................................................................3 4.3 Survey implementation.................................................................................................3
5. Findings............................................................................................................................4 5.1 Respondent characteristics ..........................................................................................4 5.2 Purchasing habits ........................................................................................................7 5.3 Use of products............................................................................................................9
5.3.1 Product instructions..................................................................................................9 5.3.2 Other sources of information ..................................................................................12 5.3.3 Ready-to-use and concentrated products ...............................................................13
5.4 Storage......................................................................................................................17 5.5 Disposal.....................................................................................................................18 5.6 Cross-tabulation.........................................................................................................21
5.6.1 Location .................................................................................................................21 5.7 Age bracket ...............................................................................................................26 5.8 Attitudes to gardening ................................................................................................28 5.9 Product disposal ........................................................................................................33
6. Summary and discussion ................................................................................................37 Appendix 1: Questionnaire ........................................................................................................40 Appendix 2: Briefing sheet for User Habits Questionnaire ..........................................................46
Pesticide user habits: public purchasing, use, storage and disposal of pesticides August 2007 DRAFT
1
1. Introduction
This report summarises a research project on pesticide user habits that was undertaken by Resource Futures on behalf of the Pesticide Safety Directorate (PSD), following identification of a need for research on the issues investigated by members of the Amateur Action Plan Implementation Group. The project comprised a survey exploring the purchasing, use, storage and disposal of garden chemicals by members of the public.
This report contains the following sections:
• background information on the context for the survey and the work being undertaken by the Amateur Use Action Plan Implementation Group (AUAPIG)
• a summary of project objectives
• a summary of methods
• discussion of survey findings and reliability
• possible future work that could be undertaken to support the ongoing work of AUAPIG.
2. Background
Pesticides are widely used by members of the public, with around 6-7 million people using products to protect plants in their gardens. The total quantity of plant protection products used by the public, while still small in relation to farm use, represents about 16% of the total amount used in the UK. Also, while products licensed for domestic use are much lower risk than professional products, their use by large numbers of untrained individuals raises potential health and safety and environmental concerns. For example, pesticides continue to reach rivers and streams in the UK at levels over the prescribed standards.
The European Commission has recently published proposals for a Directive for the Sustainable Use of Pesticides, including a range of measures designed to reduce the risk pesticides can pose both to the public and environment, eg ensuring that the public only have access to products specifically authorized for non-professional use; requiring distributors to give advice promoting sustainable use (hazard, risk, safe storage, handling, application and disposal); special measures to avoid dangerous handling of pesticides. It is likely that this Directive will require member states to ensure that any legislation helps to minimise use whilst enabling safe use, storage and disposal of pesticides in the amateur sector.
PSD is working with other stakeholders through AUAPIG to encourage best practice in use and storage, and to ensure the safe disposal of unused products and empty containers. One of the objectives of the group is to identify key research and information needs; a need to expand the knowledge base regarding public purchasing, use, storage and disposal of pesticides has been identified. On this basis, PSD requested that Resource Futures develop proposals for a survey of pesticide user habits.

Pesticide user habits: public purchasing, use, storage and disposal of pesticides August 2007
2
3. Objectives
The project will contribute to the knowledge base for continuing research and communications on amateur pesticide use by providing robust information on the purchasing, use, storage and disposal of pesticides by domestic gardeners in the UK. The project will, for example, identify the extent of potentially unsafe or environmentally damaging pesticide user habits.
Project outputs will be used by the Pesticide Safety Directorate and other stakeholders (including the British Retail Consortium, Crop Protection Association, Garden Organic, the Horticultural Trades Association, the National Society of Allotment and Leisure Gardeners, Pesticide Action Network UK and the Royal Horticultural Society) to inform work being undertaken by the AUAPIG, with particular reference to:
• the development of resources for communicating with the public about appropriate purchasing, use, storage and disposal of pesticide products
• the development of indicators of the adoption of behaviours by pesticide users of practices which help minimise risk to the environment.
The specific objectives of the project are:
• to develop a questionnaire in consultation with members of AUAPIG, in order to ensure that the concerns of all stakeholders are addressed
• to implement the survey in six garden centre locations across the UK
• to analyse and report on the findings, including attendance at an AUAPIG meeting to discuss implications.
4. Methods
4.1 Questionnaire development The questionnaire was developed through submission of a draft document to AUAPIG for discussion at a meeting in February 2007. A representative of Resource Futures attended this meeting and a revised draft was developed taking into account comments made during the course of the meeting. The revised draft was circulated to AUAPIG members by PSD in March 2007 and finalised by Resource Futures in consultation with PSD in early April 2007.
The subjects covered in the questionnaire include:
• respondents’ attitudes to gardening
• age bracket
• different types and numbers of pesticides purchased
• main location(s) of purchases
• reading of instructions and other channels through which information on pesticide use is accessed
• type of product used (ready-to-use or concentrated)
• location and duration of storage
• disposal of empty pesticide containers and pesticides.
Survey respondents were offered an incentive of entry to a prize draw for garden centre vouchers, which were provided by the Horticultural Trades Association (HTA).

Pesticide user habits: public purchasing, use, storage and disposal of pesticides August 2007
3
Survey respondents were also asked if they would be willing to take part in potential focus group research at a later date and contact details were separately recorded for all those who said that they would be happy to be contacted.
A copy of the questionnaire is provided in Appendix 1.
4.2 Survey locations AUAPIG members indicated that it was important to choose survey locations in order to reflect the different climatic conditions in different regions of the UK, as these can have a significant impact on the types of product which are used by gardeners.
Contacts for a number of garden centres around the UK were provided by the HTA. Resource Futures liaised with centre and/or company managers in order to secure agreement for surveys to be carried out in the relevant centres. The garden centres at which the survey was carried out, and the regions in which these centres are located, are listed in Table 4.1.
Resource Futures would like to thank all garden centre managers and staff for their generous support for this survey.
Table 4.1: Survey locations
Location Company Region
Milngavie, Glasgow Dobbies Garden World Scotland
Newport Hurrans Wales
Oxford Notcutts South East
Preston Dobbies Garden World North West
Tunbridge Wells Notcutts South East
Woodbridge, Ipswich Notcutts East of England
4.3 Survey implementation The work was undertaken by fully trained and experienced staff who are familiar with carrying out survey work in a retail environment. This element of the project was carried out by PH Research Services, as specified in the proposal to Defra.
Staff were briefed on the survey, and on key background facts relating to pesticides and their use, using a briefing sheet developed by PSD (see Appendix 2).
The survey was carried out at all centres from Wednesday 16 May to Sunday 20 May, with one member of staff in place Wednesday to Friday and two members of staff in place on the weekend days in order to take advantage of the periods with the highest footfall. The survey was carried out in six-hour shifts at all locations between 10am and 4pm, with modification of working hours on Sunday as required to fit in with store opening hours.
Questionnaires were only undertaken with garden centre shoppers who confirmed that they used pesticides in their gardens. Respondents were prompted with examples of relevant products if required (see Appendix 1 for the questionnaire). A total of 1,052 responses were obtained.
Data was inputted by PH Research staff and subject to minimum 10% validation.
Pesticide user habits: public purchasing, use, storage and disposal of pesticides August 2007
4
5. Findings
This section details responses to the survey, focusing on:
• respondent characteristics, including attitudes to gardening, location of gardening and age bracket
• purchasing habits, including product types and numbers purchased and usual location of purchase
• use of products, including use of concentrated products that need diluting and ready-to-use products; perception and reading of instructions for use; and details of concentrated product use such as measuring amount required
• storage of products including location and duration of storage
• disposal routes for empty pesticide containers and, where relevant, unused or unwanted substances themselves.
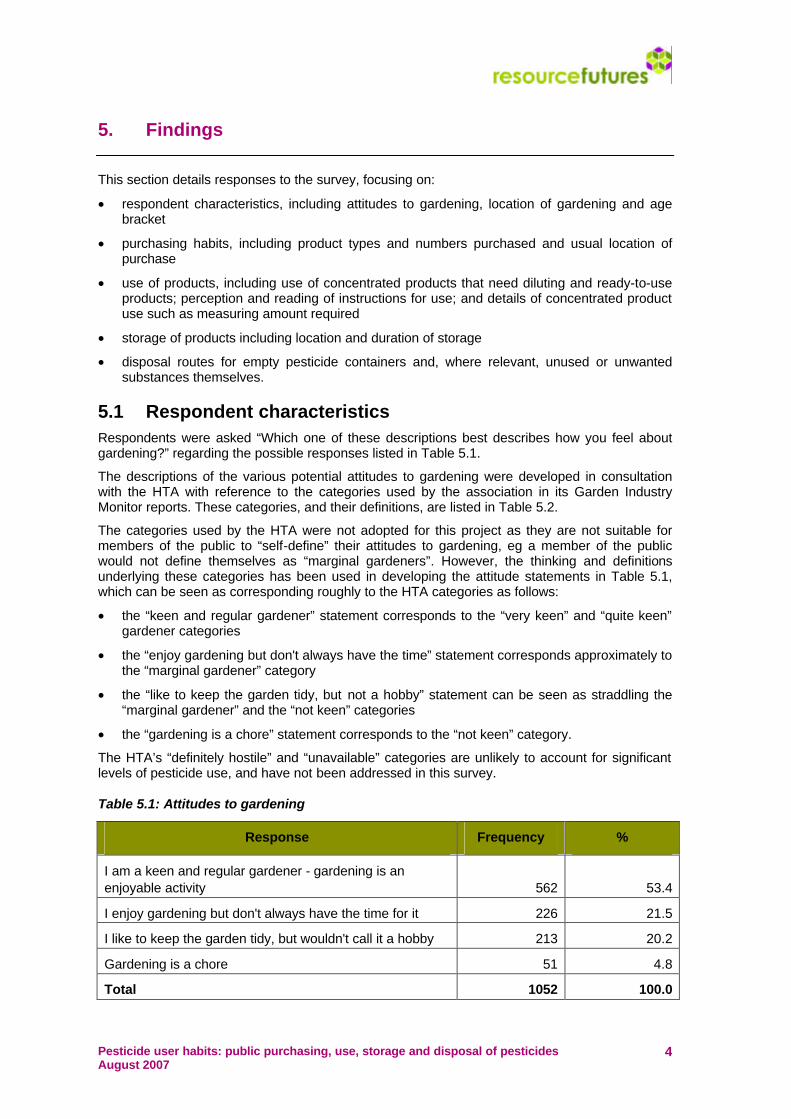
5.1 Respondent characteristics Respondents were asked “Which one of these descriptions best describes how you feel about gardening?” regarding the possible responses listed in Table 5.1.
The descriptions of the various potential attitudes to gardening were developed in consultation with the HTA with reference to the categories used by the association in its Garden Industry Monitor reports. These categories, and their definitions, are listed in Table 5.2.
The categories used by the HTA were not adopted for this project as they are not suitable for members of the public to “self-define” their attitudes to gardening, eg a member of the public would not define themselves as “marginal gardeners”. However, the thinking and definitions underlying these categories has been used in developing the attitude statements in Table 5.1, which can be seen as corresponding roughly to the HTA categories as follows:
• the “keen and regular gardener” statement corresponds to the “very keen” and “quite keen” gardener categories
• the “enjoy gardening but don't always have the time” statement corresponds approximately to the “marginal gardener” category
• the “like to keep the garden tidy, but not a hobby” statement can be seen as straddling the “marginal gardener” and the “not keen” categories
• the “gardening is a chore” statement corresponds to the “not keen” category.
The HTA’s “definitely hostile” and “unavailable” categories are unlikely to account for significant levels of pesticide use, and have not been addressed in this survey.
Table 5.1: Attitudes to gardening
Response Frequency %
I am a keen and regular gardener - gardening is an enjoyable activity 562 53.4
I enjoy gardening but don't always have the time for it 226 21.5
I like to keep the garden tidy, but wouldn't call it a hobby 213 20.2
Gardening is a chore 51 4.8
Total 1052 100.0

Pesticide user habits: public purchasing, use, storage and disposal of pesticides August 2007
5
Table 5.2: HTA Garden Industry Monitor categories
Category of Gardener
Description Proportion of the Great Britain
population (%)
Very keen gardeners
Those who positively enjoy gardening are interested and knowledgeable and spend time pursuing what is really an established hobby.
18
Quite keen gardeners
Those who claim to be quite interested and who make a positive claim about enjoyment. Although they actively work in their own gardens, they do not express a desire to increase the amount of gardening that they currently do.
16
Marginal gardeners
Those who do some gardening, are not hostile to gardening and express a willingness to do more.
30
Not keen gardeners
Those who do some gardening, but do not wish to do more, coupled with negative attitudinal responses indicating that the gardening undertaken is not because it interests them. Largely those who see gardening as a chore.
21
Definitely hostile
Those with a place to grow outdoor plants who do very little or no gardening and who have totally negative attitudes to, or interest and enjoyment in gardening, with low knowledge and absolutely no wish to do more.
14
Unavailable This group does not lack interest in gardening nor do they lack knowledge. However, they do little or no gardening, possibly due to insurmountable obstacles such as health or domestic responsibilities.
2
Source: Horticultural Trades Association
The survey findings regarding attitudes to gardening indicate that the majority of respondents (53.4%) regard themselves as “keen and regular” gardeners, as illustrated in Figure 5.1. This is considerably higher than the overall proportion of the population that would define themselves in such a way, with the HTA data indicating that around 34% of people are classed in equivalent categories in the general population. As might be expected, keen gardeners are well-represented in a survey that was undertaken in garden centres.
Figure 5.1: Attitudes to gardening
53.4%
21.5%
20.2%
4.8%
Keen and regular gardener
Enjoy gardening - don't alwayshave time
Keep the garden tidy - not ahobby
Gardening is a chore
Similar proportions of respondents stated that they “enjoy gardening but don't always have the time” (21.5%) and “like to keep the garden tidy, but wouldn't call it a hobby” (20.2%). Only one in 20 respondents (4.8%) stated that “gardening is a chore”. The combined total for these
Pesticide user habits: public purchasing, use, storage and disposal of pesticides August 2007
6
responses (46.5%) is similar to the combined proportion of the overall population that are defined as either “marginal” or “not keen” gardeners in the HTA figures (51%).
Respondents were asked where they did their gardening, with more than one response possible. A total of 1,113 responses were recorded, as shown in table 5.3, with 1,044 of the 1,051 people answering this question gardening at home. Forty respondents had an allotment and 29 people mentioned “other” locations including other people’s gardens.
Table 5.3: Home and allotment gardening
Frequency %
Garden at home 1044 99.3
Allotment 40 3.8
Other 29 2.8 Notes: n = 1,051; multi-response question; total responses = 1,113
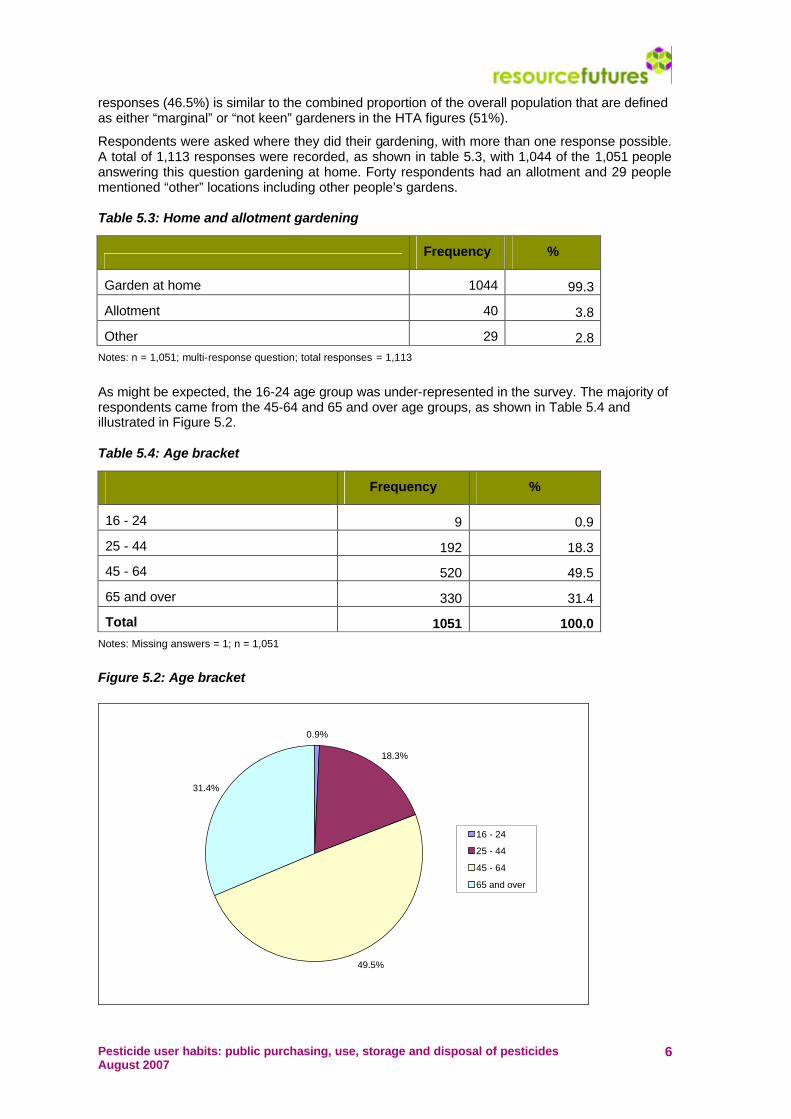
As might be expected, the 16-24 age group was under-represented in the survey. The majority of respondents came from the 45-64 and 65 and over age groups, as shown in Table 5.4 and illustrated in Figure 5.2.
Table 5.4: Age bracket
Frequency %
16 - 24 9 0.9
25 - 44 192 18.3
45 - 64 520 49.5
65 and over 330 31.4
Total 1051 100.0 Notes: Missing answers = 1; n = 1,051
Figure 5.2: Age bracket
0.9%
18.3%
49.5%
31.4%
16 - 24
25 - 44
45 - 64
65 and over

Pesticide user habits: public purchasing, use, storage and disposal of pesticides August 2007
7
5.2 Purchasing habits Survey respondents were asked what type of pesticides they use, with more than one response possible. As shown in Table 5.5 and Figure 5.3, the most frequently purchased products were slug pellets (66.8% of respondents), weedkillers (50.1%) and lawn treatments (45%).
A total of 3,065 responses were provided, indicating that an average of three product types was used by each respondent.
Table 5.5: Product types used
Frequency %
Animal repellents, e.g. cat/dog 79 7.5
Fly spays and ant powder 389 37.0
Fungicide sprays 155 14.7
Insecticides 239 22.7
Lawn treatments 473 45.0
Patio cleaners 188 17.9
Products for algae and snail control in ponds 46 4.4
Rat and mouse killers 109 10.4
Rooting powder/gel/hormone 134 12.7
Slug pellets 703 66.8
Weedkillers 527 50.1
Other 23 2.2
Notes: Multi-response question; n = 1,052; total responses 3,065
Figure 5.3: Product types used
0
10
20
30
40
50
60
70
80
Animal
repelle
nts
Fly sp
ays a
nd an
t pow
der
Fung
icide s
prays
Insec
ticide
s
Lawn t
reatm
ents
Patio cle
aners
Algae a
nd sn
ail co
ntrol
Rat an
d mou
se kil
lers
Rooting
powde
r/gel/h
ormon
e
Slug pe
llets
Wee
dkille
rsOthe
r
% o
f res
pond
ents

Pesticide user habits: public purchasing, use, storage and disposal of pesticides August 2007
8
Survey respondents were asked how many pesticide products they purchased on average each year. As Table 5.6 shows, the majority of respondents purchased either one (32%) or two (26.6%) products each year. Around one in ten people purchased an average of less than one product per year, while a total of 16.3% of respondents purchased 4 or more products each year.
Table 5.6: Average numbers of products purchased per year
Frequency %
Less than 1 116 11.0
1 336 32.0
2 279 26.6
3 148 14.1
4 68 6.5
5 45 4.3
6 or more 58 5.5
Total 1050 100.0
Notes: Missing answers 2; n = 1050
Figure 5.4: Average numbers of products purchased per year
11.0%
32.0%
26.6%
14.1%
6.5%
4.3%5.5%
Less than 1123456 or more
Respondents were asked where they “usually” bought their pesticide products from, with more than one response allowed. The most frequent answer was garden centres (81.4%). A total of 1,510 responses were provided. However, despite the survey being undertaken in garden centres, this was not the usual place of purchase for all respondents, and considerable proportions also indicated DIY stores and supermarkets.
Only a small proportion of gardeners indicated that they obtained their pesticides through a gardening club or allotment society. Of the 50 respondents who indicated “other” purchase locations, 19 usually bought their pesticides at Wilkinsons, the household goods and hardware chain.

Pesticide user habits: public purchasing, use, storage and disposal of pesticides August 2007
9
Table 5.7: Main purchase locations
Frequency %
Garden centre 856 81.4
DIY store 409 38.9
Supermarket 179 17.0
Gardening club or allotment society 14 1.3
Other 50 4.8
Notes: Missing answers 2; n = 1050; multi-response question; total responses 1,510
Figure 5.5: Main purchase locations
0
10
20
30
40
50
60
70
80
90
Garden centre DIY store Supermarket Gardening club orallotment society
Other
% o
f res
pond
ents
5.3 Use of products
5.3.1 Product instructions
In this section of the questionnaire, respondents were asked a series of questions regarding instructions for use on products:
• When do you read the instructions for use on pesticides?
• Do you generally find that instructions for use on pesticides are clear?
• Do you follow the instructions for use on pesticides?
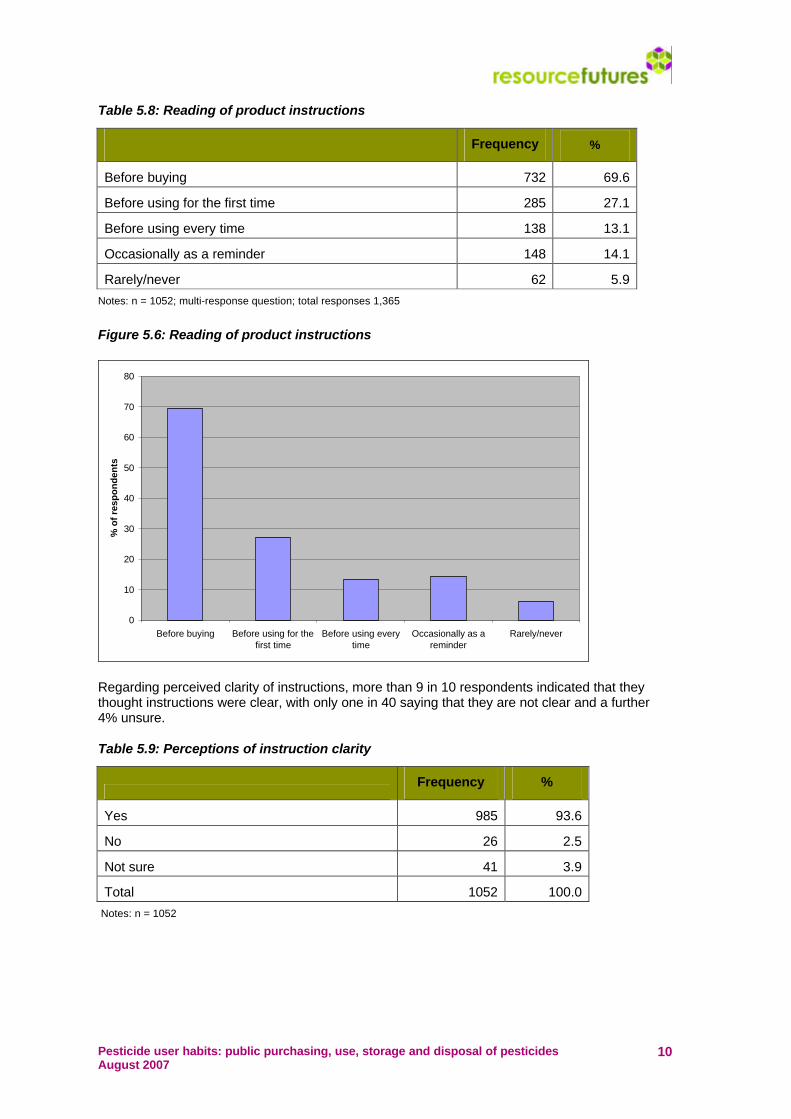
Regarding reading of instructions, a range of options were provided and more than one response was allowed, to reflect the fact that gardeners may, for example, read instructions before buying and before using for the first time. The total number of responses was 1,365.
As Table 5.8 and Figure 5.6 show, the most frequent response was “before buying” with 69.6%, although this result does indicate that 3 in 10 people do not read product instructions before purchase.
More than a quarter of respondents read instructions before using pesticides for the first time, but only around one in eight (13.1%) claimed to read them before each use.
Pesticide user habits: public purchasing, use, storage and disposal of pesticides August 2007
10
Table 5.8: Reading of product instructions
Frequency %
Before buying 732 69.6
Before using for the first time 285 27.1
Before using every time 138 13.1
Occasionally as a reminder 148 14.1
Rarely/never 62 5.9
Notes: n = 1052; multi-response question; total responses 1,365
Figure 5.6: Reading of product instructions
0
10
20
30
40
50
60
70
80
Before buying Before using for thefirst time
Before using everytime
Occasionally as areminder
Rarely/never
% o
f re
spo
nd
ents
Regarding perceived clarity of instructions, more than 9 in 10 respondents indicated that they thought instructions were clear, with only one in 40 saying that they are not clear and a further 4% unsure.
Table 5.9: Perceptions of instruction clarity
Frequency %
Yes 985 93.6
No 26 2.5
Not sure 41 3.9
Total 1052 100.0
Notes: n = 1052

Pesticide user habits: public purchasing, use, storage and disposal of pesticides August 2007
11
Figure 5.7: Perceptions of instruction clarity
93.6%
2.5% 3.9%
YesNoNot sure
As shown in Table 5.10 and Figure 5.8, more than 9 in 10 respondents also stated that they followed product instructions. However, a small minority (one in fifty) stated that they did not follow instructions, and one in 20 respondents indicated that they did so only sometimes.
Table 5.10: Following product instructions
Frequency %
Yes 969 92.3 No 22 2.1 Sometimes 59 5.6 Total 1050 100.0
Notes: Missing answers 2; n = 1050
Figure 5.8: Following product instructions
92.3%
2.1%5.6%
YesNoSometimes

Pesticide user habits: public purchasing, use, storage and disposal of pesticides August 2007
12
5.3.2 Other sources of information Gardeners were also asked what other sources of information they used to obtain information about appropriate use of pesticides. A total of 690 responses were provided by 484 respondents for this question. As Table 5.11 and Figure 5.9 show, the most frequently cited sources of information were garden centre staff (13.8%) and magazines (13.2%). Approximately 7% of respondents cited TV programmes, websites and other gardeners.
Table 5.11: Other sources of information
Frequency %
Books 56 5.3
Garden centre staff 145 13.8
Gardening advice helpline 3 0.3
Leaflets 19 1.8
Magazines 139 13.2
Other gardeners 72 6.8
Product company helpline 2 0.2
Radio 21 2.0
TV 80 7.6
Websites 79 7.5
Other 74 7.0
None 568 54.0
Notes: n = 1052; total 690 responses excluding “none”
Figure 5.9: Other sources of information
0
2
4
6
8
10
12
14
16
Book
s
Garden
centr
e staf
f
Garden
ing ad
vice h
elpline Le
aflets
Magaz
ines
Other g
arden
ers
Produ
ct com
pany
helpli
ne Radio TV
Web
sites
Other
% o
f res
pond
ents

Pesticide user habits: public purchasing, use, storage and disposal of pesticides August 2007
13
Respondents were also asked to indicate which specific TV programmes, books etc. they used to find information. The most frequent responses within the most frequently cited categories are listed in Table 5.12 where relevant. The sources are dominated by 2 organisations – the BBC and the RHS – across different media, with the Google search engine being the most frequently cited “source” through which information could be found on the internet.
The staff of the garden centres where the survey was undertaken were all cited as sources of information by a considerable number of respondents.
Table 5.12: Specific sources of information
Category Total in
category Specific responses Frequency
Magazines 139 BBC Gardeners’ World
RHS The Garden
29
9
TV 80 Gardeners’ World 21
Websites 79 Google
BBC
Royal Horticultural Society
16
9
6
5.3.3 Ready-to-use and concentrated products Table 5.13 and Figure 5.10 show the numbers of people that used either ready-to-use products or concentrated products that need diluting before use, or both. Nearly half of respondents used ready-to-use products only, with 80% using these products in total. Only one in five gardeners used concentrated products only, with over half using these products in total.
Table 5.13: Ready-to-use and concentrated products
Frequency %
Ready-to-use only 491 46.7
Need diluting only 210 20.0
Both 350 33.3
Total 1051 100.0
Notes: missing answers 1; n = 1,051
All 560 respondents who did use products that need diluting before use were asked a series of questions regarding their use of these products:
• How do you measure amounts of product when diluting?
• Do you ever save products that you have mixed up?
• Do you rinse out pesticides containers before disposing of the empty container?
• If yes, what do you do with rinsings?
Table 5.14 and Figure 5.11 summarise methods of measurement used, with around one in 10 indicating that they estimate or guess the amounts of product required.

Pesticide user habits: public purchasing, use, storage and disposal of pesticides August 2007
14
Figure 5.10: Ready-to-use and concentrated products
46.7%
20.0%
33.3%
Ready-to-use onlyNeed diluting onlyBoth
Table 5.14: Measurement methods
Frequency %
Measuring device/cap provided with product 507 90.5
Estimate or guess 57 10.2
Other 12 2.1
Notes: n = 560; multi-response question; total responses 576
Figure 5.11: Measurement methods
0
10
20
30
40
50
60
70
80
90
100
Measuring device/capprovided with product
Estimate or guess Other
% o
f res
pons
es

Pesticide user habits: public purchasing, use, storage and disposal of pesticides August 2007
15
Nearly a quarter of gardeners using products that require dilution stated that they would sometimes store these products after diluting, as shown in Table 5.15 and Figure 5.12.
Table 5.15: Storage of products after dilution
Frequency %
Yes 132 23.7
No 424 76.3
Total 556 100.0
Notes: Missing answers = 4
Figure 5.12: Storage of products after dilution
23.7%
76.3%
YesNo
As Table 5.16 and Figure 5.13 show, nearly 60% of gardeners using concentrated products rinsed the containers before disposal.
Table 5.16: Rinsing of empty containers
Frequency %
Yes 333 59.7
No 225 40.3
Total 558 100.0
Notes: Missing answers = 2
Of the 333 gardeners rinsing out containers, half disposed of rinsings by putting them down the drain, with a further 6.6% using the sink. A quarter of respondents put rinsings onto waste ground, while 8.1% added rinsings to the dilute product.

Pesticide user habits: public purchasing, use, storage and disposal of pesticides August 2007
16
Figure 5.13: Rinsing of empty containers
59.7%
40.3%
YesNo
Table 5.17: Disposal of rinsings
Frequency %
Drain 167 50.2
Sink 22 6.6
Toilet 3 0.9
Put onto waste ground 80 24.0
Add to dilute product 27 8.1
On/in the garden 23 6.9
Other 28 8.4
Notes: n = 333; multi-response question; total responses 350
Figure 5.14: Disposal of rinsings
0
10
20
30
40
50
60
Drain Sink Toilet Put ontowaste ground
Add to diluteproduct
On/in thegarden
Other
% o
f res
pons
es
Pesticide user habits: public purchasing, use, storage and disposal of pesticides August 2007
17
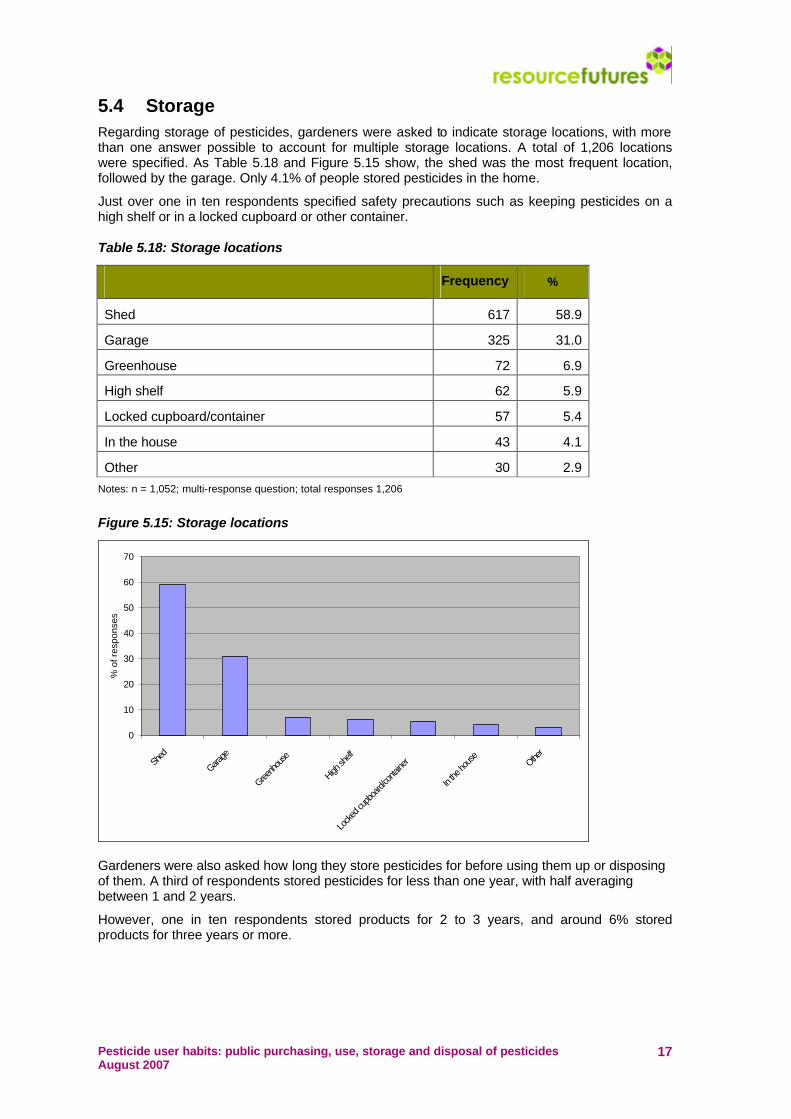
5.4 Storage Regarding storage of pesticides, gardeners were asked to indicate storage locations, with more than one answer possible to account for multiple storage locations. A total of 1,206 locations were specified. As Table 5.18 and Figure 5.15 show, the shed was the most frequent location, followed by the garage. Only 4.1% of people stored pesticides in the home.
Just over one in ten respondents specified safety precautions such as keeping pesticides on a high shelf or in a locked cupboard or other container.
Table 5.18: Storage locations
Frequency %
Shed 617 58.9
Garage 325 31.0
Greenhouse 72 6.9
High shelf 62 5.9
Locked cupboard/container 57 5.4
In the house 43 4.1
Other 30 2.9
Notes: n = 1,052; multi-response question; total responses 1,206
Figure 5.15: Storage locations
0
10
20
30
40
50
60
70
Shed
Garage
Greenh
ouse
High sh
elf
Locke
d cup
board
/conta
iner
In the
hous
eOthe
r
% o
f res
pons
es
Gardeners were also asked how long they store pesticides for before using them up or disposing of them. A third of respondents stored pesticides for less than one year, with half averaging between 1 and 2 years.
However, one in ten respondents stored products for 2 to 3 years, and around 6% stored products for three years or more.

Pesticide user habits: public purchasing, use, storage and disposal of pesticides August 2007
18
Table 5.19: Length of storage
Frequency %
Less than 1 year 351 33.9
1 to 2 years 515 49.8
2 to 3 years 106 10.2
3 to 5 years 39 3.8
More then 5 years 24 2.3
Total 1035 100.0
Figure 5.16: Length of storage
33.9%
49.8%
10.2%
3.8% 2.3%
Less than 1 year
1 to 2 years
2 to 3 years
3 to 5 years
More then 5 years
5.5 Disposal The final section of the questionnaire covered disposal of empty containers and, where relevant, disposal of pesticides themselves.
As Table 5.20 shows, nearly half of gardeners disposed of empty pesticide containers in the dustbin, while more than a third were recycling them. Nearly one in five were disposing of containers at their local household waste recycling centre (HWRC), while a small number burned containers.
Table 5.20: Disposal of pesticide containers
Frequency %
Bin 500 47.5
Recycling box/bin/bag 368 35.0
Household waste and recycling centre/tip/civic amenity site 187 17.8
Burning 14 1.3
Other 16 1.5 Notes: n = 1,052; multi-response question; total responses 1,085

Pesticide user habits: public purchasing, use, storage and disposal of pesticides August 2007
19
Figure 5.17: Disposal of pesticide containers
0
10
20
30
40
50
60
Bin Recyclingbox/bin/bag
Household wasteand recyclingcentre/tip/civicamenity site
Burn it Other
% o
f res
pons
es
Regarding disposal of pesticides themselves, as shown in Table 5.21 and Figure 5.18, only a fairly small proportion – around one in eight – found that they ever had to dispose of unused or unwanted products. This implies that the majority of respondents are using all pesticides purchased for their intended purpose.
Table 5.21: Disposal of unused or unwanted pesticides
Frequency %
Yes 145 13.8 No 905 86.2 Total 1050 100.0
Notes: missing answers = 2
Figure 5.18: Disposal of unused or unwanted pesticides
13.8%
86.2%
Yes No

Pesticide user habits: public purchasing, use, storage and disposal of pesticides August 2007
20
The methods used for disposal of unused or unwanted pesticides varied, but the survey clearly shows that products are being disposed of by some gardeners in an inappropriate fashion. A total of 153 responses to this question were provided by the 145 individuals who stated that they disposed of pesticides.
On a positive note, the most frequently cited disposal route was to take products to the local HWRC (31.7%). However, it should be noted that not all of these centres have appropriate facilities for disposal of waste pesticides, and some of the items disposed of at HWRCs may be placed in general waste containers. A small proportion (3.4%) used a local authority collection service.
The second most frequent disposal method stated was the bin (28.3%). Significant numbers of respondents (20%) disposed of pesticides by putting them down the drain, while small numbers also used the sink or the toilet.
Table 5.21: Disposal method for unused or unwanted pesticides
Frequency %
Bin 41 28.3
Drain 29 20.0
Household waste and recycling centre/tip/civic amenity site 46 31.7
Local authority collection service 5 3.4
Sink 4 2.8
Spray onto waste ground 18 12.4
Toilet 2 1.4
Other 8 5.5
Notes: n = 145; multi-response question; total responses 153
Figure 5.19: Disposal method for unused or unwanted pesticides
0
5
10
15
20
25
30
35
BinDrai
n
HWRC/tip
/CA site
Loca
l auth
ority
collec
tion se
rvice
Sink
Spray
onto
waste
groun
d Toilet
Other
% o
f res
pons
es

Pesticide user habits: public purchasing, use, storage and disposal of pesticides August 2007
21
5.6 Cross-tabulation This section summarises findings from cross-tabulation of key variables, and identifies variation between different locations and age groups, as well as by attitudes to gardening.
The analysis also contains a specific section that identifies other characteristics of respondents disposing of pesticides.
5.6.1 Location Table 5.22 shows the numbers of questionnaires completed at each location, which comprised an even spread, with similar numbers completed in each of the six locations. The numbers of people indicating that they would be happy to be contacted regarding possible participation in a focus group at a later date varied between locations (see Section 7).
Table 5.22: Responses per location
Frequency %
Ipswich 177 16.8
Tunbridge Wells 173 16.4
Newport 175 16.6
Glasgow 177 16.8
Preston 175 16.6
Oxford 171 16.3
Missing data 4 0.4
Total 1052 100.0
Table 5.23 summarises the proportions of respondents in each location using different product types, as illustrated in Figure 5.20.
Table 5.23: Product types used (%)
Ipswich Tunbridge Wells
Newport Glasgow Preston Oxford
Animal repellents 4.5 8.1 3.4 8.5 8.6 11.7
Patio cleaners 13.6 16.2 27.4 24.3 13.7 12.3
Insecticides 27.7 16.2 18.3 19.8 27.4 26.3
Rooting powder/gel/hormone
13.6 14.5 7.4 10.2 13.7 17.5
Rat and mouse killers 16.4 8.7 9.7 4.5 5.7 16.4
Weedkillers 45.8 41.0 46.3 66.1 48.6 53.2
Fly spays and ant powder 50.3 19.1 52.0 29.4 30.9 40.4
Fungicide sprays 14.7 19.1 6.9 10.7 20.6 16.4
Algae and snail control 4.0 2.9 5.7 2.8 4.6 5.8
Slug pellets 47.5 79.2 77.1 58.8 69.1 70.2
Other 0.6 2.9 4.6 1.1 1.1 1.8

Pesticide user habits: public purchasing, use, storage and disposal of pesticides August 2007
22
Figure 5.20: Product types used (%)
0%
10%
20%
30%
40%
50%
60%
70%
80%
90%
Ipswich TunbridgeWells
Newport Glasgow Preston Oxford
Animal repellents
Patio cleaners
Insecticides
Rootingpowder/gel/hormone
Rat and mouse killers
Weedkillers
Fly spays and antpowder
Fungicide sprays
Algae and snail control
Slug pellets
Other
Some considerable variations can be observed in the proportions of respondents in different locations stating that they used different product types:
• There was greater use of patio cleaners in Newport (27.4%) and Glasgow (24.3%) than in other areas, which ranged from 12.3% to 16.2%.
• Use of rat and mouse killers was particularly prevalent in Ipswich (16.4%) and Oxford (16.4%) compared with other areas, which ranged from 4.5% to 9.7%.
• More respondents in Glasgow used weedkiller (66.1%) than in other areas (41% to 53.2%).
• Use of fly sprays and ant powder ranged from 19% in Tunbridge Wells to 50.3% in Ipswich and 52% in Newport.
• Fungicide use ranged from 6.9% in Newport to 20.6% in Preston.
• Slug pellets were the most frequently used product in most areas, with proportions of gardeners in each location ranging from 47.5% in Ipswich to 79.2% in Tunbridge Wells.
The numbers of products purchased each year by respondents in different locations is summarised in Table 5.24 and illustrated in Figure 5.21.
Table 5.24: Numbers of products purchased per year (%)
Ipswich Tunbridge Wells
Newport Glasgow Preston Oxford
Less than 1 18.6 14.5 5.1 2.8 5.8 19.4 One 35.0 45.1 30.9 29.4 29.8 22.3 Two 19.2 21.4 30.9 31.6 29.8 26.4 Three 15.3 11.0 15.4 17.5 11.5 13.0 Four 4.0 3.5 9.7 9.6 5.8 6.5 Five 3.4 0.6 3.4 4.0 8.1 6.5 6 or more 4.5 4.0 4.6 5.1 9.2 5.9 Totals 100 100 100 100 100 100

Pesticide user habits: public purchasing, use, storage and disposal of pesticides August 2007
23
Figure 5.21: Numbers of products purchased per year
0%
5%
10%
15%
20%
25%
30%
35%
40%
45%
50%
Ipswich TunbridgeWells
Newport Glasgow Preston Oxford
Lessthan 1
One
Two
Three
Four
Five
6 or more
The proportions of gardeners buying four or more products each year ranged from 8.1% in Tunbridge Wells to 22.9% in Preston, as illustrated in Figure 5.22.
Figure 5.22: Gardeners buying four or more products per year (%)
0%
5%
10%
15%
20%
25%
Ipswich Tunbridge Wells Newport Glasgow Preston Oxford

Pesticide user habits: public purchasing, use, storage and disposal of pesticides August 2007
24
Table 5.25 and Figure 5.23 show that the proportions of gardeners disposing of unused or unwanted pesticides ranged from 5.7% in Newport (10 respondents) to 22.8% in Oxford (39 respondents).
Table 5.25: Disposal of unused or unwanted pesticides
Ipswich Tunbridge Wells
Newport Glasgow Preston Oxford
27 22 10 26 21 39 Yes 15.3% 12.7% 5.7% 14.7% 12.0% 22.8%
150 151 165 151 152 132 No 84.7% 87.3% 94.3% 85.3% 86.9% 77.2%
0 0 0 0 2 0 Missing answer 0.0% 0.0% 0.0% 0.0% 1.1% 0.0%
Total 177 173 175 177 175 171
Figure 5.23: Disposal of unused or unwanted pesticides
0%
5%
10%
15%
20%
25%
Ipswich Tunbridge Wells Newport Glasgow Preston Oxford
Table 5.26 and Figure 5.24 summarise proportions of respondents in each location using different disposal methods for pesticides. Some differences can be observed, but findings in this section should be treated with caution due to small sample sizes:
• 40% of respondents disposing of pesticides in Newport put them down the drain
• half of respondents in Glasgow disposed of pesticides via the bin
• higher proportions of respondents in Ipswich (44.4%) and Oxford (46.2%) took pesticides to their local HWRC than those in other areas.

Pesticide user habits: public purchasing, use, storage and disposal of pesticides August 2007
25
Table 5.26: Disposal routes for unused or unwanted pesticides
Ipswich Tunbridge Wells
Newport Glasgow Preston Oxford
7 5 4 5 2 6 Drain 25.9% 22.7% 40.0% 19.2% 9.5% 15.4%
1 0 0 1 1 1 Sink 3.7% 0.0% 0.0% 3.8% 4.8% 2.6%
1 1 0 0 0 0 Toilet 3.7% 4.5% 0.0% 0.0% 0.0% 0.0%
7 4 2 13 7 8 Bin 25.9% 18.2% 20.0% 50.0% 33.3% 20.5%
3 5 0 4 2 4 Spray onto waste ground 11.1% 22.7% 0.0% 15.4% 9.5% 10.3%
1 0 2 0 1 1 Local authority collection service 3.7% 0.0% 20.0% 0.0% 4.8% 2.6%
12 4 2 4 6 18 HWRC/tip/CA site 44.4% 18.2% 20.0% 15.4% 28.6% 46.2%
2 1 0 0 1 4 Other 7.4% 4.5% 0.0% 0.0% 4.8% 10.3%
Figure 5.24: Disposal routes for unused or unwanted pesticides
0%
10%
20%
30%
40%
50%
60%
Ipswich TunbridgeWells
Newport Glasgow Preston Oxford
Drain
Sink
Toilet
Bin
Spray onto wastegroundLocal authoritycollection serviceHWRC/tip/CA site
Other

Pesticide user habits: public purchasing, use, storage and disposal of pesticides August 2007
26
5.7 Age bracket As noted in Section 5.1, the 16-24 age group was under-represented in the survey (0.9%), with the majority of respondents coming from the 45-64 years old (49.5%) and 65 and over (31.4%) age groups. The 25-44 age group accounted for 18.3% of the sample. The sample size for the 16-24 age group was only 9 respondents. Therefore, although the results from this group are included in the tables and figures below, results for this group should be treated with caution.
The discussion in this section focuses on questions and issues where differences of a reasonable magnitude were observed between different age groups. In general, only very small differences between age groups were recorded for most questions in the survey.
As Table 5.27 and Figure 5.25 show, there were some differences between age groups regarding use of ready-to-use products and concentrated products that need diluting before use. Respondents from the 25-44 age group were considerably more likely to use ready-to-use products only, with nearly 60%, compared to 44.6% and 42.4% for the 45-64 and 65 and over groups.
Table 5.27: Ready-to-use and concentrated products use by age bracket
16 – 24 25 - 44 45 - 64 65 and
over
4 114 232 140 Ready-to-use only
44.4% 59.4% 44.6% 42.4% 2 24 109 75 Need diluting only
22.2% 12.5% 21.0% 22.7% 3 54 179 114 Both
33.3% 28.1% 34.4% 34.5%
Figure 5.25: Ready-to-use and concentrated products use by age bracket
0%
10%
20%
30%
40%
50%
60%
70%
16 - 24 25 - 44 45 - 64 65 and over
Ready-to-use onlyNeed diluting onlyBoth
There were also observable differences between age groups regarding use of concentrated products. However, the sample size of people using these products for the 16 to 24 age group was very small (five respondents in total), and results for this group should be treated with

Pesticide user habits: public purchasing, use, storage and disposal of pesticides August 2007
27
caution. In Tables 5.28 to 5.30, percentages and actual numbers of responses for each age group are shown for each question.
Regarding measurement methods when diluting products, as Table 5.28 shows, the data indicated a slightly lower likelihood to estimate or guess the amount of product to use with ascending age, although differences were small.
Table 5.28: Measurement methods
16 - 24 25 - 44 45 - 64 65 and over Totals
3 70 259 175 507 Measuring device/cap provided with product 60.0% 89.7% 89.9% 92.6% 90.5%
2 11 29 15 57 Estimate or guess
40.0% 14.1% 10.1% 7.9% 10.2% 0 1 7 4 12 Other
0.0% 1.3% 2.4% 2.1% 2.1% 0 0 1 0 1 Missing
0.0% 0.0% 0.3% 0.0% 0.3%
Disregarding the 16-24 age group, there appeared to be a higher propensity to save products once they had been diluted in the older age groups, with more than twice as many of the 65 and over group (27.0%) as the 25-44 group (12.8%) storing products.
Table 5.29: Storage of products after dilution
16 - 24 25 - 44 45 - 64 65 and over Totals
1 10 70 51 132 Yes 20.0% 12.8% 24.3% 27.0% 23.6%
4 68 214 138 424 No 80.0% 87.2% 74.3% 73.0% 75.7%
0 0 4 0 4 Missing 0.0% 0.0% 1.4% 0.0% 0.7%
5 78 288 189 560 Totals 100.0% 100.0% 100.0% 100.0% 100.0%
The data indicted that those in the 65 and over group (65.6%) were the most likely to rinse empty containers prior to disposal, closely followed by the 45 -64 age group (61.5%). Fewer respondents (39.7%) in the 25-44 age group claimed to rinse out empty containers.
Table 5.31: Rinsing of empty containers
16 - 24 25 - 44 45 - 64 65 and over Totals
1 31 177 124 333 Yes 20.0% 39.7% 61.5% 65.6% 59.5%
4 47 109 65 225 No 80.0% 60.3% 37.8% 34.4% 40.2%
0 0 2 0 2 Missing 0.0% 0.0% 0.7% 0.0% 0.4%
5 78 288 189 560 Totals 100.0% 100.0% 100.0% 100.0% 100.0%

Pesticide user habits: public purchasing, use, storage and disposal of pesticides August 2007 DRAFT
28
5.8 Attitudes to gardening The discussion in this section focuses on questions and issues where it might be expected that attitudes to gardening would have an impact on the responses provided. For example it might be expected that:
• keen and regular gardeners would purchase more products than other groups, or different types of products
• keen gardeners might be more at home with using products that need diluting before use
• keen gardeners might demonstrate a more conscientious attitude to product instructions, including appropriate disposal of unwanted or unused products.
Regarding product types used, Table 5.32 and Figure 5.26 show that:
• The four most commonly used products across all groups were slug pellets, lawn treatments, weedkillers and flysprays/ ant powders.
• The profiles of product type used were in general very similar across the groups, although fewer members of the “gardening is a chore” group used most products, indicating that members of this group generally purchase fewer products.
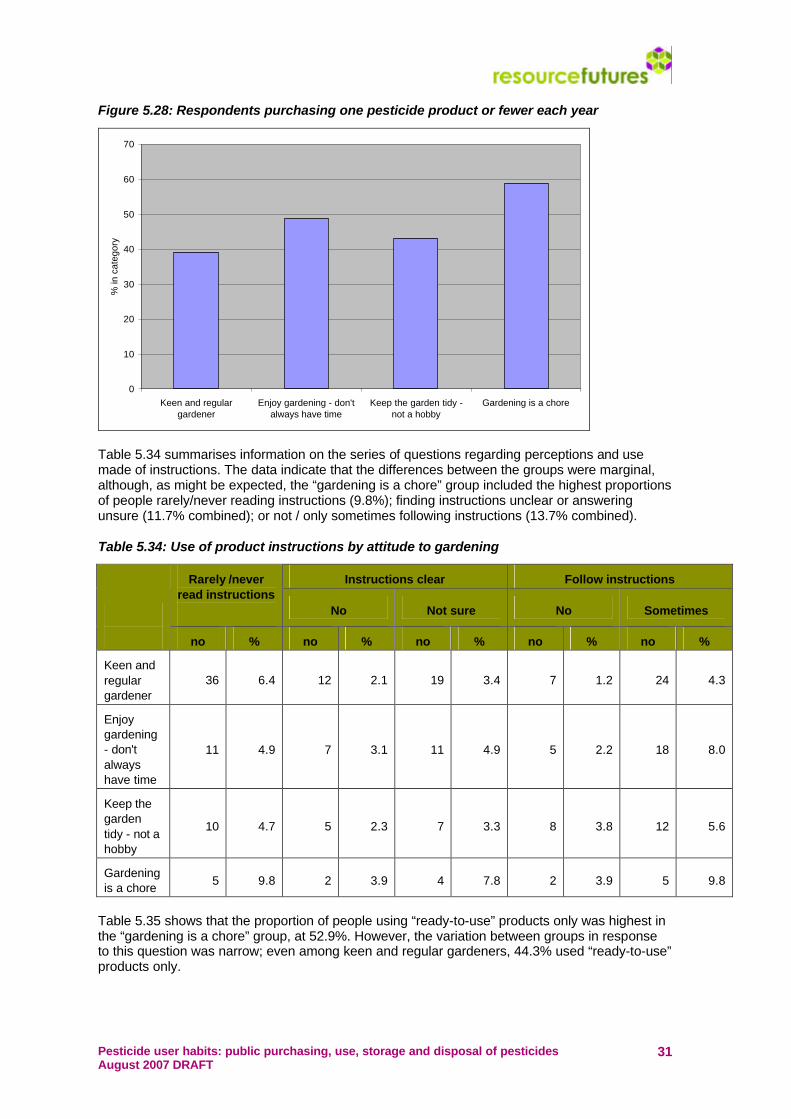
This conclusion is confirmed by the responses to the question regarding average numbers of pesticide products purchased each year. As shown in Table 5.33 and Figure 5.27, the profile of the “gardening is a chore” group indicates that fewer products are bought on average by many members of this group. This is illustrated in Figure 5.28, which shows that the numbers of respondents buying one product or fewer each year ranges from 39.2% for the “keen and regular gardener” group to 58.8% for the “gardening is a chore” group.
Figure 5.26: Product types used
0%
10%
20%
30%
40%
50%
60%
70%
80%
Keen and regulargardener
Enjoy gardening -don't always have
time
Keep the garden tidy- not a hobby
Gardening is a chore
Animal repellents
Patio cleaners
Insecticides
Rootingpowder/gel/hormoneRat and mouse killers
Weedkillers
Fly spays and antpowderFungicide sprays
Lawn treatments
Algae and snail control
Slug pellets
Other

Pesticide user habits: public purchasing, use, storage and disposal of pesticides August 2007 DRAFT
29
Table 5.32: Product types used
Animal repellents
Patio cleaners
Insecticides Rooting powder/gel/
hormone
Rat and mouse killers
Weedkillers Fly spays and ant powder
Fungicide sprays
Lawn treatments
Algae and snail
control
Slug pellets Other
No. % No. % No. % No. % No. % No. % No. % No. % No. % No. % No. % No. %
Keen and regular gardener - enjoyable hobby
44 7.8 101 18.0 151 26.9 97 17.3 67 11.9 281 50.0 207 36.8 98 17.4 255 45.4 37 6.6 399 71.0 13 2.3
Enjoy gardening - don't always have time
14 6.2 39 17.3 45 19.9 21 9.3 21 9.3 106 46.9 75 33.2 28 12.4 93 41.2 4 1.8 145 64.2 4 1.8
Like to keep garden tidy, but not a hobby
18 8.5 44 20.7 40 18.8 14 6.6 16 7.5 119 55.9 94 44.1 26 12.2 99 46.5 5 2.3 134 62.9 5 2.3
Gardening is a chore
3 5.9 4 7.8 3 5.9 2 3.9 5 9.8 21 41.2 13 25.5 3 5.9 26 51.0 0 0.0 25 49.0 1 2.0
Total
79 7.5 188 17.9 239 22.7 134 12.7 109 10.4 527 50.1 389 37.0 155 14.7 473 45.0 46 4.4 703 66.8 23 2.2

Pesticide user habits: public purchasing, use, storage and disposal of pesticides August 2007 DRAFT
30
Table 5.33: Numbers of products purchased
Less than 1
One
Two
Three
Four
Five
6 or more
Missing data
Totals
No. % No. % No. % No. % No. % No. % No. % No. % No. %
Keen and regular gardener 51 9.1 169 30.1 147 26.2 82 14.6 40 7.1 29 5.2 44 7.8 0 0.0 562 100.0
Enjoy gardening - don't always have time 38 16.8 72 31.9 52 23.0 38 16.8 11 4.9 5 2.2 8 3.5 2 0.9 226 100.0
Keep the garden tidy - not a hobby 18 8.5 74 34.7 66 31.0 25 11.7 14 6.6 10 4.7 6 2.8 0 0.0 213 100.0
Gardening is a chore 9 17.6 21 41.2 14 27.5 3 5.9 3 5.9 1 2.0 0 0.0 0 0.0 51 100.0
Figure 5.27: Numbers of products purchased
0%
5%
10%
15%
20%
25%
30%
35%
40%
45%
Keen and regulargardener
Enjoy gardening - don'talways have time
Keep the garden tidy -not a hobby
Gardening is a chore
Less than 1OneTwoThreeFourFive6 or more
Pesticide user habits: public purchasing, use, storage and disposal of pesticides August 2007 DRAFT
31
Figure 5.28: Respondents purchasing one pesticide product or fewer each year
0
10
20
30
40
50
60
70
Keen and regulargardener
Enjoy gardening - don'talways have time
Keep the garden tidy -not a hobby
Gardening is a chore
% in
cat
egor
y
Table 5.34 summarises information on the series of questions regarding perceptions and use made of instructions. The data indicate that the differences between the groups were marginal, although, as might be expected, the “gardening is a chore” group included the highest proportions of people rarely/never reading instructions (9.8%); finding instructions unclear or answering unsure (11.7% combined); or not / only sometimes following instructions (13.7% combined).
Table 5.34: Use of product instructions by attitude to gardening
Instructions clear Follow instructions Rarely /never read instructions
No Not sure No Sometimes
no % no % no % no % no %
Keen and regular gardener
36 6.4 12 2.1 19 3.4 7 1.2 24 4.3
Enjoy gardening - don't always have time
11 4.9 7 3.1 11 4.9 5 2.2 18 8.0
Keep the garden tidy - not a hobby
10 4.7 5 2.3 7 3.3 8 3.8 12 5.6
Gardening is a chore 5 9.8 2 3.9 4 7.8 2 3.9 5 9.8
Table 5.35 shows that the proportion of people using “ready-to-use” products only was highest in the “gardening is a chore” group, at 52.9%. However, the variation between groups in response to this question was narrow; even among keen and regular gardeners, 44.3% used “ready-to-use” products only.

Pesticide user habits: public purchasing, use, storage and disposal of pesticides August 2007
32
Table 5.35: Use of concentrated and ready to use products by attitude to gardening
Ready-to-use only
Need diluting only
Both
Missing answer
Totals
no % no % no % no % no % Keen and regular gardener
249 44.3 107 19.0 205 36.5 1 0.2 562 100.0
Enjoy gardening - don't always have time
109 48.2 59 26.1 58 25.7 0 0.0 226 100.0
Keep the garden tidy - not a hobby
106 49.8 33 15.5 74 34.7 0 0.0 213 100.0
Gardening is a chore 27 52.9 11 21.6 13 25.5 0 0.0 51 100.0
Table 5.36 shows the numbers and proportions in each category that stated they rinsed pesticide containers – for products that required dilution – prior to disposal. As illustrated in Figure 5.29, “keen and regular” gardeners were more likely than other categories to rinse pesticide containers before disposal.
Table 5.36: Rinsing of empty containers by attitude to gardening
Yes No Missing data Totals
no % no % no % no %
Keen and regular gardener
208 66.7 103 33.0 1 0.3 312 100.0
Enjoy gardening - don't always have time
55 47.0 61 52.1 1 0.9 117 100.0
Keep the garden tidy - not a hobby
57 53.3 50 46.7 0 0.0 107 100.0
Gardening is a chore 13 54.2 11 45.8 0 0.0 24 100.0
Figure 5.29: Rinsing of empty containers by attitude to gardening
0%
10%
20%
30%
40%
50%
60%
70%
Keen and regulargardener
Enjoy gardening - don'talways have time
Keep the garden tidy -not a hobby
Gardening is a chore
YesNo

Pesticide user habits: public purchasing, use, storage and disposal of pesticides August 2007
33
5.9 Product disposal As noted above, in Section 5.5, the number of respondents stating that they dispose of unused or unwanted pesticides was 145 (13.8%), and these respondents indicated a total of 153 different disposal routes. This section summarises information on characteristics of respondents disposing of pesticides.
The numbers of respondents in different locations, and the disposal methods that they use, are summarised in Tables 5.25 and 5.26. Some variation between locations was observed, with only 10 Newport respondents (5.7%) stating that they disposed of pesticides whereas 22.8% of Oxford respondents stated that they did so. Variations in the numbers of people using different disposal methods were also observed between locations (see Section 5.6.1), but results here should be treated with caution because of small sample sizes.
Regarding age, it should be noted that a substantial majority (62%) of respondents stating that they dispose of pesticides fell into the 45-64 age group, as shown in Table 5.37 and Figure 5.30. This group made up 49.5% of the overall sample. In the 45-64 age group, 17.3% of respondents said that they disposed of pesticides, more than double the proportion of 25-44 year olds.
Table 5.37: Disposal of unwanted products by age bracket
16 - 24 25 - 44 45 - 64 65 and over
Yes 1 16 90 38
% 11.1 8.3 17.3 11.5
No 8 176 430 290
% 88.9 91.7 82.7 87.9
Missing answer 0 0 0 2
% 0.0 0.0 0.0 0.6
Total 9 192 520 330
% 100.0 100.0 100.0 100.0
Figure 5.30: Disposal of unwanted products by age bracket
0
50
100
150
200
250
300
350
400
450
500
16 - 24 25 - 44 45 - 64 65 and over
No
of re
spon
dent
s
YesNo
A majority of respondents disposing of pesticides were also in one category when analysed according to attitude to gardening, with 53.1% (77 respondents) classing themselves as keen and regular gardeners. The greatest proportion disposing of pesticides within the categories was 19%, for the “enjoy gardening – don’t have time” group. Only 1 respondent (2.0%) from the “gardening is a chore” group disposed of pesticides.

Pesticide user habits: public purchasing, use, storage and disposal of pesticides August 2007
34
Table 5.38: Disposal of unwanted products by attitude to gardening
Keen and regular
gardener
Enjoy gardening - don't always
have time
Keep the garden tidy - not a hobby
Gardening is a chore
Yes 77 43 24 1
% 13.7 19.0 11.3 2.0
No 483 183 189 50
% 85.9 81.0 88.7 98.0
Missing answer 2 0 0 0
% 0.4 0.0 0.0 0.0
Total 562 226 213 51 % 100.0 100.0 100.0 100.0
Figure 5.31: Disposal of unwanted products by attitude to gardening
0
100
200
300
400
500
600
Keen and regulargardener
Enjoy gardening - don'talways have time
Keep the garden tidy -not a hobby
Gardening is a chore
YesNo
When different disposal methods are reviewed, it is clear that inappropriate disposal methods are being used by significant numbers. As noted in Section 5.5, although the most frequently cited disposal route was to take products to the local HWRC (31.7%), the second most frequent disposal method stated was the bin (28.3%). Significant numbers of respondents (20%) disposed of pesticides by putting them down the drain, while small numbers also used the sink or the toilet.
It should also be noted that substantial proportions of those disposing of pesticides using inappropriate methods are disposing of products that need diluting before use. Thus, while 46.7% of the total survey sample used “ready-to-use” products only, this was true of only 17.2% of respondents who disposed of pesticides down the drain, and 29.3% of those who put them in the bin. In other words, users of concentrated products appear to be over-represented among those disposing of products in an inappropriate fashion.

Pesticide user habits: public purchasing, use, storage and disposal of pesticides August 2007
35
Table 5.39: Use of ready-to-use and products requiring dilution by disposal method
Ready-to-use only Need diluting
only Both Totals
5 11 13 29 Drain
17.2% 37.9% 44.8% 100.0% 1 1 2 4 Sink
25.0% 25.0% 50.0% 100.0% 1 0 1 2 Toilet
50.0% 0.0% 50.0% 100.0% 12 12 17 41 Bin
29.3% 29.3% 41.5% 100.0% 6 4 8 18 Spray onto waste ground
33.3% 22.2% 44.4% 100.0% 1 1 3 5 Local authority collection
service 20.0% 20.0% 60.0% 100.0% 16 7 23 46 HWRC/tip/civic amenity
site 34.8% 15.2% 50.0% 100.0% 5 2 1 8 Other
62.5% 25.0% 12.5% 100.0%
There appeared to be no relationship between perceptions of and use of instructions and inappropriate disposal methods. For instance, of those disposing of pesticides to the drain, 93.1% claimed to follow product instructions and 96.6% claimed that they found instructions clear. Findings on this issue are summarised in Tables 5.40 and 5.41.
Table 5.40: Following instructions for use on pesticides by disposal method
Yes No Sometimes Totals
27 1 1 29 Drain
93.1% 3.4% 3.4% 100.0% 4 0 0 4 Sink
100.0% 0.0% 0.0% 100.0% 2 0 0 2 Toilet
100.0% 0.0% 0.0% 100.0% 37 1 3 41 Bin
90.2% 2.4% 7.3% 100.0% 14 1 3 18 Spray onto waste ground
77.8% 5.6% 16.7% 100.0% 4 0 1 5 Local authority collection
service 80.0% 0.0% 20.0% 100.0% 44 1 1 46 Household waste and
recycling centre/tip/civic amenity site 95.7% 2.2% 2.2% 100.0%
6 1 1 8 Other
75.0% 12.5% 12.5% 100.0%

Pesticide user habits: public purchasing, use, storage and disposal of pesticides August 2007
36
Table 5.41: Perceived clarity of product instructions by disposal method
Yes No Unsure Totals
28 0 1 29 Drain
96.6% 0.0% 3.4% 100.0%
Sink 3 0 1 4
75.0% 0.0% 25.0% 100.0% 2 0 0 2 Toilet
100.0% 0.0% 0.0% 100.0% 37 1 3 41 Bin
90.2% 2.4% 7.3% 100.0% 16 1 1 18 Spray onto waste ground
88.9% 5.6% 5.6% 100.0% 5 0 0 5 Local authority collection
service 100.0% 0.0% 0.0% 100.0% 45 0 1 46 Household waste and
recycling centre/tip/civic amenity site 97.8% 0.0% 2.2% 100.0%
7 1 0 8 Other
87.5% 12.5% 0.0% 100.0%

Pesticide user habits: public purchasing, use, storage and disposal of pesticides August 2007
37
6. Summary and discussion
Key survey findings can be summarised as follows:
• As might be expected, a majority of the respondents (53.4%) defined themselves as “keen and regular gardeners”.
• The sample had a bias to older age groups, with only 0.9% of respondents in the 16-24 age group, and more than 80% over 45.
• The most frequently purchased products were slug pellets (66.8% of respondents), weed-killers (50.1%) and lawn treatments (45%).
• The majority of respondents purchased either one (32%) or two (26.6%) products each year. Around one in ten people purchased an average of less than one product per year, while a total of 16.3% of respondents purchased 4 or more products each year.
• There was considerable variation between locations regarding types and numbers of products bought. For example, the proportions of gardeners buying four or more products each year ranged from 8.1% in Tunbridge Wells to 22.9% in Preston. This may be related to some extent to different climatic conditions across survey locations.
• There was also some variation regarding numbers of product purchased between different categories of gardener; numbers of respondents buying one product or fewer each year ranged from 39.2% for the “keen and regular gardener” group to 58.8% for the “gardening is a chore” group.
• Only small minorities of respondents stated that they rarely or never read product instructions (5.9%); regarded instructions as unclear (2.5%, with a further 3.9% unsure); or stated that they did not (2.1%) or only sometimes (5.6%) follow instructions.
• Differences between categories of gardener regarding attitude to instructions were marginal. However, as might be expected, the “gardening is a chore” group included the highest proportions of people rarely/never reading instructions (9.8%); finding instructions unclear or answering unsure (11.7% combined); or not / only sometimes following instructions (13.7% combined).
• In addition to product instructions, garden centre staff, magazines, TV programmes and websites were the most frequently cited sources, with the BBC (Gardeners’ World) and RHS being the most popular among these.
• Nearly half of respondents (46.9%) only used “ready-to-use” products, and are therefore not at risk of disposing of products that need diluting (and thus carry the greatest environmental risk) in an inappropriate fashion. Respondents from the 25-44 age group were considerably more likely to use ready-to-use products only, with nearly 60%, compared to 44.6% and 42.4% respectively for the 45-64 and 65 and over groups.
• Among respondents using products that require diluting before use:
• 10.2% estimate or guess amount of product to be used, with a slightly lower likelihood of doing so with ascending age;
• 23.7% save products that they have already mixed, with more than twice as many of the 65 and over group (27.0%) as the 25-44 group (12.8%) storing products;
• 59.7% rinse empty containers, with those in the 65 and over group (65.6%) the most likely to do so;
• “Keen and regular” gardeners were more likely than other categories to rinse pesticide containers before disposal (66.7%).
• More than half of respondents rinsing containers put the rinsings down the drain, with small numbers also using the sink (6.6%) or the toilet (0.9%).

Pesticide user habits: public purchasing, use, storage and disposal of pesticides August 2007
38
• The shed was the most frequent location for storage of pesticides (58.9%), followed by the garage (31.0%). Only 4.1% of people stored pesticides in the home. Just over one in ten respondents specified safety precautions such as keeping pesticides on a high shelf or in a locked cupboard or other container.
• Regarding storage duration, most respondents used products in one season (33.9%), or stored for between 1 to 2 years (49.8%). However, one in ten stored products for 2 to 3 years and around 6% for 3 years or more. This indicates that there is some hoarding of products in lieu of disposal, but that this is only carried out by a minority.
• Nearly half of gardeners disposed of empty pesticide containers in the dustbin, while more than a third were recycling them. Nearly one in five were disposing of containers at their local household waste recycling centre (HWRC), while a small number (1.4%) burned containers.
• More than one in eight respondents (13.8%) stated that they disposed of pesticides. This implies that the majority of respondents were using up products for their intended purpose. It also implies that the sample size of respondents disposing of pesticides is relatively small (145), so findings relating to this group of respondents should be treated with some caution, eg disposal routes.
• The proportions of gardeners disposing of unused or unwanted pesticides ranged from 5.7% in Newport (10 respondents) to 22.8% in Oxford (39 respondents). No compelling explanation can be suggested for this variation.
• The methods used for disposal of unused or unwanted pesticides varied, but the survey made it clear that products are being disposed of by some gardeners in an inappropriate fashion. The most frequently cited disposal route was to take products to the local HWRC (31.7% of those disposing of pesticides). A small proportion (3.4%) used a local authority collection service. However, the second most frequent disposal method stated was the bin (28.3%). One in five respondents disposing of pesticides – 29 respondents – did so by putting them down the drain, while small numbers also used the sink or the toilet. As a proportion of the total sample, 3.9% of respondents were disposing of pesticides via the bin and 2.8% were putting them down the drain.
• Some variation between locations was observed with reference to disposal methods. However, findings should be treated with caution because of small sample sizes that differed between locations. It can be speculated, however, that areas with suitably publicised household hazardous waste collection services (either at HWRCs or from households) may attract more disposal via appropriate methods.
With specific reference to respondents disposing of pesticides:
• A substantial majority (62%) of respondents fell into the 45-64 age group, which made up 49.5% of the overall sample. In the 45-64 age group, 17.3% of respondents said that they disposed of pesticides; this was more than double the proportion of 25-44 year olds.
• A majority of respondents (53.1% or 77 respondents) disposing of pesticides classed themselves as keen and regular gardeners. The greatest proportion disposing of pesticides within any category was 19%, for the “enjoy gardening – don’t have time” group. Only 1 respondent (2.0%) from the “gardening is a chore” group disposed of pesticides.
• The most frequently cited disposal route was to take products to the local HWRC (31.7%). The second most frequent disposal method stated was the bin (28.3%). Significant numbers of respondents (20%) disposed of pesticides by putting them down the drain, while small numbers also used the sink or the toilet.
• Many of those disposing of pesticides using inappropriate methods are disposing of products that need diluting before use. Thus, while 46.7% of the total survey sample used “ready-to-use” products only, this was true of only 17.2% of respondents who disposed of pesticides down the drain, and 29.3% of those who put them in the bin. In other words, users of concentrated products appear to be over-represented among those disposing of products in an inappropriate fashion.

Pesticide user habits: public purchasing, use, storage and disposal of pesticides August 2007
39
• There appeared to be no relationship between perceptions of and use of instructions and inappropriate disposal methods; of those disposing of pesticides to the drain, 93.1% claimed to follow product instructions and 96.6% claimed that they found instructions clear.
• The latter finding may indicate that respondents have claimed that they read and follow instructions when this is not the case. It also indicates that it is unlikely that people disposing of pesticides in inappropriate ways are aware that they may be causing environmental damage. On this basis, it could be argued that messages regarding appropriate disposal of pesticide products need to be marked more prominently on products.
Following consideration of this report, the Amateur Use Action Plan Implementation Group (AUAPIG) will continue to develop communications messages and materials. The group may wish to use additional qualitative focus group research to test or to inform the development of communications messages. In this respect, the numbers of survey respondents indicating that they were willing to take part in a focus group would be adequate for at least one group to be run in each location except Preston.
Table 5.42: Potential focus group participants by location
Location Ipswich 24 Tunbridge Wells 27 Newport 31 Glasgow 33 Preston 6 Oxford 49

Pesticide user habits: public purchasing, use, storage and disposal of pesticides August 2007
40
Appendix 1: Questionnaire
Pesticide User Habits survey, May 2007 INTRODUCTION
Good morning/ afternoon I’m carrying out a survey on behalf of the Pesticides Safety Directorate, a government body that works to ensure the safe use of pesticides. The survey will only take a few minutes, and there’s a prize draw for garden centre vouchers which we can enter you for if you would like. Would you be interested in taking part? Additional information if required:
• Prize draw first prize £100, plus 5 x runner-up prizes of £25 • The survey information will be used by the Pesticides Safety Directorate to develop
guidance for the public on safe use, storage and disposal of pesticides • Length of survey depends on answers – 5 to 8 minutes
1. Do you use pesticides or garden chemicals in your garden? (prompt with
examples if required)
Yes 1 No 2
If YES, continue to Question 2
If NO, thank and close interview
Questions about you
2. Which one of these descriptions best describes how you feel about gardening
(single code):
I am a keen and regular gardener – gardening is an enjoyable hobby 1
I enjoy gardening but don’t always have time for it 2
I like to keep the garden tidy, but wouldn’t call it a hobby 3
Gardening is a chore 4
3. Where do you do your gardening?
Garden at home 1
Allotment 2
Other (please specify)
_________________
3

Pesticide user habits: public purchasing, use, storage and disposal of pesticides August 2007
41
4. Which of the following age brackets do you fall into?
16-24 1
25-44 2
45-64 3
65 and over 4
Purchasing
5. Which types of pesticides do you use? (multi code)
Animal repellents, eg cat/ dog 01 Fly sprays and ant powder 07 Patio cleaners 02 Fungicide sprays 08 Insecticides 03 Lawn treatments 09 Rooting powder/gel/hormone 04 Products for algae and snail control in
ponds 10
Rat and mouse killers 05 Slug pellets 11 Weedkillers 06 Other (please
specify)_________________________ 12
6. How many pesticide products do you purchase each year on average? (single
code)
Less than 1 1
1 2
2 3
3 4
4 5
5 6
6 or more 7
7. Where do you usually buy your garden chemicals from? (multicode)
Garden centre 1 DIY store 2 Supermarket 3 Gardening club or allotment society 4 Other (please specify)____________________________ 5

Pesticide user habits: public purchasing, use, storage and disposal of pesticides August 2007
42
Use
8. When do you read the instructions for use on pesticides? (multicode)
Before buying 1 Before using for first time 2 Before using every time 3 Occasionally as a reminder 4 Rarely/ never 5
9. Do you generally find that instructions for use on pesticides are clear?
Yes 1 No 2 Not sure 3
10. Do you follow the instructions for use on pesticides?
Yes 1 No 2 Sometimes 3
11. What other places do you get information on how to use pesticides? (please
specify which if possible)
Multicode Which?
Websites 01
Magazines 02
Leaflets 03
Books 04
TV 05
Radio 06
Gardening advice helpline 07
Product company helpline 08
Garden centre staff 09
Other gardeners 10
Other 11
12. Do you tend to use ready-to-use products or products that need diluting
before use? (single code)
Ready-to-use only 1
‘Need diluting’ only 2
Both 3
Go to Q14
Go to Q13
Go to Q13

Pesticide user habits: public purchasing, use, storage and disposal of pesticides August 2007
43
[If using products that need diluting, continue to question 13. If only using
ready-to-use products, continue to question 14]
-------------------------------------------------------------------------
13a). How do you measure amounts of product when diluting?
Measuring device/cap provided with product 1 Estimate or guess 2 Other (please specify)____________________________ 3
13b). Do you ever save products that you have mixed up?
Yes 1
No 2
13c) Do you rinse out pesticides containers before disposing of the empty
container?
Yes 1
No 2
13d) If YES, what do you do with rinsings? [If NO continue to Q14]
Drain 1
Sink 2
Toilet 3
Put onto waste ground 4
Add to dilute product 5
Other (please specify)
__________________________________
6
Storage
14. Where do you store pesticides? (tick all that apply)
Shed 1 In the house 4
Garage 2 Locked cupboard/ container 5
Greenhouse 3 High shelf 6
Other (please
specify)_________________________
7
Go to Q14
Go to Q13d

Pesticide user habits: public purchasing, use, storage and disposal of pesticides August 2007
44
15. How long do you store pesticides for on average before using them up or
disposing of them?
Less than 1 year 1
1 to 2 years 2
2 to 3 years 3
3 to 5 years 4
More than 5 years 5
Disposal
16. How do you dispose of empty pesticide containers?
Bin 1
Recycling box/bin/bag 2
Household waste and recycling centre/ tip/ civic amenity site 3
Other (please specify)
__________________________________
4
17. Do you ever dispose of unused or unwanted pesticides?
Yes 1
No 2
18. How do you dispose of unused or unwanted pesticides (unprompted)?
(multicode)
Drain 1
Sink 2
Toilet 3
Bin 4
Spray onto waste ground 5
Local authority collection service 6
Household waste and recycling centre/ tip/ civic amenity site 7
Other (please specify)
__________________________________
8
Go to Q18 Go to ‘Close’ after Q18

Pesticide user habits: public purchasing, use, storage and disposal of pesticides August 2007
45
CLOSE:
Thank you very much.
Would you like to enter the prize draw, with a first prize of £100 garden centre vouchers and five
runner-up prizes of £25? YES Interviewer: write in their contact details below
Also, we may be carrying out follow-up focus group research at a later date. There would be a
small payment for taking part in the research. Would you be interested? YES Interviewer:
write in their contact details below
NB: Your details will ONLY be used to enter you in the prize draw, and/or to invite you to take part
in a focus group, and for possible backchecking.
Name:
Address:
Telephone number:
THANK AND CLOSE – NOW FILL IN THE RESPONDENT’S NAME, DETAILS, TELEPHONE NUMBER AND THE LENGTH OF INTERVIEW ON YOUR RESPONDENT SHEET – EVEN IF YOU HAVE ALREDY WRITTEN OUT CONTACT DETAILS ABOVE, THE RESPONDENT SHEET MUST STILL BE FILLED IN FOR BACKCHECKING PURPOSES. I have carried out the interview according to the instructions and as per the MRS code of conduct.
Interviewer Name:-------------------------------- Interviewer Signature:-------------------------------- Date: -------------------------------------- Duration:------------------------------------

Pesticide user habits: public purchasing, use, storage and disposal of pesticides August 2007
46
Appendix 2: Briefing sheet for User Habits Questionnaire
What are Pesticides? 'Pesticide' is a broad term, covering a range of products that are used to control pests. Pesticides you may have heard of include:
• ant powders
• insect killers (insecticides)
• mould and fungi killers (fungicides)
• weedkillers (herbicides)
• slug pellets (molluscicides)
• plant growth regulators
• bird and animal repellents, and
• rat and mouse killers (rodenticides)
Often people only think of pesticides as chemicals, but they include a huge range of different types of products. Some are natural (e.g. pyrethrums, obtained from chrysanthemums), while many are altered versions of natural chemicals (e.g. fatty acids). These ‘natural’ versions may be considered suitable for use by organic gardeners.
Organic gardening However, organic gardening involves a lot more that just avoiding the use of chemicals. Organic gardeners focus their energy into increasing the natural health of their soil, choosing appropriate plant varieties, and working with nature to produce a healthy and productive garden.
Ready to use / concentrate products Liquid Ready-to-Use products are often sold in trigger spray bottles. Liquid concentrate products are usually in plastic bottles with child proof screw caps that then need measuring out and diluting.
Granular products (e.g. some lawn treatments) are often ready to use as many can be bought in a container that will dispense the product at a particular rate. Although larger bags can also be bought which can be applied with a separate spreader.
Should I save pesticides that I have diluted? No. You should try to avoid storing diluted pesticide by only mixing up or diluting the amount you need for a specific job.
Should I rinse out pesticide containers before disposing of them? What should I do with the rinsings? It is good practice to rinse out pesticide containers that have held concentrated product (i.e. requiring dilution for use) before disposing of them. The container should be rinsed three times and the washings added to the final spray solution. Trigger bottles (Ready-to-Use products) and other containers do not need to be rinsed.
Should I keep pesticides locked up? Garden pesticides do not need to be kept locked away, although they should be kept out of the reach of children and pets.
After you have used the pesticide, make sure that the packaging is tightly closed or sealed.
Take particular care to use and store slug pellets safely, so as to avoid accidentally poisoning any pets – particularly dogs.

Pesticide user habits: public purchasing, use, storage and disposal of pesticides August 2007
47
How long should I store pesticides for before using them? If you store it carefully, any remaining pesticide will be effective for some years to come. Check whether you can still legally use it by visiting our Garden Pesticides Search.
Garden sheds and greenhouses are not ideal for storing pesticides as they can get very hot in summer or cold in winter. Pesticide products are best stored at an even temperature.
How should I dispose of empty pesticide containers? First of all, check the label for advice.
Empty containers of Ready-to-Use products (e.g. trigger sprays) can be disposed of directly into your household waste.
Empty bottles of concentrates (pesticides you dilute with water for use) need to be rinsed out three times first and the washings added to the spray solution.
How should I dispose of unwanted pesticides? Unwanted pesticides should be disposed of safely through your local amenity waste disposal site that accepts hazardous household waste. All local councils should make arrangements for disposing of hazardous household waste, so you should contact them for the nearest suitable site.
Pesticides (and other chemicals) are securely separated from other waste and disposed of safely later, usually in special high temperature incinerators that destroy them completely.