petrobras at glance - 2015
TRANSCRIPT
1
PETROBRAS
Update
May 2015
__

2 2
FORWARD-LOOKING STATEMENTS:
DISCLAIMER
The presentation may contain forward-looking statements about future events within the
meaning of Section 27A of the Securities Act of 1933, as amended, and Section 21E of
the Securities Exchange Act of 1934, as amended, that are not based on historical facts
and are not assurances of future results. Such forward-looking statements merely reflect
the Company’s current views and estimates of future economic circumstances, industry
conditions, company performance and financial results. Such terms as "anticipate",
"believe", "expect", "forecast", "intend", "plan", "project", "seek", "should", along with
similar or analogous expressions, are used to identify such forward-looking statements.
Readers are cautioned that these statements are only projections and may differ
materially from actual future results or events. Readers are referred to the documents
filed by the Company with the SEC, specifically the Company’s most recent Annual
Report on Form 20-F, which identify important risk factors that could cause actual results
to differ from those contained in the forward-looking statements, including, among other
things, risks relating to general economic and business conditions, including crude oil and
other commodity prices, refining margins and prevailing exchange rates, uncertainties
inherent in making estimates of our oil and gas reserves including recently discovered oil
and gas reserves, international and Brazilian political, economic and social
developments, receipt of governmental approvals and licenses and our ability to obtain
financing.
We undertake no obligation to publicly update or revise any forward-looking
statements, whether as a result of new information or future events or for any
other reason. Figures for 2014 on are estimates or targets.
All forward-looking statements are expressly qualified in their entirety by this
cautionary statement, and you should not place reliance on any forward-looking
statement contained in this presentation.
NON-SEC COMPLIANT OIL AND GAS RESERVES:
CAUTIONARY STATEMENT FOR US INVESTORS
We present certain data in this presentation, such as oil and gas resources,
that we are not permitted to present in documents filed with the United States
Securities and Exchange Commission (SEC) under new Subpart 1200 to
Regulation S-K because such terms do not qualify as proved, probable or
possible reserves under Rule 4-10(a) of Regulation S-X.
DISCLAIMER

3 3
Competitive Advantages Uniquely positioned to integrate upstream and downstream operations
• Leader in deep-water production, with
access to abundant oil reserves
• New exploratory frontier, adjacent to
existing operations
• Dominant position in growing market, far
from other refining centers
• Balance and integration between
production, refining and demand
• Fully developed infrastructure for
processing and transfporting gas
• Integration accross full energy and
hydrocarbon chain in Brazil
Exploration & Production
Downstream
Gas & Power/ Biofuels/Petrochemicals
13
Abundant reserves
300 km away from
the market

4 4
New Systems Ensure Future Growth
1.937
3,2
4,2
2013 2014 2015 2016 2017 2018 2019 2020
2.034
Piloto Sapinhoá
(Cid. São Paulo)
Baúna
(Cid. Itajaí)
Piloto Lula NE
(Cid. Paraty)
Papa-Terra
(P-63)
Roncador III
(P-55)
Norte Pq. Baleias
(P-58)
Iracema Sul
(C. Mangaratiba)
Roncador IV
(P-62)
Sapinhoá Norte
(Cid. Ilhabela)
Papa-Terra
(P-61+TAD)
Itapu
Lula Alto
Lula Central
Júpiter Lula Sul
(P-66)
Búzios I
(P-74)
Lapa
Lula Norte
(P-67)
Búzios II
(P-75)
Lula Ext. Sul
e CO Sul de Lula
(P-68)
Lula Oeste
(P-69)
Búzios III
(P-76)
Tartaruga Verde e
Mestiça
Maromba I
Iara Horst
(P-70)
Búzios IV
(P-77)
Entorno de Iara
(P-73)
NE de Tupi
(P-72)
Iara NW
(P-71)
Sul Pq. Baleias
ES Águas
Profundas
Carcará
Espadarte III
SE Águas
Profundas I
Búzios V
Revitalização
Marlim I
SE Águas
Profundas II
Libra
Revitalização
Marlim II
Iracema Norte
(Cid. Itaguaí)
On Stream
On Location
Ordered
Under Bidding
+640kbpd +660kbpd +150kbpd +1000kbpd +900kbpd +1050kbpd Capacity added per year
3 MM bbl
Growth in 2015:
4.5% +/-1p.p.
Under Review
Growth in 2016:
2.8% +/-2p.p.
Libra EWT
5 5
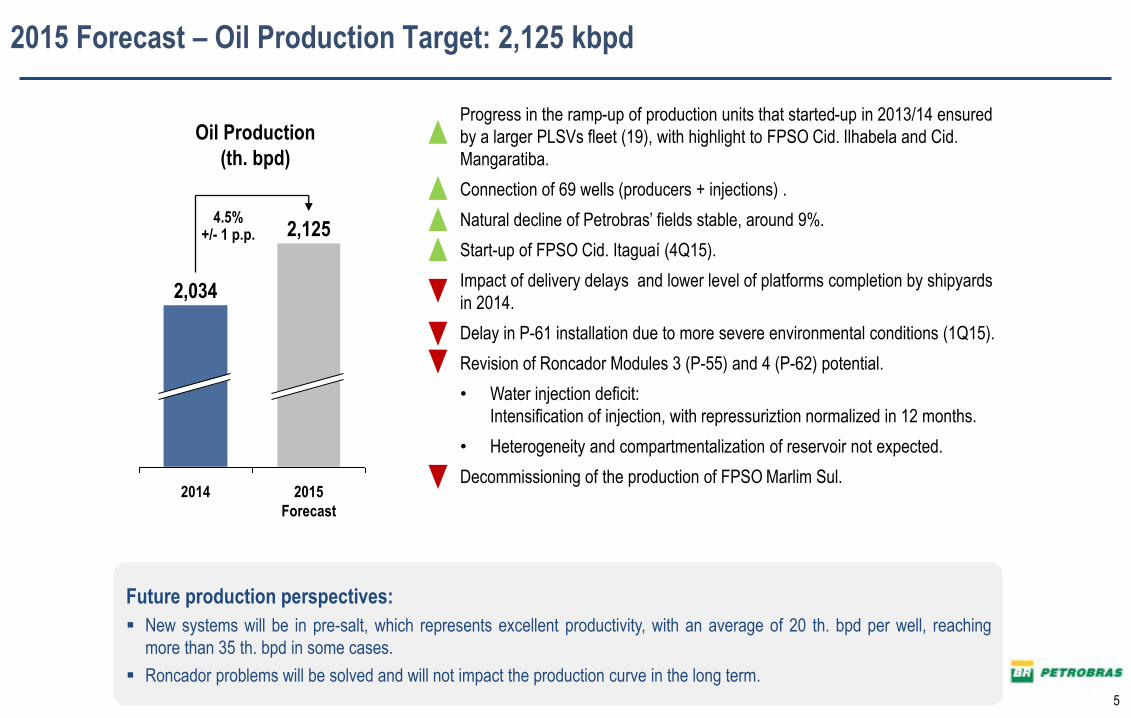
2015 Forecast – Oil Production Target: 2,125 kbpd
Future production perspectives:
New systems will be in pre-salt, which represents excellent productivity, with an average of 20 th. bpd per well, reaching
more than 35 th. bpd in some cases.
Roncador problems will be solved and will not impact the production curve in the long term.
Progress in the ramp-up of production units that started-up in 2013/14 ensured
by a larger PLSVs fleet (19), with highlight to FPSO Cid. Ilhabela and Cid.
Mangaratiba.
Connection of 69 wells (producers + injections) .
Natural decline of Petrobras’ fields stable, around 9%.
Start-up of FPSO Cid. Itaguaí (4Q15).
Impact of delivery delays and lower level of platforms completion by shipyards
in 2014.
Delay in P-61 installation due to more severe environmental conditions (1Q15).
Revision of Roncador Modules 3 (P-55) and 4 (P-62) potential.
• Water injection deficit:
Intensification of injection, with repressuriztion normalized in 12 months.
• Heterogeneity and compartmentalization of reservoir not expected.
Decommissioning of the production of FPSO Marlim Sul.
Oil Production
(th. bpd)
2015
Forecast
2,125
2014
2,034
4.5% +/- 1 p.p.

6 6
Oil and NGL Production in Brazil Petrobras Production in 2014 was 2,034 kpd, an increase of 103 kbpd over 2013
1.917 1.923 1.926
1.933
1.975
2.008
2.049
2.105 2.118 2.126 2.111
2.212 2.192
2.147
2.108
1.700
1.800
1.900
2.000
2.100
2.200
2.300
2.400
jan/
14
fev/
14
mar
/14
abr/
14
mai
/14
jun/
14
jul/1
4
ago/
14
set/1
4
out/1
4
nov/
14
dez/
14
jan/
15
fev/
15
mar
/15
2014: 2.034 mbpd (+5.3%)
1Q14: 1,922 2Q14: 1.972 3Q14: 2.090 4Q14: 2.150
kbpd
1Q15: 2.151
2015
Main factors that contributed to production growth:
Ramp up of 9 installed ( 2013 and 2014)
New 61 production wells connected in 2014
High productivity of Santos Basin pre-salt wells

7 7
Pre-Salt Province Production Highlights
8 8
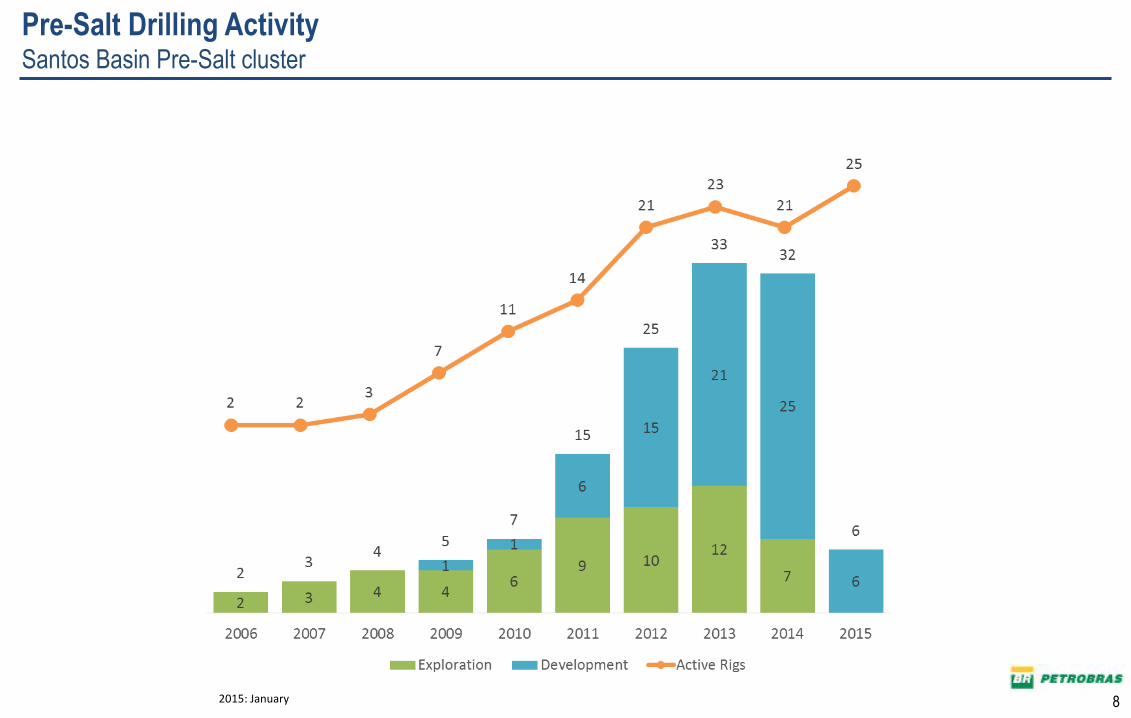
Pre-Salt Drilling Activity Santos Basin Pre-Salt cluster
2015: January

9 9
Wells Construction in Santos Pre-Salt Total Duration
Drilling (days/well)
Completion (days/well)
Source: January 2015
158
102 89 86
66 54
Until2010
2011 2012 2013 2014 2015
152
126
101 99 85 84
Until2010
2011 2012 2013 2014 2015

10
Well Connection in Brazil
4030 34
61
13
1217
26
2014
87
+70.6%
2013
51
2012
42
2011
53
Injectors
Producers

11 11
Pre-Salt Results Are Competitive to Deepwater Peers
150
120
90
60
30
0
Other
Heavy oil/oil sands/shale oil/tight liquids
Deep/ultradeep (>450 m)
Conventional
1. Range of predicted global oil demand according to the New Policies Scenario (91.7 Mboed) and the Current Policy Scenario (93.5 Mboed) in 2020, already subtracting 2.5 MBoed of processing gains – IEA Source: Rystad Energy UCUBE, IEA WEO 2012 (Nov-2012)
60
60
120
150
0
100 80 40 20 0
30
90
Break-even commercial ($/bbl)
(Mbpd)
OPEC conventional
Other conventional
Global forecasted production and break-even prices by types of oil and projects (*)
Deep and Ultradeep
Brownfield Canada oil sands and heavy oil
Greenfield Canada oil sands and heavy oil
Other oil sands and heavy oil
Tight liquids
Arctic
Oil shale
Shale oil
Break-even price range
for Brazil Pre-Salt
sanctioned projects
Next wave of new
technologies can
further decrease break-
even pre-salt price
(*) Concession Model

12 12
Oil Products Output Record in Brazil: 13 Refineries New HDT´s and conversion units, logistics and process optimization lead to higher output
1,850
1,800
1,750
1,700
1,650
1,550
1,600
1,950
2,200
2,150
2,100
2,050
2,000
1,900
1,588
2,074
1,944
2011
1,862
2010
1,798
2009
1,799
2008
1,779
2006
1,746
+226 th. Bpd +12%
2014
2,170
2013
1,765
2007 2012 2005
1,727
2004
1,704
2003
kbpd
13
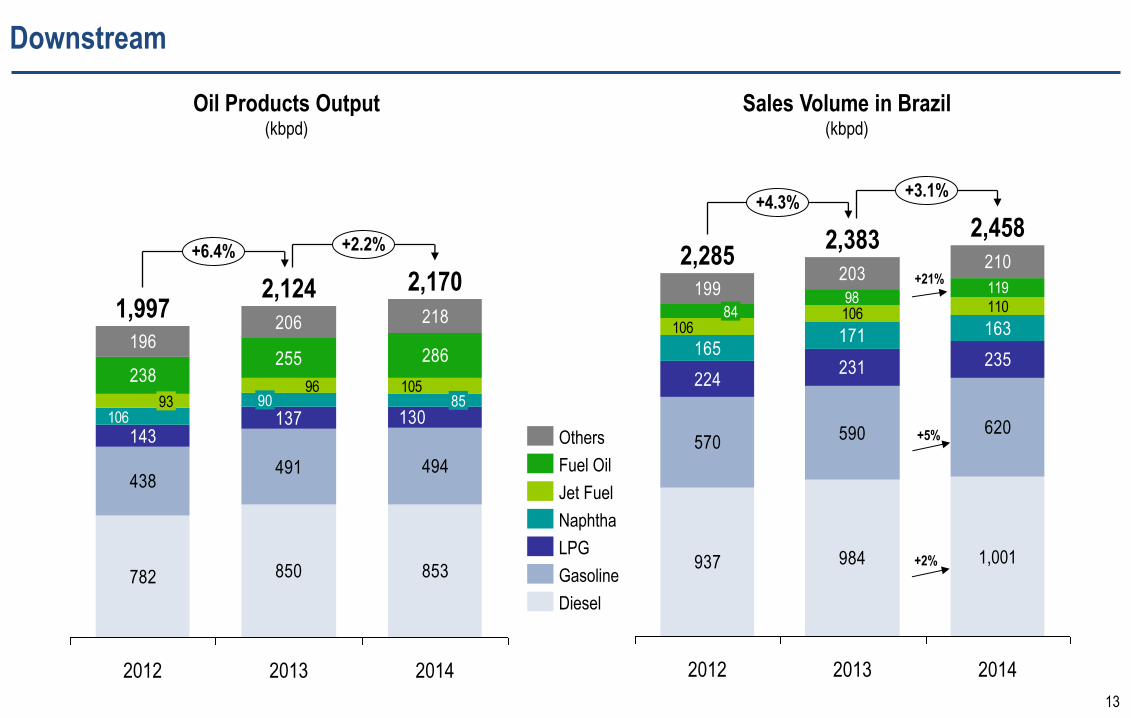
Downstream
782 850 853
438491 494
238255 286
196206 218
130137143
106
10596
+6.4% +2.2%
2013
2,124
90
2012
1,997
93
2014
2,170
85
Oil Products Output (kbpd)
937 984
570590 620
224231 235
165171 163
110199
203210
106106
98119
+4.3% +3.1%
2014
2,458
1,001
2013
2,383
2012
2,285
84
+5%
+2%
+21%
Sales Volume in Brazil (kbpd)
Diesel
Gasoline
LPG
Naphtha
Jet Fuel
Fuel Oil
Others
14 14
338 394 489 570 590 620
0
100
200
300
400
500
600
700
2009 2010 2011 2012 2013 2014
740 809 880 937 984 1001
0
200
400
600
800
1000
1200
2009 2010 2011 2012 2013 2014
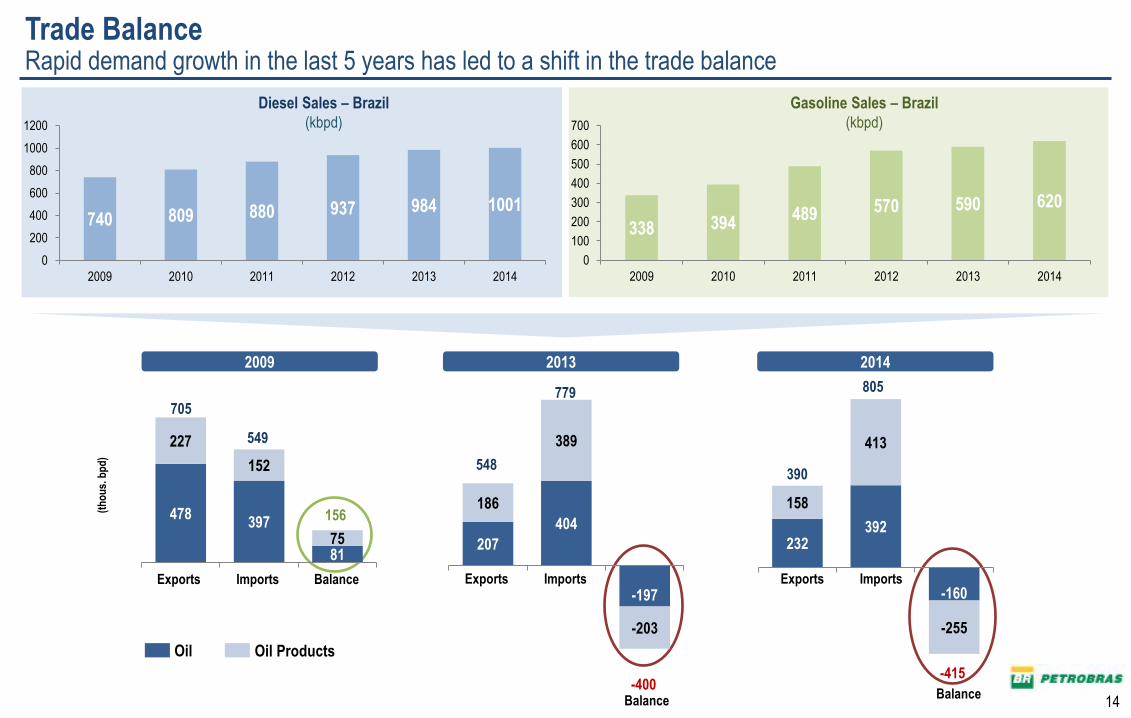
Trade Balance Rapid demand growth in the last 5 years has led to a shift in the trade balance
Gasoline Sales – Brazil
(kbpd)
Diesel Sales – Brazil
(kbpd)
Balance -400
Balance
156
Oil Oil Products
Imports Exports
-415
Imports Exports Imports Exports
2009 2013 2014
(th
ou
s. b
pd
)
705
549
548
779
390
805
Balance
478 397
81
227
152
75 207
404
-197
186
389
-203
232 392
-160
158
413
-255
15 15
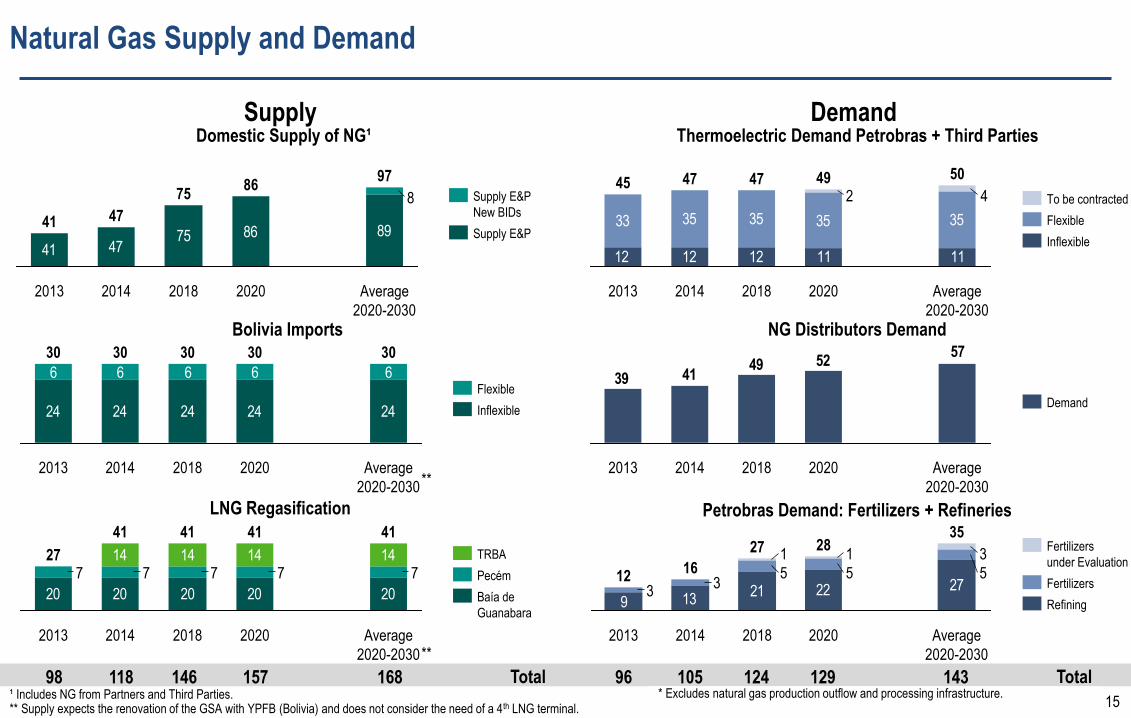
Supply Demand
LNG Regasification
Thermoelectric Demand Petrobras + Third Parties
33 35 35 35 35
1111121212
42
Average
2020-2030
50
2020
49
2018
47
2014
47
2013
45
Inflexible
Flexible
To be contracted
NG Distributors Demand 57
52494139
Average
2020-2030
2020 2018 2014 2013
Demand
Petrobras Demand: Fertilizers + Refineries
921 22 27
13
5553
3
311
Average
2020-2030
35
2020
28
2018
27
2014
16
2013
12
Refining
Fertilizers
Fertilizers
under Evaluation
96 124 129 143 98 146 157 168 118 105 Total
20 20 20 20 20
14 14 14 1477777
2013
27
2014
41
2018
41
Average
2020-2030
41
2020
41
Baía de
Guanabara
Pecém
TRBA
Bolivia Imports
24 24 24 24 24
6 6 6 6 6
2020
30
Average
2020-2030
30
2018
30
2014
30
2013
30
Inflexible
Flexible
Domestic Supply of NG¹
41 4775 86 89
8
2014
47
2013
41
Average
2020-2030
97
2020
86
2018
75 Supply E&P
New BIDs
Supply E&P
Total ¹ Includes NG from Partners and Third Parties. ** Supply expects the renovation of the GSA with YPFB (Bolivia) and does not consider the need of a 4th LNG terminal.
**
**
* Excludes natural gas production outflow and processing infrastructure.
Natural Gas Supply and Demand

16 16
37,3
27,6 29,4
25,0
2011 2012 2013 2014
EBITDA Price increases contributed to higher cash flow, but additional adjustments still needed
43,4 42,0 37,4
32,4
-6,9
-15,6 -9,8
-6,0
3,6 2,0
1,6
0,5
1,3 1,6
1,5
0,9
3,0 3,2
3,5
2,3
E&P RTM G&P Distribution International
2011 2012 2013 2014
(*) Adjusted according average exchange rate. Excludes Corporate and Elimination. 3Q14: unaudited numbers
Adjusted EBITDA Adjusted EBITDA Breakdown per Segment *

17 17
CAPEX EVOLUTION IN BUSINESS AND MANAGEMENT PLANS Total planned investments declining, E&P share increasing in each of last five Plans
* Gas and Energy, International, BR Distribuidora, PBio , Engineering Technology and Materials (ETM) and Corporate and Services Area
2014-2018 BMP Total Capex
2012-2016 BMP Total Capex
2013-2017 BMP Total Capex
2010-2014 BMP 2011-2015 BMP
E&P
Downstream
Other Areas*
Po
rtfo
lio o
f P
roje
cts
for
Fin
anci
abili
ty E
valu
atio
n
US$ 224.0 Billion Investment US$ 224.7 Billion US$ 236.5 Billion US$ 236.7 Billion US$ 220.6 Billion
48%
35%
17%
52%
33%
11% 15%
18%
27%
62%
14%
30%
56%
70%
12%

18 18
CAPEX Exploration & Production and Downstream
19 20
22
28 24
0
5
10
15
20
25
30
2010 2011 2012 2013 2014
Exploration & Production US$ Billion
16 16 15 14
8
0
5
10
15
20
25
30
2010 2011 2012 2013 2014
Downstream US$ Billion
19
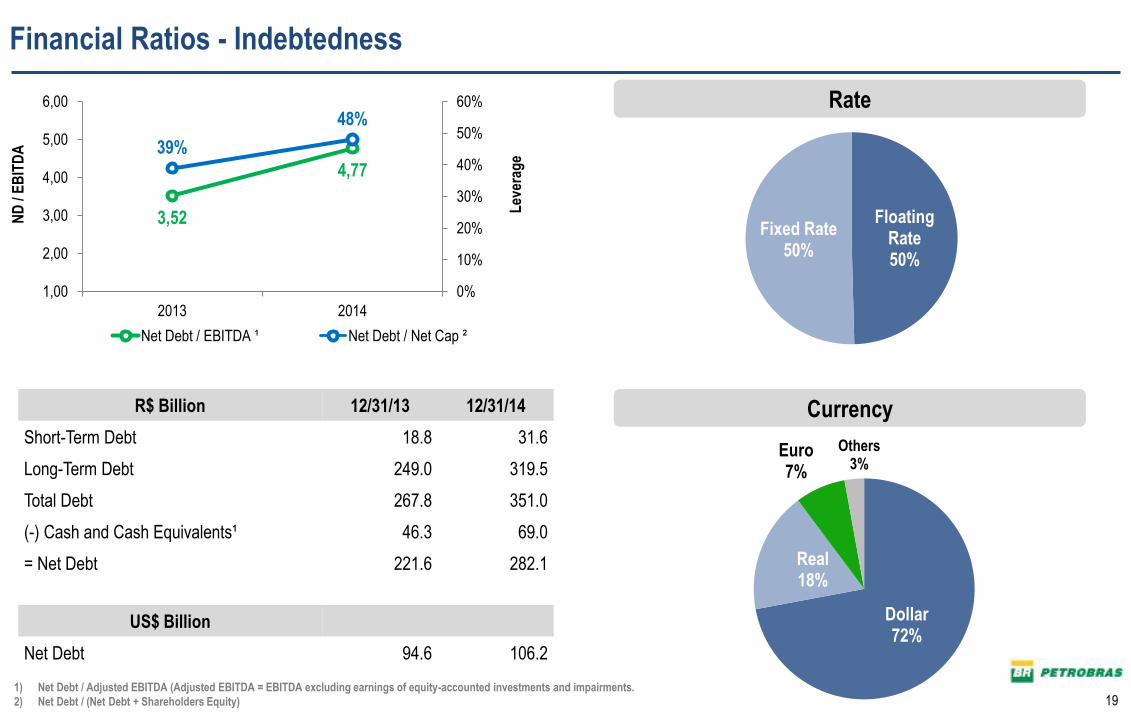
Financial Ratios - Indebtedness
Lev
erag
e
ND
/ E
BIT
DA
1) Net Debt / Adjusted EBITDA (Adjusted EBITDA = EBITDA excluding earnings of equity-accounted investments and impairments.
2) Net Debt / (Net Debt + Shareholders Equity)
3,52
4,77
39%
48%
0%
10%
20%
30%
40%
50%
60%
1,00
2,00
3,00
4,00
5,00
6,00
2013 2014
Net Debt / EBITDA ¹ Net Debt / Net Cap ²
R$ Billion 12/31/13 12/31/14
Short-Term Debt 18.8 31.6
Long-Term Debt 249.0 319.5
Total Debt 267.8 351.0
(-) Cash and Cash Equivalents¹ 46.3 69.0
= Net Debt 221.6 282.1
US$ Billion
Net Debt 94.6 106.2
Rate
Floating Rate 50%
Fixed Rate 50%
Currency
Dollar 72%
Real 18%
Euro 7%
Others 3%

20
Nominal flow (not discounted) of principal and interest, by maturity
42.6
2015
73.1
2017 2018
44.7 49.1 59.4
2020 +
208.4
2019 2016
R$ Billion

21
2015 Cash Flow
US$ Billion
US$ 60 /bbl (average)
R$ 3.10 /US$ (average)
Oil Prices
Exchange Rate
2013
23
25
26
-21
Interest,
Amortization
s and Others
-29
Investments Opearting
Cash
Flow
2015 Initial
Cash
Position
2015 Final Cash
Position
Funding Needs Rollovers Divestments
2,796 kboed Total Production

22
Assumptions for 2016
New Production Units (FPSO):
Cidade de Itaguaí (4Q15)
Cidade de Maricá (1Q16)
Cidade de Saquarema (2Q16)
Cidade de Caraguatatuba (3Q16)
Extended Well Test - Libra (4Q16)
Oil and Natural Gas
Production
(Brazil and Abroad)
US$ 10 billion Divestments
Approximately US$ 25 billion (82% in E&P)
37% below 2016 CAPEX (US$ 39.5 billion), in the 2014-2018 Business Plan Investments
2,886 kboed
+/- 2%
US$ 70 / bbl Oil Price
(Brent average) R$ 3,30 /US$
Exchange Rate (Average)
2,185 kbpd Oil Production
(Only Brazil)

23 23
Petrobras Ratings
Petrobras
Ba2
Brazil
Baa2
“The confirmation of Petrobras' rating reflects Moody's belief that the provision of audited financial statements eliminates the near term prospect of debt acceleration resulting from violation of covenants in indentures and loan agreements.
Future positive rating actions are likely to depend upon the company's ability to demonstrate improved operating performance that will support a stronger financial profile. Negative rating actions could result from significant deterioration in operating performance, major new negative developments from the corruption investigations, or the reappearance of significant liquidity pressures.”
Petrobras
BBB-
Brazil
BBB-
“Our negative outlook on Petrobras continues to reflect our intermediate-term uncertainties about the company's ability to boost production and, as a consequence, deleverage its balance sheet.
Our ratings on Petrobras continue to reflect our view that there is a "very high" likelihood that the company would receive timely extraordinary support from the Brazilian government under financial stress scenarios. Absent any sovereign rating action and change in our assessment about the likelihood of extraordinary government support, a downgrade would occur if the company's stand-alone credit profile (SACP) were to fall to 'b' Our current SACP assessment on Petrobras is 'b+'.
Petrobras
BBB-
Brazil
BBB
“The rating action reflects the publication of year-end 2014 audited financial statements, which averted violating indebtedness covenants that would have allowed creditors to start an acceleration process.
The rating action also reflects the company's improved liquidity position as a result of the recently announced USD13 billion of new financings facilities.
The Negative Outlook reflects the uncertainties surrounding the company's ability to deleverage its balance sheet in the medium term.
Petrobras' 'BBB-' and 'AAA (bra)' ratings continue to reflect its close linkage with the sovereign rating of Brazil due to the government's control of the company and its strategic importance to Brazil as its near monopoly supplier of liquid fuels.

24 24
Dividend Policy
According to Brazilian Corporate Law, companies with two classes of shares must pay a minimum amount equal to
25% of net income
Regarding Petrobras By-Laws, minimum payable to non-voting shares (PN/PBR.A) is the higher of:
25% of Adjusted Net Income
3% of the PN’s proportional book value of shareholder’s equity
5% of the PN’s proportional paid-in capital
Non-voting shares have priority rights to distribution of dividends
Petrobras By-Laws Consistent with Brazilian Corporate Law

Principal Adjustments in PP&E
25
Principal Adjustments in PP&E R$ 50.8 billion
R$ 6.2
Billion
Write-off related to overpayment incorrectly
capitalized, as a consequence of the “Car Wash
Operation”
Provision due to impairment tests R$ 44.6
Billion
PP&E in 12/31/14: R$ 581 billion

26
Principal Adjustments in PP&E
R$ 6.2
Billion
Write-off related to overpayment incorrectly
capitalized, as a consequence of the “Car Wash
Operation”
Amount of 3% over contracts with 27 companies members of the cartel between
2004 and 2012
For companies outside the cartel, specific values mentioned in the depositions
Principal Adjustments in PP&E

Methodology based on the contents of the Prosecutor’s Office investigations
Depositions consistent with relation to: the existence of the cartel; time period; percentages and values
Values by Business Segment
0.1
0.7 G&P
2.0
Others
E&P
Downstream 3.4
27
R$ 6.2 Billion
Write-off related to overpayment incorrectly capitalized, as a consequence of the “Car
Wash Operation”
28
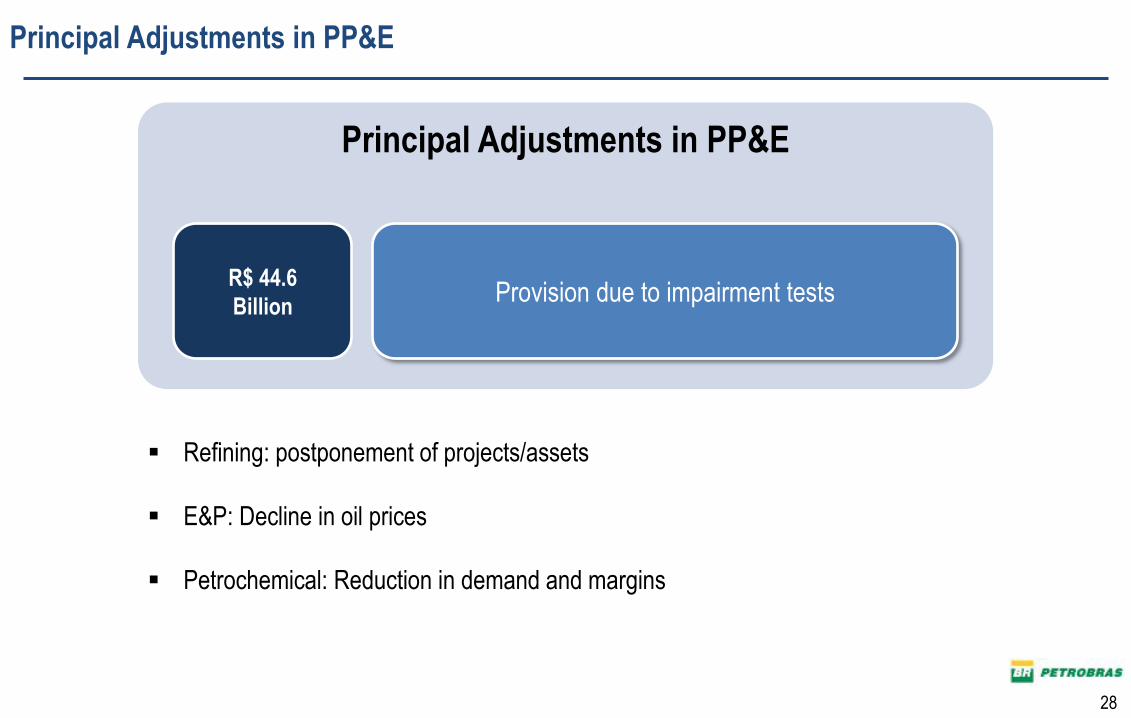
Principal Adjustments in PP&E
R$ 44.6
Billion Provision due to impairment tests
Refining: postponement of projects/assets
E&P: Decline in oil prices
Petrochemical: Reduction in demand and margins
Principal Adjustments in PP&E
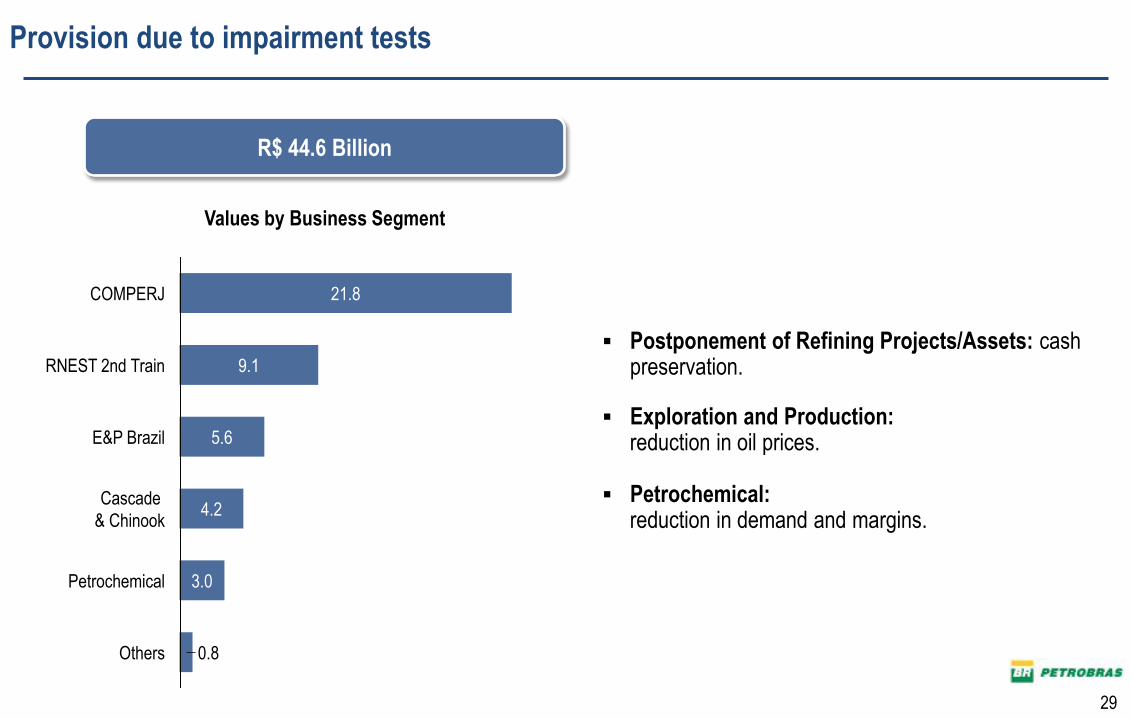
Postponement of Refining Projects/Assets: cash preservation.
Exploration and Production: reduction in oil prices.
Petrochemical:
reduction in demand and margins.
Others 0.8
Petrochemical 3.0
Cascade
& Chinook 4.2
E&P Brazil 5.6
RNEST 2nd Train 9.1
COMPERJ 21.8
29
Values by Business Segment
R$ 44.6 Billion
Provision due to impairment tests